Enhancing Growers’ Productivity
107
Understanding and Analysing the Italian Zespri Kiwifruit Chain Aiming on Opportunities for Enhancing Growers’ Productivity WAGENINGEN UNIVERSITY Master Thesis Student name: Andrea Del Zotto Falascina Student number: 840528-990-080 Supervisor: Trienekens Jacques Second supervisor: Bijman Jos Programme: Management Economics, and Consumer Studies (MME) Chair group: Management Studies Course Code: MST-80433 Source: Zespri Website
Transcript of Enhancing Growers’ Productivity

Understanding and Analysing the Italian Zespri
Kiwifruit Chain Aiming on Opportunities for
Enhancing Growers’ Productivity
WAGENINGEN UNIVERSITY
Master Thesis
Student name: Andrea Del Zotto Falascina
Student number: 840528-990-080
Supervisor: Trienekens Jacques
Second supervisor: Bijman Jos
Programme: Management Economics, and Consumer Studies (MME)
Chair group: Management Studies
Course Code: MST-80433
Source: Zespri Website

ii
Abstract
The global kiwifruit industry is concentrated among few producing countries: China, Italy, New
Zealand and Chile. Although Italy is the second world producer and the first world exporter,
limitations have been founded among Italian kiwifruit growers, which often show ineffectiveness in
producing high quantity of standardized qualitative kiwifruit that meet trader’s demand. In particular,
Zespri is facing a shortage of supply of high quality kiwifruit that guarantees retails’ shelf-space and its
year-round supply strategy. As a consequence, Italian growers pay off fluctuates accordingly to the
increasing competition and on market commodity quotations. This study focuses on Italian kiwifruit
growers and chain players with the objective to identify opportunities for growers’ productivity
improvements. From the survey conducted on 74 kiwifruit growers located in the centre of Italy
(Latina), followed by the analysis with SPSS, it emerged that kiwifruit farms are typically two/three
hectares, overall growers are rather aged and not highly educated. Psa outbreak has seriously changed
the sector and only basic orchard practices are applied by the majority of growers. Farms are largely
managed by the single grower which is occasionally supported by family members. Scarcities in the
farm management have also been identified in the limited use of complex orchard practices,
specialized employees, their involvement in the farm decision-making process, interaction with
experts, and team members’ specializations. Other contributions have been identified within chain
players where market information is not transparent. Findings demonstrate how in general kiwifruit
farm management requires younger and educated managers together with chain players’ initiatives
aimed at increasing transparency and trust, and reinforce collaboration among chain players.
Key words: kiwifruit supply chain, Zespri chain, kiwifruit orchard management, kiwifruit farm
productivity, Italian kiwifruit productivity.

iii
Executive Summary
This report provides an analysis and evaluation of the current situation of 74 kiwifruit growers located
in the centre of Italy (Latina), and their collaborations with cooperatives and Zespri. In particular this
study has the objective “To provide recommendations on opportunities for productivity improvements
of the Italian Zespri kiwifruit chain by investigating how farm management practices and chain
players' related activities have positive or negative effect on growers’ performance”. On one hand, the
main focus is to investigate farm managerial and technical practices adopted; on the other hand, the
study then refers to chain actors’ activities and interests such as technical assistance, information
exchange, diffusion of innovations, and chain management practices that might influence growers’
productivity.
The research strategy includes a preliminary desk research combined with a survey approach. Through
the literature review, theories concerning farm management and chain factors were selected and
converted into indicators. Then, a questionnaire based on theories previously selected was designed to
collect direct information from the target population. Analysis conducted with SPSS includes
calculation of the answered questionnaires with descriptive statistics indicators describing main
tendencies of the population. And 11 assumed relationships were formulated and calculated by
correlation analysis.
Results of data analysis from the descriptive statistics show the common farm size is two hectares.
Hayward and Zespri Gold are the most planted varieties. Overall growers are rather aged and not
highly educated. Psa outbreak has seriously reduced the productivity of Gold growers. Kiwifruit
growers show evident productivity gaps in the yield and OGR results, and top performing grower cases
are found limited. According to the SPSS results, it is demonstrated that most farms are owned by
single growers who do not hire specialized employees and tend to take decisions individually without
consulting external experts. Meanwhile, the information shared is not transparent because growers are
completely unaware of whom the cooperative’s buyers are and what the prices kiwifruit sold at the
bulk market are, however, the trust in Zespri and cooperative is rather positive. In general, the
satisfaction about the actual production is rather low. Nonetheless, the sample has a positive projection
about the future and they are willing to cooperate more with cooperatives and Zespri.
Based on the 11 relationships calculated in the correlation analysis, growers’ productivity is positively
related with satisfaction level, attitude towards adopting new varieties, farm technical practices (gel
pruning and bio stimulants), the presence of specialized employees, and their involvements in the farm
decision-making process. Moreover, from the other associations arose that solid teams tend to be more
satisfied with cooperative support and know more market information. There are also correlations
between growers visiting the Zespri Canopy website and the trust in cooperative and Zespri. Further
findings of the remaining correlations are fully explained in Chapter 5.2 and additional calculations can
be found in the text and Appendices IV.
In conclusion, the study shows clear associations of farm productivity with: (i) technical practices such
as gel-pruning bio stimulants, (ii) farm management factors such as the presence of specialized
employees and their involvement in the farm decision-making, and (iii) growers’ attitudes such as high
satisfaction level, bright future perspective, and importance of using new varieties. Major weaknesses
identified as main opportunities to increase the productivity are in the farm management and in the

iv
collaboration within the chain since the shared information appears to be not transparent. Thus, farm
management should be renovated and information transparency within the chain should be enhanced.
Recommendations for further research discussed in this study are: (i) to further extend the data
collection to a statistically sufficient number, (ii) to redesign the model by focusing on the factors
impacting on farm technical practices, and (iii) to explore more the management structure of small,
medium, and large kiwifruit farm. Regarding the industry players, the recommendations discussed are:
(i) kiwifruit growers should invest more resources on the management of their farm by hiring younger
managers with agricultural background, (ii) kiwifruit cooperatives should enhance the communication
with growers by improving information transparency, and (iii) Zespri should implement productivity
programmes used in New Zealand; and identify, select, recruit and retain the existing best growers to
guarantee the supply of high quality kiwifruit.

v
Acknowledgements
I have achieved this study with the precious academic guidance from my supervisor, Dr. Jacques
Trienekens. He has been very dedicated in providing me advice and in keeping me motivated. In
particular, his research experience helped me to formulate a clear structure of the report, the proposal
and in using a scientific approach to the topic investigated. He has always been a critical and inspiring
about crucial aspects of the study and point out my carelessness. I am very grateful for the support and
assistance he provided during the process.
Secondly, I own great thanks to Mariarosaria Mazzeo. She gave me assistance in the questionnaire
revision, planning the data collection, and in getting access to the Zespri’s growers network. Without
her support the data collection would have been much tougher.
Finally, I would give the greatest thanks Ching Chiu who has been an important person in supporting
me to accomplish this study. Furthermore, I dedicate this study to my parents who have always been
supportive and had faith in me during my master program in Wageningen University. Especially, I
would like to devote this study to my father and to all the people involved in our kiwifruit farm.
Through this report I expect him to get important insights and thoughts on how to strengthen our farm
management and consolidate the growth of the family business.

vi
List of Abbreviations
(AGROS) Agriculture Research Group on Sustainability
(CPPs) Crop Protection Programmes
(DM) Dry Matter
(FON) Focus Orchard Network
(FSC) Food Supply Chain
(KCPs) Kiwifruit Chain Players
(KPIs) Key Performance Indicators
(KVH) Kiwifruit Vine Health
(LAI) Leaf Area Index
(NAA) Naphthalene Acetic Acid
(OGR) Orchard Gate Return
(OMPs) Orchard Management Practices
(OPC) Orchard Productivity Centre
(PGI) Protected Geographic Denomination
(SCM) Supply Chain Management
(SPE) Single Point of Entry
(VALS) Value Added Logistic Services

vii
Table of Contents
Abstract ......................................................................................................................................................... ii
Executive Summary ..................................................................................................................................... iii
Acknowledgements ........................................................................................................................................ v
List of Abbreviations .................................................................................................................................... vi
1 Introduction ................................................................................................................................................. 1
1.1 A view of the kiwifruit chain ............................................................................................................... 3
1.2 Kiwifruit supply chain .......................................................................................................................... 3
1.2.1 Growers ......................................................................................................................................... 3
1.2.2 Pack-house operators or cooperatives ........................................................................................... 4
1.2.3 Traders ........................................................................................................................................... 4
1.2.4 Distribution centre ......................................................................................................................... 5
1.2.5 Retailers and consumers ................................................................................................................ 6
2 Research design ........................................................................................................................................... 7
2.1 Conceptual design ................................................................................................................................ 7
2.1.1 Problem context............................................................................................................................. 7
2.1.2 Conceptual framework ................................................................................................................ 10
2.1.3 Research objective ....................................................................................................................... 11
2.1.4 Research framework .................................................................................................................... 11
2.1.5 Research question ........................................................................................................................ 11
2.1.6 Definition of concepts ................................................................................................................. 12
2.2 Technical design ................................................................................................................................. 13
2.2.1 Research strategies ...................................................................................................................... 13
3 Literature review ....................................................................................................................................... 15
3.1 Introduction ........................................................................................................................................ 15
3.2 Farm management practices ............................................................................................................... 15
3.2.1 Farming system ........................................................................................................................... 15
3.2.2 The farm size and the management ............................................................................................. 16
3.2.3 Growers education ....................................................................................................................... 17
3.2.4 Experiences in the fields ............................................................................................................. 18
3.2.5 Type of labour: seasonal or fixed employees .............................................................................. 18
3.3 Farm practices .................................................................................................................................... 18
3.3.1 Canopy management and structure ............................................................................................. 19
3.3.2 Pollination ................................................................................................................................... 20
3.3.3 Pollination methods ..................................................................................................................... 20

viii
3.3.4 Soil and water management........................................................................................................ 21
3.3.5 Bio-stimulants ............................................................................................................................ 23
3.3.6 Dormancy breaking agents ......................................................................................................... 23
3.3.7 Growth activators ....................................................................................................................... 24
3.3.8 Pest and diseases management ................................................................................................... 24
3.3.9 Farm practices conclusion .......................................................................................................... 25
3.4 Chain’ actors activities and interests ................................................................................................. 25
3.4.1 Technical support ....................................................................................................................... 25
3.4.2 Technical information within kiwifruit industry ........................................................................ 26
3.4.3 Cooperative technical services ................................................................................................... 27
3.4.4 Supplier of agricultural products ................................................................................................ 27
3.5 Information transparency .................................................................................................................. 27
3.6 Innovations ........................................................................................................................................ 28
3.6.1 Factors affecting farmers’ adoption of agricultural innovations ................................................ 28
3.7 Chain management practices ............................................................................................................. 30
3.7.1 Logistics ..................................................................................................................................... 30
3.7.2 Contract farming ......................................................................................................................... 30
4 Materials and methods.............................................................................................................................. 32
4.1 Concepts classification ...................................................................................................................... 32
4.2 Conceptual model .............................................................................................................................. 32
4.3 Relationships between factors ........................................................................................................... 33
4.4 Questionnaire design ......................................................................................................................... 35
4.5 Description of the population ............................................................................................................ 36
4.5.1 Survey responses ........................................................................................................................ 36
5 Results analysis ........................................................................................................................................ 39
5.1 Descriptive statistics .......................................................................................................................... 39
5.2 Correlation analysis ........................................................................................................................... 50
5.2.1 Interpretation of the correlation coefficients related with growers’ productivity ....................... 50
5.2.2 Interpretation of the relationships between primary and secondary factors ............................... 55
6 Discussion ................................................................................................................................................ 61
7 Conclusions .............................................................................................................................................. 66
8 Recommendations for further research .................................................................................................... 68
9 Recommendations to the industry ............................................................................................................ 69
References ................................................................................................................................................... 70
Appendix I ................................................................................................................................................... 75

ix
Appendix II .................................................................................................................................................. 82
Appendix III ................................................................................................................................................. 86
Appendix IV ................................................................................................................................................. 88


1
1 Introduction
In the last half century the kiwifruit industry has shown an interesting evolution. First kiwifruit
commercial plantations were settled in New Zealand in the early 1940’s for supplying the domestic
market. In 1952 first export shipment of kiwifruit was sent to the United Kingdom and just about 20
years later, volumes exported rose rapidly (Kilgour, et al., 2007). Besides this trend, other countries
experienced similar growth. Experimental plantations were settled in Italy in the early 1970’s, and at
the end of the 1980’s 600-800 hectares were already planted (Testolin & Ferguson, 2009). The spread
of kiwifruit took place also in Chile and in countries such as France, Greece, Japan, Korea and the
United States (Ferguson, 2011).
Nowadays, kiwifruit is daily consumed as breakfast and lunch fruit. Its nutritional value, high content
of potassium and vitamin C were crucial in its acceptance by consumers (Chattophday, 2008; Bano &
Scrimgeour, 2011). The increase in kiwifruit consumption is also shown in the world kiwifruit
availability (grams per capita) which grows from 50 grams in 1985 to more than 250 grams in 2010
(Belrose, 2011).
Rank Country 1998-2001 Rank Country 2008-2011
1 Italy 314,829 1 China 491,667
2 New Zealand 239,166 2 Italy 429,885
3 China 152,833 3 New Zealand 385,049
4 Chile 112,000 4 Chile 186,667
5 France 75,080 5 Greece 79,433
6 Greece 58,403 6 France 66,890
7 Japan 40,733 7 Japan 37,467
8 United States 29,514 8 Iran 30,000
9 Iran 21,677 9 United States 25,371
10 Korea, Rep 13,904 10 Korea, Rep 15,833
- Top Five 893,908 - Top Five 1,572,701
- Percentage 82.5 % - Percentage 87.0 %
- Top Ten 1,058,139 - Top Ten 1,748,262
- Percentage 97.6 % - Percentage 96.7 %
- TOTAL 1,083,868 - TOTAL 1,807,763
Source: Belrose, 2011
Table 1: Yearly production of the top ten kiwifruit producing countries by rank and tonnage in 1998-2001 and
2008-2011.
Nowadays, the world kiwifruit production is concentrated among a few countries of the Northern and
Southern hemisphere and the top ten contribute over 95% of the world production (Table 1) (Bano &
Scrimgeour, 2011; Belrose, 2011). According to the UN FAO data, China had surpassed the other
countries in 2005 and produced 491,667 metric tons between 2008 and 2011. However, very few of the
kiwifruit produced in China are exported due to the low quality and high internal consumption. As a
result, the global market of kiwifruit is dominated by Italy (first exporter in the world), New Zealand
(the leader in the southern hemisphere), and Chile. The other countries are demonstrating a steadily
increase every year (Ferguson, 2011) (Table 1).
The high consumer acceptances in European and Asian market plus the sufficient areas of kiwifruit
plantations in both Northern and Southern hemisphere have encouraged agro-food companies to invest
in combining the northern and southern production in order to supply this seasonal fruit all year
around. This has been possible because of a rather long shelf-life of kiwifruit (up to six months) (Chen,

2
2012), and by improving the logistics and communication among suppliers and chain players of both
hemispheres. The local kiwifruit system has developed into a global dynamic industry.
One organization that has been taken part in this development is Zespri. Up to now, Zespri is the
market leader in the commercialization of kiwifruit by managing more than 30% of the global traded
volumes (Zespri, 2010). It sells Zespri labelled kiwifruit in more than 50 countries and the brand
strategy of Zespri focuses on moving a perishable commodity fruit such as kiwifruit into the premium-
priced consumer goods (Beverland, 2001). In-store sampling programmes, tailored promotions, TV
commercials etc., have added significant value to the final product (Martin, 2008). Furthermore, the
new Zespri Gold variety launched in 2000 has enhanced its success by providing the guaranteed
quality and capacity of global supply in the supermarkets twelve months a year. Zespri has established
partnerships contracts with 2,700 New Zealand growers and with more than 1,200 growers of other
countries for satisfying the immense supply need (Zespri, 2010).
Among the major producers of the northern hemisphere, Italy supplies kiwifruit for Zespri from mid-
October to mid-May (Chen, 2012). The strategic position within the EU and the leadership in exporting
kiwifruit made this country very attractive to Zespri. Licensee contracts with Italian growers were
established in 2000. Nevertheless, to guarantee the quantity needed, Zespri established contracts with a
few Italian cooperatives that had the network of growers, the facilities to process kiwifruits, and all of
those could connect and disseminate technical assistance to growers. These cooperatives were and are
still the essential intermediary organizations that bridge Zespri International with Italian kiwifruit
growers.
The interface between Zespri, cooperatives and kiwifruit growers present some peculiarities. Not only
do cooperatives satisfy Zespri’s demand with high quality kiwifruit (Zespri quality standards), but also
have a parallel market where they sell and trade kiwifruit under their own label. Hence, they are
supplier of Zespri but also direct competitors of kiwifruit suppliers for the EU retailers.
Beside these considerations, Italian kiwifruit growers are facing an overall increase in the world
competition of kiwifruit production, which resulted in a decrease in the average price per kilogram. In
the past eight years, the common Hayward kiwifruit price has fluctuated significantly between €0.8
kilogram and €0.3 kilogram. This made the market very uncertain and kiwifruit growers incapable of
differentiating their products from the commodity quotations. An alternative is to valorise their
kiwifruit by improving the quantity of high quality kiwifruit, and transforming Italian kiwifruit
productions valued as a commodity into a premium product traded under the Zespri label (Alvarez &
Shelman, 2010). In a competitive market where more and more countries are planting kiwifruit, the
Zespri systems could be the way of increasing the price per kilogram through the quality valorisation
and a consequent better return for the Italian growers.
In this study particular attention will be placed on the interface between Zespri, Italian cooperatives
and growers and investigating in what way this system can be explored and/or improved. Through this
master thesis we want to understand and analyse the Italian Zespri kiwifruit chain and to understand
how growers’ performance (farm productivity) are associated with other factors such as farm features,
growers’ attitudes, farm practices adopted and chain activities and interests. Thus the main objective is
to understand how productivity of growers can be improved and what the opportunities for enhancing
it are. Published literature reviews and interviews with a selected sample of Italian kiwifruit growers
are conducted during this study in order to elucidate the phenomenon above described.

3
1.1 A view of the kiwifruit chain
Food Supply Chain (FSC) includes all organizations that deal with production and distribution of
vegetable or animal-based products (Vorst, 2000). In particular, fresh vegetables, flowers and fruit all
belong to this category. Principal actors of the FSC are: growers, auctions, wholesalers, importers and
exporters, retailers and speciality shops (Figure 1). According to Vorst (2000) the aim of all of these
food supply chain (FSC) phases is to “leave the intrinsic characteristics of the product grown or
produced in the countryside untouched” (Vorst, 2000). The main processes are handling, storing,
packing, transportation, and trading these foodstuffs.
1.2 Kiwifruit supply chain
Kiwifruit is one of those fruit globally traded in a cold chain (Chen, 2012) defined by Rodrigue and
Notteboom (2011) as “the transportation of temperature sensitive products along a supply chain
through thermal and refrigerated packaging methods and the logistical planning to protect the
integrity of these shipments”. Within this category, kiwifruit has been categorized as exotic fruit such
as pineapple, avocados, etc. which is normally stored at the temperature around 0 °C or higher (Arduino & Parola, 2010). The value generated downstream and the high-profile of kiwifruit justifies
this attention in preserving kiwifruit from farm to plate (Smith, 2005). Chen (2012) highlights the fact
that in each step of the chain special care is given to ensure the quality of the products and thus result
in an optimization of the shelf life.
Figure 1 shows a kiwifruit chain. After harvesting, kiwifruit are immediately transported to packhouses
where they are cooled down. Then grading, labelling and packing take place at ambient temperature,
and immediately after those actions, kiwifruit are stored again in cooled rooms. Within this system
there are several organizations or Kiwifruit Chain Players (KCPs), which are involved in producing,
processing, distributing and commercializing kiwifruit. Starting from upstream there are: growers,
cooperatives, traders (Zespri), distributors, importers and retailers.
1.2.1 Growers
Kiwifruit growers are located upstream in the chain and deal with all the activities aiming at
transforming resources into kiwifruits. They manage fertilizers, pesticides, employees, orchards,
machineries, capital and so on. The production and/or maintenance of the kiwifruit vines target at
optimising both fruit number and fruit size per unit area of canopy (Patterson & Currie, 2010). Orchard
Management Practices (OMPs) are the techniques and practices that enclose actions such as pruning,
fertilizations, pest and disease management, harvesting etc. (Kilgour, et al., 2007). The cultural specific
practices of combining the grower’s skills, knowledge and commitment are fundamental prerequisite to
maximize the productivity at the orchard.
Figure 1: Kiwifruit supply chain.
Wholesalers Exporters Importers
Supermarkets
Wet-markets
Consumers Airfreight
Information flow
Fresh kiwifruit flow
Cash flow
Seafreight
Packhouses Growers
4
Growers and cooperatives collaborate respectively. Whenever growers notify cooperatives about their
vines status, forecasted volumes and other information to co-ordinate the logistic of the harvesting,
cooperatives would furnish a series of services to growers in response.
1.2.2 Pack-house operators or cooperatives
The central activity of the operations during the post-harvest period is to preserve kiwifruit by
packaging and storing. While at the orchard the quality of fruit is generated, the focus at the post-
harvest operations is to preserve the quality by packing and storing. Refrigerated into cooperatives’
infrastructures, harvested kiwifruit are immediately stored. Cooperatives’ infrastructures include
grading and packaging machineries, laboratories (quality assessment), shed and cold storages. The
packaging takes place in the cooperatives or it is finished at the port of the importing countries when
there are country-specific packaging requirements. Kiwifruit are often packed in carton trays of 3.3 kg
and/or other type of boxes to preserve them from physical damages, favourite piling and transportation.
Cooperatives provide a range of services for the associated growers, for instance, technical assistance
and documentation compliance (Pacino, et al., 2011). Seasonal themed meetings are often hosted and
organized by cooperatives to encourage information exchange between growers and technicians.
Training courses deliver knowledge such as farm risks, environmental issues, or new certifications for
exporting. Economic analysis concerning market trends, customer response, operational costs are also
transferred to growers as well as technical assistance about diseases diffusion, innovations, strategies to
improve quality/yield, lowering the costs and reduce the environmental impact of the farming activity.
1.2.3 Traders
By continuing along the chain (Figure 1), traders are usually organizations that coordinate the import-
export and sell batches of kiwifruit to supermarkets or wet-market. They manage the flow of kiwifruit
and the cash flow. More or less of these organizations guarantee the transportation of kiwifruits, and in
some cases, cooperatives behave as traders and have supply contracts with supermarkets which result
in fewer passages within the chain. While in other cases more passages within the chain take place with
the involvement of organizations such as exporters, importers, and wholesalers.
As discussed in Introduction, Zespri is one of the most crucial traders worldwide. Zespri ensures
retailers with high quality kiwifruit all year long. It coordinates the whole flow of kiwifruit, the flow of
money and information. To fulfil some activities, Zespri outsources transportations and other services
to external companies, and also makes agreements with supermarkets. A further description of Zespri
is given in the following sub-chapter.
Zespri
Zespri International Limited was funded in 1997 as a global marketing organisation, providing a Single
Point of Entry (SPE) for the export of New Zealand grown kiwifruit (Zespri, 2012). The differentiation
strategy based on promotion, new variety appeal, best kiwifruit quality and 12-months’ supply has
been achievable through its complex supply chain. The global distribution network from the producing
countries to the consuming ones is controlled and guaranteed with more than 250 employees
worldwide. Zespri commercializes more than 30% of the worldwide exported kiwifruit in over 50
countries. This has been possible by the co-ordination of kiwifruit, capital and information flow and by
the strong of relationships with growers, cooperatives and consumers.
As we can see in Figure 2, Zespri has a centralized position in co-ordinating decisions within the chain.
This co-ordination system is called “helicopter perspective” or “supply chain cockpit” for the reason

5
that one organization (in this case Zespri) takes the lead in the decision-making process as the supply
chain director (Vorst, 2000). Centralised systems such as this one require that the chain director or
leader make decisions along the chain and synchronizes the whole flow of goods, information and
cash.
In Figure 2, there is a schematization of the key relationships of how Zespri has close interactions with
farmers, pack-houses, retailers and consumers. These relationships are reported in the following list:
1. Growers have licensee agreements/contracts with Zespri. They supply kiwifruit to Zespri and in
return they get consistent payment for standardized (high quality) kiwifruit, as well as price
stability along the years.
2. Pack-houses have contracts with Zespri. They carry out activities such as: quality control,
labelling, packing and storing batches of kiwifruit until Zespri request to ship them.
3. Between Zespri and retailers there are contracts that guarantee the supply of kiwifruit.
4. Zespri has a marketing relationship with consumers. High quality kiwifruit, new varieties and
promotional campaigns have created brand recognition.
The Italian Zespri system differs consistently from the New Zealand one. In Italy, Zespri guarantees its
supply through fixed contracts mostly with cooperatives and growers. This is a medium term
relationship based on contracts with suppliers. On the contrary, in New Zealand Zespri has several
vertical integrations upstream in the chain, for instance, among growers and pack-houses and/or
growers and Zespri. Some pack-houses own large plantation and some growers have shares of the
pack-houses. Zespri itself was corporatized in 2000 and New Zealanders’ growers are its primary
shareholders (Martin, 2008; Alvarez & Shelman, 2010). As a consequence the New Zealand Zespri’s
chain presents closer interactions that cannot be compared with the Italian one.
1.2.4 Distribution centre
Continuing along the chain (Figure 1), after the trader there is the distribution centre. The intrinsic
characteristics of the fruit and the way kiwifruit is traded determine the logistic structure adopted to
distribute kiwifruit in the market. Such features are: distribution frequency and shelf life, shelf value,
demand variability, market responsiveness and country-specific requirements (Chen, 2012). Those
features are described as below.
Distribution frequency and shelf life: the longer the shelf life of the product is, the more
centralized the value added logistic services (VALS) and the lower the frequency of
distributions is. In contrast, product with a shorter shelf life need that the VALS is located
closer to the final markets and quick market respond increase the frequency of distribution.
Shelf value: expensive fruit need more quality controls and attention to packaging. The more
service level requested by the customers the higher is the margin earned.
Figure 2: Zespri Supply Chain control.

6
Demand variability: the more stable the demand is (banana, apple, etc.), the more centralized
the distribution centre is (economy of scale). In contrast, products with unpredictable demand
need decentralized distribution services that quickly respond to market changes.
Market responsiveness flexibility: fast market respond requires decentralized distributors near
the customers.
Country-specific products or packaging requirements: national differences require
customized packaging. So, for every market specific packaging is performed at the port or in
the entry locations.
Those indicators together determine the location, the sort of distribution centre and value added logistic
services (VALS). The long storability of kiwifruit (more than to six months) makes possible the
adoption of a centralized distribution (economy of scale) (Chen, 2012), with less frequency of delivery.
Also, the high shelf value of kiwifruit justifies the attention on packaging to prevent fruit loss and to
add value by the use of packaging. As a result the location of the VALS is close to the harbour where
kiwifruit are stored in a centralized area, eventually repacked and delivered to the retailers.
Jan. Feb. Mar. Apr. May Jun. Jul. Aug. Sep. Oct. Nov. Dec.
Italy
New Zealand
Chile
Greece
Table 2: Countries of origin and the respective supply in the European’s market (Chen, 2012).
An example of distribution centre can be the harbour of Antwerp. Table 2 shows shipped kiwifruit to
Antwerp from four main exporting countries (Belrose, 2011; Chen, 2012). In the EU the availability of
kiwifruit all year long is only possible through the complementarity of these productions. New Zealand
and Chile supply the EU market from May to October, whereas Italy and Greece provide kiwifruit for
the rest of the year. Distribution facilities might be used all year long with diverse batches of kiwifruit.
Centralized storage facilities store kiwifruit at controlled atmosphere and make possible the continue
supply of kiwifruit into the distribution network.
1.2.5 Retailers and consumers
Once kiwifruit arrive at the retailers, they are unloaded and moved into the shop storage room. Trays of
kiwifruit are then placed in the shelf. At the retail level, the shelf life of the fruit on display depends on
the maturity level, however when exposed at room temperature kiwifruit ripens after a few days to a
week. The supply is guaranteed by contracts with suppliers such as wholesalers, cooperatives, traders,
and importers.
In the supermarket section of fresh fruit and vegetables, large space is given to important products
daily consumed e.g. apples, carrots, bananas, potatoes, oranges, etc. (Martin, 2008), and kiwifruit is
often located in a smaller part of the fruit section where it competes against other tropical fruits. An
example concerning the shelf space in the supermarkets was experienced in Japan and in the UK.
Significant effort was placed in negotiating shelf space for both the Zespri™Green and Zespri™Gold
products (Martin, 2008). Although some resistances, when new kiwifruit variety Zespri™Gold was
launched, consumers demonstrated a certain neophilia which result in a willingness-to-pay premium
for it; often there is 100% more than that for the traditional Hayward kiwifruit (Ferguson, 2011).
Hence, retailers have shown an increasing interest in selling kiwifruit and the new varieties/products
that could give them an exclusive position over competitors and generate excitement among consumers
(O'Rourke, 2011).
7
2 Research design
After having described the kiwifruit chain players and the functions they perform within the chain, in
this section we move our attention to the aim of this study through. The conceptual design phase
includes the concepts that we focus on, and in the technical design we will explain how we intend to
achieve them.
2.1 Conceptual design
2.1.1 Problem context
The problem context is divided into sub-sections elaborating reasons why we intend to focus this study
on Italian kiwifruit growers and on their productivity. The first sub-section refers to the national
productions comparison between Italy and New Zealand. Then, we will explain which are the reasons
that motivate us in focussing on growers and why do they play a crucial role within the chain. Lastly,
we refer to the productivity at the orchard level and we will refer to the scarce collaboration within the
Italian kiwifruit industry.
National productions
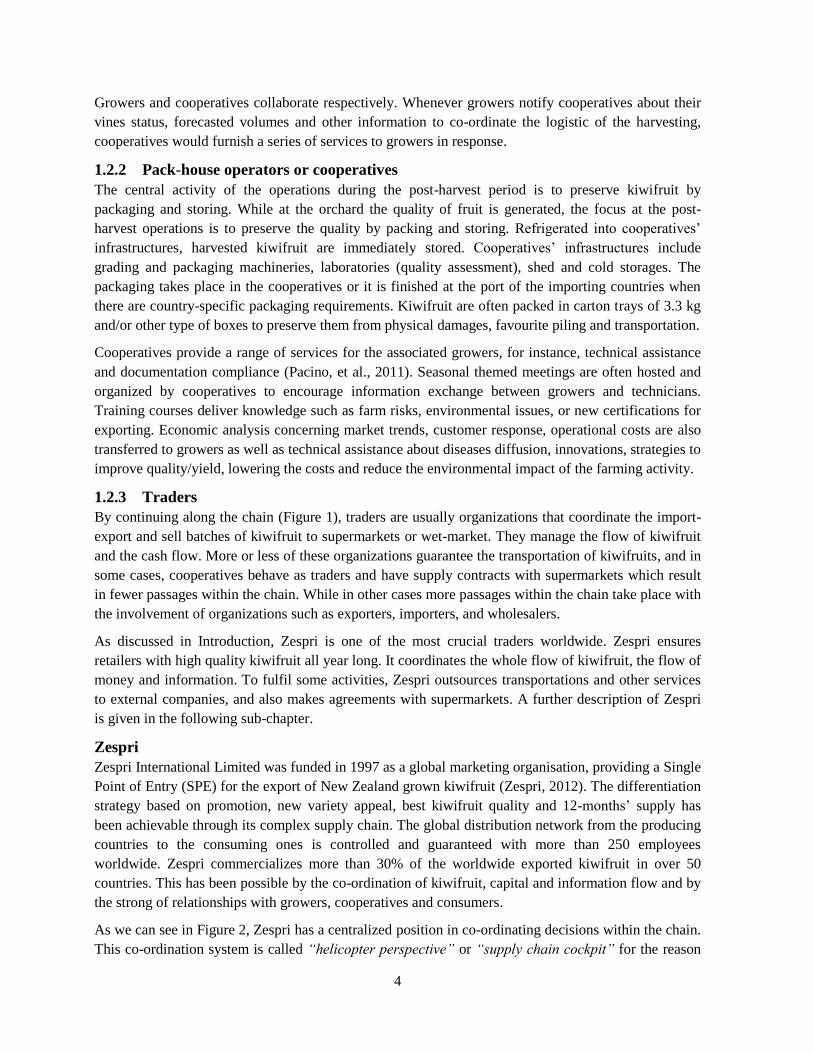
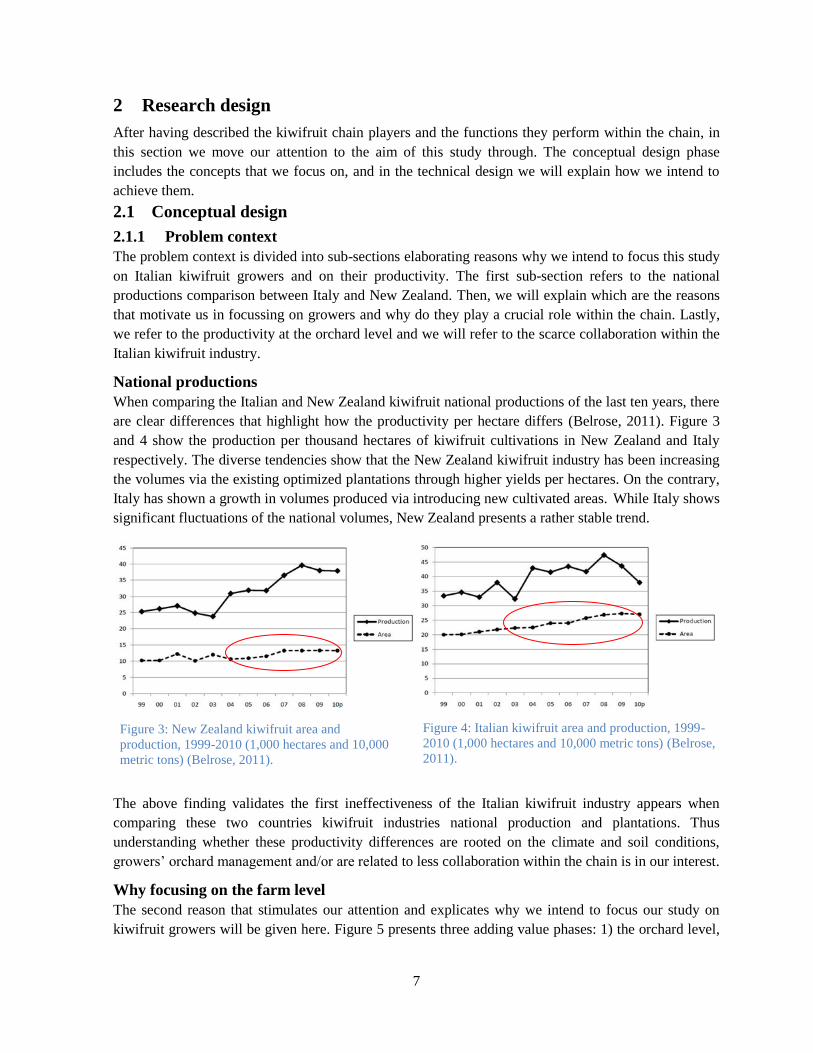
When comparing the Italian and New Zealand kiwifruit national productions of the last ten years, there
are clear differences that highlight how the productivity per hectare differs (Belrose, 2011). Figure 3
and 4 show the production per thousand hectares of kiwifruit cultivations in New Zealand and Italy
respectively. The diverse tendencies show that the New Zealand kiwifruit industry has been increasing
the volumes via the existing optimized plantations through higher yields per hectares. On the contrary,
Italy has shown a growth in volumes produced via introducing new cultivated areas. While Italy shows
significant fluctuations of the national volumes, New Zealand presents a rather stable trend.
The above finding validates the first ineffectiveness of the Italian kiwifruit industry appears when
comparing these two countries kiwifruit industries national production and plantations. Thus
understanding whether these productivity differences are rooted on the climate and soil conditions,
growers’ orchard management and/or are related to less collaboration within the chain is in our interest.
Why focusing on the farm level
The second reason that stimulates our attention and explicates why we intend to focus our study on
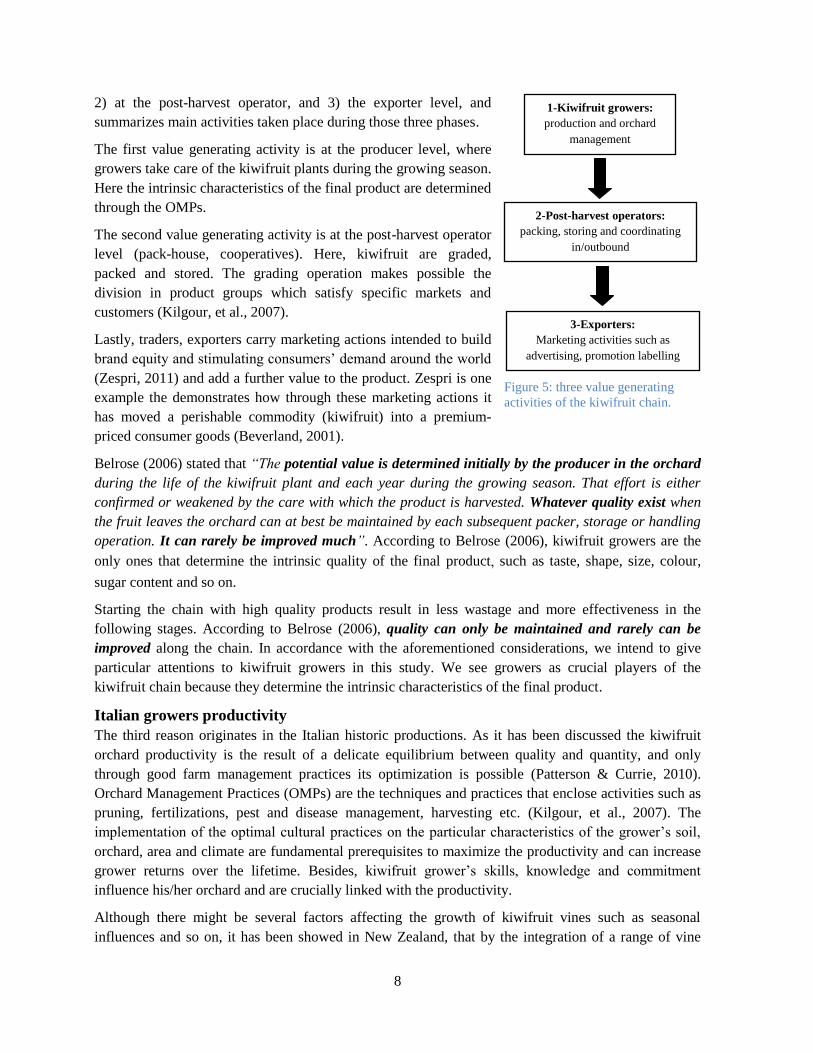
kiwifruit growers will be given here. Figure 5 presents three adding value phases: 1) the orchard level,
Figure 3: New Zealand kiwifruit area and
production, 1999-2010 (1,000 hectares and 10,000
metric tons) (Belrose, 2011).
Figure 4: Italian kiwifruit area and production, 1999-
2010 (1,000 hectares and 10,000 metric tons) (Belrose,
2011).
8
2) at the post-harvest operator, and 3) the exporter level, and
summarizes main activities taken place during those three phases.
The first value generating activity is at the producer level, where
growers take care of the kiwifruit plants during the growing season.
Here the intrinsic characteristics of the final product are determined
through the OMPs.
The second value generating activity is at the post-harvest operator
level (pack-house, cooperatives). Here, kiwifruit are graded,
packed and stored. The grading operation makes possible the
division in product groups which satisfy specific markets and
customers (Kilgour, et al., 2007).
Lastly, traders, exporters carry marketing actions intended to build
brand equity and stimulating consumers’ demand around the world
(Zespri, 2011) and add a further value to the product. Zespri is one
example the demonstrates how through these marketing actions it
has moved a perishable commodity (kiwifruit) into a premium-
priced consumer goods (Beverland, 2001).
Belrose (2006) stated that “The potential value is determined initially by the producer in the orchard
during the life of the kiwifruit plant and each year during the growing season. That effort is either
confirmed or weakened by the care with which the product is harvested. Whatever quality exist when
the fruit leaves the orchard can at best be maintained by each subsequent packer, storage or handling
operation. It can rarely be improved much”. According to Belrose (2006), kiwifruit growers are the
only ones that determine the intrinsic quality of the final product, such as taste, shape, size, colour,
sugar content and so on.
Starting the chain with high quality products result in less wastage and more effectiveness in the
following stages. According to Belrose (2006), quality can only be maintained and rarely can be
improved along the chain. In accordance with the aforementioned considerations, we intend to give
particular attentions to kiwifruit growers in this study. We see growers as crucial players of the
kiwifruit chain because they determine the intrinsic characteristics of the final product.
Italian growers productivity
The third reason originates in the Italian historic productions. As it has been discussed the kiwifruit
orchard productivity is the result of a delicate equilibrium between quality and quantity, and only
through good farm management practices its optimization is possible (Patterson & Currie, 2010).
Orchard Management Practices (OMPs) are the techniques and practices that enclose activities such as
pruning, fertilizations, pest and disease management, harvesting etc. (Kilgour, et al., 2007). The
implementation of the optimal cultural practices on the particular characteristics of the grower’s soil,
orchard, area and climate are fundamental prerequisites to maximize the productivity and can increase
grower returns over the lifetime. Besides, kiwifruit grower’s skills, knowledge and commitment
influence his/her orchard and are crucially linked with the productivity.
Although there might be several factors affecting the growth of kiwifruit vines such as seasonal
influences and so on, it has been showed in New Zealand, that by the integration of a range of vine
1-Kiwifruit growers:
production and orchard
management
3-Exporters:
Marketing activities such as
advertising, promotion labelling
2-Post-harvest operators:
packing, storing and coordinating
in/outbound
Figure 5: three value generating
activities of the kiwifruit chain.

9
manipulation techniques or OMPs that top performing growers constantly achieve very high fruit
productivity over several seasons (Woodward & Patterson, 2008; 2009). Therefore, we consider
kiwifruit growers’ skills and commitment as important factors influencing the outcomes of the orchard.
Furthermore, major constraints have been found in the Italian kiwifruit chain. The productivity of
Italian growers often lacks in quality and quantity. Italian growers have been focusing primarily on the
total yield of their crop rather than fruit size or quality or on class 1 yield per hectare (Mazzeo, et al.,
2011). This growers’ careless penalizes the final price per kilogram and therefore their gross revenues.
By taking into account these considerations, it is interesting to understand which are the causes
affecting Italian kiwifruit growers. Whether they know these OMPs and how they implement them, and
also whether they focus on quality and/or quantity. This study intends to understand to what extent
Italian Kiwifruit growers are committed to this business. As a result, our objective is to understand
what factors are affecting Italian growers’ productivity.
Chain reasons
Growers’ productivity depends on several factors of the farm management and of OMPs
implementation, nevertheless, chain organizations such as cooperatives, Zespri, suppliers of
agricultural products, research institute and public organizations do influence them to a certain extend
by providing technical support and services.
Within the Italian system there is a high level of competition among kiwifruit cooperatives, processors
and exporters. There are several large companies that dominate the export with consistent volumes but
also a multitude of traders that buy kiwifruit directly from growers. Hence, the whole industry is
characterized by different sorts of collaboration, short term relationships between growers and buyers,
and different quality parameters that differ from buyer to buyer. The cohesiveness of the chain players
reflects lack of trust and confidence. From the growers side there is a doubtful trust in the cooperatives
and in the traders.
From the Zespri perspective emerged that “securing the right product (in terms of quality) has been
more than a challenge”, and that they “have to deliver consistent, high quality and safe fruit that
upholds the integrity of the Zespri brand” (Lain Jager, Zespri CEO) (Alvarez & Shelman, 2010). This
also reflects the interest for Zespri to understand how productivity in terms of quality can be improved
in the Italian sector.
The other reason that justifies the importance of the chain players in influencing growers’ productivity
is the technical assistance and services provided. Growers have to adapt rapidly to market, regulations,
and environmental changes, which makes interactions within the chain crucial. The transparency of the
information concerning market trend, price forecast, new technologies and development can only be
achieved through the collaboration between Kiwifruit Chain Players (KCPs). If we consider the
concept of supply chain management (SCM), the design of seamless value-added processes is realized
across the organizations boundaries and not individually. This justifies the reason why we intend to
include these organizations surrounding the growers which might exert an impact as well but it is not
yet clear.
The last reason reflects the potentiality for Italian kiwifruit producers. The climate suitability and the
strategic position within the EU make this country first among the major exporters of kiwifruit

10
(Belrose, 2011). This also reflect significant interests for a global trader such as Zespri which requires
high quality kiwifruit to explore new markets.
In this study we aim on understanding the type of interaction among these chain players and whether
they jointly collaborate in optimizing the Italian kiwifruit production and commercialization. In
particular, our intention is to understand: first, to what extend the productivity of Italian growers is
correlated to activities and interests of chain actors, such as cooperatives and Zespri; and second,
which correlations there are between orchard management, technical practices, chain actors’ activities
and interests, and growers’ productivity.
Concluding remarks of the problem context
As mentioned above, we have drawn our attention to the necessity to understand and the attempt to
promote development within the Italian kiwifruit chain by focussing on growers and their interaction
with chain players. In summary, the motivations that justify the objective of this study are:
The productivity of the Italian can be improved if compared with the New Zealand one.
The growers are crucial chain players which determine the intrinsic quality of the final product.
In Italy, growers have been focusing on quantity rather than quality. OMPs are crucial items to
improve the situation and how they are implemented is the objective of this study.
The lack of collaboration among the chain players is related to the lack of trust and
effectiveness within this system.
Zespri requires high quality kiwifruit to guarantee the integrity of the Zespri brand and explore
new markets.
Lastly, the potentialities of the Italian productions place this country as an important player
within the worldwide kiwifruit industry.
2.1.2 Conceptual framework
The conceptual framework shown in Figure 6 summarizes several concepts that were identified during
the contextual analysis. In the left boxes, there are two main areas containing factors that we identified
as fundamentals in influencing growers’
productivity.
In the farm management factors box there are
managerial activities and technical practices
that growers adopt in their orchard. The
managerial aspects include growers’ skills,
knowledge, commitment and experience;
whereas technical factors are the farm
technical practices. Both are correlated with
growers’ productivity.
In the second box, chain actors' activities and
interests denotes a set of factors that probably have an interaction with growers and therefore influence
the productivity too. These factors are: technical assistance, information exchange, diffusion of
innovations, and chain management practices. These two main areas of study set the boundaries of the
research.
Figure 6: Factors that influence farm performance.
Farm management factors:
Managerial
Technical
Chain actors’ activities and
interests:
Provide technical assistance
Information exchange
Innovation
Chain management practices
Growers’
productivity

11
2.1.3 Research objective
With a clear picture of the problem context and the definition of the research background, the research
objective of the study is:
“To provide recommendations on opportunities for productivity improvements of the Italian Zespri
kiwifruit chain by investigating how farm management practices and chain players related activities
have positive or negative affect on growers’ performance”.
2.1.4 Research framework
The research framework illustrated in Figure 7 is a visual representation of steps that should be taken
to accomplish the research objective.
A theoretical/literature review will be conducted on different fields (Figure 7, bullet 1, 2, 3). Theories
concerning farm management theories (1) will be used to understand the basis of the kiwifruit orchard
management. Grower performance indicators (2) will be identified from the literature as for measuring
farm productivity. Lastly, particular attention will be given to the literature concerning chain factors
influencing growers’ performance (3).
In the second phase, an empirical analysis will gain direct information from the Italian kiwifruit
growers. From the literature study, a set of key indicators will be selected (4) and converted into
variables and questions which will be adopted as part of the questionnaire. The design of the
questionnaire will be supported by referencing other surveys already held in New Zealand (5), and then
the questionnaire will be sent to Italian kiwifruit growers. The data collection will also take place in
this phase of the study (6).
Then, the information from the survey will be processed with statistical software (SPSS) and the
possible correlations among indicators will identify what are the factors influencing growers’
productivity (7). Conclusions will be drawn then with the recommendations for improvements (8).
2.1.5 Research question
Central question
“What opportunities can be recognized within the Italian kiwifruit chain to improve the growers’
productivity?”
Figure 7: Research framework.
Theoretical/literature Empirical Conclusion Analysis
7-Comparative
growers’ survey
analysis, aiming
on understanding
the causes and
opportunities to
enhance farmers’
performance
5- NZ survey
4- Key indicators and
factors that impact
farmers’ performance
3- Chain factors that
influence farmers’
performance
2-Grower
performance
indicators (GPI’s)
8- Recommendations
for improvements
6- Survey among
Italian growers
1- Farm practices

12
2.1.6 Definition of concepts
In this section, key concepts will be provided to facilitate the execution and the delineation of the
research domain. Additional restrictions for some concepts should be imposed in order to proportionate
the scope of this research project.
OMPs
Orchard Management Practices (OMPs) are the activities and practices that optimize the kiwifruit
productivity in the kiwifruit orchards. A high portion of literature concerning OMPs will be yielded
from New Zealand professional and scientific journals due to the great advancements in research and
in kiwifruit orchard optimization.
Growers’ performance
Among the possible key performance indicators (KPIs) which can be applied to measure the
performance kiwifruit farms, we will use quality and quantity as growers’ performance indicators.
Quality: it measures whether or not the product meets the customer expectations/requirements.
E.g. taste, colour, sugar level etc.
Productivity: is related to the outputs generated by the farming activity in relation of the
resourced consumed by it. Usually it is expressed as a ratio (actual output/actual input). E.g.
tonnes of kiwifruit produced per hectare/hours of labour.
Quality
The quality of kiwifruit is evaluated by diverse indexes. There are two commonly used indicators: fruit
size and dry matter. According to Cai (2011), kiwifruit size and taste significantly increase the market
acceptance when the fruit is bigger and tastier.
Kiwifruit size denotes the physical appearance of the fruit. It is determined by the number of fruit that
fits in one tray of 3.3 kg. Sizes that are commercially marketable vary between 18 (183g) to 42 (78g)
(Kiwiflier, 2011). On the other hand, kiwifruit dry matter (DM) is considered as the most suitable
index for measuring organoleptic proprieties. DM includes both soluble solids (mainly sugar) and
insoluble solids (structural carbohydrates and starch) that affect the taste of kiwifruit (Crisosto, et al.,
2011). Tests conducted on consumers' acceptance of kiwifruit showed that fruit with a low DM are less
preferred, and that DM higher than 16.1% was considered sufficient for the Hayward and around
18.5% for Zespri Gold (Crisosto, et al., 2011). DM has been considered to be a potential index for taste
and for storability; therefore, Zespri pays additional incentives to the growers who supply premium
tasting kiwifruit (Patterson & Currie, 2010; Zespri, 2010; Kiwiflier, 2011). The enrichment of the DM
is the result of the carbohydrate accumulation influenced by orchard management practices and their
execution has become a fundamental prerequisite to be profitable.
Productivity
Farm productivity depends on quantity and quality harvested. It is expressed as the “yield of class 1
fruit per canopy hectare”, and it is measured in trays per hectare (3.3 kg/tray) or more commonly in
tons per hectare (tons/ha) (Patterson & Currie, 2010). The average yield of one hectare of Hayward
kiwifruit varies between 30 to 55 tons/ha, while for the Zespri Gold variety it varies between 30 to over
70 tons/ha of class 1 (Patterson & Currie, 2010).
The productivity of the orchard is measured via the profitability, which is the result of multiplying the
quantity and the quality produced. One of the key indexes of measurement is the orchard gate return
(OGR) (Kilgour, et al., 2007). The OGR is the amount of money that the grower gets as a

13
remuneration, and it is defined as the total amount of € or $ paid to the grower for one season per
canopy hectare (€ or $/ha/year). The OGR does not only measure the economical return of the growers
but also reflects multiple factors. The OGR includes the normal fruit payment per each category
produced plus the incentives received for the quality achieved. In Table 3 there is a scenario of the
average OGR of New Zealand growers. The data has been taken from the Zespri monthly magazine
called Kiwiflier of October 2011.
Fruit categories Average OGR per hectare
Zespri Green $30,828
Zespri Green Organic $34,671
Zespri Gold variety $85,227
Table 3: New Zealand growers average OGR of for three categories of kiwifruit 2010/11 (Kiwiflier, 2011).
Concerning this research the OGR will be used as the performance indicator to assess the effectiveness
of kiwifruit farmers. It includes several variables e.g. quality parameters, productivity (yield per
hectare) in one numeral index, so this facilitates the whole investigation and directly reflects the ability
of the growers in implementing agricultural practices aiming on its increase. Furthermore, through the
OGR we can distinguish from the pool of kiwifruit growers and, productivity differences; and then to
categorize the best-in-class and the low-skilled growers.
2.2 Technical design
2.2.1 Research strategies
A desk research will be integrated with a survey methodology. Where the desk research will yield
concepts and theories of kiwifruit cultivation methods and chain management practices, the direct
investigation among Italian growers will be conducted through a survey.
Desk research
The foundations of the study project are based on a desk research. Investigation on existing materials
such as literature, secondary data and statistical analysis concerning kiwifruit industry and chain
factors will give diverse perspective of the issue.
Particular attention will be given to New Zealand literature for the large availability of material
published, but also for the long leadership that this country has shown in the kiwifruit research. The
large material published cover multiple aspects of the kiwifruit industry starting with the practices
related with farm management and orchard optimization, passing through logistic and export and
marketing analysis of consumer preferences.
Theories and concepts of kiwifruit farm management and farm performance. An in depth review of the
published articles concerning kiwifruit orchard management practices, optimization of the resources,
quality improvements etc. will be carried out at this stage. Attention will be also given to literature
concerning kiwifruit chain members (in this case by referring to the Italian case), their interactions and
the indicators previously used in other surveys.
This will lead to the basis for the delineation of a set of variables which will be later converted into
questions. In other words, the objective of the desk research is to investigate what are in the literature
Figure 8: Questionnaire design methodology.
Literature review Theories
Variables Indicators
Questions Questionnaire

14
and a set of variables will be selected based on those concepts and theories, and then converted into
questionnaire questions (Figure 8).
Survey
The survey approach used in this study will investigate on the Italian growers (research unit). The
target is to obtain more knowledge about the Italian’s growers, to figure out what are the elements that
affect their productivity, and to see whether those elements are related to growers' lack of knowledge,
commitment, and/or are related to chain players’ factors.
To obtain reliable results, at least 60-70 growers should answer the questionnaire. Thus, this stage
entails a large number of research units and an intensive workload to collect and process the data
collected. The questionnaire will be filled in online and we will visit the farm and complete the
questionnaire in person when needed. The content of the questionnaire will be based on what discussed
above and on the literature review, however, the principal group of questions will be focusing on farm
characteristics, farm management, technical practices, collaboration with chain members and farm
performance and personal opinions. Also, questions about the interface between Zespri and
cooperatives, and the satisfaction of Zespri's services will be included. Meanwhile, we also want to
investigate whether growers are aware of the cultural practices/techniques and whether they implement
them.
Finally, data acquired from the survey will be processed with SPSS. Statistical correlations and other
type of analysis of the above-discussed factors will elucidate the issue. This information is essential in
understanding the circumstances surrounding the work at the farms, their experiences and relationships
with cooperatives and Zespri.

15
3 Literature review
3.1 Introduction
In this section, attention will be placed on literature concerning farm management practices, technical
practices concerning the cultivation of kiwifruit and theories regarding chain factors that influence the
modus operandi of kiwifruit growers (conceptual model Figure 6).
Starting with some aspects of the farm management and farm practices we will address determinant
elements of the kiwifruit farming system. Particular attention will be paid to the type of farming
system, the farm management team, how decision are taken within the team and whether the farm is
family-owned, managed, and/or it is run under diverse form of ownerships. Education, experience and
the type of labour used are other elements that we will take into account.
In the second part, a general explanation the orchard management practices (OMPs) will be clarified.
Consideration of the kiwifruit cultivation concerning the main practices of canopy management,
pollination, soil, water, and pest and diseases management will be elucidated.
After that, we will address the kiwifruit chain actors’ activities and interests. Here the focus is on the
importance of technical support given to the farmers, for instance, how it is given, from which
organizations of the chain, and how the information are shared and disseminate among kiwifruit chain
players (KCPs). The transparency within the whole system is of crucial importance for the
development; therefore, one sub-chapter is dedicated to the information transparency. Then, we will
explain some theories concerning the innovation in agriculture and the innovation in the kiwifruit
sector. And in the last part of the literature review, chain management practices will be elucidated.
The main material used in this section often refers to the New Zealand kiwifruit industry. The
importance of this crop for the national economy is reflected in the number of studies concerning
cultivating, distributing and commercializing kiwifruit. Thus, particular attention will be placed on
New Zealand academic and professional journals and publications. Besides, we will also cite
agriculture related articles concerning kiwifruit, agriculture in general and on food chain.
3.2 Farm management practices
3.2.1 Farming system
Zespri has been commercializing three main fruit products Zespri™Gold, Zespri™Green and
Zespri™Green Organic. For each fruit category, there are specific production processes and farm
systems. One study on the three different systems conducted in New Zealand presents that
Zespri™Green growers showed significant interests towards fruit yield and quality, orchard gate return
(OGR), Zespri activities, climate and vine health. Meanwhile, Zespri™Gold orchardists shared the
same view of the Green one, although, they showed more concern on quality achievement at the
orchard level and the maintenance along the chain (postharvest operators). Zespri™Green Organic
growers demonstrate to have similar concerns on yield and quality; however, they emphasize the
aspect of soil fertility influencing their yield and quality. They also demonstrate satisfaction in their
orchard environment as a place to live and to bring up a family (Fairweather, et al., 2009).
In each farming systems growers have developed different skills and peculiarities in organizing and
managing their kiwifruit orchards. Zespri Gold growers are usually more skilled in managing the
canopy, applying fertilizers and tend to hire and rely on skilled labour. High profits generated with this
variety justify additional cultural practices to balance the quality and yield throughout carful pruning

16
practices. Organic growers tend to be very skilled in managing the soil fertility and limiting pesticides
and fertilizers as well as conserving the biodiversity of their orchards. To generate good returns, they
use alternative approaches/techniques and the support of orchard consultants (e.g. fertilizers advisors)
(Kiwifruit Journal, 2009). Lastly, Green growers showed to be less educated than Zespri Gold and
Organic growers (Fairweather, et al., 2007). The lower profitability of this crop justifies why less
labour hours are used to produce green kiwi.
Although, for each production system the price differs with consequent distinctions in the OGR, large
profit gaps between the best and the worst farmer are seen in past data. The results may depend on
technical, agricultural and managerial aspects of the farm, as well as characteristics of the soil and of
the orchard.
3.2.2 The farm size and the management
Basically, within the kiwifruit industry we can distinguish three sorts of farm based on the plantation
size: large plantation, medium plantation and small farms. Farm size characteristics are also often
reflected in the way farms are managed.
Large plantations
Large plantations (>30 ha) have got permanent skilled workers and a management team composed with
managers, supervisors, experts and technicians. Decisions are jointly taken in the management team
which plans and coordinates necessary actions. Large plantation’s managers have close relationships
with post-harvest operators and suppliers. These farms often achieve high production due to the high
efficiency and innovativeness. Furthermore, large plantation farms are often subdivided into operations
units. The economy of scale and the capacity to retain skilled workers enhance their efficiency and
effectiveness which make this business attracted to external investors. Often the land and the orchard
are collectively owned and/or leased.
Medium size plantations
Medium size plantations are generally around 10-30 ha and possess similar features of the large ones
but with some differences. The management team is less structured. Experts do not work on farms full-
time and often this sort of farm is family-owned. Decisions are made on the experiences of the growers
and family members. Family members work full-time and the presences of children also boost the
family members’ participation. Reasonable incomes make attractive this business for children and for
other family members (Corsi & Salvioni, 2012). The land is often owned but there are also cases where
it is leased. They usually have a group of specialized workers that holds crucial operations and when
needed they recruit seasonal labours (harvesting period). The innovation adoption is still very high. In
several cases, medium size plantation farms present very dynamic attitudes, participation to initiatives,
and sharing opinions with peers and technicians. Thus, even though they can be family-owned, they are
very competitive within the industry.
Small farms
A large percentage of existing farms is the small farms. In this group, there are smaller family owned
plantations of 1 to 10 hectares, and farm operators are mainly family members. They work full-time
(on-farm labour) and/or part-time (off-farm) (Corsi & Salvioni, 2012). They have few permanent
workers that carry out the main practices along the year and the farmer is the only referent person who
manages all the resources. During the picking time, they recruit extra workers. Concerning the
innovation, this sort of farm presents some resistance in implementing novelties due to the limited time

17
and financial resources. Decisions are often taken by the farmers, and in more dynamic cases, in
consultation with technicians of the cooperatives and/or Zespri.
Considerations
As we also discussed in the previous chapter, there are huge productivity gaps in each farm
management category. Even very small farms can achieve excellent outcomes. Especially when family
members are really committed and skilled or even have agricultural degree, the quality of their labour
justifies the results. This highlights the fact that although farm size might affect innovation adoption
and investments, it is not always true that bigger farms realize better results. It is the combination of
multiple intrinsic and extrinsic factors of the farm and of the grower (manager) that implemented in the
right way can give superior results. The intent of this research is also to understand how this aspect is
correlated with chain players’ influence and participation.
3.2.3 Growers education
Farmers’ education and training are fundamental to rapidly adapt their businesses to any type of
changes (Millar & Kilpatrick, 2005). Often growers see educational institutions with fear, and formal
education qualifications are not highly valued. Other barriers that have been identified by Millar and
Kilpatrick (2005) are the lack of confidence as a learner and often the courses are perceived as not
meeting farmers’ real needs. There may be knowledge barriers between scientist and growers that
impede the cooperation between growers and scientists.
Kilpatrick (2000) investigated how education and training measures affect agricultural and land
management among Australian farmers. In the study, emphasis is placed on the relationship between
the education of growers (below secondary school, secondary school or post-secondary school) and
their participation in education and training classes (including courses, seminars, conferences and field
days). Kilpatrick (2000) concluded that “education and training is able to influence change in three
broadly defined ways: first, by delivering new knowledge and skills; second, by providing interaction
with 'experts' (facilitators, trainers or teachers); and third, by providing opportunities for interaction
with peers (fellow training participants)” (Kilpatrick, 2000).
In the Costa Rica coffee industry, only growers that were generally more experienced and educated
were able to transform their cultivation management practices in a more efficient coffee production.
Coffee growers increased their coffee quality and shifted from a commodity system characterized by
low cost production and low price to a high quality coffee meeting the emerging customer demand
patterns willing to pay a premiums price for it (Wollni & Brümmer, 2012). Corsi and Salvioni (2012)
refers that higher educational levels may rise the productivity of farm work as well as broaden the
range of job opportunities which would lead to more off-farm participation.
Interesting data concerning differences in qualification within the New Zealand kiwifruit industry was
shown in a study by AGROS (Agriculture Research Group on Sustainability). 40% of the Organic
producers had a diploma or a certificate whereas only 29% of conventional Zespri Gold growers and
17% of conventional Green growers have such equivalent condition. Concerning the university degree,
17% of Zespri Gold growers achieved agricultural or horticultural degree, while 13% of Organic
growers and only 2% of the Green growers had a university degree (Fairweather, et al., 2007). This
shows how Organic and Zespri Gold kiwifruit growers tend to be more educated than the green
farmers.

18
3.2.4 Experiences in the fields
The level of experience is also a very important determinant that affects farmers’ performance.
Agricultural practices and techniques have always been transmitted from generation to generation. The
experience of the growers is a valuable source of knowledge that must be taken into account when
considering the grower’s education. The growers’ attachment and familiarity with their ecosystem
(land, vines, climate, etc.) and the experiences made by mistaken fertilization, and/or other agricultural
practices are valuable variables that influence growers’ performance. However, although years of
experience can be seen as a positive factor, it is not always the case. For instance, when the new Zespri
Gold variety was launched in Italy in 2000/2002, a large majority of the Italian growers applied the
same agricultural practices already experienced for years on the Green one; but as a result, a
considerable number of them mistaken fertilization, pollination, fruit load etc. They did not consider
the different characteristics of the plant and showed a reluctant behaviour in learning new techniques.
3.2.5 Type of labour: seasonal or fixed employees
The required labour to manage kiwifruit vines in specific periods of the year highlights the strong
reliance of kiwifruit growers on the workforce. Skilled employees combined with seasonal workers
hold most of the hand labour required in the kiwifruit farm. The variable cost of the labour needed for
1 kg of kiwifruit harvested represents the biggest expenditure and in relation to the variety cultivated,
the growing system (plant density, etc.) the hours of labour required for one-year production are
between 600 and 1200 per hectare. For instance, labours for only fruit and flower thinning can be
expensive since it is a time-consuming work. The work takes from 100 to 200 hours per hectare (Brun,
2010).
Specialized workers are needed for winter and summer pruning, cane selection, flowers and fruit
thinning, till the soil and apply pesticides. For instance, concerning winter pruning and other crucial
activities, Patterson and Currie (2010) remarked how the key feature of many high productivity
orchards is an “intensive” approach which use “skilled labour to implement pruning practices, and
close attention is paid on achieving target numbers of winter buds and final fruit numbers per unit
canopy area that enable fruit size expectations to be met”. Thus, in order to achieve high results, it is
very important that people are trained and have enough experience to correctly manipulate the kiwifruit
vines.
Nevertheless, during picking time, kiwifruit growers need to hire seasonal workforces which are often
foreigners and temporary emigrants. These temporary workers receive minimum remuneration and
usually stay for a limited amount of time. In New Zealand, growers and post-harvest operators hire
foreign workers to supplement their workforce over the peak periods such as harvesting time (Max,
2008). Even if the extra workers stay for just a few weeks of the picking time, growers offer training
lessons concerning picking practices and practices to avoid physical damages caused by poor picking
practices. This enhances a reduction of fruit loss and the optimization of the orchard profitability
(Woodward & Allison, 2009).
3.3 Farm practices
In this section, literature concerning kiwifruit orchard practices and why they are so important in
determining growers’ productivity will be elucidated. The execution of a series of correct actions such
as canopy management, pollination, nutrition, irrigation, pest and disease management are crucial in
guaranteeing the financial returns of the growers. Crop load in terms of fruit number, size and quality

19
per hectare of canopy is the result of the combination and execution of all these activities (Patterson &
Currie, 2010). Differences in terms of soil, climate, vines age, cultivar, and so on are key determinants
characteristics of the kiwifruit plantation and they differ from farm to farm, and often even within the
same orchard. However, the techniques for implementation described here have been proved to be the
most influential factor influencing the productivity.
3.3.1 Canopy management and structure
Canopy management or vine manipulation is crucial in determining the number of fruit per m² of
canopy, fruit size and dry matter content (DM) (Patterson & Currie, 2010). Canopy structure, winter
and spring pruning, wood selection practices are all implemented to have an appropriate ratio of
leafs/fruits, interception of light and to maximize the portioning of carbohydrate to the fruit rather than
into vegetation.
The interception of light is determined by the leaf area index (LAI). Its optimization is guaranteed
through a prudent selection of the wood (canes) during winter pruning (Patterson & Currie, 2010) and
it is fundamental to optimize the production of carbohydrates. A high productivity Hayward orchard
would typically have LAI values of 3-4 (Patterson & Currie, 2010). The optimum LAI via wood
selection seems to be far more important to a high productivity outcome than previously appreciated
(Patterson & Currie, 2010). The ratio of leafs/fruit is crucial for an optimal growth of fruit and the
accumulation of carbohydrates per fruit (Patterson & Currie, 2010)
Pruning and crop load
Kiwifruit vine has many sources of carbohydrate and many carbohydrate sinks (Minchin, et al., 2010).
Researchers have been showing that carbohydrates are allocated with different priority in diverse
organs of the plant. The competition for carbohydrate partitioning between shoot apices and fruit has
been proved to affect the final size of kiwifruit by Minchin et al. (2010). The research has showed that
when shoots are pruned the regrowth has a negative impact on fruit development. Size and DM appear
to be affected when fruit are harvested (Minchin, et al., 2010). To prevent this competition, growers
have to minimize the spring and summer pruning and/or better implement specific pruning techniques
(Patterson & Currie, 2010). Gel-pruning, tip-squeezing, “Zero-leaf” pruning and low vigour wood can
minimize this effect.
Gel-Pruning: shoots are cut with a gel containing naphthalene acetic acid (NAA) which is
applied to limit the regrowth.
Tip-Squeezing: aims on causing a “control crushing” of shoot tips which are consequently
inhibited to regrowth. By squeezing the tips also the development of new lateral shoots is
inhibited (Patterson & Currie, 2010).
“Zero-leaf” pruning: consists in pruning the fruit shoots just after the last fruit. In this way
there are not buds which can regrowth.
Use of “low-vigour” wood: it is a canopy management technique aiming on using canes
which have already fruited and which have a low propensity for vigour shoot growth
(Patterson & Currie, 2010).
Lastly, fruit thinning is required to balance the crop load and enhance the quality. Moreover, the
homogeneous distribution of leaves, shoots and fruits, enhanced light penetration and air movement
result in a better pest and disease control (Matta, et al., 1987). The selection of less vigour type of
wood as well as the maintenance of the canopy through the adoption of vegetation practices

20
aforementioned have become essential for high productivity results (Patterson & Currie, 2010; Miller,
et al., 2001; Thorp, et al., 2011).
3.3.2 Pollination
Kiwifruit is a deciduous species and male pollinators must grow together with female to have fruit set
(Costa, et al., 1993). Usually 10% to 25% of the canopy area is given to male plants with a ratio
male/female that vary from 1:4 to 1:7 (Patterson & Currie, 2010). Kiwifruit blooming lasts 10-15 days
and the contemporary opening of male and female flowers is essential for fruit set. Even so, few days
of adverse weather condition during the flowering period can seriously compromise the pollination and
the achievement of commercial size fruit (Gonzales, et al., 1998; Costa, 2003).
The direct correlation between fruit seed number and the
fruit size has been documented by several studies
(Gonzales, et al., 1998; Costa, 2003; Testolin, 1991).
Within the female flower there are up to 1500 ovules
(Hopping & Jerram, 1979) and their fecundation is
essential for good weight fruit. An overall number of
1000 seeds are needed to harvest fruit >100 g (Costa, et
al., 1993; Testolin, 1991). Figure 9 shows the relationship
between fruit weight and the number of seeds they
contain (Goodwin, 2000). Although there is not a linear
correlation, it is clear how seed number can influence
fruit weight.
3.3.3 Pollination methods
Male pollen is naturally transported to the female flowers by wind
and insects or it can be transported by artificial pollination.
Previous studies documented outcomes of each pollination method
in terms of advantages on fruit size, working hours needed and
possible limitations in case of adverse climatic conditions (Costa,
et al., 1993; Gonzales, et al., 1998; Asteggiano, et al., 2010).
Figure 10 compares fruit weights/frequency at the harvest time
pollinated with three diverse methods (Costa, et al., 1993). Results
demonstrate smaller fruit in the control when compared with
honeybees and hand-pollinated fruits.
This study proves how crucial and delicate this phase is in
determining fruit size and how pollination techniques aid fruit size.
Therefore kiwifruit growers should place remarkable attention
during the blooming period. Below are described diverse
techniques which have been developed to boost the pollination in
kiwifruit.
Wind pollination
Wind pollination consists of the movement of pollen from male to female vines by wind. This happens
naturally in the orchard but recently it has also been enhanced with mechanical fans installed on
Figure 10: 10-g class distribution of
fruit weight in caged, open pollinated
with bees, and hand-pollinated vines in
1990 (Costa, et al., 1993).
Figure 9: Relationship fruit weights and
seeds number (Goodwin, 2000).

21
tractors. The success of this technique depends on the blooming synchronization, climate conditions
and the male/female ratio. However, even under the most favourable condition, wind alone is not
sufficient to produce fruit of 100 g or more (Costa, et al., 1993; Goodwin, 2000).
Honey bees pollination
Among the diverse insects that visit kiwifruit flowers, honey bees are the most commonly used. They
transferred male pollen to female flowers. A single bee visit can produce more than 200 seeds
(Goodwin, 2000). Hives are introduced in the orchard when 10 to 20% of the female flowers are open,
and their number is generally around 8-10 hives per hectare. Honeybees can successfully pollinate
kiwifruit but their flower visiting is highly dependent on weather conditions. Scarce pollinations have
been seen in seasons when they appeared to have low temperature, excessive rain and cloudy weather
conditions.
Artificial pollination
Artificial pollination has been demonstrated to be effective in pollinating kiwifruit in several scientific
studies (Costa, et al., 1993; Gonzales, et al., 1998; Asteggiano, et al., 2010). A great advantage of this
technique is that it reduces the risks of the growers. If it is correctly held, it can guarantee successful
results even with adverse weather conditions (Gonzales, et al., 1998). Kiwifruit pollen can be stored for
2-3 years at -20 °C and applied when needed (Goodwin, 2000) in combination with wind and/or
honeybees to increase fruit size. However, it should be taken into account that artificial pollination is
an expensive practice and it is important that the extra costs of implementing it will be repaid by the
fruit size achieved (Goodwin, 2000).
The pollen is applied to female flowers by three basic principles, direct contact, wet, or dry. Direct
contact consists in the application by hand flowers by flower. The reliability and effectiveness of this
technique in fully pollinate the female flower has been proved by several studies that it is often used as
an experimental tool. Nevertheless, it is labour intensive. Usually, pollinating 1 hectare of canopy area
takes between 130 to 180 hours. Thus, large plantations encounter difficulties in implementing this
approach. The second artificial technique is the wet method. Male pollen is dissolved in a solution
designed to maintain its viability and with different devices it is applied. Lastly, there is the dry
method. Pollen is distributed with devices that create an air current. For both wet and dry method, there
is specific equipment that requires hours of labour. It is important to emphasize that the more precise
the application of the pollen to female flowers is the better results are. Hand pollinator devices are
often preferred than mechanic distributors.
To sum up, kiwifruit pollination is crucial in determining marketable fruits. The relationship between
seed number and fruit weight is commonly known. It is also clear that rely the pollination only on one
method might give unsatisfactory fruit size. Adverse weather conditions compromise honeybees’
activity and frequent rains during the blooming period increase the risks of having scarce pollination
results. It is therefore fundamental to use complementary pollination practices (Asteggiano, et al.,
2010).
3.3.4 Soil and water management
Plant nutrition
Soil fertility is essential to sustain production as well as minimizing the environmental impact of
kiwifruit orchard. Fertilization programmes should take into account the amount of nutrients required

22
by the vines along the different phenology phases, the one already available in the soil and the minerals
coming from the mineralization of soil organic matter (Xiloyannis, et al., 2011).
Soil and leaf analysis are two complementary tools to evaluate soil fertility, vine status, and design
fertilization programs (Table 4). The objective of these analyses is to determine whether there are
deficiencies and/or excesses of nutrients and to ensure that growers timely adjust fertilizers inputs
along the diverse growth phases. Soil testing is usually held annually in late winter and before adding
any type of fertilizers. Physical and chemical information of the soil are then evaluated by the growers
in consultation with experts of designing fertilization program for the coming year. A direct assessment
of the nutrient intake and specific symptoms (i.e. toxicities) (Sher, 2008) is done by leaf tissue
sampling. Growers conduct leaf testing usually twice a year. Eight weeks after leaf emergence (pre-
flowering), leafs are analysed to detect any nutrient deficiencies (potassium contents). This allowed the
growers to immediately correct fertilization program. The second leaf analysis is usually carried in the
mid-season (mid-summer) when nutrients level is stabilized. Here, the opportunity to correct nutrient
deficiencies is limited, but vine status data is used to make adjustments for the following season’s
nutrient programme (Sher, 2008).
Analysis Phenological phase Benefits
Soil testing Mid-winter (before any nutrient
applications)
-Determine nutritional status of the soil
-Design fertilization programme
Leaf testing Pre-flowering (eight weeks after leaf emergence)
-Early correcting actions -Modification of the fertilization programme
Leaf testing Mid-season (when nutrient level are
stable)
-Evaluation of the nutrient availability during spring
-Adjustments for the following seasons programme
Water testing Before summer -Identification of minerals applied by water -Interaction with fertilizers programmes
Table 4: Soil and leaf analysis used to control vine status.
Water is also analysed to measure the chemicals contained. Vine nutrition might be affected by the
high content of minerals in the water (Sher, 2008). For instance, total dissolved salts should not exceed
the electrical conductivity of 2.5 micro mhos/cm (Sher, 2008).
Fertilization practice differs from orchard to orchard and several are the parameters that should be
taken into account when designing nutritional programmes. According to Pentreath (2011), it is
fundamental to “tailor the fertilization program to the single orchard needs by utilising analytical
results, technical expertise and smart tool to ensure optimal returns while minimizing the
environmental impacts”. The fertilization of kiwifruit should take into the right dose in each phase. For
instance the amount of nitrogen (N) and calcium (Ca) might affect the quality of DM (Boyd, 2005;
Boyd & Barnett, 2010).
Irrigation management
Judd et al. (1989) stated that “the economic returns of kiwifruit depend strongly on individual fruit
sizes, which are in turn directly affected by water availability”. To prevent the vines from suffering
water stress, kiwifruit orchards are regularly irrigated. Summer drought and scarce rains justify the
economic effort afforded by growers to irrigate kiwifruit vines (Xiloyannis, et al., 2011).
Judd (1989) and Miller (1998) proved that after fruit set, water stress has a direct effect on fruit growth.
A reduction of the average size is visible in Figure 11 (Miller, et al., 1998). Vines were water stressed
in two moments of fruit development, that are 10 (water stress 1) and 90 (water stress 2) days after the

23
full bloom respectively. Compared to the control,
significant fruit size reduction was seen in the water stress
1. However, water stress 2 caused lesser reduction and an
increase of DM.
Overwatering kiwifruit vines in the early and late stage of
fruit development might also affect quality. A reduction of
DM has been proved by more fruit water uptake. This was
even more evident when fruit have been treated with
growth stimulants (Morton & Woolley, 2011).
Multiple are the factors in determining the correct water
amount. Factors such as temperature, humidity, radiation
intensity and wind are indicators used by the growers to
daily adjust irrigation frequency and volumes.
3.3.5 Bio-stimulants
Obtaining marketable size fruit is an important determinant of orchard profitability (Patterson &
Currie, 2010). Bio-stimulators are adopted in farm management to achieve high yield of ideal size
(ideal-sized) fruit. Within the category of bio-stimulants, there are products that improve the
development of buds and flowers such as: HiCane® or Dormex® -defined as dormancy breaking
agents- and those products that directly influence fruit morphogenesis, also called fruit sizing
stimulators and/or growth activators.
3.3.6 Dormancy breaking agents
These bio-stimulators are usually adopted in certain climatic areas to overcome the lack of chilling
requirement during winter (Costa, et al., 2011). Kiwifruit plantations located in warm cultivating areas
are often affected by scarce differentiation of flower buds which results in scarce yield and low rate of
marketable fruits. By applying dormancy breaking agents, the bud-break and fertility are expected to
increase (will increase) (Patterson & Currie, 2010; Costa, et al., 2011). As a secondary effect,
dormancy breaking agents strongly reduce unwanted lateral flowers (flowers malformation), which
reduces greatly thinning costs (Hernández & Craig, 2011), stimulate contemporary blooming (Costa, et
al., 2011) , and they also contribute to increase the average size of the fruit produced (Mc Pherson, et
al., 2001). These dormancy breaking agents are normally applied in mid-winter, 40-45 days before the
expected bud-brake, to stimulate the hormone maturation of the flower buds.
Their usage among growers has been increased in the last decade. However, recently hydrogen
cyanamid (Dormex®, HiCane®) has been restricted for dormancy interruption within the EU. New
Zealand growers have raised serious concerns about how long these products will be available and
what are the other alternatives available in the market (Hernández & Craig, 2011). Other two
dormancy breaking products Erger® and Armobreak® were tested and compared with HiCane® on
Hayward kiwifruit (Actinida deliciosa var. deliciosa ‘Hayward’).
Figure 11: Changes in kiwifruit volume
from fruit set to harvest and the effects on
growth when a water stress is imposed in
early (■) or late summer (▲) compared to
control vines (O) (Miller, et al., 1998).

24
3.3.7 Growth activators
Within this category, there are formulas used to increase consistently fruit size. Commercial products
are Sitofex®, Caplit®, Maxim®, Spray Dunger Global® and Benefit®. The great advantage of using
them, for instance Benefit applied on the Zespri™Gold, is the increase in fruit weight from c. 95 to 125
g (Patterson, et al., 2003). Thus, these bio-stimulators can make differences in terms of crop load and
fruit weights. However, recently there has been more attention on the adoption of the bio-stimulators.
If they enhance fruit size and by two/three applications growers can increase their productivity, several
scientific papers demonstrate that these fruit often hardly reach high level of dry matter (taste)
(Patterson & Currie, 2010). Moreover, the storability life can be affected and it must be pointed out
that the use of these compounds is restricted in some crop protection programmes (Costa, et al., 2011).
It should be stressed that although these bio-stimulants can enhance the grower productivity, negative
effects, such as low dry matter and low storability, can be seen when they are applied on orchard where
inappropriate cultural techniques were used. Especially when the grower mistaken in managing
orchard with scarce pollination, high crop load, or inappropriate pruning, the effect of these stimulators
can even be more negative (short cold storage life or higher storage disease susceptibility) (Costa, et
al., 2011). It is therefore fundamental that kiwifruit growers have a deep knowledge regarding the use
of these products and the physiological effect they cause on the morphogenesis of kiwifruit.
3.3.8 Pest and diseases management
Pest and diseases management includes all the practices aimed on preserving the health conditions of
vines and the quality of fruits. The control of pest and diseases is fundamental to guarantee the
production of qualitative fruit. Grower’s knowledge concerning crop protection practices is essential to
meet the legal requirements of export markets (such as maximum residue limits) as well as
environmentally responsible usage of pesticide. Fungi and bacterial diseases can compromise the
quality of fruit and therefore the productivity. To support growers’ decision-making, Zespri has
established a crop protection programmes (CPPs) that list the allowed agrichemical products, their
rates of application and time required to limits of their applications before harvest
(www.canopy.zespri.com).
Among the few pests and diseases, a bacterium called Pseudomonas Syringae pv. Actinidiae (Psa) is
considered as the most serious threat for the world production of kiwifruit up to date (Mazzaglia, et al.,
2012). This bacterial canker of kiwifruit was firstly identified in Japan in 1984 (Serizawa, et al., 1989),
then in Korea (Koh & Lee, 1992) and Italy in 1992 (Scortichini, 1994). In 2010, Psa disease was found
on A. Deliciosa and A. Chinensis in New Zealand (Everett, et al., 2011). Psa symptom is a red exudate
visible from infected parts such as canes, leaders and trunk. Usually red exudate appears in the early
spring on fruit canes, and later in the season the infected canes tend to die and the fruit collapse
(Balestra, et al., 2009; Vanneste, et al., 2010). Phytosanitary practices aim on containing the infections.
Agronomical practices such as the removal of the infected parts, the continuous monitoring of the
orchard vines, and the application of bactericides products that reduces Psa population are all held by
growers. Fundamental is the coordination of these practices with research institutions and cooperatives
that can provide crucial guidelines and updated information about climatic condition that might favour
this pathogen.
To tackle this problem, Zespri is in collaboration with diverse institutions and organizations of the
kiwifruit industry and has established an entity to assist growers. Kiwifruit Vine Health (KVH) is a

25
website which contains information about Psa. Bulletins, status updates, seasonal management guide,
seminars, and research outcomes are transferred to growers from time-to-time. Seasonal management
advice give guidelines of orchard hygiene, spray information, seasonal monitoring and reporting
symptoms, sampling and testing, vine removal and disposal, and so on (www.kvh.org.nz).
3.3.9 Farm practices conclusion
The above discussed farm practices/techniques are essential for achieving the growers’ profitability.
Seasonal factors are still fundamental determinants of vines development. However, according to
Woodward and Patterson (2008; 2009) “top performing growers integrate a range of vine
manipulation techniques and consistently achieve very high fruit productivity over several seasons”.
While climate factors are crucial factors that influence the physiological growth of the kiwifruit vines,
high performing growers are able to adapt cultural practices properly and often obtain productions
which are above the industry averages (Woodward & Patterson, 2009). Even concerning quality of
kiwifruit (DM), there is a clear evidence that the grower management factors have significantly higher
impact than any differences induced by seasonal effect (Patterson & Currie, 2010). This confirms the
hypothesis that farmer’s practices and inputs are the main determinants in the production of kiwifruit.
3.4 Chain’ actors activities and interests
Chain actors’ activities and interests include those chain factors that have an influence on the growers
activity and therefore on the productivity. Significant importance is given to technical assistance,
information exchange, diffusion of innovations and chain management practices referring to the
organizations located next to the growers in the chain. They are cooperatives, Zespri, and suppliers of
agricultural products.
3.4.1 Technical support
The assistance provided by cooperative, Zespri and suppliers in addition with the farmer’s knowledge,
experience and skills is crucial in the day-to-day farming decisions. Henderson and Quandt (1958)
stated that “the best utilization of any particular input combination is a technical not an economic
problem”. An interesting aspect founded by Mook (1981) is that any type of education imparting
knowledge about the cultivating process increases the production possibilities. In other words, any
combination of inputs managed by the grower who has more production-relevant education can
produce more output (Kilpatrick, 2000).
Today, growers need to deal with complex issues such as regulations, environmental implications and
changes of the food industries (Greer, et al., 1995). The complexity of these decisions highlights the
necessity of growers to consult expertise to rapidly adjust their business (Walker, 2002). To do so,
growers, extensionists and scientists have to collaborate and conduct research together through social
learning processes, which are often referred to as ‘partnerships’ (Warner, 2005). For instance, among
the EU sugar beet growers, the exchange of technical information within the chain has always been
crucial for the efficiency and profitability of beet producers (May & Fisher, 2001). Technical
assistance and information transfer are therefore essential to optimize the cultivation practices of
kiwifruit growers.
The transmission and integration of knowledge between growers and scientists have been studied in
several cases of agro-ecology and organic agriculture (Warner, 2005; Barbercheck, et al., 2011).
Particular attention has been placed on growers’ participation in programmes of co-learning and
knowledge exchange. Initiatives as such, aimed on implementing new cultural practices to conserve

26
natural resources and enhance grower returns. It is demonstrated that scientists and growers have to
learn from each other. Auburn and Baker (1992) experienced that “knowledge exchange is accelerated
through farm-scale joint research”. Warmer (2005) referred that major participations were seen among
growers of perennial crops (e.g. kiwifruit) for the reason that:
a) Growers have invested time in learning about the crop,
b) These crops are multi-decades investment of capital and labour,
c) Perennial crops have a long history of cooperative marketing and collective actions (Warner,
2005).
This has called attention to the importance of the technical support, especially on how frequently
cooperatives and Zespri’s technicians give technical information to kiwifruit growers. And by
considering the previous studies, this will create development and promote progress in the sector.
3.4.2 Technical information within kiwifruit industry
Managing a kiwifruit orchard is a multidisciplinary activity which requires support of external
expertise. Everyday growers deal with a wide range of problems that require scientific and/or
managerial, and economic knowledge. Climate change, new varieties, and particular diseases are
continuously challenging kiwifruit growers. Because of these changes consultation with expert might
provide extra support and information which could be used to better perform the farming activities held
by the kiwifruit growers. And universities, research institutes, supplier of agricultural products, Zespri
and cooperatives are all providing technical support. An example of how New Zealand kiwifruit chain
players have been dealing with this issue is given in the next paragraph.
Zespri programmes in New Zealand
In New Zealand, Zespri is committed in helping growers who want to achieve higher yield and
optimize their orchards' profitability. And to do so, it has promoted initiatives to stimulate a co-
learning process between growers and scientists. Focus Orchard Network, Orchard Productivity
Centre, Kiwi-Tech seminars, field days (excursions and meetings), industry publications (Kiwiflier,
Kiwifruit Journal), and the Zespri Canopy website (www.canopy.zespri.com) are all initiatives aiming
on the diffusion and integrations of the technical information. Two of these programs are reported in
the following sub-chapter as an example of dissemination of the technical support in a highly
integrated kiwifruit chain such as the New Zealand one.
Focus Orchard Network (FON)
A programme called Focus Orchard Network (FON) groups gathers growers, technical staff,
agronomists and scientists and promotes the dissemination of information with an objective of boosting
growers' performance. The program is based on the confrontations and demonstrations of diverse
management practices and on-orchard decisions and selected growers’ orchards are the representative
cases. The aim is to transfer knowledge to growers by showing possible options and to evaluate the
inputs usage with specialists. Cultural practices are then evaluated under cost analysis, yield achieved,
utilization of the resources, and so on. To disseminate such information, this programme uses field
days (excursions and meetings), industry publications (Kiwiflier, Kiwifruit Journal and Field day hand
outs), and the Zespri Canopy website.
Performance of these targeted orchards are then benchmarked against other growers and against the
industry average. This will provide the evidence that there are growers who reach significant
productions and which practices they adopt to do so Invalid source specified.. Benchmarking farmers’
27
performance has been also used in European sustainability programs. The benchmark tool was used to
enhance inter-farm competition concerning environmental impact and to stimulate awareness among
growers for the usage of pesticides. In the pilot group of Dutch growers studied by Snoo (2006) they
positively respond to the benchmark tool, showing willingness to compare their own performance with
the one of others.
Orchard Productivity Centre
Another programme implemented to boost productivity among growers is the Orchard Productivity
Centre (OPC). This initiative embraces Zespri departments and key players of the kiwifruit industry to
ensure the transmission and adoption of new practices. This guarantees that growers are continuously
updated regarding new techniques to improve quality and productivity. That can be achieved by the
identification of industry best practices, introduction of new cultivars, tech transfer capability, and
analytical assessment of performance. Here, Zespri is the interface provider between teams, research
centres, growers and other industry actors. Seasonal Kiwi-Tech seminar updates growers about
practices used in a particular phonological phase. Critical issues covers pollination, optimization of the
performance of new varieties, male synchrony, research on diseases tolerant cultivars, season
performance, yield balance and dry matter content, productivity increase through improved pollination,
and so on.
3.4.3 Cooperative technical services
Technical assistance and documentation compliance are offered by the cooperative’s technicians
(Pacino, et al., 2011). Cooperatives have experts and technicians that periodically visit growers’
orchards. They monitor the status of vines, fruit development, diseases, and water supply. A direct
relationship between these technicians and growers is often characterized by trust. Seasonal themed
meetings teach, inform, and translate technical information to growers. Training courses instruct
growers about farm risks, environmental issues, and new certifications for exporting as well as
economic analysis concerning market trend, customer response, and operational costs.
3.4.4 Supplier of agricultural products
On-farm decisions are also influenced by suppliers of agricultural products. Specialized shops that sell
agricultural products such as fertilizers, pesticides, herbicides and bio-stimulants frequently offer
technical advice to growers. This relationship is based on a face-to-face information transfer.
Furthermore, these organizations offer updated information concerning new agricultural products in the
market. But also they know which product has been banned in the EU and which one is not authorized
by Zespri regulations.
3.5 Information transparency
The information diffusion among supply chain members has been directly associated with the trust
level. Akkermans et al., (2004) define the information transparency within the chain as “the result of
reinforcing dynamic interactions between trust levels of chain partners”. Information transparency
shared with the chain depends on how closely chain members work together. “The more supply chain
partners work closely together, the more they will trust each other, and the more data they will dare to
share” (Akkermans, et al., 2004).
Forrester (1961) first identified the importance of the information transparency for better decisions
along the chain. The study described how information delaying causes demand amplification upstream
in the chain. Besides, the concept of trust is defined as “the belief that the other party will act in the
28
firms best interest in circumstances where that other party could take advantage or act
opportunistically to gain at the firms expense” (Mc Cutcheon & Stuart, 2000). Anderson and Weitz
(1989) then explained how trust is generated. They refer to the past experience and how partners that
know each other tend to continue their social exchange over time. De Jong and Nooteboom (2000)
associate this phenomenon as human habituation. A repeated interaction between parties led to habit
formation and psychological relief among chain players.
After having elucidated a few definitions of trust and information transparency within supply chains,
we would like to apply those concepts in the kiwifruit chain. Growers, cooperatives and Zespri are
closely interconnected in their operations. Fundamental is their information sharing and trust to be
efficient and competitive. Parkhe (1993) referred as scarce opportunistic behaviour within co-operative
alliances. So, licensee contracts and association agreements between growers, cooperatives and Zespri
might be enough to support a collaborative system. However, in the empirical phase of this study,
questions concerning trust and information transparency will be utilized to make clear this issue.
Technology has been used in several agricultural cases to facilitate the information exchange. Decision
support systems (DSSs) have been used in agricultural sectors to facilitate the growers’ decision
making. These tools address a variety of issues such as farm sustainability, improving crop production
and use of fertilizers, pest and diseases management, etc. A similar tool is the Zespri Canopy website
built to disseminate technical information and to make more transparent and clear the information. All
associated growers can access with a password and apprehend knowledge about experiments, farm
practices and industry news. This communication tool is efficient and cost-effective, and it also
enhances transparency. Thus, questions concerning the use of the Zespri Canopy website will also be
included in the questionnaire.
3.6 Innovations
The recognition and implementation of new technologies in the management practices are crucial for
improving farm performance (Bella & Martin, 2009). We can consider any technologies and/or new
practices as an innovation for the reason that the “idea or object is perceived new by the farmers”
(Rogers, 1995). The type of innovation that takes place in a farming system is new, including
marketing, management, labour use, natural resource management practices, product changes,
production practice changes, cropping equipment, and irrigation practices. The innovation process is
the “results of a process of networking and interactive learning among a heterogeneous set of actors
such as farmers, input industries, processors, traders, researchers, extensionists, government official,
and civil society organizations” (Klerkx, et al., 2010).
3.6.1 Factors affecting farmers’ adoption of agricultural innovations
There are several studies that attempt to tackle factors influencing the rate of innovation adoption in
agriculture. Among scientists, there is a common agreement that the adoption of agricultural
technologies depends on “a range of personal, social, cultural and economic factors, as well as on the
characteristics of the innovation itself” (Pannell, et al., 2006; Howley, et al., 2012).
Education and training positively enhance growers’ ability to include new management practice in
their business (Kilpatrick, 2000). Kilpatrick (2000) investigated how education and training actions
affect agricultural and land-management changes among Australian farmers. These farm business
changes are also often positively associated with the profitability of the farm. Emphasis is placed on
the relationship between education of growers (below secondary, secondary or post-secondary school)

29
and their participation in education and training events (courses, seminars, conferences and field days)
with the rate of adoption of agricultural changes. Kilpatrick (2000) concluded that “education and
training is able to influence change in three broadly defined ways: first, by delivering new knowledge
and skills; second, by providing interaction with 'experts' (facilitators, trainers or teachers); and third,
by providing opportunities for interaction with peers (fellow training participants)”. As a result, all the
activities aiming on educating and training growers are opportunities to facilitate the implementation of
novelties.
Farm size can also be crucial in influencing the adoption of innovation. The positive tendency of a
large farm in absorbing technology has been addressed to have a higher profitability, a more risk-
bearing capacity, and the economy of scale (Bella & Martin, 2009). Small farms often reflect restricted
financial capacities which make more difficult the adoption of changes. In particular, Fenton et al.
(2000) referred to the fact that financial characteristics have effects on farmers’ decisions to implement
novelties.
The complexity, adaptability, risks, and cost of an innovation are also influent features that should be
taken when referring to the adoption rate of novelties (Howley, et al., 2012). El-Osta and Morehart
(2002) affirmed that “farm size and specialization in dairy production increased the likelihood of
adopting a capital-intensive”, while the education and the size of the operation promote the adoption
of management-intensive technology. Lastly, the interactions between growers and peers,
extensionists, researchers, etc., also positively impact on agricultural adoption of innovation (Howley,
et al., 2012). Like Prokopy et.al., (2008) summarized in previous research, the implementation of new
agricultural practices is the result of heterogeneous factors such as “education levels, capital, income,
farm size, access to information, positive environmental attitudes, environmental awareness and
utilization of social networks..”.
Innovation in the kiwifruit farming system
The sorts of innovations that usually take place in the agriculture are discussed above. However, in this
study, the attention is placed on kiwifruit growers associated with cooperatives and Zespri. Innovation
about activities such as marketing, distribution channels and commercialization of kiwifruit are not in
the objects of this investigation. When considering novelties, we refer to new practices, techniques and
management novelties in the kiwifruit farming system. A list of them is provided below.
New members to farm's management.
New approaches to labour use.
New soil-related natural resource management.
New pest and disease management practices.
New varieties.
New products (fertilizers, pesticides, bio-stimulants).
The New Zealand case of innovation diffusion
In New Zealand, Zespri in collaboration with the HortResearch funded a project called Innovative
Growing Systems. In the programme, HortResearch experts work alongside with three innovative
orchardists and their management teams over a three-year period to investigate the opportunities of
increasing fruit yields and therefore grower returns. The inputs and outputs of these plantations are
then quantified in all its aspects. And subsequently, information about the novelties adopted is

30
divulgated to other growers trough tech transfer programme based on discussion groups, field days,
workshops and publications (Max, et al., 2007).
3.7 Chain management practices
Aside from the influence that chain players might have on technical services, information, and
innovations, the way they operate in the sector can also impact on growers' performance. The
coordination of the kiwifruit transportation, refrigeration, quality control, logistics activities do
interfere the quality delivered to the final consumers. The type of contracting arrangements between
growers and buyers do influence the trust among each other and influence the willingness to cooperate.
3.7.1 Logistics
As we discussed, kiwifruit is transported in a controlled atmosphere (cold chain) and the quality must
be preserved along all the passages. Post-harvest operations do influence quality. And the logistics
from point of origin to point of consumption might affect it. Controls of quality, pesticide residues,
fruit maturity and the postharvest management in general affect fruit quality, the shelf life and export
price (Cooper, et al., 2007).
Johnston et al., (2001) asserted that fruit softening is one of the unresolved problems during the storage
and transportation which decreases the shelf-life of fruits. For instance, the quality maintenance of
mango during the supply chain depends on many aspects at farm and post-harvest operation level.
Harvesting practices, packing operation, postharvest treatments, temperature management,
transportation, and storage activities prevent the fruit from being damaged (Dharini, et al., 2011).
In the kiwifruit chain, it is also crucial that harvested kiwifruit are immediately cooled down and
preserved along all the aforementioned passages. During harvest, cooperatives’ staffs coordinate the
logistics trucks that load kiwifruit from each farm and then unload batches of fruit which are instantly
transferred into cold storage rooms to avoid weight loss and maintain the quality. Following that, there
is the handling phase where kiwifruit are graded, packed, and labelled until each quality category
satisfies specific market needs and the kiwifruit are ready to be shipped. The coordination of the post-
harvest logistics activities might reduce the quality of the final product and result in less return for the
growers. Therefore, maximum attention should be placed on post-harvest phases.
3.7.2 Contract farming
Contract farming is particularly common in industrial crops such as sugar cane, tobacco and tea;
nonetheless, it can still be found in other crops or farming systems where products are sold to high-
income consumers who are willing to pay a premium for quality and food safety (Miyata, et al., 2007).
Through contract farming, growers get market access, acquire marketing information, and technology
to improve farming performance and inputs (Arumugam, et al., 2010). And in return, large-scale
buyers, cooperatives, traders, exporters and/or food processors, ensure a steady supply of raw materials
meeting certain quality standards which are in line with supermarkets requirements and with the today
increasing demand for high-qualitative food products (Miyata, et al., 2007).
In developing countries, contract farming between small growers and exporters facilitates the
implementation of global standards for agricultural producers (Otieno & Knorringa, 2012). However,
some criticisms pointed out that “large agribusiness firms use contracts to take advantage of cheap
labour and transfer production risk to farmers” (Miyata, et al., 2007). In the study of Hu and
Hendrikse (2009) explained how “under contract farming, many decision rights are shifted from

31
growers to firms”. However, Miyata et al., (2007) and Pandit, et al., (2009) showed that contract
farming rises the income of growers especially when it involves small scale growers that hardly can
have access to extension agents that provide technical assistance and guidance of the quality standards
requirements. Pandit, et al., (2009) also showed that in West Bengal, growers who produce potatoes
under contract farming were more experienced and had more years of schooling than the non-contract
growers.
Contract farming is commonly used within the kiwifruit industry. There are growers that do not belong
to any fruit club and tend to have an independent mind-set “selling their products to agents offering
the best price” (Hewett, 2003). These growers usually guarantee their productions with yearly
agreements (short-term relationships) with their buyers. Often these contracts are signed in the
beginning of the season, but there are cases where growers prefer to keep open the opportunity to get
higher offers until few weeks before the harvesting. A more integrated collaboration takes place when
growers are members of cooperatives and long-term relationships take place. As members, they have
access to services and information and in return they deliver their products. This sort of relationships is
maintained by more stable relationships which are also guaranteed through contracts.
To guarantee the year-round supply of Zespri Gold and Zespri Green kiwifruit, Zespri partnered with
Italian cooperatives and growers. Through contracts Zespri supplied the crafted wood of new varieties
e.g. Gold (also protected through propriety rights) “in exchange for a license after growers and
suppliers agreed that Zespri would market the fruit for a margin” (Alvarez & Shelman, 2010). The
interface between Zespri, cooperatives and growers is regulated with a series of contracts. Between
growers and Zespri there are contracts that give the right of commercialization to Zespri and allowed
the growers to cultivate new varieties. And between Zespri and cooperatives there are supply
agreements. Cooperatives collect, pack, and store kiwifruit for Zespri, and in return they get a
compensation for the services offered, usually calculated in € per kg of kiwifruit processed.

32
4 Materials and methods
The methodology partly discussed in Chapter 2 will be extended in more detail in this chapter. Here we
summarize the findings from the literature study with the objective to isolate the relevant one and
answer to the research question.
4.1 Concepts classification
From the concepts discussed in the literature
review and the already grouped factors of Figure 6
(farm management and the chain activities and
interests), we identify a set of elements that will
facilitate the questionnaire designing process and
the formulation of the supposed correlations
between group of factors and variables.
In the left boxes of Figure 12 there are the factors
found in the literature which describe influential
aspects of the: farm characteristics, farm
management, farm practices, chain factors,
personal characteristics of the grower and the farm
performance. The questionnaire will be designed
and based on this categorization and on the
equivalent factors here reported. In the right boxes
of Figure 12 there are the research fields which
will be the reclaimed in the main areas of the
questionnaire.
4.2 Conceptual model
The conceptual model of Figure 13 illustrates the assumed relationships between groups of variables.
We distinguish three primary factors which we assume have a direct impact on the farmers’
productivity, and two secondary factors which we assume that do not have a direct effect on
productivity but have an influence on the primary one.
We presume that within the primary factors, characteristics of the farm can alter growers’ productivity
as well as farm management factors. For instance, farm size might influence the way farms are
managed. Farm management reflects more the education of the growers, the composition of the
management team, the workforce, as well as the manner agricultural practices are executed and how
information from outside are absorbed. So, we assumed that farm management might influence
growers’ productivity as well as the technical practices. Moreover, we expect that technical practices
directly influence growers’ productivity for the reason that they aim at optimizing quality/quantity
produced and the more often these practices are conducted the higher the productivity would be.
Within the secondary factors, chain factors and personal characteristics are expected to be less
influential on growers’ productivity; however, to verify this hypothesis we associated them with
growers’ productivity. Moreover, as described in the literature review, chain factors and all their
activities and interests do interfere with growers operations. They are expected to have an effect on the
farm management for the reason that the technical support, innovations, information and other services
Figure 12: Classification in six main categories of the
concepts identified from the literature review.
Qualities, fruit size, dry matter,
yield, orchard gate return, satisfaction
Farmers’
performance
Cultivation system, size, decrease due to Psa, type of
ownership, farm status
Farm
characteristics
Employees number,
management team, decision
making, use of external experts
Farm
management
Canopy management,
pollination, soil management, bio-stimulant, pest/disease
management
Farm technical
practices
Technical services, information
transparency, trust, innovation,
cooperative relationship Chain factors
Age, gender, farming status,
experience, educational level,
willingness to cooperate
Personal
characteristics

33
or inputs might alter the farm management and also change technical practices implemented. We think
that personal characteristics such as age, gender, farming status, experience, educational level and
willingness to cooperate would show a conjuncture with the way the farm is managed and with the
technical practices adopted by the farmers.
The general message behind this model is to graphically illustrate the possible associations between
variables by taking into account the objective of this study. By referring to our research question, 11
probable relationships have been identified (illustrated by the arrows). These associations have been
considered by us as the most interesting one after the description of the concepts and theories yielded
in the literature review.
4.3 Relationships between factors
In this Chapter we explain the reasons that motivate the identifications of these 11 relationships. Based
on the model (Figure 13) and on the aforementioned group the factors of Figure 12, we frame some
questions to clarify the hypothesized relationships. In the following text we will explain the assumed
relations by following the group of factors order, and to facilitate their distinctions we numbered them
from 1 to 11.
Farm characteristics associations
In what measure farm characteristics such as area of cultivation, cultivation system, farm size, Psa
outbreak and type of ownership influence grower’s productivity and farm management factors?”
Relationship 3: (3→6)
a) We presume that recent new varieties such as Zespri Gold tend to produce more.
b) We assume that the bigger the farm size, the higher is the productivity.
c) We assume that the lower is the Psa outbreak, the higher is the productivity.
How is the influence of the farm characteristics on the farm management?
Relationship 10: (3→4)
a) We assume that the larger the farm is the more effective is the management team.
Figure 13: Conceptual model showing possible relationships among primary and secondary
factors in affecting growers’ productivity.
Secondary
Factors
Primary Factors
4) Farm
management
6) Growers’
productivity
3) Farm
characteristics
5) Farm
technical
practices
1) Chain
factors
2) Personal
characteristics and opinions

34
d) We believe that the larger is the farm and the more innovations are implemented with a
consecutive reflection in the whole management.
e) We assume that the bigger is the farm and the more skilled are the employees (permanent
employees) who are positively reflected in a better control of Psa and more production.
Farm management associations
In what measure the farm management influences the productivity and the farm management
practices?
Relationship 4: (4→6)
a) We assume that the more specialized employees the farm possess, the more productive is the
farm.
Relationship 11: (4→5)
a) We suppose that the more skilled and educated is the management team, the more rapidly and
effectively the farm practices are implemented.
Farm technical practices associations
In what measure the farm technical practices and their implementation influence growers’
productivity?
Relationship 5: (5→6)
a) We assume that there is a strong correlation between farm technical practices and the
achievement of the growers’ productivity. Farm technical practices are all techniques
implemented to produce kiwifruit, thus, they are highly associated with the growers’
productivity. As a result, we suppose that the more these practices are implemented, the higher
is the productivity.
Chain factors associations
In which way chain factors do influence growers’ productivity, farm management and farm technical
practices?
Relationship 1: (1→6)
a) We think that the more services and support is given to the farmers, the higher is the
productivity.
Relationship 6: (1→4)
a) We assume that the more qualitative and regular is the technical support, the more updated the
management team can become.
b) The more transparent are the information shared, the more effective would be the
implementation of the farm management strategies and of innovations.
c) The more trust there is in the chain, the more effective would be the collaboration of the
management team with other organizations.
Relationship 7: (1→5)
a) The better is the technical support offered by chain players, the more effective would be the
implementation of farm practices (canopy management, pollination, soil management, and bio-
stimulants, pest and diseases management).
Personal characteristics and opinions
Do growers’ personal characteristics and opinions have an effect on growers’ productivity, on farm
management and on farm technical practices?

35
Relationship 2: (2→6)
a) We assume that the more educated, experienced, and young the growers are, the higher the
growers’ productivity is.
b) We believe that the more positive, satisfied, and willing to cooperate the growers are, the
higher their productivity is.
Relationship 8: (2→4)
a) We suppose that growers with high satisfaction, positive future prospective and willingness to
cooperate are the one who tend to be more dynamic and ready to adapt to chances is the
management of the farm.
b) The younger are the grower, the more innovations and new practices are implemented in their
farms.
Relationship 9: (2→5)
a) The more committed, educated and involved in the kiwifruit production (as primary activity) is
the farmer, the more precise and effective is the implementation of the technical practices.
Although in the above description the relationships do not follow the numerical order, the relationships
from one to five intend to determine which variables most influence growers’ productivity, and the
following relations from six to 11 aim at describing possible other interferences between the factors
taken in to account. From the filled questionnaire data, the assumed relationships will be tested and
discussed with the support of SPSS.
4.4 Questionnaire design
The methodology applied to design the questionnaire has been introduced in the research strategy
definition of Chapter 2.2.1. Based on the literature review findings, theories were selected and
converted into variables which were then translated into questions. Referring to Figure 12, the
variables were grouped into factors. The questionnaire covers the six main areas of investigations
(farm characteristics, farm management, farm technical practices, growers’ productivity, chain factors
and personal characteristics and opinions).
Examples of other surveys were used to design our questionnaire, and in some cases we selected
agricultural topics related with our study. To begin with, one of the questionnaire samples is conducted
in 2007 to assess the New Zealand kiwifruit sector on a number of topical dimensions (Fairweather, et
al., 2007). In particular, the survey was held by the AGROS organization (Agriculture Research Group
on Sustainability) to understand the conditions and the differences of New Zealand growers cultivating
kiwifruit in the conventional and organic way. Another survey consulted is the one implemented in the
Nepalese agricultural sector to investigate economic condition of the growers (Goletti, et al., 2001).
Although we did not pre-test the questionnaire in the real environment, multiple revisions have been
conducted to improve it. We discussed its validity and effectiveness with our supervisor Jacques
Trienekens, with Stefano Pascucci, and also it was validated with two experts of the Italian Zespri
divisions (Mariarosaria Mazzeo and Callum Kay).
The description of the variables selected from the literature study, their conversion into questions and
the reasons why we selected those will be explained in more details in Appendix I. The questionnaire
contains 31 questions of which some contain sub-questions. Starting with questions of the general
characteristics of the farm (Questions 1, 2, 3, 4, 5, 31), the questionnaire continues with three questions
about grower’s productivity (Questions 6, 7, 8). Then, it covers aspects of the farm management
(Questions 12, 13, 14, 15, 17, 28), farm technical practices (Question 16), chain factors (Questions 18,

36
19, 20, 21, 23, 25), and lastly personal characteristics and opinions (Questions 9, 10, 11, 22, 24, 26, 27,
29, 30). The layout of the questions is based on the five-level Likert scale, nominal questions as well as
yes/no questions combined with some open questions.
4.5 Description of the population
Italian kiwifruit plantations are concentrated in a few regions of the north, centre and south of Italy.
With years, cultivated hectares of kiwifruit grew particularly in specific areas that became significantly
specialized in producing kiwifruit. Among those, Lazio Region is “the most important area for
kiwifruit production in Italy” (Famiania, et al., 2012). It produces about 37% of the national volume
which corresponds to about 10% of the world production (Testolin & Ferguson, 2009; Famiania, et al.,
2012). Kiwifruit plantations are principally located in the southern part of Lazio in Latina province,
where climate condition and soil characteristics are suitable for kiwifruit. In this area, kiwifruit
growers’ productions are certified through the Protected Geographic Denomination (PGI) called “Kiwi
Latina” (Cacioppo, 2004; Famiania, et al., 2012) and within this PGI consortium, there are several
municipalities including Latina, Cisterna, Aprilia, and other smaller adjacent areas.
Hayward and Zespri Gold kiwifruit are the two most common varieties cultivated in this area. One is
the normal consumed Hayward kiwifruit that takes the name from horticulturalist Hayward Wright,
and has been cultivated in Italy since its introduction in 1969. Meanwhile, the other one is a yellow
flesh kiwifruit called Zespri Gold. It was introduced around 2000 and has always been protected by the
Zespri propriety rights since then. The kiwifruit production specialization of the Lazio area in
accordance with significant volumes produced is the main reason why Zespri leased the Zespri Gold
variety mostly in this area.
Our survey was carried out during September/October 2012 in central Italy with particular attention the
area of Latina. The population was chosen and reached with the help of Zespri Latina office. Through
their network we had access to 85 Zespri Gold growers' emails (centre and north of Italy) and also the
contacts of several Hayward growers located mostly in the Lazio region. The data collection was
carried out by two different means. First, we sent an internet-based questionnaire to the growers who
we had email address. Second, we went to several farms principally located in Latina province and in
the surrounding areas for collecting surveys.
By directly visiting their farm, we discussed about their general satisfaction and opinions about the
sector while answering to the questionnaire. Through the personal contacts with the sample it became
clear that growers’ characteristics vary from case to case. Every grower has unique features starting
from farm characteristics, passing through personal experiences and knowledge. As a result, the cases
investigated are very dissimilar and unique.
4.5.1 Survey responses
Of 85 growers’ emails accessed, we obtained 34 filled
questionnaires. To arrive at such response number, we sent the
questionnaire four times. Besides, we collected additional 40
answers by visiting growers’ farms. In total, we reached 74
respondents with 56 growers of cultivate Hayward kiwifruit,
35 growers of cultivate Zespri Gold and some of them have
both cultivar and/or other varieties.
Figure 14: Locations of the sample.

37
Figure 15: Sample’s farm size in
hectares.
As discussed before, our investigation was carried out mostly in the Lazio Region and the data
collected refers to a large extend to the centre of Italy (Figure 14). 29 respondents are from Cisterna, 13
from Latina, 11 from Aprilia and other 12 from neighbouring municipalities (Cori, Riolo, Sezze and
Velletri). These cases are all located within the Protected Geographic Denomination called “Kiwi
Latina”. In addition, we got five respondents from Brisighella and three from Faenza that answered by
internet. They are located in a north region called Emilia Romagna.
Hectares
of Zespri
Gold in
2011
Hectares
of
Hayward
in 2011
Hectares of
Hayward
organic in
2011
Hectares of
other
varieties in
2011
N Valid 35 56 6 12
Missing 39 18 68 62
Mean 3.914 8.323 5.000 4.250
Mode 2.0 2.0 3.0 1.0
Table 5: Kiwifruit cultivated hectares of our sample.
As it is illustrated in table 5, the two most common agricultural systems of our sample are Zespri Gold
(35 orchards) and Hayward (56 orchards), while only 6 growers cultivate Hayward Organic and 12
have other varieties. The average size of both Zespri Gold and Hayward kiwifruit orchard is about two
hectares. It is clear that although the mean shows higher values, due to the presence of few large
plantations, the most common answer regarding the size of the
kiwifruit orchard is around two hectares. This is also showed by
owner-farmed agricultural area where the cultivated size is the
total land of the growers (Figure 15). It is evident that the most
frequent farm size is below two hectares.
According to Figure 15, we can distinguish several farms below
five/six hectares and less frequent larger farms. 56.3% of the
cases are below and/or 10 hectares, 35.3% have a farm between
10 and 50 hectares, and only 8.4% are above 50 hectares. In
Figure 15, we neglected farms over 20 ha in order to illustrate
and concentrate the attention to the majority of our sample which
are below 20 ha.
What we can learn from the aforementioned considerations is that within our sample, Hayward and
Zespri Gold kiwifruit varieties are the most cultivated in Latina region. Our population is
representative of the Italian kiwifruit sector for the reason that the population is from Lazio region
which -as stated above- is the central producing area for the national kiwifruit industry.
Furthermore, we saw that in general kiwifruit plantations are quite small. This sample is characterized
by the presence of small farms which have kiwifruit plantations
around two hectares. Only six farms are larger than 50 hectares.
This intrinsic characteristic of how kiwifruit sector is
constituted by several small farms demonstrates the importance
of trading companies and/or other intermediaries that want to
supply large volumes to retailers need to maintain the
relationships with a considerable number of small farms. As a
result, the collaboration with the chain seems to be fundamental
to reach volumes of highly qualitative standardized fruits. Figure 16: Kiwifruit cooperatives.

38
Our sample is associated mostly with four cooperatives that work closely with Zespri. The bar chart of
Figure 16 describes the distribution of the sample among those. 19 cases are associated to Apofruit, 18
to Kiwi Pontino, 14 to Intesa, 9 to Punto Frutta and 8 growers are associated to smaller cooperatives.
Although there are quite a few traders and small other cooperatives and/or organizations that
commercialize kiwifruit in that area, these four ones are the largest and the most representative.
The average length of membership association with each of these cooperative is about 12.03 years. The
extreme cases are from one to 40 years of association, thus it is difficult to evaluate whether
relationship between kiwifruit growers and their cooperatives are short, medium or long term
relationships. From the frequencies analysis calculated by SPSS, it emerged that 39.7% of our sample
have been associated for less than six years, followed by 31.7% of them showing medium-term
relationships (between 6 and 16 years), and lastly, the very loyal growers (28.6%) are found associated
from 16 to 40 years.
These findings can be associated with the rather high age of growers. The average age of our sample is
50.77 years old. The range varies from growers of 20 years old to the oldest which is 77. The analysis
showed the significant scarce presence of young growers. It appeared that 81.8% of the population is
above 40 years old according to the calculation.
It is clear that the lengths of relationships between kiwifruit and cooperatives are different. Shorter
associations might be reflected in growers who have an independent mind-set and aim at selling
kiwifruit to agents offering the best price. While long-term relationships take place between the very
old growers and the first cooperatives established in this area, clear evidence demonstrates the rather
high presence of old growers. The data calculated from our sample supports that a relative low
involvement of the young generation in the sector might be a threat for the future of the sector.

39
5 Results analysis
With the support of SPSS, we analyse our sample by two different approaches. Initially, we process the
data with the objective to determine the trend and distribution of each variable investigated
(questionnaire’s question). Based on the descriptive statistic results, we will describe our sample’s
tendencies and characteristics. In the second part of this chapter, we will illustrate the correlations
among different variables with the objective to understand the main causes affecting growers’
productivity and how related these factors are.
5.1 Descriptive statistics
In this chapter, the attention is placed on descriptive statistic parameters such as frequencies, mean,
median, mode, standard deviation, variance, range that give an overall descriptive picture of the
responses. The discussions and interpretations of the results are based on charts and tables calculated
with SPSS. In some cases they are placed next to the text and in other cases we prefer to place the less
relevant in Appendix III.
Farm characteristics
Infection rate from Psa
The Psa average infection rate from 2009 to 2011 is shown in Figure
17. The most frequent answer is between 60-100% because the sample
is constituted by several Zespri Gold growers which have been seriously
affected by Psa. In general, we can distinguish two groups. One is
represented by the ex-Zespri Gold that had significant reduction in
productivity, and the other group is in the left side of the graph
represents Hayward growers. Hayward growers experienced less
infection due to the fact that the Hayward variety is more tolerant to
Psa.
Conversion to other variety
We asked whether at this moment growers are converting their orchards to new varieties and/or are
growing again Hayward from the existing rootstock. From the 70 valid answers, there is a similar trend
of the previous question. 52% of them are converting their orchard (ex-Zespri Gold farmers), and the
other half (47%) are the Hayward growers which did not have significant reduction in productivity.
And as a result, only ex-Zespri Gold growers are converting their orchard with other variety.
Type of ownership
To better understand farm characteristics, we asked whether the farm is family owned, collectively
owned or is under other forms of ownerships. 78.4% of the farms are family owned, 4.1% are
collectively owned, and 6.6% are under other type of ownerships.
Concluding remarks on farm characteristics factors
What we saw from the farm characteristics -that have been also partly discussed in the description of
the population- is that there are two main clusters within our samples. One includes Zespri Gold
growers that had a serious infection from Psa and are converting to new varieties. The other group
comprises Hayward growers which did not experience significant decrease in the production and
therefore are not converting their orchards. In both groups, the most common type of ownership is
family-owned farms. This demonstrates the importance of family business structure of the Italian
kiwifruit production sector.
Figure 17: distribution of the
infection rate of the
investigated cases.

40
Farm performance
Farm yield
Respondents scored the average yield obtained in 2011 from Zespri Gold and Hayward orchards. Only
five growers produced organic kiwifruit and/or other varieties thus the attention is placed on 28 Zespri
Gold growers and the 54 growers that produced Hayward. Figures 18 and 19 illustrate Zespri Gold and
Hayward yields of the last year season (2011). There are clear huge productivity differences in the
yields of both varieties. Within the population interviewed there are growers that produce less than 200
ql/ha and other who exceed the 500 ql/ha.
Figure 18 shows Zespri Gold growers’ yields. 28 growers produced Zespri Gold kiwifruit with an
average yield of 300 ql/ha. The frequency of cases decreases gradually from the low yields to the high
one. Concerning Hayward yield illustrated in Figure 19, 54 growers produced Hayward kiwifruit in
2011. The average yield of the Hayward samples is about 330 ql/ha. A general remarks that appeared
from the distribution of cases, is that in both varieties the mostly represented yields value are within the
first three categories (<200, 200-300, and 300-400 ql/ha), and only a few growers reached yields of
400-500 ql/ha and rare examples exceed 500 ql/ha.
Orchard Gate Return
Orchard gate return (OGR) is the amount of money that the grower gets (gross income). As we can see
in the Figures 20 and 21, OGRs differ significantly between Zespri Gold and Hayward cultivation
systems. The mean of Zespri Gold producers' OGR is clearly higher than the Hayward's, which is
between 25.000 and 30.000 €/ha (mean value of 4.43) and between 10.000 and 15.000 €/ha (mean
value of 2.38) respectively. Furthermore, while best Hayward growers showed a maximum OGR of
20.000-25.000 €/ha, Zespri Gold growers far exceed the OGR of 25.000 with two growers that achieve
more than 40.000 €/ha.
Additional findings can be observed in the ORG distribution. Zespri Gold OGR values are more
dispersive (from less than 5.000 to over 40.000 €/ha), whereas Hayward OGR values are more
concentrated between 5.000 and 15.000 €/ha. These differences in OGR’s values depend on price
differences at which kiwifruit are sold.
Figure 21: OGR of Hayward growers. Figure 20: OGR of Zespri Gold growers.
Figure 19: Hayward yield categories. Figure 18: Zespri Gold yield
categories.

41
Concluding remarks on yield and OGR results
From the above findings, it is evident that there are productivity gaps within the examined sample.
They confirm the hypothesis stated in the beginning of this study that there are top, average and low
performing growers in both Zespri Gold and Hayward kiwifruit agricultural systems. We can observe
that the more we move to high yields the fewer cases there are. Basically, top performing grower cases
are limited. This tendency is evident in both varieties. Concerning the differences in terms of OGR, it
is clear that price makes the difference. Zespri Gold kiwifruit is often paid twice or more of the price of
the Hayward one.
Farm management
Seasonal and permanent employees
To understand different aspects of the workforce management, we asked kiwifruit growers the numbers
of seasonal and permanent workers. In both questions, they showed certain reluctance in answering and
many of them did not clearly express a number. Furthermore, a significant majority consider
themselves as the only employees. In some cases, they said that family members also contribute by
working a few hours per week but are not considered formal employees. This supports the tendency to
rely on familiar workforce along the whole year and use external employees only when more labour is
required.
Farm labor management
To deepening the farm labour management and to understand which type of management structure the
sample possesses, we formulated extra questions. The respond rate concerning these four questions
was rather low (about 50 growers on the 74), and from the face to face interviews respondents
demonstrated a certain reluctance in answering.
On the question “I rely on permanent (specialized) employees”, 53.1% completely disagree and/or
disagree, 18.4% are neutral, and 29.6% agree or completely agree. In contrast, a large percentage of the
respondents agreed on the statement “The employees of my farm know the practices and procedures to
manage kiwifruit vines”. When we asked to rate whether they agree or not with the statement “We
have a good team that jointly resolves operational problems”, most of the respondents (67.3%) are
neutral or disagree. And again, on the statement “I always take farm decisions in consultation with my
employees”, growers mostly score disagree or completely disagree. The bar charts illustrating the
tendencies of these four aspects about farm labour management are in Appendix III (Question 14).
Use of the Zespri Canopy website
Among the 74 growers interviewed, only 50 answered to this question. 28% replied that they have
never visited this website, 4% only once a year, and 24% every six months. If we look at the
cumulative percentage, 56% of them visit the Zespri website every six months or less. This
demonstrates rather low propensity of the kiwifruit growers to use this information tool.
Use of external advisors and technicians
To understand whether kiwifruit growers use external technicians, advisors, and expertise to get
information concerning a range of agricultural issues, we ask them to rate how often they request
support from experts for managing the canopy, improving the pollination, managing the fertilizations,
using bio stimulants, dealing with Psa and improving their productivity in general. Though this
question we aim at clarifying whether they rely on external advisors, which aspects are most needed,
and with what frequencies.
42
Overall we got 60 respondents out of the 74 interviewees. From the results, kiwifruit growers
demonstrated a certain reluctance and independency in managing the canopy. 57.4% of them expressed
that they never ask assistance regarding the canopy management. This shows the already acquired
experiences in managing the canopy. Concerning the pollination, they showed more propensities in
using consultants. About the fertilization management, 46.6% of them expressed that they did ask for
recommendations about fertilization practices at least once a month or even every week. In the usage
of bio stimulants, 72.6% said that they never ask technicians about how to apply bio-stimulants. When
we asked whether they consult technicians concerning Psa control, most of them expressed their
propensity to get information for Psa problem. 70.5% of the growers interviewed said that they contact
technicians and ask information about Psa at least once a month and/or once a week. This
demonstrates that nowadays kiwifruit growers are very worry about this disease significant attention is
paid reducing the infections and containing the disease. Lastly, in the question "Do you consult
external experts to learn how to improve your productivity", 34.4% of them said that they never asked
for such advice. This demonstrates that a large majority of them does not know what are the
productivity limits of kiwifruit are and therefore do not ask for improving their productivity.
Full/part-time commitment
78.8% of the respondents are full-time farmer while the rest 21.2% are cultivating kiwifruit as a part-
time work with incomes from off-farm work. This data demonstrates that the significant incomes
generated from kiwifruit in the past 20 years created several job opportunities in the kiwifruit
production industry and turned a number of growers into full-time workers of kiwifruit production.
Concluding remarks on farm management
After having described the results concerning farm management factors, it has emerged that most
growers tend to rely on family members instead of accessing specialized employees. They showed
reluctance in involving external employees in the decision making of the farm and the majority of
them do not have a management team. On the contrary, among the few growers that have permanent
(specialized) employees they are considered skilled and trained in managing kiwifruit vines. In
general, what we observed from our sample is that there is a predisposition to manage the farm in an
independent way, that is, the grower is often the only figure that takes decisions independently or
maybe in consultation with his/her relatives.
About farm management upgrading and problem solving arose that growers do not use the website and
do not consult external advisors. The sample shows interests in consulting experts only for fertilization
and Psa control. They do not get new information concerning the pollination, bio stimulants usage and
most importantly, they do not ask information about increasing their productivity. Overall, results
demonstrate that growers are suspicious and adverse in including information from outside. It might be
related with the age or with their educational level but, the management body of several kiwifruit farms
appeared to be undeveloped and disorganized.
Farm technical practices
In this section, we discuss about technical practices used in the cultivation of kiwifruit which are
fundamental to reach consistent yield and quality. 14 statements were used to measure the degree of
the execution of certain farm technical practices. In Appendix III (Question 16), there are two Tables
showing the mean, mode and missing answers.
Starting with selecting the canes during winter pruning, 77% of them said that they always do it. Thus,

43
this practice seems to be accepted and implemented by the majority of the famers. Slightly fewer
growers do prune kiwifruit vines during summer, 34.4% revealed that they never or rarely do it. Also
our growers do not implement gel-pruning, tip-squeezing and girdling techniques. These practices are
often implemented to improve fruit size and quality but they are very costly and time consuming.
Flowers and fruit thinning are practices that almost everybody does. They are fundamental to balance
the number of fruit per plat in order to reach commercial size fruits. Thinning fruit and flowers is
implemented by 88.9% of the respondents. Similarly, when we asked whether they use more
pollinations techniques or not, 59% of the respondents said that they always apply artificial pollens to
increase the fruit size.
Concerning the question “I analyse soil and leaves”, the majority of them answered that they often or
more than often analyse the soil and leaves. However, still there are 30.6% of the growers that rarely or
never do it. Following the questions, we asked whether they supply the correct fertilizer in each
physiological phase, and 84.1% of them said that they apply the correct fertilizer in each physiological
phase more than often and/or always.
Avoiding water stress after fruit set to stimulate fruit growth is carried by 76.6% of them that say
always avoid water stress. About the use of bio-stimulants, 66.1% of the growers expressed that they
never use these products, some of them say sometime, and 19.3% use bio stimulants more than often
and/or always.
Lastly, we investigate the practices concerning pest and diseases management with particular attention
to the practices adopted to contain Psa. In the question “I constantly monitor the orchard from Psa
symptoms”, 69.4% say always and 12.9% say more than often. This tendency supports the particular
attention given by the growers on the disease. Also, when we ask “I immediately remove the infected
parts”, a significant majority respond that always do it.
Concluding remarks on farm technical practices
From these variables concerning the implementation of the fundamental agricultural practices to
cultivate kiwifruit, we saw a general tendency in often and/or always applying some practices, while
others seem to be implemented less. Our sample of growers always does winter pruning, but not many
growers do summer pruning, gel-pruning, tip-squeezing, or girdling. This means that they do not
implement practices to optimize the partitioning of carbohydrate to fruit and as a result, they penalize
the final size and quality. Also, from the face to face interviews conducted, several growers were not
even aware of the girdling and tip-squeezing techniques.
Concerning fruit and flowers thinning practices, the sample shows more predispositions in doing it;
however, only 59% often and/or always do artificial pollination. These two practices are interrelated.
Artificial pollination makes possible the fructification per m² of canopy, whereas flower and fruit
thinning balance fruit load which is crucial to reach optimal quantity/quality. It is clear that these two
practices should always be conducted, however, within our sample there are still growers not doing
them.
In the same way, analysis of soil and leaves is not held by all the growers. Being able to read the
analysis requires specialized and agricultural educated growers, yet those prerequisites are lacking in
our sample. Therefore, more skilled people who are able to interpret soil and leaves results are needed.

44
With regard to avoiding water stress, the majority of the population do it. However, concerning the use
of bio stimulants there are some controversies. Some products are not allowed in the Zespri production
guidelines because they leave residues and reduce the dry matter (taste) of kiwifruit. Consequently, lots
of growers demonstrated certain reluctance in answering this question. Lastly, the sample demonstrates
to be very attentive concerning Psa outbreak, and the majority of them implement the practices
suggested.
Chain factors
Zespri quality guidelines dissemination
To understand whether cooperatives inform kiwifruit growers with technical advice that respect Zespri
quality standards, we decided to include this question within the questionnaire. 81% of the growers
agreed or completely agreed with it.
Chain services satisfaction
With regard to the technical services offered by the cooperative, Zespri and suppliers, here we tested
the level of satisfaction of our sample. The illustration showing tendencies of these variables are in
Appendix III (Question 21a, 21b and 21c). Generally growers are quite satisfied about the technical
support furnished by cooperatives since 76.5% of them strongly agree and/or agree on the statement “I
am satisfied with the technical support provided by my cooperative”. Similarly, concerning Zespri’s
technical support 66.6% of the respondents express similar opinions. The tendency is different from the
technical support provided by the suppliers of agricultural products. Only 29.3% agreed and/or
strongly agree with it. Concerning the field days, meetings, farm excursion and so on, organized by the
cooperative, respondents show a more neutral tendency of satisfaction, which is similar for the Zespri
initiatives. The illustrations are reported in Appendix III (Question 21d and 21e).
Information transparency and trust in the chain
Information transparency within the kiwifruit chain is measured
through a series of statements. We asked directly how transparent
the information from the cooperatives are and whether they are
satisfied. At the same time, we tested more deeply this aspect of
the chain by asking whether they know who the cooperative’s
buyers are and whether they know the price at the bulk market.
In general, it is emerged that the growers consider the information
transparent provided by the cooperative (Figure 24) and they are
satisfied about the market information furnished by Zespri
(Figure 25). However, as we can see in Figures 26 and 27 that
they are completely unaware of who are the cooperative’s buyers
and at which price the kiwifruit are sold at the bulk market. This
confirms the scarce transparency within the chain with particular
regards to the market and price information shared within the
chain.
Figure 22: “The market information
provided by my cooperative is
transparent”.
Figure 23: “I am satisfied of the
market information provided by
Zespri”.

45
To confirm these findings, we can compare the means of the questions of Figures 24 and 25 with the
one of 26 and 27. They tend to be around the value three (neutral) in Figures 24 and 25 (3.06 and 2.75),
and are more negative in the question 26 and 27 (2.44 and 2.28) respectively. 48.4% of the respondents
disagree and/or completely disagree about “I know who the cooperative’s buyers are”. And similarly,
56.3% of our sample disagree and/or completely disagree with the statement “I know the price at the
bulk market”. These results support our first hypothesis that the information within the kiwifruit chain
especially between cooperative, Zespri and growers is not transparent.
The second aspect investigated is about the trust in the kiwifruit chain. The frequencies of the answers
are illustrated in Figures 26 and 27. In general, the trust in cooperatives and Zespri is overall positive
although there are still about 20% of the growers that disagree with it. At the statement “I trust the
technical and market information provided by my cooperative”, 25% answered strongly disagree
and/or disagree, 21.9% are neutral, and 53.1% agree or strongly agree (Figure 26). And in the
following one about the trust toward Zespri’s technical and market information, 17.7% strongly
disagree and/or disagree, 29% are neutral and 53.2% agree or strongly agree (Figure 27).
Innovations providers
We ask our sample to choose who are the most important innovation providers by giving multiple
choices answer where could fill more than one (Table 11). The results shown in table 6 explain that
cooperatives and Zespri are considered the most important. Zespri and cooperatives were chosen most
(31.5%) followed by other growers with 16.2%, technology sellers with 9.9%, and suppliers of
agricultural products with 9%.
Figure 27: Question “I trust the
technical and market information
provided by my cooperative”.
Figure 25: “I know who my
cooperatives’ buyers are”.
Figure 26: “I trust the technical and
market information provided by
Zespri”.
Figure 24: “I know the price of the
bulk market”.

46
Table 6: Innovation providers.
Concluding remarks on chain factors
To summarize the main findings concerning chain factors, our sample seems quite satisfied about
Zespri and cooperative's technical support and less satisfied about the technical supports given by the
suppliers of agricultural products. With regard to the information shared upstream between growers,
Zespri, and cooperatives, the opinions of our growers presented some contradictions. Growers believed
that the information is transparent and sufficient but they are completely unaware of who the
cooperative’s buyers are and what the prices kiwifruit sold at the bulk market are. This demonstrates
that market information is not transparent and openly shared between the growers. As for the trust in
Zespri and cooperative, the situation is rather positive. Nevertheless, in most interviews conducted in
local, kiwifruit growers verbally expressed that they don’t trust completely the cooperative and only
because they are the members of the cooperative should they show the trust. Overall the situation
appears to be not very transparent. The general feeling of our sample towards cooperative information,
such as operational costs and market information coming from downstream are rather suspicious.
However, questions used in this study did not really clarify and explore the issue of Zespri,
cooperative, and interactions between kiwifruit growers.
Growers’ attitudes
Satisfaction level
In Figure 28, we present the level of satisfaction of the growers
concerning the actual production. Overall the sample shows a certain
level of dissatisfaction. From the cumulative percentage, it appeared
that 50% of them are very unsatisfied and/or unsatisfied. However,
the most frequent answer is satisfied and only a few cases showed to
be very satisfied (11.4%) and completely satisfied (2.9%). The
validity of this question presents some limitation for the reason that
when we design the Likert scale we mistaken in dividing equally the
satisfaction level in five equal options. The answer satisfied should
have been located at the fourth level and not at the third one where a neutral option should have used.
Future perspectives
We asked how they see the future prospects of their farm. Among the five options offered, the most
frequent answer is neither black nor bright. 20% of the respondents see their future perspective as very
black and/or black. In contrast, 35% see the future as bright and only 2.9 % as very bright.
In the next question, we provide five options which describe the future possibilities of the farm in the
next five years, that are: a) land sold and retired, b) land transferred to the next generation, c) still
farming kiwifruit but with significant income from off-farm work, d) still farming kiwifruit with
significant income from farm activities, and e) still farming kiwifruit as main activity. Most of the
Responses
N Percent
Innovation providers
Growers 18 16.2%
Suppliers 10 9.0%
Cooperative 35 31.5%
Zespri 35 31.5%
Technology sellers 11 9.9%
Others 2 1.8%
Total 111 100.0%
Figure 28: Satisfaction level
of the growers concerning
the actual production.

47
respondents choose the option "Still farming kiwifruit" as a main activity (42.9%) and "Still farming
kiwifruit with significant income from farm activity" (24.3%). This reflects the importance of kiwifruit
in generating interesting incomes within the population examined.
Willingness to cooperate
To understand our sample’s intention towards a more effective communication and collaboration
within the chain, we include two questions in our questionnaire; one concerning the collaboration with
the cooperative and the other one refers to Zespri.
There is a strong tendency that reflects the positive intentions to collaborate more with both
organizations. Both frequencies are illustrated in Figure 29 and 30. 90.6% of the respondents strongly
agree and/or agree on collaborating more with their cooperative and 90.3% of them express the same
opinion concerning the collaboration with Zespri.
Optional improvements
From the literature review, we have identified some programmes (initiatives) used in New Zealand to
increase the farm productivity of kiwifruit growers, and to investigate whether these are applicable also
in the Italian context, we convert them into statements by asking our sample to evaluate how important
the programmes are for them. The three crucial programmes are based on: a) sharing knowledge and
information between growers, expertise, technician, and researchers; b) visiting top-performing
growers’ orchard and provide evidence of the practices adopted, and c) benchmark growers’
performance with other growers to stimulate inter-farm competition. The frequencies of the answered
question are illustrated in Figure 31, 32, and 33.
Respondents believe that it is very important to share knowledge between growers and expertise as
well as between technicians and researchers (Figure 31). Whether we sum the number of people that
ranked important, very important and extremely import, we reach 98.5% of the respondents. The
variable “Visiting top-performing growers’ orchard and provide evidence of the practices adopted”
also scored very high (Figure 32). 91.1% of the growers said that this is very and/or extremely
Figure 33: Visiting top-performing
farmers’ orchard and provide
evidence of the practices adopted.
Figure 31: Benchmark your
performance with the one of other
growers to stimulate inter-farm
competition.
Figure 32: Importance of sharing
knowledge and information between
farmers, expertise, technician and
researchers.
Figure 29: “I am willing to collaborate
more with my cooperative”.
Figure 30: “I am willing to
collaborate more with Zespri”.

48
important. However, from the interviews in local, several growers doubt that top-performing growers
are willing to say the truth about the practices adopted. Lastly, in the question "benchmark your
performance with other growers to stimulate inter-farm competition" (Figure 33), the majority
expressed that it is important. But 17.9% think that it is not important or of little importance. These
growers might be reluctant in sharing personal data.
Growers’ responses about innovations
Four questions concerning innovations within the kiwifruit farming system were included in the
questionnaire to understand general opinions about innovations. Illustrations concerning these
frequencies are in Appendix III. All the growers agree and/or strongly agree about adopting
innovations to increase farm productivity. Growers also showed less concerned when hiring
specialized employees. Similar tendency emerge on the statement “Apply new approaches to labour
use”, although from the face to face interviews respondents said that this question is unclear. Lastly,
the use of new varieties is seen as very important (Figure 34). 81.2% of the respondents agree or
completely agree that it is important to adopt new varieties which are more resistant to Psa.
Educational level of the sample
The educational level of our sample is shown in Figure 34. In
general, it appeared that our sample has a very low educational
level. Overall the mean is 2.64 which indicate that the average
education is between middle and high school. Clear evidence
can be observed in the cumulative percentage of the
population. 40.9% of the respondents have achieved
elementary (10 years old) and middle (13 years old) school
diploma, and including the one with a high school diploma, we
reach the value of 84.8%. Only 15.2% have achieved a
university diploma in which most cases is not agriculture
related.
Concluding remarks on growers’ attitudes
In general, the satisfaction about the actual production is rather low. A large majority of the ex-Zespri
Gold kiwifruit growers faced a dramatic reduction in productivity due to the Psa outbreak. As a result,
several growers are not satisfied. Nonetheless, the sample has a positive projection about the future.
The majority see their future as not black nor bright or bright, which demonstrated a good preposition
for the future. Most of the respondents answered that they will still farming kiwifruit as a main activity
in the next five years. So, future perspective seems to be optimistic for them. Likewise, their
willingness to cooperate more with the cooperative and with Zespri, and their positive opinions about
the three programmes/initiatives to increase their productivity, and the optimistic considerations
concerning four type of innovations reported, demonstrates that there is an open nature to participate in
the develop the system from the growers’ side .
However, when we look at the rather low education level of kiwifruit growers, some doubts arise. Our
findings demonstrate that kiwifruit growers show a certain willingness to cooperate and so on, but as
mentioned before, 84.8% have a limited education, and 81.8% of the population is represented by
growers older than 40 years old. Also, they are less inclined to shows their outcomes and create inter-
farm competition. To some extent, a rural agricultural system constituted by very old and low educated
Figure 34: Educational level
distribution of kiwifruit growers.

49
growers might be an obstacle for the kiwifruit sector and its evolution into a dynamic global kiwifruit
production system.
In addition, during the data collection phase, a scarce consideration was given the questionnaire. Most
of the growers were very reluctant when we ask face to face to fill our questionnaire. And to collect 35
answered internet-based questionnaires, we sent it four times (once a week), and with reminding phone
calls for them to reply. This shows rather low skills in using the computer, which is also proved by the
very low use of the Zespri Canopy website. This information tool contains all possible innovations and
most updated information about kiwifruit agricultural practices also translated in Italian which could be
a valuable source and guidelines for the growers. But not even one third of our sample consults this
website more than once a month. To conclude, the rather scarce presence of new generations
associated with the opinions and characteristics of the population of kiwifruit growers make this sector
behindhand and incapable to rapidly adapt to changes.
50
5.2 Correlation analysis
In the second part of this study, we focus on determining correlations among groups of factors
according to the supposed relations discussed in Chapter 4.3. Based on the conceptual model of Figure
15, we expect find existing relationships among factors with the support of SPSS. We will first
correlate primary and secondary factors with growers’ productivity variables in order to identify which
are positively and/or negatively influencing the productivity of kiwifruit growers. As for the second
part of the analysis, attention will be placed on how primary and secondary factor do interfere each
other. The correlation analysis will be explained by the numerical order from one to eleven.
Correlation and significance test
Before moving into the results interpretation and the meaning of the correlation coefficient, their
significances and intensity of the association are explained. The correlation coefficients that will be
calculated will be interpreted and considered in relation of their significance coefficient. The
possibility that the correlation numbers could be explained by random variation or by pure chances
must be reduce to the minimum, and only statistically significant correlation indexes will be discussed
and taken into account. The coefficient P or Sig. describes the probability of our data not being
significant due to pure chances and casual variation. The lower the significance value is, the higher the
probability that our correlation coefficient does not depend on occasional chances and/or random
variation is.
In our case, we will consider correlation indexes of 0.01 or below as very representative, remarkably
the indexes below 0.05 and of less interest the one which are between 0.1 and 0.05. Correlation that is
above 0.1 will be considered not relevant due to pure chances and therefore not explaining evident
associations. In order to mark these three categories of significance indexes, they will be highlighted in
red and a bigger size will be used for showing the significant relations.
The tendency of one variable to differ in relationship with another is expressed through the correlation
coefficient called r. One can assume positive values from zero to +1 to be the case of a positive linear
relationship, and negative values from zero to −1 to be the case of a negative correlation. Its intensity
varies; and the more r assumes values around zero, the less related the two variables. Due to the large
variability of our population, we labelled and categorized r values ≤0.25 as low or weak correlations,
between 0.25 to 0.40 modest or moderate correlations, and ≥0.4 to 1.0 strong or high correlation in
both positive and negative cases.
5.2.1 Interpretation of the correlation coefficients related with growers’ productivity
After having elucidated the methodology applied to correlate and analyse our variables, we will now
move on to the interpretation of these associations. Numerical results obtained from the analysis are
shown in the correlation matrixes of Appendix VI, and the simplified version containing more
significant correlations coefficient are placed next to the text. Starting with growers’ productivity
correlations, we include yield, dry matter and OGR of Hayward and Zespri Gold kiwifruit on the left
column and the other variables (depending on the group of factor) on the horizontal row.
The correlations will follow the order:
Relationships 1: 6→1 Growers’ productivity vs. Chain factors.
Relationships 2: 6→2 Growers’ productivity vs. Growers’ attitude.
Relationships 3: 6→3 Growers’ productivity vs. Farm characteristics.
Relationships 4: 6→4 Growers’ productivity vs. Farm management.

51
Relationships 5: 6→5 Growers’ productivity vs. Farm technical practices.
Relationship 1: Growers’ productivity → Chain factors
Table 7 summarizes the most significant correlations coefficients identified from the association
between growers’ productivity and chain factors and the complete table is illustrated in Appendix VI.
In general, we saw several negative relationships with very significant indexes that are not in line with
our previous assumptions. Surprisingly, we expect that more satisfied growers which also trust the
technical support furnished by Zespri, cooperatives and suppliers, would be positively correlated with
productivity variable, but the results confirm an opposite tendency.
In particular we observed negative associations among (see Table 7):
Zespri Gold yield → Question 21 A and D + Question 23 A, B, and E
Hayward yield → Question 21 C and E + Question 23 A, B, C, D and E
Hayward OGR → Question 23 A, B, C, D and E
From this unexpected tendency we can to a certain extent deduct that the growers with a higher yield
and OGR are the one that are not satisfied of the technical support and negatively judged the variables
concerning the provision of the information.
21) In which measure do you agree with the following
statements 23) Provision of the information
Spearman's rho correlation
A) I am satisfied with the technical support provided by Zespri
B) I am satisfied with
the advice provided by the suppliers
of agricultural products
C) I am satisfied with my
cooperative's
initiatives
D) I am satisfied with the Zespri's initiatives
E) The market
information provided by
my cooperative
are transparent
A) I know who are
my cooperati
ve's buyers
B) I know the price
of the bulk
market
C) I am satisfied with the market
information
provided by Zespri
D) I trust the
technical and
market informatio
n provided
by my cooperati
ve
E) I trust the technical
and market information provided by
Zespri
What was your yield of Zespri Gold per
hectare in 2011?
r -.586** .105 .050 -.603
** -.282 -.391 -.372 -.313 -.283 -.379
Sig .002 .618 .812 .001 .171 .053 .067 .128 .170 .062
N 25 25 25 25 25 25 25 25 25 25
What was your yield of Hayward per
hectare in 2011?
r -.051 .022 -.336* -.144 -.467
** -.421
** -.264 -.278 -.359
* -.361
*
Sig .734 .877 .017 .330 .001 .003 .067 .062 .011 .013
N 47 50 50 48 49 49 49 46 49 47
What was your OGR per
hectare of Zespri Gold in 2011?
r -.254 .439* .089 -.232 -.263 -.355 -.343 -.238 -.171 -.330
Sig .193 .019 .652 .235 .177 .064 .074 .222 .385 .087
N 28 28 28 28 28 28 28 28 28 28
What was your OGR per
hectare of Hayward in 2011?
r .023 .029 -.223 .065 -.224 -.305* -.349
* -.397
** -.453
** -.459
**
Sig .879 .841 .124 .668 .121 .033 .013 .006 .001 .001
N 45 49 49 46 49 49 50 46 49 47
**. Correlation is significant at the 0.01 level (2-tailed). *. Correlation is significant at the 0.05 level (2-tailed).
Table 7: Correlations coefficients of growers’ productivity and chain factors.
Relationship 2: (6-2) Growers’ productivity → Growers’ attitudes
Table 8 illustrates the most significant correlations coefficients identified from the association between
growers’ productivity and grower’s attitudes. The complete correlation matrix is place in Appendix III.
In particular we observed positive associations among (see Table 8):
Zespri Gold yield → Question 22 A + Question 24 B
Dry matter → Question 22 A + Question 24 B
Gold OGR → Question 9 + Question 10 + Question 22 B + Question 24 B

52
We can clarify the associations by saying that growers who believe it is important to use new varieties
are the one producing high yield and OGR of Zespri Gold kiwifruit. This might demonstrate how top-
performing Gold growers think it is important to use new varieties. Also here it is visible that the
higher the Zespri Gold OGR is the higher growers’ satisfactions are, and the brighter their future
perspectives are. Lastly, dry matter content seems to increase when the importance of sharing
knowledge increases. This might demonstrate that through more field days and communication with
external experts, the dry matter content will increase.
9) 10) 22) Please rate the importance to you
of each of the following statements 24) How important are for you
the following statements?
Spearman's rho
correlation
Generally, how satisfied are you with your actual production?
Do you see the future
prospects of your
farm as?
A) Share knowledge and information between growers
and expertise, technicians and researchers
B) Hire specialized workers to
improve farm productivity
A) Apply new approaches to
labour use B) Adopt new variety
What was your yield of Zespri Gold per hectare in 2011?
r .225 .121 .361 .283 .361 .551**
Sig .249 .541 .076 .180 .306 .005
N 28 28 25 24 10 24
What was the average Dry Matter at the harvest of 2011?
r -.212 .024 .344* -.018 .019 .239
Sig .131 .864 .015 .905 .931 .101
N 52 52 49 48 24 48
What was your OGR per hectare of Zespri Gold in 2011?
r .407* .453
* .101 .323 .478 .512
**
Sig .026 .012 .610 .101 .193 .006
N 30 30 28 27 9 27
**. Correlation is significant at the 0.01 level (2-tailed). *. Correlation is significant at the 0.05 level (2-tailed).
Table 8: Correlations coefficients between growers’ productivity and growers’ attitudes.
Relationship 3: (6-3) Growers’ productivity → Farm characteristics
When comparing growers’ productivity factors with farm characteristics such as farm size, Psa
outbreak infection rate, conversion phase, and the type of ownership emerged that in general there are
no evident correlations. The significance indexes found are in large measure above 0.1 which means
that the correlations are due to pure chances. The coefficients of the analysis conducted on these
variables are illustrated in table placed in Appendix VI.
Relationship 4: (6-4) Growers’ productivity → Farm management
Here we compare growers’ productivity with farm management factors. Kiwifruit farm management
aspects such as employees, team, decision making and use of external advisors are correlated with
yield, dry matter and OGR variables. From the analysis emerged several discrepancies that are in
contrast with our assumed relationships. On the one hand we observed positive associations among
(see Table 9):
Gold yield → Question 14 A and B + Question 17 C
Dry matter → Question 14 A and B + Question 17 B
Gold OGR → Question 17 C
From these positive correlations emerged the importance for Gold growers to have employees that
know the practices and procedures to manage kiwifruit plants and to take decisions commonly, as well
as consulting external figures to better apply bio stimulants. This is also showed in the dry matter
content which is an index mostly used by the Gold growers. On the other hand, negative correlations
coefficients arose between (see Table 9):
Hayward yield → Question 14 A and B + Question 17 A, B and D
Hayward OGR → Question 14 A + Question 17 A and B

53
Hayward growers in contrast of the gold one show less propensity in having specialized employees,
take decisions together and in consulting external figures. In general, we can deduce that the presence
of skilled employees and their involvement in the farm decision-making process does increase the
productivity of Gold growers while negatively affect Hayward yield and OGR.
14) Farm management
17) To what extend you make use of external
advisors and to get knowledge and information
concerning the following issues
Spearman's rho correlation
A) The employees of my farm know the practices and procedures to manage
kiwifruit vines
B) I always take decision in consultation
with the employees
A) Managing the canopy
B) Improve pollination
C) Apply bio
stimulants
D) Improve your productivity
What was your yield of Zespri Gold per hectare in 2011?
r ,451 ,417 -,009 ,093 .423* -,177
Sig ,060 ,085 ,964 ,651 ,031 ,396
N 18 18 26 26 26 25
What was your yield of Hayward per hectare in
2011?
r -.461** -.324
* -.291
* -.423
** ,071 -.350
*
Sig ,002 ,036 ,050 ,003 ,637 ,017
N 44 42 46 46 47 46
What was the average Dry Matter at the harvest of 2011?
r .333* ,303 ,171 .297
* ,110 ,062
Sig ,041 ,068 ,245 ,040 ,453 ,673
N 38 37 48 48 49 48
What was your OGR per hectare of Zespri Gold in 2011?
r ,160 ,154 ,152 -,126 .600** -,149
Sig ,500 ,517 ,431 ,514 ,001 ,448
N 20 20 29 29 29 28
What was your OGR per hectare of Hayward in 2011?
r -.335* -,169 -.298
* -.294
* ,179 -,158
Sig ,026 ,290 ,047 ,050 ,235 ,299
N 44 41 45 45 46 45
**. Correlation is significant at the 0.01 level (2-tailed). *. Correlation is significant at the 0.05 level (2-tailed).
Table 9: Correlations coefficients between growers’ productivity and farm management factors.
Relationship 5: (6-5) Growers’ productivity → Farm technical practices
In this section, we correlate growers’ productivity with farm technical practices to understand whether
farm technical practices improve the yield, dry matter and OGR of kiwifruit growers. Overall these
findings confirm our assumptions that the more often these practices are implemented, the higher the
productivity is. This relationship is also confirmed by the absence of significant negative correlations
between farm technical practices and growers’ productivity. The most significant positive correlations
identified are between (see Table 10):
Gold yield → Question 16 B and F
Dry matter → Question 16 B and H
Gold OGR → Question 16 F
Hayward OGR → Question 16 D, E and F
Relating to Table 10, gel pruning practices is positively correlated with an r of 0.511 (Sig=0.009) with
Zespri Gold yield, and with and r of 0.425 (Sig=0.003) with dry matter. The use of bio stimulants plays
also a crucial role in increasing the productivity of both Zespri Gold and Hayward growers. This is
demonstrated by the coefficients r of 0.444 (Sig=0.023) and 0.285 (Sig=0.052) for both Zespri Gold
and Hayward yield, and the r coefficients of 0.656 (Sig=0.000) and 0.406 (Sig=0.005) for the Zespri
Gold and Hayward OGR.
In particular it emerged that gel pruning techniques seems to increase the Zespri Gold yield, dry matter
and OGR. This is a rather expensive practice that is mostly carried out on Zespri Gold variety due to
the higher prices obtained. Plus the uses of bio stimulants increase yield and OGR of both varieties.

54
16) Please rate how often do you use these practices
Spearman's rho correlation
A) Carefully select the
canes
B) I do gel pruning
C) I do flowers and fruit thinning
D) I use more pollination techniques (artificial)
E) I avoid water stress after fruit set
F) I use bio
stimulants to increase fruit size
G) I immediately remove the
infected parts
H) I apply pesticides
according to Zespri guidelines
What was your yield of Zespri Gold per hectare in 2011?
r ,063 .511** ,159 ,128 -,068 .444
* ,111 -,108
Sig ,764 ,009 ,437 ,553 ,740 ,023 ,599 ,601
N 25 25 26 24 26 26 25 26
What was your yield of Hayward per hectare in 2011?
r -,069 ,009 -,258 ,163 ,120 ,285 -,153 -,180
Sig ,647 ,951 ,077 ,274 ,417 ,052 ,315 ,232
N 47 45 48 47 48 47 45 46
What was the average Dry Matter at the harvest of 2011?
r ,061 .425** ,023 -,095 -,147 -,105 ,263 .289
*
Sig ,685 ,003 ,873 ,527 ,312 ,473 ,074 ,047
N 47 46 49 47 49 49 47 48
What was your OGR per hectare of Zespri Gold in 2011?
r ,090 ,365 ,085 ,137 ,298 .656** ,083 -,286
Sig ,648 ,056 ,659 ,495 ,116 ,000 ,676 ,132
N 28 28 29 27 29 29 28 29
What was your OGR per hectare of Hayward in 2011?
r ,264 ,095 ,176 .325* .342
* .406
** -,103 -,197
Sig ,076 ,534 ,238 ,027 ,018 ,005 ,506 ,195
N 46 45 47 46 -,068 .444* ,111 -,108
**. Correlation is significant at the 0.01 level (2-tailed). *. Correlation is significant at the 0.05 level (2-tailed).
Table 10: Significant correlations coefficients between growers’ productivity and farm technical practices factors.
Concluding remarks on factors impacting on growers’ productivity
In general, we found some discrepancies which are not in accordance with our assumptions. In
particular, Hayward and Zespri Gold yield variables show negative correlations with chain factors and
management factors variables. A further check on the SPSS database was processed with special
attention to the yields data, but there were not mismatches compared with the original data from the
questionnaire. One way to reason it is to consider the rather high variability of our sample, the limited
number respondents, and to the Psa outbreaks which has seriously modified the productivity of several
farms. So not clear evidence have been noticed on how farm management influence growers’
productivity.
Moving to the personal characteristics correlated with growers’ productivity, it is clear that OGR and
yield of Zespri Gold is positive associated with satisfaction level and with future perspective and
importance in adapting new varieties. So the higher their OGR is, the more satisfied and positive the
growers are. Moreover, another interesting relationship emerging from the analysis is about dry matter.
The more growers believe that it is important to share knowledge with external experts, the higher the
dry matter is. This illustrates an interesting aspect about quality.
As discussed above, farm management factors do have some contradicting results when associated
with Hayward yield and OGR. In general, we can deduce that the presence of skilled employees and
their involvement in the farm decision-making process are positively associated with the productivity
of Zespri Gold, while it is not the case with Hayward yield and OGR. The use of external advisors
concerning the use of bio stimulants is significantly positive in increasing Zespri Gold and Hayward
yield and OGR.
Lastly when we associated growers’ productivity with farm technical practices arose that when these
practices are held, the productivity rise as well. This is confirmed by the general essence of negative
correlation coefficients. Due to the variability of our sample the r coefficient are not very significant
and strong apart gel pruning and use of bio stimulants. Gel pruning technique is positively associated
with Zespri Gold yield and with dry matter. And the use of bio stimulants presents very high r

55
coefficients with Zespri Gold and Hayward yield and OGR. So, these two practices appeared to be the
most influential in altering the productivity of kiwifruit.
5.2.2 Interpretation of the relationships between primary and secondary factors
After having described the variables affecting kiwifruit growers’ productivity, we move our attention
on how secondary and primary factors influence each other. By referring to conceptual model of Figure
13, chain factors and growers’ attitudes will be correlated with farm management and farm technical
practices; and farm characteristics factors will be correlated with farm management factors that we also
assume influence farm technical practices. Following the same organization used above, correlation
tables which report significant relationships are illustrated next to the text and the complete correlation
matrixes are in Appendix VI. Here we will discuss the associations six to 11.
Relationships 6: 1→4 Chain factors vs. Farm management.
Relationships 7: 1→5 Chain factors vs. Farm technical practices.
Relationships 8: 2→4 Growers’ attitudes vs. Farm management.
Relationships 9: 2→5 Growers’ attitudes vs. Farm technical practices.
Relationships 10: 3→4 Farm characteristics vs. Farm management.
Relationships 11: 4→5 Farm management vs. Farm technical practices.
Especially in this part of the analysis emerged that there are several correlations with moderate
significance and r coefficients. To make the analysis clearer, we identify certain tendencies in the
matrixes which are showing interesting associations, as well as by referring and discussing those that
present reasonable reasons behind.
Relationship 6: (1-4) Chain factors → Farm management
From the association illustrated in Table 11 where we associate chain and farm management factors, it
appears that all relations coefficients are positive. This demonstrates that chain factors and farm
management are closely interdependent and that the increase of one causes an increase of the other as
well. By focussing on the significant associations and at their trend we can highlight a few interesting
positive associations among (see Table 11):
Question 14 C → Question 20 + Question 21 A and C + Question 23 B and D
Question 15 → Question 23 B, C, D and E
Question 17 A → Question 20 + Question 21 D and E + Question 23 A, B, C, D, and E
Question 17 B → Question 21 A, D and E + Question 23 A, B, C and D
The first association demonstrates that the stronger the team is the more satisfied the growers are of the
cooperative support and the more information concerning the price at the bulk market they know.
Thus, growers that possess a management team are more satisfied and aware of the information.
The second interesting inclination is about the use of Zespri canopy website. This relation confirms
that growers who visit the website tend to know more information from the chain and as a result show
trusts in these organizations.
Table 11 also shows other positive correlations concerning the use of external advisors to get
knowledge and information concerning the control of Psa and the increase of productivity. It emerged
that the more information growers ask to external advisors about the Psa control, the more satisfied
about cooperatives and Zespri initiatives they are, and furthermore the more information they have and
the more trust they express. Regarding the use of external advisors to get knowledge and information

56
concerning the improvements in the productivity, it is positively correlated with satisfaction versus
cooperative and Zespri initiatives, knowledge about the cooperative’s buyer and about the price at the
bulk market. And lastly it is correlated with satisfaction towards Zespri information and trust towards
technical and market information provided. As a result, the growers that want to do better and improve
their productivity are the ones that positively consider the chain factors.
Spearman's rho correlation
14) Farm management 15)
17) To what extend you make use of
external advisors to get knowledge and
information concerning the following issues
A) I rely mostly on permanent (specialized) employees
B) The employees of my farm know the
practices and procedures to manage
kiwifruit vines
C) We have a good team that jointly resolve operational problems
How often do you visit the
Zespri Canopy website
A) Deal with Psa B) Improve your productivity
20 My cooperative informs me about the Zespri guidelines concerning the quality standards?
r .324* ,241 .328
* ,055 .347
** ,194
Sig ,028 ,091 ,020 ,718 ,008 ,148
N 46 50 50 46 58 57
21 A) I am satisfied with the technical support provided by my cooperative
r ,266 .295* .291
* ,159 ,219 .321
*
Sig ,071 ,036 ,038 ,292 ,096 ,014
N 47 51 51 46 59 58
21 B) I am satisfied with the technical support provided by Zespri
r -,102 -,055 -,055 ,079 ,215 ,167
Sig ,514 ,710 ,713 ,600 ,114 ,228
N 43 48 48 47 55 54
21 C) I am satisfied with the advice provided by the suppliers of agricultural products
r ,150 ,212 .313* -,018 -,012 ,245
Sig ,308 ,132 ,024 ,908 ,928 ,062
N 48 52 52 46 60 59
21 D) I am satisfied with my cooperative's initiatives
r .312* ,210 ,208 -,040 .354
** .308
*
Sig ,032 ,140 ,142 ,790 ,006 ,019
N 47 51 51 46 59 58
21 E) I am satisfied with the Zespri's initiatives
r ,154 -,056 -,011 -,109 .388** .310
*
Sig ,325 ,706 ,940 ,464 ,003 ,023
N 43 48 48 47 55 54
23 A) I know who are my cooperative's buyers
r ,129 ,166 ,137 ,246 .280* .268
*
Sig ,387 ,249 ,339 ,103 ,033 ,044
N 47 50 51 45 58 57
23 B) I know the price of the bulk market
r ,136 .344* .368
** .447
** .292
* .404
**
Sig ,367 ,016 ,008 ,002 ,027 ,002 N 46 49 51 45 57 57
23 C) I am satisfied with the market information provided by Zespri
r ,040 ,111 ,157 .336* .371
** ,262
Sig ,799 ,463 ,286 ,024 ,006 ,056
N 43 46 48 45 54 54
23 D) I trust the technical and market information provided by my cooperative
r ,176 .287* ,242 .304
* .412
** .310
*
Sig ,236 ,043 ,087 ,042 ,001 ,019
N 47 50 51 45 58 57
23 E) I trust the technical and market information provided by Zespri
r ,053 ,139 ,131 ,256 .354** ,195
Sig. ,733 ,350 ,370 ,085 ,008 ,154
N 44 47 49 46 55 55
**. Correlation is significant at the 0.01 level (2-tailed). *. Correlation is significant at the 0.05 level (2-tailed).
Table 11: Correlations coefficients between chain factors and farm management factors.
Relationship 7: (1-5) Chain factors → Farm technical practices
From the correlation of these two groups of factors arose some dispersed positive and negative
correlations. By looking closely and searching for interesting associations, we did not identify
remarkable associations to discuss. The correlation indexes are illustrated in Appendix III.

57
Relationship 8: (2-4) Growers’ attitudes → Farm management
From the comparison between growers’ attitudes and farm management factors we saw interesting
tendencies among (see Table 12):
Question 26 → Question 14 A, C
Question 30 → Question 13 + Question 14 A, B, C
Question 14 C → Question 22 A, B, C + Question 23 A, B + Question 24 A, B, C + Question
30
Question 22 A → Question 14 B, C + Question 17 A, B, C, D, E
Starting with growers characteristics such as the age, we found two negative correlations that prove
that the higher the age is, the lower the reliance on specialized employees is (r=0.398 Sig=0.003) and
the less decisions taken in consultation with the employees are (r=0.398 Sig=0.003). This demonstrates
the tendency in which older growers are more sceptical in hiring specialized people and in relying on
them. Next to this, we found that educational level does have an effect on the way the farm is managed
with special concern about the presence of specialized employees. Schooling level is positive
associated with the number of permanent employees (r=0.444 Sig=0.004), with the reliance on them
(r=0.320 Sig=0.025), the consideration that these employees know how to manage kiwifruit vines
(r=0.398 Sig=0.003) and with the fact that the growers tend to take decisions in consultation with them
(r=0.373 Sig=0.006). As a result, the more educated are the growers the more specialized, solid, and
consistent the farm management is. An additional finding is about the variable “I always take decision
in consultation with the employees” which is positively correlated with several variable of the growers’
attitudes, and negatively associated with age and years of experience in cultivating kiwifruit. Hence,
growers who work cohesively with their employees in their management structure are the ones that are
optimistic on possible improvements, innovations and also are the ones that are more educated. Lastly,
we saw an interesting trend between sharing knowledge between growers and expertise (22 A) with the
question 17 about the use of external advisors concerning different agricultural issues. The more
important is for the growers to share knowledge about agricultural issues and the more they ask
information to external experts.

58
Spearman's rho correlation
13) 14) Farm management 17) To what extend you make use of external advisors to get
knowledge and information concerning the following issues
How many permanent employees
do you have?
A) I rely mostly on permanent
(specialized) employees
B) The employees of my
farm know the practices and procedures to
manage kiwifruit vines
C) I always take decision
in consultation
with the employees
A) Improve pollination
B) Fertilization
management
C) Apply bio
stimulant
D) Deal with Psa
E) Improve your
productivity
22 A) Share knowledge and information between growers and expertise, technicians and researchers
r ,190 ,085 .306* .334
* .275
* .276
* .258
* .382
** .294
*
Sig ,240 ,567 ,026 ,016 ,032 ,032 ,043 ,002 ,021
N 40 48 53 51 61 60 62 61 61
22 B) Visiting top-performing growers’ orchard and provide evidence of the practices adopted
r ,214 ,094 ,209 .329* .310
* ,052 -,029 .301
* ,225
Sig ,184 ,527 ,132 ,019 ,016 ,694 ,825 ,019 ,083
N 40 48 53 51 60 59 61 60 60
22 C) Benchmark your performance with other growers to stimulate inter-farm competition
r ,181 ,245 ,142 ,234 .310* ,160 ,055 ,154 .315
*
Sig ,263 ,094 ,309 ,098 ,016 ,225 ,671 ,240 ,014
N 40 48 53 51 60 59 61 60 60
23 A) I am willing to collaborate more with my cooperative
r ,173 ,184 ,187 .288* ,184 -,016 ,103 ,065 ,174
Sig ,294 ,217 ,193 ,045 ,160 ,906 ,428 ,620 ,185
N 39 47 50 49 60 59 61 60 60
23 B) I am willing to collaborate more with Zespri
r ,046 ,192 .335* .491
** ,224 ,149 ,095 .338
** ,259
Sig ,789 ,211 ,022 ,001 ,091 ,268 ,478 ,010 ,051
N 37 44 47 46 58 57 58 58 57
24 A) Hire specialized workers to improve farm productivity
r ,093 .430** ,233 .471
** .295
* ,147 -,049 ,219 .298
*
Sig ,575 ,002 ,097 ,000 ,029 ,288 ,720 ,108 ,027
N 39 48 52 51 55 54 56 55 55
24 B) Apply new approaches to labour use
r ,195 ,344 ,325 .429* ,185 .265
* -,050 ,078 ,143
Sig ,339 ,058 ,074 ,014 ,165 ,046 ,705 ,561 ,285
N 26 31 31 32 58 57 59 58 58
24 C) Adopt new variety
r ,264 ,170 ,233 ,267 ,156 ,235 ,077 -,062 ,285
Sig ,105 ,248 ,097 ,058 ,393 ,196 ,677 ,737 ,114
N 39 48 52 51 32 32 32 32 32
26 What is your age?
r -,005 -,264 -,202 -.353* ,017 ,152 -,128 ,242 ,208
Sig ,973 ,070 ,151 ,011 ,898 ,260 ,333 ,068 ,118
N 41 48 52 51 58 57 59 58 58
29 How many years have you been working in kiwifruit farm?
r ,137 -,255 -,140 -.325* -,069 -,036 ,155 -,106 -,212
Sig ,394 ,080 ,323 ,020 ,607 ,791 ,242 ,430 ,111
N 41 48 52 51 58 57 59 58 58
30 What is your education level?
r .444** .320
* .398
** .373
** ,189 ,116 -,036 ,151 ,194
Sig ,004 ,025 ,003 ,006 ,144 ,379 ,779 ,244 ,135
N 41 49 53 52 61 60 62 61 61
**. Correlation is significant at the 0.01 level (2-tailed). *. Correlation is significant at the 0.05 level (2-tailed).
Table 12: Correlations coefficients between growers’ attitudes and farm management factors.
Relationship 9: (2-5) Growers’ attitudes → Farm technical practices
From this association there are several correlations that were founded not really plausible. So we
decide to exclude them from the discussion and report the original table which is illustrated in
Appendix VI.
Relationship 10: (3-4) Farm characteristics → Farm management
From the associations illustrated in Table 13 we identified two important affinities that clarify how the
management aspects investigated are positively correlated with the farm size. These relations can be
seen among (see table 13):
Question 2 → Question 13 + Question 14 C + Question 17 B, C, D
Question 3 → Question 13 + Question 14 A, B, C + Question 17 A, B, D
A very significant correlation is visible between the total farm size and number of permanent
employees (r=0.7 Sig=0.000). Aside from that, we found that larger farms tend to have employees that
know practices and procedures to manage kiwifruit vines (r=0.327 Sig=0.008), a good team that
jointly resolve operational problems (r=0.7 Sig=0.000), and takes decisions in consultation with their
employees (r=0.7 Sig=0.000). Moreover, as we can see in Table 13 farm size is positively associated

59
with the use of external concerning canopy management (r=0.7 Sig=0.000), fertilization management
(r=0.7 Sig=0.000), and on improving the productivity (r=0.7 Sig=0.000). This demonstrates that the
larger farms are the more permanent employees they have, and the more jointly daily problems are
solved and the more external advisors are consulted. Thus, although we did not find significant
differences between large plantation and smaller one in terms of OGR and yield of both Zespri Gold
and Hayward variety (maybe due to Psa), here emerged that the way kiwifruit farms are managed
differ on the farm size.
Spearman's rho correlation
14) Farm management
17) To what extend you make use of external
advisors to get knowledge and information
concerning the following issues
13 How many permanent
employees do you have?
A) The employees of my farm know the practices and
procedures to manage kiwifruit
vines
B) We have a good team that jointly resolve
operational problems
C) I always take decision
in consultation with the
employees
A) Managing the canopy
B) Fertilization management
C) Apply bio
stimulants
D) Improve
your productiv
ity
2 How many hectares of Hayward did you have in 2011?
r .697** .176 .176 .277* .248* .353** .335** .343**
Sig .000 .124 .121 .036 .047 .008 .010 .009 N 32 45 46 43 47 46 48 47
3 What is your total farm size (ha)?
r .700** .327** .462** .417** .339** .321** .160 .341**
Sig .000 .008 .000 .001 .004 .006 .107 .004 N 41 54 55 52 61 60 62 61
**. Correlation is significant at the 0.01 level (2-tailed). *. Correlation is significant at the 0.05 level (2-tailed).
Table 13: Correlations coefficients between farm management and farm characteristics factors.
Relationship 11: (4-5) Farm management → Farm technical practices
In the last relationship calculated we compare farm management and farm technical practices factors
(Table 14). The main tendencies identified are between (see Table 14):
Question 13 → Question 16 A
Question 14 → Question 16 A, B, C, D, G
Question 17 A → Question 16 D
Question 17 B → Question 16 E, F, G
What we saw from this relationship matrix is that the more permanent employees the farms have the
more frequent the girdling practices are implemented. In general sophisticated practices such as gel
pruning, tip-squeezing and girdling are positively associated with the number of employees and with
the variable “I always take decision in consultation with the employees”. But also that the more
frequently farm technical practices are implemented, the more inclined the grower asking advice
concerning their implementation; and/or vice versa. This is shown in the correlation between “I use bio
stimulants to increase fruit size” with “I use external advisors to get knowledge and information about
how to apply bio stimulants” (r=0.676 Sig=0.002). And similarly, the variable “I apply pesticides
according to Zespri guidelines” with the three practices adopted to contain Psa.

60
Spearman's rho correlation
16) Please rate how often do you use these practices
A) I do gel pruning
B) I do tip-squeezing
C) I do girdling
D) I use bio stimulants to increase fruit
size
E) I constantly monitor the
orchard from Psa
symptoms
F) I immediately remove the
infected parts
G) I apply pesticides
according to Zespri guidelines
13 How many permanent employees do you have?
r .039 .266 .486** -.178 -.168 -.116 .207
Sig .413 .058 .002 .147 .161 .250 .113
N 34 36 35 37 37 36 36
14 I always take decision in consultation with the employees
r .269* .273* .314* -.302* -.009 .245* .277*
Sig .034 .030 .016 .018 .475 .047 .028
N 47 48 47 48 48 48 48
17 A) Apply bio stimulants
r .167 -.261* -.226* .676** -.100 -.153 -.143
Sig .105 .023 .044 .000 .220 .121 .135
N 58 59 58 62 62 60 61
17 B) Deal with Psa
r .044 .090 .143 -.072 .285* .278* .472**
Sig .371 .249 .142 .290 .013 .016 .000 N 58 59 58 61 61 60 61
**. Correlation is significant at the 0.01 level (2-tailed). *. Correlation is significant at the 0.05 level (2-tailed).
Table 14: Correlations coefficients between farm management and farm technical practices factors.

61
6 Discussion
Referring to the outcomes obtained and described in the results analysis chapter, we now move our
attention to the interpretations based on our research objective, the literature review and on the
methodology applied.
First of all, it is interesting to consider the main characteristics of the sample studied. The kiwifruit
growers investigated are located mostly in the center of Italy and are in large measure represented by
small and medium size family owned farms with two/three hectares. The two most common kiwifruit
varieties of our sample are Zespri Gold and Hayward. Overall our sample is composed by growers
rather aged for the reason that 82% of them are over 40 years old. And clear evidence emerged when
we saw that 40% of the respondents have achieved only elementary (10 years old) and middle (13
years old) school diploma which reflect the low educational level of the sample. From this preliminary
description of the sample investigated, it is evident that growers’ age and education might be two
limiting aspects affecting the collaboration within the chain, and in particular the interaction with
experts and peers as supported by Kilpatrick (2000).
Another findings concern the variability of our sample which appear to be more evident in some
variables and less in others. For instance, concerning the productivity, some Zespri Gold kiwifruit
growers had an OGR below 5,000 €/ha in 2011 whereas other growers far exceed 40,000 €/ha. Another
variability found is in the farm size. Within our respondents there are farms of one hectare and other of
220 hectares. One of the causes of the variability concerning the productivity is related to the Psa
outbreak. This disease has seriously changed the sector and compromised the productivity of Zespri
Gold farmers as we saw in 59% of our sample which experienced a decreased in productivity of about
30 to 100% between 2009 and 2011.
With regard to our objective of the study to “provide recommendations on opportunities for
productivity improvements of the Italian Zespri kiwifruit chain by investigating how farm management
practices and chain players related activities have positive or negative effect on growers’
performance”, we found evident limitations (negative effects) in the way farms are managed. Within
our sample we saw that the farm management team is mostly constituted by the single grower that own
the farm and that relies on labour forces (largely family members) in specific periods of the year. From
the survey, 53% of our respondents completely disagree and/or disagree on relying on permanent
(specialized) employees. As remarked by Patterson and Currie (2010), specialized workers are needed
to achieve high numbers of commercial fruit. Thus, scarce presence of specialized employees might be
a limitation of their productivity. Also, 61% of the respondents strongly disagree and/or disagree in
including their employees in the decision-making process. An opposite tendency arose within large
plantations. From the correlation between farm characteristics and farm management we found positive
correlation coefficients between farm size and permanent employees number (r=0.7 Sig=0.000), and
with the variable involving them in the decision-making process (r=0.417 Sig=0.001). We can
translate this aspect by saying that only medium/large size plantations possess a management team
based on experienced employees, and rarely smaller farms are able to maintain permanent employees
all year long. This is also due to the seasonality of the labour request in a kiwifruit farm which
fluctuates with picking at the harvesting time, winter pruning and so on during the year.
Another trend that might negatively influence growers’ productivity is that only few growers rely on
external experts and/or other information tool to get technical assistance in the day-to-day farming

62
decisions. From the 50 growers out of 74 that answered the question about the use of the Zespri
website, 56% of them visit the Zespri website every six months or less. This also confirmed by the low
requests of asking advice from external expert. From the analysis emerged that the sample do not ask
advices about canopy management, pollination, use of bio stimulants, and about how to improve the
orchard’ productivity. The only issue in which our respondents tend to consult experts is the Psa
management and control. 70% of the growers interviewed contact technicians and ask information
about Psa at least once a month and/or once a week. Concerning this aspect, we saw more
predispositions from the grower side in updating his/her knowledge. In line with Kilpatrick (2000) and
with other literature findings, it is the combination of inputs managed by the grower who has more
production-relevant education and/or information that can produce more output. The overall tendency
in the sample studied is that kiwifruit growers are not very open to get assistance from outside which
appeared to be different concerning the Psa.
The last factor of the farm management practices that we saw and that may negatively influence the
growers’ productivity concerns the technical practices adopted to cultivate kiwifruit. The sample
implement only basic technical practices such as winter pruning, flowers and fruits-thinning, artificial
pollination (not always), fertilization and Psa monitoring. While it does not apply more sophisticated
and expensive techniques i.e. summer pruning, girdling, tip-squeezing used to enhance the distribution
of carbohydrate to fruit with consequent improve in quality and quantity. As a result, high productivity
outcomes are hardly achievable (Patterson & Currie, 2010). This might depend on the scarce presence
of specialized (permanent) employees that are needed to execute such laborious practices or to the
limited resources and knowledge of the large majority of growers interviewed.
With regard to the chain players activities and interests, we saw that the technical services offered by
the cooperative, Zespri and suppliers, might positively influence growers performance. Our
respondents’ outcomes showed to be satisfied about the services provided by the cooperative, Zespri,
and slightly less about the services offered by their suppliers. The studied sample also shows a positive
satisfaction concerning field days, meetings, farm excursions organized by cooperative and Zespri.
This reflects the general opinion of the sample concerning the technical support offered. However, in
the analytical phase we did not find significant correlations coefficients which demonstrate that
satisfied growers tend to produce more.
An additional chain aspect that might interfere with growers productivity emerged from our findings
when we test the transparency of the information shared between growers, cooperatives and Zespri. It
appeared that although growers considered the information provided by the cooperative transparent,
and they are satisfied about the market information given by Zespri; they are completely unaware of
who are the cooperative’s buyers and at which price their kiwifruit at the bulk market is sold. 48% of
them disagree and/or completely disagree on “I know who the cooperative’s buyers are”, and similarly,
56% disagree and/or completely disagree on “I know the price at the bulk market”. These results
confirm the scarce transparency within the chain, with particular regards to the market and price
information shared between cooperatives, Zespri and growers. Furthermore, we found that our sample
trust cooperatives and Zespri which is in a complete contradiction with what we saw in the literature.
Akkermans et al., (2004) define the information transparency within the chain as “the result of
reinforcing dynamic interactions between trust levels of chain partners”. In our case the information
seems to be not transparent, but the trust level is high. One way of interpreting this contradiction is that
respondents do not fully trust the system but they do not have any other alternatives (limited

63
competitions among cooperatives or pack-houses). Another explanation could be that they do not really
know which type of chain information should be shared. This was also confirmed from the 40 face-to-
face interviews. Several interviewed answered that they have never received any sort of information
about downstream passages. We suggest that further studies are needed to clarify these inconsistencies
about chain information transparency within the Italian kiwifruit system.
In the survey we also look at some general opinions of the grower such as satisfaction, future
perspectives, importance of innovations, and the consideration about possible programmes used in
New Zealand to improve kiwifruit farm productivity. It arose that 50% of our sample is very
unsatisfied and/or unsatisfied, 36% is satisfied and just a few of them showed to be very satisfied about
the actual production. About the future prospects of their farm, 20% of the growers see them as very
black and/or black, 61% neither black nor bright, and 35% see the future as bright and only 4% as very
bright. In general the population reflected certain dissatisfaction about the actual situation, while their
future perspectives are seen as slightly bright.
Respondents show willingness to cooperate more with Zespri and with the cooperatives, and also think
that it is important to implement the three programmes proposed and based on: 1) sharing knowledge
and information between growers, expertise, technician, and researchers; 2) visiting top-performing
growers’ orchard and provide evidence of the practices adopted, and 3) benchmark growers’
performance with other growers to stimulate inter-farm competition. The positive attitude of our
sample concerning the aforementioned aspects seems to be an opportunity to implement such
programmes which might develop the kiwifruit production sector and the productivity too.
Among the factors that we saw are directly influencing the productivity, we identify evident
correlations which demonstrate that growers’ productivity is positively associated with the following
aspects:
→ Satisfaction level
→ Future perspective
→ The importance in adopting new varieties
→ Farm technical practices such as: a)gel pruning b)bio stimulants
→ The presence of specialized employees
→ The involvements of employees in the farm decision-making process
Additional consideration founded along the study can be drawn from the correlation between primary
and secondary factors (Chapter 5.2.2). Although these correlations do not directly influence growers’
productivity they might be indirectly related.
Between chain factors and farm management (Relationship 6) we observed that:
→ The stronger is the team the more satisfaction the growers are about cooperative support, and the
more information of bulk market price they know.
→ Growers that visit the Zespri Canopy website more often know more information from the chain
and tend to trust more cooperative and Zespri.
→ Growers that use external advisors to get knowledge and information concerning the
improvements in the productivity are satisfied towards cooperatives and Zespri initiatives, and
they have knowledge about the cooperative’s buyer and bulk market price.
Between growers’ attitudes and farm management (Relationship 8) we observed that:

64
→ The higher is the age, the lower is the reliance on specialized employees and the fewer decisions
are taken in consultation with the employees.
→ Educational level is positive correlated with the presence of specialized employees, with the
reliance on them, with the fact that these employees know how to manage kiwifruit vines, and with
the tendency to take decisions in consultation with the employees.
Between farm characteristics and farm management (Relationship 10) we observed that:
→ The larger are the farms the more permanent employees are used, the more practices they
employees know and the more solid is the management team which also take decision in
consultation with the employees.
→ The larger is the farm the more consultation is request to external advisors concerning canopy
management, fertilization management, and improving the productivity.
Between farm management and farm technical practices (Relationship 11) we observed that:
→ The more farm-technical practices are implemented and the more inclined is the grower to ask
advice concerning their implementation.
These aforementioned associations should be taken into account when implementing intervention
programmes. We found evident association that demonstrated which are the aspects that could
reinforce farm management.
By moving our attention to the methodology used in this study, we can say the strategies applied (desk
research combined with the survey strategy) demonstrated to be very suitable. On the one hand the
desk research strategy bears a better understanding of the context and the validation of the significant
theories concerned the topic; and on the other hand, the survey strategy appeared to be a robust tool to
collect empirical information from our sample. It makes possible the information generation and
significant evidence throughout the field data collection. We consider the strategy appropriate to the
research performed for the reason that we did not encounter significant problems along the research
development.
The concepts identified in the beginning which we assumed as fundamentals factors influencing
growers’ productivity were then grouped and used during the whole study process. Based on this
assumed categorization interesting findings and specific relationships emerged from the study.
However, they embraced multiple aspects of the sector which made the investigation very broad.
The conceptual model (Figure 15) designed and based on these groups of factors was then used to
illustrate possible relationships of the kiwifruit farming system influencing growers’ productivity. We
assume that farm characteristics, farm management and farm technical practices are directly
influencing the productivity (primary factor); and that, chain factors and growers’ attitudes do exert a
weaker effect (secondary factors) on growers’ productivity. This supposition has been confirmed only
for farm technical practices which showed evident positive statistical correlations coefficients with
productivity. So far, farm technical factors can be considered primary in influencing growers’
productivity. And concerning all other groups of variables, no evident differences appeared between
primary and secondary factors in affecting the growers’ productivity. These are the reasons why the
conceptual model should be redesigned or tested in a bigger sample. As a consequence, our model
presents limitations in exploring the causes altering the productivity of kiwifruit growers.
Some criticism concerning this study can be stressed on the way of data collection. From the several
aspects identified in the literature, we designed a questionnaire focusing on six main issues (farm
characteristics, farm management, technical practices, chain factors, personal characteristics and

65
opinions and growers’ productivity). It was structured in 31 questions of which some contain sub-
questions, which in total result in 69 questions that we asked to each respondent. The time needed to
fill it varies from 20 to up to 40 minutes. We directly experienced that during the interview conducted
in the farms, kiwifruit growers got stressed for such a long test. Also often they did not understand
some questions and even more time was needed to explain it. This did not speed up the process of
collecting the data. Possible improvements on the questionnaire can be done though reducing the
number of questions, and by pre-testing it in a small sample located in the area for further
modifications. Lastly, a reduction of the issues investigated would speed up the data collection. A
shorter questionnaire focusing on less features of the kiwifruit system would increase the number of
cases to a more valid statistical quantity (e.g. 200/300 kiwifruit growers), which would result in a
better description of a specific phenomenon.

66
7 Conclusions
Based on the objective of the study, the Italian kiwifruit growers’ productivity can be improved and
opportunities can be recognized within the industry. The study has undergone a literature review and a
survey to understand and elucidate further. From the sample examined become clearer that the ways
kiwifruit farms are managed differ significantly from case to case. A panorama on 74 kiwifruit growers
mostly located in the centre of Italy (Latina) verified its variability on some growers’ characteristics.
Significant productivity differences have been noticed in the yield, OGR of Hayward and Zespri Gold
kiwifruit growers. Furthermore, Psa outbreak has seriously changed the sector and compromised the
productivity of the majority of Zespri Gold growers since 2009.
By referring to our initial research question of “what opportunities can be recognized within the Italian
kiwifruit chain to improve the growers’ productivity?”, we identify the following factors as directly
related to growers’ productivity.
Farm technical practices such as gel-pruning are positively associated with Zespri Gold yield and
dry matter, while use of bio stimulants clearly increases Zespri Gold and Hayward yield and OGR.
Farm management factors: there are positive associations between the presence of specialized
employees and their involvement in the farm decision-making process with dry matter and Zespri
Gold yield.
Growers’ attitudes such as high satisfaction level, bright future perspective, and importance of
using new varieties are positively correlated with dry matter and Zespri Gold yield.
Furthermore, the major weaknesses which have been identified as main opportunities to increase the
productivity are in the farm management; that are, (i) the rather low educational level of the growers,
(ii) the absence of management teams, (iii) the very low involvement of specialized employees in the
farm decision making, (iv) the limited use of sophisticated technical practices (girdling, summer
pruning, soil test etc.) used to enhance quality and quantity, (v) the low frequency of adopting Zespri
Canopy website, and (vi) the low dependency on external experts, for they may all indirectly affect the
productivity
To verify the above management weaknesses, we have found for some cases that when they present a
well-organized management team, the growers appear to be more satisfied about the cooperative
supports and more informed about the bulk market prices. We also observed significant results
regarding how farm management teams gain information externally. Growers who visit the Zespri
Canopy website frequently know more chain information and tend to trust the cooperatives and Zespri.
Besides, we saw that growers who consult experts to gain knowledge and information about
productivity improvements are more satisfied with the cooperatives and Zespri initiatives, and they
know who the buyers are and bulk market prices. Lastly, growers that execute farm-technical practices
more frequently are inclined to ask advice about their implementation. Additional interesting findings
that might be extra opportunities for improving the growers’ productivity are the characteristics of the
grower. Older growers do not rely on specialized employees, and do not include employees in the
decision-making process. On the contrary, highly educated growers show strong reliance on
specialized employees and they are more willing to involve the employees in the decision-making
process.
We found that the information within the chain is not transparent since most growers of our sample are
not aware of the cooperatives’ buyers and the bulk market prices. However, this contradicts to our

67
results of how most growers show their trust in cooperatives and Zespri while they don’t know crucial
information which should be shared. Therefore, improving the transparency of the information might
create an opportunity to indirectly increase the growers’ productivity.
To sum up, farm management should be renovated and information transparency within the chain
should be enhanced as these are the opportunities for improvements. Possible solutions for these
inadequacies are to share information with experts, visit top grower’s farms and benchmark their
outcomes, for the three programmes have been highly valued by our sample.

68
8 Recommendations for further research
Due to the high variability of our sample’s characteristics, we encountered some difficulties testing our
assumed relationships. Especially when we move to the correlation analysis, it emerged that the
calculated coefficients tend to assume moderate correlations values. We believe that the limited
number of cases investigated might reduce evidences to a certain extent, and that 74 respondents did
limit the identification of the crucial relationships intended to examine with this study. As a
consequence, we recommend researchers to further extend the data collection to a statistically
sufficient number of respondents (200/300 growers). This may deliver more evidences in a variegate
sample such as the Italian kiwifruit growers.
Furthermore, referring to the aforementioned statement, the conceptual model should be modified. We
saw how farm technical practices emerged as main factor influencing growers’ productivity. Regarding
further researches with similar objective, we recommend to redesign the model by focussing on the
factors impacting on farm technical practices; for instance, production costs, agronomical knowledge,
specialization of the employees, etc.
Lastly, we identify interesting findings about the way kiwifruit farms are managed. In particular we
saw ineffectiveness in the team composition, decision making process, specialization of the employees,
the communication with external figures etc. Therefore we strongly recommend that further studies
should explore more the management structure of small, medium, and large kiwifruit plantations.

69
9 Recommendations to the industry
After having conducted this study we believe it is fundamental to provide some recommendations to
the industry players. In particular we refer to kiwifruit chain players such as growers, cooperatives and
Zespri.
Recommendations to Kiwifruit Growers
To kiwifruit growers we suggest to invest more resources on the management of their farm.
Improvements should be done through farm reorganization. Younger and educated agronomists should
be hired and accompanied together with growers in the farm management. They will improve the
communication with expert, cooperatives’ technicians and with other stakeholders. We also advise
them to implement more laborious and expensive technical practices, such as girdling, summer
pruning, soil test, etc. which will increase quality and quantity. In conclusion, younger technicians with
an agricultural background and with more competencies should be integrated in the existing farm
structure in order to lift the optimization of the resources and the farm productivity.
Recommendations to Kiwifruit Cooperatives
To cooperatives we suggest to enhance the communication with growers by improving the
transparency of the information together with offering technical services. Furthermore, we saw that
cooperatives process, pack and store kiwifruit for Zespri and for other customers. Due to different fruit
characteristics requirements, we suggest to promote specific production programmes among their
associated growers. For instance, one programme could focus on producing kiwifruit according to
Zespri quality parameters, and the other programme could be based on fulfilling other customers’
requirements. Thus, we advise cooperatives to reinforce the information transparency by informing the
associate growers about: who the customers are, which products growers should produce (in order to
satisfy specific consumer), and most importantly, how to produce it.
Recommendations to Zespri
Concerning Zespri, we identify two main suggestions for improvements. As mentioned earlier, we
suggest cooperatives to improve the communication with kiwifruit growers. Respondents gave positive
considerations to the three optional programmes for improvements (page 47). These already applied
approaches in New Zealand could be applicable also in Italy. These will principally increase the
growers’ competencies, stimulate growers information exchange with experts, and most importantly, it
will create a transparent co-learning process which will also boost growers’ performance and create
inter-farm competition. This could be done through: seasonal-theme meetings, periodic farm
excursions and through training courses that clarify and explain to growers how to optimizing their
resources for a better kiwifruit production.
The second suggestion is about the identification, selection and retention of the best growers which can
constantly supply standardized high quality kiwifruit. Although there are limited top performing cases
in our study (see Chapter 5.1), we visited a few outstanding growers selling fruits to other traders
without participating the Zespri network. So, one way to increase volumes of high quality kiwifruit
could be done by recruiting the existing best growers and ensuring their products to Zespri in a long
run. This pool of selected growers could also establish a positive example to other growers, who might
shift their businesses to the Zespri supply programmes in the future.

70
References
Akkermans, H., Bogerd, P. & Doremalen, J., 2004. Travail, transparency and trust: A case study of computer-
supported collaborative supply chain planning in high-tech electronics. European Journal of Operational
Research , Volume 153, pp. 445-456.
Alvarez, J. & Shelman, M., 2010. Zespri's story is one of transforming a commodity into a premium product.
Harvard Business School, 511(001).
Anderson, E. & Weitz, B., 1989. Determinants of continuity in conventional industrial channel dyads. Marketing
Science, Volume 8, pp. 310-323.
Arduino, G. & Parola, F., 2010. Cold chain in the shipping industry: bulk versus container in the banana trade,
Lisbon: World Conference on Transport Research.
Arumugam, N., Fatmah, M., Chiew, E. & Zainalabidin, M., 2010. Supply chain analysis of fresh fruits and
vegetables (FFV): Prospects of contract farming. Agricultural Economics , Volume 56, pp. 435-442.
Asteggiano, L. et al., 2010. Ten years of research on complementary pollination of kiwifruit, s.l.: Acta Hort.
Auburn, J. & Baker, B., 1992. Re-integrating agricultural research. American Journal of Alternative Agriculture,
Volume 7, pp. 105-110.
Balestra, G. et al., 2009. Current status of bacterial canker spread on kiwifruit in Italy. Australiasian Plant
Disease Note, Volume 4, p. 34–36..
Bano, S. & Scrimgeour, F., 2011. New Zealand Kiwifruit Export Performances: Market Analysis and Revealed
Comparative Advantages, Hamilton: University of Waikado.
Barbercheck, M., Kiernan, N., Hulting, A. & Duiker, S., 2011. Meeting the ‘multi-’ requirements in organic
agriculture research: Successes, challenges and recommendations for multifunctional, multidisciplinary,
participatory projects. Renewable Agriculture and Food Systems, Volume 27, pp. 93-106.
Bella, L. & Martin, P., 2009. Farm innovation in the broadacre and dairy industries, 2006-07 to 2007-08,
Canberra: ABARE research report 09.16.
Belrose, I., 2006. World Kiwifruit Review, USA: Inc Pullman.
Belrose, I., 2011. World Kiwifruit Review, Creston Lane, Pullman, USA: Belrose, Inc.,.
Beverland, M., 2001. Creating value through brands: the ZESPRI kiwi fruit case. British Food Journal, Vol. 103
(Iss: 6 ), pp. pp. 383 - 399.
Boyd, L., 2005. Review of kiwifruit mineral nutrition, s.l.: Report to ZESPRI Group Limited.
Boyd, L. & Barnett, A., 2010. Nitrogen and Kiwifruit Quality – As Many Questions as Answers. New Zealand
Kiwifruit Journal.
Brun, S., 2010. CHEMICAL THINNING FOR FRENCH ORCHARDS?. Kiwifruit Journal , Volume
September/October .
Cacioppo, O., 2004. "Actinidia di qualità in provincia di Latina" "The quality of Actinidia from Latina province".
Informatore agrario , Volume 50, pp. 41-42.
Cai, J. & Wang, Z., 2011. Effect of plant vigor on fruit size and quality and flower production in kiwifruit. Faenza
, ISHS, pp. 289-293.
Chattophday, T., 2008. A textbook on pomology. Ludhiana, India : Kalyani.
Chen, F., 1999. Decentralized supply chains subject to information delayes. Management Science, Volume 45,
pp. 1076-1090.
Chen, L., 2012. Distribution and value added logistics in the cold chain product market with application to the
role of seaports, Antwerp: University of Antwerp.
Cooper, T., Gargiullo, A. & Retamales, J., 2007. Kiwifruit Softening: Comprehensive Research Approach in
Chile and Relevant Results. ACTA HORTICULTURAE, Volume 753, pp. 289-296.
71
Corsi, A. & Salvioni, C., 2012. Off- and on-farm labour participation in Italian farm households. Applied
Economics, 44(19), pp. 2517-2526.
Costa, G., 2003. Recenti innovazioni nella tacnica culturale e nell'impollinazione dell'actinidia. Verona, s.n., pp.
105-134.
Costa, G. et al., 2011. Use of Plant Bioregulators in Kiwifruit Production. In: VII International Symposium on
Kiwifruit. Faenza : Acta Hort. (ISHS), pp. 337-344.
Costa, G., Testolin, R. & Vizzotto, G., 1993. Kiwifruit pollination: An unbiased estimate of wind and bee
contribution. New Zealand Journal of Crop and Horticultural Science, Volume 21:2, pp. 189-195.
Crisosto, C., Zegbe, j., Hasey, J. & Crisosto, G., 2011. Is dry matter a reliable quality index for Hayward
kywifruit?. Faenza , ISHS, pp. 531-537.
De Jong, G. & Nooteboom, B., 2000. The causal structure of long-term supply relationships. Kluwer Academic
Publishers.
Deflorian, S., 2009. Il miglioramento genetico dell’Actinidia negli ultimi 20 anni: problematiche affrontate e
soluzioni proposte, Padova: University of Padova.
Dharini, S., J., Y. & Y., E. M., 2011. Maintaining mango (Mangifera indica L.) fruit quality during the export
chain. Food Research International, Volume 44, pp. 1254-1263.
El-Osta, H. S. & Morehart, M. J., 2002. Technology Adoption and Its Impact on Production Performance of
Dairy Operations. Review of Agricultural Economics, Volume 22, pp. 477-498.
Everett, K. et al., 2011. First report of Pseudomonas syringae pv. actinidiae causing kiwifruit bacterial canker in
New Zealand. Australiasian Plant Disease Note., Volume 6 Number 1, pp. 67-71.
Fairweather, J., Hunt, L. & Benge, J., 2009. Understanding Kiwifruit Orchard Systems. Kiwifruit Journal ,
Volume March/April.
Fairweather, J. et al., 2007. New Zealand Farmer and Grower Attitude and Opinion Survey: Kiwifruit Sector, s.l.:
ARGOS Research Report: Number 07/08.
Famiania, F. et al., 2012. Yield affects qualitative kiwifruit characteristics and dry matter content may be an
indicator of both quality and storability. Scientia Horticulturae, Volume 146, pp. 124-130.
Fawcett, S., Ellram, L. & Ogden, J., 2007. Supply chain management from vision to implementation. Upper
Saddle River : Pearson .
Fenton, M., MacGregor, C. & Cary, J., 2000. Final report on framework and review of capacity and motivation
for change to sustainable management practices, Bureau of Rural Sciences: Social Sciences Centre.
Ferguson, A., 2011. Kiwifruit:Evolution of a Crop, s.l.: The New Zealand Institute for Plant & Food Research
Ltd..
Forrester, J., 1961. Industrial dynamics. MIT Press Cambridge.
Goletti, F., Ghimire, D., Bhatta, A. & Dulal, U., 2001. FARMER FIELD SURVEY DESIGN AND
METHODOLOGY OF ANALYSIS, Kathmandu, Nepal: AGRICULTURAL SECTOR PERFORMANCE
REVIEW.
Gonzales, M., Coque, M. & Herrero, M., 1998. Influence of pollination systems on fruit set and fruit quality in
kiwifruit (Actinidia deliciosa). Annals of Applied Biology, 132(2), p. 349–355.
Goodwin, R., 2000. Kiwifruit Pollination Manual, s.l.: Zespri Innovation.
Greer, J., Falk, S., Greer, K. & Bentham, M., 1995. Explaining and justifying recommendations in an agriculture
decision support system,. Computers and Electronics in Agriculture, Volume 11, pp. 195-214.
Henderson, J. & Quandt, R. E., 1958. Microeconomic Theory: A Mathematical Approach. New York: McGraw-
Hill .

72
Hernández, G. & Craig, R., 2011. EFFECTS OF ALTERNATIVES TO HYDROGEN CYANAMIDE ON
COMMERCIAL KIWIFRUIT PRODUCTION. In: VII International Symposium on Kiwifruit. Faenza : Acta
Hort. (ISHS) , pp. 357-363.
Hewett, E., 2003. PERCEPTIONS OF SUPPLY CHAIN MANAGEMENT FOR PERISHABLE
HORTICULTURAL CROPS: AN INTRODUCTION. Acta Hort (ISHS) , Volume 604, pp. 37-46.
Hopping, M. & Jerram, E., 1979. Pollination of kiwifruit (Actinidia chinensis Planch.): stigma-style structure and
pollen tube growth.. New Zealand journal of botany, Volume 17, pp. 233-240.
Howley, P., Donoghue, C. & Heanue, K., 2012. Factors Affecting Farmers’ Adoption of Agricultural
Innovations: A Panel Data Analysis of the Use of Artificial Insemination among Dairy Farmers in Ireland.
Journal of Agricultural Science, Volume 4, pp. 171-179.
Hu, Y. & Hendrikse, G., 2009. Allocation of decision rights in fruit and vegetable contracts in China.
International Studies of Management and Organization, 39(4), pp. 8-30.
Johnston, J. et al., 2001. Prediction of postharvest Royal Gala apple softening. Acta Hort, Volume 553, pp. 197-
200.
Judd, M. J., McAneney, K. J. & Wilson, K. S., 1989. Influence of water stress on kiwifruit growth. Irrigation
Science, Volume 10, pp. 303-311.
Kilgour, M., Saunders, C., Scrimgeour, F. & Zellman, E., 2007. The key elements of success and failure in the NZ
kiwifruit industry, The University of Waikato: Agribusiness Research and Education Network.
Kilgour, M., Saunders, C., Scrimgeour, F. & Zellman, E., 2007. The key elements of success and failure in the NZ
kiwifruit industry, The University of Waikato: Agribusiness Research and Education Network.
Kilpatrick, S., 2000. Education and training: Impacts on farm management practice. The Journal of Agricultural
Education and Extension, Volume 7, pp. 105-116.
Kiwiflier, 2011. October Forecast Reflects Steady Sales. Kiwiflier, 28 October, p. 8.
Kiwifruit Journal, 2009. Organic Regime Proves Successful for Long Term Te Puke Grower. Kiwifruit Journal,
Volume May/June.
Klerkx, L., Aarts, N. & Leeuwis, C., 2010. Adaptive management in agricultural innovation systems: The
interactions between innovation networks and their environment. Agricultural Systems , Volume 103, p. 390–
400.
Koh, J. K. & Lee, D., 1992. Canker of kiwifruit by Pseudomonas syringae pv. morsprunorum.. Korean Journal of
Plant Pathology , Volume 8, pp. 119-122.
Lee, H., Padmanabhan, P. & Whang, S., 1997. Information distortion in a supply chain: The Bullwhip effect.
Management Science , 43(4), pp. 516-558.
Martin, R. A., 2008. Development of ZESPRI™ Gold Kiwifruit – Success at a Cost. Acta Horticulturae , Volume
772, pp. 19-24 .
Matta, F., Rasberry, F. & Little, S., 1987. Pruning high density orchards: influence cultivars and topping date or
return bloom and regrowth of trees. Nissiripi, Agri. For. Exp. Sta. No. 12..
Max, S., 2008. Resolving labour shortages – Is RSE a step in the right direction?. Kiwifruit Journal , Volume
January/February .
Max, S., Barnett, A., Blattmann, P. & Thorp, G., 2007. Pushing the boundaries with innovative growers. kiwifruit
journal , Volume May/June.
May, M. & Fisher, S., 2001. Information transfer for Sugar Beet Production. s.l., s.n., pp. 81-88.
Mazzaglia, A. et al., 2012. Pseudomonas syringae pv. actinidiae (PSA) Isolates from Recent Bacterial Canker of
Kiwifruit Outbreaks Belong to the Same Genetic Lineage. PLoS ONE, Volume 7 (5).
Mazzeo, M., Gentili, A., Onorato, R. & Kay, C., 2011. CULTURAL PRACTICE IMPROVEMENTS ON
HAYWARD ORCHARDS IN LATINA. NZ KIWIFRUIT JOURNAL , pp. 50-54.

73
Mc Cutcheon, D. & Stuart, F., 2000. Issues in the choice of supplier alliance partners. Journal of Management,
18(3), pp. 279-302.
Mc Pherson, H., Richardson, A., W.P., S. & Currie, M., 2001. Effects of hydrogen cyanamide on budbreak and
flowering in kiwifruit (Actinidia deliciosa ‘Hayward’). New Zealand Journal of Crop and Horticultural Science,
Volume 29, pp. 277-285.
Meensel, J. et al., 2012. Effect of a participatory approach on the successful development of agricultural decision
support systems: The case of Pigs2win. Decision Support Systems.
Millar, P. & Kilpatrick, S., 2005. Management Skill Training for Traditional Primary Industries: Is Delivery in
Decline?. Gold Coast, Queensland, s.n., pp. 55-62.
Miller, S. A., Smith, G. S., Bolding, H. L. & Johansson, A., 1998. Effects of Water Stress on Fruit Quality
Attributes of Kiwifruit. Annals of Botany, Volume 81, pp. 73-81.
Miller, S., Broom, F., Thorp, T. & A.M., B., 2001. Effects of leader pruning on vine architecture, productivity
and fruit quality in kiwifruit. Scientia Hort, Volume 91, pp. 189-199..
Minchin, P., Snelgar, W., Blattmann, P. & Hall, A., 2010. Competition between fruit and vegetative growth in
Hayward kiwifruit. New Zealand Journal of Crop and Horticultural Science, Volume 38:2, pp. 101-112.
Miyata, S., Minot, N. & Hu, D., 2007. Impact of Contract Farming on Income Linking Small Farmers, Packers,
and Supermarkets in China, Washington: INTERNATIONAL FOOD POLICY RESEARCH INSTITUTE.
Moock, P. R., 1981. Education and Technical Efficiency in Small-Farm Production. Economic Development and
Cultural Change, 29(4), pp. 723-739.
Morton, A. & Woolley, D., 2011. MANIPULATION OF FRUIT WATER AND DRY MATTER CONTENT BY
TREATMENTS APPLIED DURING EARLY AND LATE STAGES OF FRUIT DEVELOPMENT IN
KIWIFRUIT. Acta Hort. (ISHS), Volume 913, pp. 309-313.
O'Rourke, D., 2011. Dealing with Changing World Markets for Kiwifruit. s.l., ISHS, pp. 45-49.
Otieno, G. & Knorringa, P., 2012. Localizing Global Standards . In: Global Value Chains. Linking Local
Producers from Developing Countries to International markets . s.l.:s.n.
Pacino, B. et al., 2011. Kiwifruit quality standards. Faenza , Acta Horticulturae.
Pandit, A., Pandey, N., Rana, R. & Lal, B., 2009. An empirical study of gains from potato contract farming.
Indian Journal of Agricultural Economics, 64(3), pp. 497-508.
Pannell, D. J. et al., 2006. Understanding and promoting adoption of conservation practices by rural landholders.
Australian Journal of Experimental Agriculture, Volume 46, pp. 1407-1424.
Parkhe, A., 1993. Strategic alliance structuring: A game theoretic and transaction cost examination of interfirm
cooperation. Academy of Management Journal, Volume 36, pp. 794-829.
Patterson, J. & Currie, M., 2010. Optimizing kiwifruit vine performance for high productivity and superior fruit
taste. Faenza , ISHS, pp. 257-268.
Patterson, K., Burdon, J. & Lallu, N., 2003. ‘Hort16A’ kiwifruit: progress and issues with commercialisation.
Acta Hort, pp. 267-273.
Pentreath, R., 2011. Monitoring the nutrient requirements of kiwifruit insights from ZESPRI’S Focus Orchard
Network, s.l.: s.n.
Prokopy, L. S., Floress, K., Klotthor-Weinkauf & Baumgart-Getz., 2008. Determinants of agricultural best
management practice adoption: Evidence from the literature. Journal of Soil and Water Conservation, Volume
63, pp. 300-311.
Rodrigue, J. & Notteboom, T., 2011. The cold chain and its logistics, s.l.: Geography of Transport Systems.
Rogers, E., 1995. Diffusion of Innovations. fourth ed. New York: Free Press.
Scortichini, M., 1994. Occurrence of Pseudomonas syringae pv. actinidiae on kiwifruit in Italy. Plant Pathology ,
Volume 43, pp. 1035-1038.

74
Serizawa, S. et al., 1989. Occurrence of bacterial canker of kiwifruit in Japan: description of symptoms, isolation
of the pathogen and screening of bactericides.. Annals of the Phytopathological Society of Japan, Volume 55, p.
427–436.
Sher, D., 2008. Kiwifruit Nutrient Testing. KiwiTech Bullettin , Volume N43.
Smith, J., 2005. Specialized logistics for a longer perishable supply chain. World Trade Magazine.
Snoo, G., 2006. Benchmarking the Environmental Performances of Farms. THE INTERNATIONAL JOURNAL
OF LIFE CYCLE ASSESSMENT, Volume Volume 11, Number 1, pp. 22-25.
Testolin, R., 1991. Maledensity and arrangement in kiwifruit orchards. Scientia orticulturae , Volume 40, pp. 41-
50.
Testolin, R. & Ferguson, A., 2009. Kiwifruit (Actinidia) production and marketing in Italy. Crop Hort. Sci, pp. 1-
32.
Thorp, T., Barnett, A. & Blattmann, P., 2011. What Are the Productivity Limits for ‘Hayward’ Kiwifruit?. Acta
Hort. (ISHS), pp. 419-424.
Vaccaro, A. & Madsen, P., n.d. Firm Information Transparency: Ethical Questions in the Information Age, s.l.:
IST Lisbon and Carnegie Mellon University.
Vanneste, J., Yu, J. & Cornish, D., 2010. Molecular characterisations of Pseudomonas syringae pv. actinidiae
strains isolated from the recent outbreak of bacterial canker on kiwifruit in Italy. New Zealand Plant Protection ,
Volume 63, pp. 7-14.
Verchuren, P. & Doorewaard, H., 1999. Designing a Research Project. second edition ed. Utrecht: Lemma.
Vorst, J. v. d., 2000. Effective Food Supply Chains -Generating, Modelling and Evaluating Supply Chain
Scenarios., Wageningen: PhD-thesis Wageningen University.
Walker, D., 2002. Decision support, learning and rural resource management. Agricultural Systems, Volume 73,
p. 113–127.
Warner, K. D., 2005. Extending agroecology: Grower participation in partnerships is key to social learning.
Renewable Agriculture and Food Systems, Volume 21, pp. 84-94.
Wollni, M. & Brümmer, B., 2012. Productive efficiency of specialty and conventional coffee farmers in Costa
Rica: Accounting for technological heterogeneity and self-selection. Food Policy , Volume 37, pp. 67-76.
Woodward, T. & Allison, P., 2009. Poor Picking Costs You Money. Kiwifruit Journal, Volume May/June.
Woodward, T. & and Patterson, K., 2008. The best of both worlds: high yields of high dry matter fruit. New
Zealand Kiwifruit Journal , January/February, pp. 9-13.
Woodward, T. & Patterson, K., 2008. The best of both worlds: high yields of high dry matter fruit. New Zealand
Kiwifruit Journal, January/February, pp. 9-13.
Woodward, T. & Patterson, K., 2009. Learning from top performing orchards. New Zealand Kiwifruit Journal ,
January/February, pp. 21-24.
Woodward, T. & Patterson, K., 2009. Learning from top performing orchards. New Zealand Kiwifruit Journal ,
January/February, pp. 21-24.
Xiloyannis, C., Montanaro, G. & Dichio, B., 2011. SUSTAINABLE ORCHARD MANAGEMENT, FRUIT
QUALITY AND CARBON FOOTPRINT. Acta Hort. (ISHS) , Volume 913, pp. 269-273.
Zespri website , 2012. http://www.zespri.com/about-zespri/history.html. [Online].
Zespri, 2010. Zespri annual review, s.l.: s.n.
Zespri, 2012. http://www.zespri.com/about-zespri/history.html. [Online].

75
Appendix I
Questionnaire description
Farm characteristics
General information concerning the area of cultivation, the type of farm system (variety) and the size
introduce the respondent.
Question 1: In which area are you located?
Question 1 is an open question where respondents can write the area of cultivation. Through this
question we can identify their location and describe our sample.
Question 2: How many hectares each variety (Zespri™Gold, Hayward, Hayward organic, other
variety) did you have in the season 2011?
We include this question to understand the differences of the cultivated area for each variety.
Question 3: What is your total farm size in hectare?
This is an open question which addresses the size of the farm. As discussed larger farms present
different characteristics than the small one. This will lead to the identification of growers groups (large,
medium, small plantations).
Question 4: In what percentage from 2009 to 2011 your productivity has been reduced due to Psa
(bacterial disease) (0-5%, 5-10%, 10-30%, 30-60%, 100 %)?
We include the question about the decrease of productivity due to the Psa (bacterial disease), for the
reason that infected kiwifruit vines tend to collapse with falling fruit production (Balestra, et al., 2009;
Vanneste, et al., 2010). And question 4 addresses the decrease in productivity due to Psa outbreak, and
shows which growers are the most affected. This question also quantifies the reduction in productivity
of the previous season.
Question 5: Are you in the healing phase at this moment (conversion to Hayward and/or other
varieties)?
In the last two years a lot of Zespri Gold growers have cut off their Zespri Gold vines, and it might be
possible that they are in the transformation phase. From the existing rootstock growers can regrowth
the plant of Hayward (green variety) and/or new varieties crafted in one/two years and return to
sufficient productivity levels. During this healing phase the organization of the farm has somewhat
change farm management and income. Psa has tremendously changed the operations of some farms.
With this question we tackle the actual status of the orchard and whether or not is in the conversion
phase.
Question 31: Your farm is (family-owned, collective-owned or joint venture, other forms)?
Question 31 addresses whether the farm is family or collectively owned, or if it is under other type of
ownership. This will clarify the typology of farms investigated.
Farm performance
Farm performance and productivity is a direct measurement of the grower’s skills. The growers
capacity to “read the season” and technical factors of the kiwifruit production and manipulate vines
accordingly is directly reflected by his/her orchard performance. Farm performance also reflects the
growers’ income achieved. The distinction in “high” and “low” outcome growers is linked with the

76
capacity to respect a delicate equilibrium between yield and quality, which depend on farm practices
implemented.
Each crop is sold at diverse prices, so first we ask the typology of fruit produced for Zespri. Yield, fruit
size and dry matter content can be considered as quality farm performance because, they indicate
incentives received for quality. The index that combines all these indicators is the orchard gate returns
(OGR). Through it we will be able to categorize growers in three stratified samples or categories: top-
performing growers, average and low-performing. References used to formulate and reason these
questions are: (Patterson & Currie, 2010), (Kilgour, et al., 2007), (Zespri, 2010), (Kiwiflier, 2011),
(Cai & Wang, 2011), (Crisosto, et al., 2011) and (Fairweather, et al., 2007).
Question 6: What was your yield per hectare (quintals/hectare) in 2011? (Please leave empty the
categories that you did not produce)
This close question measures what was the average yield of commercial fruit per hectare harvested in
2011. There are gap of 100 quintals differentiating the top performing growers from the low
performing one. Furthermore, it addresses the quantity produced per each variety (Zespri™Gold,
Hayward, Hayward organic, and other variety).
Question 7: What was the average dry matter content when you harvest (< 15 %, 15-16 %, 16-17 %,
17-18 %, >19 %)?
The measurement of the quality is achieved through the Dry Matter index (citation) and this question
wants to assess it on the one hand and examine whether growers remember this index and how
important is for them.
Question 8: What was your average Orchard Gate Return per hectare (€/ha)?
The orchard gate return (OGR) is the amount of money that the grower gets defined as the total amount
of € paid back to the grower for one season per canopy hectare (€/ha/year). The OGR do not only
measures the economical return of the growers but reflects multiple factors. Through it we will be able
to categorize the pool of growers in three stratified samples or categories: top-performing growers,
average and low-performing.
Farm management
This section begins with a series of questions concerning managerial approaches. This will enable us to
have a more comprehensive assessment of how is composed the management team, how it operates
and which actions have been taken to increase the productivity over the last few years. We formulate
questions concerning the management team, whether it is a family business, how many people
participate in the decision-making process, and which type of workforce do they use and whether they
train their workers.
Question 2: How many HECTARES of each variety (Zespri™Gold, Hayward, Hayward organic, other
variety) did you have in the season 2011?
Although this question has been described in the farm characteristics paragraph, it also shows the type
of farming system which reflects diverse way of managing the plantations (Fairweather, et al., 2007).
Question 12: How many seasonal workers do you have?
This is an open question that describe the how the growers rely on the seasonal workforce.
Question 13: How many permanent employees do you have? (Including temporary employees that
work for more than three months)?

77
This question reflects the importance and the presence of skilled employees in the farm.
Question 14: Farm management
I rely mostly on permanent (specialized) workers.
The employees of my farm know the practices and procedures to manage kiwifruit vines.
We have a good team to jointly resolve operational problems.
I always take farm decisions in consultation with the employees.
This series of questions illustrate the differences in the management organization of the farm. They
investigate whether growers rely on the workforce, and in a team, and whether they include the
employees in the decision-making process. The respondents can rank each question with five levels
Likert scale (completely disagree, completely agree).
Question 15: How often do you visit the Zespri Canopy website (never/once a year/every six
months/once a month/once a week)?
The Zespri canopy website is a tool to communicate new approaches, innovations, practices and
general information about the kiwifruit industry. Here the intention is to measures which are the
informatics skills of the farmer and how much do they consult the website to get updates concerning
the cultivation practices.
Question 17: To what extend you make use of external advisors/technicians/and third party
information (cooperatives, Zespri, suppliers, etc.) to get knowledge and information for the following
issues (1=never, 2=once a year, 3=every six months, 4=once a month, 5=once a week)?
Managing the canopy
Improve your pollination
Managing the fertilization
Using bio-stimulants
Deal with Psa problems
Improve your productivity in general
Question 28: What is your farming status (full-time or part-time)?
This close question wants to address whether the grower dedicate most of his/her time to cultivate
kiwifruit, or it is considered as an extra income (part-time) of the off-farm work. Reflections can be
seen in the farm management in general.
Farm technical practices
Question 16: What measure do you use the following technical practices? (1=never, 2=sometimes,
3=often, 4=more than often, 5=always)?
In question 16 we addressed several aspects concerning technical practices used to produce optimal
quality kiwifruit. The main focus is given on what practices each farmer is aware of and whether he
knows how to apply them to improve quality and quantity. The question is divided in five groups of
technical practices: canopy management, pollination, soil management, use of bio-stimulants and pest
and diseases management.
Canopy management
Carefully select the canes during winter pruning
Summer pruning
Gel-pruning

78
Tip-squeezing to contain vegetation
Girdling to increase fruit size
Fruit thinning
Canopy management includes winter and spring pruning, wood selection practices and other crop
practices aiming on having an appropriate ratio of leafs/fruits, better interception of light and to
maximize the portioning of carbohydrate to promote fruit development (Patterson & Currie, 2010). By
achieving these practices it is possible to maximize the number of fruit per m² of canopy, their quality
in size and DM and therefore the orchard productivity (Patterson & Currie, 2010; Miller, et al., 2001;
Thorp, et al., 2011).
Pollination
Use more pollination techniques (artificial)
The effect that pollination has on fruit size has been proved by lots of researchers (Hopping & Jerram,
1979; Testolin, 1991; Costa, et al., 1993; Gonzales, et al., 1998; Goodwin, 2000; Costa, 2003;
Patterson & Currie, 2010). The more attention and resources are dedicated to this delicate phase the
more production can be achieved. Among the pollination methods wind, honeybees and artificial
pollination systems have been developed and are commonly known among growers. Often Italian
kiwifruit growers rely only on wind pollination, however, only through complementary pollination
practices good size, marketable fruit can be produced (Asteggiano, et al., 2010). One question concern
using more pollination techniques and the second wants to see how much importance growers give to
the pollination in order to achieve commercial fruit size. The questions follow the same configuration
(very important-not applicable).
Soil management
Analysing the soil and leaves
Supplying the right fertilizers in each physiological phase
Avoid water stress after fruit set
Soil management includes fertilization and irrigation practices. The emphasis here is placed on how
growers deal with these aspects throughout analysis and consultation with experts to correctly supply
the right fertilizer in each phase. The importance of soil and leaves analysis to tailor the fertilization
program to the single orchard needs was claimed by Sher (2008) and Pentreath (2011). Especially after
fruit set Judd (1989) and Miller (1998) water stress can seriously affect fruit growth. The questions
follow the same configuration (very important-not applicable).
Bio-stimulants
Use bio-stimulants to increase fruit size
Lastly, we include in the survey the usage of bio-stimulants. These products increase fruit size and
enhance growers’ profitability (Patterson & Currie, 2010), however, when applied on orchard where
inappropriate cultural techniques were used (scarce pollination, high crop load, inappropriate pruning)
very negative effects can be seen in terms of dry matter and storability (Costa, et al., 2011). We want to
test whether growers are aware of the complication of using bio-stimulators. The questions follow the
same configuration (very important-not applicable).
Pest and diseases management
Monitoring the orchard from Psa symptoms in autumn, winter and spring
Constantly remove the infected parts and burn them
Apply bactericides according

79
Pest and diseases management includes all the practices aimed on preserving the health conditions of
vines and the quality of fruits. One question regards the monitor of the orchard from the Psa. And the
second one refers to whether growers follow cooperative and Zespri procedures to prevent these
diseases. The questions follow the same configuration (very important-not applicable).
Chain factors Within this section we focus on the chain factors such as technical support, information transparency,
innovations, and chain management factors. In each sub-section are reported the principal questions
used.
Question 18: Of which cooperative are you member (1=Apo Fruit, 2=Kiwi Pontino, 3=Intesa,
4=Spreafico, 5=Punto Frutta, Other=6)?
To describe our sample and to define to which cooperative growers are associated we include this
question in the questionnaire. Throughout this question we can also make comparison among
cooperatives’ services and support.
Question 19: How long have you been associated to your cooperative?
This question aims on understanding the time length of the relationship between cooperatives and
growers, whether kiwifruit growers tent to have an independent mind-set “selling their products to
agents offering the best price” (Hewett, 2003); or have a more integrated collaboration that last for
several years in case of long-term relationships.
Question 20: My cooperative informs me about ZESPRI guidelines concerning quality standards
(1=never, 2=few times, 3=sometimes, 4=often, 5=always)?
Question 21: In which measure do you agree with the following statements?
I am satisfied with the technical support provided by my cooperative
I am satisfied with the technical support provided by Zespri
I am satisfied with the advice provided by the suppliers of agricultural products
I am satisfied with my cooperative’s initiatives such as meetings, conferences, field days, trips,
etc.
I am satisfied with the Zespri initiatives such as field days, meetings, etc.
External services are crucial factor in the day-to-day farming decisions (Moock, 1981). Any
combination of inputs managed by the grower with more production-relevant education and technical
services can produce more output (Kilpatrick, 2000). Technical advice is furnished by cooperatives,
Zespri and suppliers of agricultural products. Starting with cooperatives services we attempted to cover
the crucial aspects in line with the literature yielded. The question 16 and 19 reflect the respondent
willingness to participate on the one hand, and the frequency of initiatives provided by cooperatives
and Zespri on the other.
Question 23: Provision of the information (1=completely disagree, 2=disagree, 3=neutral, 4=agree,
5=completely agree)?
The market information provided by my cooperative are transparent
I know who are my cooperative’s buyers
I know the price of the bulk market
I am satisfied with the market information provided by Zespri
I trust the technical and commercial information provided by my cooperative
I trust the technical and commercial information provided by Zespri

80
I am willing to collaborate more with my cooperative
I am willing to collaborate more with Zespri
The information transparency is defined as “the degree of completeness of information, regarding their
own business activities, provided by each company…” (Vaccaro & Madsen, s.d.). According to
Akkermans et al, (2004) “the more supply chain partners work closely together, the more they will
trust each other, and the more data they will dare to share”. Therefore, we asked questions to assess
the perception of the growers in perceiving the transparency, the trust to cooperatives and Zespri.
Question 25: Who is the most important providers of these innovations (1=other growers, 2=suppliers
of agricultural products, 3=cooperatives, 4=Zespri, 5=innovation sellers, 6=external expertise,
7=others)?
Personal characteristics and opinions
Growers’ characteristics such as age, farming status, farming experiences, education and personal
opinions describe the respondents overall conditions and way of thinking. For instance one of our
finding from the literature is that educational level does promote the adoption of innovations and better
collaboration. Age as well determines influences other aspect of the farming system. These questions
have been taken from other surveys, but in almost each growers survey we identify general questions
such as this one.
Question 9: Generally, how satisfied are you with your kiwifruit farming output at present (1=totally
unsatisfied, 2=unsatisfied, 3=satisfied, 4=very satisfied, 5=completely satisfied).
This is to understand what is the overall satisfaction rate of our sample.
Question 10: How do you see the future prospects of your kiwifruit farm (1=very black, 2=black, 3=
neither black nor bright, 4= bright, 5=very bright)?
Question such as this one focus on investigate whether the actual feeling of our population is positive
with regard to the future.
Question 11: Which option best reflects where you might be in five years from now (1=land sold and
retired, 2=land passed on to next generation, 3= farming but with significant income from off-farm
work, 4= farming with most income from farm work, 5=farming kiwifruit as a main activity)?
This nominal question intends to investigate what would be the future of their farm in the next five
years.
Question 22: Please rate the importance to you of each of the following statements (1=not important
at all, 2=unimportant, 3=important, 4=very important, extremely important)?
Share knowledge and information between growers and expertise, technicians, researchers etc.
Visiting top-performing growers’ orchard and provide evidences of the practices adopted
Benchmark your performance with other growers to stimulate inter-farm competition
Question 24: How important are for you the following statements? Please, rate the importance to you
of each of the following statements (1= completely disagree, 2=disagree, 3=neutral, 4=agree,
5=completely agree).
Implementing innovations to enhance farm productivity
Hire new members to the farm management team
Apply new approaches to labour use

81
Adopt new varieties
The recognition and implementation of new technologies and farm management practices are crucial to
improve the farm performance (Bella & Martin, 2009). The adoption rate of agricultural technologies
depends on “a range of personal, social, cultural and economic factors, as well as on the
characteristics of the innovation itself” (Pannell, et al., 2006; Howley, et al., 2012). Here we are
interested in understanding growers concern towards innovations. Who are the innovation facilitators,
and so on.
Question 26: What is your AGE?
Question 27: What is your gender (1=Male, 2=Female)
Question 29: How many years have you been working in the kiwifruit farm?
Question 30: What is your education level (1=elementary school, 2=middle school 13 years old,
3=high school, 4= university)?
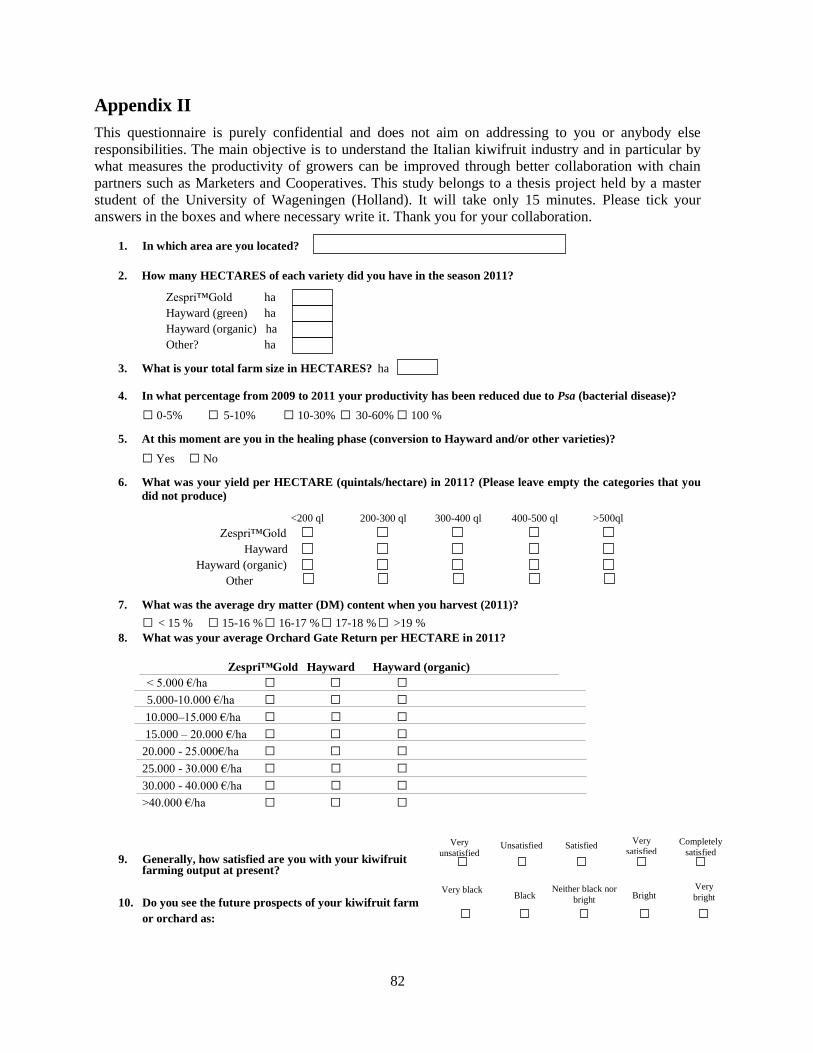
82
Appendix II
This questionnaire is purely confidential and does not aim on addressing to you or anybody else
responsibilities. The main objective is to understand the Italian kiwifruit industry and in particular by
what measures the productivity of growers can be improved through better collaboration with chain
partners such as Marketers and Cooperatives. This study belongs to a thesis project held by a master
student of the University of Wageningen (Holland). It will take only 15 minutes. Please tick your
answers in the boxes and where necessary write it. Thank you for your collaboration.
1. In which area are you located?
2. How many HECTARES of each variety did you have in the season 2011?
Zespri™Gold ha
Hayward (green) ha
Hayward (organic) ha
Other? ha
3. What is your total farm size in HECTARES? ha
4. In what percentage from 2009 to 2011 your productivity has been reduced due to Psa (bacterial disease)?
□ 0-5% □ 5-10% □ 10-30% □ 30-60% □ 100 %
5. At this moment are you in the healing phase (conversion to Hayward and/or other varieties)?
□ Yes □ No
6. What was your yield per HECTARE (quintals/hectare) in 2011? (Please leave empty the categories that you
did not produce)
Zespri™Gold
Hayward
Hayward (organic)
Other
7. What was the average dry matter (DM) content when you harvest (2011)?
□ < 15 % □ 15-16 % □ 16-17 % □ 17-18 % □ >19 % 8. What was your average Orchard Gate Return per HECTARE in 2011?
Zespri™Gold Hayward Hayward (organic) < 5.000 €/ha □ □ □ 5.000-10.000 €/ha □ □ □
10.000–15.000 €/ha □ □ □
15.000 – 20.000 €/ha □ □ □
20.000 - 25.000€/ha □ □ □
25.000 - 30.000 €/ha □ □ □
30.000 - 40.000 €/ha □ □ □
>40.000 €/ha □ □ □
9. Generally, how satisfied are you with your kiwifruit farming output at present?
10. Do you see the future prospects of your kiwifruit farm
or orchard as:
<200 ql
200-300 ql 300-400 ql 400-500 ql >500ql
Very black Very
bright Bright Black Neither black nor
bright
Very
unsatisfied Completely
satisfied Very
satisfied Unsatisfied Satisfied

83
11. Which option best reflects where you might be in five years from now?
□ Land sold and retired
□ Land passed on to next generation
□ Still farming kiwifruit but with significant income from off-farm work
□ Still farming with significant income from farm activities
□ Still farming kiwifruit as main activity
12. How many seasonal workers do you have? Number of employees
13. How many PERMANENT employees do you have?
Number of employees (including temporary Number of employees
workers for more than three months)
14. Farm management
I rely mostly on permanent (specialized) workers
The employees of my farm know the practices
and procedures to manage kiwifruit vines
We have a good team to jointly resolve operational
problems
I always take farm decisions in consultation with
the employees
15. How often do you visit the Zespri Canopy website
Technical
16. Please rate how often do you use these practices
Canopy management
carefully select the canes
during winter pruning
summer pruning
gel-pruning
tip-squeezing to contain
vegetation
girdling to increase fruit size
fruit thinning
use more pollination
techniques (artificial)
Analysing the soil and leaves
Supplying the right fertilizers in
each physiological phase
Avoid water stress after fruit set
Use bio-stimulants to increase
fruit size
Monitoring the orchard from
Psa symptoms
Completely disagree
Strongly agree
Never Once a week Every 6 months
Always Never Sometimes Enough
More
than
Enough
Once
a year Once a
month
Disagree Neither
agree nor disagree Agree

84
Constantly remove the infected
parts and burn them
Apply bactericides according
to Zespri guidelines
17. To what extend you make use of external advisors/technicians/and third parties to get knowledge and
information concerning the following issues:
Managing the canopy
Improve your pollination effectiveness
Managing the fertilization
Using bio-stimulants
Deal with Psa problems
Improve your productivity in general
18. To which cooperative are you member?
□ Apo Fruit □ Kiwi Pontino □ Intesa □ Spreafico □ Punto Frutta Other
19. How long have you been associated to your cooperative?
20. My cooperative informs me about ZESPRI guidelines concerning quality standards
□never □ few times □ sometimes □ often □ always
21. In which measure do you agree with the following statements.
I am satisfied with the technical support
provided by my cooperative
I am satisfied with the technical support
provided by Zespri
I am satisfied with the advice provided
by the suppliers of agricultural products
I am satisfied with my cooperative’s
initiatives such as meetings,
conferences, field days, trips, etc.
I am satisfied with the Zespri initiatives
such as field days, meetings, etc.
22. Please rate the importance to you of each of the following statements:
Share knowledge and information between growers
and expertise, technicians, researchers etc.
Visiting top-performing growers’ orchard and
provide evidence of the practices adopted
Benchmark your performance with other growers
to stimulate inter-farm competition
Never Once a week
Not important Very important Important
Every 6 months
Once
a year Once a month
Of little importance
Extremely
Important
Completely disagree
Strongly agree Neutral Disagree Agree

85
23. Provision of the information
The market information provided by my cooperative are
transparent
I know who are my cooperative’s buyers
I know the price of the bulk market
I am satisfied with the market information provided by Zespri
I trust the technical and market information provided by my
cooperative
I trust the technical and market information provided by Zespri
I am willing to collaborate more with my cooperative
I am willing to collaborate more with Zespri
Innovation
24. How important are for you the following statements? Please, rate the importance to you of each of the
following statements:
Implementing innovations to enhance farm productivity
Hire specialized workers to improve the farm management
Apply new approaches to labour use
Adopt new varieties
25. Who is the most important providers of these innovations?
□ other growers □ Suppliers of agricultural products □ Cooperatives □ Zespri
□ Innovation sellers □ External expertise □ others
26. What is your AGE?
27. What is your GENDER?
□ Male □ Female
28. What is your farming status?
□ Full time □ Part time with income from off-farm work
29. How many years have you been working in the kiwifruit farm?
30. What is your education level?
□ Elementary school □ Middle school (till 13 years old) □ High school (till 19 years old) □ University
31. Your farm is:
□ Family-owned □ Collective-owned or joint venture □ Other forms
Completely disagree
Completely agree Neutral
Disagree
Completely
disagree Strongly
agree Disagree Neutral Agree
Agree
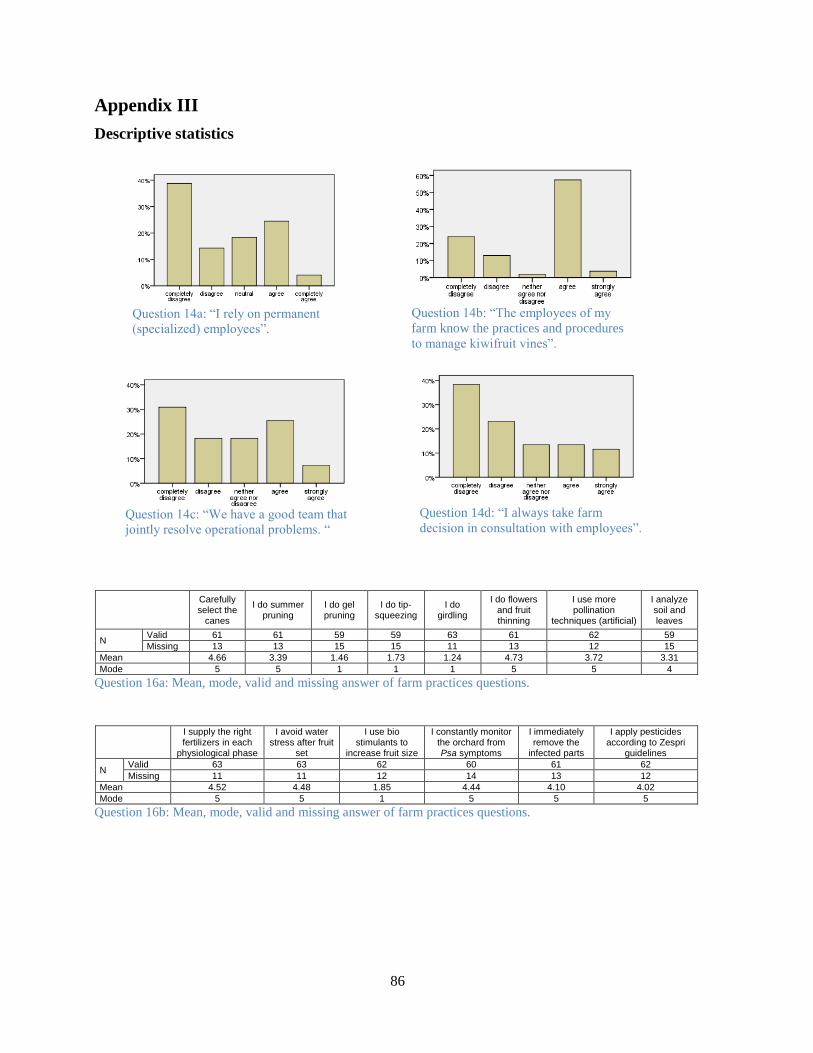
86
Appendix III
Descriptive statistics
Carefully select the
canes
I do summer pruning
I do gel pruning
I do tip-squeezing
I do girdling
I do flowers and fruit thinning
I use more pollination
techniques (artificial)
I analyze soil and leaves
N Valid 61 61 59 59 63 61 62 59
Missing 13 13 15 15 11 13 12 15
Mean 4.66 3.39 1.46 1.73 1.24 4.73 3.72 3.31
Mode 5 5 1 1 1 5 5 4
Question 16a: Mean, mode, valid and missing answer of farm practices questions.
I supply the right fertilizers in each
physiological phase
I avoid water stress after fruit
set
I use bio stimulants to
increase fruit size
I constantly monitor the orchard from Psa symptoms
I immediately remove the
infected parts
I apply pesticides according to Zespri
guidelines
N Valid 63 63 62 60 61 62
Missing 11 11 12 14 13 12
Mean 4.52 4.48 1.85 4.44 4.10 4.02
Mode 5 5 1 5 5 5
Question 16b: Mean, mode, valid and missing answer of farm practices questions.
Question 14a: “I rely on permanent
(specialized) employees”. Question 14b: “The employees of my
farm know the practices and procedures
to manage kiwifruit vines”.
Question 14d: “I always take farm
decision in consultation with employees”. Question 14c: “We have a good team that
jointly resolve operational problems. “

87
Question 21a: “I am satisfied
with the technical support
provided by my cooperative”.
Question 21b: “I am satisfied with
the technical support provided by
Zespri”.
Question 21c: “I am satisfied of
the advice provided by the
suppliers of agricultural products”.
Figure 38: “implementing innovations
to increase farm productivity”.
Figure 38: “hire specialized
employees to improve farm
productivity”.
Figure 38: “apply new approaches
to labour use”.
Figure 38: “adopt new varieties”.
Question 21d: “I am satisfied with
my cooperative’s initiatives such as
meetings, conference, firld days”.
Question 21e: “I am satisfied with
the Zespri’s initiatives such as
meetings, conference, firld days”.

Appendix IV
Correlation analysis
Relationships 1: (6-1) Growers’ productivity → Chain factors
19) 20) 21) In which measure do you agree with the following
statements 23) Provision of the information
Spearman's rho correlation
How long have you been
associated to your cooperative?
My cooperative informs me about the
Zespri guidelines
concerning the quality
standards?
I am satisfied with the technical
support provided by
my cooperative
I am satisfied with the technical support provided by Zespri
I am satisfied with
the advice provided by the suppliers
of agricultural products
I am satisfied with
my cooperative's initiatives
I am satisfied with the Zespri's initiatives
The market information provided by
my cooperative
are transparent
I know who are my
cooperative's buyers
I know the
price of the bulk
market
I am satisfied with the market
information provided by
Zespri
I trust the technical
and market information provided by
my cooperative
I trust the technical
and market information provided by
Zespri
What was your yield of Zespri Gold per
hectare in 2011?
r .040 -.047 -.155 -.586** .105 .050 -.603
** -.282 -.391 -.372 -.313 -.283 -.379
Sig .854 .824 .460 .002 .618 .812 .001 .171 .053 .067 .128 .170 .062
N 24 25 25 25 25 25 25 25 25 25 25 25 25
What was your yield of Hayward per hectare in 2011?
r -.088 -.270 -.198 -.051 .022 -.336* -.144 -.467
** -.421
** -.264 -.278 -.359
* -.361
*
Sig .543 .061 .168 .734 .877 .017 .330 .001 .003 .067 .062 .011 .013
N 50 49 50 47 50 50 48 49 49 49 46 49 47
What was the average Dry Matter
at the harvest of 2011?
r .280 .163 .001 -.230 -.028 .190 -.077 .082 -.150 .018 .081 .124 .003
Sig .057 .273 .992 .128 .849 .195 .613 .581 .309 .906 .595 .402 .985
N 47 47 48 45 48 48 45 48 48 48 46 48 47
What was your OGR per hectare of Zespri Gold in 2011?
r .179 .088 -.108 -.254 .439* .089 -.232 -.263 -.355 -.343 -.238 -.171 -.330
Sig .363 .654 .584 .193 .019 .652 .235 .177 .064 .074 .222 .385 .087
N 28 28 28 28 28 28 28 28 28 28 28 28 28
What was your OGR per hectare of Hayward in 2011?
r .017 -.215 -.201 .023 .029 -.223 .065 -.224 -.305* -.349
* -.397
** -.453
** -.459
**
Sig .909 .143 .166 .879 .841 .124 .668 .121 .033 .013 .006 .001 .001 N 48 48 49 45 49 49 46 49 49 50 46 49 47
**. Correlation is significant at the 0.01 level (2-tailed). *. Correlation is significant at the 0.05 level (2-tailed).
88

Relationships 2: (6-2) Growers’ productivity → Growers’ attitudes
9) 10) 11) 22) Please rate the importance to you of
each of the following statements 23) Provision of the
information 24) How important are for you the following
statements? 26) 29) 30)
Spearman's rho correlation
Generally, how satisfied are you with your actual production?
Do you see the future prospects of your farm as?
Which of the following options reflects
where you might be in five years from now?
Share knowledge and
information between
growers and expertise,
technicians and researchers
Visiting top-performing growers’
orchard and provide
evidence of the practices
adopted
Benchmark your performance with other growers to stimulate inter-
farm competition
I am willing to collaborate
more with my cooperative
I am willing to
collaborate more with
Zespri
Implementing innovations to enhance farm productivity
Hire specialized workers to
improve farm productivity
Apply new approaches
to labour use
Adopt new
variety
What is
your age?
How many years
have you been
working in kiwifruit farm?
What is your
education level?
What was your yield of Zespri Gold per hectare in 2011?
r .225 .121 .012 .361 .272 .288 .132 .199 .260 .283 .361 .551** .251 -.126 -.069
Sig .249 .541 .951 .076 .188 .162 .528 .341 .219 .180 .306 .005 .226 .549 .738
N 28 28 28 25 25 25 25 25 24 24 10 24 25 25 26
What was your yield of Hayward per hectare in 2011?
r .150 .029 .118 -.072 -.001 .056 -.047 -.039 .049 .004 .149 .080 .130 .077 -.123
Sig .277 .837 .394 .612 .996 .691 .748 .794 .743 .976 .488 .591 .369 .593 .390
N 54 54 54 52 52 52 49 47 48 48 24 48 50 50 51
What was the average Dry Matter at the harvest of 2011?
r -.212 .024 .016 .344* .171 .039 .052 .138 .195 -.018 .019 .239 .163 .226 -.021
Sig .131 .864 .912 .015 .241 .790 .724 .356 .184 .905 .931 .101 .268 .123 .886
N 52 52 52 49 49 49 48 47 48 48 24 48 48 48 49
What was your OGR per hectare of Zespri Gold in 2011?
r .407* .453
* .204 .101 .196 .023 -.067 -.106 .277 .323 .478 .512
** .331 .010 -.027
Sig .026 .012 .280 .610 .317 .909 .734 .590 .163 .101 .193 .006 .085 .960 .890
N 30 30 30 28 28 28 28 28 27 27 9 27 28 28 29
What was your OGR per hectare of Hayward in 2011?
r .163 -.118 .076 -.024 .093 -.010 .087 .081 .023 .008 .191 .043 -
.066 .090 -.181
Sig .243 .400 .586 .865 .518 .947 .552 .589 .877 .955 .331 .771 .651 .533 .204
N 53 53 53 51 51 51 49 47 48 48 28 48 50 50 51
**. Correlation is significant at the 0.01 level (2-tailed). *. Correlation is significant at the 0.05 level (2-tailed).
Relationship 3: (6-3) Growers’ productivity → Farm characteristics Spearman's rho
correlation
2) How many hectares of Zespri Gold did you have in
2011?
2 How many hectares of Hayward did you have in
2011?
3 What is your total farm size (ha)?
4 In what percentage from 2009 to 2011 your productivity has been reduced due
to Psa?
5 At this moment are you in the healing phase (conversion to other
varieties)?
What was your yield of Zespri Gold per hectare in 2011?
r .263 .143 -.032 -.077 .174
Sig .194 .535 .870 .702 .377
N 26 21 28 27 28
What was your yield of Hayward per hectare in 2011?
r .307 .070 .031 -.148 -.284*
Sig .135 .626 .826 .294 .040
N 25 51 54 52 53
What was the average Dry Matter at the harvest of 2011?
r .019 .151 .066 .107 -.081
Sig .918 .352 .642 .453 .573
N 33 40 52 51 51
What was your OGR per hectare of Zespri Gold in
2011?
r .197 .327 -.083 -.081 -.064
Sig .297 .160 .662 .676 .738
N 30 20 30 29 30
What was your OGR per hectare of Hayward in 2011?
r .218 .213 .083 -.058 -.309*
Sig .330 .133 .556 .684 .026
N 22 51 53 51 52
**. Correlation is significant at the 0.01 level (2-tailed). *. Correlation is significant at the 0.05 level (2-tailed).
89
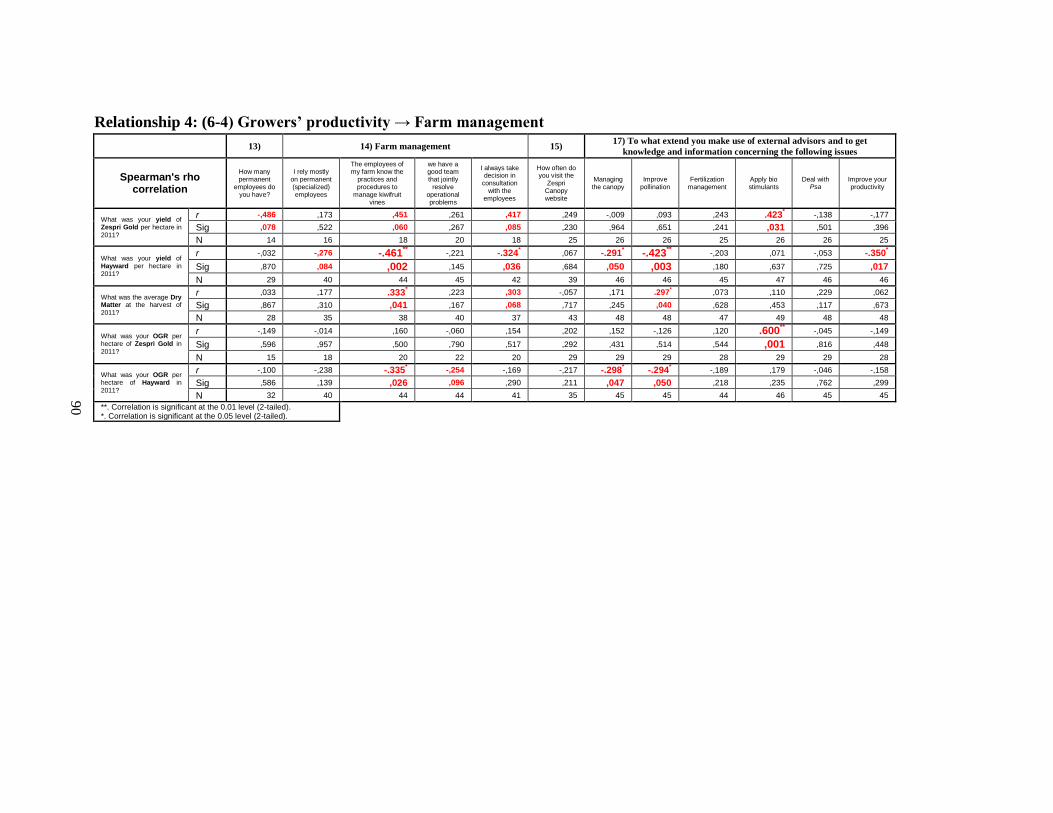
Relationship 4: (6-4) Growers’ productivity → Farm management
13) 14) Farm management 15) 17) To what extend you make use of external advisors and to get
knowledge and information concerning the following issues
Spearman's rho correlation
How many permanent
employees do you have?
I rely mostly on permanent (specialized) employees
The employees of my farm know the
practices and procedures to
manage kiwifruit vines
we have a good team that jointly
resolve operational problems
I always take decision in
consultation with the
employees
How often do you visit the
Zespri Canopy website
Managing the canopy
Improve pollination
Fertilization management
Apply bio stimulants
Deal with Psa
Improve your productivity
What was your yield of Zespri Gold per hectare in 2011?
r -,486 ,173 ,451 ,261 ,417 ,249 -,009 ,093 ,243 .423* -,138 -,177
Sig ,078 ,522 ,060 ,267 ,085 ,230 ,964 ,651 ,241 ,031 ,501 ,396
N 14 16 18 20 18 25 26 26 25 26 26 25
What was your yield of Hayward per hectare in 2011?
r -,032 -,276 -.461** -,221 -.324
* ,067 -.291
* -.423
** -,203 ,071 -,053 -.350
*
Sig ,870 ,084 ,002 ,145 ,036 ,684 ,050 ,003 ,180 ,637 ,725 ,017
N 29 40 44 45 42 39 46 46 45 47 46 46
What was the average Dry Matter at the harvest of 2011?
r ,033 ,177 .333* ,223 ,303 -,057 ,171 .297
* ,073 ,110 ,229 ,062
Sig ,867 ,310 ,041 ,167 ,068 ,717 ,245 ,040 ,628 ,453 ,117 ,673
N 28 35 38 40 37 43 48 48 47 49 48 48
What was your OGR per hectare of Zespri Gold in 2011?
r -,149 -,014 ,160 -,060 ,154 ,202 ,152 -,126 ,120 .600** -,045 -,149
Sig ,596 ,957 ,500 ,790 ,517 ,292 ,431 ,514 ,544 ,001 ,816 ,448
N 15 18 20 22 20 29 29 29 28 29 29 28
What was your OGR per hectare of Hayward in 2011?
r -,100 -,238 -.335* -,254 -,169 -,217 -.298
* -.294
* -,189 ,179 -,046 -,158
Sig ,586 ,139 ,026 ,096 ,290 ,211 ,047 ,050 ,218 ,235 ,762 ,299
N 32 40 44 44 41 35 45 45 44 46 45 45
**. Correlation is significant at the 0.01 level (2-tailed). *. Correlation is significant at the 0.05 level (2-tailed).
90

Relationship 5: (6-5) Growers’ productivity → Farm technical practices
16) Please rate how often do you use these practices
Spearman's rho
correlation
Carefully select the
canes
I do summer pruning
I do gel pruning
I do tip-squeezing
I do girdling
I do flowers and fruit thinning
I use more pollination techniques (artificial)
I analyse soil and leaves
I supply the right fertilizers in each
physiological phase
I avoid water stress after
fruit set
I use bio stimulants to increase fruit size
I constantly monitor the
orchard from Psa symptoms
I immediately remove the
infected parts
I apply pesticides according to
Zespri guidelines
What was your yield of Zespri Gold per hectare in 2011?
r ,063 -,087 .511** -,069 -,026 ,159 ,128 ,197 ,005 -,068 .444
* ,041 ,111 -,108
Sig ,764 ,671 ,009 ,744 ,904 ,437 ,553 ,345 ,979 ,740 ,023 ,841 ,599 ,601
N 25 26 25 25 24 26 24 25 26 26 26 26 25 26
What was your yield of Hayward per hectare in 2011?
r -,069 -,085 ,009 -,172 -,136 -,258 ,163 ,130 ,054 ,120 ,285 -,023 -,153 -,180
Sig ,647 ,576 ,951 ,259 ,375 ,077 ,274 ,380 ,717 ,417 ,052 ,881 ,315 ,232
N 47 46 45 45 45 48 47 48 48 48 47 47 45 46
What was the average Dry Matter at the harvest of 2011?
r ,061 ,139 .425** ,083 ,033 ,023 -,095 ,056 -,099 -,147 -,105 ,241 ,263 .289
*
Sig ,685 ,350 ,003 ,585 ,827 ,873 ,527 ,707 ,498 ,312 ,473 ,095 ,074 ,047
N 47 47 46 46 45 49 47 48 49 49 49 49 47 48
What was your OGR per hectare of Zespri Gold in 2011?
r ,090 ,071 ,365 -,076 -,017 ,085 ,137 ,107 ,099 ,298 .656** ,130 ,083 -,286
Sig ,648 ,716 ,056 ,695 ,934 ,659 ,495 ,588 ,608 ,116 ,000 ,502 ,676 ,132
N 28 29 28 29 27 29 27 28 29 29 29 29 28 29
What was your OGR per hectare of Hayward in 2011?
r ,264 ,035 ,095 -,137 -,239 ,176 .325* ,070 ,138 .342
* .406
** ,067 -,103 -,197
Sig ,076 ,817 ,534 ,381 ,118 ,238 ,027 ,639 ,356 ,018 ,005 ,657 ,506 ,195
N 46 45 45 43 44 47 46 ,197 ,005 -,068 .444* ,041 ,111 -,108
**. Correlation is significant at the 0.01 level (2-tailed). *. Correlation is significant at the 0.05 level (2-tailed).
91

Relationships 6: (1-4) Chain factors → Farm management
13) 14) Farm management 15) 17) To what extend you make use of external advisors and to get
knowledge and information concerning the following issues
Spearman's rho correlation
How many permanent employees
do you have?
I rely mostly on
permanent (specialized) employees
The employees of my farm know the
practices and procedures to
manage kiwifruit vines
We have a good team that jointly
resolve operational problems
I always take decision in
consultation with the
employees
How often do you visit the
Zespri Canopy website
Managing the canopy
Improve pollination
Fertilization management
Apply bio stimulants
Deal with Psa
Improve your productivity
19 How long have you been associated to your cooperative?
r .433** -,066 ,183 ,250 ,071 -,143 ,167 -,043 ,002 ,138 ,161 ,047
Sig ,007 ,658 ,199 ,077 ,629 ,350 ,210 ,749 ,988 ,300 ,228 ,728
N 38 47 51 51 49 45 58 58 57 58 58 57
20 My cooperative informs me about the Zespri guidelines concerning the quality standards?
r ,150 .324* ,241 .328
* ,202 ,055 ,093 -,027 .308
* -.275
* .347
** ,194
Sig ,377 ,028 ,091 ,020 ,169 ,718 ,486 ,840 ,020 ,037 ,008 ,148
N 37 46 50 50 48 46 58 58 57 58 58 57
21 I am satisfied with the technical support provided by my cooperative
r ,131 ,266 .295* .291
* .317
* ,159 ,168 ,166 ,228 -.267
* ,219 .321
*
Sig ,434 ,071 ,036 ,038 ,027 ,292 ,202 ,209 ,085 ,041 ,096 ,014
N 38 47 51 51 49 46 59 59 58 59 59 58
21 I am satisfied with the technical support provided by Zespri
r -,169 -,102 -,055 -,055 ,046 ,079 ,030 -,103 ,080 -.291* ,215 ,167
Sig ,341 ,514 ,710 ,713 ,761 ,600 ,830 ,456 ,564 ,031 ,114 ,228
N 34 43 48 48 46 47 55 55 54 55 55 54
21 I am satisfied with the advice provided by the suppliers of agricultural products
r ,103 ,150 ,212 .313* ,160 -,018 .311
* ,151 ,247 ,144 -,012 ,245
Sig ,531 ,308 ,132 ,024 ,266 ,908 ,016 ,249 ,059 ,273 ,928 ,062
N 39 48 52 52 50 46 60 60 59 60 60 59
21 I am satisfied with my cooperative's initiatives
r .326* .312
* ,210 ,208 ,076 -,040 ,221 ,153 .359
** ,084 .354
** .308
*
Sig ,046 ,032 ,140 ,142 ,602 ,790 ,093 ,249 ,006 ,529 ,006 ,019
N 38 47 51 51 49 46 59 59 58 59 59 58
21 I am satisfied with the Zespri's initiatives
r ,101 ,154 -,056 -,011 -,054 -,109 ,229 ,028 ,244 -,130 .388** .310
*
Sig ,568 ,325 ,706 ,940 ,723 ,464 ,093 ,841 ,075 ,343 ,003 ,023
N 34 43 48 48 46 47 55 55 54 55 55 54
23 I know who are my cooperative's buyers
r ,178 ,129 ,166 ,137 ,107 ,246 -,024 ,020 ,134 -.309* .280
* .268
*
Sig ,278 ,387 ,249 ,339 ,465 ,103 ,858 ,884 ,319 ,018 ,033 ,044
N 39 47 50 51 49 45 58 58 57 58 58 57
23 I know the price of the bulk market
r .354* ,136 .344
* .368
** ,221 .447
** ,145 ,209 ,172 -,222 .292
* .404
**
Sig ,027 ,367 ,016 ,008 ,131 ,002 ,283 ,119 ,206 ,094 ,027 ,002 N 39 46 49 51 48 45 57 57 56 58 57 57
23 I am satisfied with the market information provided by Zespri
r ,150 ,040 ,111 ,157 ,088 .336* ,216 ,066 ,080 -.276
* .371
** ,262
Sig ,382 ,799 ,463 ,286 ,563 ,024 ,116 ,633 ,571 ,041 ,006 ,056
N 36 43 46 48 45 45 54 54 53 55 54 54
23 I trust the technical and market information provided by my cooperative
r ,035 ,176 .287* ,242 ,132 .304
* ,041 ,078 .301
* -,227 .412
** .310
*
Sig ,831 ,236 ,043 ,087 ,366 ,042 ,760 ,559 ,023 ,087 ,001 ,019
N 39 47 50 51 49 45 58 58 57 58 58 57
23 I trust the technical and market information provided by Zespri
r -,158 ,053 ,139 ,131 ,015 ,256 ,001 -,002 ,173 -.323* .354
** ,195
Sig. ,351 ,733 ,350 ,370 ,919 ,085 ,994 ,988 ,210 ,015 ,008 ,154
N 37 44 47 49 46 46 55 55 54 56 55 55
**. Correlation is significant at the 0.01 level (2-tailed). *. Correlation is significant at the 0.05 level (2-tailed).
92
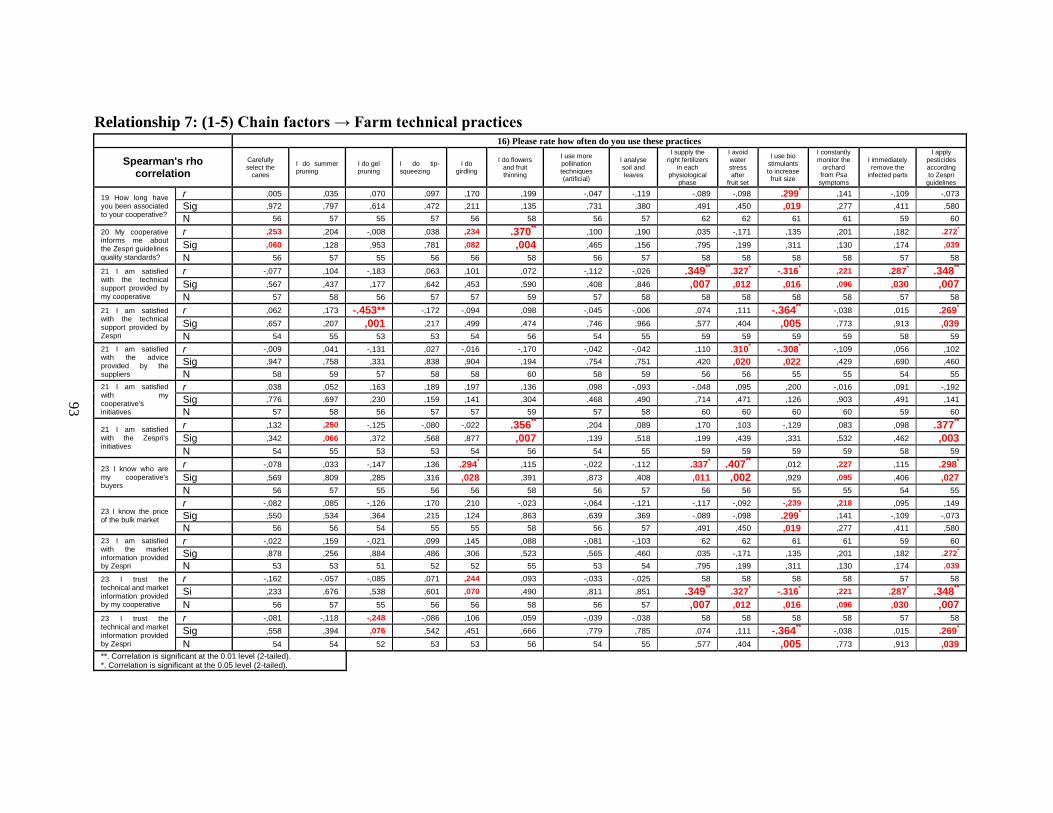
Relationship 7: (1-5) Chain factors → Farm technical practices 16) Please rate how often do you use these practices
Spearman's rho correlation
Carefully select the
canes
I do summer pruning
I do gel pruning
I do tip-squeezing
I do girdling
I do flowers and fruit thinning
I use more pollination techniques (artificial)
I analyse soil and leaves
I supply the right fertilizers
in each physiological
phase
I avoid water stress after
fruit set
I use bio stimulants to increase fruit size
I constantly monitor the
orchard from Psa symptoms
I immediately remove the
infected parts
I apply pesticides according to Zespri
guidelines
19 How long have you been associated to your cooperative?
r ,005 ,035 ,070 ,097 ,170 ,199 -,047 -,119 -,089 -,098 .299* ,141 -,109 -,073
Sig ,972 ,797 ,614 ,472 ,211 ,135 ,731 ,380 ,491 ,450 ,019 ,277 ,411 ,580
N 56 57 55 57 56 58 56 57 62 62 61 61 59 60
20 My cooperative informs me about the Zespri guidelines quality standards?
r ,253 ,204 -,008 ,038 ,234 .370** ,100 ,190 ,035 -,171 ,135 ,201 ,182 .272
*
Sig ,060 ,128 ,953 ,781 ,082 ,004 ,465 ,156 ,795 ,199 ,311 ,130 ,174 ,039
N 56 57 55 56 56 58 56 57 58 58 58 58 57 58
21 I am satisfied with the technical support provided by my cooperative
r -,077 ,104 -,183 ,063 ,101 ,072 -,112 -,026 .349** .327
* -.316
* ,221 .287
* .348
**
Sig ,567 ,437 ,177 ,642 ,453 ,590 ,408 ,846 ,007 ,012 ,016 ,096 ,030 ,007
N 57 58 56 57 57 59 57 58 58 58 58 58 57 58
21 I am satisfied with the technical support provided by Zespri
r ,062 ,173 -.453** -,172 -,094 ,098 -,045 -,006 ,074 ,111 -.364** -,038 ,015 .269
*
Sig ,657 ,207 ,001 ,217 ,499 ,474 ,746 ,966 ,577 ,404 ,005 ,773 ,913 ,039
N 54 55 53 53 54 56 54 55 59 59 59 59 58 59
21 I am satisfied with the advice provided by the suppliers
r -,009 ,041 -,131 ,027 -,016 -,170 -,042 -,042 ,110 .310* -.308
* -,109 ,056 ,102
Sig ,947 ,758 ,331 ,838 ,904 ,194 ,754 ,751 ,420 ,020 ,022 ,429 ,690 ,460
N 58 59 57 58 58 60 58 59 56 56 55 55 54 55
21 I am satisfied with my cooperative's initiatives
r ,038 ,052 ,163 ,189 ,197 ,136 ,098 -,093 -,048 ,095 ,200 -,016 ,091 -,192
Sig ,776 ,697 ,230 ,159 ,141 ,304 ,468 ,490 ,714 ,471 ,126 ,903 ,491 ,141
N 57 58 56 57 57 59 57 58 60 60 60 60 59 60
21 I am satisfied with the Zespri's initiatives
r ,132 ,250 -,125 -,080 -,022 .356** ,204 ,089 ,170 ,103 -,129 ,083 ,098 .377
**
Sig ,342 ,066 ,372 ,568 ,877 ,007 ,139 ,518 ,199 ,439 ,331 ,532 ,462 ,003
N 54 55 53 53 54 56 54 55 59 59 59 59 58 59
23 I know who are my cooperative's buyers
r -,078 ,033 -,147 ,136 .294* ,115 -,022 -,112 .337
* .407
** ,012 ,227 ,115 .298
*
Sig ,569 ,809 ,285 ,316 ,028 ,391 ,873 ,408 ,011 ,002 ,929 ,095 ,406 ,027
N 56 57 55 56 56 58 56 57 56 56 55 55 54 55
23 I know the price of the bulk market
r -,082 ,085 -,126 ,170 ,210 -,023 -,064 -,121 -,117 -,092 -,239 ,218 ,095 ,149
Sig ,550 ,534 ,364 ,215 ,124 ,863 ,639 ,369 -,089 -,098 .299* ,141 -,109 -,073
N 56 56 54 55 55 58 56 57 ,491 ,450 ,019 ,277 ,411 ,580
23 I am satisfied with the market information provided by Zespri
r -,022 ,159 -,021 ,099 ,145 ,088 -,081 -,103 62 62 61 61 59 60
Sig ,878 ,256 ,884 ,486 ,306 ,523 ,565 ,460 ,035 -,171 ,135 ,201 ,182 .272*
N 53 53 51 52 52 55 53 54 ,795 ,199 ,311 ,130 ,174 ,039
23 I trust the technical and market information provided by my cooperative
r -,162 -,057 -,085 ,071 ,244 ,093 -,033 -,025 58 58 58 58 57 58
Si ,233 ,676 ,538 ,601 ,070 ,490 ,811 ,851 .349** .327
* -.316
* ,221 .287
* .348
**
N 56 57 55 56 56 58 56 57 ,007 ,012 ,016 ,096 ,030 ,007
23 I trust the technical and market information provided by Zespri
r -,081 -,118 -,248 -,086 ,106 ,059 -,039 -,038 58 58 58 58 57 58
Sig ,558 ,394 ,076 ,542 ,451 ,666 ,779 ,785 ,074 ,111 -.364** -,038 ,015 .269
*
N 54 54 52 53 53 56 54 55 ,577 ,404 ,005 ,773 ,913 ,039
**. Correlation is significant at the 0.01 level (2-tailed). *. Correlation is significant at the 0.05 level (2-tailed).
93

Relationship 8: (2-4) Growers’ attitudes → Farm management
13) 14) Farm management 15) 17) To what extend you make use of external advisors and to get knowledge
and information concerning the following issues
Spearman's rho correlation
How many permanent
employees do you have?
I rely mostly on permanent
(specialized) employees
The employees of my farm know the practices
and procedures to manage kiwifruit vines
We have a good team that jointly
resolve operational problems
I always take decision in
consultation with the
employees
How often do you visit the
Zespri Canopy website
Managing the canopy
Improve pollination
Fertilization management
Apply bio stimulants
Deal with Psa Improve your productivity
9 Generally, how satisfied are you with your actual production?
r -,115 -,013 -,051 ,006 ,019 -,075 -,062 -,248 -,029 -,088 -,111 -,219
Sig ,475 ,927 ,713 ,966 ,895 ,608 ,633 ,054 ,825 ,496 ,393 ,090
N 41 49 54 55 52 49 61 61 60 62 61 61
10 Do you see the future prospects of your farm as?
r ,108 ,141 ,120 ,075 ,094 ,190 .320* ,206 .356
** ,151 ,225 ,179
Sig ,500 ,334 ,387 ,588 ,506 ,191 ,012 ,112 ,005 ,242 ,081 ,168
N 41 49 54 55 52 49 61 61 60 62 61 61
22 Share knowledge and information between growers and expertise, technicians and researchers
r ,190 ,085 .306* ,243 .334
* ,258 ,173 .275
* .276
* .258
* .382
** .294
*
Sig ,240 ,567 ,026 ,076 ,016 ,077 ,182 ,032 ,032 ,043 ,002 ,021
N 40 48 53 54 51 48 61 61 60 62 61 61
22 Visiting top-performing growers’ orchard and provide evidence of the practices adopted
r ,214 ,094 ,209 ,218 .329* ,119 -,002 .310
* ,052 -,029 .301
* ,225
Sig ,184 ,527 ,132 ,113 ,019 ,419 ,990 ,016 ,694 ,825 ,019 ,083
N 40 48 53 54 51 48 60 60 59 61 60 60
22 Benchmark your performance with other growers to stimulate inter-farm competition
r ,181 ,245 ,142 ,207 ,234 -,016 ,164 .310* ,160 ,055 ,154 .315
*
Sig ,263 ,094 ,309 ,134 ,098 ,914 ,211 ,016 ,225 ,671 ,240 ,014
N 40 48 53 54 51 48 60 60 59 61 60 60
23 I am willing to collaborate more with my cooperative
r ,173 ,184 ,187 ,066 .288* ,208 -,007 ,184 -,016 ,103 ,065 ,174
Sig ,294 ,217 ,193 ,646 ,045 ,171 ,959 ,160 ,906 ,428 ,620 ,185
N 39 47 50 51 49 45 60 60 59 61 60 60
23 I am willing to collaborate more with Zespri
r ,046 ,192 .335* ,199 .491
** ,288 ,076 ,224 ,149 ,095 .338
** ,259
Sig ,789 ,211 ,022 ,170 ,001 ,052 ,573 ,091 ,268 ,478 ,010 ,051
N 37 44 47 49 46 46 58 58 57 58 58 57
24 Hire specialized workers to improve farm productivity
r ,093 .430** ,233 ,206 .471
** ,155 ,098 .295
* ,147 -,049 ,219 .298
*
Sig ,575 ,002 ,097 ,136 ,000 ,304 ,475 ,029 ,288 ,720 ,108 ,027
N 39 48 52 54 51 46 55 55 54 56 55 55
24 Apply new approaches to labour use
r ,195 ,344 ,325 .371* .429
* ,305 ,237 ,185 .265
* -,050 ,078 ,143
Sig ,339 ,058 ,074 ,040 ,014 ,205 ,074 ,165 ,046 ,705 ,561 ,285
N 26 31 31 31 32 19 58 58 57 59 58 58
24 Adopt new variety
r ,264 ,170 ,233 .290* ,267 ,135 ,344 ,156 ,235 ,077 -,062 ,285
Sig ,105 ,248 ,097 ,034 ,058 ,372 ,054 ,393 ,196 ,677 ,737 ,114
N 39 48 52 54 51 46 32 32 32 32 32 32
26 What is your age?
r -,005 -,264 -,202 -,122 -.353* -,058 ,015 ,017 ,152 -,128 ,242 ,208
Sig ,973 ,070 ,151 ,378 ,011 ,703 ,911 ,898 ,260 ,333 ,068 ,118
N 41 48 52 54 51 46 58 58 57 59 58 58
29 How many years have you been working in kiwifruit farm?
r ,137 -,255 -,140 ,040 -.325* -,107 ,041 -,069 -,036 ,155 -,106 -,212
Sig ,394 ,080 ,323 ,775 ,020 ,481 ,759 ,607 ,791 ,242 ,430 ,111
N 41 48 52 54 51 46 58 58 57 59 58 58
30 What is your education level?
r .444** .320
* .398
** ,199 .373
** ,162 -,031 ,189 ,116 -,036 ,151 ,194
Sig ,004 ,025 ,003 ,146 ,006 ,275 ,810 ,144 ,379 ,779 ,244 ,135
N 41 49 53 55 52 47 61 61 60 62 61 61
**. Correlation is significant at the 0.01 level (2-tailed). *. Correlation is significant at the 0.05 level (2-tailed).
94

Relationship 9: (2-5) Personal characteristics and opinions → Farm technical practices 16) Please rate how often do you use these practices
Spearman's rho correlation
Carefully select the
canes
I do summer pruning
I do gel pruning
I do tip-squeezi
ng
I do girdling
I do flowers and fruit thinning
I use more pollination techniques (artificial)
I analyse soil and leaves
I supply the right fertilizers in each
physiological phase
I avoid water stress after
fruit set
I use bio stimulants to increase fruit
size
I constantly monitor the
orchard from Psa symptoms
I immediately remove the infected
parts
9 Generally, how satisfied are you with your actual production?
r ,038 -,085 -.262* ,069 ,105 -,093 -,001 ,143 .347
** ,241 ,228 -,023 -,240
Sig ,769 ,522 ,045 ,604 ,412 ,474 ,996 ,262 ,005 ,059 ,074 ,861 ,063
N 61 59 59 59 63 61 62 63 63 62 62 60 61
10 Do you see the future prospects of your farm as?
r ,003 ,104 ,118 ,148 ,072 ,227 ,178 ,129 ,161 ,116 .336** .300
* ,106
Sig ,984 ,432 ,375 ,262 ,572 ,079 ,167 ,313 ,207 ,369 ,008 ,020 ,416
N 61 59 59 59 63 61 62 63 63 62 62 60 61
22 Share knowledge and information between growers and technicians, researchers, etc.
r ,248 .317* .312* ,165 ,149 ,209 ,186 ,045 -,086 -,086 .257* ,238 ,221
Sig ,056 ,015 ,017 ,213 ,247 ,108 ,151 ,729 ,507 ,508 ,045 ,070 ,090
N 60 58 58 59 62 60 61 62 62 61 61 59 60
22 Visiting top-performing growers’ orchard and provide evidence of the practices adopted
r ,229 ,169 ,237 ,130 ,125 ,137 ,170 -,024 -,036 ,014 ,156 ,165 ,108
Sig ,078 ,205 ,073 ,326 ,333 ,296 ,189 ,854 ,781 ,913 ,231 ,211 ,412
N 60 58 58 59 62 60 61 62 62 61 61 59 60
22 Benchmark your performance with other growers to stimulate inter-farm competition
r ,159 .307* ,173 ,240 ,072 ,106 ,083 ,059 -,059 ,039 ,075 ,021 ,082
Sig ,226 ,019 ,195 ,067 ,579 ,422 ,523 ,646 ,647 ,766 ,566 ,875 ,535
N 60 58 58 59 62 60 61 62 62 61 61 59 60
23 I am willing to collaborate more with my cooperative
r ,229 .268* ,243 ,123 ,239 .321* ,194 .325* .270
* ,015 ,199 ,195 .292
*
Sig ,087 ,048 ,072 ,365 ,070 ,016 ,149 ,013 ,040 ,913 ,134 ,142 ,026
N 57 55 56 56 58 56 57 58 58 58 58 58 58
23 I am willing to collaborate more with Zespri
r ,256 ,261 ,207 ,063 ,105 ,254 ,206 ,188 ,068 -,093 ,165 ,224 ,174
Sig ,062 ,062 ,137 ,655 ,443 ,064 ,131 ,166 ,619 ,494 ,224 ,100 ,204
N 54 52 53 53 56 54 55 56 56 56 56 55 55
24 Hire specialized workers to improve farm productivity
r ,028 .274* ,192 -,016 ,249 ,061 .345
** .334
** ,167 -,024 ,020 ,025 ,203
Sig ,837 ,041 ,156 ,908 ,055 ,647 ,007 ,009 ,203 ,858 ,881 ,851 ,126
N 58 56 56 57 60 58 59 60 60 59 59 58 58
24 Apply new approaches to labour use
r ,140 ,263 ,138 -,131 ,299 -,165 ,202 ,173 ,061 -,008 -,073 -,089 ,082
Sig ,446 ,152 ,458 ,483 ,096 ,375 ,276 ,342 ,738 ,967 ,690 ,628 ,655
N 32 31 31 31 32 31 31 32 32 32 32 32 32
24 Adopt new variety
r .270* .366
** ,218 ,204 ,076 ,174 .270
* ,193 ,137 ,016 .287
* ,087 ,161
Sig ,040 ,006 ,107 ,129 ,563 ,191 ,039 ,139 ,295 ,905 ,028 ,517 ,228
N 58 56 56 57 60 58 59 60 60 59 59 58 58
26 What is your age?
r -.281* -,031 -,011 ,123 -.284
* -,136 ,112 -,160 -,155 ,149 -,196 -,091 -.321
*
Sig ,033 ,820 ,936 ,360 ,028 ,308 ,398 ,221 ,237 ,259 ,136 ,499 ,014
N 58 56 56 57 60 58 59 60 60 59 59 58 58
29 How many years have you been working in kiwifruit farm?
r -,040 -,222 -,122 ,002 ,019 -,075 -,015 -,221 -,119 ,190 -,148 -,090 -,076
Sig ,768 ,101 ,372 ,990 ,886 ,573 ,910 ,090 ,364 ,150 ,264 ,500 ,573
N 58 56 56 57 60 58 59 60 60 59 59 58 58
30 What is your education level?
r ,213 ,144 ,157 ,153 -,040 -,058 -,210 -,017 -,207 ,007 -,091 -,029 -,039
Sig ,105 ,284 ,245 ,257 ,759 ,664 ,106 ,896 ,109 ,956 ,490 ,827 ,768
N 59 57 57 57 61 59 60 61 61 60 60 59 59
**. Correlation is significant at the 0.01 level (2-tailed). *. Correlation is significant at the 0.05 level (2-tailed).
95

Relationship 10: (3-4) Farm characteristics → Farm management
Spearman's rho correlation
13 How many
permanent employees
do you have?
14 I rely mostly on permanent
(specialized) employees
14 The employees of my farm know the
practices and procedures to manage
kiwifruit vines
14 we have a good team that jointly resolve
operational problems
14 I always take decision in
consultation with the
employees
15 How often do you visit the Zespri Canopy website
17 managing
the canopy
17 improve pollination
17 fertilization management
17 apply bio
stimulants
17 deal with Psa
17 improve your
productivity
2 How many hectares of Zespri Gold did you have in 2011?
r .101 -.068 -.247 .099 .172 .077 .043 .156 .100 .197 .078 -.167
Sig .354 .388 .122 .319 .216 .336 .408 .197 .297 .140 .335 .185
N 16 20 24 25 23 33 32 32 31 32 32 31
2 How many hectares of Hayward did you have in 2011?
r .697** .131 .176 .176 .277* .123 .248* .216 .353** .335** .158 .343**
Sig .000 .206 .124 .121 .036 .228 .047 .072 .008 .010 .144 .009 N 32 41 45 46 43 39 47 47 46 48 47 47
3 What is your total farm size (ha)?
r .700** .161 .327** .462** .417** .216 .339** .114 .321** .160 .117 .341**
Sig .000 .135 .008 .000 .001 .066 .004 .191 .006 .107 .185 .004 N 41 49 54 55 52 50 61 61 60 62 61 61
4 In what percentage from 2009 to 2011 your productivity has been reduced due to Psa?
r .309* .349** .108 .022 .060 .112 .093 .232* .112 .187 .124 .284*
Sig .025 .007 .224 .438 .339 .224 .239 .037 .199 .075 .172 .014
N 41 49 52 54 51 48 60 60 59 61 60 60
5 At this moment are you in the healing phase (conversion to other varieties)?
r -.373** -.174 .012 .073 -.054 .053 .016 -.020 -.092 -.097 -.326** -.220*
Sig .008 .116 .465 .297 .353 .358 .452 .439 .244 .229 .005 .045
N 41 49 54 55 52 49 60 60 59 61 60 60
**. Correlation is significant at the 0.01 level (2-tailed). *. Correlation is significant at the 0.05 level (2-tailed).
96

Relationship 11: (4-5) Farm management → Farm technical practices
16) Please rate how often do you use these practices
Spearman's rho correlation
I do summer pruning
I do gel pruning
I do tip-squeezing
I do girdling
I do flowers and fruit thinning
I use more pollination techniques (artificial)
I analyze soil and leaves
I supply the right fertilizers in each
physiological phase
I avoid water
stress after fruit set
I use bio stimulants to increase fruit
size
I constantly monitor the
orchard from Psa symptoms
I immediately remove the
infected parts
I apply pesticides
according to Zespri
guidelines
13 How many permanent employees do you have?
r .261 .039 .266 .486** -.137 -.143 -.315
* -.205 -.182 -.178 -.168 -.116 .207
Sig .062 .413 .058 .002 .210 .203 .031 .112 .141 .147 .161 .250 .113
N 36 34 36 35 37 36 36 37 37 37 37 36 36
14 I rely mostly on permanent (specialized) employees
r -.101 .276* .164 .113 .129 -.036 .019 .265* -.024 -.140 .022 .117 .275*
Sig .251 .033 .138 .230 .197 .406 .449 .037 .438 .176 .443 .219 .032
N 46 45 46 45 46 46 46 46 46 46 46 46 46
14 The employees of my farm know the practices and procedures to manage kiwifruit vines
r .058 .162 .261* .192 .002 -.291* -.263* -.133 -.267* -.247* .041 .253* .223
Sig .345 .134 .035 .093 .493 .019 .031 .176 .029 .042 .389 .039 .060
N 50 49 49 49 51 51 51 51 51 50 50 49 50
14 we have a good team that jointly resolve operational problems
r .064 .085 .202 .299* -.008 -.160 -.047 -.095 -.332** -.233 .062 .254* .210
Sig .329 .279 .080 .018 .478 .131 .370 .251 .008 .050 .332 .038 .072
N 51 50 50 50 52 51 52 52 52 51 51 50 50
14 I always take decision in consultation with the employees
r .169 .269* .273* .314* -.035 -.241* -.088 -.113 -.242* -.302* -.009 .245* .277*
Sig .123 .034 .030 .016 .406 .050 .276 .219 .047 .018 .475 .047 .028
N 49 47 48 47 49 48 48 49 49 48 48 48 48
15 How often do you visit the Zespri Canopy website
r .019 .109 .076 -.075 -.209 -.037 -.022 -.239* -.198 -.071 -.209 -.045 .110
Sig .450 .239 .309 .311 .075 .401 .441 .049 .087 .315 .077 .382 .231
N 47 45 45 45 49 47 48 49 49 48 48 46 47
17 managing the canopy
r .038 .147 .341** .151 -.041 -.268* -.074 -.021 .030 .021 -.041 .109 .068
Sig .387 .136 .004 .129 .377 .020 .287 .435 .409 .436 .377 .204 .301
N 60 58 59 58 61 59 60 61 61 61 61 60 61
17 improve pollination
r .070 .163 .285* .247* -.092 .080 .103 -.105 -.166 -.234* .114 .152 .150
Sig .297 .111 .014 .031 .240 .273 .218 .211 .101 .035 .192 .124 .124
N 60 58 59 58 61 59 60 61 61 61 61 60 61
17 fertilization management
r -.069 .088 .282* .168 .080 .119 .184 .045 .182 -.092 .182 .292* .227*
Sig .302 .258 .016 .105 .272 .184 .081 .367 .082 .242 .082 .012 .041
N 59 57 58 57 60 59 59 60 60 60 60 59 60
17 apply bio stimulants
r -.101 .167 -.261* -.226* -.044 .226* -.006 -.113 -.044 .676** -.100 -.153 -.143
Sig .221 .105 .023 .044 .366 .042 .480 .191 .366 .000 .220 .121 .135
N 60 58 59 58 62 60 61 62 62 62 62 60 61
17 deal with Psa
r .179 .044 .090 .143 .115 .191 .138 .060 .275* -.072 .285* .278* .472**
Sig .085 .371 .249 .142 .188 .073 .147 .323 .016 .290 .013 .016 .000 N 60 58 59 58 61 59 60 61 61 61 61 60 61
17 improve your productivity
r .081 .005 .217 .108 -.089 .115 -.059 -.113 .017 -.094 .059 .010 .050
Sig .270 .485 .051 .212 .247 .193 .328 .194 .448 .236 .327 .469 .351
N 59 57 58 57 61 59 60 61 61 61 61 59 60
**. Correlation is significant at the 0.01 level (1-tailed). *. Correlation is significant at the 0.05 level (1-tailed).
97