Performance Analysis of D-STATCOM and UPQC in Distribution ...
Upload
eng-ahmed-salad-osmanCategory
view
763download
4
RESTRICTED
organisation where research was done)*
OPEN ACCESS
:
I acknowledged that UniversitiTeknologi Malaysia reserves the right as follows:
: ABDIFATAH MOHAMED MOHAMUD
AHMED SALAD OSMAN
ABUBAKAR HASSAN TAKOW
DECLARATION OF THESIS / UNDERGRADUATE PROJECT PAPER AND COPYRIGHT
UNIVERSITY OF HORMUUD
Author’s full name
: ENHANCEMENT OF POWER QUAITY IN
DISTRIBUTION SYSTEM BY D-STATCOM
Academic Session 2014/2015
I declare that this thesis is classified as:
CONFIDENTIAL (Contains confidential information)
(Contains restricted information
I agree that my thesis to be published as online open access
( full text)
1. The thesis is the property of University of Hormuud.
2. The Library of University of Hormuud has the right to make copies for the
purpose of research only.
3. The Library has the right to make copies of the thesis for academic exchange.
NOTES : If the thesis is CONFIDENTIAL or RESTRICTED, please attach with the letter from
The organisation with period and reasons for confidentiality or restriction.
Title
√
as by the
*
(Contains restricted information as specified by the
organization where research was done)
We acknowledged that University of Hormuud reserves the right as follows
SIGNATURE OF SUPERVISOR
SAID OSMAN MOHAMMED
NAME OF SUPERVISOR
DATE: 1 AUGUST 2015
Certified by:
We declare that this thesis is classified as:
Author’s full names
Title ENHANCEMENT OF POWER QUALITY IN DISTRIBUTION
SYSTEM BY USING D-STATOCM
Academic year

ENHANCEMENT OF POWER QUALITY IN DISTRIBUTION SYSTEM BY
USING DISTRIBUTION STATIC DCOMPENSATOR (D-STATCOM)
Ahmed Salad Osman
Abdifatah Mohammed Mohammud
Abubakar Hassan Takow
A report submitted in fulfillment of the requirements for the award of the degree of
Bachelor of Engineering (Electrical)
FACULTY OF ELECTRICAL ENGINEERING
UNIVERSITY OF HORMUUD
AUGAST 2015

“I declare that I have read this project and in my opinion this project report is
adequate in term of scope and quality for the purpose of awarding a Bachelor‘s
degree of Electrical Engineering”
External examiners
MOHAMUD FARAH ALI :
ALI ADDAWE GEDI :
Signature
Signature :
Name of Supervisor : SAID OSMAN MOHAMMED
Date : AUGUST 1 2015

II
“We hereby declared that the following thesis entitled ‘power quality
enhancement in distribution system Using Distribution Static Compensator (D-
STATCOM)’ is the result of our own effort except as cited in the references”
Signature :
Name : ABDIFATAH MOHAMMED MOHAMMUD
Signature :
Name : AHMED SALAD OSMAN
Name : ABUBAKAR HASSAN TAKOW
Signature :
Date : AUGUST 1 2015

III
ACKNOWLEDGMENT
First of all we thank Allah SWT, who gave us the opportunity and strength to
carry out this project.
We would like to express our sincere appreciation to our final year project
supervisor, Eng Said Osman Mohamed for encouragement, guidance, critics and give
US a lot of motivation in order to complete this project.
We also want to express our warm thanks to my friends who supported us in
this work for all their help, support, interest and valuable hints. We really appreciate
it and will forever be indebted to them.
Lots of thanks to our beloved mothers and fathers, for their love and support
and always stay beside us and always pray for us to success in study.

IV
ABSTRACT
Nowadays, the term power quality has becoming increasingly concerned by
both electric utilities and end users of electrical power. Power quality problems such
as transient, short duration variations (sags, swells and interruption), voltage
imbalance, waveform distortion (dc offset, harmonics, inter harmonics, notching and
noise), voltage fluctuations and power frequency variations can affect the
performance of the equipment at consumer. The most affected due to these problems
is industrial customers who use a lot of sensitive equipment. They have suffered a
huge loss due to this problem. Thus, device such as Static Synchronous Compensator
(STATCOM), Dynamic Voltage Restorer (DVR) and Uninterruptable Supply (UPS)
has been created to solve this problem. D-STATCOM has it respective limitations
such as capabilities and functions. The project will focus on how the D-STATCOM
can regulate the voltage in order to improve the voltage sag in the system. A
simulation was carried out using MATLAB/Simulink software to obtain the result.
When there was an overload in the system, high current will flow through the line
and the consequence voltage sag will occur. In order to improve voltage sag, D-
STATCOM was connected to the system. In this project, the performance of D-
STATCOM both before and after saging will be analyzed.
V
TABLE OF CONTENTS
Chapter Title Page
Declaration
Dedication Ii
Acknowledgment Iii
Abstract Iv
Table of contents V
List of tables Viii
List of figures Ix
List of symbols Xi
List of abbreviations Xii
List of appendices Xiii
1 INTRODUCTION
1.1 introduction 1
1.2 problem statement 3
1.3 objectives 4
1.4 scope 4
1.5 structure of the thesis 5
2 LITERATURE REVIEW
2.1 introduction 6
2.2 power quality problems and solutions 7
2.2.1 introduction 7
2.2.2 power quality problems 8
2.2.2.1 interruption 8
2.2.2.2 sags 9
VI
2.2.2.3 swells 10
2.2.2.4 harmonics 11
2.2.2.5 harmonic distortion 12
2.2.2.6 harmonic source from commercial loads 13
2.2.2.7 harmonic source from industrial loads 13
2.2.2.8 voltage spikes 14
2.2.2.9 voltage unbalance 14
2.2.3 sources of power quality problems 15
2.2.3.1 power electronic devices 15
2.2.3.2 IT and office equipment 15
2.2.3.3 arcing device 16
2.2.3.4 load switching 16
2.2.3.5 large motor starting 17
2.2.3.6 sensitive equipments’ 17
2.2.3.7 storm and environment related damage 17
2.2.3.8 capacitor switching 18
2.2.4 power quality improvement techniques 18
2.3 voltage sag 19
2.3.1 sources of voltage sag 19
2.3.2 factors of voltage sag 20
2.3.3 types of volts that cause voltage sag 21
2.3.3.1 single line to ground fault 22
2.3.3.2 double line to ground fault 22
2.3.3.2 three phase fault 22
2.3.4 impacts of voltage sag 23
2.4 custom power devices 25
2.4.1 Dynamic Voltage Restorer (DVR) 25
2.4.1.1 introduction 25
2.4.1.2 DVR components 26
` 2.4.1.3 operating principle of DVR 29
2.4.2 unified power quality conditioner (UPQC) 30
2.4.2.1 introduction 30
VII
2.4.2.1 classification of UPQC and operating principle 31
2.4.3 distribution static compensator (D-STATCOM) 33
2.4.3.1 introduction 33
2.4.3.2 main components of a D-STATCOM 35
2.4.3.3 distribution static compensator configuration 37
2.4.3.4 D-STATCOM V-I characteristic 38
2.4.3.5 basic configuration and function of D-STATCOM 40
2.4.3.6 calculation of voltage injection by D-STATCOM 42
2.4.3.7 operation modes of a D-STATCOM 43
3 METHODOLOGY
3.1 introduction 46
3.2 project flow 46
3.3 simulations 48
3.3.1 system implementation in MATLAB/simulink 50
3.4 conclusion 57
4 RESULT AND DISCUSSION
4.1 introduction 58
4.2 simulations without insertion D-STATCOM scheme 58
4.3 Simulations with installation D-STATCOM system 63
4.4 conclusion 67
5 CONCLUSION AND RECOMMENDATION
5.1 conclusion 69
5.2 recommendations 70
5.3 references 71
5.4 Appendix A 75
Appendix B 76
Appendix C 77
VIII
LIST OF TABLES
Table Title Page
4.1 Results of voltage sags for different types of faults 62
4.2 Results of voltage sags after compensation for different types of
faults
63

IX
LIST OF FIGURES
Figure Title Page
2.1 Short interruptions 8
2.2 Long interruptions 9
2.3 Voltage sag or dip 10
2.4 Voltage swell 11
2.5 Harmonics 12
2.6 Voltage spike 14
2.7 Voltage unbalance 15
2.8 Disturbance caused by energizations capacitor bank 18
2.9 Dynamic Voltage Restorer( DVR) scheme diagram 26
2.10 Filter placed in high voltage side 28
2.11 Filter placed in low voltage side 28
2.12 Schematic diagram of DVR based on compensation system 29
2.13 Single line representation of conventional UPQC 32
2.14 General arrangement of STATCOM 35
2.15 Schematic diagram of STATCOM 38
2.16 D-STATCOM V-I characteristic 39
2.17 Schematic diagram of D-STATCOM 42
2.18 No-load mode (Vs=Vi) 44
2.19 Capacitive mode (Vi>Vs) 44
2.20 Inductive mode (Vs>vi) 45

X
3.1 Flow chart of project process 47
3.2 Flow chart of simulation process 49
3.3 The main circuit implemented in MARLAB/simulink 51
3.4 Sample run time of simulation 51
3.5 Configuration for fault generator 52
3.6 Energy storage and voltage source converter 53
3.7 Configuration of voltage source converter 54
3.8 Control scheme design for the D-STATCOM 54
3.9 Control mechanism 55
3.10 D-STATCOM system connected in distribution system 56
4.1 Main circuit of distribution system without D-STATCOM 59
4.2 Reference signal before three phase fault applied 59
4.3 Reference signal for each phase A,B and C before fault respectively 59
4.4 Reference signal after the three phase fault applied of voltage sag 61
4.5 Voltage output at feeder A for each phase A,B and C respectively 61
4.6 Voltage at load point for TLG,DLG and SLG without D-STATCOM 63
4.7 Main circuit of distribution system with D-STATCOM 64
4.8 Three phase output voltage after compensation 64
4.9 Output voltage at feeder A after compensation for each phase A,B.
and C respectively
65
4.10 Voltage at load point for TLG,DLG and SLG with D-STATCOM 66

XI
LIST OF SYMBOLS
R Resistance
L Inductance
Zth Thevenin equivalent
Vi Output voltage
Vs Source voltage
Ish Shunt current
Il Load current
IS Source current
VTH Thevinin voltage
ƞ Line angle
α Thevenin voltage angle
ß Thevenin impedance angle
VL Load voltage
Ssh Complex power exchange

XII
LIST OF ABBREVIATIONS
FACTS Flexible ac transmission systems
STATCOM Static compensator
D-STATCOM Distribution static compensator
IEEE Institution of electrical engineering
RMS Root mean square
SLG Single line to ground
DLG Double line to ground
TLG Triple line to ground
SVC Static VAR compensator
VSC Voltage source converter
PWM Pulse width modulator
Vi Output voltage
Vs Source voltage
DC Direct current
AC Alternating current
PI Proportional integral
PLC Programmable logic controllers
DVR Dynamic voltage restorer
UPQC Unified power quality conditioner
IGBT Insulated gate bipolar transistor
GTO Gate thyristor turn off

XIII
LIST OF APPENDICES
APPENDIX TITLE PAGE
A Configuration and specification
B The main circuit of distribution system without D-
STATCOM system
C The main circuit of the distribution system with D-
STATCOM system

1
CHAPTER ONE
INTRODUCTION
1.1 Introduction
Our country Somalia is low power quality which caused different problems,
one of those problems we fix in our thesis project, knowing that the cost of electricity
in Somalia is very high that caused by lack of power quality so our thesis will
concentrate how to enhance the power quality , therefore we require high power
quality , reliable electrical power and rising number of distorting loads may leads to
an increased awareness of power quality both by clients and utilities , the mainly
general power quality problems today are voltage sags, harmonic distortion and low
power factor .
Power quality is one of the most important aspect concerned by utility and
residential customer, especially when it becomes a very sensitive issue for industrial
consumer [1]. Power quality means the ability to receive pure electrical voltage
sinusoidal waveform at delivery point [1]. It is obvious that everyone will aim to gain
the excellent quality in every situation no matter in which aspect, and power quality
should not be excluded. Power quality problems are not new issues in a electrical
power system and every electrical user might want to minimize their effect on
electrical equipment so that the highest possible power quality could be obtained by
all of the users [2].
2
The changes of the voltage supplied even for very short period of time, which
were not really mostly taken attention by public, is now very expensive due to their
cause of improper operation and shut down situation in manufacturing plants. For
the purpose of getting the highest efficiency in production besides for sustaining of
the most reasonable operating cost, electrical customers were now eager for the high
power quality. For instance, disturbances like voltage sag, which was introduced by
the higher fault on the network, will influenced more number of customer victims
[1]. Therefore, a proper study and determination about the power quality
disturbances should be conducted seriously as well as the extenuation manners not
only to fulfill customers demand, but also increase the reputation and quality of
electrical power in our country.
In order to further understand the sophisticated power quality problems, the
recordings of all disturbances are now done by installing the on-line power quality
monitoring system. Besides that, various professional surveys had conducted in date
[1]. Hence, it is obviously that power quality disturbances are now became the very
crucial topic for us to understand and study more. It means that the detection and
mitigation of voltage sag in electrical power system are also very important to
achieve improvement in power system so that their benefits could be experienced by
people in whole country.
From decades to decades, power electronics have been introduced and
developed further due to its economical and power saving advantages. Flexible AC
Transmission System (FACTS) are widely used to solve power quality disturbances
and Distribution Static Compensator (DSTATCOM) is one of the members of
FACTS devices family which is effective and flexible. Its function is similar to the
usage of synchronous transformer. In other words, DSTATCOM is a fast-respond
reactive power source compensator, which can properly solve varies power
disturbances with appropriate controller designed, such as voltage sag, voltage swell,
flicker, harmonic, and transient. It contains an injection transformer, a voltage source
converter (VSC) and a PWM controller with specific control scheme in order to
perform its main function efficient and effectively. In this thesis, the function of

3
DSTATCOM in voltage mitigation was mainly be discussed and it is one of the most
important function of D-STATCOM devices.
1.2 Problem statement
Electronic equipment have been evolving to more sensitive than their
processors 10 or 30 years ago in world. The sensitivity of the equipment are
increasing and at the same time companies become much stricter to the loss of
production time caused by their decreasing in profit margins besides competitive
ability [3]. Since electronic devices are developed more and more advance
nowadays,
the tolerance and sensitivity to the power quality disturbances for customers have
drastically reduced.
Voltage sag has been considered as one of the most affective power quality
problems for industrial users. It is because voltage sag not only cause technical
problems like power disruptions but also introduces economic loss. Majority of
voltage sags and voltage dips are normally originated by faults [4]. Also, this
problem might cause industrial customers suffer from fluctuation in production rates,
incorrect operation of equipment, flicker of lighting system, tripping of drives, and
inaccurate data obtaining [5].
The most important power quality problem is voltage sags. Based on records
by TNB, 80% of power quality complaints in the world were traced to be related to
voltage sag [6]. Equipment such as process controllers, programmable logic
controllers (PLC) and robotics becoming more sensitive to voltage sags due to the
complexity of the equipment itself increase. This sensitive equipment that used by
industrial customers suffer a huge loss of revenue and it can lead to dangerous
situation because of voltage sag.

4
Mitigation is a very important process. If mitigation could not be done
effectively, it is obviously very hard for the utilities and electrical consumers to
satisfy to the quality of the electricity they obtain. Although there is a lot of power
disturbance improving method being applied to power electrical system other than
DSTATCOM, it provides extremely flexible function in doing this. The reason
behind in this statement is because DSTATCOM are able to improve not only
voltage sag problems, but also the flickers, voltage swell and more power
distribution problems by implementing a proper controller. Also, its control system
act very fast so it could alter the magnitude and phase of voltage almost instantly.
1.3 objectives
The research objectives to be achieved in this project are:
To determine the causes and impacts of power quality problems, specifically
voltage sag.
To simulate the mitigation of voltage sag efficiently using DSTATCOM in
MATLAB
To determine the effectiveness of DSTATCOM in voltage sag mitigation
1.4 Scope
Although there are a lot of power quality disturbances could be observed in
electrical power system, the only power quality to be improved in this project is
voltage sag due to the time constraint. Moreover, the method for voltage sag
mitigation which was discussed in this project is by using Distribution Static
Compensator (DSTATCOM).
5
The modelling and simulation were conducted by using the software of
MATLAB Simulink. The test system to simulate voltage sag problems was designed
and built based on the electrical power system applied in the world. The voltage sag
occurred due to three phase fault, double line to ground fault and single line to
ground fault were simulated. The waveform was analyzed and compensated after
applying DSTATCOM model with special control algorithm to the test system.
1.5 Structure of the thesis
This report consists of five main chapters. In chapter one basically discussed
about related issues with the whole project such as the project background, problem
statement, objectives of the project and the scope of the project. Project background
was discussed about power quality problems nowadays with an increased awareness
of power quality both by customers and utilities. Problems statement and objective of
the project also was mention in this chapter. Scope of the project mention about the
characteristic of the distribution system tested and the type of fault applied in this
project.
For chapter two, it is more details about definition and related theory for
power quality problems and voltage sags. Besides that, a detailed explanation about
D-STATCOM device also include in this chapter.
Next, in chapter three it is discussed about the method used to implement this
project. This project used MATLAB/Simulink software to simulate the distribution
systems condition that is with installed D-STATCOM device and without installed
D-STATCOM device.
Chapter four is about result and discussion. All the results obtained from the
simulation was recorded and discussed in this chapter. Finally, conclusion and
recommendation was made and was stated in chapter five.

6
CHAPTER TWO
LITERATURE REVIEW
2.1 Introduction
The issues like low voltage, voltage dip, voltage sag, etc. have been major
challenge faced by power engineer since three to four decades. Even through
transmit of electricity is getting complex and sophisticated day by day, there is no
end for hunt of a regulated voltage profile, in earlier stages or methods improvement
was done by conventional devices such as synchronous condensers, tap changing
transformer, capacitor placement etc, before the development of a STATCOM ways
to improve power quality is using shunt capacitors to improve power factor, shunt
capacitors are used in rating from 15 KVAR to 10000 KVAR. Small banks of
capacitors up to few hundred KVAR rating are used on individual distribution
circuits of customers. Capacitor banks of 500-3000 KVAR are used in small
distribution substations and those will still larger rating at large substations.
Capacitors are installed either in groups at one central location, say at the primary or
the secondary of transformer or individually on each motor or branch circuit feeding
a group of motors. They are arranged in three phase banks connected in star or delta,
another way to improve power quality is using synchronous condensers to improve
power factor, synchronous condensers is when the KVAR requirements is small, it
can be met through static capacitors. However when requirements exceed 10,000
KVAR it is generally more economical to use the synchronous condensers [7].

7
A synchronous condenser is essentially an over excited synchronous motor;
generally it does not supply any active mechanical power. The excitation of the
machine is varied to provide the necessary amount of the leading KVAR, but a new
dimension has achieved for improvement power quality known as DSTATCOM,
DTATCOM is better for above types of improvement because DSTATCOM has
solved more problems such as low power factor, voltage sag, voltage dip, harmonics
etc, while other two types of improvement only fix poor power factor and etc, that is
the why of DSTATCOM is more important in our distribution system.
2.2 Power quality problems and solutions
2.2.1 Introduction
A power quality problem is defined as "an incidence manifested in voltage,
current or frequency deviations, which results in failure or disoperation of end-use
equipment” Commercial customers have become more exacting in their command
for relative 'quality' of power they purchase, variations in flow or voltage can
actually damage and disrupt sensitive electronics equipment like computers and
microprocessors.
Customers and utilities have a shared responsibility in the mitigation of
voltage variation. Mitigation of the effects on consumer devices from voltage
variations can be achieved only if utilities work with manufacturers in the design of
consumer products so that the products function during normal utility operation.
Different types of power quality problems, customer load profiles and power quality
improvement techniques are discussed in this chapter.
8
2.2.2 Power Quality Problems
Power quality is influenced among other factors by utility operations,
customer load types and equipment designs. Distribution utilities and their
customers, along with their engineering equipment manufacturers and vendors,
generate, propagate and receive power quality problems. Electrical disturbances can
develop from problems within the customer's facility, even though the supply voltage
is constant. Achieving power quality demands a united effort between the utility and
the customer [8].
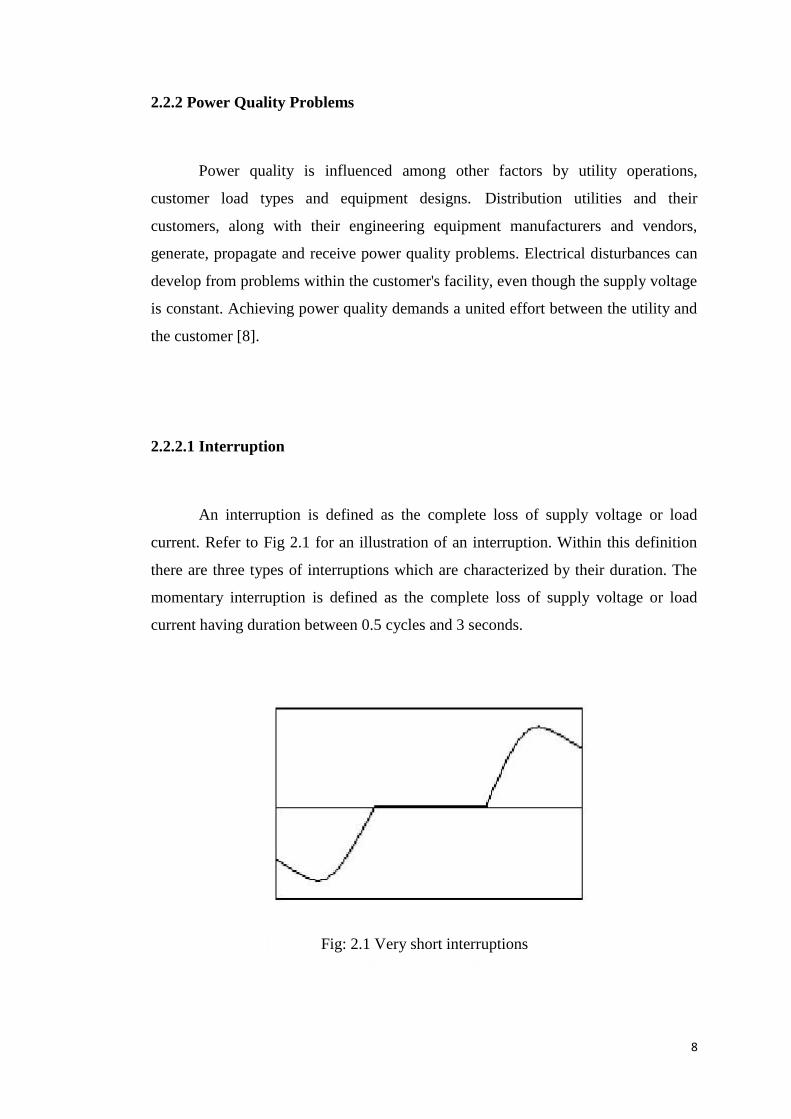
2.2.2.1 Interruption
An interruption is defined as the complete loss of supply voltage or load
current. Refer to Fig 2.1 for an illustration of an interruption. Within this definition
there are three types of interruptions which are characterized by their duration. The
momentary interruption is defined as the complete loss of supply voltage or load
current having duration between 0.5 cycles and 3 seconds.
Fig: 2.1 Very short interruptions

9
The temporary interruption is the complete loss lasting between 3 seconds
and 1 minute and the long term interruption or outage is an interruption which has
duration of more than 1 minute. The causes of interruptions are myriad and too
numerous to outline in detail but normally result in the operation of a system
protective device, e.g., a fuse or automatic breaker, which is utilized to isolate the
source of the system fault. Common sources of interruptions include lightning,
animals, trees, vehicle accidents and equipment failure.
2.2.2.2 Sags
Voltage sags (dips) are short-duration reductions in rms voltage caused by
short-duration increases of the current, typically at another location than where the
voltage sag is measured. The most common causes of over currents leading to
voltage sags are motor starting, transformer energizing and faults [9].
Fig: 2.2 Long interruptions

10
Voltage sags have been mainly associated with short circuit incidences. Fault
occurrences elsewhere can generate voltage sags affecting consumers differently
according to their location in the electrical system. Starting large motors can also
generate voltage sags, although usually not so severe.
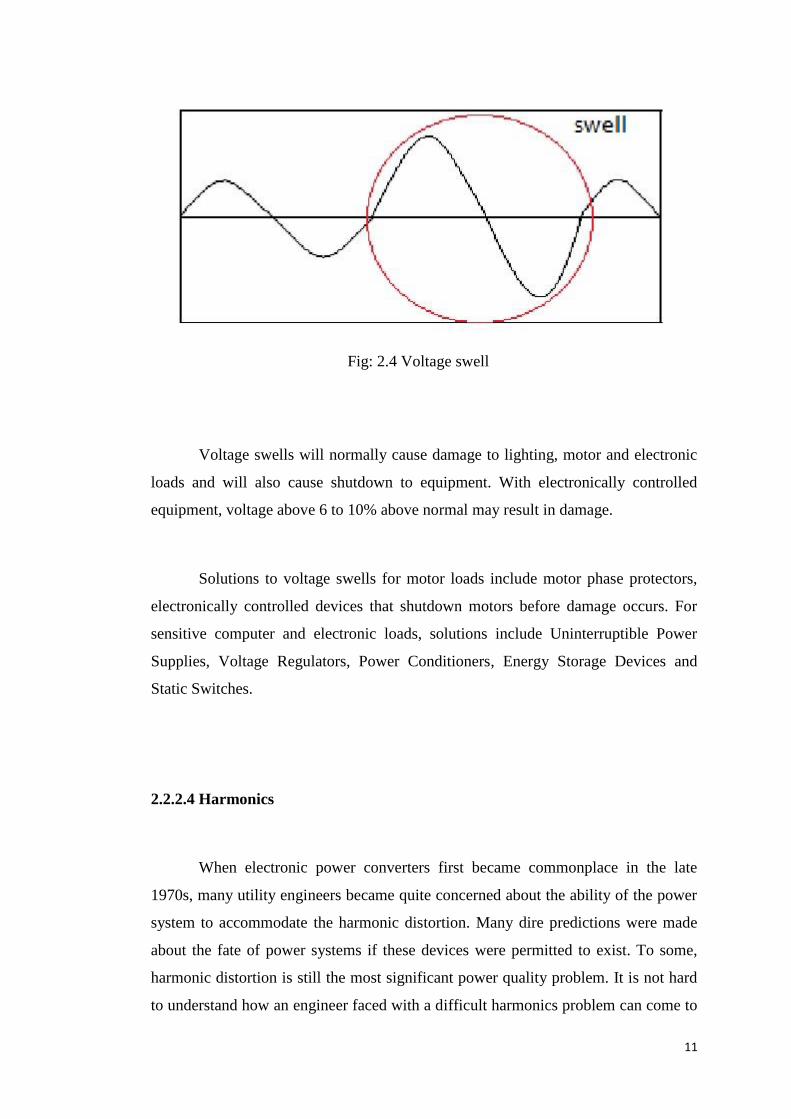
2.2.2.3 Swells
Swell is an RMS increase in the AC Voltage, at the power frequency, for
duration from a half a cycle to a few seconds. Voltage can rise above normal level
for several cycles to seconds.
Voltage swells can originate internally in building wiring or externally on
power lines. Voltage swells are the least frequent of the power line problems
representing only about 2 to 3% of all power problems occurring to industry studies
[9].
Fig: 2.3 Voltage sag or dip
11
Voltage swells will normally cause damage to lighting, motor and electronic
loads and will also cause shutdown to equipment. With electronically controlled
equipment, voltage above 6 to 10% above normal may result in damage.
Solutions to voltage swells for motor loads include motor phase protectors,
electronically controlled devices that shutdown motors before damage occurs. For
sensitive computer and electronic loads, solutions include Uninterruptible Power
Supplies, Voltage Regulators, Power Conditioners, Energy Storage Devices and
Static Switches.
2.2.2.4 Harmonics
When electronic power converters first became commonplace in the late
1970s, many utility engineers became quite concerned about the ability of the power
system to accommodate the harmonic distortion. Many dire predictions were made
about the fate of power systems if these devices were permitted to exist. To some,
harmonic distortion is still the most significant power quality problem. It is not hard
to understand how an engineer faced with a difficult harmonics problem can come to
Fig: 2.4 Voltage swell
12
hold that opinion. Harmonics problems counter many of the conventional rules of
power system design and operation that consider only the fundamental frequency
[10].
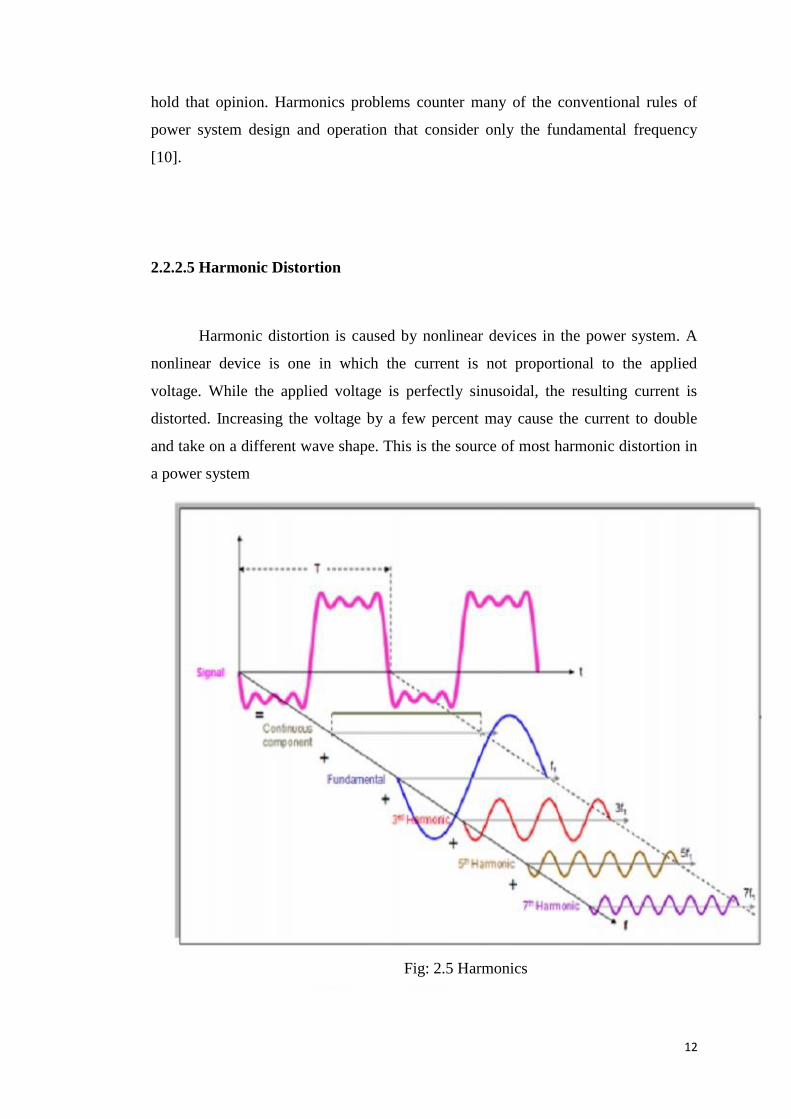
2.2.2.5 Harmonic Distortion
Harmonic distortion is caused by nonlinear devices in the power system. A
nonlinear device is one in which the current is not proportional to the applied
voltage. While the applied voltage is perfectly sinusoidal, the resulting current is
distorted. Increasing the voltage by a few percent may cause the current to double
and take on a different wave shape. This is the source of most harmonic distortion in
a power system
Fig: 2.5 Harmonics

13
2.2.2.6 Harmonic Sources from Commercial Loads
Commercial facilities such as office complexes, department stores, hospitals
and Internet data centers are dominated with high efficiency fluorescent lighting with
electronic ballasts, adjustable speed drives for the heating, ventilation and air
conditioning loads, elevator drives and sensitive electronic equipment supplied by
single phase switch-mode power supplies. Commercial loads are characterized by a
large number of small harmonic-producing loads. Depending on the diversity of the
different load types, these small harmonic currents may add in phase or cancel each
other. The voltage distortion levels depend on both the circuit impedances and the
overall harmonic current distortion.
2.2.2.7 Harmonic Sources from Industrial Loads
Modern industrial facilities are characterized by the widespread application of
nonlinear loads. These loads can make up a significant portion of the total facility
loads and inject harmonic currents into the power system, causing harmonic
distortion in the voltage. This harmonic problem is compounded by the fact that
these nonlinear loads have a relatively low power factor.

14
2.2.2.8 Voltage Spikes
Very rapid variation of the voltage value for durations from a some
microseconds to few milliseconds is Voltage spike. These variations may accomplish
thousands of volts. This is due to lightning, switching of lines or power factor
improvement capacitors, disconnection of heavy loads.
2.2.2.9 Voltage Unbalance
Voltage differences in a three phase system in which the three phase angle
differences or the three voltage magnitude differences between them are not equal.
Fig: 2.6 Voltage spikes

15
2.2.3 Source of Power Quality Problems
2.2.3.1 Power Electronic Devices
Power electronic devices viz. Rectifiers, Inverters, Choppers etc. are
nonlinear loads that produce harmonic distortion and can be vulnerable to voltage
sags if not sufficiently protected.
2.2.3.2 It and Office Equipment
IT equipment power provisions consist of a switched mode power supply
(SMPS) and are the reason of a significant increase in the level of 3rd, 5th and 7th
Fig: 2.7 Voltage Unbalacne
16
harmonic voltage distortion in current years. Because the third harmonic is a 'triplen'
harmonic it is of zero order phase sequence and therefore adds in the neutral of a
balanced three-phase system. The increasing use of IT equipment has led to concern
of the increased overloading of neutral conductors and also overheating of
transformers.
2.2.3.3 Arcing Device
Electric arc furnaces, arc welders and electric discharge lamps are all forms
of electric arcing devices. These devices are highly non linear loads. The results of
arc furnaces are difficult to mitigate, balancing the phases with other furnaces will
not always be effective as arc furnaces are operated in various modes, leading to
phase imbalance. Arc welders normally cause transients in the local network due to
the intermittent switching and therefore some electronic equipment may necessitate
safeguard from the impulsive spikes generated [11].
2.2.3.4 Load Switching
The result of load switching on the voltage is normally encountered in the
form of transient activity. This kind of transient might occur as the effect of
switching in a heavy single-phase load [12]. Other apparatus can be protected from
these switching transients by electrically isolating them from the affecting apparatus.

17
2.2.3.5 Large Motor Starting
The energetic nature of induction machines means that they draw current
depending on the mode of operation, during starting this current can be as high as six
times the standard rated current. This increased loading on the local network has the
effect of causing voltage sag, the magnitude of which is reliant on the system
impedance.
2.2.3.6 Sensitive Equipments
Equipment manufacturers are planning and manufacturing ever more
complicated equipment, much of which is increasingly vulnerable to variations in
power quality. There are many concerns relating to the subject of equipment
sensitivity and the effect of power quality occurrences on perceptive equipment.
2.2.3.7 Storm and Environment Related Damage
Lightning strikes are a reason of transient over voltages frequently leading to
faults on the electricity supply network. Lightning does not have to strike a
conductor in order to introduce transients onto the local network. Impulses can be
made if lightning strikes near a conductor. The local ground potential can be move
up by a nearby strike leading to neutral current flowing to earth via a remote ground.

18
2.2.3.8 Capacitor Switching
The capacitor bank is being switched on to compensate for reactive power
losses to maintain the voltage and energy transmission competence of the
transmission grid [13]. Notice that this wave shape also has the wave shape
disturbance occurring at the peak of the sine wave.
2.2.4 Power Quality Improvement Techniques
Nonlinear loads generate harmonic currents that can propagate to other
locations in the power system and ultimately return back to the source. Therefore,
harmonic current propagation creates harmonic voltages throughout the power
systems [14]. Many mitigation techniques have been proposed and implemented to
sustain the harmonic voltages and currents within recommended levels.
High power quality equipment design,
Harmonic cancellation,
Dedicated line or transformer,
Optimal placement and sizing of capacitor banks,
Fig: 2.8 Disturbance caused by the energization of a capacitor bank

19
Derating of power system devices, and
Harmonic filters (passive, active, hybrid) and custom power devices such as
active power line conditioners (APLCs), DVR, DSTATCOM and UPQC.
2.3 Voltage Sag
The definition of voltage sag is a short decrease in voltage magnitude for
duration of time. Based on the IEEE defined standard in the year 1995, the definition
of voltage sag is the reduction of rms voltage from 0.1 to 0.9 pu for a duration of 0.5
cycle to 1 minute [15]. Meanwhile, the meaning of voltage sag might be varied in
terms of duration and magnitude depending on the authority.
It is clarified in terms of duration and retained voltage, normally been
described by using nominal rms voltage remaining at the lowest point when sag
occurs. In other words, voltage sag is also defined as the full energy needed is unable
delivered to the load, which might bring serious effect depends by the load type [16].
2.3.1 Sources of voltage sag
There are three main sources of voltage sags. One of the causes is starting of
large motor loads either on the affected site or by a consumer on the same circuit.
Secondly, it may also originated by the faults on other branches of the supply
network. Thirdly, it might because of the faults in the internal supply scheme of the
consumer’s installation [16].
Voltage sags noticed on the supply network is primarily originated by the
electric short circuit on the electrical supply system. The impact of short circuit is
current rise substantially and hence bigger voltage drops in the impedances of the

20
supply system. The major cause fundamentally contain a breakdown in the dielectric
between 2 structures are kept at different potentials. These structures are proposed to
be insulated from each other [16].
It is a fact that overvoltage is the main culprit contributes to short circuit by
forcing the insulation over its ability. One of the natural phenomena that contribute
to this observation is lightning. Besides, there are some occurrences can weaken,
devastate and bridge the insulation. Such as consequences of other weather effects,
the knocking or contact of animals, vehicles, excavating equipment as well as the
ageing effect [16].
Conveying energy from multiple sources to multiple loads, like motors,
lighting, heating and electronic devices, is conducted by the typical electricity supply
system. The whole system is a single, integrated and dynamic system. It brings the
meaning of any different of voltage, current, impedance, etc. at one point
immediately cause a difference at every other point on the system [16].
Since our country is implementing three phase supply systems, the short
circuit will happen between phases, phases and neutral or phase and ground. When
short circuit occurs at a point, the voltage on the system is dropped to approximately
the same at almost every other point. In order to recover this problem in supply
systems, protective devices are installed to isolate the short circuit from the source.
This sudden declining and companion with recovery stated of voltage are called as
voltage sags [16].
2.3.2 Factors of Voltage Sag
There are various factors can induce the voltage sag problem in real world.
Normally, it is brought by the abrupt increase in loads, especially inductive loads. As

21
we mentioned in previous texts, short circuits or usually known as faults are the
major coming source of the voltage sag occurrence.
Some characteristics of loads like the switching of large loads, starting of
transformers, energizing of large motors and the fluctuation of large magnitude are
all potentially convert the current to effect which is very much similar to short circuit
current. As a result, the resulting changes of voltage will also similar to the
drastically increasing voltage in short circuits. In this situation, they could also be
classified as voltage sags [16].
Due to the supply and installation of cable are dimensioned for normal
running Current, the starting current is very large and affect voltage to fall in the
supply network As well as installation site. This kind of voltage sags caused by
initial currents will occur from one to a few seconds or ten seconds, which is much
longer and less deep to the network fault voltage sags [16].
In short, the causes of voltage sags could be summarize by following [17].
1. Switching of heavy loads
2. Unbalanced load of a three phase system.
3. Remote of rural location from power system.
4. Long distance from a distribution transformer with interposed loads.
5. Grid systems which is not reliable.
6. Equipment not appropriate for local supply.
2.3.3 Types of Faults That Cause Voltage Sag
In this thesis, voltage sags which are caused by faults in an electrical power
system, are the main concerns and were discussed in detail. There are three type of
faults that will probably cause the voltage sags to occur, such as single line to ground
fault, double line to ground fault, and three phase fault [18]. The three phase fault is

22
categorized as balance or symmetrical fault while single line to ground fault and
double line to ground fault are belong to unsymmetrical faults. Three of the faults
will lead to the occurrence of voltage sags with different waveforms.
2.3.3.1 Single Line to Ground Fault
Single line to ground (SLG) fault is the most common fault which will occur
in real electrical power system. The cause of SLG fault might due to lightning
strikes, tree branches, animal contact like bird contact, and more. It is not a fresh
situation that single phase voltage dips to thirty percent of the nominal voltage or less
than that occurred in industrial plants [16].
2.3.3.2 Double Line to Ground Fault
Double line to ground (DLG) fault might happen due to bad weather,
wrecking of the utility poles and tree branches. In this case, two phase voltage sag
will occur and might be noticed on other feeders from same situation [16].
2.3.3.3 Three Phase Fault
Three phase fault is the least to be noticed but it still has the probability to
cause voltage sag and should not be neglected. The situation that may cause three
phase fault to exist is switching or tripping of three phase circuit breaker or switch,
which will introduce the three phase voltage sags in the system. Meanwhile, starting
a large motor will also lead to the happening of three phase voltage sag in a electrical
power system [16].
23
2.3.4 Impact of Voltage Sag
As discussed in Section 2.3, voltage sag will cause abnormalities in voltage
magnitude reduction. These impacts might affect users and utility, and it is a very
annoying problem to the industrial customers. Hence, it is quite crucial for modern
engineers to deeply understand the main effect and obvious impact so that the power
quality could be improved to maximum level. It is not only beneficial to all the
electrical equipment users but also contribute to the enhancement of electrical field
reputation. Perhaps the customers will also lost confident and make complains to the
electricity supplier once the reputation degrade.
In general, the effects of voltage sags mainly contributed to production rates
fluctuates, abnormal functioning equipment, dimming of lighting systems, variable
speed drives shut down to avoid damage, relays and contractors drop out and even
the unreliable data in equipment test or calibration [18].
The symptoms of voltage sags might not obvious and common for residential
customers but it is not a fresh issue for industrial users. Therefore, it is encouraging
to study the effects of voltage sag to industrial equipment. Electrical equipment
which are now so integral to industrial and commercial power system, will easily
break down if exposed to a voltage, current or frequency deviation. Before solid-state
electronics are well developed, power quality was not studied since the impact on
most loads connected to electrical distribution systems is ignorable. When an
induction motor underwent voltage sag, it did not turn off automatic but only operate
in less power until the sag was over. The same situation happened on incandescent or
fluorescent lighting systems in a facility and it reacted by shortly reduced the lumen
output.
In contrast come to nowadays, contractors and engineers always emphasize
on installing specialized equipment to prevent the happening of unwanted occurrence
due to the high sensitivity equipment and complicated process as well as the
expensive repairing cost.
24
In term of electronic equipment, the effect of voltage sags is meaning about
how much energy is being transferred into the power supply. If insufficient energy is
passing into the power supply which is caused by voltage sag, the DC voltage
received by the IC decrease resulting to the shutting down, locking down or data
garbling of device to occur. If the device shuts down, it will normally restart once the
energy return into the supply. It is because electronic devices need a more
manipulated electrical environment than most other loads. For instance,
programmable logic controls (PLC) system and inverter.
On the other hand, motors are vastly tolerant to voltage sags besides voltage
Swells. Motors only have very small response to voltage variations except during the
experiencing of extremely low or extremely high r.m.s magnitudes. Since motors are
manipulated by electronic drive controllers, the effect on electronic equipment will
also be concerned. When the magnitudes are abruptly large or voltage sags occur
often, it will stress the windings on the stator, which is potentially damage the
premature motor. Besides that, extreme sags may also leads to insufficient rotational
inertia and resulting to decline of performance or effectiveness. Also, if it occur
frequently, the motor may draw high inrush currents often enough to trip a breaker.
Furthermore, majority of the lighting system are tolerant of voltage sags and
Voltage swells. Incandescent system will simply or continuously light brighter or
dimmer and make it produce annoying visual effect besides overall lifespan might be
affected. The sudden change in brightness is usually known as flicker.
For sensitive equipment in industrial plants, it is a fact that severe swells may
stress components to the point of broken down, but less disturbance or damage could
be notice other than that. The responsiveness of system towards load when expose to
voltage sag might determine the problems impact. It is hard to deny that huge value
of voltage sag could result in tripping of breakers, blowing of fuses or damage the
electronic components such as PLC control devices.
25
2.4 Custom power devices
2.4.1 Dynamic Voltage Restorer
2.4.1.1 Introduction
Dynamic Voltage Restoration (DVR) is a method and apparatus used to keep
up, or restore, voltage sags, or spikes in voltage supply to sustain operational electric
load. frequently used in manufacturing areas requiring significant power to run
tools/equipment, and utility plants, this custom device mitigates potential damage to
equipment and undesirable slowdowns to the production line caused by an abrupt
change in electric load. This method uses critical devices such as an automatic
transfer switch and IGBT Modules in order to operate. DVRs are now a developed
option in industry to decrease the impact of voltage sags to sensitive loads. The use
of DVR in power quality applications is rising. Although, the most popular
application of DVR is to manage voltage sags (swells) but the harmonics and power
factor correction may also be achieved through robust control schemes. To get a
number of benefits to industrial, commercial, and residential customers is by
employing and installing DVR in whole system. Reduce in shut down time of
process industries, small losses in the production process and reduction of insulation
damage on transformers, and smooth operation of sophisticated electronic
equipment’s are few of them. Proliferation of sensitive load has opened the venues
for DVR application in all consumer categories. DVR has variety applications in
transmission and distribution systems. It is a series compensation device, DVR has
more protection to sensitive electric loads from power quality problems such as
voltage sags, swells, unbalance and distortion through power electronic controllers
that use voltage source converters (VSC). The first DVR was installed in North
America in 1996 - a 12.47 kV system located in Anderson, South Carolina. Since
then, DVRs have been applied to defend critical loads in utilities, semiconductor and

26
food processing. Today, the most efficient power quality devices in solving voltage
sag harms are the dynamic voltage restorer. The basic theory of the dynamic voltage
restorer is to inject a voltage of required magnitude and frequency, so that it can
restore the load side voltage to the desired amplitude and waveform even when the
source voltage is unbalanced or distorted. usually, it employs a gate turn off thyristor
(GTO) solid state power electronic switches in a pulse width modulated (PWM)
inverter structure. The DVR can generate or absorb independently controllable real
and reactive power at the load side. In other words, the DVR is made of a solid state
DC to AC switching power converter that injects a set of three phase AC output
voltages in series and synchronism with the distribution and transmission line
voltages [19]. The schematic diagram of dynamic voltage restorer (DVR) is shown in
figure 2.9
2.4.1.2 DVR Components
Voltage Source Converter (VSC): a voltage source converter is a power
electronic system consisting of a storage device and switching devices, which can
generate a sinusoidal voltage at any required frequency, magnitude, and phase angle.
When VSC is in the DVR can temporarily restore the supply voltage or to generate
Fig: 2.9 Dynamic Voltage Restorer(DVR) schematic diagram

27
the part of the supply voltage which is missing. The missing voltage is the difference
between the nominal voltage and the actual. The VSC is based on some kind of
energy storage that will provide the converter with a DC voltage. The solid state
electronics in the converter is then switched to get the desired output voltage [20].
Injection transformer: injection transformers employed in the dynamic
voltage restorer plays a vital role in ensuring the maximum reliability and
effectiveness of the restoration scheme. It is connected in series with the distribution
feeder. he Injection / Booster transformer is a specially designed transformer that
attempts to limit the coupling of noise and transient energy from the primary side to
the secondary side. Its main tasks are first It connects the DVR to the distribution
network via the HV-windings and Transforms and couples the injected compensating
voltages generated by the voltage source converters to the incoming supply voltage.
Second In addition, the Injection transformer serves the purpose of isolating the Load
from the system (VSC and control mechanism [20].
Passive Filters: passive filters are used to convert the PWM inverted pulse
waveform into a sinusoidal waveform. This is achieved by removing the unnecessary
higher order harmonic components generated from the DC to AC conversion in the
VSC, which will distort the compensated output voltage. These filters can be placed
either in the high voltage side (load side) as shown in figure 2.10 or in the low
voltage side (inverter side) of the injection transformers as shown if figure 2.11 . The
advantage of the inverter-side filter is that it is on the low-voltage side of the series
transformer and is closer to the harmonic source. Using this scheme, the high-order
harmonic currents will be prevented from penetrating into the series transformer thus
reducing the voltage stress on the transformer [20].

28
Energy storage device: During voltage sag, the DVR injects a voltage to
restore the load supply voltages. The DVR needs a source for this energy. That
source of energy is an energy storage device. Some energy storage devices are dc
capacitors, batteries, super-capacitors, superconducting magnetic energy Storage and
flywheels. The capacity of energy storage device has a big impact on the
compensation capability of the system. Compensation of real power is essential when
large voltage sag occurs [20].
Fig: 2.10 Filter placed in high voltage side
Fig: 2.11 Filter placed in Low voltage side [20]

29
2.4.1.3 Operating Principles of DVR
In figure 2.2 is a DVR compensated single phase system. Let us assume that
source voltage is 1.0 Pu and we want to regulate the load voltage to 1.0 Pu. Let us
denote the phase angle between V s and VL as δ. In this analysis, harmonics are not
considered. Further we assume that during DVR operation, real power is not required
except some losses in the inverter and the non ideal filter components. These losses
for the time being are considered to be zero. This condition implies that the phase
difference between Vf and is should be 90o. Let us first consider a general case to
understand the concept [21].
Apply Kirchhoff voltage law (KVL) in circuit of figure 2.12 is
Fig: 2.12 Schematic diagram of a DVR based compensation in adistribution system

30
Note that in the above circuit Is = IL =I. The load voltage VL can be written
in terms of load current and load impedance as given below
Using (2.1), the source voltage can be expressed as in the following.
With the help of above equation, the relationship between load voltages and
source voltage and DVR voltages can be expressed as below
2.4.2 Unified Power Quality Conditioner (UPQC)
2.4.2.1 Introduction
UPQC is a custom power device and consists of combined series active
power filter and shunt active power filter. Series active power filter that compensates
2.1
2.2
2.3
2.4
31
voltage harmonics, voltage unbalance, voltage flicker, voltage sag/swell and shunt
active power filter that compensates current harmonics, current unbalance and
reactive current. UPQC is also known as universal power quality conditioning
system, the universal active power line conditioner and universal active filter. It is a
common operation of series and shunt active conditioner. Shunt active power filter
have capability of the current compensation, series active power filter have capability
of voltage compensation allow mitigation of various power quality problem. The
function of unified power quality conditioner is to eliminate the disturbances that
affect the performance of the critical load in power system. In other words, the
UPQC has the capability of improving power quality at the point of installation on
power distribution systems. The UPQC, therefore, is expected to be one of the most
powerful solutions to large capacity loads sensitive to supply voltage flicker and
voltage unbalance. The UPQC, which has two inverters that share one dc link, can
compensate the voltage sag and swell, the harmonic current and voltage, and control
the power flow and voltage stability. Besides, the UPQC can also compensate the
voltage interruption if it has some energy storage or battery in the dc link [22].
2.4.2.2 Classification of UPQC And Its Operating Principle
The UPQC are classified in many different ways based on: a power inverter
topology that is used as the power conversion unit. The system configuration of the
conventional UPQC consists of the shunt active power filter that is placed on the
right side with respect to the series active power. Both the shunt and series active
power filters are based on the six-switch VSC topology. Both the shunt and series
VSCs are connected to a common dc-link. In the three phase three wire DG system,
only the three-phase balanced sensitive and non-linear load can be connected due to
inexistence of a neutral wire. Thus, the three-phase source currents which flow
through the distribution network are balanced and (3n + 3) harmonic free, where n =
0, 1, ∞. A single line representation of UPQC as shown in figure 2.13 [22].

32
The shunt active power filter is connected in parallel with respect to the
distribution network. It is controlled in the current control mode and solves current
power quality problems, thus, it operates as a controlled current source. Another key
component of the shunt active power filter is its interfacing passive filter. Its
configuration typically varies among two types such as a coupling inductor and a
parallel LC filter [23]. The main function of all of these types is to mitigate high-
frequency current switching harmonics. Moreover, the choice of the passive filter
type generally depends on a selected control method for the shunt active power filter.
The coupling inductor is typically used with linear controllers. Non-linear control
techniques might be implemented in combination with the parallel LC filter [24].
The series active power filter is connected in series with the distribution
network using three single phase transformers. It operates as a controlled voltage
source and handles voltage related power quality problems we mentioned in above
section. In contrast to the shunt active power filter only one type as the parallel LC
filter is employed in the series active power filter [25]. Similarly, it compensates
high-frequency voltage switching harmonics. The dc-link in the conventional UPQC
Fig: 2.13 Single line representation of conventional UPQC

33
is usually formed as a single capacitor. It interconnects two VSCs, which create well
known back-to-back topology, and maintains constant dc-bus voltage, if the power
storage unit is not connected. Thus, different dc-bus voltage control techniques are
developed such as: the proportional-integral (PI) - controller-based approach, fuzzy-
PI controller, optimized controller, PID controller and unified dc voltage
compensator to name a few. The PI-controller-based approach is the most commonly
used.
2.4.3 DSTATCOM
2.4.3.1 Introduction
STATCOM is stand for Static Compensator. It is one of the FACTS family
devices. As we know FACTS devices stand for Flexible AC Transmission Systems.
It consists of a group of power electronic devices such as IGBT, GTO and transistor.
FACTS Devices functioning as same as other power system controllers such as
transformer tap changers, phase shifting transformers, passive reactive compensators,
and synchronous condensers [26]. To categorize the FACTS Devices, it can be seen
by the way they connected to the power systems, either in shunt, series on in shunt-
series connection.
STATCOM can be used on alternating current electricity transmission
networks. Basically a STATCOM is a system that relates closely with power
electronic device. One of the power electronic device that be used in STATCOM is
voltage source converter (VSC) .Voltage source converter functioning as a source or
supplier. It will provide a reactive AC and active AC power to an electrical system.
Usually a STATCOM is installed to support electricity networks that have a poor
power factor and often poor voltage regulation. Besides that, STATCOM can also be
used in wind energy, voltage stabilization, and harmonic filtering. It also may be

34
used for the dynamic compensation of power transmission system, providing voltage
support and increased transient stability margins. However, the most common use of
STATCOM is for voltage stability [27].
The concept of STATCOM was disclosed by Gyugyi in 1976, In 1995, the
first 100 MVA STATCOM was installed at the Sullivan substation of Tennessee
Valley Authority in northeastern Tennessee, United States. This unit is mainly used
to regulate 161 kV bus during the daily load cycle to reduce the operation of the tap
changer In 1996, the National Grid Company of England and Wales designed
dynamic reactive compensation equipment with inclusion of a STATCOM of 150
MVA range. Confidence in the STATCOM principle has now grown sufficiently for
some utilities to consider them for normal commercial service. Japan (Nagoya),
United States, England and Australia (QLD) also use STATCOM in practice.
The general arrangement of STATCOM is shown in figure 2.14 .STATCOM
system functioning as same as static VAR Compensator (SVC). Both of them
provide shunt compensation by using a voltage source converter. The basic principle
of operation of STATCOM is generation of a controllable AC voltage source behind
a transformer leakage reactance by a voltage source converter connected to a DC
capacitor. The voltage difference across the reactance produce active and reactive
power exchanges between the STATCOM and power system [26].
A D-STATCOM consists of Voltage Source Converter (VSC), a DC energy
storage device, a capacitor, and a coupling transformer to connect the D-STATCOM
through it in shunt to the distribution network.

35
2.4.3.2 Main Components of (D STATCOM)
D-STATCOM consists of three main components that is Voltage Source
Converter (VSC), Energy Storage Circuit, and it Controller system. Each one of this
component play an important role to ensure that D-STATCOM can operate wisely
without have any problems.
Voltage Source Converter (VSC) is one of the power electronic devices.
VSC is the most important component in D-STATCOM and it can generate a
sinusoidal voltage waveform with any required magnitude, with any required phase
angle and also with any required frequency. Usually VSC is mostly used in
Adjustable Speed Drive but it also can be used to mitigate the voltage sags. VSC is
used to replace the voltage or to inject the ‘missing voltage’. The missing voltage can
be defined as the difference between the actual voltage and the nominal voltage [29].
Fig: 2.14 General arrangement of statcom

36
Normally, the converter is based on some kind of energy storage which will get the
supply from the DC voltage. This converter is used the switching based on a
sinusoidal PWM method. The PWM offers simplicity and good response. The device
that used for the switching is an IGBT power electronic device.
Energy Strorage Circuit: The purpose of energy storage is to maintain the
DC side voltage of VSC. It can be capacitor or DC source, e.g. battery. Traditional
STATCOM only has DC capacitor, thus; only reactive power can be injected to the
power system by STATCOM, whereas both active and reactive power can be
injected to the power system by STATCOM if DC source is used. In energy storage
circuit, the DC source was connected in parallel with the DC capacitor. DC source is
act as a battery that will supply a power meanwhile the DC capacitor is the main
reactive energy storage element. It carries the input ripple current of the converter.
To charged the DC capacitor, it could be used either a battery source or it could be
recharged by the converter itself [30].
Filter and Control part: As the Pulse-Width Modulation (PWM)
technique is used in VSC, the output voltage of VSC has switching ripple, which
bring harmonics into the current injected to the power system. These harmonics will
affect the voltage quality of the power system. Therefore, a relatively small reactor is
installed between VSC and the point of the system which the D-STATCOM is
connected, to filter those harmonics in the current. The filter can be L-filter, LC-filter
and LCL-filter.
The aim of the controller system is to maintain the constant voltage
magnitude at the point where a sensitive load is connected under system
disturbances. The control system element can only measured the RMS voltage
magnitude that measured at the load point. For the controller system there is no
requirements of the reactive power measurements. The input for the controller
system is an error signal. This error signal is obtained from the reference signal
measured at the terminal voltage and RMS voltage magnitude that measured at the
load point. First of all, this error signal will enter to the sequence analyzer block

37
which is functioning to measure the harmonic level in that signal. Then, the PI
controller will process this error signal and come out with the output in term of the
angle, ∂. This angle can drive the error to zero. Next, this angle will be summed with
the phase angle of the supply voltage which is assumed to be 120 to produce the
suitable synchronizing signal, required to operate the PWM generator [31]. Then,
this angle will be submitted to the PWM signal generator. PWM generator will
generate the sinusoidal PWM waveform or signal.
2.4.3.3 Distribution Static Compensator Configuration
In its most basic form, the STATCOM configuration consist of a two level
voltage source converter (VSC), a dc energy storage device, a coupling transformer
connected in shunt with ac system, and associated control circuit [28].Figure 2.15
depicts the schematic diagram of the STATCOM. The VSC will convert the DC
voltage across the storage device into AC output voltages that are in phase and
coupled with the AC system through the reactance of coupling transformer. Since the
AC output voltage connected directly with the coupling transformer, the exchange of
active and reactive powers can be easily made between the converters and the AC
system. The active and reactive power can be exchanged directly by adjusting the
phase angle between the converter output voltage and the bus voltage at the point of
common coupling.

38
There are many types of FACTS device such as Static Var Compensator
(SVC), Dynamic Voltage Restorer (DVR) and STATCOM itself. To see the
advantages of STATCOM, it can be compared with the Static Var Compensator
(SVC). There is a few main advantages of STATCOM over the conventional Static
VAR Compensator (SVC) [32]. Firstly, STATCOM has significant size reduction
due to reduced number of passive elements. Then, it is also can be able to supply
required reactive power even at low voltages. Next, STATCOM is a creator reactive
power current output capability at depressed voltages and it is also exhibits faster
response and better control stability.
2.4.3.4 DSTATCOM V-I Characteristic
The STATCOM can be operated in two different modes which is in voltage
regulation mode and can operate in reactive power control mode. When the
Fig: 2.15 The schematic diagram of a STATCOM

39
STATCOM operated in reactive power mode, the STATCOM reactive power output
itself will remain constant. When the STATCOM is operated in voltage regulation
mode, it will produces the following Voltage versus Current (V-I) characteristic.
Figure 2.16 show the V-I characteristic of STATCOM. The STATCOM can supply
both the capacitive and the inductive compensation and is able to independently
control its output current over the rated maximum capacitive or inductive range
irrespective of the amount of ac-system voltage. The STATCOM can provide full
capacitive-reactive power at any system voltage. This capability is useful for
situations in which the STATCOM is needed to support the system voltage during
and after faults where voltage collapse would otherwise be a limiting factor.
From the figure 2.16 it show that as long as the reactive current stays within
the minimum and minimum current values (-Imax, Imax) imposed by the converter
rating, the voltage is regulated at the reference voltage Vref. However, a voltage
droop is normally used (usually between 1% and 4% at maximum reactive power
output), and the V-I characteristic has the slope indicated in the figure. In the voltage
regulation mode, the V-I characteristic is described by the following equation:
Slope xs Vref
Fig: 2.16 DSTATCOM V-I Characteristic

40
Where,
V - Positive sequence voltage (pu)
I - Reactive current (pu/Pnom) (I > 0 indicates an inductive current)
Xs - Slope or droop reactance (pu/Pnom)
Pnom- Three-phase nominal power of the converter
2.4.3.5 Basic Configuration and Function of D-STATCOM
DSTATCOM consist of three main part, namely injection transformer,
voltage source inverter (VSI) and PWM generator with specific control scheme. The
function of injection transformer is to inject the AC produced from VSI. On the other
hand, the VSI is used to convert DC storage to AC while PWM generator is to
generate the appropriate gate signal for the switching device in VSI to perform
voltage sag mitigation function.
The voltage source inverter (VSI) could convert DC voltage into AC
sinusoidal voltage before injection of current back to the power system is done via
injection transformer. The total replacement of voltage or insertion of voltage to fill
the dipped voltage could be done by implementation of this voltage source converter
or specifically named as inverter. A DC energy storage is used to supply the
converter with DC voltage, while the electronic switching devices invert DC into the
output voltage required.
The most important part of DSTATCOM is its controller. By applying
appropriate controller, various power quality disturbances could be solved

41
specifically, includes voltage sag. The main purpose of the control scheme is to keep
voltage magnitude fixed at the point where the power system is undergoing voltage
sag problem. In modern controller, not only controller for voltage sag compensation,
but also some other low-power application use PWM technique instead of
Fundamental Frequency Switching (FFS) methods because PWM is more flexible,
simple, and good response. Also, PWM techniques could be applied with high
switching frequencies so that its efficiency could be maximized and also the
switching losses could be drastically reduced.
The controller of the DSTATCOM is designed to conduct the reactive power
exchange between the inverter and the system line by modifying the phase angle
between the inverter voltage and line voltage. The reactive power output of the
DSTATCOM could either be inductive or reactive, depending on the operation mode
of DSTATCOM. There are three operation modes. When the inverter voltage is same
as the system voltage, no reactive power exchange is conducted. When the inverter
voltage is larger than the system voltage, the DSTATCOM is having the
inductive reactance, the current will be injected from the inverter to the system
through the
Injection transformer. Consequently, capacitive reactive power is generated
by the DSTATCOM . When the inverter voltage is smaller than the system voltage,
the DSTATCOM is responding as capacitive reactance, the current will passes
through the injection transformer from the system to the inverter. Consequently, the
inductive reactive power is absorbed by the DSTATCOM.
42
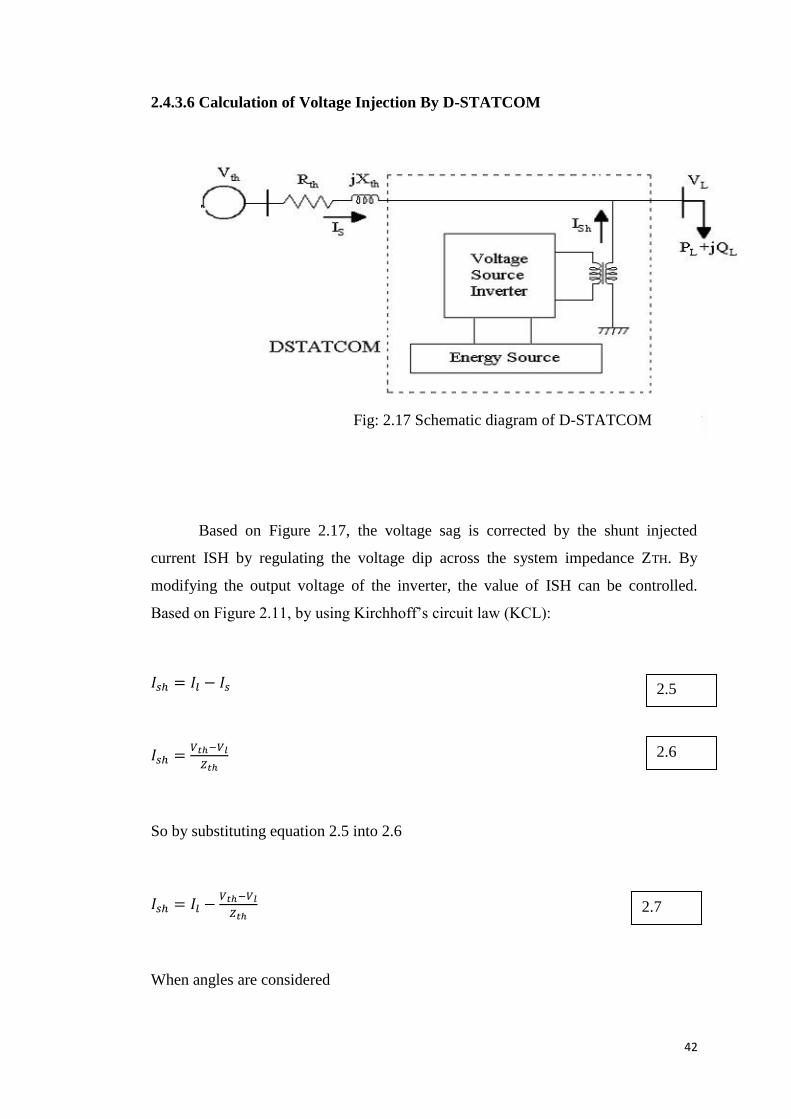
2.4.3.6 Calculation of Voltage Injection By D-STATCOM
Based on Figure 2.17, the voltage sag is corrected by the shunt injected
current ISH by regulating the voltage dip across the system impedance ZTH. By
modifying the output voltage of the inverter, the value of ISH can be controlled.
Based on Figure 2.11, by using Kirchhoff’s circuit law (KCL):
𝐼𝑠ℎ = 𝐼𝑙 − 𝐼𝑠
𝐼𝑠ℎ =𝑉𝑡ℎ−𝑉𝑙
𝑍𝑡ℎ
So by substituting equation 2.5 into 2.6
𝐼𝑠ℎ = 𝐼𝑙 −𝑉𝑡ℎ−𝑉𝑙
𝑍𝑡ℎ
When angles are considered
Fig: 2.17 Schematic diagram of D-STATCOM
2.5
2.6
2.7

43
𝐼𝑠ℎ∠𝜂 = 𝐼𝑙∠(−𝛼) −𝑉𝑡ℎ∠(𝛼−𝛽)−𝑉𝑙∠−𝛽
𝑍𝑡ℎ
Where𝜂 , 𝛼 and 𝛽 are the angles of shunt inverter voltage, line angle, thevenin
voltage and thevenin impedance respectively.
The complex power exchange at DSTATCOM side is able to be indicated as:
𝑆𝑠ℎ = 𝑉𝑙𝐼𝑠ℎ
Hence, the effectiveness of DSTATCOM in compensating the voltage sag is actually
based on the value of ZTH or fault level of the load bus.
2.2.3.7 Operation Modes of A DSTATCOM
No load mode
If Vi is equal to Vs, the reactive power is zero and the D-STATCOM does
not generate or absorb reactive power.
Fig: 2.18 No load mode( Vs-Vi )
2.8
2.9

44
Capacitive mode
When Vi is greater than Vs, the D-STATCOM shows an inductive reactance
connected at its terminal. The current I, flows through the transformer reactance from
the DSTATCOM to the ac system, and the device generates capacitive reactive
power.
Fig: 2.19 Capacitve mode ( Vi>Vs )

45
Inductive mode
If Vs is greater than Vi, the D-STATCOM shows the system as a capacitive
reactance. Then the current flows from the ac system to the D-STATCOM, resulting
in the device absorbing inductive reactive power.
Fig: 2.19 Inductive mode ( Vs>Vi )

46
CHAPTER THREE
METHODOLOGY
3.1 Introduction
In this chapter will discuss the methodology of this project. And also discuss
about design of 11kv distribution system in order to finish up this project
successfully, the project consists of three parts including designing phase, simulating
and analysis respectively. First phase the designed distribution system with a creation
of voltage sag by three faults is subjected to the effect of distribution static
compensator (D-STATCOM) in enhancing the voltage sag in the distribution
network. Second phase is the modeling of the D-STATCOM had been developed
and simulates using MATLAB/Simulink. Third phase The simulation implemented
on distribution network is without installation of D-STATCOM and with installation
of D-STATCOM to the network system was analyzed.
3.2 Project Flow
In order to accomplish to goal of the project, the following process as shown
in fig 3.1 must be followed carefully.

47
Fig: 3.1 Flow chart of the project process
48
Firstly, for the first phase of the project, the understanding about voltage sag
and methods to improve the problems is compulsory. Every idea and topic related to
the problems was clarified and comprehends it clearly. After that, after the method of
the project was determined, the introduction result should be done. This is the
important part because it is an initial step in order to deal with the bigger scope.
For the second phase of the project, a clear understanding should be made.
Anything related to Distribution Static Compensator (D-STATCOM) scheme should
be done. After that, the simulation was implemented. The result found from the
simulation was compared with theoretical and validate it by calculation if needed. If
the result found from the simulation does not match the theoretical the simulation
needs to run back. Eventually, if the simulation was successful at that time the
analysis was started and after that the report writing should be done.
3.3 simulations
According to the scope of this project, the simulation was tested on the
distribution system. In order to make voltage sags, three phase fault was applied on
feeder B and immediately voltage sag will take place in feeder A. After that,
Distribution Static Compensator (D-STATCOM) will be inserted into the distribution
system to mitigate the voltage dips or sags.

49
Fig: 3.2 Flow chart of simulation process

50
Figure 3.2 shows the simulation process flow. That flow chart clarifies about
the in general process of the simulation. Initially, the most important circuit of
distribution system was applied in MATLAB/Simulink. Next, to generate voltage
sags, three phase fault with different resistance values was applied on the system.
Next, start the simulation between 0 up to 1 second. at that time, to advance the
voltage sag, DSTATCOM was inserted into the distribution system. If the sags is still
less than 0.9 p.u after the addition of D-STATCOM, run another time the simulation
until the result give details that the sags get better greater than 0.9 p.u. Then the
outcome from the scope can be studied.
3.3.1 System implementation in MATLAB/Simulink
Based on the scope of this project, the simulation was experienced on the
distribution system. The experiment system consists of a 275 kV transmission
system, feeding into the primary side of a 3-winding transformer. A differentiating
load is connected to the 11 kV, secondary side of the transformer. In order to
examine the sags (dips) event, three lines to the ground fault was created. Then,
automatically voltage sags (dips) will happen. therefore, we can analyze the result of
using Distribution Static Compensator (D-STATCOM) and how D-STATCOM
systems enhance the sags (dips). All of this process was completed by using
MATLAB/Simulink.

51
Initially, the major circuits was designed and fulfilled in the
MATLAB/Simulink. Figure 3.3 illustrates the main circuit of distribution network
without setting up of D-STATCOM systems. All these values of the every part is
shown in Appendix A. the linked load to the system is balanced loads and thus load
is connected to the 11 kV, secondary side of the transformer. The three phase fault
creator was located on feeder B. The run time for the entire system is 1 second where
sags (dips) happen in feeder A for the period of 0.3 second to 0.6 second.
Fig: 3.3 The main circuit implement in MATLAB/simulink
Fig: 3.5 Sample run time for the simulation

52
Figure 3.4 displays that the fault maker was placed to the three phase to the
ground and the transition times were put to 0.3 to 0.6 in order to create sag for 0.3
seconds. Then three phase voltage measurement located at feeder A. The outcome of
this component will be sent to the scope in order to examine the sags (dips) at feeder
A. also that, RMS signal is besides located at the scope in order to calculate the sags
(dips) at the load end. Then the simulation was established by clicking the run button
close to simulation displayed run time as shown in Figure 3.5. The effect of the
simulation without installation of (D-STATCOM) can be seen from Scope 1 by
Fig: 3.4 Configuration of fault generator

53
double click on it and the result of the voltage sags compute from the load end can be
analyzed from scope 3. Then the result was recorded. After that, the second
simulation is to simulate the power distribution system set up with D-STATCOM
system. While the scope of this project was treat with D-STATCOM and only the
STATCOM scheme present in MATLAB/Simulink, so D-STATCOM system
required to be model. STATCOM and D-STATCOM is not the same, it was
dissimilarity as discuss in chapter two previously. D-STATCOM consists of three
major part also has discuss in chapter two which is Voltage Source Converter
(VSC), Controller system and Energy storage circuit. Each division of this
DSTATCOM require be model in MATLAB/Simulink to make sure a good
performance of the D-STATCOM.
Figure 3.6 explain the Energy storage circuit and Voltage Source Converter
(VSC) correspondingly. DC source is linked in parallel with the DC capacitor. it
takes the input wave current of the converter and it is the major reactive energy
storage component. This DC capacitor could be charged by a battery source or could
be recharged by the converter itself.
A voltage-source changer is a power electronic tool that coupled in shunt or
parallel to the network. Figure 3.7 demonstrate the configuration of this VSC. Power
Fig: 3.6 Energy storage circuit and voltage source converter

54
electronic device that used in this simulation are IGBT with the number of bridge
arm are three.
Fig: 3.7 Configuration of voltage source converter
Fig: 3.8 Control scheme design for the D-STATCOM

55
Referring to figure 3.8 it displays the control system for the D-STATCOM.
The controller scheme is partially part of distribution system. Proportional-integral
controller (PI Controller) is a feedback controller. This PI controller will guide the
scheme to be controlled with a weighted sum of the error signal and integral of that
value. Error signal can be defined as dissimilarities between the output and desired
set end value. PWM producer is used to make the Sinusoidal PWM waveform or
signal.
Figure 3.9 shows the control mechanism. Control mechanism is one
component of the controller system. It is a phase modulation control angle.
To make sure that the usefulness of this controller in gives that continuous
voltage regulation, simulations were approved with and without D-STATCOM
associated to the network. A two level DSTATCOM is linked to the 11 kV tertiary
winding to give immediate voltage support at the load end. Voltage sags can take
Fig: 3.9 Control Mechanisms

56
place when there is fault on the distribution line and to enhance the voltage sag,
FACTS device similar to DSTATCOM has been generate to solve this difficulty.
Fig: 3.10 D-STATCOM system connected to the distribution system

57
3.3 Conclusion
In this chapter, it is talked about the way used to implement this project. In
this chapter it will clarify more detailed about to generate a voltage sags problem and
to solve it by using D-STATCOM mechanism. MATLAB/Simulink software has
been used and 11kV distribution scheme has been implementing in
MATLAB/Simulink software. first of all, the distribution system with two feeders
has been design. Then to make voltage sags, three phase fault has been applied at one
of the feeder. After that, run the simulation between 0 until 1 second to see the
voltage sags waveform. Then, to advance the voltage sags, D-STATCOM device will
be put in into the distribution system. D-STATCOM consists of controller structure,
Voltage Source Converter (VSC) and energy storage circuit. Afterward, the wave
shape from the scope can be investigated to observe the either the voltage sags had
get better or not with addition of DSTATCOM.

58
CHAPTER FOUR
RESULT AND DISCUSSION
4.1 Introduction
This chapter will focus on the results gained in simulation. The result consists
of the simulation of the distribution system without insertion of Distribution Static
Compensator (D-STATCOM) scheme and with installation of DSTATCOM system.
4.2 simulations without insertion D-STATCOM scheme
Distribution system without D-STATCOM system was implemented in
matlab simulink as shown in Figure 4.1. Reference signal found before three phase
fault was applied in the distribution system as shown in Figure 4.2. Reference signal
for every phase before three phase fault was applied the signal find was normal with
no any voltage drop happen as shown in Figure 4.3.

59
Fig: 4.1 main circuit of Distribution system without D-STATCOM
Fig: 4.1 Main circuit of the distribution system without DSTATCOM
Fig: 4.2 Reference signal before three faults applied
Main circuit of the distribution system without
DSTATCOM

60
In order to make the voltage sags in distribution system, various types of fault
such as and Single Line to Ground (SGL), Three Line to Ground (TLG) And Double
Line to Ground (DLG), are inserted on feeder B. That faults will bring an
interruption on feeder B. on the other hand, feeder A will bring voltage sag instead
the fault actually on the system. It is same goes with the distribution system that has
three feeders or more than that. Once a fault happens on one feeder, the other whole
parallel feeder will bring voltage sag. Figure 4.4 shows the result of the simulation
when three phases to ground fault applied and Figure 4.5 shows the results of voltage
sag for each phase. The result obtained was as expected. Voltage sags occurred
between 0.4s until 0.6s.
Fig: 4.3 Reference signal for each phase A, phase B and phase C before fault respectively
Main circuit of the distribution system without DSTATCOM

61
Fig: 4.4 Reference Signal after Three Phase Fault Applied or voltage sag
Fig: 4.5 Voltage output at feeder A for each phase. Phase A , phase B and Phase C

62
Table 4.1 shows that the results of the voltage sag for different type of fault.
Three different types of fault was applied in the distribution system and the value of
the fault resistance was varies.
Voltage sags for
STLG(p.u)
Voltage sags for
DLG(p.u)
Voltage sags for
TLG(p.u)
Fault resistance
Rf(Ω)
0.4676 0.4671 0.4672 0.66
0.5027 0.5028 0.5024 0.76
0.5314 0.5315 0.5311 0.86
0.5554 0.5550 0.5546 0.96
From the table, it can observe that the value of fault resistance is directly
proportional to the voltage. When the values of fault resistance increase, it shows that
the voltage will also increase for different types of fault. Figure 4.6 (a) until figure
4.6 (c) show the result of voltage sags for different types of fault measure at the load
point when the value of fault resistance is R = 0.66Ω. The faults occur between 0.4s
until 0.6s.
Table 4.1: Results of voltage sags for different type of faults

63
4.3 Simulation with installation D-STATCOM system
Figure 4.7 shows the order of the distribution system with D-STATCOM
system implemented in MATLABsimulink. Figure 4.8 shows the result of
compensation D-STATCOM to the power system. It shows that the custom power
device successfully compensate the voltage sag. Almost 90% of the voltage sag
during 0.4s to 0.6s back to the nominal value. However, since custom power device
Figure 4.6 (a): Voltage at load point is 0.4672 Pu for TLG fault
Figure 4.6 (b): Voltage at load point is 0.5394 Pu for DLG fault
Figure 4.6 (c): Voltage at load point is 0.5149 Pu for TLG fault

64
deal with electronic element, harmonic and distortion will appeared in the system.
Figure 4.9 shows the voltage sag has improved for each phase.
Fig: 4.7 Main circuit of the distribution system with Dstatcom system
Fig: 4.8 Three phase output voltage after compensation

65
Table 4.2 shows that the results of the voltage sag after compensation for
different types of fault. Three different types of fault was applied in the distribution
system and the value of the fault resistance was varies. From the table 4.2, it can be
observed that voltage sags improved with the insertion of D-STATCOM. The value
of voltage sag is between 0.9407 pu until 0.9974 pu.
Figure 4.9: Output voltage at feeder A after compensation for each phase. Phase A, Phase B
and Phase C respectively.

66
Voltage sags for
SLG(p.u)
Voltage sags for
DTLG(p.u)
Voltage sags for
TLG(p.u)
Resistance
Rf(Ω)
0.9858 0.9813 0.9407 0.66
0.9907 0.9878 0.9531 0.76
0.9940 0.9920 0.9615 0.86
0.9974 0.9959 0.9686 0.96
Figure 4.10 (a) until Figure 4.0 (c) show the results of voltage sags after
compensation for different types of fault measure at the load point when the value of
fault resistance is R = 0.66Ω. The fault occurs between 0.4s until 0.6s.
Table 4.2: Results of voltage sags after compensation for different type of fault
Fig: 4.10 (A) Voltage at load point 0.9402 Pu for TLG fault

67
It can be observed that, after compensation the voltage at the load point will
improved due to the insertion of the D-STATCOM system. D-STATCOM can
improve the voltage sags since this system can absorb or generate reactive power
easily. The exchange of active and reactive power can be made easily between D-
STATCOM system and the electricity network because the AC output voltage of D-
STATCOM connected directly with the coupling transformer of the electricity
network.
4.4 Conclusion
In this chapter it will discussed about the result and discussion. The result can
be separates into two part that is the result of the simulation without installation D-
STATCOM and the result with installation D-STATCOM.
Fig: 4.10 (B) Voltage at load point 0.9813 Pu for DLG fault
Fig: 4.10 (C) Voltage at load point 0.9858 Pu for SLG fault

68
The distribution system is a 11kV system. When there is a three phase fault
occur at one of the distribution feeder, the voltage sags will take place at the other
feeder. Without installation of the D-STATCOM, the result obtained was as
expected, voltage sags occurred between 0.4 second until 0.6 second. Then, the three
phase fault has been varies with Three Line to Ground (TLG), Double Line to
Ground (DLG), and Single Line to Ground (SLG). The fault resistance also has been
varies from 0.66Ω, 0.76Ω, 0.86Ω and 0.96Ω. Then, from the result it can be observed
that, when the value of fault resistance increase, the voltage also will increased for
different types of fault.
Next, with installation of the D-STATCOM, the result obtained show that the
voltage sag had improved. Almost 90% of the voltage sag during 0.4second to
0.6second back to the nominal value

69
CHAPTER FIVE
CONCLUTION AND RECOMMENDATION
5.1 Conclusion
From this project, it is known that one of the methods to mitigate the voltage
sag (dip) is by using Distribution Static Compensator (D-STATCOM). In order to
show or examine whether voltage sags can mitigate by using D-STATCOM or not,
MATLAB/Simulink was chosen so as to perform simulation for the distribution
scheme and mitigate the voltage sag (dip).
Based on the outcome and simulation that has been completed, it can prove
and verify that D-STATCOM device can be capable to overcome the voltage sags
problem. Although the scheme cannot compensate 100 percent of voltage during
sag, it is an acceptable because the output voltage after compensation still in range of
the nominal value.
The simulation was executed by using the distribution system. In this case,
the fault only takes place at the distribution system and D-STATCOM has a superior
effectiveness because it is deal with distribution system only. Since Distribution
Static Compensator, D-STATCOM is deal with a power electronic device that is
IGBT; automatically there will be a harmonic distortion result. To remove the
harmonics, LCL passive filter can be used.

70
5.2 Recommendation
First Since D-STATCOM deal with a power electronic device, harmonic
distortion can be happen. It is greatly suggested that, LCL passive filter can be
design in MATLAB/Simulink.
Second to get rid of harmonic problem. Use large distribution network. It
recommends that the major circuit of distribution system may be used at least more
than three feeders. So, the effect of fault can be observed at every feeder and how
much percentage of voltage sags took place at every feeder.
Third It is highly recommended to study the voltage sags problem when the
fault happen on the transmission line
Fourth For the future, it is better to make the comparison between two
FACTS device. For instance compare voltage sags mitigation method by using
DSTATCOM and SVC device to observe more clearly about voltage sags
investigation.

71
REFERENCES
[1] Mohamed, A., Shareef, H., Hannan, M., Ayob, A., Begum, R. and Faisal, M.
Power Quality Surveyfor Premium Power Options In Malaysia. Journal of
Applied Sciences Research, 2012. 8(1).
[2] Awad, M. S. Review Power Quality Issues. Modern Applied Science, 2012.
6(2).
[3] Tenaga Nasional, B. Voltage Sag Solutions for Industrial Customers. Power
Quality Guidebook, 2007.
[4] Ross,I.K. VoltageSags: AnExplanation-Causes,EffectsandCorrection-Part I.
Omniverter Inc., T&D Magazine-Electricity Today, 2007.
[5] Edomah, N. Effects of voltage sags, swell and other disturbanceson electrical
equipment and their economic implications. Electricity Distribution-Part 1, 2009.
CIRED 2009. 20th International Conference and Exhibition on. IET. 2009. 1–4.
[6] Mohamed Fuad Faisal (2007). Voltage Sag Solutions for Industrial Customers. A
guide book by TenagaNasionalBerhad (TNB).
[7]. ………………………………
[8]. Vinod Khadkikar and Ambrish Chandra, “A New Control Philosophy for a
Unified Power Quality Conditioner (UPQC) to Coordinate Load-Reactive Power
demand between shunt and series inverters” IEEE Transactions on power delivery,
vol. 23, no. 4, october 2008.
[9]. Teke K. Bayindir and M. Tumay, “Fast sag/swell detection method for fuzzy
logic controlled dynamic voltage restorer” IET Gener. Transm. Distrib., 2010, Vol.
4, Iss. 1, pp. 1–12.
[10] M. Aredes, J. A. M. Neto, J. C. C. Ferreira, L. F. C. Monteiro, R. M. Fernandes
“A simplified control strategy for a unified power quality conditioner prototype”,
2005 IEEE.
[11] Carl Ngai-man Ho,Henry S. H. Chung and Keith T. K. Au “Design and
Implementation of a Fast Dynamic Control Scheme for Capacitor-Supported

72
Dynamic Voltage Restorers” IEEE Transactions on power electronics, vol. 23, no. 1,
january 2008.
[12] V. Khadkikar, A. Chandra' Senior, A. 0. Barry and T. D. Nguyen, “Conceptual
Study of Unified Power Quality Conditioner (UPQC)”, IEEE ISIE 2006, July 9-12,
2006, Montreal, Quebec, Canada.
[13] Harish Suryanarayana and Mahesh K. Mishra,“Fuzzy Logic based Supervision
of DC Link PI Control in a DSTATCOM”, 2008 IEEE.
[14] Kian Hoong Kwan, Yun Chung Chu and Ping Lam So, “ModelBased H∞
Control of a Unified Power Quality Conditioner”, IEEE Transactions on industrial
electronics, vol. 56, no. 7, july 2009.
[15] Polycarpou, A. Power Quality and voltage sag indices in Electrical Power
Systems, 2011.
[16] Madhusudan, R. and Ramamohan Rao, G. Modeling and simulation of a
distribution STATCOM (D-STATCOM) for power quality problemsvoltage sag and
swell based on Sinusoidal Pulse Width Modulation (SPWM). Advances in
Engineering, Science and Management (ICAESM), 2012 International Conference
on. IEEE. 2012. 436–441.
[17] Mohamad Hasif, b. M. H. Voltage Sag Mitigation by FACTS Devices.
Bachelor’s Degree Thesis. Universiti Teknologi Malaysia. 2012.
[18] Ross,I.K. VoltageSags: AnExplanation-Causes,EffectsandCorrection-Part I.
Omniverter Inc., T&D Magazine-Electricity Today, 2007.
[19] Amit Kumar Jena, Bhupen Mohapatra, Kalandi Pradhan, “Modeling and
Simulation of a Dynamic Voltage Restorer (DVR)”, Project Report,Bachelor of
Technology in Electrical Engineering, Department of Electrical Engineering,
National Institute of Technology, Rourkela, Odisha-769008.
[20] Rosli Omar, N.A. Rahim and Marizan Sulaiman, “Dynamic Voltage Restorer
Application for Power Quality Improvement in Electrical Distribution System: An
73
Overview”, Australian Journal of Basic and Applied Sciences, 5(12): 379-396, ISSN
1991-8178, 2011.
[21] M.V.Kasuni Perera, “Control of a Dynamic Voltage Restorer to compensate
single phase voltage sags”, Master of Science Thesis, Stockholm, Sweden, 2007.
[22] L.H.Tey,P.L.So and Y.C.Chu,Unified power QualityConditionar for improveing
power Quality Using ANN withHysterisis Control, IEEE Tran. Power Electronics,
vol. 9,no.3, May 1994, pp. 1441 -1446.
[23] Hirofumi Akagi, Trends in Active Power Line Conditioners, IEEE Tran. Power
Electronics, vol. 9, no.3, May 1994, pp.
263-268.
[24] Janko Nastran, Rafael Cajhen, Matija Seliger, and Peter Jereb, Active Power
Filter for Nonlinear AC Loads, IEEE Trans. Power Electronics, vol.9, no.1, Jan.
1994, pp. 92-96.
[25] Hideaki Fujita and Hirofumi Akagi, the Unified Power Quality Conditioner: The
Integration of Series- and Shunt- Active Filters, IEEE Tran. Power Electronics, vol.
13, no.2, Mar. 1998, pp.315-322.
[26] A. Adamezyk, R.Teodorescu, R.N. Mukerjee, P.Rodriguez, Overview of FACTS
Devices Wind Power Plants Directly Connected to the Transmission Network,
IEEE2010.
[27] E.Acha, V.G Agelidis, O.Anaya-Lara, T.J.E.Miller(2002). Power Electronic
Control in Electrical Systems. 1 st edition. New Delhi. Newnes. 108- 118,137-
137,290-336.
[28] Elango, S.ChandraSekaran E .(2011) Mitigation of Voltage Sag by Using
Distribution Static Compensator (D-STATCOM). Process Automation, Control and
Computing (PACC), 2011 International Conference. 20-22 July 2011, 1-6.
[29] Firas Marwan Flaih, JyotiShrivastava (2013). DSTATCOM with LCL Filter to
Improve Voltage Sags and Current Harmonics in Power Distribution System.
International Journal of modern Engineering Research (IJMER). 3(6), 3521-3528.

74
[30] M.Mohammadi, M.AkbariNasab (2011). Voltage Sag Mitigation with
DSTATCOM In Distribution Systems.Australian Journal of Basic and Applied
Sciences. 5(5), 201-207.
[31] E.Acha, V.G Agelidis, O.Anaya-Lara, T.J.E.Miller(2002). Power Electronic
Control in Electrical Systems. 1 st edition. New Delhi. Newnes. 108- 118,137-
137,290-336.
[32] H. Yonezawa, T.Shimato, M.Tsukada, K. Matsuno, I.Iyoda, J.Paserba, G.F.Reed
(2000). Study of a STATCOM application for voltage stability Evaluated by
dynamic PV curve and time simulation. IEEE Power Engineering.
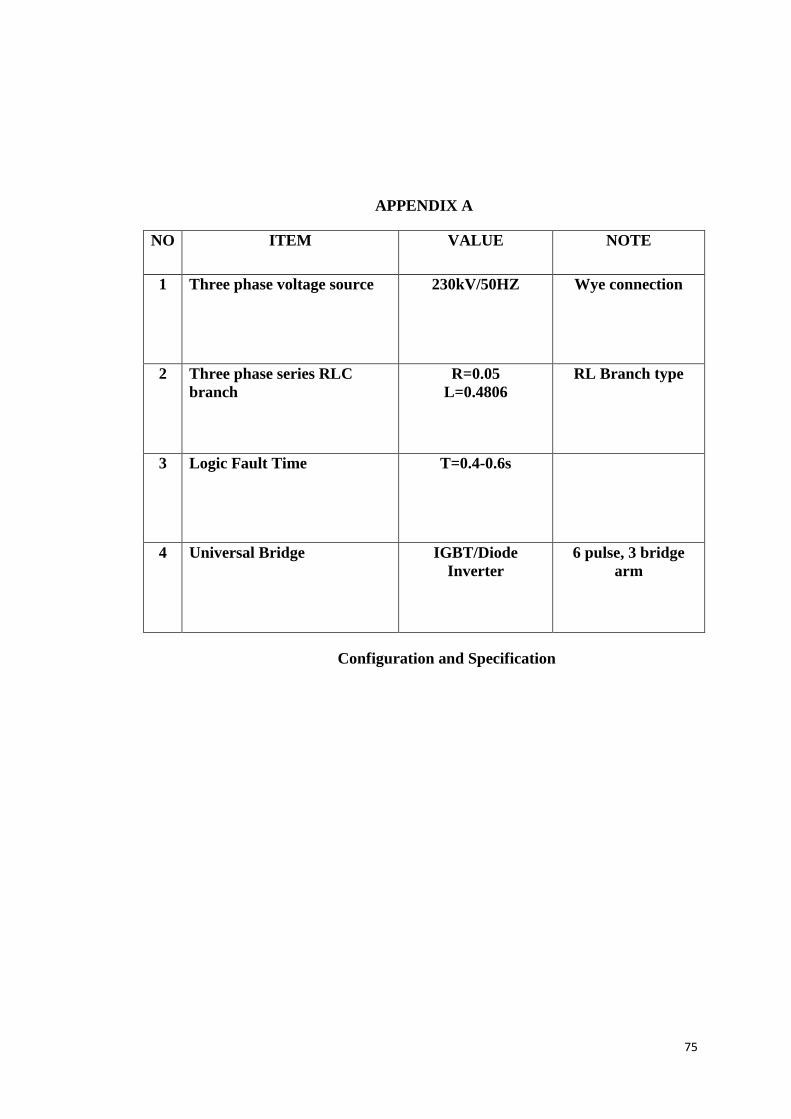
75
APPENDIX A
NO ITEM VALUE NOTE
1 Three phase voltage source 230kV/50HZ Wye connection
2 Three phase series RLC
branch
R=0.05
L=0.4806
RL Branch type
3 Logic Fault Time T=0.4-0.6s
4 Universal Bridge IGBT/Diode
Inverter
6 pulse, 3 bridge
arm
Configuration and Specification

76
APPENDIX B
The main circuit of the distribution system without D-STATCOM system

77
APPENDIX C
The main circuit of the distribution system with D-STATCOM system
![Voltage Stability Enhancement in Large Power … Stability Enhancement in Large Power System by using STATCOM Punam Domkawale1, V.K. Chandrakar2 1PG student[IPS],Dept.of EE,GHRCE,Nagpur,India](https://static.fdocuments.us/doc/165x107/5b1e63ad7f8b9a116d8b7e47/voltage-stability-enhancement-in-large-power-stability-enhancement-in-large-power.jpg)