ENHANCED PROTEIN AND - Chemical Analysis, Life …€¦ · · 2018-01-22S1 Column2 Info. Mod...
8
Spectrum Algorithm Peak Modeling Deconvolution Mass 16951.778 Sequence Name Myoglobin (horse) Target mass 16951.6073 Delta ppm 10.07 MinZ 6 MaxZ 18 Z Count 13 Fit Score 0 U 0 Agilent MassHunter BioConfirm Software ENHANCED PROTEIN AND PEPTIDE CHARACTERIZATION
Transcript of ENHANCED PROTEIN AND - Chemical Analysis, Life …€¦ · · 2018-01-22S1 Column2 Info. Mod...

Qualitative Compound Report
MS Spectrum
IRM Calibration Status Success DA Method BioConfirmIntactProteinHighMass-Default.m
Data File Intact_MyoglobinNewMyo-010012.d Sample Name NewMyo-01Sample Type Sample Position P1-B-03
Comment IntProt
Instrument Name MH Instrument User Name wadminAcq Method Intact_MyoglobinNovartis.m Acquired Time 3/4/2014 2:08:13 PM
Intact Acq + Myo-DA
6200 series TOF/6500 series Q-TOF B.06.00 (B502)
Column2Sample Group
Protein Sequence
Mass
Mod Pro�le1
Custom
Column3
horse_myo.txt16951||| Phospho&OxA,B,C
S1
Column2Info.
Mod Pro�le
Protein Sequence 1
Mass1
Custom1
Stream NameWalkup Method Description
Acquisition SW Version
Column3
||| MyoMyoglobin2.psq16951test
Compound TableMass
16951.778Sequence Name
Myoglobin (horse)Target Mass
16951.6073MaxZ
18Z Count
13Fit Score
0
RuleIntact protein
Rule
Intact proteinUncertainty
0.05Signi�cance
100Algorithm
Peak Modeling Deconvolution# Hits
3Data File
Intact_MyoglobinNewMyo-010012.dDelta ppm
10.07Height
201650689MinZ
6
998.1704
Spectrum
Spectrum
AlgorithmPeak Modeling Deconvolution
Mass16951.778
Sequence NameMyoglobin (horse)
Target mass16951.6073
Delta ppm10.07
MinZ6
MaxZ18
Z Count13
Fit Score0
Uncertainty0.05
Signi�cance100
1131.15781211.88291305.02721413.69551542.1217
MS Spectrum Peak Listm/z
998.19891060.5234
Calc m/z
1060.49311131.12551211.84831304.98991413.65521542.0777
-28.54
z
1716151413
Di�(ppm)
-28.52-28.53
Abund
23654.564051.1
121533.45159260.59
-28.53
-28.53-28.53-28.53-28.53
98
1696.18481884.53792119.9793
1884.59172120.0398
1696.2332 -28.54-28.54
--- End Of Report ---
169176.91153094.25129325.84
76638.532788.913695.6
121110
Page 1 of 1 Printed at: 3:13 PM on:3/14/2014
Agilent MassHunter BioConfirm Software
ENHANCED PROTEIN AND PEPTIDE CHARACTERIZATION

2
ENVISION HIGHER CONFIDENCE IN YOUR PROTEIN/PEPTIDE CHARACTERIZATION
Agilent’s sophisticated MassHunter BioConfirm Software brings you greater confidence in your protein/peptide analysis. Together with Agilent’s high performance liquid chromatography/mass spectrometry (LC/MS) systems, it provides an intelligent solution for rapid confirmation of synthetic peptides and characterization of proteins and peptides. Now you can elevate your discovery by confirming your data with confidence and ease.
AGILENT MASSHUNTER BIOCONFIRM SOFTWARE
BioConfirm Software Delivers:• Precise and rapid protein confirmation• Easier batch-to-batch analysis• Comprehensive peptide mapping

3
Counts vs. Deconvoluted Mass (amu)
2.82.42.01.61.20.80.4
0
x106
3.22.82.42.01.61.20.80.4
0
x104
144600 144800 145000 145200 145400 145600
144783.28
144946.75
145106.77
145265.67
144582.58
144786.27
144947.23 145107.68
145268.27
145583.41
(a) Maximum
(b) Peak Modeling
Intact Protein Workflow
DeconvoluteMatch proteinsequences and predict PTMs
Generate report
Integrate and extract MSAcquire data
Qualitative Compound Report
MS Spectrum
IRM Calibration Status Success DA Method BioConfirmIntactProteinHighMass-Default.m
Data File Intact_MyoglobinNewMyo-010012.d Sample Name NewMyo-01Sample Type Sample Position P1-B-03
Comment IntProt
Instrument Name MH Instrument User Name wadminAcq Method Intact_MyoglobinNovartis.m Acquired Time 3/4/2014 2:08:13 PM
Intact Acq + Myo-DA
6200 series TOF/6500 series Q-TOF B.06.00 (B502)
Column2Sample Group
Protein Sequence
Mass
Mod Pro�le1
Custom
Column3
horse_myo.txt16951||| Phospho&OxA,B,C
S1
Column2Info.
Mod Pro�le
Protein Sequence 1
Mass1
Custom1
Stream NameWalkup Method Description
Acquisition SW Version
Column3
||| MyoMyoglobin2.psq16951test
Compound TableMass
16951.778Sequence Name
Myoglobin (horse)Target Mass
16951.6073MaxZ
18Z Count
13Fit Score
0
RuleIntact protein
Rule
Intact proteinUncertainty
0.05Signi�cance
100Algorithm
Peak Modeling Deconvolution# Hits
3Data File
Intact_MyoglobinNewMyo-010012.dDelta ppm
10.07Height
201650689MinZ
6
998.1704
Spectrum
Spectrum
AlgorithmPeak Modeling Deconvolution
Mass16951.778
Sequence NameMyoglobin (horse)
Target mass16951.6073
Delta ppm10.07
MinZ6
MaxZ18
Z Count13
Fit Score0
Uncertainty0.05
Signi�cance100
1131.15781211.88291305.02721413.69551542.1217
MS Spectrum Peak Listm/z
998.19891060.5234
Calc m/z
1060.49311131.12551211.84831304.98991413.65521542.0777
-28.54
z
1716151413
Di�(ppm)
-28.52-28.53
Abund
23654.564051.1
121533.45159260.59
-28.53
-28.53-28.53-28.53-28.53
98
1696.18481884.53792119.9793
1884.59172120.0398
1696.2332 -28.54-28.54
--- End Of Report ---
169176.91153094.25129325.84
76638.532788.913695.6
121110
Page 1 of 1 Printed at: 3:13 PM on:3/14/2014
Deconvoluted spectra. (a) Maximum entropy deconvoluted spectrum. (b) Peak modeling deconvoluted spectrum.
ENVISION PRECISE PROTEIN CONFIRMATION
BioConfirm provides both classical maximum entropy deconvolution and enhanced peak modeling (pMod) to determine the molecular weight of intact proteins.
Maximum entropy deconvolution provides rapid mass resolution, especially for simple protein mixtures. For complex protein mixtures, the enhanced pMod algorithm removes artifacts from the spectrum and helps to resolve overlapping peaks—even severely overlapping peaks—providing cleaner spectra and more precise mass measurement. This enables fast confirmation of intact protein sequences and modifications.
BioConfirm Software Delivers:• Precise and rapid protein confirmation• Easier batch-to-batch analysis• Comprehensive peptide mapping
4
Counts vs. Mass-to-Charge (m/z)
7.26.66.05.44.84.23.63.02.41.81.20.6
0
x104
100 200 300 400 500 600 700 800 900 1,000 1,100
Peptide Mapping Workflow
Match Protein sequences and identify PTMs
Visualize sequence coverage
Generate report
Extract compoundsAcquire data
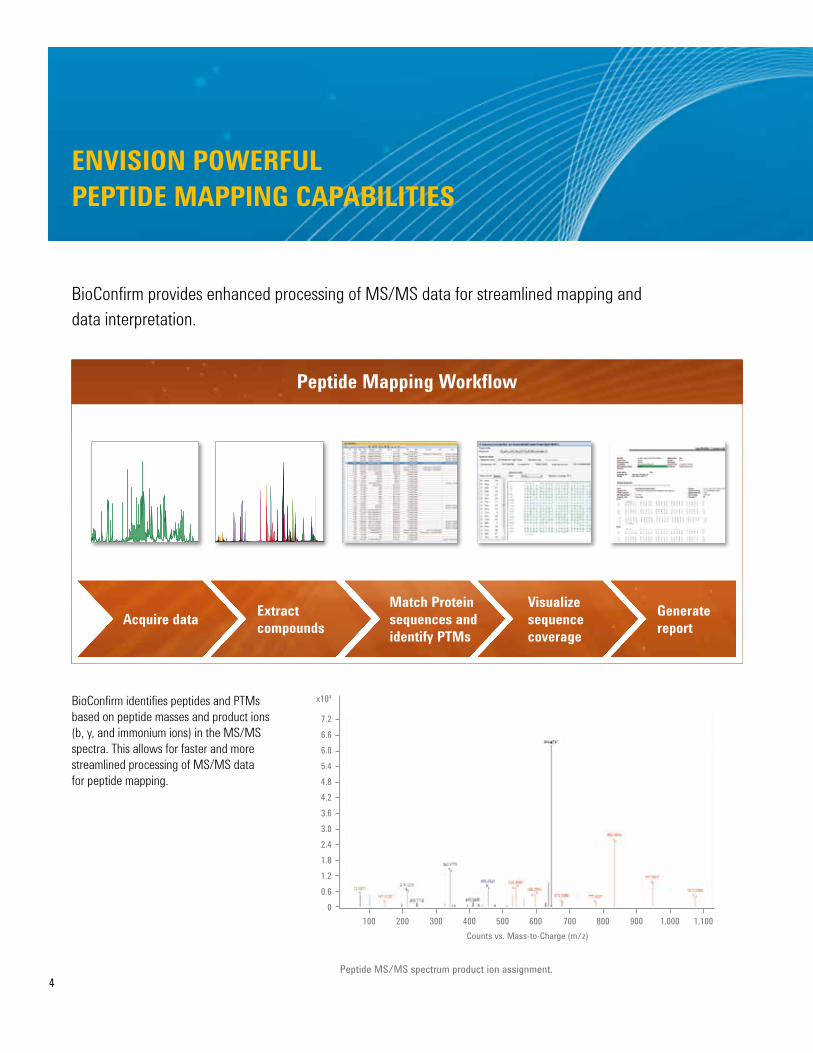
BioConfirm provides enhanced processing of MS/MS data for streamlined mapping and data interpretation.
ENVISION POWERFUL PEPTIDE MAPPING CAPABILITIES
BioConfirm identifies peptides and PTMs based on peptide masses and product ions (b, y, and immonium ions) in the MS/MS spectra. This allows for faster and more streamlined processing of MS/MS data for peptide mapping.
Peptide MS/MS spectrum product ion assignment.
5
Counts vs. Mass-to-Charge (m/z)
1.050.9
0.750.6
0.450.3
0.150
x102
100 400 700 1,000 1,300 100 400 700 1,000 1,300
Counts vs. Mass-to-Charge (m/z)
0.8
0.5
0.2
-0.1
x102
0.8
0.5
0.2
-0.1
x102
300 450 600 750 900 1050 1,200 1,350 1,500 1,650
Counts vs. Deconvoluted Mass (amu)
2.4
1.8
1.2
0.6
0
-0.6
-1.2
-1.8
-2.4
-3.0
-3.6
x103
147100 1474000 147700 148000 148300 148600 148900
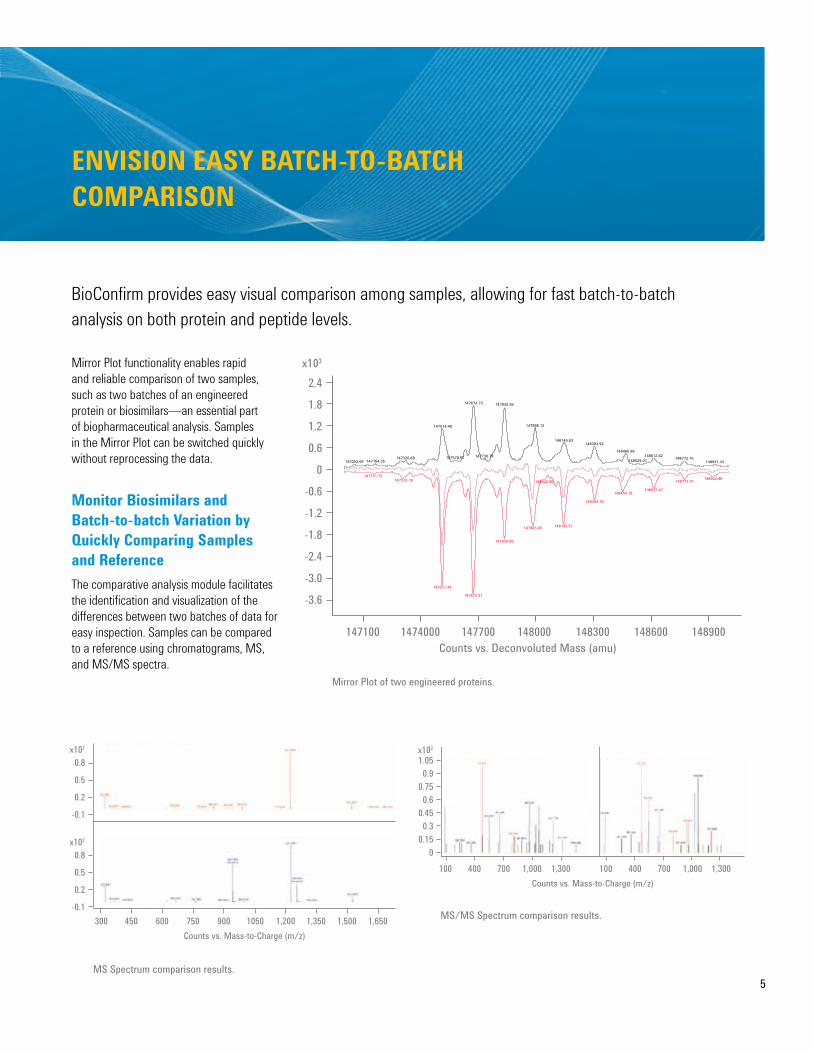
ENVISION EASY BATCH-TO-BATCH COMPARISON
BioConfirm provides easy visual comparison among samples, allowing for fast batch-to-batch analysis on both protein and peptide levels.
Mirror Plot functionality enables rapid and reliable comparison of two samples, such as two batches of an engineered protein or biosimilars—an essential part of biopharmaceutical analysis. Samples in the Mirror Plot can be switched quickly without reprocessing the data.
Monitor Biosimilars and Batch-to-batch Variation by Quickly Comparing Samples and ReferenceThe comparative analysis module facilitates the identification and visualization of the differences between two batches of data for easy inspection. Samples can be compared to a reference using chromatograms, MS, and MS/MS spectra.
Mirror Plot of two engineered proteins.
MS/MS Spectrum comparison results.
MS Spectrum comparison results.

6
mAb Glycan Workflow
Extract compounds
Search database and identify glycans
Calculate percentage and generate report
Acquire data
N
ENVISION RAPID AND ACCURATE mAb GLYCAN ANALYSIS
BioConfirm enables users to accurately identify and visualize glycan structures in their mAb samples using Agilent’s Glycan Personal Compound Database (PCD) and extensive predefined glycan modifications. Using Agilent’s mAb-Glyco Chip, customers have a comprehensive workflow for glycan analysis including hardware, software, and consumables—a complete workflow that includes on-chip deglycosylation of the mAb as well as enrichment, chromatographic separation, and detection of the cleaved glycans. All activities, including data processing using BioConfirm, can be completed in less than 15 minutes.
BioConfirm provides an easy and effective workflow for the analysis of mAb glycans.
7
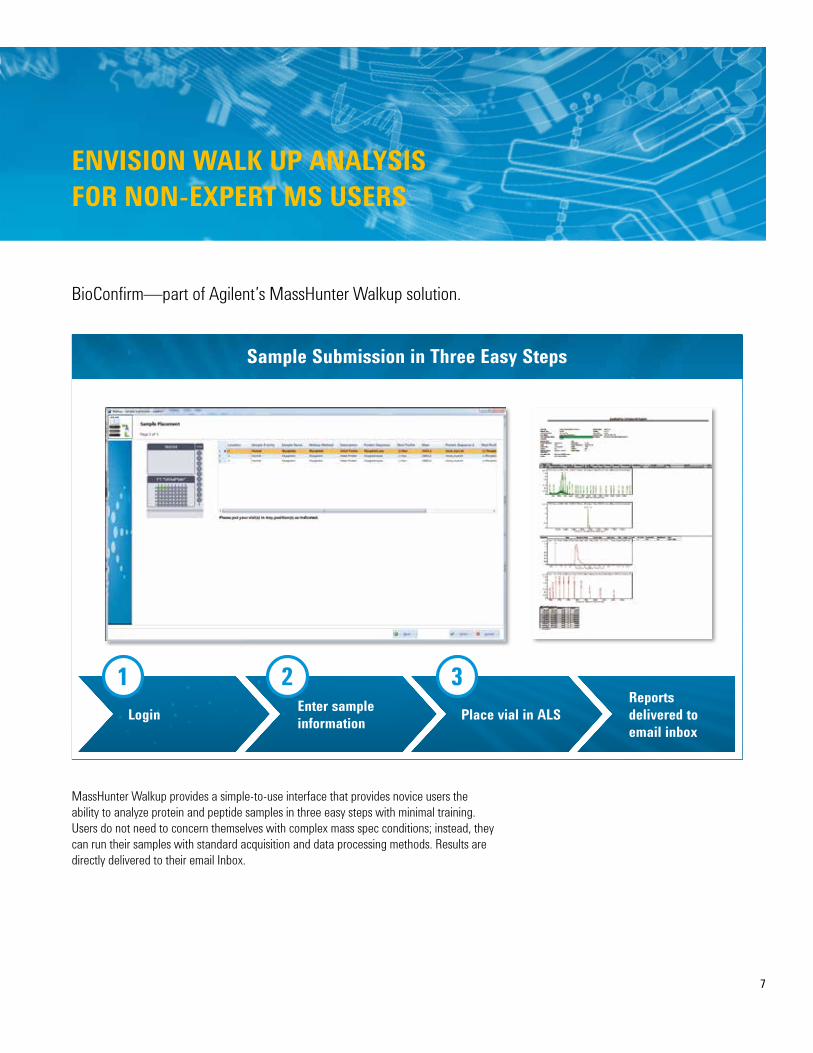
Sample Submission in Three Easy Steps
Enter sample information Place vial in ALS
Reports delivered to email inbox
Login
1 2 3
ENVISION WALK UP ANALYSIS FOR NON-EXPERT MS USERS
BioConfirm—part of Agilent’s MassHunter Walkup solution.
MassHunter Walkup provides a simple-to-use interface that provides novice users the ability to analyze protein and peptide samples in three easy steps with minimal training. Users do not need to concern themselves with complex mass spec conditions; instead, they can run their samples with standard acquisition and data processing methods. Results are directly delivered to their email Inbox.

Learn more www.agilent.com/chem/masshunter
Buy online www.agilent.com/chem/store
Find a local Agilent customer center www.agilent.com/chem/contactus
USA and Canada 1-800-227-9770 [email protected]
Europe [email protected]
Asia Pacific [email protected]
Research use only. Information, descriptions, and specifications in this publication are subject to change without notice. Agilent Technologies shall not be liable for errors contained herein or for incidental or consequential damages in connection with the furnishing, performance, or use of this material.
© Agilent Technologies, Inc., 2014 Published in the USA, April 7, 2014 5991-3643EN