Enhanced CLIP Uncovers IMP Protein-RNA Targets in...
32
Resource Enhanced CLIP Uncovers IMP Protein-RNA Targets in Human Pluripotent Stem Cells Important for Cell Adhesion and Survival Graphical Abstract Highlights d Enhanced CLIP identifies thousands of reproducible IMP1, IMP2, and IMP3 binding sites d IMP1 and IMP2 binding sites are highly correlated in 3 0 UTRs of coding genes d Integrins represent a key mechanism for IMP1 modulation of cell adhesion in hESCs d Apoptosis of hESCs resulting from depletion of IMP1 is mediated by IMP1 target BCL2 Authors Anne E. Conway, Eric L. Van Nostrand, Gabriel A. Pratt, ..., Christopher B. Burge, D. Leanne Jones, Gene W. Yeo Correspondence [email protected] (D.L.J.), [email protected] (G.W.Y.) In Brief Using transcriptome-wide mapping with eCLIP, Conway et al. identify thousands of IMP1, IMP2, and IMP3 RNA binding sites in human stem cells, identifying both overlapping and distinct targets among IMP proteins. Two IMP1 targets, ITGB5 and BCL2, help mediate IMP1 roles in cell adhesion and survival. Accession Numbers GSE78509 Conway et al., 2016, Cell Reports 15, 1–14 April 19, 2016 ª2016 The Authors http://dx.doi.org/10.1016/j.celrep.2016.03.052
Transcript of Enhanced CLIP Uncovers IMP Protein-RNA Targets in...

Resource
Enhanced CLIP Uncovers
IMP Protein-RNA Targetsin Human Pluripotent Stem Cells Important for CellAdhesion and SurvivalGraphical Abstract
Highlights
d Enhanced CLIP identifies thousands of reproducible IMP1,
IMP2, and IMP3 binding sites
d IMP1 and IMP2 binding sites are highly correlated in 30 UTRsof coding genes
d Integrins represent a key mechanism for IMP1 modulation of
cell adhesion in hESCs
d Apoptosis of hESCs resulting from depletion of IMP1 is
mediated by IMP1 target BCL2
Conway et al., 2016, Cell Reports 15, 1–14April 19, 2016 ª2016 The Authorshttp://dx.doi.org/10.1016/j.celrep.2016.03.052
Authors
Anne E. Conway, Eric L. Van Nostrand,
Gabriel A. Pratt, ..., Christopher B. Burge,
D. Leanne Jones, Gene W. Yeo
[email protected] (D.L.J.),[email protected] (G.W.Y.)
In Brief
Using transcriptome-wide mapping with
eCLIP, Conway et al. identify thousands
of IMP1, IMP2, and IMP3 RNA binding
sites in human stem cells, identifying both
overlapping and distinct targets among
IMP proteins. Two IMP1 targets, ITGB5
and BCL2, help mediate IMP1 roles in cell
adhesion and survival.
Accession Numbers
GSE78509

Please cite this article in press as: Conway et al., Enhanced CLIP Uncovers IMP Protein-RNA Targets in Human Pluripotent Stem Cells Important forCell Adhesion and Survival, Cell Reports (2016), http://dx.doi.org/10.1016/j.celrep.2016.03.052
Cell Reports
Resource
Enhanced CLIP Uncovers IMP Protein-RNA Targetsin Human Pluripotent Stem Cells Importantfor Cell Adhesion and SurvivalAnne E. Conway,1,2,3,10 Eric L. Van Nostrand,1,2,10 Gabriel A. Pratt,1,2,4 Stefan Aigner,1,2 Melissa L. Wilbert,1,2
Balaji Sundararaman,1,2 Peter Freese,5 Nicole J. Lambert,5 Shashank Sathe,1,2 Tiffany Y. Liang,1,2 Anthony Essex,3
Severine Landais,3 Christopher B. Burge,5 D. Leanne Jones,3,6,7,* and Gene W. Yeo1,2,8,9,*1Department of Cellular and Molecular Medicine, University of California at San Diego, La Jolla, CA 92037, USA2Stem Cell Program and Institute for Genomic Medicine, University of California at San Diego, La Jolla, CA 92037, USA3Laboratory of Genetics, Salk Institute for Biological Studies, La Jolla, CA 92037, USA4Department of Bioinformatics and Systems Biology, University of California at San Diego, La Jolla, CA 92093, USA5Department of Biology, Massachusetts Institute of Technology, Cambridge, MA 02142, USA6Department of Molecular, Cellular and Developmental Biology, University of California at Los Angeles, Los Angeles, CA 90095, USA7Eli and Edythe Broad Center of Regenerative Medicine and Stem Cell Research, University of California at Los Angeles, Los Angeles,
CA 90095, USA8Molecular Engineering Laboratory, A*STAR, Singapore 1190777, Singapore9Department of Physiology, Yong Loo Lin School of Medicine, National University of Singapore, Singapore 1190777, Singapore10Co-first author
*Correspondence: [email protected] (D.L.J.), [email protected] (G.W.Y.)
http://dx.doi.org/10.1016/j.celrep.2016.03.052
SUMMARY
Humanpluripotent stemcells (hPSCs) requireprecisecontrol of post-transcriptional RNA networks tomaintain proliferation and survival. Using enhancedUV crosslinking and immunoprecipitation (eCLIP),we identify RNA targets of the IMP/IGF2BP familyof RNA-binding proteins in hPSCs. At the broad re-gion and binding site levels, IMP1 and IMP2 showreproducible binding to a large and overlapping setof 30 UTR-enriched targets. RNA Bind-N-seq appliedto recombinant full-length IMP1 and IMP2 revealsCA-rich motifs that are enriched in eCLIP-definedbinding sites.Weobserve that IMP1 loss in hPSCs re-capitulates IMP1 phenotypes, including a reductionin cell adhesion and increase in cell death. For celladhesion, we find IMP1 maintains levels of integrinmRNA specifically regulating RNA stability of ITGB5in hPSCs. Additionally, we show that IMP1 can belinked to hPSC survival via direct target BCL2. Thus,transcriptome-wide binding profiles identify hPSCtargets modulating well-characterized IMP1 roles.
INTRODUCTION
Human embryonic stem cells (hESCs) are an invaluable model
system to address mechanisms of early human development
due to the ability to self-renew and differentiate into the majority
of cell types in the mammalian embryo. Recent studies profiling
RNA regulatory networks controlled by RNA binding proteins
(RBPs), including RBFOX2, LIN28A, and MBNL, have demon-
This is an open access article under the CC BY-N
strated that RBPs play key roles in maintenance of pluripotency
through regulating diverse aspects of RNA processing (Han
et al., 2013; Wilbert et al., 2012; Yeo et al., 2009).
The IGF2 mRNA binding proteins (IMPs/IGF2BPs) are a highly
homologous family of RBPs that are conserved from insects to
mammals (Hansen et al., 2004; Nielsen et al., 1999). Humans
and mice have three IMPs (IMP1-3/IGF2BP1-3), which are ex-
pressed broadly during early development. Protein expression
generally decreases inmost tissues post-natally, with the excep-
tion of sustained expression in the germline in adults (Hammer
et al., 2005; Hansen et al., 2004). IMP2mRNA, however, remains
expressed in adult murine tissues (Bell et al., 2013). IMP1 is
necessary for proper embryogenesis (Hansen et al., 2004), and
IMPs are upregulated in many different types of cancer including
lung, liver, breast, and colon, with expression being tightly corre-
lated with poor patient prognosis (Dimitriadis et al., 2007; Ross
et al., 2001).
Molecular mechanisms of how IMP proteins bind and regulate
their target RNAs have been studied predominantly in vitro.
Molecules of IMP1 protein bind RNA cooperatively and sequen-
tially, dimerizing to forma stable complexwith boundRNAvia the
hnRNP K homology (KH) domains 1–4 (Nielsen et al., 2004). All
four KH domains contribute to RNA binding and are important
for localization of IMP (Nielsen et al., 2002). Furthermore, both
IMP2 and IMP3 are able to heterodimerize on a target RNA with
IMP1 via the four KH domains (Nielsen et al., 2004). Identification
of IMP1 RNA targets in vivo revealed IMP1 modulates develop-
ment and differentiation by regulating various stages of RNA pro-
cessing. The namesake target of the IMP family, IGF2, is primarily
regulated at the level of translation, but IMP1 can either promote
or repress translation of IGF2 depending on cellular context
(Dai et al., 2013; Nielsen et al., 1999). IMP1 also controls the
localization and translation of neuron-specific Tau mRNA in a
Cell Reports 15, 1–14, April 19, 2016 ª2016 The Authors 1C-ND license (http://creativecommons.org/licenses/by-nc-nd/4.0/).

Figure 1. Expression Patterns of IMP1, IMP2, and IMP3 RNA Binding Proteins
(A) Domain structure of IMP protein family members, with RNA-recognition motif (RRM) 1-2, hnRNPK-homology (KH) 1-2 and 3-4 domains, and nuclear export
signal (NES).
(B) Illumina Bodymap tissue RNA-seq data of IMP1-3, GAPDH, and ACTB mRNA expression (RPKM) in comparison to H1, H9, and HUES6 human embryonic
stem cells (hESCs).
(C) IMP protein expression in human fibroblasts, induced pluripotent (iPS), and hESCs by western blot analysis.
(D) Immunofluorescence displaying IMP localization in hESCs. Scale bar, 10 mm.
(E) Cellular fractionation into nuclear and cytoplasmic expression of IMP1-3 by western blot analysis.
Please cite this article in press as: Conway et al., Enhanced CLIP Uncovers IMP Protein-RNA Targets in Human Pluripotent Stem Cells Important forCell Adhesion and Survival, Cell Reports (2016), http://dx.doi.org/10.1016/j.celrep.2016.03.052
differentiation-dependentmanner (Atlas et al., 2007) andcontrols
stability of MYC RNA (Bernstein et al., 1992).
Although these studies in cell lines and model organisms have
provided clues into IMP regulation of a small number of RNAs,
our understanding of how the IMP-RNA target orchestra is
conducted transcriptome-wide in human development is incom-
plete. In HEK293 cells, Hafner et al. (2010) surveyed the genome-
wide binding preferences of all three IMPs overexpressed
with photoactivatable-ribonucleoside-enhanced crosslinking
and immunoprecipitation (PAR-CLIP) and Jønson et al. (2007)
surveyed the RNAs in IMP1 RNP complexes using RNA immu-
noprecipitation followed by microarray (RIP-ChIP). However,
whether overexpression recapitulates endogenous binding is al-
ways a concern with RBPs, and indeed it was recently shown
that exogenous expression of IMP1 results in aberrant sedimen-
tation in polysomal gradient centrifugation when compared with
endogenous protein (Bell et al., 2013). Therefore, to study the
normal roles of endogenous IMP proteins in hESCs, we inte-
grated two recently developed approaches: enhancedUV cross-
linking and immunoprecipitation followed by high-throughput
sequencing (eCLIP) to identify the endogenous RNA targets of
IMP1, IMP2, and IMP3 in vivo, and RNA Bind-n-seq (RBNS) to
uncover the in vitro binding preferences of full-length IMP1 and
IMP2 proteins. These approaches revealed highly overlapping
binding for IMP1 and IMP2 that was distinct from IMP3, suggest-
ing the IMP family plays both redundant and distinct functions in
hPSCs. Further, loss of IMP1 leads to defects in cell survival and
adhesion in hPSCs that can be partially explained through its ef-
2 Cell Reports 15, 1–14, April 19, 2016
fects on direct targets BCL2 and ITGB5, respectively. Thus,
profiling of endogenous IMP1 targets in hPSCs reveals insight
into the pathways through which well-characterized IMP1 func-
tions are achieved in stem cells.
RESULTS
Enhanced CLIP Identifies Targets of IMP1, IMP2, andIMP3 Proteins in Human Embryonic Stem CellsThe human IMP family of RNA binding proteins (RBPs) consists
of three members (IMP1, IMP2, and IMP3) that contain two
RNA recognition motifs (RRMs) and four KH domains each (Fig-
ure 1A). Previous reports have observed significant expression
of all three IMP proteins in pluripotent and cancer cell lines,
with expression in differentiated tissues mostly limited to IMP2
(Bell et al., 2013). Analyzing public RNA sequencing (RNA-seq)
datasets (Marchetto et al., 2013), we confirmed that all three
members are highly expressed at the mRNA level in PSCs rela-
tive to differentiated tissues (Figure 1B). At the protein level, we
validated that IMP1, IMP2, and IMP3 are all expressed in undif-
ferentiated human ESC lines H9 and HUES6 and an induced
pluripotent stem cell (iPSC) line, whereas IMP2 is also expressed
in the parental fibroblasts from which the iPSC line was gener-
ated (Figure 1C). Further, immunohistochemical staining (Fig-
ure 1D) and subcellular fractionation (Figure 1E) in H9 hESCs
demonstrated dominant cytoplasmic localization of all three
IMP proteins. Thus, we selected H9 hESC to identify the RNA tar-
gets of IMP proteins in pluripotent stem cells.

Figure 2. Identification of RNA Binding Targets of IMP1, IMP2, and IMP3 in hESCs by eCLIP
(A) Schematic of enhanced CLIP protocol. In brief, H9 hESCs were subjected to UV-mediated crosslinking, lysis, and treatment with limiting amount of RNase,
followed by immunoprecipitation (IP) of protein-RNA complexes. RNA fragments protected from RNase digestion were subjected to 30 RNA linker ligation,
reverse-transcription and 30 DNA linker ligation to generate eCLIP libraries for high-throughput Illumina sequencing. In addition, a size-matched input (SMInput)
library was generated for each IMP protein (see the Experimental Procedures for further details).
(B) Identification of IMP1-bound regions. For each gene in Gencode v19, read density was counted separately for 30 UTR (blue), CDS (red), or introns (teal).
Scatterplot indicates fold enrichment for each region in IMP1 eCLIP relative to paired SMInput (y axis), plotted against read density in SMInput (x axis). Open
circles indicate significant enrichment (p % 10�5 and R4-fold) in eCLIP relative to SMInput.
(C–F) Scatter plots indicate correlation between region-based fold enrichment in eCLIP for (C) IMP1 biological replicates, (D) IMP1 versus RBFOX2, (E) IMP1
versus IMP2, and (F) IMP1 versus IMP3. For each, regions from all genes meeting a minimal read depth criteria are shown, with least-squares regression line
indicated by the dotted line.
(G) Histogram of region-based fold enrichment for IMP family members IMP1, IMP2, and IMP3, unrelated splicing regulator RBFOX2, and an IgG negative control
(each compared to its paired SMInput).
See also Figures S1 and S2 and Tables S1 and S2.
Please cite this article in press as: Conway et al., Enhanced CLIP Uncovers IMP Protein-RNA Targets in Human Pluripotent Stem Cells Important forCell Adhesion and Survival, Cell Reports (2016), http://dx.doi.org/10.1016/j.celrep.2016.03.052
To uncover molecular pathways in PSCs regulated by IMP
proteins, we utilized an enhanced iCLIP (eCLIP) protocol to iden-
tify transcriptome-wide RNA targets of the IMP proteins (Konig
et al., 2011; Van Nostrand et al., 2016). Briefly, H9 hESCs were
subjected to UV-mediated crosslinking, lysis, and treatment
with limiting amount of RNase, followed by immunoprecipitation
(IP) of protein-RNA complexes using commercially available
antibodies that specifically recognize IMP1, IMP2, or IMP3 (Fig-
ures 2A and S1A). RNA fragments protected from RNase
digestion by IMP protein occupancy were subjected to 30 RNAlinker ligation, reverse-transcription, and 30 DNA linker ligation
to generate eCLIP libraries for high-throughput Illumina
sequencing. eCLIP improves these ligations to >70% efficiency,
significantly increasing the number of non-PCR duplicate reads
that can be obtained after high-throughput sequencing (Van
Nostrand et al., 2016). Specificity of the antibodies was evalu-
ated by western blotting with recombinant human IMP1,
IMP2, and IMP3 proteins (Figure S1A). Co-immunoprecipitation
experiments in H1 hESCs demonstrate that the IMP1 and
IMP2 antibodies do not enrich any of the other family members,
while IMP3 appears to slightly co-immunoprecipitate IMP1
(Figure S1B).
We generated biological replicate eCLIP libraries for IMP1
and IMP2 and single replicates for IMP3, a negative control
(IgG-only IP) and an unrelated RBP (RBFOX2) (Figures S1C
and S1D). The improved efficiency of eCLIP enabled us to
Cell Reports 15, 1–14, April 19, 2016 3

Please cite this article in press as: Conway et al., Enhanced CLIP Uncovers IMP Protein-RNA Targets in Human Pluripotent Stem Cells Important forCell Adhesion and Survival, Cell Reports (2016), http://dx.doi.org/10.1016/j.celrep.2016.03.052
generate a size-matched input (SMInput) library for each biolog-
ical sample, in which 2% of the pre-immunoprecipitation sample
was subjected to identical library generation steps including
ribonuclear protein complex size-selection on nitrocellulose
membranes. In total, ten eCLIP (including SMInput) libraries
were sequenced to �15 million reads, of which �70% mapped
uniquely to the human genome, and �58%–93% of the uniquely
mapped reads are distinct after accounting for PCR duplicates
(Table S1).
Enrichment of IMP1 and IMP2 Binding to 30 UTRsTo identify which annotated gene regions are preferentially
bound by the IMP proteins, we first evaluated the biological
reproducibility of eCLIP (including SMInput) data. Read density
within full-length annotated gene regions, namely coding exons
(CDS), introns, and 30 UTRs, were highly correlated across repli-
cates for the IMP proteins (R2 values of �0.9; Figures S2A and
S2B), as well as between IMP proteins and their individually
paired SMInput (R2 values of �0.7; an example IMP1 replicate
is shown in Figure S2C) and IgG (R2 values of �0.5; example
IMP1 replicate shown in Figure S2D). These high correlations
were expected due to intrinsic biological biases in gene expres-
sion and shared technical variations in shearing and amplifica-
tion. Therefore, as a more accurate measure of enrichment
(signal) over background, we computed the fold enrichment in
the IP in comparison to the paired SMInput within each region
(Figures 2B and S2E–S2H; Table S2). Biological replicates of
IMP1 and IMP2 showed significant correlation in fold enrichment
(R2 > 0.46) (Figures 2C and S2I). In contrast, neither IMP1 nor
IMP2 showed correlation of binding signal at CDS or 30 UTRswith either IgG or unrelated RBP RBFOX2 (all R2 < 0.04; Figures
2D and S2J–S2L).
The region fold enrichments between the paralogs IMP1 and
IMP2 were also highly correlated (R2 > 0.37; Figures 2E and
S2M). Unexpectedly, despite having the same domain architec-
ture and cytoplasmic localization as IMP1 and IMP2, IMP3
binding within coding exon regions was not correlated with
either IMP1 or IMP2 (R2 % 0.03; Figures 2F and S2N). Further-
more, we observed that rather than interacting with a specific
limited set of RNA substrates, there was widespread enrich-
ment in binding to particular regions within genes, as 30 UTRswere enriched for IMP1 and IMP2 binding by 2.7- to 4.4-fold
(median values) above SMInput IP (Figures 2B, 2G, and S2E).
This was notably higher than coding exons, which were
enriched by only 1.2- to 1.7-fold. Analysis of IMP3 binding re-
vealed an opposite trend, as coding exons were 2.9-fold-
enriched while 30 UTRs were only 2.3-fold-enriched (Figures
2G and S2F). Consistent with their cytoplasmic localization,
depletion of intronic signal globally across all introns was
observed for all three IMP family members (depleted 1.9- and
2.3-fold for IMP1, 1.8- and 2.1-fold for IMP2, and 1.7-fold for
IMP3, respectively) (Figures 2B, 2G, and S2E–S2H). These
global enrichments for coding exons (depleted in both) or
30 UTRs were not observed for IgG or RBFOX2 (1.3-fold-en-
riched in IgG, depleted in RBFOX2). We conclude that the
IMP1 and IMP2 proteins exhibit remarkably similar binding
preferences to 30 UTRs of mature mRNAs, and IMP3 binding
is enriched for coding exons.
4 Cell Reports 15, 1–14, April 19, 2016
Discovery of Reproducible IMP1 and IMP2 Binding Sitesby Input NormalizationDue to their similarity in 30 UTR preferences, we chose to
continue evaluating IMP1 and IMP2. To identify high resolution
IMP1 and IMP2 binding sites, standard CLIP-seq cluster discov-
ery was performed using CLIPper (Lovci et al., 2013). We identi-
fied 62,784 and 95,577 clusters for two biological replicates of
IMP1 and 57,648 and 66,928 clusters for IMP2 replicates, with
cluster sizes 36–40 bases on average (Figures 3A and S3A; Table
S1). Next, as SMInput normalization significantly improves
signal-to-noise in identifying true binding sites (Van Nostrand
et al., 2016), we compared the read density in IP and SMInput
within clusters to compute the enrichment of each cluster above
SMInput (Figure S3B). As in the regional comparisons, fold
enrichment at the cluster level exhibited high correlation across
biological replicates (R values 0.54 and 0.51 for IMP1 and IMP2,
respectively), whereas low correlation was observed when IMP1
(or IMP2) was compared to IgG or RBFOX2 (Figures S3C–S3F).
Additionally, ranking clusters by fold enrichment makes them
amenable to irreproducible discovery rate (IDR) analysis, a stan-
dardmetric to evaluate the reproducibility of binding sites across
biological replicates (Li et al., 2011). We observed that IMP1-
IMP1 or IMP2-IMP2 comparisons yielded thousands of repro-
ducible clusters at a 0.01 IDR threshold (where 1% of peaks
do not reproduce), whereas identical comparisons with IgG or
RBFOX2 yielded less than ten reproducible clusters (Figure 3B).
These orthogonal computational approaches indicate that
eCLIP of IMP1 and IMP2 yield highly reproducible binding at
both the cluster and read-density-within-cluster levels.
For further analysis, we identified a set of 1,884 and 7,004
high-confidence peaks in IMP1 and 1,572 and 4,494 in IMP2
that meet stringent enrichment criteria (p % 10�5 and R8-fold-
enriched versus SMInput) (Figures 3A and S3A). In contrast,
IgG eCLIP identified only 142 clusters that satisfy these criteria.
These stringent binding sites were highly reproducible, as over
66%of stringent clusters identified in the first biological replicate
overlapped clusters in the second for both IMP1 and IMP2 (Fig-
ures 3A and S3A). Consistent with our regional analyses, IMP1
and IMP2 binding sites were generally located within the
30 UTR and to a lesser extent, within coding exons (Figures 3C,
S3I, and S3J). Thus eCLIP identifies thousands of highly confi-
dent and reproducible IMP1 and IMP2 binding sites.
High-Resolution IMP1 and IMP2 Binding Is HighlyCorrelatedAs we observed substantial correlation between IMP1 and IMP2
binding at the region level, we next compared IMP1 and IMP2
at the binding site level. Pairwise comparisons indicated 2,495
and 4,301 peaks (at the 0.01 IDR threshold), on par with that
observed for biological replicates (Figure 3B). We further
observed high correlation of input-normalized signal intensity
(R = 0.42 and 0.47 for IMP1Rep1 versus IMP2Rep2 and IMP1Rep2versus IMP2Rep1, respectively), indicating that the association
of IMP1 and IMP2 is highly similar across thousands of binding
sites (Figures S3G and S3H). To test whether these factors
were associating to the same short regions or simply binding
nearby each other, we next considered the distribution of read
intensity around peak centers. Considering a window of 600-nt

Figure 3. Reproducible Peaks Reveal Correlated Binding of IMP1 and IMP2
(A) Clusters of enriched read density within IMP1 eCLIP are identified for each biological replicate by CLIPper (gray). Comparison of cluster read density in eCLIP
and paired SMInput identifies a subset of clusters enriched above SMInput (red/orange; also see Figure S3B), which show high overlap between replicates
(center). See Figure S3A for IMP2.
(B) Irreproducible discovery rate (IDR) analysis comparing peak fold enrichment across various datasets are indicated. Rep1 was used unless otherwise
indicated.
(C) Pie chart indicates the distribution of significantly enriched IMP1 peak locations across the transcriptome for replicating peaks described in (A). See Figure S3I
for all (including non-significant) IMP1-enriched clusters and Figure S3J for IMP2.
(D) Plot indicates the normalized read density for indicated eCLIP experiments (Rep2 for IMP1 and IMP2), centered around the midpoint of significantly enriched
IMP1 peaks (described in A) identified from an independent biological replicate (Rep1). Read densities across each peak region were normalized within the 600 nt
window, and mean (points) and SEM (error bars) were calculated across all peaks for both eCLIP and paired SMInput datasets as indicated.
See also Figure S3 and Table S2.
Please cite this article in press as: Conway et al., Enhanced CLIP Uncovers IMP Protein-RNA Targets in Human Pluripotent Stem Cells Important forCell Adhesion and Survival, Cell Reports (2016), http://dx.doi.org/10.1016/j.celrep.2016.03.052
centered on the midpoint of IMP1 peaks from an independent
biological replicate, we observed that both IMP1 and IMP2
read density are enriched at the peak centers (Figure 3D).
Thus, despite the IMP1 and IMP2 antibodies showing very little
cross-immunoprecipitation (Figure S1B), analysis of our eCLIP
data at both the region- and cluster-level indicates that IMP1
and IMP2 binding signals are as highly correlated as biological
replicates of IMP1 or IMP2.
RNA Bind-N-Seq Identifies CA-Rich Motifs Enriched inCoding and 30 UTR Binding SitesTo characterize the sequence specificity of IMP proteins, we
applied RNA Bind-N-seq (RBNS) (Lambert et al., 2014) to puri-
fied full-length human IMP1 and IMP2. After incubation of protein
with randomized RNA pools, affinity purification, and high-
throughput sequencing, we performed motif analysis to calcu-
late enrichment over input (R) values (Figures 4A, S4A, and
S4B). This identified two CA-rich motifs for each IMP: a primary
motif exemplified by AY(A)1YA and secondary motif exemplified
by Y(A)2YA (Figures 4B and 4C), with many enriched 6-mers
(52% for IMP1, 49% for IMP2) containing one of four 4-mers
(CACA, UACA, AACA, CAUA), similar to previously identified
IMP motifs (Alipanahi et al., 2015; Hafner et al., 2010; Ray
et al., 2013). We observed a high correlation between IMP1
and IMP2 6-mer enrichments (R2 = 0.788) (Figure 4D), whereas
IMP1 and RBFOX2 were uncorrelated (R2 = 0.018) (Figure 4E),
indicating that the RBNS assay captured IMP-specific binding
signatures.
Next, we interrogated whether hESC IMP binding sites identi-
fied by eCLIP were enriched for the RBNS-identified in vitro
motifs. We found that hexamers containing the CACA core
sequence were shifted toward higher IMP1 RBNS enrichments,
and they also showed greater enrichments among IMP1 eCLIP
30 UTR and CDS binding sites than other hexamers (Figures 4F
and S4C). Other RBNS motifs (UACA, AACA, CAUA) showed
more variable enrichment, suggesting a distinguishable dif-
ference between in vitro and in vivo binding preferences (Figures
4F–4H). The enrichment for the CACA motif was more signifi-
cant when using the subset of stringent CLIP-enriched peaks,
consistent with these peaks having improved signal-to-noise
Cell Reports 15, 1–14, April 19, 2016 5

Figure 4. RNA Bind-N-Seq Identifies an AC-Rich Preference for IMP1 and IMP2 Binding
(A) Schematic of RNA Bind-N-seq (RBNS) protocol.
(B and C) Motif logos with corresponding probability bar graphs made from aligning enriched 5-mers for IMP1 (B) and IMP2 (C). All 5-mers with an enrichment
Z score R2 with two or fewer mismatches to the most-enriched 5-mer were aligned to create top logo; remaining 5-mers with enrichment Z score R2 were
aligned to create bottom logo. Probabilities in left bar graph are proportional to the summed enrichments of all 5-mers aligned in each logo.
(D and E) Comparison of 6-mer enrichments (RBNSR values) in IMP2 (D) or RBFOX2 (E) versus IMP1. 6-mers containing one of the top four non-overlapping IMP1
4-mers are colored, and significant enrichment (Z score R2) is indicated by dotted lines.
(F–H) Comparison of RBNS and eCLIP k-mer enrichment. 6-mers containing a CACA 4-mer (red), TACA 4-mer (navy), AACA 4-mer (light blue), and TACA 4-mer
(magenta) are highlighted. (F–G) IMP1 RBNS enrichment of all 6-mers (x axis) is plotted against (F) enrichment in all reproducible eCLIP 30 UTR clusters, or (G)
stringent reproducible 30 UTR peaks only (as described in Figure 3A). (H) IMP2 RBNS enrichment plotted against motif enrichment in IMP2 stringent eCLIP
clusters.
See also Figure S4.
6 Cell Reports 15, 1–14, April 19, 2016
Please cite this article in press as: Conway et al., Enhanced CLIP Uncovers IMP Protein-RNA Targets in Human Pluripotent Stem Cells Important forCell Adhesion and Survival, Cell Reports (2016), http://dx.doi.org/10.1016/j.celrep.2016.03.052

Please cite this article in press as: Conway et al., Enhanced CLIP Uncovers IMP Protein-RNA Targets in Human Pluripotent Stem Cells Important forCell Adhesion and Survival, Cell Reports (2016), http://dx.doi.org/10.1016/j.celrep.2016.03.052
(Figures 4G and S4D). IMP2 showed similar enrichment for CA-
rich sequences in both RBNS and eCLIP binding sites (Fig-
ure 4H). Thus, these results demonstrate that IMP1 and IMP2
interact with CA-rich sequences in vitro, and this preference
can be observed for coding and 30 UTR binding sites in vivo.
Integrated IMP1 eCLIP and RNA-Seq Data ImplicatesIntegrin mRNAs in IMP1-Mediated Cell AdhesionDefectsNext, we utilized our IMP1 binding data to provide insight into the
direct regulatory roles of IMP1. To evaluate if loss of IMP1
affected mRNA expression, IMP1 was depleted in H9 hESCs us-
ing lentiviral transduction of independent short-hairpin RNAs
(shRNAs) that specifically target IMP1 (hereafter referred to as
IMP1 knockdown [IMP1KD] cells) (Figures S5A and S5B). Total
RNA was extracted from three biologically independent trans-
ductions of IMP1 shRNA and two transductions of a non-target-
ing shRNA to generate RNA-seq libraries, which were then
sequenced (Figure S5C). Of the 17,013 expressed genes
analyzed, we identified 257 decreased and 467 increased genes
with significantly altered expression (R2-fold and p % 0.05
versus non-targeting control) upon IMP1 depletion (Figure S5D).
When we compared global IMP1 RNA targets to genes affected
by IMP1 depletion, we did not observe any meaningful correla-
tion between genes that were bound and trends in gene expres-
sion changes (Figure S5E).
Nevertheless, when we considered the most CLIP-enriched
30 UTRs for IMP1, we observed significant enrichment for genes
involved in cell-cell and cell-extracellular matrix (ECM) adhesion
(Figure 5A). As IMP1 regulation of cell adhesion has been well
characterized in cancer cell-lines (Gu et al., 2012; Vikesaa
et al., 2006), we performed a quantitative crystal violet adher-
ence assay following IMP1 depletion to determine whether loss
of IMP1 affected adhesion in H9 hESCs. We found that IMP1KD
cells showed significantly decreased adherence compared to
control shRNA-treated cells (p < 0.05), even within the first
hour after plating, indicating that cell adhesion is also affected
by loss of IMP1 in hESCs (Figures 5B–5D). We also observed
that the actin cytoskeleton and cytoskeletal organization ap-
peared disrupted upon IMP1 depletion (Figures S5F and S5G).
However, analysis of our RNA-seq data did not indicate altered
RNA levels of known IMP1 targets previously shown to modulate
cell adhesion, such asCTNNB1 (in breast cancer cells) (Gu et al.,
2008) orCD44 (in adenocarcinoma cells) (Vikesaa et al., 2006). In
particular, despite having enriched IMP 30 UTR binding (Fig-
ure S5H), we could observe no mRNA or protein change for
CTNNB1 in IMP1KD cells (Figure S5I). Similarly, although the
F-actin anchoring, cell adhesion protein vinculin (VCL) was one
of the most enriched genes in our eCLIP dataset (over 20-fold-
enriched relative to SMInput), VCL did not appear to be affected
at the RNA or protein level upon loss of IMP1 (Figures S5J and
S5K). Thus, we observe cell adhesion defects as a consequence
of IMP1 depletion in hESCs, but the phenotype cannot be ex-
plained simply by regulation through previously characterized
IMP1 targets.
Given that IMP1 binding alone was insufficient to predict
mRNA level effects, we next focused on IMP1 target genes
that harbored enriched binding sites in the 30 UTR and whose
levels were also affected in the IMP1KD RNA-seq data. Surpris-
ingly, we observed that multiple genes in the integrin family
were bound by IMP1 and were downregulated upon depletion
of IMP1 (Figures 5E and 5F). Integrins are known to have signif-
icant roles in extracellular signaling and cell adhesion across
various systems, with ITGB5 and ITGB1 specifically described
to play key roles in human stem cell maintenance and cell adhe-
sion (Braam et al., 2008). Interestingly, ITGB5 was the most
downregulated of all of the integrin genes and contained regions
of enriched read density within the 30 UTR compared to SMInput
or RBFOX2 (Figure 5G). We performed RNA immunoprecipita-
tion (RIP) followed by RT-PCR in an independent hESC line
(HUES6) and observed IMP1 enrichment on ITGB5, with ACTB
mRNA as a positive control (Ross et al., 1997) (Figure 5H),
validating the interaction between IMP1 and ITGB5 mRNA.
Additionally, we confirmed downregulation of ITGB5 and
ITGB1 mRNAs in IMP1KD cells using two independent shRNAs
(Figure 5I) and further observed significant depletion of ITGB5
protein upon IMP1 loss (Figure 5J).
Next, we considered potential mechanisms for IMP1 regula-
tion of ITGB5. To test whether IMP1 affects ITGB5 mRNA levels
post-transcriptionally at the level of mRNA turnover, we treated
hESCs with actinomycin D (ActD) to inhibit the transcription of
newly transcribed RNA and collected total RNA after 60 and
120 min. Quantification of mRNA levels by qRT-PCR revealed
that ITGB5 was destabilized more quickly in the IMP1KD cells
compared to cells treated with a control shRNA (Figure 5K).
Interestingly, ITGB1 did not show this destabilization upon
IMP1 depletion (Figure S5L), confirming specificity of this
approach and indicating that IMP1 may regulate various integ-
rins differently. Taken together, these results indicate that
the well-characterized role of IMP1 in maintaining proper
cell-cell interactions is conserved in hESCs, but that the
downstream effectors in hESCs include unanticipated integrin
targets like ITGB5, which is regulated at the level of mRNA
turnover.
IMP1 Target BCL2 Enhances Survival of IMP1-DepletedhESCsIn addition to cytoskeletal defects, depletion of IMP1 also led to a
drastic reduction in hESC colony size (Figure 6A). Embryoid
bodies derived from IMP1KD cells were substantially and consis-
tently smaller than those derived from controls (Figure S6A). In
order to determine whether depletion of IMP1 led to a decrease
in proliferation, which could explain a decrease in colony size, we
performed fluorescence-activated cell sorting (FACS) analysis
using the proliferation antigen KI-67. We observed only a slight,
but insignificant, difference between IMP1-depleted and control
cells using two independent shRNAs targeting IMP1 (Fig-
ure S6B). To further analyze a potential role for IMP1 in hESC
proliferation, cell-cycle analysis was conducted by BrdU and
propidium iodide (PI) staining followed by FACS. IMP1KD cells
exhibited a moderate, but significant decrease in the S phase
population (p < 0.01), along with an increase in the number of
cells in G2 (p < 0.05) (Figure S6C). Supporting the hypothesis
that a loss of IMP1 leads to an increase in cell death, we detected
a statistically significant increase in Annexin V-positive IMP1KD
cells compared to controls by FACS (p < 0.05) (Figure 6B).
Cell Reports 15, 1–14, April 19, 2016 7
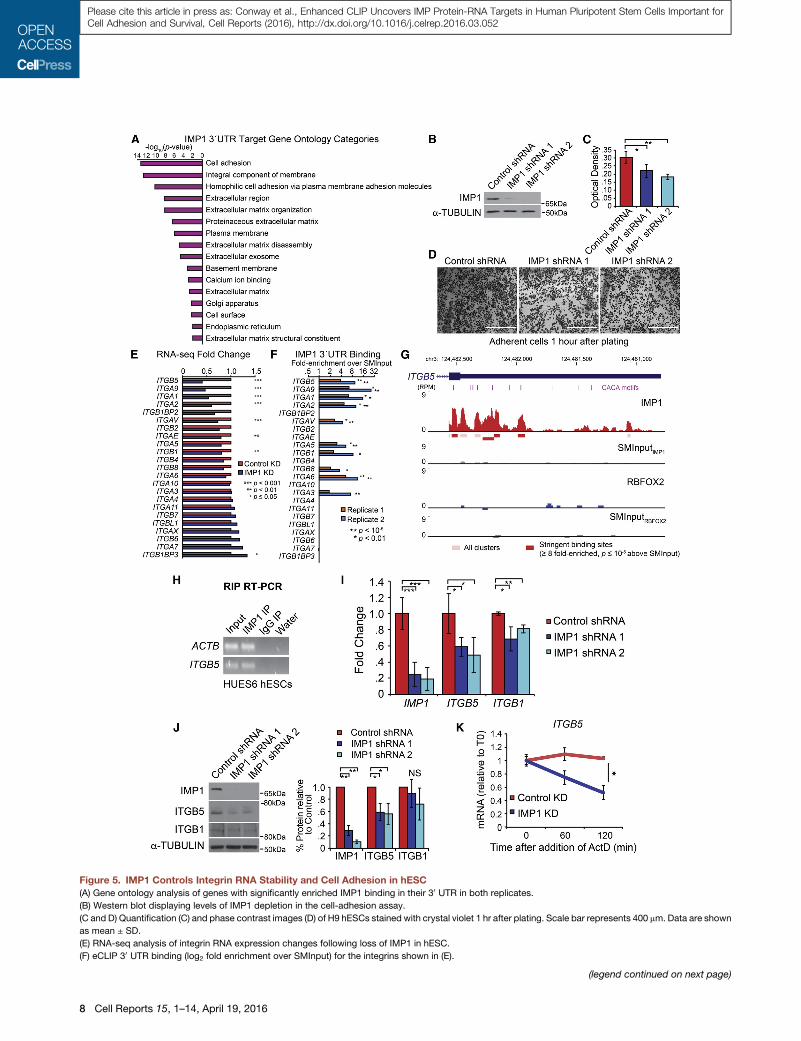
Figure 5. IMP1 Controls Integrin RNA Stability and Cell Adhesion in hESC
(A) Gene ontology analysis of genes with significantly enriched IMP1 binding in their 30 UTR in both replicates.
(B) Western blot displaying levels of IMP1 depletion in the cell-adhesion assay.
(C and D) Quantification (C) and phase contrast images (D) of H9 hESCs stained with crystal violet 1 hr after plating. Scale bar represents 400 mm. Data are shown
as mean ± SD.
(E) RNA-seq analysis of integrin RNA expression changes following loss of IMP1 in hESC.
(F) eCLIP 30 UTR binding (log2 fold enrichment over SMInput) for the integrins shown in (E).
(legend continued on next page)
8 Cell Reports 15, 1–14, April 19, 2016
Please cite this article in press as: Conway et al., Enhanced CLIP Uncovers IMP Protein-RNA Targets in Human Pluripotent Stem Cells Important forCell Adhesion and Survival, Cell Reports (2016), http://dx.doi.org/10.1016/j.celrep.2016.03.052

Please cite this article in press as: Conway et al., Enhanced CLIP Uncovers IMP Protein-RNA Targets in Human Pluripotent Stem Cells Important forCell Adhesion and Survival, Cell Reports (2016), http://dx.doi.org/10.1016/j.celrep.2016.03.052
Additionally, we observed a significant increase in levels of
cleaved-Caspase 3 upon reduction of IMP1, but not in control-
treated hESCs (Figure 6C). Together, these results strongly indi-
cate that IMP1 plays an important role in hPSC survival.
To determine the molecular mechanism by which IMP1 im-
pacts hESC survival, we examined anti-apoptotic factors in
our IMP1KD RNA-seq data as candidate targets of IMP1 and
found that BCL2 (B cell lymphoma 2) was decreased by 2-fold
(Table S4). This decrease in BCL2 was confirmed at the
mRNA level by qRT-PCR (Figure 6D) and at the protein level by
western blot analysis (Figures 6C and S6D). Interestingly, the
BCL2 30 UTR contains CA-rich sequences (Figure S6E) and
was >2-fold-enriched over SMInput in both IMP1 eCLIP data-
sets; however, BCL2 fell below our standard significance cutoffs
due to low RNA expression (Table S2). Nevertheless, we
confirmed IMP1 binding by performing RIP followed by RT-
PCR in HUES6 hESCs (Figure 6E). To further investigate IMP
binding preferences to CA-rich sequences, as previously shown
by RBNS, we performed an electrophoretic mobility shift assay
(EMSA) with full-length recombinant human IMP1 protein and
both wild-type (WT) and mutated versions of the BCL2 30 UTR(88 bp segments, see Experimental Procedures). The wild-type
ACTB zipcode (IMP binding site) and a truncated ACTB zipcode
were used as positive and negative controls, respectively. We
were able to detect an interaction between IMP1 and the wild-
type BCL2 30 UTR in vitro using 200 nM recombinant IMP1
protein (Figure 6F). Upon mutation of the CACA motif to GAGA,
the binding affinity was dramatically reduced, indicating that
IMP1 interacts specifically with the CA-rich motif that constitutes
an IMP1 binding site within BCL2 30 UTR. Finally, to evaluate
whether restoring levels of BCL2 can suppress cell death as a
consequence of IMP1 depletion, we utilized a doxycycline-
inducible lentiviral system (Ardehali et al., 2011) to ectopically ex-
press BCL2 in IMP1KD hESCs. Using the Caspase-Glo assay we
measured apoptosis following a titration of BCL2 overexpression
with doxycycline and found that BCL2 is able to rescue the
IMP1KD cell death phenotype (Figures 6G, S6F, and S6G). There-
fore, our data indicate that one pro-survival function of IMP1 in
hESCs is to maintain adequate levels of BCL2 mRNA and,
consequently, maintain its anti-apoptotic activity.
DISCUSSION
Using systematic, transcriptome-wide mapping with eCLIP, we
identified thousandsof IMP1, IMP2, and IMP3binding siteswithin
RNA targets in hESCs. IMP1 and IMP3 are typically viewed as the
most related familymembers, with greater similarity at the protein
sequence level (Nielsen et al., 1999), expression patterns across
(G) Read density tracks show read density for IMP1 (Rep2; red), RBFOX2 (blue), an
boxes below tracks, with significantly enriched peaks indicated as darkly colore
(H) RNA immunoprecipitation for ITGB5 in HUES6 hESCs. ACTB is shown as a p
(I) qRT-PCR validation of ITGB1 and ITGB5 expression changes by RNA-seq, nor
(J) ITGB1 and ITGB5 protein levels following depletion of IMP1 in H9 hESCs. An a
on the right (replicates are normalized to the corresponding b-tubulin sample).
(K) Actinomycin D RNA stability assay. Expression of ITGB5 was measured by qR
hESCs and normalized to PPIA and RPLP0, genes determined not to change over
indicates significance of p < 0.05 by unpaired t test).
See also Figure S5 and Tables S3 and S4.
tissuesanddevelopment (Bell et al., 2013) andco-immunoprecip-
itation during CLIP (Figure S1B), whereas IMP2 has been associ-
ated with more distinct roles, such as in metabolism (Dai et al.,
2011, 2015; Janiszewska et al., 2012). Thus, hESCs (that express
IMP1, IMP2, and IMP3) present a unique opportunity to observe
redundant or co-regulation of RNA targets by multiple IMP family
members.Surprisingly,weobservedsubstantial overlapbetween
IMP1and IMP2binding thatwas not observedbetween IMP1 and
IMP3, indicating it is not simply an artifact of analyzing cyto-
plasmic factors with CLIP. Despite the large number of IMP1-
bound mRNAs and quite dramatic phenotypes upon knockdown
of IMP1 in hESCs, we observed relatively few transcripts strongly
bound by IMP1 to be altered when RNA-seq was performed
in hESCs depleted of IMP1. In contrast, previous studies in
HEK293 cells observed a small but significant shift toward
decreased expression (presumably by decreased RNA stability)
of IMP targets when all three IMP proteins were simultaneously
depleted (Hafner et al., 2010). These results suggest that IMP fam-
ily members may share redundant regulatory roles, particularly
during development and in cancer whenmultiple familymembers
are expressed at high levels. The distinct binding to CDS regions
observed for IMP3 suggests that further studies may yet reveal
additional regulatory rolesdistinct from IMP1, although thesevere
phenotypes observed upon individual knockdown by shRNA of
IMP1 and IMP2 presents a challenge to detailed characterization
of redundancy among IMP family members in hESCs.
At the region-level, we observed significant IMP1 binding to a
substantial fraction of all 30 UTRs. Although such widespread
binding has been described for core RNA processing factors,
such as the nonsense-mediated decay regulator UPF1 (Lee
et al., 2015), previous studies of IMP have largely focused on a
small number of specific targets. Although the degree of wide-
spread binding is unexpected, it may help to explain why
detailed studies of individual IMP targets have not identified
one specific mechanism or pathway of regulation; rather, IMP
binding has been shown to participate in a broad range of RNA
processing regulation steps, including mRNA stability (Leeds
et al., 1997), mRNA localization (Atlas et al., 2007; Ross et al.,
1997), both inhibition of and enhancement of translation (Dai
et al., 2011; Nielsen et al., 1999), and even potentially nuclear
export (H€uttelmaier et al., 2005; Wu et al., 2015). Thus, consid-
ering IMPs as broad regulators may provide insight into how
these factors can achieve these various roles. Future work will
be needed to better characterize how different IMP targets are
directed toward distinct regulatory mechanisms.
Although standard UV254 crosslinking provides specificity by
requiring interacting molecules to have reactive groups within
one bond length apart (Wagenmakers et al., 1980), the frequency
d paired SMInputs (gray) across the 30 UTR of ITGB5. Clusters are indicated as
d boxes.
ositive control.
malized to HMBS, GAPDH, and 18s (error bars represent mean ± SEM, n = 3).
verage of three independent experiments quantified by densitometry is shown
T-PCR at different time points following addition of 10 mM actinomycin D in H9
the given time period (error bars represent mean ± SEM, n = 3; a single asterisk
Cell Reports 15, 1–14, April 19, 2016 9

Figure 6. IMP1 Promotes Cell Survival through Regulation of BCL2
(A) Phase contrast images of H9 hESCS following depletion of IMP1. Scale bar, 1 mm.
(B) Shown is a representative image of flow cytometry analysis and quantification of Annexin V expression following depletion of IMP1 (error bars represent
mean ± SD, n = 3).
(C) Cleaved-caspase 3 and BCL2 protein expression following depletion of IMP1 in H9 hESCs by western blot.
(D) qRT-PCR validation of BCL2 expression following depletion of IMP1, with expression normalized to average of HMBS,GAPDH, and 18s (error bars represent
mean ± SEM, n = 3).
(E) RNA immunoprecipitation (RIP) for BCL2 in HUES6 hESCs using antibodies that target either IMP1 or IgG.
(F) EMSA results depicting IMP1 binding preferences for ACTB WT, ACTB truncated, BCL2 WT, and BCL2D RNAs. One representative experiment is shown.
(G) Caspase-Glo apoptosis assay. BCL2 protein was induced with increasing amounts of doxycycline after which apoptosis was measured via luminescence
using the Caspase-Glo 3/7 assay. A single asterisk indicates significance of p < 0.05, and two asterisks indicate significance of p < 0.01, determined by unpaired
t test. Data are shown as mean ± SD.
See also Figure S6 and Tables S3 and S4.
Please cite this article in press as: Conway et al., Enhanced CLIP Uncovers IMP Protein-RNA Targets in Human Pluripotent Stem Cells Important forCell Adhesion and Survival, Cell Reports (2016), http://dx.doi.org/10.1016/j.celrep.2016.03.052
of crosslinking is substantially decreased at non-Uridine bases
(Sugimoto et al., 2012), limiting the ability of IMPs to crosslink
at a CA-rich motif. Thus, to complement our eCLIP profiling
data, we performed RBNS to characterize the in vitro binding
motif for full-length IMP1 and IMP2 proteins (each including all
six RNA binding domains). This method revealed that recombi-
nant IMP1 and IMP2 proteins harbor strong preferences for
CA-rich motifs with a degenerate CAU within them, correlating
well with theMAHWCAmotifs identified for IMP2 and IMP3 using
an independent in vitro method RNACompete (Ray et al., 2013)
as well as the CA motif identified in DeepBind re-analysis of
RNACompete data (Alipanahi et al., 2015). Profiling in vivo by
10 Cell Reports 15, 1–14, April 19, 2016
PAR-CLIP identified a similar but slightly altered motif (CAU)
(Hafner et al., 2010), possibly influenced by crosslinking at 4SU
nucleotides in PAR-CLIP. These motifs all share strong similarity
with motifs described by detailed molecular studies of individual
IMP targets (Chao et al., 2010). The CA-rich motif was signifi-
cantly enriched in eCLIP peaks, providing further validation
that this motif likely represents a major component of IMP1
and IMP2 binding. As IMP binding is often complex, requiring
specific spacing of associated motifs to drive dimerization
(potentially of multiple IMP family members) (Nielsen et al.,
2004), more detailed biochemical studies should provide insight
into whether the CA repeat is more critical for binding initiation or

Please cite this article in press as: Conway et al., Enhanced CLIP Uncovers IMP Protein-RNA Targets in Human Pluripotent Stem Cells Important forCell Adhesion and Survival, Cell Reports (2016), http://dx.doi.org/10.1016/j.celrep.2016.03.052
stabilization of IMP complexes and what role these other motifs
play in directing IMP target recognition.
Given the relatively small transcriptome change observed
upon IMP1 knockdown in hESCs, we were surprised to observe
that loss of IMP1 led to dramatic cellular phenotypes, including
increased apoptosis and a loss of cell adhesion and cytoskeletal
integrity. As IMP roles in maintenance of cell adhesion have been
previously described (Gu et al., 2012; Vikesaa et al., 2006), we
asked whether the cell adhesion defect in hESCs could be ex-
plained by known or novel targets. We observed that there
was a specific enrichment for downregulation of integrinmRNAs,
particularly those most strongly bound by IMP1 (Figure 5).
Further analysis validated IMP regulation of the stability of
ITGB5. These results indicate that in addition to known IMP1 reg-
ulatory targets such asCTNNB1 andCD44 that play critical roles
in maintenance of proper cell adhesion (Gu et al., 2012; Vikesaa
et al., 2006), the integrin family represents an additional cell
adhesion regulatory mechanism for IMP1. Future work to deter-
mine whether integrin regulation by IMP1 is specific to hESCs or
affects cell adhesion in other systems and the direct mecha-
nisms (including additional co-factors) through which IMP1 bind-
ing modulates stability of ITGB5 will provide further insight into
the cell-type-specificity of the mechanisms through which
IMPs regulate cell adhesion.
Although loss of cell adhesion partially explains the dramatic
hESC cell viability defect upon IMP1 knockdown, we noted
that apoptotic markers were also increased. Global analyses of
either eCLIP-bound or differential transcripts did not show gen-
eral enrichments for apoptosis or related pathways. However,
closer inspection of IMP1 bound and responsive targets identi-
fied BCL2, which encodes a critical anti-apoptotic protein, as
another IMP1 target that decreases upon IMP1 depletion in
hPSCs. Pursuing this further due to the well-characterized roles
of BCL2 inmediating apoptotic signals, we found that re-expres-
sion of BCL2 in hESCs partially rescued the cell death phenotype
resulting from IMP1 depletion in a dose-dependentmanner, con-
firming the contribution of BCL2 to IMP1 knockdown pheno-
types in hESCs. The linkage of IMP1 with direct regulation of
BCL2 further associates IMP1 with known oncogenic pathways
and may provide an interesting avenue for further studies of
IMP1 in other cell types, particularly with respect to understand-
ing its roles in modulating tumorigenesis and metastasis. Thus,
our results indicate that we are far from an exhaustive list of func-
tional IMP family targets, and further elucidation of the direct and
regulated targets of IMP proteins in their various cellular contexts
(whether in normal or cancerous cell-types) may provide insights
into the distinct and shared roles these proteins play in develop-
ment and tumorigenesis.
EXPERIMENTAL PROCEDURES
eCLIP-Seq Experimental Procedures
UV-crosslinked (103 106) (400 mJ/cm2 constant energy) H9ES (IMPs, IgG) or
H1ES (RBFOX2) cellswere lysed in iCLIP lysis buffer and sonicated (BioRuptor).
Lysate was treated with RNase I (Ambion) to fragment RNA, after which IMP1
(MBL, #RN007P), IMP2 (MBL, #RN008P), IMP3 (MBL, #RN009P), RBFOX2
(Bethyl Laboratories, #A300-864A), and rabbit IgG (Life Technologies) pro-
tein-RNA complexes were immunoprecipitated using the indicated antibody.
In addition to the RBP-IPs a parallel size-matched input (SMInput) library was
generated; these samples were not immunoprecipitated with anti-RBP anti-
bodies but were otherwise treated identically (to aid in the removal of false pos-
itives). One SMInput was used for each biological replicate grouping of all IMP
proteins due to their similarity in molecular weight, with a separate SMInput
generated for RBFOX2. Stringent washes were performed as described in
iCLIP, during which RNA was dephosphorylated with FastAP (Fermentas)
and T4 PNK (NEB). Subsequently, a 30 RNA adaptor was ligated onto the
RNA with T4 RNA ligase (NEB). Protein-RNA complexes were run on an SDS-
PAGE gel, transferred to nitrocellulose membranes, and RNA was isolated off
the membrane identically to standard iCLIP. After precipitation, RNA was
reverse transcribed with AffinityScript (Agilent), free primer was removed
(ExoSap-IT, Affymetrix), and a 30 DNAadaptorwas ligated onto the cDNAprod-
uct with T4 RNA ligase (NEB). Libraries were then amplified with Q5 PCR mix
(NEB). See Van Nostrand et al. (2016) for further details regarding standardized
eCLIP experimental workflows.
eCLIP-Seq Read Processing and Cluster Analysis
Briefly, reads were adaptor trimmed (cutadapt), mapped against repetitive
elements (with repeat-mapping reads discarded), and then mapped to the hu-
man genome with STAR. PCR duplicate reads were removed, and the second
(paired-end) read was used to perform peak-calling with CLIPper (Lovci et al.,
2013). Region-level analysis was performed by counting reads overlapping re-
gions annotated in Gencode (v19). Input normalization of peaks was per-
formed by counting reads mapping to CLIPper-identified peaks in eCLIP
and paired SMInput datasets, with significance thresholds of p % 10�5 and
fold enrichment R8. See the Supplemental Experimental Procedures for
further details and Van Nostrand et al. (2016) for software packages used
and additional description of processing steps.
hPSC Cell Culture
All hPSC lines (including H9, H1, HUES6, and iPSC) lines were grown on Ma-
trigel (BD Biosciences) using mTeSR1medium (Stem Cell Technologies). Cells
were routinely passaged using Dispase (2 mg/ml) and scraping the colonies
with a glass pipet. For assays requiring single-cell dissociation, Accutase
(Innovative Cell Technologies) was used followed by culture medium supple-
mented with 10 mM Rock Inhibitor Y-26732 (Calbiochem) for 24 hr. See the
Supplemental Experimental Procedures for further details.
Lentiviral Vectors, Production, and hESC Infection
If not otherwise indicated, experiments were performed using pLKO lenti-
virus constructs TRCN0000075149 for IMP1, TRCN0000255463 for IMP2,
TRCN0000074675 for IMP3, and non-target control Sigma #SHC002 (that
targets turboGFP). Two additional shRNAs were tested for IMP1,
TRCN0000218079 that targeted the CDS (shRNA 2) and TRCN0000230114
that targets the IMP1 30 UTR (shRNA 3). Unless otherwise noted, shRNA 3
(TRCN0000230114) was used as the second shRNA for phenotypic experi-
ments. See the Supplemental Experimental Procedures for additional details.
Adhesion Assay
After virus transduction and puromycin selection, hES cells were plated out at
50,000 cells per well in a 96-well plate coated with Matrigel, incubated for 1 hr
at 37�C with 5% CO2, vortexed at 2,000 rpm for 15 s, washed three times with
0.1% BSA in DMEM/F12, and fixed with 4% paraformaldehyde for 10 min at
room temperature. Following fixation, cells were washed with 0.1% BSA in
DMEM/F12 and stained with crystal violet (5 mg/ml in 2% EtOH) for 10 min.
Cells were then rinsed with H2O and left to completely dry for 15 min. SDS
(2%) was added for 20 min followed by absorbance reading on a plate reader.
Data are represented as mean ± SD, with statistical significance calculated by
unpaired t test.
BCL2 Rescue Apoptosis Assay
H9 hESCs expressing control and IMP1 shRNAs were split into four biological
replicates each and transduced with dox-inducible BCL2 viruses. After 24 hr,
three replicates were each re-plated into four wells of a 96-well plate at a
density of 20,000 cells per well. A titration of doxycycline was added for
24 hr after which apoptosis was measured by the Caspase-Glo 3/7 assay
(Promega). The Caspase-Glo 3/7 assay was performed according to the
Cell Reports 15, 1–14, April 19, 2016 11

Please cite this article in press as: Conway et al., Enhanced CLIP Uncovers IMP Protein-RNA Targets in Human Pluripotent Stem Cells Important forCell Adhesion and Survival, Cell Reports (2016), http://dx.doi.org/10.1016/j.celrep.2016.03.052
manufacturer’s instructions. The fourth replicate was collected in parallel for
western blot analysis of BCL2 induction. Luminescence and fluorescence
data were averaged across the four technical replicate wells and are repre-
sented as mean ± SD of biological replicates, with statistical significance
calculated by unpaired t test.
Western Blot
Cells were washedwith PBS and lysed with lysis buffer (10mMTris-HCl [pH 8],
150 mM NaCl, 1% Triton X-100 and complete protease inhibitor mixture
[Roche]). Total protein extracts were run on 4%–12% NuPAGE Bis-Tris gels
in NuPAGE MOPS running buffer (Thermo Fisher), transferred to nitrocellulose
membranes (Amersham Biosciences) and analyzed using primary antibodies.
Primary antibodies were incubated overnight at 4�C and secondary HRP con-
jugated antibodies (Jackson ImmunoResearch, 1:10,000) were incubated for
1 hr at room temperature. Thermo Pierce ECL detection reagents were
used. See the Supplemental Experimental Procedures for full list of antibodies
used.
RNA Extraction and qRT-PCR Analysis
Total RNAwas isolated using Trizol Reagent (Invitrogen) according to theman-
ufacturer’s recommendations, DNase treated with Turbo DNA-free kit (Am-
bion), and cDNA synthesized from 2 mg total RNA using the SuperScript III
Reverse Transcriptase kit for qRT-PCR (Invitrogen). Both random hexamers
and oligo(dT) primers were used for reverse transcription. Real-time PCR
was performed using the SYBR-Green FAST qPCR Master mix (Applied Bio-
systems) on a CFX384 Touch Real-Time PCR Detection System (Bio-Rad).
Values of gene expression were normalized using an average of 18s, GAPDH,
andHMBSwith the exception of the Actionmycin D experiments (see Figure 5K
and Experimental Procedures for details) and are shown as fold change rela-
tive to the value of the control shRNA-treated sample. All experiments were
performed in technical and biological triplicates. Bars indicate mean ± SEM
as measured by the DDCt method. Significance was determined by unpaired
t test between the control shRNA sample and IMP1 shRNA sample. See the
Supplemental Experimental Procedures for primer sequences used.
Actinomycin D RNA Stability Assay
H9 hESCs were treated with 10 mg/ml actinomycin D (Sigma) and RNA was
isolated using Trizol at time 0 (no treatment), 60 min, and 120 min after
treatment. RNA decay was measured with qRT-PCR normalized to the
amount of RNA at time 0 (see RNA Extraction and qRT-PCR Analysis). Values
of gene expression were normalized using PPIA and RPLP0, genes deter-
mined not to change over the given time period following addition of actino-
mycin D.
RNA Immunoprecipitation Assay in hESCs
RNA immunoprecipitation (RIP) was performed with an input of�203 106 un-
crosslinked HUES6 hES cells lysed with CLIP lysis buffer (Wilbert et al., 2012).
A total of 5 mg of each antibody, Rabbit IgG (Santa Cruz, #SC-2027) and IMP1
(MBL, #RN007P), were coupled to Protein G Dynabeads (Invitrogen) and
incubated with pre-cleared cell lysate overnight on rotation at 4�C. Immuno-
precipitated RNA was isolated from beads using 1 ml Trizol according to the
manufacturer’s instructions and reverse-transcribed using the SuperScript III
Reverse Transcriptase kit. Endpoint RT-PCR was performed using Crimson
Taq DNA Polymerase (NEB).
Electrophoretic Mobility Shift Assay
IMP1 electrophoretic mobility shift assay (EMSA) was performed based on the
conditions used in Farina et al. (2003). Binding reactions contained the
following: 10 mM Tris [pH 7.5], 50 mM NaCl, 1 mM MgCl2, 0.5 mM EDTA,
0.5 mM DTT, 4% glycerol, 100 ng Escherichia coli tRNA (Roche), 10,000
cpm of the 32P-labeled target RNA, and increasing amounts of recombinant
human IMP1 protein (Origene #TP316226) to a final volume of 20 ml. Reactions
were incubated for 30 min at room temperature followed by 15 min on ice.
Reactions were loaded on 5% nondenaturing polyacrylamide TGE gels con-
taining 5% glycerol and run at 150 V for 2 hr. Following electrophoresis, gels
were dried and exposed to phosphoimager film. See the Supplemental Exper-
imental Procedures for further details.
12 Cell Reports 15, 1–14, April 19, 2016
RNA Bind-N-Seq
RNA Bind-N-seq (RBNS) was performed on full-length GST-SBP-tagged
IMP1 and IMP2 as previously described (Lambert et al., 2014). The motif fre-
quency in the RBP-selected pool divided by the frequency in the input RNA
library was calculated for all k-mers (k = 4, 5, 6) and defined as the motif
enrichment (R) value. Mean and SD of R values were calculated across all
k-mers for each k (4-mers, 5-mers, and 6-mers), with significance thresholds
set at Z score R 2. Enrichments from the protein concentration with the
greatest enrichment were used for comparison with CLIP peaks, compared
against same-sized regions randomly selected from the same genomic re-
gion (e.g., 30 UTRs or CDS). See the Supplemental Experimental Procedures
for additional details.
ACCESSION NUMBERS
The accession number for the IMP eCLIP and knockdown RNA-seq data re-
ported in this paper is GEO: GSE78509. The accession numbers for the
Bind-N-Seq datasets reported in this paper are ENCODE DCC (https://www.
encodeproject.org): ENCSR928XOW (IMP1) and ENCSR588GYZ (IMP2).
SUPPLEMENTAL INFORMATION
Supplemental Information includes Supplemental Experimental Procedures,
six figures, and four tables and can be found with this article online at http://
dx.doi.org/10.1016/j.celrep.2016.03.052.
AUTHOR CONTRIBUTIONS
Conceptualization, A.E.C., E.L.V.N., M.L.W., D.L.J., and G.W.Y; Investigation,
A.E.C., E.L.V.N., S.A., B.S., M.L.W., T.Y.L., P.F., and N.J.L.; Validation, A.E.
and S.L.; Formal Analysis, A.E.C., E.L.V.N., G.A.P., and S.S.; Writing – Original
Draft, A.E.C., E.L.V.N., M.L.W., D.L.J., and G.W.Y.; Writing – Review & Editing,
A.E.C., E.L.V.N., D.L.J., and G.W.Y.; Funding Acquisition, C.B.B., D.L.J., and
G.W.Y.; Supervision, D.L.J. and G.W.Y.
ACKNOWLEDGMENTS
We thank members of the D.L.J. and G.W.Y. labs for constructive discussions
and comments on the manuscript and the Salk Institute Stem Cell Core, espe-
cially Dr. Travis Berggren, Margaret Lutz, and Ken Diffenderfer for their invalu-
able assistance. We thank Patrick Liu for computational analysis assistance
and Reza Ardehali, Matt Inlay, and Irving Weissman for sharing BCL2 plas-
mids. This work was supported by the Eli and Edythe Broad Center of Regen-
erative Medicine and Stem Cell Research at the University of California, Los
Angeles, and a California Institute of Regenerative Medicine (CIRM) New Fac-
ulty Award (RN1-00544) to D.L.J. and by grants from the NIH (HG004659,
NS075449, and U54HG007005) and CIRM (RB1-01413 and RB3-05009) to
G.W.Y., and was partially supported by NIH grant HG007005 to C.B.B.
A.E.C. and M.L.W. were supported in part by the University of California,
San Diego, Genetics Training Program through an institutional training grant
from the NIGMS, T32 GM008666. S.L. and A.E. were supported by Pioneer
postdoctoral fellowship awards from the Salk Institute for Biological Studies.
M.L.W. was a CIRM pre-doctoral fellow. E.L.V.N. is a Merck Fellow of the
Damon Runyon Cancer Research Foundation (DRG-2172-13), and G.W.Y.
was an Alfred P. Sloan Research Fellow.
Received: December 24, 2015
Revised: February 17, 2016
Accepted: March 11, 2016
Published: April 7, 2016
REFERENCES
Alipanahi, B., Delong, A., Weirauch, M.T., and Frey, B.J. (2015). Predicting the
sequence specificities of DNA- and RNA-binding proteins by deep learning.
Nat. Biotechnol. 33, 831–838.

Please cite this article in press as: Conway et al., Enhanced CLIP Uncovers IMP Protein-RNA Targets in Human Pluripotent Stem Cells Important forCell Adhesion and Survival, Cell Reports (2016), http://dx.doi.org/10.1016/j.celrep.2016.03.052
Ardehali, R., Inlay, M.A., Ali, S.R., Tang, C., Drukker, M., and Weissman, I.L.
(2011). Overexpression of BCL2 enhances survival of human embryonic
stem cells during stress and obviates the requirement for serum factors.
Proc. Natl. Acad. Sci. USA 108, 3282–3287.
Atlas, R., Behar, L., Sapoznik, S., and Ginzburg, I. (2007). Dynamic associ-
ation with polysomes during P19 neuronal differentiation and an untrans-
lated-region-dependent translation regulation of the tau mRNA by the tau
mRNA-associated proteins IMP1, HuD, and G3BP1. J. Neurosci. Res. 85,
173–183.
Bell, J.L., Wachter, K., M€uhleck, B., Pazaitis, N., Kohn, M., Lederer, M., and
H€uttelmaier, S. (2013). Insulin-like growth factor 2 mRNA-binding proteins
(IGF2BPs): post-transcriptional drivers of cancer progression? Cell. Mol. Life
Sci. 70, 2657–2675.
Bernstein, P.L., Herrick, D.J., Prokipcak, R.D., and Ross, J. (1992). Control of
c-mycmRNA half-life in vitro by a protein capable of binding to a coding region
stability determinant. Genes Dev. 6, 642–654.
Braam, S.R., Zeinstra, L., Litjens, S., Ward-van Oostwaard, D., van den Brink,
S., van Laake, L., Lebrin, F., Kats, P., Hochstenbach, R., Passier, R., et al.
(2008). Recombinant vitronectin is a functionally defined substrate that sup-
ports human embryonic stem cell self-renewal via alphavbeta5 integrin.
Stem Cells 26, 2257–2265.
Chao, J.A., Patskovsky, Y., Patel, V., Levy, M., Almo, S.C., and Singer, R.H.
(2010). ZBP1 recognition of beta-actin zipcode induces RNA looping. Genes
Dev. 24, 148–158.
Dai, N., Rapley, J., Angel, M., Yanik, M.F., Blower, M.D., and Avruch, J. (2011).
mTOR phosphorylates IMP2 to promote IGF2 mRNA translation by internal ri-
bosomal entry. Genes Dev. 25, 1159–1172.
Dai, N., Christiansen, J., Nielsen, F.C., and Avruch, J. (2013). mTOR complex 2
phosphorylates IMP1 cotranslationally to promote IGF2 production and the
proliferation of mouse embryonic fibroblasts. Genes Dev. 27, 301–312.
Dai, N., Zhao, L., Wrighting, D., Kramer, D., Majithia, A., Wang, Y., Cracan, V.,
Borges-Rivera, D., Mootha, V.K., Nahrendorf, M., et al. (2015). IGF2BP2/IMP2-
Deficient mice resist obesity through enhanced translation of Ucp1 mRNA and
Other mRNAs encoding mitochondrial proteins. Cell Metab. 21, 609–621.
Dimitriadis, E., Trangas, T., Milatos, S., Foukas, P.G., Gioulbasanis, I., Courtis,
N., Nielsen, F.C., Pandis, N., Dafni, U., Bardi, G., and Ioannidis, P. (2007).
Expression of oncofetal RNA-binding protein CRD-BP/IMP1 predicts clinical
outcome in colon cancer. Int. J. Cancer 121, 486–494.
Farina, K.L., Huttelmaier, S., Musunuru, K., Darnell, R., and Singer, R.H. (2003).
Two ZBP1 KH domains facilitate beta-actin mRNA localization, granule forma-
tion, and cytoskeletal attachment. J. Cell Biol. 160, 77–87.
Gu, W., Wells, A.L., Pan, F., and Singer, R.H. (2008). Feedback regulation be-
tween zipcode binding protein 1 and beta-catenin mRNAs in breast cancer
cells. Mol. Cell. Biol. 28, 4963–4974.
Gu, W., Katz, Z., Wu, B., Park, H.Y., Li, D., Lin, S., Wells, A.L., and Singer, R.H.
(2012). Regulation of local expression of cell adhesion and motility-related
mRNAs in breast cancer cells by IMP1/ZBP1. J. Cell Sci. 125, 81–91.
Hafner, M., Landthaler, M., Burger, L., Khorshid, M., Hausser, J., Berninger, P.,
Rothballer, A., Ascano, M., Jr., Jungkamp, A.C., Munschauer, M., et al. (2010).
Transcriptome-wide identification of RNA-binding protein and microRNA
target sites by PAR-CLIP. Cell 141, 129–141.
Hammer, N.A., Hansen, Tv., Byskov, A.G., Rajpert-De Meyts, E., Grøndahl,
M.L., Bredkjaer, H.E., Wewer, U.M., Christiansen, J., and Nielsen, F.C.
(2005). Expression of IGF-II mRNA-binding proteins (IMPs) in gonads and
testicular cancer. Reproduction 130, 203–212.
Han, H., Irimia, M., Ross, P.J., Sung, H.K., Alipanahi, B., David, L., Golipour, A.,
Gabut, M., Michael, I.P., Nachman, E.N., et al. (2013). MBNL proteins repress
ES-cell-specific alternative splicing and reprogramming. Nature 498, 241–245.
Hansen, T.V.O., Hammer, N.A., Nielsen, J., Madsen, M., Dalbaeck, C., Wewer,
U.M., Christiansen, J., and Nielsen, F.C. (2004). Dwarfism and impaired gut
development in insulin-like growth factor II mRNA-binding protein 1-deficient
mice. Mol. Cell. Biol. 24, 4448–4464.
H€uttelmaier, S., Zenklusen, D., Lederer, M., Dictenberg, J., Lorenz, M., Meng,
X., Bassell, G.J., Condeelis, J., and Singer, R.H. (2005). Spatial regulation of
beta-actin translation by Src-dependent phosphorylation of ZBP1. Nature
438, 512–515.
Janiszewska, M., Suva, M.L., Riggi, N., Houtkooper, R.H., Auwerx, J.,
Clement-Schatlo, V., Radovanovic, I., Rheinbay, E., Provero, P., and Stamen-
kovic, I. (2012). Imp2 controls oxidative phosphorylation and is crucial for pre-
serving glioblastoma cancer stem cells. Genes Dev. 26, 1926–1944.
Jønson, L., Vikesaa, J., Krogh, A., Nielsen, L.K., Hansen, Tv., Borup, R., John-
sen, A.H., Christiansen, J., and Nielsen, F.C. (2007). Molecular composition of
IMP1 ribonucleoprotein granules. Mol. Cell. Proteomics 6, 798–811.
Konig, J., Zarnack, K., Rot, G., Curk, T., Kayikci, M., Zupan, B., Turner, D.J.,
Luscombe, N.M., and Ule, J. (2011). iCLIP–transcriptome-wide mapping of
protein-RNA interactions with individual nucleotide resolution. J. Vis. Exp.
(50), 2638.
Lambert, N., Robertson, A., Jangi, M., McGeary, S., Sharp, P.A., and Burge,
C.B. (2014). RNA Bind-n-Seq: quantitative assessment of the sequence and
structural binding specificity of RNA binding proteins. Mol. Cell 54, 887–900.
Lee, S.R., Pratt, G.A., Martinez, F.J., Yeo, G.W., and Lykke-Andersen, J.
(2015). Target discrimination in nonsense-mediated mRNA decay requires
Upf1 ATPase activity. Mol. Cell 59, 413–425.
Leeds, P., Kren, B.T., Boylan, J.M., Betz, N.A., Steer, C.J., Gruppuso, P.A.,
and Ross, J. (1997). Developmental regulation of CRD-BP, an RNA-binding
protein that stabilizes c-myc mRNA in vitro. Oncogene 14, 1279–1286.
Li, Q., Brown, J.B., Huang, H., and Bickel, P.J. (2011). Measuring reproduc-
ibility of high-throughput experiments. Ann. Appl. Stat. 5, 1752–1779.
Lovci, M.T., Ghanem, D., Marr, H., Arnold, J., Gee, S., Parra, M., Liang, T.Y.,
Stark, T.J., Gehman, L.T., Hoon, S., et al. (2013). Rbfox proteins regulate alter-
native mRNA splicing through evolutionarily conserved RNA bridges. Nat.
Struct. Mol. Biol. 20, 1434–1442.
Marchetto, M.C., Narvaiza, I., Denli, A.M., Benner, C., Lazzarini, T.A., Nathan-
son, J.L., Paquola, A.C., Desai, K.N., Herai, R.H., Weitzman,M.D., et al. (2013).
Differential L1 regulation in pluripotent stem cells of humans and apes. Nature
503, 525–529.
Nielsen, J., Christiansen, J., Lykke-Andersen, J., Johnsen, A.H., Wewer, U.M.,
and Nielsen, F.C. (1999). A family of insulin-like growth factor II mRNA-binding
proteins represses translation in late development. Mol. Cell. Biol. 19, 1262–
1270.
Nielsen, F.C., Nielsen, J., Kristensen, M.A., Koch, G., and Christiansen, J.
(2002). Cytoplasmic trafficking of IGF-II mRNA-binding protein by conserved
KH domains. J. Cell Sci. 115, 2087–2097.
Nielsen, J., Kristensen,M.A., Willemoes,M., Nielsen, F.C., and Christiansen, J.
(2004). Sequential dimerization of human zipcode-binding protein IMP1 on
RNA: a cooperative mechanism providing RNP stability. Nucleic Acids Res.
32, 4368–4376.
Ray, D., Kazan, H., Cook, K.B., Weirauch, M.T., Najafabadi, H.S., Li, X., Guer-
oussov, S., Albu, M., Zheng, H., Yang, A., et al. (2013). A compendium of RNA-
binding motifs for decoding gene regulation. Nature 499, 172–177.
Ross, A.F., Oleynikov, Y., Kislauskis, E.H., Taneja, K.L., and Singer, R.H.
(1997). Characterization of a beta-actin mRNA zipcode-binding protein. Mol.
Cell. Biol. 17, 2158–2165.
Ross, J., Lemm, I., and Berberet, B. (2001). Overexpression of an mRNA-bind-
ing protein in human colorectal cancer. Oncogene 20, 6544–6550.
Sugimoto, Y., Konig, J., Hussain, S., Zupan, B., Curk, T., Frye, M., and Ule, J.
(2012). Analysis of CLIP and iCLIPmethods for nucleotide-resolution studies of
protein-RNA interactions. Genome Biol. 13, R67.
Van Nostrand, E.L., Pratt, G.A., Shishkin, A.A., Gelboin-Burkhart, C., Fang,
M.Y., Sundararaman, B., Blue, S.M., Nguyen, T.B., Surka, C., Elkins, K.,
et al. (2016). Robust transcriptome-wide discovery of RNA binding protein
binding sites with enhanced CLIP (eCLIP). Nat. Methods, Published online
March 28, 2016. http://dx.doi.org/10.1038/nmeth.3810.
Cell Reports 15, 1–14, April 19, 2016 13

Please cite this article in press as: Conway et al., Enhanced CLIP Uncovers IMP Protein-RNA Targets in Human Pluripotent Stem Cells Important forCell Adhesion and Survival, Cell Reports (2016), http://dx.doi.org/10.1016/j.celrep.2016.03.052
Vikesaa, J., Hansen, T.V., Jønson, L., Borup, R.,Wewer, U.M., Christiansen, J.,
and Nielsen, F.C. (2006). RNA-binding IMPs promote cell adhesion and inva-
dopodia formation. EMBO J. 25, 1456–1468.
Wagenmakers, A.J., Reinders, R.J., and van Venrooij, W.J. (1980). Cross-link-
ing of mRNA to proteins by irradiation of intact cells with ultraviolet light. Eur. J.
Biochem. 112, 323–330.
Wilbert, M.L., Huelga, S.C., Kapeli, K., Stark, T.J., Liang, T.Y., Chen, S.X., Yan,
B.Y., Nathanson, J.L., Hutt, K.R., Lovci, M.T., et al. (2012). LIN28 binds
14 Cell Reports 15, 1–14, April 19, 2016
messenger RNAs at GGAGA motifs and regulates splicing factor abundance.
Mol. Cell 48, 195–206.
Wu, B., Buxbaum, A.R., Katz, Z.B., Yoon, Y.J., and Singer, R.H. (2015). Quan-
tifying protein-mRNA interactions in single live cells. Cell 162, 211–220.
Yeo, G.W., Coufal, N.G., Liang, T.Y., Peng, G.E., Fu, X.D., and Gage,
F.H. (2009). An RNA code for the FOX2 splicing regulator revealed by
mapping RNA-protein interactions in stem cells. Nat. Struct. Mol. Biol.
16, 130–137.

Cell Reports, Volume 15
Supplemental Information
Enhanced CLIP Uncovers IMP Protein-RNA Targets
in Human Pluripotent Stem Cells Important
for Cell Adhesion and Survival
Anne E. Conway, Eric L. Van Nostrand, Gabriel A. Pratt, Stefan Aigner, Melissa L.Wilbert, Balaji Sundararaman, Peter Freese, Nicole J. Lambert, ShashankSathe, Tiffany Y. Liang, Anthony Essex, Severine Landais, Christopher B.Burge, D. Leanne Jones, and Gene W. Yeo

Inventory of Supplemental Information:
Figures and Tables:
Figure S1: Related to Figure 2, IMP RBPs bind thousands of target RNAs in hESCs.
Figure S2: Related to Figure 2, IMP1 and IMP2 show highly correlated binding to 3'UTR regions.
Figure S3: Related to Figure 3, IMP1 and IMP2 show correlated, reproducible binding peaks.
Figure S4: Related to Figure 4, IMP1 and IMP2 in vitro binding motifs identified by RNA Bind-N-Seq (RBNS).
Figure S5: Related to Figure 5, IMP1 binds target genes important for regulating cytoskeletal architecture in hESC.
Figure S6: Related to Figure 6, IMP1 has little effect on cell proliferation but promotes cell survival through regulation of BCL2 in
hESCs.
Table S1: Related to Figure 2, eCLIP sequencing library processing summary metrics.
Table S2: Related to Figures 2 and 3, eCLIP fold-enrichment values across genic regions (attached as an individual excel file).
Table S3: Related to Figures 5 and 6, RNA-seq processing summary metrics.
Table S4: Related to Figures 5 and 6, RNA-seq differential expression analysis of Control KD versus IMP1 knockdown hESCs
(attached as an individual excel file).
Supplemental Experimental Procedures.

Figure S1: Related to Figure 2, IMP RBPs bind thousands of target RNAs in hESCs.
(A) Recombinant human IMP protein expression in rabbit reticulolysates followed by Western blot for IMP1, IMP2, and IMP3. (B)
Western blot of immunoprecipitation of IMP1, IMP2, and IMP3 in H1 hESC, showing co-immunoprecipitation of other family
members. (C) Western blot validation of immunoprecipitation performed during eCLIP of IMP1, IMP2, and IMP3. (D) Images show
nitrocellulose membranes cut during eCLIP of IMP1, IMP2, and IMP3, indicating the size range from which RNA was isolated.

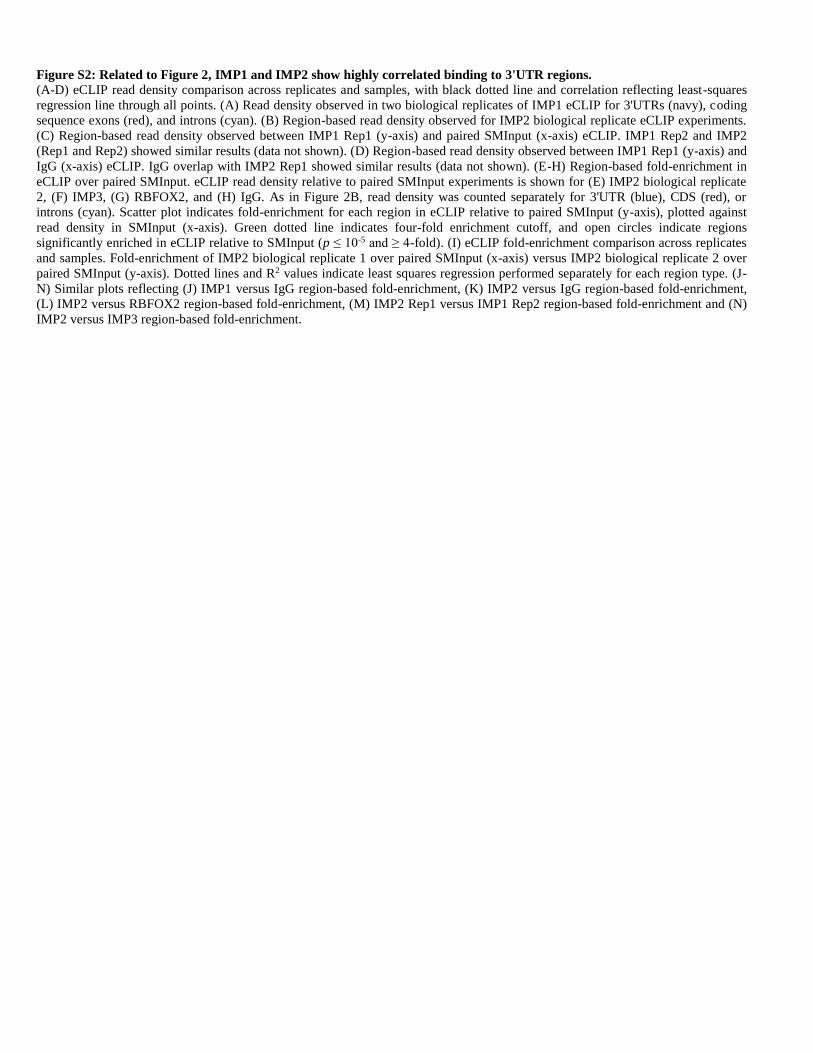
Figure S2: Related to Figure 2, IMP1 and IMP2 show highly correlated binding to 3'UTR regions.
(A-D) eCLIP read density comparison across replicates and samples, with black dotted line and correlation reflecting least-squares
regression line through all points. (A) Read density observed in two biological replicates of IMP1 eCLIP for 3'UTRs (navy), coding
sequence exons (red), and introns (cyan). (B) Region-based read density observed for IMP2 biological replicate eCLIP experiments.
(C) Region-based read density observed between IMP1 Rep1 (y-axis) and paired SMInput (x-axis) eCLIP. IMP1 Rep2 and IMP2
(Rep1 and Rep2) showed similar results (data not shown). (D) Region-based read density observed between IMP1 Rep1 (y-axis) and
IgG (x-axis) eCLIP. IgG overlap with IMP2 Rep1 showed similar results (data not shown). (E-H) Region-based fold-enrichment in
eCLIP over paired SMInput. eCLIP read density relative to paired SMInput experiments is shown for (E) IMP2 biological replicate
2, (F) IMP3, (G) RBFOX2, and (H) IgG. As in Figure 2B, read density was counted separately for 3'UTR (blue), CDS (red), or
introns (cyan). Scatter plot indicates fold-enrichment for each region in eCLIP relative to paired SMInput (y-axis), plotted against
read density in SMInput (x-axis). Green dotted line indicates four-fold enrichment cutoff, and open circles indicate regions
significantly enriched in eCLIP relative to SMInput (p ≤ 10-5 and ≥ 4-fold). (I) eCLIP fold-enrichment comparison across replicates
and samples. Fold-enrichment of IMP2 biological replicate 1 over paired SMInput (x-axis) versus IMP2 biological replicate 2 over
paired SMInput (y-axis). Dotted lines and R2 values indicate least squares regression performed separately for each region type. (J-
N) Similar plots reflecting (J) IMP1 versus IgG region-based fold-enrichment, (K) IMP2 versus IgG region-based fold-enrichment,
(L) IMP2 versus RBFOX2 region-based fold-enrichment, (M) IMP2 Rep1 versus IMP1 Rep2 region-based fold-enrichment and (N)
IMP2 versus IMP3 region-based fold-enrichment.


Figure S3. Related to Figure 3, IMP1 and IMP2 show correlated, reproducible binding peaks.
(A) IMP2 clusters are shown as in Figure 3A; pie charts indicate the fraction of CLIPper-identified clusters (grey) that show enriched
read coverage in CLIP above SMInput (green & blue), with overlap across biological replicates indicated in light blue (center). (B)
Scatter plot indicates the enrichment p-value (by Yates’ Chi-Square test, or Fisher’s Exact Test if read number was below 5 (see
Methods)) and fold-enrichment between IP and SMInput for IMP1 (Rep1) CLIPper-identified cluster regions. The distribution of
clusters by fold-enrichment is indicated by the left histogram. (C-H) For clusters identified in one eCLIP dataset (x-axis), scatter
plots indicate the IP-to-SMInput enrichment for this set of regions across two datasets. The subset of IP-enriched (p ≤ 10-5, ≥ 8-fold
enriched versus SMInput) peaks are indicated in green, with attached histogram indicating distribution along the second dataset (y-
axis). Correlation indicated is from comparison of all clusters (black + green). Figures compare (C) IMP1 biological replicates, (D)
IMP1 versus RBFOX2, (E) IMP1 versus IgG, (F) IMP2 biological replicates, (G) IMP1 versus IMP2, and (H) IMP2 versus IMP1. (I-
J) Pie charts indicate the distribution of (I) IMP1 CLIP-enriched or (J) IMP2 significantly enriched peaks overlapping genic coding
sequence (CDS), 3' or 5' untranslated regions, and distal (more than 500nt from the splice site) and proximal (within 500nt of the
splice site) intronic regions.
Figure S4: Related to Figure 4, IMP1 and IMP2 in vitro binding motifs identified by RNA Bind-N-Seq (RBNS).
(A-B) Coomassie staining of recombinantly expressed and GST purified full-length IMP1 and IMP2 protein size-separated by gel
electrophoresis. (C-D) Comparison between motif enrichments identified in eCLIP and RBNS of IMP1. IMP1 RBNS motif
enrichment (x-axis) plotted against IMP1 eCLIP motif enrichment (y-axis) for all 6-mers (black dots) or 6-mers containing a CACA
4-mer (red), TACA (navy), AACA (light blue), or CATA (magenta). Kernel-smoothed density plots for all motifs (black line) and 4-
mer-containing motifs (colored lines) are shown for RBNS (top) and eCLIP (right), with significance determined by Kolmogorov-
Smirnov test. Panels show motif analysis for (C) all IMP1 CDS clusters or (D) stringent IMP1 CDS peaks (defined as p ≤ 10-5 and ≥
8-fold enrichment above SMInput).


Figure S5: Related to Figure 5, IMP1 binds target genes important for regulating cytoskeletal architecture in hESC.
(A) Western blot displaying IMP1, IMP2 and IMP3 protein expression following depletion of IMP1 using three different shRNAs in
H9 hESCs (#1-TRCN0000075149, #2-TRCN0000218079 and #3-TRCN0000230114). (B) Western blot displaying specificity of
shRNAs targeting each of the three IMP family members, IMP1, IMP2, and IMP3. (C) (left) Bars indicate IMP1 reads per million
mapped reads (RPKM) in samples used for RNA-seq. (right) Points indicate RPKM (log2) for all genes quantified by RNA-seq. See
Table S3 for overall RNA-seq processing statistics, and Table S4 for differential gene expression quantitation. (D) Pie chart indicates
number of genes with altered expression (≥2 fold-changed, p ≤ 0.05) upon loss of IMP1 in hESCs. (E) Overlap between genes
altered upon IMP1 knockdown and IMP1 eCLIP significantly bound 3'UTRs (defined as more than four-fold enriched and p ≤ 10-5
above SMInput). Bar charts only include genes profiled above minimal read depth cutoffs in both RNA-seq and eCLIP (see
Methods). (F) Immunofluorescence microscopy for Phalloidin in H9 hESC following loss of IMP1, scale bar represents 10 microns.
(G) Immunofluorescence microscopy for β-catenin in H9 hESC following loss of IMP1, scale bar represents 10 microns. (H) Read
density plot for IMP1-enriched CTNNB1 (β-catenin) 3'UTR, showing IMP1 (red), RBFOX2 (blue), and paired SMInput (grey)
density. Clusters are indicated in boxes below. (I) Western blot and RNA-seq for CTNNB1 following loss of IMP1 in hESCs. (J)
Read density plot for IMP1-enriched VCL (Vinculin) 3'UTR. Dark boxes below indicate significantly enriched peaks in eCLIP
relative to SMInput. Clusters are indicated in boxes below. (K) Western blot for ACTB and VCL following loss of IMP1 in hESCs.
(L) ActinomycinD RNA stability assay. Expression of ITGB1 was measured by qRT-PCR at different time points following addition
of 10μM Actinomycin D in H9 hESCs and normalized to PPIA and RPLP0, genes determined not to change over the given time
period (Error bars = mean ± SEM, n=3).

Figure S6: Related to Figure 6, IMP1 has little effect on cell proliferation but promotes cell survival through regulation of
BCL2 in hESCs.
(A) Phase contrast images of HUES6 Embryoid Bodies (EBs) upon 2 weeks of undirected differentiation following transduction with
lentiviruses expressing either non-targeting shRNA or shRNA targeting IMP1. Scale bar represents 1mm. (B) KI-67 proliferation
assay with non-target control and IMP1 shRNA treated cells analyzed by FACS. (left) A representative histogram is shown of
untransduced, non-target shRNA treated, and IMP1 shRNA1 and IMP1 shRNA2 treated cells stained for KI-67, as well as unstained
and isotype controls on untransduced cells (n=3 for each). (right) Bars indicate fraction of cells in the ‘KI=67 positive’ region, with
error bars indicating SD. (C) Bromodeoxyuridine (BRDU) and Propidium Iodide (PI) proliferation assay with Control and IMP1KD
cells, analyzed by FACS. Quantification (i) and representative images of 1 biological replicate (ii-iv) are shown. Asterisks (i)
represent significant differences between the control shRNA and IMP1KD samples in phases G2 and S of the cell cycle (* = p < 0.05

and ** = p < 0.01). Error bars indicate SD. (D) Quantitation of Western blot in Figure 6D. (E) Read density of IMP1, IMP2, and
IMP3 eCLIP across BCL2. Overall 3'UTR signal is 2.2-fold enriched in IMP1 and 3.2-fold enriched in IMP2. (F) (top) Lines
indicate expression of BCL2-copGFP in cells treated with IMP1 shRNA (blue) and control shRNA (red). Control shRNA (which
targets related protein turboGFP) has 3 mismatches to copGFP, and does not show repression of copGFP. (bottom) Lines indicate
cell density, using the co-transfected rTTA-RFP marker, in IMP1 shRNA (green) and non-target control (purple). Error bars = mean
± SD, n=3. (G) Western blot of BCL2 over-expression in hESCs in the context of depleted levels of IMP1, with loading control γ-
TUBULIN.
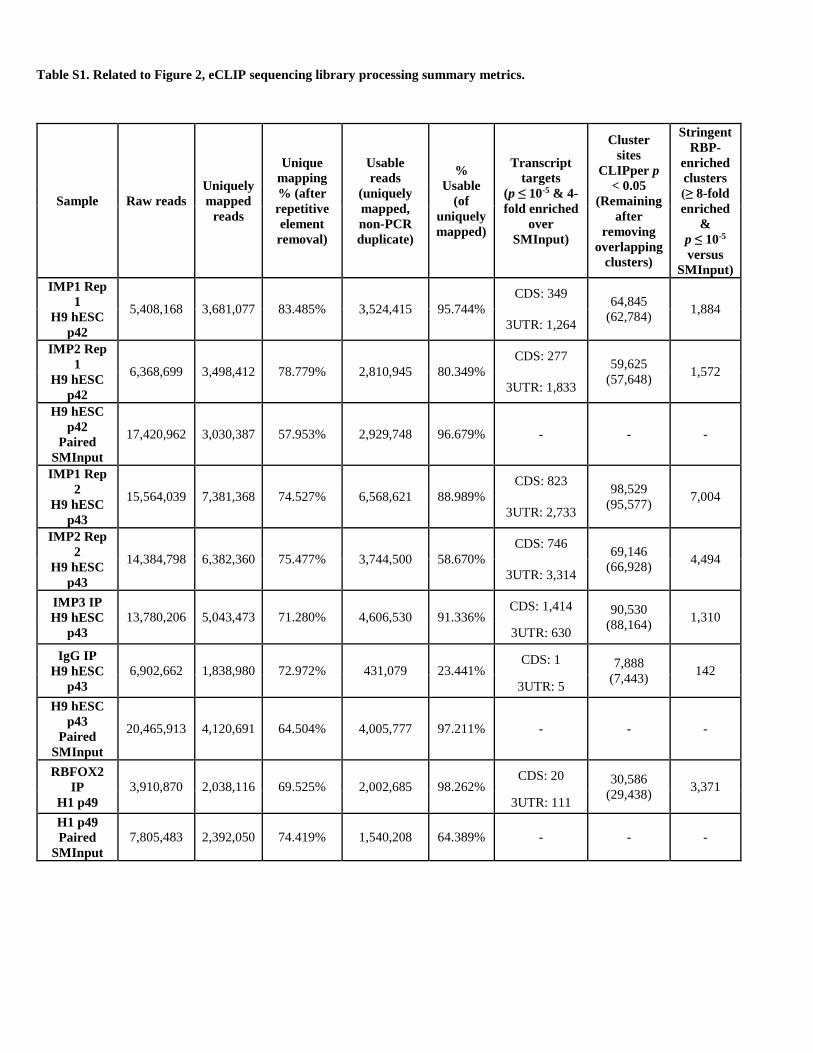
Table S1. Related to Figure 2, eCLIP sequencing library processing summary metrics.
Sample Raw reads
Uniquely
mapped
reads
Unique
mapping
% (after
repetitive
element
removal)
Usable
reads
(uniquely
mapped,
non-PCR
duplicate)
%
Usable
(of
uniquely
mapped)
Transcript
targets
(p ≤ 10-5 & 4-
fold enriched
over
SMInput)
Cluster
sites
CLIPper p
< 0.05
(Remaining
after
removing
overlapping
clusters)
Stringent
RBP-
enriched
clusters
(≥ 8-fold
enriched
&
p ≤ 10-5
versus
SMInput)
IMP1 Rep
1
H9 hESC
p42
5,408,168 3,681,077 83.485% 3,524,415 95.744%
CDS: 349 64,845
(62,784) 1,884
3UTR: 1,264
IMP2 Rep
1
H9 hESC
p42
6,368,699 3,498,412 78.779% 2,810,945 80.349%
CDS: 277 59,625
(57,648) 1,572
3UTR: 1,833
H9 hESC
p42
Paired
SMInput
17,420,962 3,030,387 57.953% 2,929,748 96.679% - - -
IMP1 Rep
2
H9 hESC
p43
15,564,039 7,381,368 74.527% 6,568,621 88.989%
CDS: 823 98,529
(95,577) 7,004
3UTR: 2,733
IMP2 Rep
2
H9 hESC
p43
14,384,798 6,382,360 75.477% 3,744,500 58.670%
CDS: 746 69,146
(66,928) 4,494
3UTR: 3,314
IMP3 IP
H9 hESC
p43
13,780,206 5,043,473 71.280% 4,606,530 91.336% CDS: 1,414 90,530
(88,164) 1,310
3UTR: 630
IgG IP
H9 hESC
p43
6,902,662 1,838,980 72.972% 431,079 23.441% CDS: 1 7,888
(7,443) 142
3UTR: 5
H9 hESC
p43
Paired
SMInput
20,465,913 4,120,691 64.504% 4,005,777 97.211% - - -
RBFOX2
IP
H1 p49
3,910,870 2,038,116 69.525% 2,002,685 98.262% CDS: 20 30,586
(29,438) 3,371
3UTR: 111
H1 p49
Paired
SMInput
7,805,483 2,392,050 74.419% 1,540,208 64.389% - - -

Table S3. Related to Figures 5 and 6, RNA-seq processing summary metrics.
Sample Raw reads Mapped reads (%)
Expressed Transcripts (RPKM ≥ 0)
Control KD A 54,210,262 42,398,504 (78%) 29,159
Control KD B 25,518,766 19,531,864 (77%) 26,090
IMP1 KD A 35,846,578 26,931,930 (75%) 27,946
IMP1 KD B 37,528,602 28,915,082 (77%) 28,391
IMP1 KD C 36,672,029 27,065,313 (74%) 27,867

SUPPLEMENTAL EXPERIMENTAL PROCEDURES
Human Illumina Bodymap Dataset Analysis
Bodymap data for 16 tissue samples from the Human Bodymap 2.0 project was downloaded from EMBL: E-MTAB-513, and H1
and HUES6 datasets were downloaded from GEO: GSE47626. H9 data shown is Rep1 of non-target shRNA RNA-seq from this
study. Data was processed as described for IMP1 knockdown RNA-seq datasets. Read counting was performed using featureCounts
(using the SubRead package in the R statistics software).
Antibodies Used For Western Blotting
Antibodies used were: anti-IMP1 (Cell Signaling, #2852), 1:1000; anti-IMP2 (MBL, #RN008P), 1:1000; anti-IMP3 (MBL,
#RN009P), 1:1000; anti-BCL2 (BD, #610538), 1:500; anti-ITGB1 (Cell Signaling, #4706S), 1:1000; anti-ITGB5 (Cell Signaling,
#4708P) 1:500; anti-HNRNPC (MBL, #RN052PW) 1:1000; anti-GAPDH (Abcam, #ab8245) 1:10,000; Cleaved-Caspase 3 (Cell
Signaling, #9661), 1:500; anti-VCL (Sigma #V9131) 1:1000; anti-ACTB (Sigma, #A1978) 1:10,000; anti-β-catenin (Santa Cruz, sc-
7963) 1:500; anti-γ-TUBULIN (Sigma, #T6557) 1:10,000; anti-α-TUBULIN (Abcam, #ab4074-100) 1:10,000. Western blots
performed during eCLIP were done with the same antibody used for IP at 1:5000 dilution.
Nuclear/Cytoplasmic Protein Extraction
Nuclear and cytoplasmic protein extracts were isolated from 1x10⁶ H9 hES cells using the NE-PER Nuclear and Cytoplasmic
Extraction Reagents kit according to the manufacturer’s instructions (Pierce, #78833).
Co-Immunoprecipitation of IMP Family Members in hESC
500,000 H1 hES cells were lysed (lysis buffer- 50 mM Tris-HCl pH 7.4; 100 mM NaCl; 1% NP-40; 0.1% SDS; 0.5% sodium
deoxycholate with protease inhibitor (Roche cocktail)) and spun at 18,000g for 20 minutes at 4°C. Lysates were pre-cleared with
anti-rabbit IgG coated Dynabeads (Life Technologies, cat#11204D). Following pre-clearing, the lysate was incubated with IMP
antibody-conjugated Dynabeads (5µg per 200µl beads) overnight at 4°C (MBL #RN007P for IMP1, MBL #RN008P for IMP2 and
#RN009P for IMP3). Immunoprecipitated complexes were then washed twice with 900µl cold High salt wash buffer (50 mM Tris-
HCl pH 7.4, 1 M NaCl, 1 mM EDTA, 1% NP-40, 0.1% SDS, 0.5% sodium deoxycholate) and then with twice Wash buffer (20 mM
Tris-HCl pH 7.4, 10 mM MgCl2, 0.2% Tween-20). Samples were then resuspended in wash buffer + 10µl 4X NuPAGE SDS buffer
+ 4µl 1M DTT. Denaturing was performed boiling at 70°C for 10 min and samples were then loaded onto a 4-12% NuPAGE gel for
Western blotting.
In Vitro Transcription and Translation of IMP Proteins in Rabbit Reticulolysates
Recombinant IMP proteins were produced using the TNT Quick Coupled Rabbit Reticulolysate System according to the
manufacturer’s instructions (Promega, Cat# L1170). IMP family ORFs were cloned into pRSETA (Life Technologies). 1µg of
plasmid DNA as well as a no-template control was incubated with reaction mixture at 30°C for 90 minutes followed by Western blot
for each of the IMPs using the following antibodies- (MBL #RN007P for IMP1, #RN008P for IMP2 and #RN009P for IMP3, all at
1:1000). 10% of the reaction mix was run on each lane of the gel for detection by Western blot.
eCLIP-seq Data Processing and Analysis
CLIP-seq read processing includes five major analysis steps: adapter trimming, repetitive element removal, mapping, PCR duplicate
removal, and cluster identification. (1) Paired-end reads were processed with cutadapt v1.9.dev1 to remove trailing adapter
sequences, resolve potential fragment dimers, and discard all reads with less than 18 high quality bases remaining. (2) To remove
potential artifacts reads were first mapped to RepBase18.05 with STAR (v2.4.0i), with mapping reads discarded for further analysis.
(3) Remaining reads were then mapped with STAR (v2.4.0i) to the human genome (hg19) plus annotated splice junctions. Only
uniquely mapping reads were kept for downstream analysis. (4) To remove PCR duplicate reads, all reads mapping to the same
position were compared based on the random-mer sequence. If more than one read mapped to the same position with the exact same
random-mer (hamming distance of 0), these duplicate reads were discarded. Remaining reads are termed “usable reads”. (5) Cluster
identification was performed on the second read (which is enriched for termination at the protein-RNA crosslink site) using the
CLIPPER algorithm (Lovci et al., 2013) which calls significantly enriched clusters independently for each gene.
To identify cluster enrichment above paired SMInput, for each cluster the number of reads mapping within that genomic region were
obtained for both the IP and SMInput samples. Fold-enrichment was then calculated as the ratio of reads in IP versus SMInput,
normalized by usable read depth in both experiments. Significance was determined by Yates’ Chi-Square test (using the Perl
Statistics::Distributions module), or Fisher’s Exact Test (using the R statistics language) if the observed or expected read number in
eCLIP or SMInput was below 5). If two CLIPPER-called clusters overlapped, only the cluster with the most significant enrichment
above SMInput was retained.
For broad region analysis, usable (uniquely mapped, post-PCR duplicate removal) reads were counted across regions for all
annotated transcripts in Gencode v19 (comprehensive). For coding genes (transcripts with the “protein_coding” transcript type),
possible regions included CDS, 5'UTR, 3'UTR, and introns; for non-coding transcripts (all other transcript types), regions included

exon and introns. For each gene, a read was first queried for overlap with coding exons; then with 5'UTR or 3'UTR exons; then
introns; this priority ensured that a read overlapping with CDS in one transcript and an intron in another was assigned to the CDS
class only. For non-coding genes exons were similarly prioritized above introns, and coding transcripts were prioritized above non-
coding. Reads were then summed across all introns or exons for the gene to obtain final region counts, and a pseudocount of 1 was
added to classes for which no reads were observed. For analyses involving fold-enrichment, read counts were normalized by the total
number of usable reads (RPM normalization). Only regions with at least 10 reads in one of IP or SMInput, and where at least 10
reads would be expected in the opposite dataset given the total number of usable reads, were considered, and significance was
determined by Yates’ Chi-Square test or Fisher’s Exact test as described above.
To generate read density plots across IMP1 peaks (Figure 3D), the midpoint was identified for each of 1884 significant enriched
peaks from the first IMP1 biological replicate. Next, for each peak region in each dataset the read coverage from -300nt to +300nt
flanking this midpoint was counted, and then at each position the read coverage (plus a pseudocount of 1) was divided by the sum of
all points (plus pseudocounts) to generate a per-region normalization. The mean and standard error of the mean were then calculated
across all remaining peak regions.
RNA Bind-N-Seq (RBNS) Full Experimental Procedures
Full length IMP1 and IMP2 were cloned downstream of a GST-SBP tandem affinity tag. The proteins were recombinantly
expressed, purified via the GST tag, and the IMP1 GST tag was cleaved off with PreScission protease (GE); GST was left on for
IMP2 since tag cleavage led to additional proteolysis. RBNS was performed as in (Lambert et al., 2014). Briefly, RBNS input
random RNA was prepared by in vitro transcription using the RBNS T7 template, a DNA oligo containing a random 40mer sequence
flanked by priming sites for the addition of Illumina adapters and the T7 promoter sequence. Five concentrations of RBP (5, 20, 120,
320, and 1300 nM), as well as a no RBP condition, were equilibrated in binding buffer for 30 min at 37°C. RBNS input random
RNA was then added to a final concentration of 1 μM with 40 U of Superasin (Ambion) and incubated for 1 hr at 37°C. To pull
down tagged RBP and interacting RNA, each RNA/protein solution was then added to 1 mg of washed streptavidin magnetic beads
and incubated for 1 hr. Unbound RNA was removed from the beads, and the beads were washed once with 1 ml of wash buffer. The
beads were incubated at 70°C for 10 min in 100 μl of elution buffer (10 mM Tris pH 7.0, 1mM EDTA, and 1% SDS), and the eluted
material was collected. Bound RNA was extracted, reverse transcribed into cDNA, amplified by PCR, and sequenced.
RNA Bind-N-Seq Computational Analysis Motif enrichment (R) values were calculated for k-mers (k=4, 5, 6) as the motif frequency in the RBP-selected pool over the
frequency in the input RNA library. R values were considered significant if they had a Z-score 2 (mean and standard deviation
calculated over all k-mers for each k). Values in Figure 3 are for the protein concentration library with the highest overall enrichment
(320 nM for IMP1, 1300 nM for IMP2). k-mers containing “CCC”, “CUCC, or “CACC” were removed as they are complementary
to portions of the sequencing adapters flanking the random region, are enriched in multiple independent protein Bind-N-Seq
experiments, and are therefore believed to be technical artifacts.
Motif logos were made from following iterative procedure on the most enriched pulldown library for k=5: the most enriched k-mer
was given a weight equal to its enrichment over the input library (=R-1), and all occurrences of that k-mer were masked in both the
pulldown and input libraries. All enrichments are recalculated on the masked read sets to obtain the most enriched remaining k-mer
and its corresponding weight, with this process continuing until the R Z-score was less than 2. All k-mers and determined from this
procedure were aligned to minimize mismatches to the most enriched k-mer, with a new motif started if the number of mismatches
was greater than 2. The frequencies of each nucleotide in the position weight matrix, as well as the overall percentage of each motif,
were determined from the weights of the individual aligned k-mers that went into that motif.
For comparison with CLIP-seq data, Bind-N-Seq enrichments were determined from the concentration with the largest enrichment.
For enrichment in CLIP-seq 6-mers fastq sequences were extracted from all clusters, and a matched number of random clusters from
the same genomic region (5'UTR, CDS, 3'UTR, proximal and distal introns, defined as 500bp from an exon intron boundary or
outside that area). EMBOSS Compseq was run on the true set and background set and a delta between real and background k-mers
was calculated with the equation: ∆𝑘𝑚𝑒𝑟 =
𝑓𝐶𝐿𝐼𝑃𝑁𝐶𝐿𝐼𝑃
− 𝑓𝑏𝑔𝑑
𝑁𝑏𝑔𝑑
√(1
𝑁𝐶𝐿𝐼𝑃+
1
𝑁𝑏𝑔𝑑)×𝑔×(1−𝑔)
, for 𝑔 = 𝑓𝐶𝐿𝐼𝑃+𝑓𝑏𝑔𝑑
𝑁𝐶𝐿𝐼𝑃+𝑁𝑏𝑔𝑑.
To plot enrichment, all 6-mers with the 4-mer of interest were highlighted and a KDE plot was created of all 6-mers and 6-mers that
contain the 4-mer of interest. Statistical significance in differences between distributions was determined by the Kolmogorov–
Smirnov 2-tailed test.
Gene Ontology Analysis
Gene Ontology annotations were obtained from ENSEMBL (5/29/15) for all annotated human genes. Significance was determined
by Fisher’s Exact Test (using R), with Chi-Square approximation where appropriate (using the Perl Statistics::Distributions module).
Only Gene Ontology terms with at least 5 genes were considered, and Bonferroni correction was used to correct for multiple
hypothesis testing. For all comparisons, background sets were defined as all genes with sufficient read depth to be quantified (as
described above).
Lentivirus Production and hESC Transduction
shRNA plasmids TRCN0000075149 (IMP1), TRCN0000255463 (IMP2), TRCN0000074675 (IMP3) were co-transfected with 3rd
generation packaging plasmids into 293T cells, incubated for 2 days, and lentivirus-containing media was harvested and
concentrated by ultracentrifugation. Following titration, a dilution series was performed on hESCs to determine maximum shRNA
efficiency with minimal cell death; equal amounts of virus were used for all experiments. Cells were single-cell dissociated to 200k
cells/sample and incubated with concentrated virus for 1 hour at 37°C at 5% CO2 before plating out into 1 well of a 6 well plate
supplemented with 10μM Rock Inhibitor Y-26732 (Calbiochem). Medium was refreshed the following day and selection with
1μg/ml Puromycin (Sigma) began 48 hours following transduction and continued for 5 days when the cells were collected for
experiments unless otherwise noted in Methods. For additional IMP1 shRNAs, plasmids were co-transfected with 3rd generation
packaging plasmids into 293T cells, media was changed to TESR after 24 hours, and lentiviral supernatants were collected after an
additional 24 and 48 hours, pooled, and passed through a 0.45 µM filter to remove cellular debris. Following filtration and
identification of the proper amount of virus to add using a dilution series, virus supernatant was added to hESCs that had been plated
out at ~40% confluency using single-cell dissociation and grown overnight. Media was changed after 24 hours. For BCL2
experiments, lentiviral plasmids expressing BCL2-GFP and rTTA-RFP (#408 and #329, respectively in Ardehali et al., 2011) were
obtained from the Weissman laboratory, prepared identically, and added to hESC cells previously selected for IMP1 or control
shRNA transduction.
RNA-seq Preparation and Analysis
RNA was extracted as described above for three independent IMP1KD biological replicates and two independent non-target control
biological replicates (H9 hESC p50 for all). 1μg total RNA was treated with Ribo-zero and processed using the Tru-seq Stranded
Total RNA Preparation Kit (Illumina) according to the manufacturer’s instructions. Reads were adapter-trimmed, trimmed of 3' A
bases, and remaining reads (≥18 nt long) were mapped to the human genome build hg19 using STAR (with default settings).
Differential expression was identified using DEseq2 (with significance cutoffs of p ≤ 0.05 and log2(fold-change) ≥ 1, and a minimum
of 10 reads in all of control or knockdown replicates required).
List of qRT-PCR primers
Gene Name Forward Reverse
IMP1 AGGCCATCGAAACTTTCTCC TTTCGGATTTGAATTTTCCG
18s AGGCATTGACAACAGGGTTC GTTGCACATCAGCAGCACTT
GAPDH GGACTCATGACCACAGTCCATGCC TCAGGGATGACCTTGCCCACAG
HMBS GGCAATGCGGCTGCAA
GGGTACCCACGCGAATCAC
ACTB GCACAGAGCCTCGCCTT GTTGTCGACGACGAGCG
HNMT GGAGCTTCAAAAGTGGGACT TCTGAGATCAGGTGGTGCTG
ITGB1 GAGTCGCGGAACAGCAG CAGTCCAATCCAGAAAATTGG
ITGB5 CCTTTCTGTGAGTGCGACAA TGTAACCTGCATGGCACTTG
BCL2 CTGAGTACCTGAACCGGCA GAGAAATCAAACAGAGGCCG
RPLP
0
GGCGACCTGGAAGTCCAACT CCATCAGCACCACAGCCTTC
PPIA GTCAACCCCACCGTGTTCTT CTGCTGTCTTTGGGACCTTGT
Immunofluorescence Microscopy
Cells were rinsed with PBS, fixed in 4% paraformaldehyde in PBS at 4°C for 10 minutes. hESCs were permeabilized at room
temperature for 15 minutes in 1.0% Triton X-100 in PBS. All cells were blocked in 5% donkey serum with 0.1% Triton at room
temperature for 30 minutes. The following primary antibodies and dilutions were used: mouse anti-Oct4 (Santa Cruz #5279), 1:500;
rabbit anti-IMP1 (Cell Signaling #2852), 1:100; rabbit anti-IMP2 (MBL #RN008P), 1:200; rabbit anti-IMP3 (MBL #RN009P),
1:200; Alexa Fluor Phalloidin 568 (Life Technologies #A12380), 1:40 per manufacturer’s instructions; and mouse anti-β-catenin
(Santa Cruz sc-7963), 1:100. Primary antibodies were incubated overnight at 4°C. Secondary antibodies were Alexa donkey 488, 555
and 647 anti-rabbit (Invitrogen), and Alexa donkey 488 and 555 anti-mouse (Invitrogen); all were used at 1:200. To visualize nuclei,
slides were mounted with Vectashield + DAPI (Vector Labs). Images were acquired using an Olympus FluoView1000 confocal
microscope at 60X.
Flow Cytometry
The AnnexinV apoptosis assay was performed using the AnnexinV-FITC Apoptosis Detection kit from BD Biosciences according to
the manufacturer’s instructions and analyzed using the FACS Canto II (BD Bioscience). Data was analyzed using FlowJo software.
KI-67 proliferation analysis was performed using the PE Mouse Anti-Human Ki-67 Set (BD #556027), according to the
manufacturer’s instructions on the FACSCanto II. Data was analyzed using FlowJo software. Significance was determined by
unpaired t-test between the control shRNA sample and IMP1 shRNA samples (N = 3 for each).

Embryoid Body (EB) Differentiation
HUES6 hESCs transduced with lentiviruses expressing either a non-targeting shRNA (SHC002) or shRNA targeting IMP1
(TRCN0000075149) were treated with collagenase until the edges were detached from the plate (1mg/ml concentration, ~90minutes)
then detached with a cell scraper, rinsed, and resuspended in EB medium (DMEM/F12 containing 10% FBS, 0.5 mM L-glutamine,
0.1 mM non-essential amino acids and 55 μM β-mercaptoethanol). EBs were maintained on low-attachment 6 well plates and
replenished with fresh EB media approximately every 3 days for two weeks.
BRDU Cell Cycle Analysis
For BRDU cell cycle analysis, cells were incubated in mTeSR1 containing 10 µM BrdU for 30 minutes. Cells were dissociated using
Accutase (Innovative Cell technologies, Inc), rinsed with PBS and fixed in 70% ethanol overnight at 4°C. The cell pellet was
resuspended in ice cold 0.1 M HCl/0.5% TritonX-100 for 10 minutes, after which the cells were boiled for 10 minutes in a water
bath and transferred to ice for 5 minutes to cool. After a brief incubation in 0.5% Triton-X100 in PBS, cells were incubated with a
rat-anti-BrdU antibody (1:100 dilution; Axyll #OBT0030) for 30 minutes followed by incubation with an Alexa 488 goat anti-rat
secondary antibody (1:200; Life Technologies) for 20 minutes. The cell pellet was resuspended in PBS containing 5 µg/ml of
Propidium Iodide and 100 µg/ml of RNaseA. Analyses were conducted using a FACScan (BD Bioscience) and data was analyzed
using FlowJo software. Significance was determined by unpaired t-test between the Control sample and IMP1 KD sample.
In Vitro Transcription of RNAs Used in EMSA
To produce RNAs by in vitro transcription, single stranded DNA oligos corresponding to the RNAs of interest and containing the T7
promoter were first annealed to the second strand of the T7 promoter by heating at 95°C and then cooling on benchtop to room
temperature, followed by in vitro transcription using the MEGAshortscript T7 Kit according to the manufacturer’s instructions
(Ambion #AM1354M). Transcribed RNAs were then cleaned up using the MEGAclear Transcription Clean Up kit according to the
manufacturer’s instructions (Ambion #AM1908) with the exception of the ACTB truncated RNA which was LiCl precipitated due to
the short length. CIP treatment (Antarctic phosphatase, NEB #M0289S) followed by phenol-chloroform extraction and ethanol
precipitation was performed to remove residual contaminants. PNK treatment (NEB) and 5' end labeling with [γ32P]-ATP
(PerkinElmer) was performed for 20minutes at 37°C followed by clean up on Illustra MicroSpin G25 spin columns (GE Healthcare).
Purified RNAs were then quantified using a scintillation counter. 32P-labeled 3'UTR target RNAs used in the experiment were as
follows: ACTB 3'UTR zipcode WT (88bp) - 5'-
CCUCCAUCGUCCACCGCAAAUGCUUCUAGGCGGACUAUGACUUAGUUGCGUUACACCCUUUCUUGACAAAACCU
AACUUGCGCAGAAA -3' (human zipcode noted in bold); Truncated ACTB zipcode (26bp) - 5' –
UGUGAUGAAACAAAACCCAUAAAUGC - 3' (nucleotides 29-54 from Chao et al., 2010); BCL2 3'UTR WT (88bp) - 5'-
AAUGACCAGCAGAUUCAAAUCUAUGGUGGUUUGACCUUUAGAGAGUUGCUUUACGUGGCCUGUUUCAACACAGA
CCCACCCAGAGCCC -3'; Mutated BCL2 3'UTR (88bp), bold sequence inverted and mutated (underlined portion is mutated) - 5'-
AAUGACCAGCAGATTCAAAUCUAUGGUGGUUUGACCUUUAGAGAGUUCCCGAGACCCACCCAGAGAGAACUUUG
UCCGGTGCAUUUCG -3'.