
An Economic Inquiry into Ethiopian Exports: Pattern, characteristics, Dynamics and Survival
Upload
cognoscenti75Category
view
223download
0description

ENGLISH PROFICIENCY AND LABOR MARKET PERFORMANCE:EVIDENCE FROM THE ECONOMICS PROFESSION
WILLIAM W. OLNEY∗
This article investigates whether the global spread of the English language providesan inherent advantage to native English speakers. This question is studied within thecontext of the economics profession, where the impact of being a native English speakeron future publishing success is examined. English speakers may have an advantagebecause they are writing in their native language, the quality of writing is a crucialdeterminant of publishing success, and all the top economics journals are published inEnglish. Using a ranking of the world’s top 2.5% of economists, this article confirmsthat native English speakers are ranked 100 spots higher (better) than similar non-native English speakers. A variety of extensions examine and dispel many other potentialexplanations. (JEL A11, J44, F66)
I. INTRODUCTION
The spread of the English language has beenprofound. It is used throughout the businessworld, intergovernmental agencies, and academiaand there is really no viable alternative.1 Whilethe diffusion of the English language has beenremarkable, the implications of these changes arenot well understood.2 This article investigateswhether the spread of English provides an inher-ent advantage to native English speakers. Thisquestion is studied within the context of the eco-nomics profession, where specifically the impactof being a native English speaker on future pub-lishing success is examined.
With the rapid pace of globalization, it isincreasingly useful to have a common language
∗I am grateful to Jon Bakija, Dan Friedman, Dan Hamer-mesh, Paul Oyer, Romain Wacziarg, Christian Zimmermann,and numerous seminar participants for helpful comments andsuggestions.Olney: Associate Professor, Department of Economics,
Williams College, Williamstown, MA 01267.Phone 413-597-2408, Fax 413-597-4045, [email protected]
1. By some measures, Mandarin is more common, dueto the sheer size of China. However, it is one of the mostdifficult to master, least computer friendly languages, and isnot even universal within China (“The English Empire” TheEconomist, Feburary 15, 2014).
2. David Crystal in “English as a Global Language”(2003) documents the impressive spread of English aroundthe globe since 1950. For instance, he says “there has neverbeen a language so widely spread or spoken by so manypeople as English” but he only speculates at some of theimplications of this growth.
of discourse. For better or worse, Englishserves this role. Multinationals throughoutthe world now use English as their officiallanguage, including numerous firms from non-native English-speaking countries. For instance,Lufthansa a German airline company, Lenova aChinese computer company, Audi a German carmaker, Rakuten a Japanese technology company,and Aventis a French/German pharmaceuticalfirm all use English. The Economist writesthat “native English speakers often assume thatthe spread of their language in global corpo-rate life confers an automatic advantage onthem.”3 Whether this is in fact true remains anopen question.
English proficiency is also crucial in academicdisciplines where most top journals are publishedin English. For instance, in 1995, 87.2% of allpublications in physical sciences and 82.5% ofall publications in social sciences were in Englishand these shares are growing (Ammon 2003).More specifically, all of the top economics jour-nals are published in English (see Engemann
3. “The English Empire.” The Economist. Feburary15, 2014.
ABBREVIATIONS
CEPII: Centre d’Études Prospectives et d’InformationsInternationalesCOB: Country of BirthCV: Curriculum VitaeGDP: Gross Domestic Product
1
Economic Inquiry(ISSN 0095-2583)
doi:10.1111/ecin.12370© 2016 Western Economic Association International

2 ECONOMIC INQUIRY
and Wall 2009 and IDEAS/RePEc rankings).4
Since tenure and compensation often hinge onresearch output, the need to publish articles inEnglish-speaking journals is a crucial determi-nant of future success in academic disciplines.
Despite the importance of English, it is notan easy language to master. Even native Englishspeakers can have difficulty articulating complexideas in their first language. For non-native speak-ers, it is that much more difficult.5 The most flu-ent non-native English speakers can still struggleto write technical papers in a second language andpresumably this is a more time-consuming pro-cess. Thus, English proficiency can affect boththe quality and quantity of research.
Abundant anecdotal evidence indicates thatthe quality of writing is crucially important inthe publishing process and that native Englishspeakers have an advantage in this endeavor.For instance, Robert Moffitt (former editor ofthe American Economic Review) said “I shouldalso note that non-native-English speakers shouldwork hard to get the English right and, if nec-essary, hire native English speakers to edit theirpapers. It is no doubt unfair, but editors andreferees often take poor English as a signal oflow quality.”6 In a similar vein, Lawrence Katz(editor of The Quarterly Journal of Economics)advises that “Papers need to be well-written andself-contained. A paper will get desk rejected forsure if it is sloppy regardless of the quality of theideas.”7 Patricia Anderson (former editor of Jour-nal of Human Resources) admits that “As an edi-tor, when I get a paper that is riddled with typos,I can’t help but have that color my view of theoverall enterprise.”8 Daniel Hamermesh (formereditor of Journal of Population Economics) rec-ommends that if you want to publish your paperin a top economics journal then “get a nativeEnglish speaker to read it carefully for you.”9
To summarize, three important characteris-tics of the economics profession are especially
4. Some journals will accept an article in a languageother than English (for instance the Canadian Journal ofEconomics accepts articles in French), but these journalsultimately publish the article in English.
5. “The English Empire.” The Economist. Feburary15, 2014.
6. “How to Get Published in an Economics Journal.”CSWEP Newsletter, Spring 2011.
7. “Q&A with Larry Katz, editor of QJE.” Berk Ozler andDavid McKenzie Blog. World Bank. January 4, 2012.
8. “How to Get Published in an Economics Journal.”CSWEP Newsletter, Spring 2011.
9. “How to Publish in a Top Journal (I wish that Iknew!).” Daniel S. Hamermesh. University of Texas atAustin presentation.
relevant for this analysis. First, all the topeconomics journals are published in English.Second, publishing success within economicsdepends crucially on the quality of the writing.No matter how groundbreaking the idea or howsophisticated the analysis, a poorly written paperwill be rejected. Third, as these editors alludeto, English speakers tend to have an advantageat writing papers in their native language. Thegoal of this article is to examine whether thereis empirical support for this basic intuitionthat native English speakers have an inherentadvantage in the publishing process.10
Despite these editors’ comments, perhaps,being born and raised in a non-native English-speaking country provides benefits that morethan compensate for the difficulty of publish-ing in a second language. For instance, beingexposed to different countries and cultures mayoffer insights and expertise that is useful ineconomic research. Or maybe, the process oflearning a second language stimulates partsof the brain that are useful in future academicpursuits. Alternatively, perhaps the perceivedadvantages associated with writing in their nativelanguage lead native English speakers to becomplacent and rest on their laurels.11 For allof these reasons, the overall impact of beinga native English speaker is ambiguous and isultimately an empirical question that this paperhopes to answer.
This analysis utilizes data provided byIDEAS/RePEc on the ranking of economists.Specifically, the top 2.5% of economists world-wide (or 1,082 economists) are identified usingdata on their quality-adjusted number of pub-lications and on their quality-adjusted numberof citations. Then, the biographical informationfor each of these economists was individuallygathered, which was the most challenging andtime-consuming aspect of this project. Specifi-cally, a variety of sources were used to identifyinformation about the economist including theircountry of birth (COB), date of birth, gender,date of death (when applicable), undergraduateinstitution and year of degree, and graduate
10. An alternate and more nuanced story is that thecharacteristics of the English language itself might be morecondusive to economic thought or research. To the best ofmy knowledge, there is no evidence that supports this intu-ition and in fact existing research indicates the opposite. Forinstance, Chen (2013) shows that the structure and grammarof the English language adversely affects future economic andhealth outcomes.
11. “The English Empire.” The Economist. Feburary15, 2014.

OLNEY: ENGLISH PROFICIENCY AND LABOR MARKET PERFORMANCE 3
FIGURE 1Share of Native English Speakers
02
04
06
08
01
00
Pe
rce
nt
U.S. Economics PhDs Top 2.5% of Economists Nobel Prize Winners
Native English Non-Native English
Notes: The first bar uses data from the National Science Foundation on economics PhD graduates from U.S. institutions overthe years 1966–2006. Native English speakers are defined as graduates who are U.S. citizens. The second bar uses RePEc/IDEASrankings from February 2015 and biographical information obtained by the author. The final bar uses data provided by the NobelPrize website for the years 1969–2015. In these latter two bars, native English speakers are defined as those born in the six nativeEnglish-speaking countries.
institution and year of degree. A rigorous datacollection process was followed in order tomaintain the integrity of the dataset.
Focusing on economics is appealing for a cou-ple of reasons. First, there is an objective andpublicly available rankings of economists basedon research output. It would be much more dif-ficult, for instance, to examine the impact ofEnglish proficiency on success in other pro-fessions where analogous rankings are unavail-able.12 Second, there are a variety of factorsthat should, if anything, mitigate the impactof English in the economics profession. Forinstance, economics is a math- and statistical-based discipline where the benefits of Englishproficiency should be less pronounced comparedto other more language-intensive academic fields.In addition, success in economics is based onwritten output which is easier to improve rel-ative to spoken English which is often neededin the business world. For example, non-nativeEnglish-speaking economists can hire proofread-ers to address writing and grammatical issues.13
12. For instance, as Fourcade et al. say (2015): “in noother social science can one find the extraordinary volume ofdata and research about rankings (of journals, departments,and individuals) that economists produce.”
13. However, proofreaders likely have a harder time help-ing convey complex economic ideas.
Finally, coauthoring is common in economics, soto the extent that native and non-native Englishspeakers collaborate, the disadvantage of being anon-native English speaker will be mitigated.14
For all of these reasons, English proficiencyshould have less of an effect in economics relativeto other fields and professions. Thus, the resultsof this article should be considered a lower boundon the broader effects of English proficiency.
A preliminary look at the data suggests thatnative English speakers do in fact have an advan-tage. Figure 1 shows the share of native Englishspeakers in the economics profession, in the sam-ple of the top 2.5% of economists, and amongNobel Prize winning economists.15 A compari-son between the first two columns indicates thatthe share of native English speakers in the overallpopulation of economists (52%) is much lower
14. Consistent with this story, Freeman and Huang (2014)find that papers coauthored by scientists of different eth-nicities tend to be published in better journals and citedmore often. Although surprisingly cross-ethnicity coauthor-ship happens less frequently than expected.
15. Estimating the share of native English speakers in theoverall population of economists is difficult, due to a lackof data. Column 1 provides a rough estimate by calculat-ing the share of U.S. citizens who graduated from U.S. eco-nomics PhD programs using data from the National ScienceFoundation. This is probably an overestimate since the nativeEnglish-speaking share is likely even lower at programs out-side the United States.

4 ECONOMIC INQUIRY
than the share among the top 2.5% of economists(65%). Column 3 then shows that the share ofnative English speakers among the 76 NobelPrize winning economists is even higher (70%).Overall, Figure 1 illustrates that the share ofnative English speakers increases as the sampleof economists becomes more talented. While thisbasic comparison in Figure 1 suggests that nativeEnglish speakers may in fact have an advantage,a more rigorous analysis is needed that controlsfor other factors that likely contribute to successin the economics profession.
Focusing more carefully on the top 2.5% ofeconomists, the empirical analysis examineswhether an economist’s ranking is increasingwith English proficiency. Testing this hypothesisfaces a couple of important empirical challenges.First, English proficiency is hard to measure.Second, it likely depends on factors such asinnate ability to learn languages, education,and other characteristics which could be cor-related with research output. To address theseconcerns, the analysis uses information aboutwhether an economist was born in a nativeEnglish-speaking country (i.e., United Kingdom,Ireland, Australia, New Zealand, Canada, andthe United States) as a proxy for English profi-ciency. Country of birth is unaffected by futurepublishing success which mitigates endogeneityconcerns and allows the causal effect of being anative English speaker on research output to beidentified. Furthermore, using country of birth todefine native English speakers, rather than self-reported language ability, is appealing becauseit reduces misclassification errors and has betterdata coverage.
A second potential econometric challenge isselection into the profession. Given the impor-tance of English proficiency in economics,perhaps only those mathematically inclined peo-ple with sufficiently strong English skills chooseto become an economist. Although informationabout noneconomists is unavailable, this selec-tion effect should attenuate the empirical resultsof this article. A related issue is that, due to dataconstraints, the sample focuses on an extremelytalented and successful group of economists.An individual that is able to make it into thisupper echelon of the profession will presumablyhave relatively strong English skills (which isconsistent with Figure 1). Thus, within thisgroup of well-educated and talented economists,language differences should play a relativelyminor role which will further attenuate theresults.
The empirical results show that, after control-ling for other characteristics of the economist,native English speakers have a significant advan-tage in the economics profession. Specifically,being born in an English-speaking countryincreases the rank of an economist by about100 spots. Furthermore, native English speakershave an advantage in both components of theranking: they are more highly ranked accordingto quality-adjusted publications and according toquality-adjusted citations.
A series of extensions examine and addressmany other alternate explanations for this find-ing. First, the sensitivity of the results to usingdifferent definitions of native English speak-ers is examined. Similar results are found ifEnglish proficiency is defined using informationon a country’s official language, the percent-age of the population that speaks English, thelinguistic distance between English and othernative languages, and whether the undergraduateinstitution was in an English-speaking country.Second, the findings are robust to using alternatecountry-of-birth*year controls such as real grossdomestic product (GDP) per capita and averageeducational attainment. This indicates that beinga native English speaker is not inadvertentlycapturing some other advantage of being born inthis group of countries. Third, these results arenot simply driven by Americans, who comprisea large share of the top 2.5% of economists.Fourth, similar results are obtained using atotally separate ranking of economists providedby Coupe (2003), which dispels concerns thatthese results are specific to the IDEAS/RePEcdata. Fifth, the results are significant across dif-ferent age cohorts, which indicates the findingsare not being driven by compositional effects(i.e., maybe older economists are more likely tobe native English speakers and have a larger pub-lication portfolio). Sixth, results including fieldof study, PhD institution, and employer controlsindicate the results are not being driven by differ-ences in subdisciplines, differences in networkeffects, or differences in research expectationsacross countries. Finally, the results are robustto using different subsamples of economists,including for instance the top 800 and the bottom800 economists. Overall, these extensions dispelnumerous alternate explanations and thus leaveEnglish proficiency as the most plausible driverof these results.
It is important to emphasize that these resultsdo not imply that non-native English speakers aredoomed to failure or that native English speakers

OLNEY: ENGLISH PROFICIENCY AND LABOR MARKET PERFORMANCE 5
are guaranteed success. To the contrary, manyof the most brilliant economists ever are non-native English speakers and presumably someof the worst economists of all time are nativeEnglish speakers. Rather the findings of thispaper suggest that a native English speaker has,on average, a slight advantage over a similar non-native English speaker. Given the importance ofa well-written paper emphasized by many edi-tors of prominent economics journals, this find-ing should not be surprising.
However, the implications of these findingsare important. Specifically, they indicate thatsome economists may have an advantage in thepublishing process simply due to their coun-try of birth and their native language. This istroubling since many important decisions arebased on publishing success. Employers shouldbe cognizant of these discrepancies when mak-ing hiring, tenure, promotion, and compensationdecisions. Furthermore, the fact that significantresults are found in a math-based discipline likeeconomics suggests that the advantages of beinga native English speaker are likely even more pro-found in other professions. For instance, nativeEnglish speakers in more language-intensive dis-ciplines (such as other humanities) or in profes-sions that require more spoken English (such asservices or business) are likely to have an evengreater advantage. Given the rapid pace of glob-alization and the growing prevalence of English,these findings are especially noteworthy.
This article contributes to a large literaturethat focuses on the publishing process withinthe economics profession. For instance, exist-ing studies show that an economist’s researchoutput can be affected by a variety of factors,including their age, their name, their gender, theirinitial job placement, and whether they coau-thor (Einav and Yariv 2006; Hamermesh 2013,2015; Hudson 1996; Maske, Durden, and Gaynor2003; McDowell, Singell, and Stater 2006; Oyer2006, 2007; van Praag and van Praag 2008).Other papers examine trends in the publica-tion process at top economics journals (Cardand DellaVigna 2012, 2013; Ellison 2002). Thislarge body of work provides numerous interestinginsights. However, to the best of my knowledge,this is the first paper to specifically examine theimpact of English proficiency on research output.
There is also a large related literature thatfocuses on the English proficiency of immigrants.This research shows that the language skillsof immigrants has a strong positive impact ontheir labor market outcomes such as employment,
wages, and educational attainment in a varietyof English-speaking countries (Adsera and Pyt-likova 2015; Bleakley and Chin 2004, 2010;Borjas 2000; Carnevale, Fry, and Lindsay Lowell2001; Chiswick 1991; Chiswick and Miller 1995,2010, 2014; Dustmann and Fabbri 2003; Fer-rer, Green, and Riddell 2006; Rivera-Batiz 1990).Peri and Sparber (2009) highlight the importanceof English proficiency by showing that immi-grants in the United States specialize in man-ual labor-intensive occupations while similarlyskilled natives tend to specialize in language-intensive jobs. My paper does not focus on immi-grants per se, but it is related to this literature inthat it highlights the importance of English pro-ficiency. Consistent with this existing evidence,I find that English proficiency has a strong posi-tive impact on labor market outcomes within theeconomics profession.
The results of this paper also offer an intrigu-ing potential explanation for cross-country differ-ences in income inequality. Specifically, researchshows that top income shares have increasedsubstantially in English-speaking countries butnot in continental Europe or in Japan (Alvaredoet al. 2013; Atkinson, Piketty, and Saez 2011;Bakija, Cole, and Heim 2012). These cross-country differences have been hard to reconcilewith common explanations of income inequal-ity, such as globalization and skill-biased tech-nical change, which should be prevalent in allof these developed countries. However, the find-ings of this paper point to a new and interestingpotential explanation. First, the business world isincreasingly using English as the common lan-guage of discourse. Second, this paper showsthat English proficiency has a significant posi-tive impact on labor market performance. Thus,managers and executives from English-speakingcountries, who represent a large fraction of topincome earners (Bakija, Cole, and Heim 2012),are in a unique position to disproportionately ben-efit from the “spread of their language in globalcorporate life.”16 Certainly additional research isneeded, but this seems like one possible expla-nation for the increase in top income shares inEnglish-speaking countries.
The remainder of the article is organized asfollows. Section II discusses the data used in thisanalysis and presents a number of descriptivestatistics. Section III focuses on the empir-ical specification and Section IV presents
16. “The English Empire.” The Economist. Feburary 15,2014.
6 ECONOMIC INQUIRY
the baseline results. A variety of potentialalternate explanations are examined in the exten-sions discussed in Section V. Finally, SectionVI concludes.
II. DATA
A. Rankings Data
IDEAS/RePEc provides one of the mostcomprehensive and commonly used rankingsof authors, journals, and institutions in the eco-nomics profession (Zimmermann 2013). Over1,700 archives provide bibliographic data toRePEc on over 1,600,000 items of research(including books, articles, working papers, bookchapters, and software components) spanningover 2,000 journals (including many non-Englishjournals), over 13,000 institutions, and over42,000 individuals.17 While omissions areunavoidable, the scale and scope of this datasetare impressive. The IDEAS/RePEc data arepreferable for these reasons, however SectionV.C examines whether the results are robust tousing an older ranking of economists producedby Tom Coupe (2003).
For the purposes of this analysis, the pub-licly available February 2015 rankings of thetop 2.5% of economists (1,082 economists)across a variety of categories was obtained fromIDEAS/RePEc. These categories include variousmethods of measuring the number of papers,the number of citations, the number of journalpages published, and the number of abstractviews and downloads. IDEAS/RePEc constructsa total rank for each economist as the mean ofthese, often times repetitive, individual measures.One unfortunate implication of this aggregatemeasure is that some authors have a very highoverall rank simply because of high rankings in acouple of these criteria. For instance, economistswho often publish in statistical software journalsare ranked very highly due to abstract views anddownloads but are ranked lower according tomore traditional measures such as publicationsand citations.
Instead of using IDEAS/RePEc’s compositerank, this article focuses on two of the bestspecific measures of publishing success. Thefirst measure is the weighted number of distinctpapers divided by the number of authors oneach work. The second measure is the weightednumber of citations divided by the number ofauthors on each work. The weights in both
17. See IDEAS/RePEc website: https://ideas.repec.org.
measures reflect quality by using a recursiveimpact factor weighting method (Zimmermann2013). These two measures represent the bestand most common method for judging researchoutput.18 An average of these two individualmeasures is then calculated and used as thetotal ranking of economists in this article. Thesethree variables successfully capture prominencewithin the profession and are consistent withother metrics. For instance, among the top 10in each of these measures there are seven Nobelprize winners and six John Bates Clark winners,with no doubt more to come.
B. Biographical Information
Collecting the biographical information of thetop 2.5% of economists was the most challeng-ing and time-consuming aspect of this project.IDEAS/RePEc only provides the name and rankof each individual, so additional informationabout each of the economists had to be individ-ually gathered. Specifically, data on the countryof birth, date of birth, gender, date of death(when applicable), undergraduate institution,undergraduate graduation year, PhD institution,PhD graduation year, among other variables werecollected from a variety of different sources. Tomaintain the integrity of the dataset, a rigorousdata collection process was utilized, which oftenrequired each piece of information to be con-firmed by multiple sources. If there was any doubtabout the accuracy of the data being providedor if different sources provided conflicting infor-mation, then that particular observation was leftmissing. See the Data Gathering Process sectionin the Appendix for additional details about howthis biographical information was collected.
This analysis defines a native English speakeras a person born in the United States, Canada,United Kingdom, Australia, Ireland, or NewZealand.19 Using country of birth to definenative English speakers is appealing for a fewreasons. First, data on country of birth are morereadily available than self-reported informationon language proficiency. However, when bothare available, they are almost always consistent.Second, using country of birth eliminates thepotential for misclassification errors associatedwith self-reported language ability (Dustmannand van Soest 2001). Finally, self-reportedlanguage proficiency is potentially endogenous.
18. See IDEAS/RePEc website: https://ideas.repec.org.19. Section V.A shows that the results are robust to alter-
nate definitions of native English-speaking countries.
OLNEY: ENGLISH PROFICIENCY AND LABOR MARKET PERFORMANCE 7
For instance, both research output and the capac-ity to learn a language are likely correlated withunobserved ability. Using country of birth todetermine language proficiency eliminates theseendogeneity concerns.
With that being said, it is certainly possiblethat an economist was born in one of these coun-tries but is not a native English speaker or con-versely was born in a different foreign countrybut is a native English speaker. However, thedata collection process suggested that this is rareand it should, if anything, attenuate the empiricalresults that follow.
For some economists, information on theircountry of birth or date of birth was not avail-able or was unreliable. To maintain as completea dataset as possible, information on undergrad-uate institution and graduation year, which arealmost always available, are used to make infer-ences about these missing values. Specifically, itis assumed that the individual was born in thesame country as their undergraduate institutionand that they were 22 years old when they gradu-ated. The Missing Values section of the Appendixconfirms that these assumption are reasonableand also demonstrates that the results are actuallystronger if these country of birth and date of birthobservations are left missing.
In addition to English proficiency, the bio-graphical information is also used to constructa number of additional individual-level controls.Specifically, the empirical analysis that followsincludes: age, age squared, gender, and deceased.A control variable indicating the first letter ofthe economist’s last name is also included, wherethe variable takes on values 1 through 26 thatreflect the letters of the alphabet. Given the prac-tice in economics to list coauthors alphabetically,economists with last names beginning with a let-ter earlier in the alphabet may have an advantage(Einav and Yariv 2006; van Praag and van Praag2008).
Finally, the empirical analysis will also con-trol for the level of development of the countryin which the economist was born. Specifically,using 1990 World Bank data, the country of birthis classified as low income, low-middle income,upper-middle income, or high income.20 It isimportant to control for the level of developmentto ensure that the empirical analysis identifies
20. If data were not available for a particular countryin 1990, then information from a subsequent year was usedinstead. This was relevant for only nine countries and entailedusing data predominently from 1991 to 1992.
TABLE 1Summary Statistics
Variable Obs Mean SD Min Max
Total rank 1,059 606 337 5 1,186English 1,059 0.65 0.48 0 1Age 1,059 59 10 35 97Age squared 1,059 3,588 1,286 1,225 9,409Male 1,059 0.94 0.24 0 1First letter last name 1,059 11 7 1 26Deceased 1,059 0.03 0.18 0 1
Note: Summary statistics of the top 2.5% of economistsaccording to papers and citations using data fromRePEc/IDEAS.
the benefits of being a native English speakerand does not inadvertently capture the benefitsof being born in these developed countries. Anextension reported in Section V.B shows that theresults are robust to using other country of birthcontrols, such as GDP per capita and educationalattainment, despite the fact that this leads to manymore missing observations.
C. Descriptive Statistics
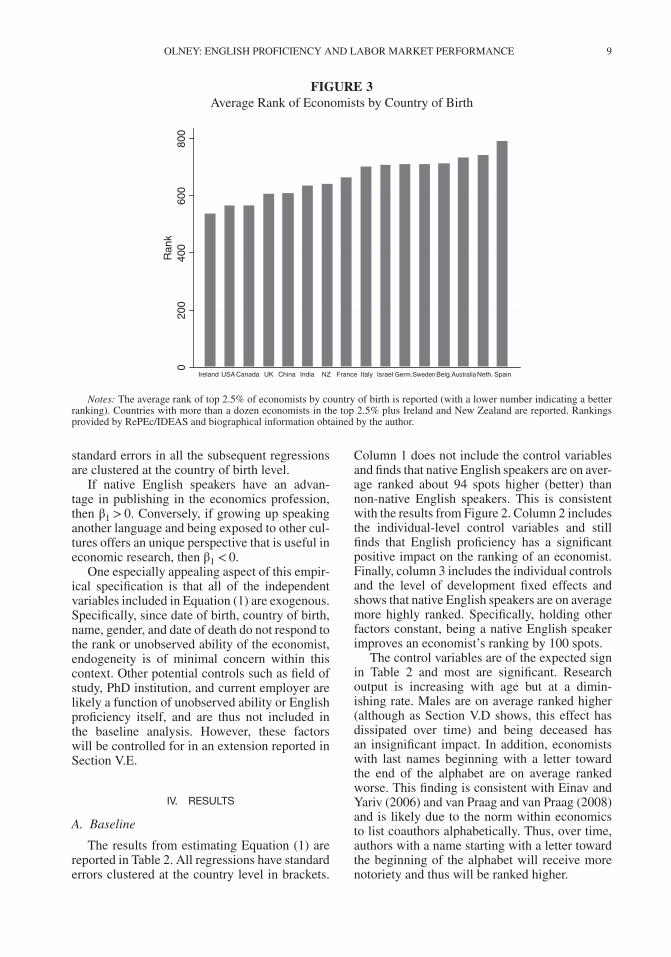
Table 1 reports summary statistics of the keydependent and independent variables. Specifi-cally, 65% of top economists are native Englishspeakers, they are on average 59 years old, theyare 94% male, on average their last name beginswith the letter K, and 3% of them are deceased.Table A2 reports the country of birth of these topeconomists. Clearly, the economists in this sam-ple were born in a diverse set of countries span-ning different stages of development.
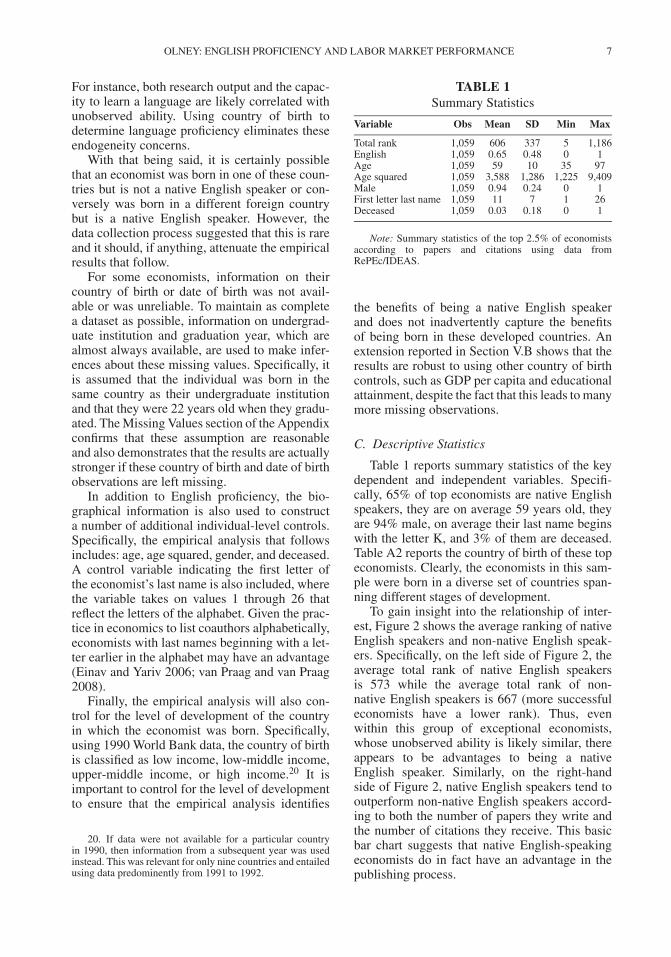
To gain insight into the relationship of inter-est, Figure 2 shows the average ranking of nativeEnglish speakers and non-native English speak-ers. Specifically, on the left side of Figure 2, theaverage total rank of native English speakersis 573 while the average total rank of non-native English speakers is 667 (more successfuleconomists have a lower rank). Thus, evenwithin this group of exceptional economists,whose unobserved ability is likely similar, thereappears to be advantages to being a nativeEnglish speaker. Similarly, on the right-handside of Figure 2, native English speakers tend tooutperform non-native English speakers accord-ing to both the number of papers they write andthe number of citations they receive. This basicbar chart suggests that native English-speakingeconomists do in fact have an advantage in thepublishing process.
8 ECONOMIC INQUIRY
FIGURE 2Average Rank of Native and Non-Native English-Speaking Economists
02
00
40
06
00
80
0
Ra
nk
Total Papers Citations
Native English Non-Native English
Note: The average rank of native and non-native English-speaking economists is reported (with a lower number indicating abetter ranking). Rankings provided by RePEc/IDEAS and biographical information obtained by the author.
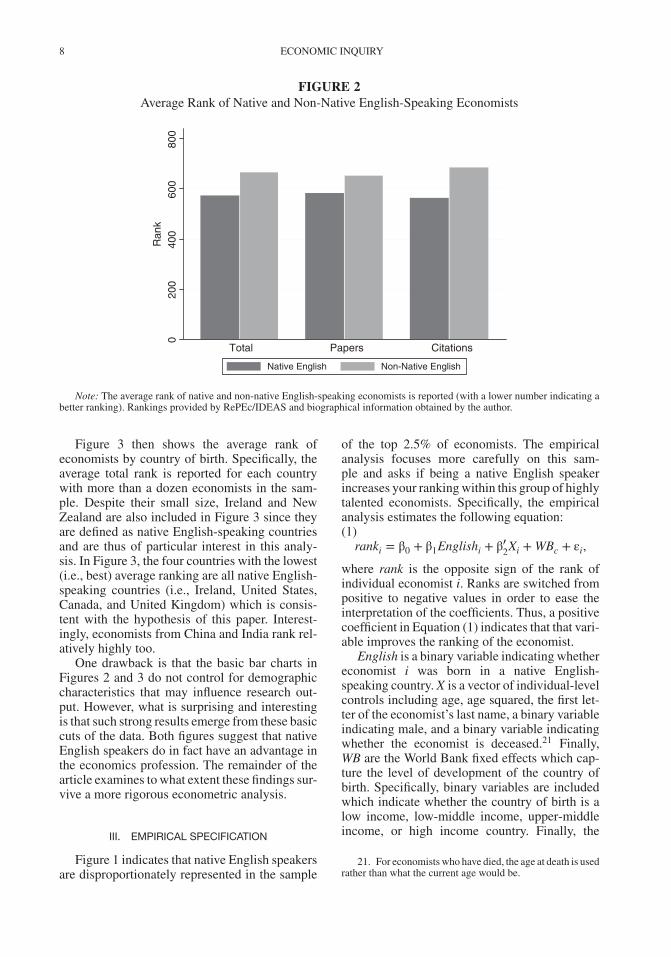
Figure 3 then shows the average rank ofeconomists by country of birth. Specifically, theaverage total rank is reported for each countrywith more than a dozen economists in the sam-ple. Despite their small size, Ireland and NewZealand are also included in Figure 3 since theyare defined as native English-speaking countriesand are thus of particular interest in this analy-sis. In Figure 3, the four countries with the lowest(i.e., best) average ranking are all native English-speaking countries (i.e., Ireland, United States,Canada, and United Kingdom) which is consis-tent with the hypothesis of this paper. Interest-ingly, economists from China and India rank rel-atively highly too.
One drawback is that the basic bar charts inFigures 2 and 3 do not control for demographiccharacteristics that may influence research out-put. However, what is surprising and interestingis that such strong results emerge from these basiccuts of the data. Both figures suggest that nativeEnglish speakers do in fact have an advantage inthe economics profession. The remainder of thearticle examines to what extent these findings sur-vive a more rigorous econometric analysis.
III. EMPIRICAL SPECIFICATION
Figure 1 indicates that native English speakersare disproportionately represented in the sample
of the top 2.5% of economists. The empiricalanalysis focuses more carefully on this sam-ple and asks if being a native English speakerincreases your ranking within this group of highlytalented economists. Specifically, the empiricalanalysis estimates the following equation:(1)
ranki = β0 + β1Englishi + β′2Xi + WBc + εi,
where rank is the opposite sign of the rank ofindividual economist i. Ranks are switched frompositive to negative values in order to ease theinterpretation of the coefficients. Thus, a positivecoefficient in Equation (1) indicates that that vari-able improves the ranking of the economist.
English is a binary variable indicating whethereconomist i was born in a native English-speaking country. X is a vector of individual-levelcontrols including age, age squared, the first let-ter of the economist’s last name, a binary variableindicating male, and a binary variable indicatingwhether the economist is deceased.21 Finally,WB are the World Bank fixed effects which cap-ture the level of development of the country ofbirth. Specifically, binary variables are includedwhich indicate whether the country of birth is alow income, low-middle income, upper-middleincome, or high income country. Finally, the
21. For economists who have died, the age at death is usedrather than what the current age would be.
OLNEY: ENGLISH PROFICIENCY AND LABOR MARKET PERFORMANCE 9
FIGURE 3Average Rank of Economists by Country of Birth
0200
400
600
800
Rank
Ireland USA Canada UK China India NZ France Italy Israel Germ.SwedenBelg.AustraliaNeth. Spain
Notes: The average rank of top 2.5% of economists by country of birth is reported (with a lower number indicating a betterranking). Countries with more than a dozen economists in the top 2.5% plus Ireland and New Zealand are reported. Rankingsprovided by RePEc/IDEAS and biographical information obtained by the author.
standard errors in all the subsequent regressionsare clustered at the country of birth level.
If native English speakers have an advan-tage in publishing in the economics profession,then β1 > 0. Conversely, if growing up speakinganother language and being exposed to other cul-tures offers an unique perspective that is useful ineconomic research, then β1 < 0.
One especially appealing aspect of this empir-ical specification is that all of the independentvariables included in Equation (1) are exogenous.Specifically, since date of birth, country of birth,name, gender, and date of death do not respond tothe rank or unobserved ability of the economist,endogeneity is of minimal concern within thiscontext. Other potential controls such as field ofstudy, PhD institution, and current employer arelikely a function of unobserved ability or Englishproficiency itself, and are thus not included inthe baseline analysis. However, these factorswill be controlled for in an extension reported inSection V.E.
IV. RESULTS
A. Baseline
The results from estimating Equation (1) arereported in Table 2. All regressions have standarderrors clustered at the country level in brackets.
Column 1 does not include the control variablesand finds that native English speakers are on aver-age ranked about 94 spots higher (better) thannon-native English speakers. This is consistentwith the results from Figure 2. Column 2 includesthe individual-level control variables and stillfinds that English proficiency has a significantpositive impact on the ranking of an economist.Finally, column 3 includes the individual controlsand the level of development fixed effects andshows that native English speakers are on averagemore highly ranked. Specifically, holding otherfactors constant, being a native English speakerimproves an economist’s ranking by 100 spots.
The control variables are of the expected signin Table 2 and most are significant. Researchoutput is increasing with age but at a dimin-ishing rate. Males are on average ranked higher(although as Section V.D shows, this effect hasdissipated over time) and being deceased hasan insignificant impact. In addition, economistswith last names beginning with a letter towardthe end of the alphabet are on average rankedworse. This finding is consistent with Einav andYariv (2006) and van Praag and van Praag (2008)and is likely due to the norm within economicsto list coauthors alphabetically. Thus, over time,authors with a name starting with a letter towardthe beginning of the alphabet will receive morenotoriety and thus will be ranked higher.

10 ECONOMIC INQUIRY
TABLE 2Impact of English Proficiency on Total Rank
Total Rank
(1) (2) (3)
English 94.17*** 68.81*** 99.74***[17.24] [16.53] [15.90]
Age 43.95*** 43.20***[7.82] [7.54]
Age squared −0.32*** −0.31***[0.06] [0.06]
Male 48.26* 49.41**[24.79] [23.95]
First letter last name −1.66** −1.46*[0.82] [0.81]
Deceased 25.98 26.72[53.35] [53.79]
COB WB FE No No YesObservations 1,059 1,059 1,059R2 0.018 0.064 0.074
Notes: Robust standard errors clustered at the country ofbirth level in brackets. The dependent variable is the totalrank of each economist, which is the average of their rankaccording to papers and citations.
***p< .01, **p< .05, *p< .1.
Overall, the results in Table 2 provide evi-dence that native English speakers do in facthave an advantage in the economics profession.The strength and significance of this finding aresurprising given the host of reasons one wouldexpect a relatively small impact in economics.For example, this is a sample of extremely well-educated, talented economists where we wouldexpect the differences in English proficiencyto be minimal. Second, economics is a math-and statistical-based discipline that relies lesson eloquent language relative to other fields.Third, since economists often collaborate, onewould expect the impact of native language tobe minimal as native English and non-nativeEnglish speakers coauthor together. Fourth, theeconomists on this list have large resources attheir disposal which can be used to hire Englishproofreaders if need be. Thus, for a variety ofreasons, one would expect a minimal impact,and yet Table 2 shows that native English speak-ers have a significant advantage in the publi-cation process over similar non-native English-speaking colleagues.
B. Components
Table 3 examines the impact of being a nativeEnglish speaker on each of the components ofthe total rank variable. Specifically, column 1presents the baseline results while columns 2and 3 use the quality-adjusted number of papers
TABLE 3Impact of English Proficiency on Components
of Total Rank
TotalRank
PaperRank
CitationRank
(1) (2) (3)
English 99.74*** 57.71*** 141.78***[15.90] [21.40] [21.17]
Age 43.20*** 33.97*** 52.43***[7.54] [8.03] [8.74]
Age squared −0.31*** −0.21*** −0.42***[0.06] [0.07] [0.08]
Male 49.41** 78.96*** 19.86[23.95] [28.88] [38.85]
First letter last name −1.46* −2.53 −0.40[0.81] [1.55] [1.51]
Deceased 26.72 38.88 14.56[53.79] [46.28] [89.66]
COB WB FE Yes Yes YesObservations 1,059 1,059 1,059R2 0.074 0.075 0.064
Notes: Robust standard errors clustered at the countryof birth level in brackets. “Paper Rank” is the rank of aneconomist according to their quality-adjusted number of dis-tinct papers. “Citation Rank” is the rank of an economistaccording to their quality-adjusted number of citations.
***p< .01, **p< .05, * p< .1.
and citations as the dependent variable, respec-tively. The results indicate that being a nativeEnglish speaker has a positive and significantimpact on both of these components. In col-umn 2 of Table 3, native English speakers areranked 58 spots higher according to their quality-adjusted number of papers. Consistent with theeditors’ comments about the importance of well-written papers, the results in column 2 indi-cate that economists with a better commandof the English language are more successful atpublishing their work.
In addition, column 3 shows that nativeEnglish speakers are ranked 142 spots higheraccording to the (quality-adjusted) number oftimes their research is cited. If native Englishspeakers are on average writing clearer andmore persuasive papers, as the editors’ quotesindicate, then it is not surprisingly that they arerelatively more successful at publishing theirwork (column 2) and that their research is citedmore often (column 3). Overall, Table 3 confirmsthat native English speakers have an advantagein terms of both the quantity and quality of theirpapers and citations.
The results in Table 3 use the rank of aneconomist as the dependent variable. However,the Score Instead of Rank section in the Appendixinvestigates whether the findings are robust to

OLNEY: ENGLISH PROFICIENCY AND LABOR MARKET PERFORMANCE 11
TABLE 4Impact of English Proficiency on Rank, by Alternate English Definitions
Total Rank
(1) (2) (3) (4) (5)
English official 94.68***[16.09]
English 20% 70.83***[17.85]
Linguistic distance −102.57***[16.49]
English undergrad 113.01***[15.82]
English COB & undergrad 112.42***[16.51]
Controls Yes Yes Yes Yes YesCOB WB FE Yes Yes Yes Yes YesObservations 1,059 1,059 1,059 1,046 1,046R2 0.073 0.067 0.073 0.084 0.084
Notes: Robust standard errors clustered at the country of birth level in brackets. Column 1 defines countries as Englishspeaking if their official language is English (using data from CEPII) which includes the six baseline countries as well as HongKong, India, Jamaica, and Zimbabwe. Column 2 defines countries as English speaking if more than 20% of the population speaksEnglish (according to CEPII) which includes the six baseline countries as well as Hong Kong, India, Israel, Jamaica, Lebanon,Pakistan, Rwanda, South Korea, and Zimbabwe. Column 3 instead uses a measure of linguistic distance from the United States(Fearon 2003 and Spolaore and Wacziarg 2009) to examine whether it is more difficult for some economists to learn Englishthan others. Column 4 defines a native English speaker as an economist that went to an undergraduate institution in one of the sixnative English-speaking countries. Finally, column 5 defines a native English speaker as an economist who was born and wentto an undergraduate institution in one of the six native English-speaking countries.
***p< .01, **p< .05, *p< .1.
using the underlying (quality-adjusted) numberof paper and citation “score” variables instead.Consistent with the baseline results, this exten-sion indicates that native English speakers haveapproximately 9% more quality-adjusted papersand 22% more quality-adjusted citations. Over-all, Table A3 shows that the results are not sen-sitive to whether the rank or the score of theeconomist is used as the dependent variable.
V. EXTENSIONS
The baseline results provide compelling evi-dence that native English-speaking economistsdo in fact have an advantage in the publishingprocess. However, perhaps there are other poten-tial explanations that could be contributing tothese strong and significant results. Thus, the goalof this section is to examine and hopefully refutethese alternate hypotheses.
A. English Definition
This subsection investigates whether theresults are robust to alternate definitions ofEnglish proficiency. This includes using broaderdefinitions of native English-speaking coun-tries, an analysis that takes into account the
linguistic distance between foreign languagesand English, and using undergraduate institutionrather than the country of birth as a proxy forEnglish proficiency.
First, this analysis has defined native Englishspeakers as those economists born in the UnitedStates, Canada, the United Kingdom, Australia,Ireland, and New Zealand. This is a logicalbut conservative definition of English-speakingcountries. There are other countries that either useEnglish as their official language or have a sig-nificant English-speaking population. Thus, twoalternate definitions of native English-speakingcountries are constructed. Using data from theCentre d’Études Prospectives et d’InformationsInternationales (CEPII) countries were definedas English speaking if English is the officiallanguage or if at least 20% of the populationspeaks English.
The results from this robustness analysis arereported in Table 4. Column 1 defines English-speaking countries as those where English isthe official language. According to CEPII, thisincludes the six baseline countries as well asHong Kong, India, Jamaica, and Zimbabwe.22
22. Obviously, there are many other countries whereEnglish is the official language, but these are the ones whereat least one economist in the top 2.5% was born.

12 ECONOMIC INQUIRY
Column 2 defines a country as English speakingif at least 20% of the population speaks English.According to CEPII, this includes the six base-line countries as well as Hong Kong, India,Israel, Jamaica, Lebanon, Pakistan, Rwanda,South Korea, and Zimbabwe. The results incolumns 1 and 2 indicate that English profi-ciency has a positive and significant impact onthe ranking of economists regardless of hownative English-speaking countries are defined.
Second, the linguistic distance betweenEnglish and an economist’s native languagemay be important. For instance, economists thatgrew up speaking a foreign language that ismore similar to English may have an easier timelearning English and subsequently publishingin economic journals. To investigate this possi-bility, I use data on linguistic distance betweencountries constructed by Fearon (2003) and Spo-laore and Wacziarg (2009). Specifically, Fearon(2003) identifies how many common nodes inthe linguistic tree two languages share. Spolaoreand Wacziarg (2009) then create a weighted mea-sure of linguistic similarity between countriesusing the number of nodes two randomly chosenpeople (one from each country) would share.23
Following Fearon (2003) and Spolaore andWacziarg (2009), I then transform this variableso that it is bounded by 0 and 1 and increasing inlinguistic distance.24
Column 3 in Table 4 shows that this mea-sure of linguistic distance has a significant neg-ative effect on subsequent publishing successwithin the economics procession. This means thatan economist’s ranking is decreasing as the lin-guistic distance between their country of birthand the United States increases. This is consis-tent with the idea that it is more difficult forsome economists to learn English and thus pub-lish in English-speaking journals than others. Itis important to emphasize that this continuousmeasure of linguistic distance is totally distinctfrom the measure of English proficiency used inthe baseline analysis. However, the results arevery similar.
Third, perhaps English proficiency is drivenmore by the undergraduate institution rather
23. My results are similar if I instead use an unweightedmeasure that simply measures the number of common nodesshared by the most commonly spoken language in the twocountries.
24. There are a maximum of 15 nodes so the trans-formation takes the following form: Linguistic Distance =√
(15−#common nodes)15
.
than the country of birth (Hamermesh and Pfann2013). To test this hypothesis, it is possibleto define an English speaker as someone whowent to an undergraduate institution in a nativeEnglish-speaking country rather than someonewho was born in a native English-speakingcountry. Column 4 of Table 4 shows that thecoefficient on this alternate definition of nativeEnglish speakers is positive and significant.25
Finally, column 5 defines economists as nativeEnglish speakers if they were born and went toan undergraduate institution in a native English-speaking country. Again, the results are positiveand significant. Overall, Table 4 shows that theresults are robust to a wide variety of alternatedefinitions of native English speakers.
B. Country Controls and Results
Perhaps, the English proficiency variable isinadvertently capturing some other benefit ofbeing born in these six countries or maybe theresults are being driven by one particular countryand not reflecting the benefits of being a nativeEnglish speaker more generally. This subsectioninvestigates both of these issues.
While the World Bank fixed effects, whichcontrol for the level of development of the coun-try of birth, should mitigate this former concern,maybe this is too coarse a measure. Although fewpotential time-varying country-of-birth controlsspan the countries and years in this dataset, for-tunately both real GDP per capital and averageyears of schooling have reasonably good cover-age. Data on real GDP per capita were obtainedfor numerous countries from 1950 to 2010 fromthe Penn World Tables. Data on average years ofschooling were obtained from the Barro and Lee(2013) Educational Attainment Dataset.26
The results in Table 5 account for the possi-bility that the level of income or the educationalsystem within a country affects the economist’supbringing which in turn is correlated with theirfuture success. Specifically, column 1 controlsfor the real GDP per capita and the averageyears of schooling in the country and year of theeconomist’s birth. Neither real GDP per capitanor average years of schooling are significant and
25. Additional results show that the benefits of goingto an undergraduate institution in a native English-speakingcountry are, not surprisingly, even larger for economists bornin non-English-speaking countries.
26. The average years of schooling data of those over 25years old is reported every 5 years from 1950 to 2010 and theintervening years are calculated using linear interpolation.

OLNEY: ENGLISH PROFICIENCY AND LABOR MARKET PERFORMANCE 13
TABLE 5Impact of English Proficiency on Rank,Country-Specific Controls and Results
Total Rank
(1) (2) (3) (4)
English 138.87*** 94.28***[21.50] [24.55]
English U.S. 153.98*** 119.32***[23.05] [28.89]
English other 129.31*** 80.00***[19.71] [23.05]
In (RGDPPC) −31.03 −40.36[39.89] [42.09]
In (Schooling) −23.83 −34.13[40.78] [41.48]
In (RGDPPC) at 18 20.36 −1.56[43.67] [47.06]
In (Schooling) at 18 11.15 −11.05[46.17] [50.26]
Controls Yes Yes Yes YesCOB WB FE Yes Yes Yes YesObservations 717 1,009 717 1,009R2 0.085 0.076 0.085 0.077
Notes: Robust standard errors clustered at the country of birth levelin brackets. Columns 1 and 3 include real GDP per capita and averageyears of schooling at the time of the economist’s birth. Columns 2 and4 use instead real GDP per capita and average years of schooling whenthe economist was 18 years old. Columns 3 and 4 separate the UnitedStates from other native English-speaking countries.
***p< .01, **p< .05, *p< .1.
importantly the coefficient on English remainspositive and significant. This result is similar tothe baseline findings, despite the fact that a thirdof the sample is lost because of missing GDP andschooling values.27
In order to reduce the number of missingobservations, column 2 uses real GDP per capitaand the average years of schooling in the coun-try of birth when the economist was 18 yearsold instead. Using information from when theeconomist was 18 is appealing since this is whenthey are in the midst of their education andthus the impact of their country of birth may bemost profound. However, the results in column 2remain similar. Once again GDP and schoolingare insignificant and the coefficient on Englishremains positive and significant.
Another concern is that maybe the results arebeing driven by Americans who represent a largefraction of the top economists and who may havean advantage because a disproportionate num-ber of the best economics departments and jour-nals happen to be based in the United States.Although Figure 3 refutes this concern, columns
27. Due to a lack of data, any economist who was bornprior to 1950 is automatically dropped from the sampleand in many countries economists born much later werealso dropped.
3 and 4 decompose native English speakers intothose born in the United States and those born inthe other five native English-speaking countries.The coefficients on both variables are positive andsignificant, and importantly not statistically dif-ferent from one another. This indicates that theresults are not being driven solely by U.S.-borneconomists.28
Table 5 shows that including time-varyingcountry-specific controls does not offer any ben-efit over the World Bank fixed effects. The resultsremain similar, but these controls significantlyreduce the number of observations which is whyonly the World Bank fixed effects are used inthe baseline analysis. Furthermore, the resultsin Table 5 support the assertion that it is thesecountry’s shared language that is driving theresults and not some idiosyncratic factor specificto Americans. Overall, these findings provide noevidence that the English proficiency variable isinadvertently capturing other characteristics ofthe home country or that one particular English-speaking country is driving the results.
C. Alternate Rankings
This subsection investigates whether theresults are robust to using other rankings ofeconomists. The IDEAS/RePEc dataset providesthe most comprehensive, the most rigorous, andthe most commonly used ranking of economists.However, perhaps there is some unobserved biasagainst non-English-speaking economists in theIDEAS/RePEc rankings that are affecting theresults in this article. While there is nothing inthe data that suggests this is in fact the case, it isworth exploring whether the results are robust tothe use of other rankings.
The only other comprehensive rankings ofeconomists, that I am aware of, was constructedby Tom Coupe (2003). Specifically, he rankedeconomists according to publications from 1969to 2000 and ranked economists according to cita-tions from 1975 to 2000.29 The analysis focuseson quality-adjusted articles and the citation countwhich are broadly consistent with the analogousIDEAS/RePEc measures.30 However, there are
28. Additional results show that all six native English-speaking countries individually have significant positiveeffects on total rank, although these results are a bit noisiergiven the small sample sizes.
29. A more limited version of this data spanning the years1990–2000 was used in Tom Coupe’s 2003 paper. The morecomprehensive data used in this analysis are available on hisarchived website.
30. The results are robust to using other rankings ofpublications and citations.
14 ECONOMIC INQUIRY
TABLE 6Impact of English Proficiency on Alternate
Coupe Ranking of Economists
Total Rank Paper Rank Citation Rank(1) (2) (3)
English 117.57*** 117.28** 110.02***[38.90] [45.38] [39.64]
Controls Yes Yes YesCOB WB FE Yes Yes YesObservations 611 611 611R2 0.023 0.082 0.043
Notes: Robust standard errors clustered at the country of birth levelin brackets. This table uses rankings of economists produced by TomCoupe rather than from lDEAS/RePEc.
***p< .01, **p< .05, *p< .1.
some differences between these two datasets thatare worth noting: the Coupe data cover an ear-lier time period, use a different database of arti-cles, include fewer economists, and measure pub-lications and citations in a slightly less sophisti-cated way.
Nonetheless, the results using the Coupe rank-ings are reported in Table 6. This analysis focuseson the top 611 economists according to totalrank, which is an average of the publication rankand the citation rank.31 The results indicate thatnative English-speaking economists are rankedhigher overall (column 1), ranked higher accord-ing to their publications (column 2), and rankedhigher according to their citations (column 3).Not only are these results significant and identi-cal in sign to the baseline results but amazinglythe magnitudes are very similar too. Thus, theresults are the same when using a completely dif-ferent dataset that covers a different sample ofyears, includes a different group of economists,and uses slightly different rank variables. Over-all, this provides support for the conclusions ofthe article and indicates that the baseline resultsare robust to the use of a totally distinct rankingsof economists.
D. Cohorts
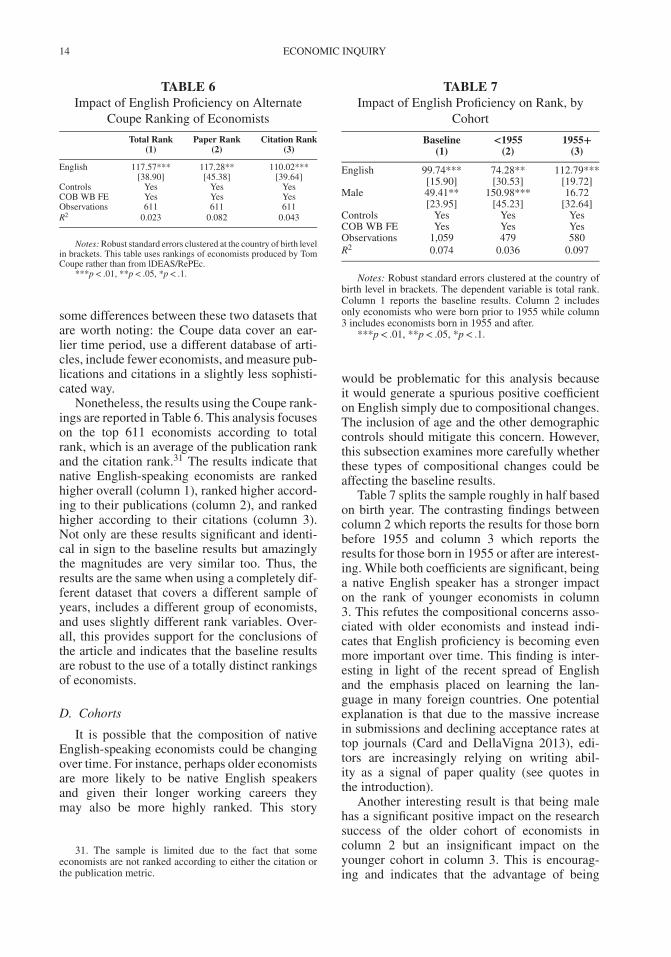
It is possible that the composition of nativeEnglish-speaking economists could be changingover time. For instance, perhaps older economistsare more likely to be native English speakersand given their longer working careers theymay also be more highly ranked. This story
31. The sample is limited due to the fact that someeconomists are not ranked according to either the citation orthe publication metric.
TABLE 7Impact of English Proficiency on Rank, by
Cohort
Baseline <1955 1955+(1) (2) (3)
English 99.74*** 74.28** 112.79***[15.90] [30.53] [19.72]
Male 49.41** 150.98*** 16.72[23.95] [45.23] [32.64]
Controls Yes Yes YesCOB WB FE Yes Yes YesObservations 1,059 479 580R2 0.074 0.036 0.097
Notes: Robust standard errors clustered at the country ofbirth level in brackets. The dependent variable is total rank.Column 1 reports the baseline results. Column 2 includesonly economists who were born prior to 1955 while column3 includes economists born in 1955 and after.
***p< .01, **p< .05, *p< .1.
would be problematic for this analysis becauseit would generate a spurious positive coefficienton English simply due to compositional changes.The inclusion of age and the other demographiccontrols should mitigate this concern. However,this subsection examines more carefully whetherthese types of compositional changes could beaffecting the baseline results.
Table 7 splits the sample roughly in half basedon birth year. The contrasting findings betweencolumn 2 which reports the results for those bornbefore 1955 and column 3 which reports theresults for those born in 1955 or after are interest-ing. While both coefficients are significant, beinga native English speaker has a stronger impacton the rank of younger economists in column3. This refutes the compositional concerns asso-ciated with older economists and instead indi-cates that English proficiency is becoming evenmore important over time. This finding is inter-esting in light of the recent spread of Englishand the emphasis placed on learning the lan-guage in many foreign countries. One potentialexplanation is that due to the massive increasein submissions and declining acceptance rates attop journals (Card and DellaVigna 2013), edi-tors are increasingly relying on writing abil-ity as a signal of paper quality (see quotes inthe introduction).
Another interesting result is that being malehas a significant positive impact on the researchsuccess of the older cohort of economists incolumn 2 but an insignificant impact on theyounger cohort in column 3. This is encourag-ing and indicates that the advantage of being
OLNEY: ENGLISH PROFICIENCY AND LABOR MARKET PERFORMANCE 15
male in the economics profession has diminishedover time.
E. Individual Controls
The baseline analysis only includes inde-pendent variables that are plausibly exogenous.Country of birth, date of birth, name, gender,and date of death do not depend on the rank orunobserved ability of the economist, which isan appealing feature of the econometric speci-fication. With that said, there are other factors,such as field of study, PhD institution, andcountry of employment that may influence theresearch output of an economist. While poten-tially important, these factors were not includedin the baseline analysis since they are likelyendogenous to unobserved ability and Englishproficiency. However, this section examineswhether the results survive the inclusion of theseadditional variables.
First, field of study may influence aneconomist’s ranking since it could be easier
for some fields to publish in top journals relativeto others. Furthermore, economists in largersubdisiplines may have more citations to theirwork simply due to the shear size of their field.Second, whether an economist received theirPhD from an American institution may alsohave an important impact on future researchoutput. Many of the top programs are locatedin the United States, attending a PhD programin the United States may improve Englishproficiency, and attending an American insti-tution may provide professional networks thatprove useful in the future. Third, research andtenure expectations as well as professionalnetworks may vary according to the countryof employment. For instance, U.S. employersmay have higher research expectations, betterprofessional networks, and attract more nativeEnglish speakers.
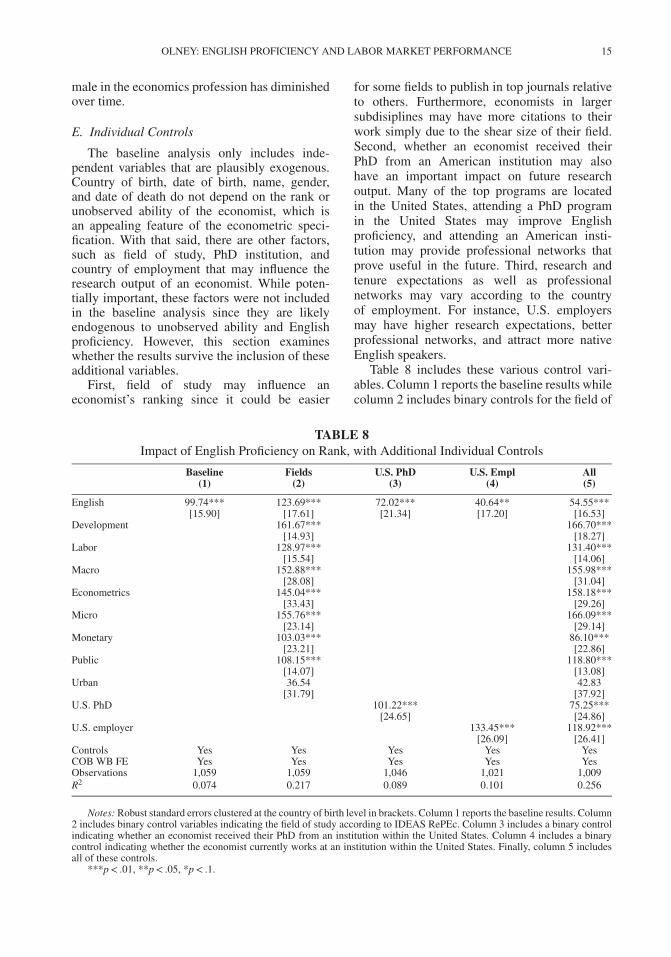
Table 8 includes these various control vari-ables. Column 1 reports the baseline results whilecolumn 2 includes binary controls for the field of
TABLE 8Impact of English Proficiency on Rank, with Additional Individual Controls
Baseline Fields U.S. PhD U.S. Empl All(1) (2) (3) (4) (5)
English 99.74*** 123.69*** 72.02*** 40.64** 54.55***[15.90] [17.61] [21.34] [17.20] [16.53]
Development 161.67*** 166.70***[14.93] [18.27]
Labor 128.97*** 131.40***[15.54] [14.06]
Macro 152.88*** 155.98***[28.08] [31.04]
Econometrics 145.04*** 158.18***[33.43] [29.26]
Micro 155.76*** 166.09***[23.14] [29.14]
Monetary 103.03*** 86.10***[23.21] [22.86]
Public 108.15*** 118.80***[14.07] [13.08]
Urban 36.54 42.83[31.79] [37.92]
U.S. PhD 101.22*** 75.25***[24.65] [24.86]
U.S. employer 133.45*** 118.92***[26.09] [26.41]
Controls Yes Yes Yes Yes YesCOB WB FE Yes Yes Yes Yes YesObservations 1,059 1,059 1,046 1,021 1,009R2 0.074 0.217 0.089 0.101 0.256
Notes: Robust standard errors clustered at the country of birth level in brackets. Column 1 reports the baseline results. Column2 includes binary control variables indicating the field of study according to IDEAS RePEc. Column 3 includes a binary controlindicating whether an economist received their PhD from an institution within the United States. Column 4 includes a binarycontrol indicating whether the economist currently works at an institution within the United States. Finally, column 5 includesall of these controls.
***p< .01, **p< .05, *p< .1.
16 ECONOMIC INQUIRY
TABLE 9Impact of English Proficiency on Rank, by Sample Size
Top 1,000 Top 900 Top 800 Top 700 Bottom 1,000 Bottom 900 Bottom 800 Bottom 700(1) (2) (3) (4) (5) (6) (7) (8)
English 86.34*** 81.23*** 87.56*** 78.75*** 83.08*** 60.70*** 38.50** 29.61**[17.34] [20.11] [20.60] [20.36] [13.07] [13.90] [17.63] [13.56]
Controls Yes Yes Yes Yes Yes Yes Yes YesCOB WB FE Yes Yes Yes Yes Yes Yes Yes YesObservations 1,000 900 800 700 999 900 800 700R2 0.076 0.081 0.087 0.084 0.054 0.037 0.033 0.024
Notes: Robust standard errors clustered at the country of birth level in brackets. The dependent variable is total rank. Columns1–4 restrict the sample to the top X number of economists, and columns 5–8 restrict the sample to the bottom X number ofeconomists.
***p < .01, **p < .05, *p < 0.1.
study of the economist.32 Most of these large sub-disciplines have a significant positive effect onan economist’s ranking (relative to the excludedsmaller fields), but importantly the English pro-ficiency coefficient remains positive, significant,and is actually larger in size. The results incolumns 3 and 4 indicate that economists thatobtained their PhD from a U.S. university and thatcurrently work for a U.S. institution are rankedhigher.33 Given the endogeneity of both vari-ables, it is hard to know whether this impliesthat attending and working for American institu-tions is beneficial for research output or whethera selection effect means that talented economistsare more likely to attend and work at U.S. insti-tutions. Nonetheless, the more important pointis that the coefficient on English proficiencyremains positive and significant in both specifi-cations. Not surprisingly, the magnitude of thiscoefficient is slightly smaller in column 4, sincewhere an economist works is a direct functionof his or her research. Thus, controlling for U.S.employment absorbs a lot of potentially usefulvariation in research output
Finally, column 6 includes all of these addi-tional controls together. The results show thatEnglish proficiency has a significant positiveeffect on research output after controlling for theeconomist’s field of study, whether they obtaineda U.S. PhD, and whether they work in the UnitedStates. It is reassuring that the results remainsignificant despite the inclusion of all of thesepotentially endogenous controls. Overall, Table 8
32. The subdiscipline of the economist was determinedusing the field designation in IDEAS/RePEc. Note, it is pos-sible for the same economist to be listed in different subfields.
33. Current employer is not available for deceasedeconomists which limits the sample in column 4.
shows that subdisciplines, network effects, andresearch expectations are not the primary driversof the results in this article. Even after controllingfor all of these factors, native English-speakingeconomists still have an advantage.
F. Sample
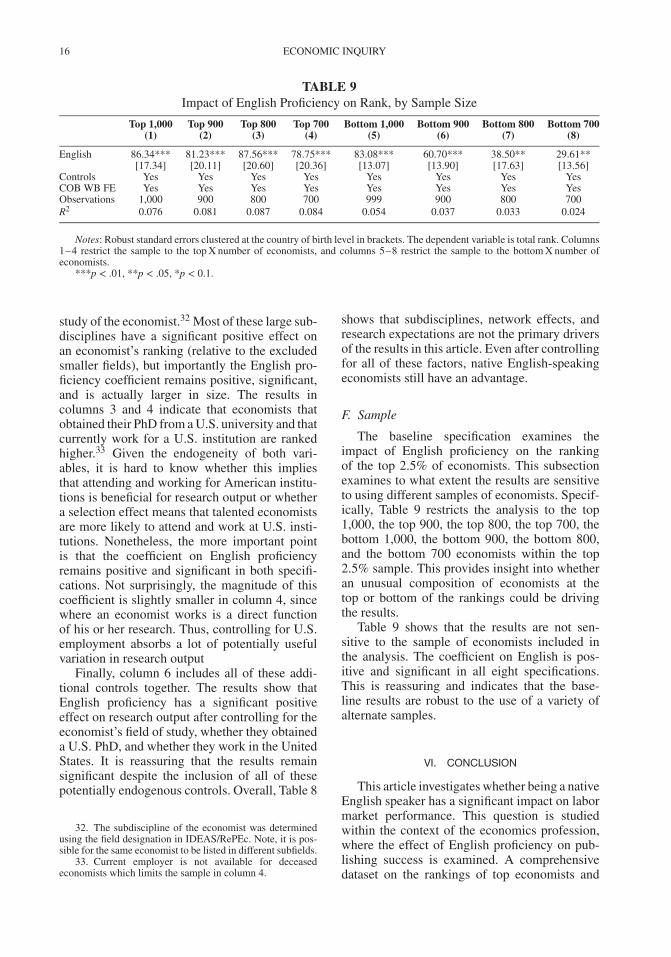
The baseline specification examines theimpact of English proficiency on the rankingof the top 2.5% of economists. This subsectionexamines to what extent the results are sensitiveto using different samples of economists. Specif-ically, Table 9 restricts the analysis to the top1,000, the top 900, the top 800, the top 700, thebottom 1,000, the bottom 900, the bottom 800,and the bottom 700 economists within the top2.5% sample. This provides insight into whetheran unusual composition of economists at thetop or bottom of the rankings could be drivingthe results.
Table 9 shows that the results are not sen-sitive to the sample of economists included inthe analysis. The coefficient on English is pos-itive and significant in all eight specifications.This is reassuring and indicates that the base-line results are robust to the use of a variety ofalternate samples.
VI. CONCLUSION
This article investigates whether being a nativeEnglish speaker has a significant impact on labormarket performance. This question is studiedwithin the context of the economics profession,where the effect of English proficiency on pub-lishing success is examined. A comprehensivedataset on the rankings of top economists and
OLNEY: ENGLISH PROFICIENCY AND LABOR MARKET PERFORMANCE 17
their biographical information is constructed toexamine this issue.
The results provide compelling evidencethat native English speakers do in fact have anadvantage in the economics profession. Con-trolling for a host of other factors, the resultsindicate that native English speakers are ranked,on average, about 100 spots higher than non-native English speakers. Similar results are foundwhen separately examining the impact on paperand citation ranks. Additional results using theunderlying paper and citation scores rather thanthe ranks (see Score Instead of Rank section inthe Appendix) confirm these baseline results andindicate that the findings are meaningful. Englishproficiency leads to approximately a 9% increasein the quality-adjusted number of papers anda 22% increase in the quality-adjusted numberof citations.
A host of extensions and robustness checksdispel other potential explanations for these find-ings and suggests that English proficiency is lead-ing to a significant advantage in research outputin the economics profession. This confirms anec-dotal evidence that indicates that native Englishspeakers have an advantage in writing economicpapers and that well-written papers are morelikely to be accepted by economics journals.
Due to data constraints, this analysis focuseson an elite group of economists. However, theseare the leaders in the field who have enormousinfluence within the profession, in policy circles,and in public debates more generally. Thus, thefinding that this elite group of economists dis-proportionately consists of native English speak-ers may have important implications within andoutside the profession. Furthermore, since thissample of economists are incredibly talented andhave enormous resources at their disposable, theimpact of English proficiency should if anythingbe attenuated.
More generally, these results have importantimplications. First, they indicate that some indi-viduals have an advantage at publishing withineconomics simply due to their country of birthand native language. Since research output is acrucial factor in tenure, promotions, and com-pensation, this finding is potentially troubling.Second, these results have broader implicationsfor other disciplines and professions. The factthat such strong results are found in a math-and written-based discipline like economicssuggests that the impact of being a native Englishspeaker is likely even larger in other fields and
professions. Given the rapid pace of globaliza-tion and the spread of the English language,this is an important finding that warrantsfurther research.
APPENDIX
DATA GATHERING PROCESS
Biographical information for each of the top economistsin the sample was individually gathered from a variety ofsources. This proved to be the most daunting aspect of thisproject but also the most important. Great care was takento ensure that each piece of information was correct, whichoften entailed confirming it across multiple sources. Thespecific data collection process for each individual took thefollowing form.
First, the curriculum vitae (CV) of the individual wasused which proved to be the most important source of bio-graphical information. Almost all economists publicly posttheir CVs and the information is deemed highly accurate,since the economist creates the document themselves. TheCV almost always includes current employment, undergrad-uate institution, undergraduate graduation year, PhD institu-tion, and PhD graduation year. Often the economist’s CValso includes information on the country of birth, year ofbirth, citizenship, and languages (including “mother tongue”).Since citizenship can change, it was not used to identify coun-try of birth unless it could be independently confirmed withother information from different sources. Furthermore, the“mother tongue” and country of birth were almost alwaysconsistent. However, country of birth had far better coverage.For economists that provided all of this biographical infor-mation, the data gathering process was complete. However,even for these individuals, the data provided in the CV werecross-checked against information provided by other sources.Unfortunately, many economists do not provide, for instance,country and year of birth in their CVs and so I turned toother sources.
Economists with missing or incomplete CVs were lookedup in Who’s Who in Economics (Blaug and Vane 2003). Thisbook provides biographical information, including name,education, country of birth, date of birth, and current andpast employment, for the most noteworthy economists ofthe twentieth century. Numerous older and more prominenteconomists are listed in the book, and thus Who’s Whoin Economics proved to be a valuable source of informa-tion. When applicable, rarely did an entry in Who’s Whoin Economics conflict with the information provided on theeconomist’s CV.
The short autobiographies written by Nobel Prize win-ning economists also proved to be a useful source of informa-tion. This was a first-hand account of the economists’ past,although obviously it is only available for a select group ofeconomists. For economists who unfortunately passed away,there are often obituaries that include extensive biographicalinformation. In addition, economists often grant interviewswhich are available online and contain information about theirpast. Numerous economists also provide a short biography ontheir website. This often has information such as country ofbirth, date of birth, or the place that they grew up which wasnot readily available on their CV.
Many economists have entries in Wikipedia that containbiographical information. However, given the open sourcenature of Wikipedia, I used this information sparingly and

18 ECONOMIC INQUIRY
FIGURE A1
Age at Undergraduate Graduation
01
00
200
300
400
Fre
quency
15 20 25 30
Age at Undergraduate Graduation
Note: This histogram includes the top 2.5% of economists with nonmissing date of birth and undergraduate year of graduation.
FIGURE A2
Share of Economists Whose COB Equals Undergraduate Country
020
40
60
80
100
Perc
ent
Total English COB Non-English COB
Note: This bar chart reports the share of economists, with nonmissing values, whose country of birth equals the country oftheir undergraduate studies. This share is reported for all economists in column 1, for those born in the six native English-speakingcountries in column 2, and for those born in all non-native English-speaking countries in column 3.
would cross-check it with data from other sources beforeusing it. Finally, background check websites (such as Radaris)contain information on the age of an individual which can beused to infer the year of birth.34 This information was onlyutilized if the full name (including middle initial) matched the
34. The amount of publicly available information onthese websites is surprisingly comprehensive. For instance,they have information on any person that resided within the
economist, if the place of residence was consistent with theeconomist’s current employer, and if past locations were con-sistent with past employers of the economist. Finally, beforeusing this information, the date of birth was cross-checkedagainst the year of undergraduate degree to ensure that theimplied age at graduation was plausible. For economists
United States for any period of time (which includes mosteconomists in my sample).

OLNEY: ENGLISH PROFICIENCY AND LABOR MARKET PERFORMANCE 19
TABLE A1Impact of English Proficiency on Components of Rank,
Missing Values
Total Rank Papers Citations(1) (2) (3)
English 125.56*** 87.65*** 163.47***[20.84] [27.93] [25.82]
Controls Yes Yes YesCOB WB FE Yes Yes YesObservations 794 794 794R2 0.087 0.075 0.092
Notes: Robust standard errors clustered at the countryof birth level in brackets. Missing country of birth and ageobservations are not filled.
***p< .01, **p< .05, *p< .1.
with common names, it was not possible to conclusivelyidentify them on these websites and thus the observation wasleft missing.
MISSING VALUES
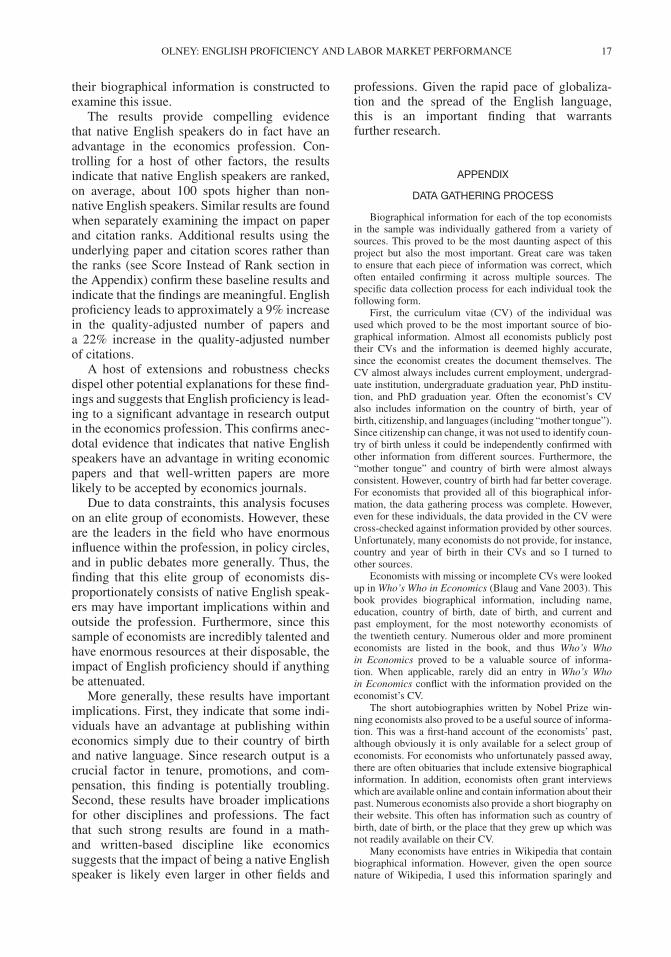
Despite my best efforts to construct a comprehensivedataset using this data collection process, some biographicalinformation for certain economists remains unavailable. Fur-thermore, if there was any ambiguity or inconsistencies acrosssources, I erred on the side of caution and left the observa-tion missing. Thus, a portion of economists within my samplehave missing biographical information. For this article, thecountry of birth and date of birth missing values are poten-tially problematic since they are used to construct the English,age, and age-squared variables utilized in the empirical anal-ysis. Information on gender, the first letter of the economist’slast name, and the year of death (when applicable) werenever missing.
In the sample of the top 2.5% of economists, 9% of theyear of birth observations are missing and 20% of the countryof birth observations are missing. It is unclear whether toleave these observations missing or rely on other biographicalinformation to make inferences about these missing values. Inthe baseline specification, I chose the latter option to ensure, tothe extent possible, that the full sample of top economists wasmaintained. Thus, specifically it is assumed that individualsgraduated from their undergraduate institution at the age of22.35 In addition, it is assumed that the economist obtainedan undergraduate degree from an institution in their country ofbirth. Because information on the undergraduate institution isseldom missing, this proved to be a useful way of identifyingboth missing values.
How reasonable is it to assume that the economist grad-uated from their undergraduate institution at the age of 22?Figure A1 provides information on the age at graduation, forthose economists that have nonmissing data on year of birthand year of graduation. Forty-three percent of these individu-als graduated at the age of 22 and 79% graduated between theages of 21 and 23. Thus, approximating the date of birth bysubtracting 22 from the economist’s graduation year appearsto be remarkably accurate.
35. For five economists whose undergraduate informa-tion was also missing, I inferred their date of birth by usingtheir PhD graduation year and assuming that they were 28years old when they graduated.
Next it is worth asking how reasonable it is to assume thatthe economist graduated from an undergraduate institution intheir country of birth. Among those economists with nonmiss-ing values, Figure A2 shows the share of individuals whosecountry of birth matches the country of their undergradu-ate degrees. The first column shows that 89% of economistsgraduated college in the country in which they were born.Column 2 shows that the share is 98% for those born inthe six English-speaking countries and 75% for non-English-speaking countries. Overall, Figure A2 demonstrates that itis quite common for economists to attend an undergraduateinstitution in their country of birth.
Despite the fact that the assumptions used to approx-imate the age and country of birth of the economist seemremarkably accurate, it is worth investigating what wouldhappen if these observations were left missing. Table A1replicates Table 3 but leaves these values missing. Despite thedrop in the number of observations, the results remain verysimilar. Specifically, English remains positive and significantin all three specifications. Furthermore, the magnitude ofthe coefficients, if anything, becomes larger in Table A1.Thus, the treatment of these missing values has no significantbearing on the results.
COUNTRY OF BIRTH OF TOP ECONOMISTS
TABLE A2Country of Birth of Top Economists
Country WB Code Country WB Code
Algeria LM Lithuania UMArgentina LM Malaysia LMAustralia H Mexico UMAustria H Monaco HBelarus UM Myanmar LBelgium H Netherlands HBrazil UM New Zealand HBulgaria LM Norway HCanada H Pakistan LChile LM Peru LMChina L Poland LMCosta Rica LM Portugal UMCuba LM Romania LMCyprus H Russia UMD. R. of Congo L Rwanda LDenmark H Serbia LMFinland H Slovakia LMFrance H South Korea UMGermany H Spain HGreece UM Sweden HHong Kong H Switzerland HHungary UM Taiwan HIndia L Tunisia LMIran LM Turkey LMIraq UM UK HIreland H USA HIsrael H Uruguay UMItaly H Venezuela UMJamaica LM Vietnam LJapan H Zimbabwe LMLebanon LM
Note: World Bank 1990 country classification data areused where countries are defined as low income (L), lower-middle income (LM), upper-middle income (UM), and highincome (H).
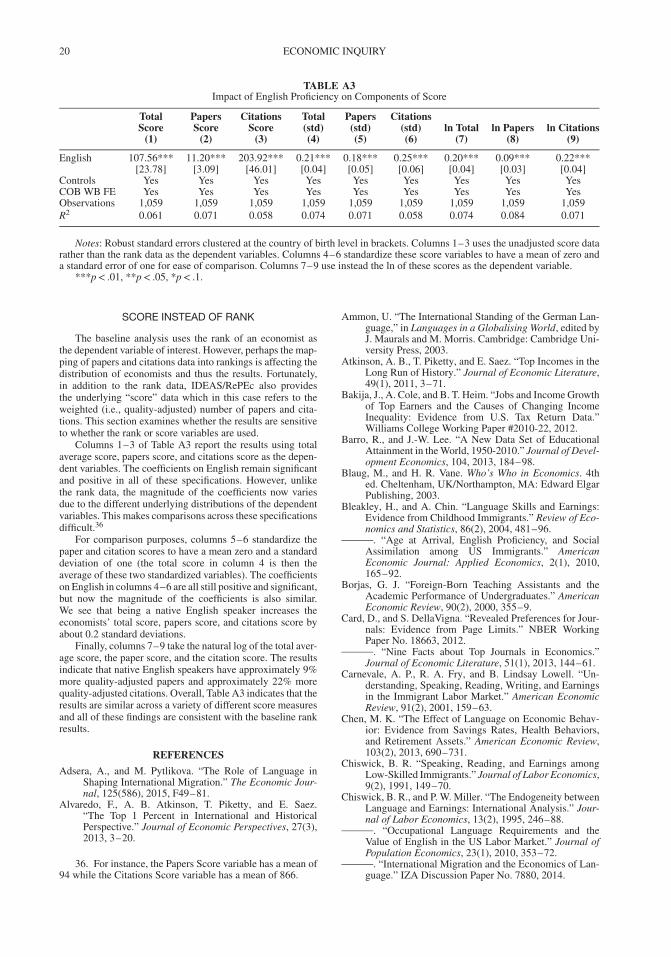
20 ECONOMIC INQUIRY
TABLE A3Impact of English Proficiency on Components of Score
TotalScore
PapersScore
CitationsScore
Total(std)
Papers(std)
Citations(std) ln Total ln Papers ln Citations
(1) (2) (3) (4) (5) (6) (7) (8) (9)
English 107.56*** 11.20*** 203.92*** 0.21*** 0.18*** 0.25*** 0.20*** 0.09*** 0.22***[23.78] [3.09] [46.01] [0.04] [0.05] [0.06] [0.04] [0.03] [0.04]
Controls Yes Yes Yes Yes Yes Yes Yes Yes YesCOB WB FE Yes Yes Yes Yes Yes Yes Yes Yes YesObservations 1,059 1,059 1,059 1,059 1,059 1,059 1,059 1,059 1,059R2 0.061 0.071 0.058 0.074 0.071 0.058 0.074 0.084 0.071
Notes: Robust standard errors clustered at the country of birth level in brackets. Columns 1–3 uses the unadjusted score datarather than the rank data as the dependent variables. Columns 4–6 standardize these score variables to have a mean of zero anda standard error of one for ease of comparison. Columns 7–9 use instead the ln of these scores as the dependent variable.
***p< .01, **p< .05, *p< .1.
SCORE INSTEAD OF RANK
The baseline analysis uses the rank of an economist asthe dependent variable of interest. However, perhaps the map-ping of papers and citations data into rankings is affecting thedistribution of economists and thus the results. Fortunately,in addition to the rank data, IDEAS/RePEc also providesthe underlying “score” data which in this case refers to theweighted (i.e., quality-adjusted) number of papers and cita-tions. This section examines whether the results are sensitiveto whether the rank or score variables are used.
Columns 1–3 of Table A3 report the results using totalaverage score, papers score, and citations score as the depen-dent variables. The coefficients on English remain significantand positive in all of these specifications. However, unlikethe rank data, the magnitude of the coefficients now variesdue to the different underlying distributions of the dependentvariables. This makes comparisons across these specificationsdifficult.36
For comparison purposes, columns 5–6 standardize thepaper and citation scores to have a mean zero and a standarddeviation of one (the total score in column 4 is then theaverage of these two standardized variables). The coefficientson English in columns 4–6 are all still positive and significant,but now the magnitude of the coefficients is also similar.We see that being a native English speaker increases theeconomists’ total score, papers score, and citations score byabout 0.2 standard deviations.
Finally, columns 7–9 take the natural log of the total aver-age score, the paper score, and the citation score. The resultsindicate that native English speakers have approximately 9%more quality-adjusted papers and approximately 22% morequality-adjusted citations. Overall, Table A3 indicates that theresults are similar across a variety of different score measuresand all of these findings are consistent with the baseline rankresults.
REFERENCES
Adsera, A., and M. Pytlikova. “The Role of Language inShaping International Migration.” The Economic Jour-nal, 125(586), 2015, F49–81.
Alvaredo, F., A. B. Atkinson, T. Piketty, and E. Saez.“The Top 1 Percent in International and HistoricalPerspective.” Journal of Economic Perspectives, 27(3),2013, 3–20.
36. For instance, the Papers Score variable has a mean of94 while the Citations Score variable has a mean of 866.
Ammon, U. “The International Standing of the German Lan-guage,” in Languages in a Globalising World, edited byJ. Maurals and M. Morris. Cambridge: Cambridge Uni-versity Press, 2003.
Atkinson, A. B., T. Piketty, and E. Saez. “Top Incomes in theLong Run of History.” Journal of Economic Literature,49(1), 2011, 3–71.
Bakija, J., A. Cole, and B. T. Heim. “Jobs and Income Growthof Top Earners and the Causes of Changing IncomeInequality: Evidence from U.S. Tax Return Data.”Williams College Working Paper #2010-22, 2012.
Barro, R., and J.-W. Lee. “A New Data Set of EducationalAttainment in the World, 1950-2010.” Journal of Devel-opment Economics, 104, 2013, 184–98.
Blaug, M., and H. R. Vane. Who’s Who in Economics. 4thed. Cheltenham, UK/Northampton, MA: Edward ElgarPublishing, 2003.
Bleakley, H., and A. Chin. “Language Skills and Earnings:Evidence from Childhood Immigrants.” Review of Eco-nomics and Statistics, 86(2), 2004, 481–96.
. “Age at Arrival, English Proficiency, and SocialAssimilation among US Immigrants.” AmericanEconomic Journal: Applied Economics, 2(1), 2010,165–92.
Borjas, G. J. “Foreign-Born Teaching Assistants and theAcademic Performance of Undergraduates.” AmericanEconomic Review, 90(2), 2000, 355–9.
Card, D., and S. DellaVigna. “Revealed Preferences for Jour-nals: Evidence from Page Limits.” NBER WorkingPaper No. 18663, 2012.
. “Nine Facts about Top Journals in Economics.”Journal of Economic Literature, 51(1), 2013, 144–61.
Carnevale, A. P., R. A. Fry, and B. Lindsay Lowell. “Un-derstanding, Speaking, Reading, Writing, and Earningsin the Immigrant Labor Market.” American EconomicReview, 91(2), 2001, 159–63.
Chen, M. K. “The Effect of Language on Economic Behav-ior: Evidence from Savings Rates, Health Behaviors,and Retirement Assets.” American Economic Review,103(2), 2013, 690–731.
Chiswick, B. R. “Speaking, Reading, and Earnings amongLow-Skilled Immigrants.” Journal of Labor Economics,9(2), 1991, 149–70.
Chiswick, B. R., and P. W. Miller. “The Endogeneity betweenLanguage and Earnings: International Analysis.” Jour-nal of Labor Economics, 13(2), 1995, 246–88.
. “Occupational Language Requirements and theValue of English in the US Labor Market.” Journal ofPopulation Economics, 23(1), 2010, 353–72.
. “International Migration and the Economics of Lan-guage.” IZA Discussion Paper No. 7880, 2014.

OLNEY: ENGLISH PROFICIENCY AND LABOR MARKET PERFORMANCE 21
Coupe, T. “Revealed Performances: Worldwide Rankings ofEconomists and Economics Departments, 1990–2000.”Journal of the European Economic Association, 1(6),2003, 1309–45.
Crystal, D. English as a Global Language. Cambridge: Cam-bridge University Press, 2003.
Dustmann, C., and F. Fabbri. “Language Proficiency andLabor Market Performance of Immigrants in the UK.”The Economic Journal, 113(489), 2003, 695–717.
Dustmann, C., and A. van Soest. “Language Fluency andEarnings: Estimation with Misclassified Language Indi-cators.” Review of Economics and Statistics, 83(4),2001, 663–74.
Einav, L., and L. Yariv. “What’s in a Surname? The Effectsof Surname Initials on Academic Success.” Journal ofEconomic Perspectives, 20(1), 2006, 175–88.
Ellison, G. “The Slowdown of the Economics PublishingProcess.” Journal of Political Economy, 110(5), 2002,947–93.
Engemann, K. M., and H. J. Wall. “A Journal Ranking forthe Ambitious Economist.” Federal Reserve Bank of St.Louis Review, May/June, 2009, 127–40.
Fearon, J. “Ethnic and Cultural Diversity by Country.” Jour-nal of Economic Growth, 8(2), 2003, 195–222.
Ferrer, A., D. A. Green, and W. C. Riddell. “The Effect ofLiteracy on Immigrant Earnings.” Journal of HumanResources, 41(2), 2006, 380–410.
Fourcade, M., E. Ollion, and Y. Algan. “The Superiority ofEconomists.” Journal of Economic Perspectives, 29(1),2015, 89–114.
Freeman, R. B., and W. Huang. “Collaborating with PeopleLike Me: Ethnic Co-Authorship within the U.S.” NBERWorking Paper No. 19905. 2014.
Hamermesh, D. S. “Six Decades of Top Economics Publish-ing: Who and How?” Journal of Economic Literature,51(1), 2013, 162–72.
. “Age, Cohort and Co-Authorship.” NBER WorkingPaper No. 20938, 2015.
Hamermesh, D. S., and G. A. Pfann. “Reputation and Earn-ings: The Roles of Quality and Quantity in Academe.”Economic Inquiry, 50(1), 2013, 1–16.
Hudson, J. “Trends in Multi-Authored Papers in Economics.”Journal of Economic Perspectives, 10(3), 1996,153–58.
Maske, K. L., G. C. Durden, and P. E. Gaynor. “Deter-minants of Scholarly Productivity among Male andFemale Economists.” Economic Inquiry, 41(4), 2003,555–64.
McDowell, J. M., L. D. Singell Jr. , and M. Stater. “Two toTango? Gender Differences in the Decisions to Pub-lish and Coauthor.” Economic Inquiry, 44(1), 2006,153–68.
Oyer, P. “Initial Labor Market Conditions and Long-TermOutcomes for Economists.” Journal of Economic Per-spectives, 20(3), 2006, 143–60.
. “Is There an Insider Advantage in Getting Tenure?”American Economic Review, 97(2), 2007, 501–5.
Peri, G., and C. Sparber. “Task Specialization, Immigration,and Wages.” American Economic Journal: Applied Eco-nomics, 1(3), 2009, 135–69.
van Praag, C. M., and B. M. S. van Praag. “The Benefitsof Being Economics Professor A (Rather than Z).”Economica, 75(300), 2008, 782–96.
Rivera-Batiz, F. L. “English Language Proficiency and theEconomic Progress of Immigrants.” Economics Letters,34(3), 1990, 295–300.
Spolaore, E., and R. Wacziarg. “The Diffusion of Develop-ment.” Quarterly Journal of Economics, 124(2), 2009,469–529.
Zimmermann, C. “Academic Rankings with RePEc.” Econo-metrics, 1(3), 2013, 249–80.


