English - Maharashtra Electricity Regulatory Commission
13
1 MAHARASHTRA STATE ELECTRICITY DISTRIBUTION COMPANY LIMITED Plot No. G-9, Prakashgad, Bandra (E), Mumbai – 400051 Website: www.mahadiscom.in PUBLIC NOTICE Inviting Suggestions/ Objections on Maharashtra State Electricity Distribution Company Limited’s Petition for approval of MYT Business Plan for the period of FY 2013-14 to FY 2015-16 (Case No. 134 of 2012) 1. Maharashtra State Electricity Distribution Company Limited (MSEDCL) has filed the Petition for approval of its Multi-Year Tariff (MYT) Business Plan for the period from FY 2013-14 to FY 2015-16 before the Maharashtra Electricity Regulatory Commission (MERC) under Sections 61 and 62 of the Electricity Act, 2003 (Act) and Regulation 7 of the Maharashtra Electricity Regulatory Commission (Multi Year Tariff) Regulations, 2011. The Commission has admitted the Petition on 30 March, 2013 and directed MSEDCL to publish a Public Notice under Section 64(2) of the Act for inviting suggestions and objections from the public through this Notice. 2. The salient features of the Petition are provided below: Table 1: Category-wise Sales Projections including Distribution Franchisee (MUs) Table 1 a: Category-wise Sales Projections HT (including Distribution Franchisee) (MUs) Consumer Category & Consumption Slab FY 2013-14 FY 2014-15 FY 2015-16 HT Category HT I - Industry 31,449 34,279 37,364 Continuous Industry (Express Feeders) 20,079 21,886 23,855 Non-continuous Industry (Non Express Feeders) 11,212 12,221 13,321 Seasonal Industry 158 173 188 HT II - Commercial 1,879 2,029 2,192 Express feeders 714 771 833 Non-Express feeders 1,165 1,258 1,359 HT – III - Railway Traction 1,455 1,484 1,514 HT IV - PWW 1,747 1,887 2,038 Express Feeders 1,504 1,625 1,755 Non- Express Feeders 243 262 283 HT V- Agriculture 740 792 847 HT- VI 313 329 345 Group Housing Society 313 329 345 HT Poultry/SP. AG 61 62 62 HT-IX Public services 470 507 548 Express feeders 136 147 159 Non-Express feeders 334 360 389 HT-TEMPORARY 12 12 12 HT TOTAL 38,126 41,381 44,922
Transcript of English - Maharashtra Electricity Regulatory Commission
1
MAHARASHTRA STATE ELECTRICITY DISTRIBUTION COMPANY LIMITED
Plot No. G-9, Prakashgad, Bandra (E), Mumbai – 400051
Website: www.mahadiscom.in
PUBLIC NOTICE
Inviting Suggestions/ Objections on Maharashtra State Electricity Distribution Company
Limited’s Petition for approval of MYT Business Plan for the period of FY 2013-14 to FY 2015-16
(Case No. 134 of 2012)
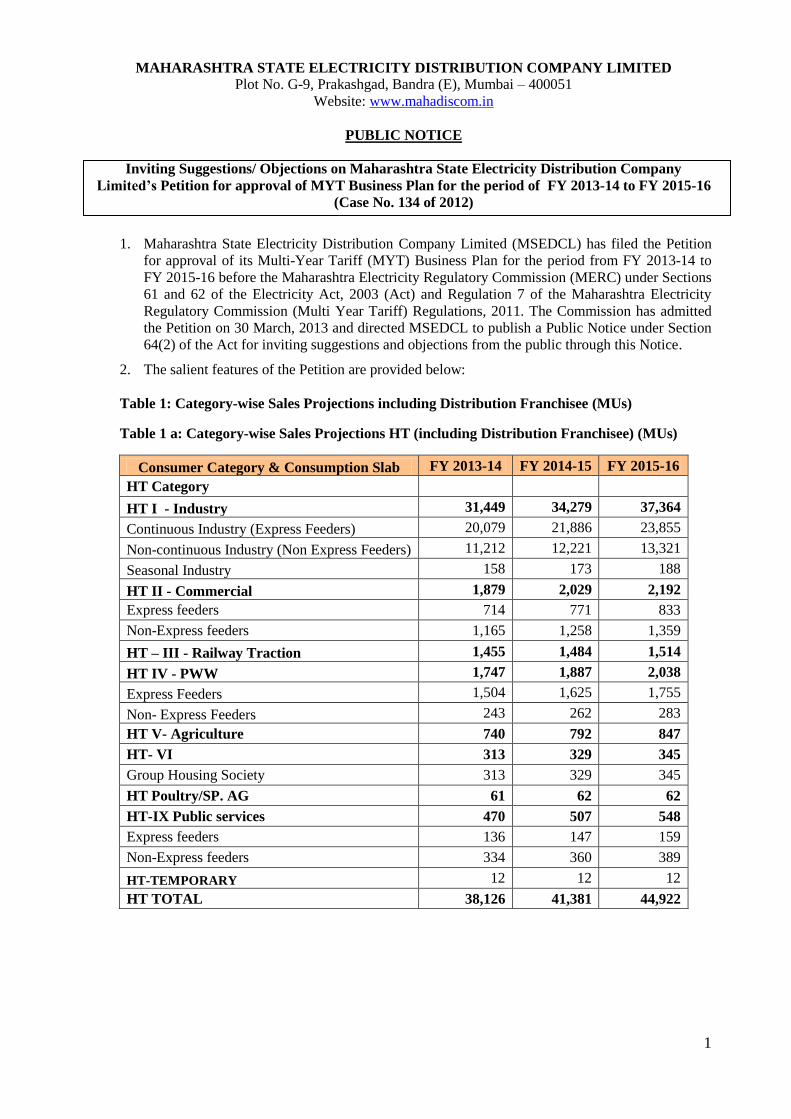
1. Maharashtra State Electricity Distribution Company Limited (MSEDCL) has filed the Petition
for approval of its Multi-Year Tariff (MYT) Business Plan for the period from FY 2013-14 to
FY 2015-16 before the Maharashtra Electricity Regulatory Commission (MERC) under Sections
61 and 62 of the Electricity Act, 2003 (Act) and Regulation 7 of the Maharashtra Electricity
Regulatory Commission (Multi Year Tariff) Regulations, 2011. The Commission has admitted
the Petition on 30 March, 2013 and directed MSEDCL to publish a Public Notice under Section
64(2) of the Act for inviting suggestions and objections from the public through this Notice.
2. The salient features of the Petition are provided below:
Table 1: Category-wise Sales Projections including Distribution Franchisee (MUs)
Table 1 a: Category-wise Sales Projections HT (including Distribution Franchisee) (MUs)
Consumer Category & Consumption Slab FY 2013-14 FY 2014-15 FY 2015-16
HT Category
HT I - Industry 31,449 34,279 37,364
Continuous Industry (Express Feeders) 20,079 21,886 23,855
Non-continuous Industry (Non Express Feeders) 11,212 12,221 13,321
Seasonal Industry 158 173 188
HT II - Commercial 1,879 2,029 2,192
Express feeders 714 771 833
Non-Express feeders 1,165 1,258 1,359
HT – III - Railway Traction 1,455 1,484 1,514
HT IV - PWW 1,747 1,887 2,038
Express Feeders 1,504 1,625 1,755
Non- Express Feeders 243 262 283
HT V- Agriculture 740 792 847
HT- VI 313 329 345
Group Housing Society 313 329 345
HT Poultry/SP. AG 61 62 62
HT-IX Public services 470 507 548
Express feeders 136 147 159
Non-Express feeders 334 360 389
HT-TEMPORARY 12 12 12
HT TOTAL 38,126 41,381 44,922

2
Table 1 b: Category-wise Sales Projections LT (including Distribution Franchisee) (MUs)
Consumer Category & Consumption Slab FY 2013-14 FY 2014-15 FY 2015-16
LT Category
LT I - Domestic 17,453 19,373 21,504
BPL 268 297 330
LT Domestic 17,185 19,076 21,174
0-30 Units 5,214 5,788 6,424
31-100 Units 6,308 7,002 7,773
101- 300 Units 4,144 4,600 5,106
301-500 Units 674 748 831
Above 500 units (Only balance Units) 845 937 1,041
LT II - Non Domestic 2,319 2,481 2,655
0-20 kW 1,484 1,588 1,699
>20 - 50 kW 580 620 664
> 50 kW 255 273 292
LT III - Public Water Works 692 748 808
0- 20 KW 587 634 685
>20-40 KW 63 68 73
>40-50 KW 42 46 49
LT IV - Agriculture 22,174 23,523 25,021
Un-metered Tariff 9,908 9,908 9,908
Metered Tariff (including Poultry Farms) 12,266 13,615 15,113
LT V - Industrial 5,167 5,632 6,139
0-20 kW (up to and including 27 HP) 2,069 2,256 2,459
Above 20 kW (above 27 HP) 3,098 3,377 3,681
LT V - Powerloom 2,996 3,205 3,429
0-20 kW (up to and including 27 HP) 2,160 2,311 2,472
Above 20 kW (above 27 HP) 836 895 957
LT VI - Street Light 1,177 1,281 1,396
Grampanchayat, A, B & C Class Municipal
Council 776 846 922
Municipal Corporation Areas 400 435 474
LT VII - Temporary 65 69 72
Temporary Connections –Other Purpose 63 67 70
Temporary Connections -Religious 2 2 2
LTVIII - Advertisement & Hoardings 4 4 5
LT IX – Crematoriums & Burial Grounds 2 2 2
LT X - Public services 1,677 1,794 1,920
0-200 Units 738 789 845
>200 units 889 951 1,018
>20-50 kW 34 36 38
>50 kW 17 18 19
LT TOTAL 53,726 58,114 62,952
MSEDCL Total (Incl. DF Category wise) 91,851 99,495 107,875
3
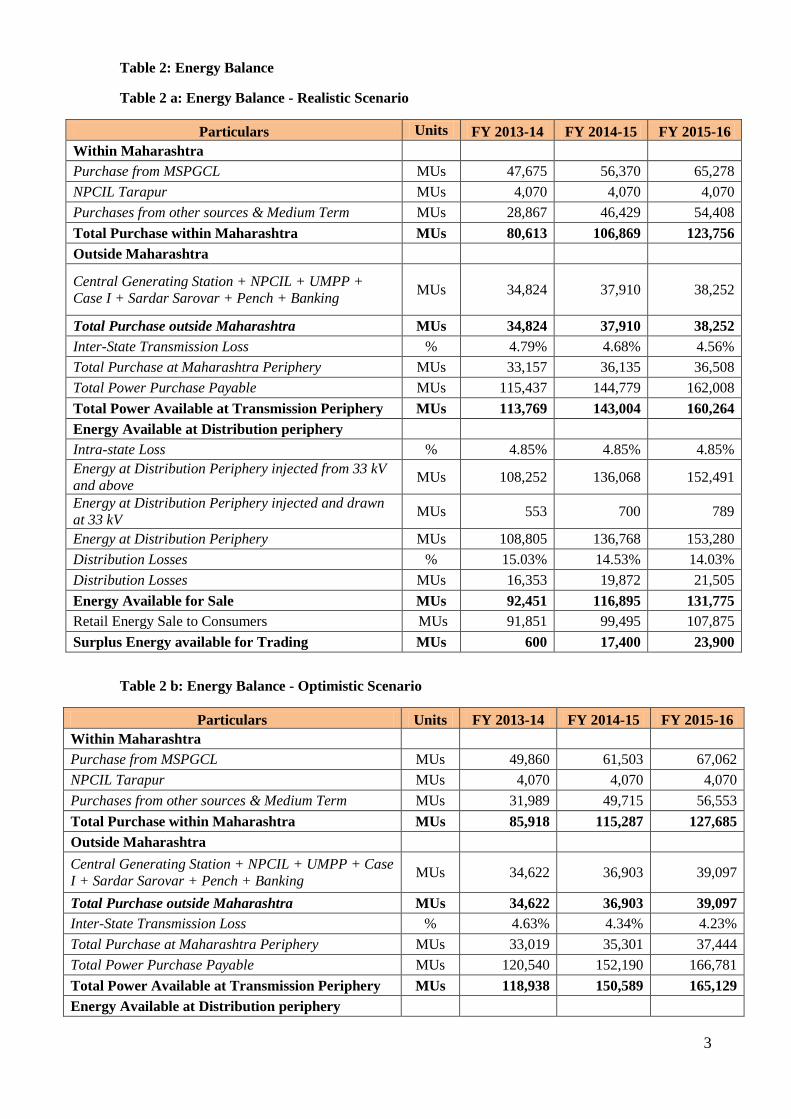
Table 2: Energy Balance
Table 2 a: Energy Balance - Realistic Scenario
Particulars Units FY 2013-14 FY 2014-15 FY 2015-16
Within Maharashtra
Purchase from MSPGCL MUs 47,675 56,370 65,278
NPCIL Tarapur MUs 4,070 4,070 4,070
Purchases from other sources & Medium Term MUs 28,867 46,429 54,408
Total Purchase within Maharashtra MUs 80,613 106,869 123,756
Outside Maharashtra
Central Generating Station + NPCIL + UMPP +
Case I + Sardar Sarovar + Pench + Banking MUs 34,824 37,910 38,252
Total Purchase outside Maharashtra MUs 34,824 37,910 38,252
Inter-State Transmission Loss % 4.79% 4.68% 4.56%
Total Purchase at Maharashtra Periphery MUs 33,157 36,135 36,508
Total Power Purchase Payable MUs 115,437 144,779 162,008
Total Power Available at Transmission Periphery MUs 113,769 143,004 160,264
Energy Available at Distribution periphery
Intra-state Loss % 4.85% 4.85% 4.85%
Energy at Distribution Periphery injected from 33 kV
and above MUs 108,252 136,068 152,491
Energy at Distribution Periphery injected and drawn
at 33 kV MUs 553 700 789
Energy at Distribution Periphery MUs 108,805 136,768 153,280
Distribution Losses % 15.03% 14.53% 14.03%
Distribution Losses MUs 16,353 19,872 21,505
Energy Available for Sale MUs 92,451 116,895 131,775
Retail Energy Sale to Consumers MUs 91,851 99,495 107,875
Surplus Energy available for Trading MUs 600 17,400 23,900
Table 2 b: Energy Balance - Optimistic Scenario
Particulars Units FY 2013-14 FY 2014-15 FY 2015-16
Within Maharashtra
Purchase from MSPGCL MUs 49,860 61,503 67,062
NPCIL Tarapur MUs 4,070 4,070 4,070
Purchases from other sources & Medium Term MUs 31,989 49,715 56,553
Total Purchase within Maharashtra MUs 85,918 115,287 127,685
Outside Maharashtra
Central Generating Station + NPCIL + UMPP + Case
I + Sardar Sarovar + Pench + Banking MUs 34,622 36,903 39,097
Total Purchase outside Maharashtra MUs 34,622 36,903 39,097
Inter-State Transmission Loss % 4.63% 4.34% 4.23%
Total Purchase at Maharashtra Periphery MUs 33,019 35,301 37,444
Total Power Purchase Payable MUs 120,540 152,190 166,781
Total Power Available at Transmission Periphery MUs 118,938 150,589 165,129
Energy Available at Distribution periphery

4
Particulars Units FY 2013-14 FY 2014-15 FY 2015-16
Intra-state Loss % 4.85% 4.85% 4.85%
Energy at Distribution Periphery injected from 33 kV
and above MUs 113,169 143,285 157,120
Energy at Distribution Periphery injected and drawn
at 33 kV MUs 578 737 812
Energy at Distribution Periphery MUs 113,748 144,022 157,933
Distribution Losses % 15.03% 14.53% 14.03%
Distribution Losses MUs 17,096 20,926 22,158
Energy Available for Sale MUs 96,651 123,095 135,775
Retail Energy Sale to Consumers MUs 91,851 99,495 107,875
Surplus Energy available for Trading MUs 4,800 23,600 27,900
Table 2 c: Energy Balance - Pessimistic Scenario
Particulars Units FY 2013-14 FY 2014-15 FY 2015-16
Within Maharashtra
Purchase from MSPGCL MUs 45,596 48,805 59,010
NPCIL Tarapur MUs 4,070 4,070 4,070
Purchases from other sources & Medium Term MUs 26,916 44,122 50,613
Traders MUs 3,800
Total Purchase within Maharashtra MUs 80,382 96,997 113,694
Outside Maharashtra
Central Generating Station + NPCIL + UMPP + Case
I + Sardar Sarovar + Pench + Banking MUs 34,232 36,853 37,843
Total Purchase outside Maharashtra MUs 34,232 36,853 37,843
Inter-State Transmission Loss % 4.62% 4.04% 4.90%
Total Purchase at Maharashtra Periphery MUs 32,649 35,363 35,990
Total Power Purchase Payable MUs 114,613 133,850 151,537
Total Power Available at Transmission Periphery MUs 113,031 132,361 149,683
Energy Available at Distribution periphery MUs
Intra-state Loss % 4.85% 4.85% 4.85%
Energy at Distribution Periphery injected from 33 kV
and above MUs 107,549 125,941 142,424
Energy at Distribution Periphery injected and drawn
at 33 kV MUs 550 647 736
Energy at Distribution Periphery MUs 108,099 126,589 143,160
Distribution Losses % 15.03% 14.53% 14.03%
Distribution Losses MUs 16,247 18,393 20,085
Energy Available for Sale MUs 91,851 108,195 123,075
Retail Energy Sale to Consumers MUs 91,851 99,495 107,875
Surplus Energy available for Trading MUs
8,700 15,200

5
Table 3: Power Purchase Cost
Table 3 a: Power Purchase Cost - Realistic Scenario
Source FY 2013-14 FY 2014-15 FY 2015-16
MUs Rs. p. u. Rs. Crs MUs Rs. p. u. Rs. Crs MUs Rs. p. u. Rs. Crs
MSPGCL 47,675 4.11 19,608 56,370 4.49 25,306 65,278 4.70 30,682
NTPC 27,244 2.80 7,625 30,330 2.99 9,082 31,772 3.14 9,992
NPCIL 5,070 2.67 1,352 5,070 2.81 1,422 5,070 2.95 1,495
SSP 990 2.05 203 990 2.05 203 990 2.05 203
Pench 110 2.05 23 110 2.05 23 110 2.05 23
RGPPL 5,256 4.75 2,499 5,256 4.93 2,594 5,256 5.18 2,723
Dodson 114 2.38 27 114 2.58 29 114 2.60 30
JSW 2,048 3.49 715 2,048 3.67 750 2,048 3.85 788
Adani Power 8,394 2.55 2,143 17,390 3.09 5,376 18,125 3.16 5,725
Mundra
UMPP 5,480 2.65 1,451 5,480 2.78 1,523 5,480 2.92 1,599
India Bulls 2,736 3.30 902 8,108 3.39 2,752 8,108 3.50 2,837
NCE 8,597 5.31 4,569 10,444 5.65 5,906 12,844 5.92 7,603
CPP 1,600 3.58 573 1,600 3.50 560 1,600 3.50 560
EMCO
Energy 122 2.99 37 1,469 3.07 451 1,469 3.16 464
Lanco Case I
3,745 3.26 1,222
Others 960
1,080
1,140
Total 115,437 3.70 42,685 144,779 3.94 57,058 162,008 4.14 67,085
Table 3 b: Power Purchase Cost - Optimistic Scenario
Source FY 2013-14 FY 2014-15 FY 2015-16
MUs Rs. p. u. Rs. Crs MUs Rs. p. u. Rs. Crs MUs Rs. p. u. Rs. Crs
MSPGCL 49,860 4.05 20,215 61,503 4.36 26,804 67,062 4.66 31,229
NTPC 28,141 2.78 7,815 30,423 3.00 9,120 32,616 3.13 10,214
NPCIL 5,070 2.67 1,352 5,070 2.81 1,422 5,070 2.95 1,495
SSP 1,039 2.05 213 1,091 2.05 224 1,146 2.05 235
Pench 112 2.05 23 117 2.05 24 123 2.05 25
RGPPL 5,256 4.75 2,499 5,256 4.93 2,594 5,256 5.18 2,723
Dodson 113 2.40 27 119 2.51 30 125 2.57 32
JSW 2,234 3.49 780 2,234 3.67 819 2,234 3.85 860
Adani Power 8,394 2.55 2,143 17,390 3.09 5,376 18,125 3.16 5,725
Mundra
UMPP 5,480 2.65 1,451 5,480 2.78 1,523 5,480 2.92 1,599
India Bulls 2,736 3.30 902 8,108 3.39 2,752 8,108 3.50 2,837
NCE 10,283 5.37 5,527 12,231 5.64 6,896 14,523 5.89 8,559
CPP 1,700 3.58 609 1,700 3.50 595 1,700 3.50 595
EMCO
Energy 122 2.99 37 1,469 3.07 451 1,469 3.16 464
Lanco Case I
3,745 3.26 1,222
Others
960
1,080
1,140
Total 120,540 3.70 44,551 152,190 3.92 59,709 166,781 4.13 68,953
6
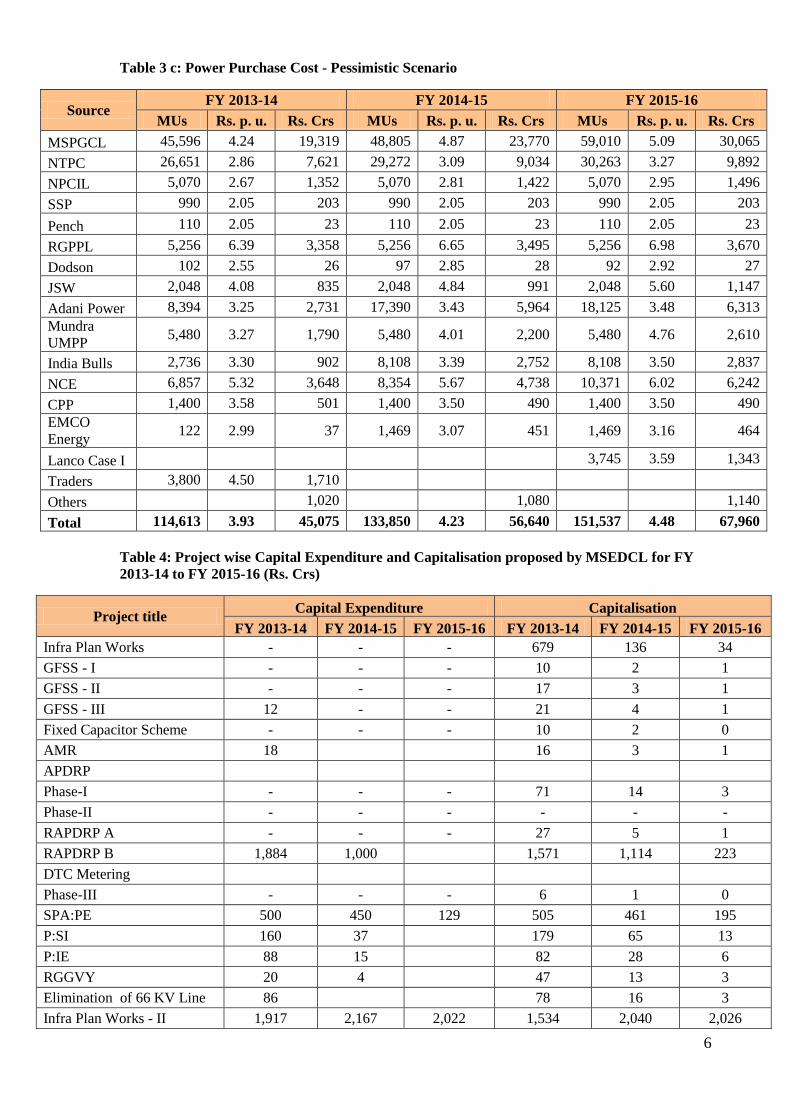
Table 3 c: Power Purchase Cost - Pessimistic Scenario
Source FY 2013-14 FY 2014-15 FY 2015-16
MUs Rs. p. u. Rs. Crs MUs Rs. p. u. Rs. Crs MUs Rs. p. u. Rs. Crs
MSPGCL 45,596 4.24 19,319 48,805 4.87 23,770 59,010 5.09 30,065
NTPC 26,651 2.86 7,621 29,272 3.09 9,034 30,263 3.27 9,892
NPCIL 5,070 2.67 1,352 5,070 2.81 1,422 5,070 2.95 1,496
SSP 990 2.05 203 990 2.05 203 990 2.05 203
Pench 110 2.05 23 110 2.05 23 110 2.05 23
RGPPL 5,256 6.39 3,358 5,256 6.65 3,495 5,256 6.98 3,670
Dodson 102 2.55 26 97 2.85 28 92 2.92 27
JSW 2,048 4.08 835 2,048 4.84 991 2,048 5.60 1,147
Adani Power 8,394 3.25 2,731 17,390 3.43 5,964 18,125 3.48 6,313
Mundra
UMPP 5,480 3.27 1,790 5,480 4.01 2,200 5,480 4.76 2,610
India Bulls 2,736 3.30 902 8,108 3.39 2,752 8,108 3.50 2,837
NCE 6,857 5.32 3,648 8,354 5.67 4,738 10,371 6.02 6,242
CPP 1,400 3.58 501 1,400 3.50 490 1,400 3.50 490
EMCO
Energy 122 2.99 37 1,469 3.07 451 1,469 3.16 464
Lanco Case I 3,745 3.59 1,343
Traders 3,800 4.50 1,710
Others
1,020
1,080
1,140
Total 114,613 3.93 45,075 133,850 4.23 56,640 151,537 4.48 67,960
Table 4: Project wise Capital Expenditure and Capitalisation proposed by MSEDCL for FY
2013-14 to FY 2015-16 (Rs. Crs)
Project title Capital Expenditure Capitalisation
FY 2013-14 FY 2014-15 FY 2015-16 FY 2013-14 FY 2014-15 FY 2015-16
Infra Plan Works - - - 679 136 34
GFSS - I - - - 10 2 1
GFSS - II - - - 17 3 1
GFSS - III 12 - - 21 4 1
Fixed Capacitor Scheme - - - 10 2 0
AMR 18
16 3 1
APDRP
Phase-I - - - 71 14 3
Phase-II - - - - - -
RAPDRP A - - - 27 5 1
RAPDRP B 1,884 1,000
1,571 1,114 223
DTC Metering
Phase-III - - - 6 1 0
SPA:PE 500 450 129 505 461 195
P:SI 160 37
179 65 13
P:IE 88 15
82 28 6
RGGVY 20 4
47 13 3
Elimination of 66 KV Line 86
78 16 3
Infra Plan Works - II 1,917 2,167 2,022 1,534 2,040 2,026

7
Project title Capital Expenditure Capitalisation
FY 2013-14 FY 2014-15 FY 2015-16 FY 2013-14 FY 2014-15 FY 2015-16
GFSS IV 50 - - 147 29 6
LT Capacitor Phase I & II 31 - - 41 8 2
Single Phasing - Left out
villages - - - 37 7 2
GFSS (Shrirampur) 87 - - 70 14 3
Special Action Plan (Par t
_A) 21 - - 19 4 1
SCADA Part A 77 - - 70 14 3
Smart Grid Project Pilot at
Baramati 35 - - 35 - -
Deogad Wind Power Project 90 - - 90 - -
Establishment of Meter
Testing Labs (NABL) 36 - - 36 - -
MIS - - - 3 - -
Evacuation 60 40 50 58 44 49
Evacuation Wind Generation 30 30 30 30 30 30
DPDC / Non-Tribal - - - 8 2 0
DPDC / SCP (Loan) 35 35 35 39 36 44
DPDC / TSP + OTSP 49 30 30 52 34 31
Back log 92 92 92 193 113 97
AG AMR 100 - - 80 16 4
ERP - - - 15 3 1
Total 5,478 3,900 2,388 5,876 4,262 2,781
Table 5: Capital Expenditure and Capitalisation proposed by MSEDCL for FY 2013-14 to FY
2015-16 (Rs. Crs)
Particulars Capital Expenditure Capitalisation
FY 2013-14 FY 2014-15 FY 2015-16 FY 2013-14 FY 2014-15 FY 2015-16
Approved – DPR 5,076 3,672 2,151 5,378 3,988 2,526
Submitted but yet to be
approved – DPR - - - - - -
To be submitted – DPR 35 - - 35 - -
Prior approval not
required – Non DPR 366 227 237 463 274 254
Total 5,478 3,900 2,388 5,876 4,262 2,781
Table 6: Funding details for capital expenditure requirements proposed by MSEDCL for FY
2013-14 to FY 2015-16 (Rs. Crs)
Sources of Funding FY 2013-14 FY 2014-15 FY 2015-16
PFC 2,972 2,092 1,019
REC 1,467 1,112 740
GoM Loan 35 35 35
GoM Equity 400 433 404
Grant 238 127 122
Internal Accrual 366 100 68
Total 5,478 3,900 2,388

8
3. Further, the Business Plan Petition enumerates various strategic plans and operational plans
including Human Resource Development Plan, Training and Development Plan, Recruitment and
Promotion Policy, Risk Analysis and Risk Mitigation Plan, Environmental Policy and Corporate
Social Responsibility, Capital Investment Plan, Market Issues and Challenges, etc., of MSEDCL
for the period from FY 2013-14 to FY 2015-16. Moreover, MSEDCL has submitted three scenarios,
i.e., Optimistic, Pessimistic and Realistic scenarios for its projection of Aggregate Revenue
Requirement (ARR) for the period from FY 2013-14 to FY 2015-16 considering the availability of
power under three scenarios i.e., Optimistic, Pessimistic and Realistic scenarios.
Table 7: Operational Parameters
Particulars FY 2013-14 FY 2014-15 FY 2015-16
Distribution Loss 15.03% 14.53% 14.03%
Collection Efficiency 97.64% 97.89% 98.14%
SAIDI (Rural areas, towns & cities) (Minutes) 83 83 83
Wires Availability (Rural areas, towns & cities) 99.06% 99.06% 99.06%
Supply Availability 98.75% 98.75% 98.75%

9
Table 8: Aggregate Revenue Requirement of MSEDCL (Rs. Crs)
Table 8 a: Aggregate Revenue Requirement of MSEDCL (Rs. Crs) – Realistic Scenario
S.
No. Particulars
FY 2013-14 FY 2014-15 FY 2015-16
Wires
Business
Retail
Supply Total
Wires
Business
Retail
Supply Total
Wires
Business
Retail
Supply Total
1 Power Purchase Expenses 600 42,084 42,685 857 56,200 57,058 1,003 66,081 67,085
2 Operations and Maintenance Expenses 3,598 1,889 5,486 4,341 2,219 6,560 5,060 2,576 7,635
3 Depreciation, including advance against depreciation 1,768 196 1,964 2,006 223 2,229 2,172 241 2,413
4 Interest on Long-term Loan Capital 1,326 147 1,473 1,553 173 1,726 1,616 180 1,796
5
Interest on Working Capital, Consumer SD & Finance
Charges 418 502 920 446 553 999 476 609 1,085
6 Provisions for Bad Debts 87 780 867 101 906 1,006 114 1,024 1,138
7 Other Expenses 656 656
130 130
136 136
8 Income Tax 235 29 265 251 32 283 265 33 299
9 Transmission Charges paid to Transmission Licensee 3,484 3,484
3,684 3,684
3,884 3,884
10 Contribution to contingency reserves (0.25% of GFA) 78 9 87 91 10 101 101 11 112
11 Incentives/Discounts 244 244
256 256
269 269
12 Total Revenue Expenditure 8,109 50,021 58,130 9,647 64,384 74,031 10,807 75,044 85,851
13 Return on Equity Capital 1,175 147 1,323 1,256 158 1,413 1,327 166 1,493
14 Aggregate Revenue Requirement 9,284 50,168 59,452 10,903 64,542 75,444 12,134 75,210 87,344
15 Less: Non Tariff Income 1,332 1,332
1,398 1,398
1,467 1,467
16 Less: Income from wheeling charges 14
14 15
15 16
16
17 Less: Income from CSS and OA Charges 87
87 96
96 105
105
18 Net Aggregate Revenue Requirement 9,183 48,836 58,019 10,792 63,144 73,936 12,012 73,743 85,756
19 Less: Income from Trading of Surplus Power 222 222
6,857 6,857
9,897 9,897
20 Total Aggregate Revenue Requirement 9,183 48,614 57,797 10,792 56,287 67,078 12,012 63,847 75,859
21 Sales (MUs) 91,851 91,851 91,851 99,495 99,495 99,495 107,875 107,875 107,875
22 Average Cost of Supply (Rs./kWh) 1.00 5.29 6.29 1.08 5.66 6.74 1.11 5.92 7.03

10
Table 8 b: Aggregate Revenue Requirement of MSEDCL (Rs. Crs) – Optimistic Scenario
S.
No. Particulars
FY 2013-14 FY 2014-15 FY 2015-16
Wires
Business
Retail
Supply Total
Wires
Business
Retail
Supply Total
Wires
Business
Retail
Supply Total
1 Power Purchase Expenses 604 43,947 44,551 860 58,849 59,709 1,009 67,944 68,953
2 Operations and Maintenance Expenses 3,598 1,889 5,486 4,341 2,219 6,560 5,060 2,576 7,635
3 Depreciation, including advance against depreciation 1,768 196 1,964 2,006 223 2,229 2,172 241 2,413
4 Interest on Long-term Loan Capital 1,326 147 1,473 1,553 173 1,726 1,616 180 1,796
5 Interest on Working Capital, Consumer SD & Finance Charges 418 502 920 446 553 999 476 609 1,085
6 Provisions for Bad Debts 87 785 872 101 909 1,010 114 1,027 1,141
7 Other Expenses 656 656
130 130
136 136
8 Income Tax 235 29 265 251 32 283 265 33 299
9 Transmission Charges paid to Transmission Licensee 3,484 3,484
3,684 3,684
3,884 3,884
10 Contribution to contingency reserves (0.25% of GFA) 78 9 87 91 10 101 101 11 112
11 Incentives/Discounts 244 244
256 256
269 269
12 Total Revenue Expenditure 8,113 51,888 60,001 9,649 67,037 76,686 10,813 76,909 87,722
13 Return on Equity Capital 1,175 147 1,323 1,256 158 1,413 1,327 166 1,493
14 Aggregate Revenue Requirement 9,289 52,035 61,324 10,905 67,194 78,099 12,140 77,076 89,216
15 Less: Non Tariff Income 1,332 1,332
1,398 1,398
1,467 1,467
16 Less: Income from wheeling charges 14
14 15 - 15 16 - 16
17 Less: Income from CSS and OA Charges 87
87 96
96 105
105
18 Net Aggregate Revenue Requirement 9,187 50,703 59,890 10,794 65,796 76,591 12,019 75,609 87,628
19 Less: Income from Trading of Surplus Power 1,774 1,774
9,259 9,259
11,535 11,535
20 Total Aggregate Revenue Requirement 9,187 48,929 58,116 10,794 56,537 67,332 12,019 64,074 76,093
21 Sales (MUs) 91,851 91,851 91,851 99,495 99,495 99,495 107,875 107,875 107,875
22 Average Cost of Supply (Rs./kWh) 1.00 5.33 6.33 1.08 5.68 6.77 1.11 5.94 7.05

11
Table 8 c: Aggregate Revenue Requirement of MSEDCL (Rs. Crs) – Pessimistic Scenario
S.
No. Particulars
FY 2013-14 FY 2014-15 FY 2015-16
Wires
Business
Retail
Supply Total
Wires
Business
Retail
Supply Total
Wires
Business
Retail
Supply Total
1 Power Purchase Expenses 643 44,431 45,075 898 55,742 56,640 1,042 66,918 67,960
2 Operations and Maintenance Expenses 3,598 1,889 5,486 4,341 2,219 6,560 5,060 2,576 7,635
3 Depreciation, including advance against depreciation 1,768 196 1,964 2,006 223 2,229 2,172 241 2,413
4 Interest on Long-term Loan Capital 1,326 147 1,473 1,553 173 1,726 1,616 180 1,796
5 Interest on Working Capital, Consumer SD & Finance
Charges 418 502 920 446 553 999 476 609 1,085
6 Provisions for Bad Debts 91 816 907 105 943 1,048 120 1,078 1,198
7 Other Expenses 656 656
130 130
136 136
8 Income Tax 235 29 265 251 32 283 265 33 299
9 Transmission Charges paid to Transmission Licensee 3,484 3,484
3,684 3,684
3,884 3,884
10 Contribution to contingency reserves (0.25% of GFA) 78 9 87 91 10 101 101 11 112
11 Incentives/Discounts 244 244
256 256
269 269
12 Total Revenue Expenditure 8,156 52,403 60,559 9,691 63,964 73,655 10,852 75,934 86,786
13 Return on Equity Capital 1,175 147 1,323 1,256 158 1,413 1,327 166 1,493
14 Aggregate Revenue Requirement 9,331 52,551 61,882 10,947 64,121 75,069 12,179 76,101 88,280
15 Less: Non Tariff Income 1,332 1,332
1,398 1,398
1,467 1,467
16 Less: Income from wheeling charges 14
14 15
15 16
16
17 Less: Income from CSS and OA Charges 87
87 96
96 105
105
18 Net Aggregate Revenue Requirement 9,230 51,219 60,449 10,836 62,723 73,560 12,058 74,634 86,692
19 Less: Income from Trading of Surplus Power 3,681 3,681
6,817 6,817
20 Total Aggregate Revenue Requirement 9,230 51,219 60,449 10,836 59,042 69,878 12,058 67,817 79,875
21 Sales (MUs) 91,851 91,851 91,851 99,495 99,495 99,495 107,875 107,875 107,875
22 Average Cost of Supply (Rs./kWh) 1.00 5.58 6.58 1.09 5.93 7.02 1.12 6.29 7.40

12
Table 9: Average Cost of Power Supply of MSEDCL (Rs. /kWh)
Particulars FY 2013-14 FY 2014-15 FY 2015-16
Realistic Scenario 6.29 6.74 7.03
Optimistic Scenario 6.33 6.77 7.05
Pessimistic Scenario 6.58 7.02 7.40
4. Copies of the following documents can be obtained on written request from the offices of
MSEDCL mentioned below:
a. Executive Summary of the Petition (free of cost, in Marathi or English)
b. Detailed Petition documents along with CD (in English) (on payment of Rs. 250/- by
Cash/DD/ Cheque drawn on “Maharashtra State Electricity Distribution Company
Limited”
c. Detailed Petition documents (in English) (on payment of Rs. 200/-).
d. CD of detailed Petition document (in English) (on payment of Rs. 100/-).
Head Office:
Shri. Vijay Shiroorkar, Chief General Manager, (Corporate Finance)
Maharashtra State Electricity Distribution Company Limited,
1st Floor, Prakashgad, Plot No. G-9,
Bandra (East), Mumbai 400 051
STD code: 022, Phone No. 26581475(P), 26474211(O).
E-mail: [email protected]
Other Offices:
1. The Chief Engineer
(O&M), MSEDCL, Bhandup Urban
Zone, Vidhyut, 1st floor, Near Asian
Paint, L.B.S.Marg, Bhandup,
Mumbai-400078,
STD Code- 022, Phone : 25660652(P),
25663984 (O), Fax: 25663990
E-mail : [email protected]
2.The Chief Engineer
(O&M),MSEDCL, Aurangabad Zone,
Vidhyut Bhawan, Dr.Babasaheb
Ambedkar Marg,
Aurangabad-431001,
STD Code- 0240, hone : 2331347(P),
2334065 (O), Fax: 2331056, E-mail:
3. The Chief Engineer
(O&M),MSEDCL, Amravati Zone,
Akola, Vidyut Bhawan, Ratanlal Plot,
Akola-444001,
STD Code- 0724, Phone : 2434740
(P), 2434476 (O),
Fax: 2438025,
E-mail : [email protected]
4.The Chief Engineer
(O&M), MSEDCL, Nagpur Urban
Zone, Prakash Bhawan, Link Road,
Gaddi Gudam, Sadar, Nagpur-440001,
STD Code-0712,
Phone: 2532142 (P), 2531561 (O),
Fax: 2520178,
Email:[email protected]
5. The Chief Engineer
(O&M), MSEDCL, Nashik Zone,
Vidyut Bhavan, Bitco Point, Nashik
Road, Nashik-422101 ,
STD Code-0253, Phone: 2461767 (P),
2462491 (O),
Fax: 2461581/2456380,
E-mail:[email protected]
6. The Chief Engineer
(O&M),MSEDCL, Pune Zone,
Adm.Bldg., Power House,
Rasta Peth,
Pune-411011,
STD Code- 020, Phone : 26135740
(P), 26131389 (O), Fax: 26132052,
Email:[email protected]
7. The Chief Engineer
(O&M), MSEDCL, Nagpur Rural
Zone, Vidyut Bhawan, Katol Road,
Nagpur-440013
STD Code- 0712, Phone: 2591993 (P),
2591976 (O), Fax: 2591927,
E-mail: [email protected]
8. The Chief Engineer,
(O & M), MSEDCL, Kalyan Zone
Kalyan, Tejashri, Jahangir Maidan,
Karnik Road, Kalyan- 421 301.
STD Code-0251. Phone: 2305960(P),
2328283(O) Fax : 2329488/2305929.
E-mail: [email protected]
9. The Chief Engineer,
(O & M), MSEDCL, Konkan Zone
Konkan, New Administrative
Building, Nachani Road,
Ratnagiri- 415639.
STD Code-02352. Phone: 225852(P),
271003(O), Fax : 226504.
E-mail:[email protected]

13
10. The Chief Engineer,
(O & M), MSEDCL, Kolhapur Zone,
Kolhapur, Administrative Building,
Tarabai Park, Kolhapur- 416003.
STD Code-0231. Phone: 2653583(P),
2650581(O) Fax : 2658060.
E-mail: [email protected]
11. The Chief Engineer,
(O & M), MSEDCL, Latur Zone
Latur, June Vidyut Gruh, Sale Galli,
Latur- 413512.
STD Code-02382. Phone: 253344(P),
253866(O), Fax: 251866.
E-mail: [email protected]
12. The Chief Engineer,
(O & M), MSEDCL, Jalgaon Zone
Jalgaon, Vidyut Bhavan, Old MIDC,
Ajintha Road, Jalgaon- 425003.
STD Code-0257. Phone: 2272917(P),
2272990(O), Fax: 2210141.
E-mail:[email protected]
13. The Chief Engineer,
(O & M), MSEDCL, Nanded Zone,
Nanded, Annabhau Sathe Chauk,
Nanded- 431602.
STD Code-02462 Phone: 286801(P),
286803 (O) Fax: 286804.
E-mail:[email protected]
14. The Chief Engineer,
(O & M), MSEDCL, Baramati Zone,
Baramati, Vidya Corner Complex,
Gala No. 14 to 17, Pencil Chauk,
MIDC, Baramati- 413133.
STD Code-02112. Phone: 244771(P),
244772(O), Fax: 244773. E-mail:
5. The Commission has directed MSEDCL to invite objections and comments/suggestions from the
public on the above Petition through this Notice. Suggestions and/.or objections may be sent to
the Secretary, Maharashtra Electricity Regulatory Commission, 13th Floor, Centre No.1, World
Trade Centre, Cuffe Parade, Mumbai-400005 [Fax: 22163976 E-Mail:
[email protected]] by Monday, 6 May 2013 along with proof of service on the Chief
General Manager, (Corporate Finance), MSEDCL.
6. Every person who intends to file suggestion and/or objection can submit the same in English or
in Marathi, in six copies, and should carry the full name, postal address and e-mail address, if
any, of the sender. It should be indicated whether the suggestion and/or objection is being filed
on behalf of any organization of category of consumers. It should also be mentioned if the
sender wants to be heard in person, in which case opportunity may be given by the Commission
at the Public Hearing to be held at Centrum Hall, 1st Floor, Centre 1, World Trade Centre,
Cuffe Parade, Colaba, Mumbai -400 005 on Friday, 10 May 2013 at 11.00 AM, for which no
separate notice will be given.
7. MSEDCL shall reply to each of the objections/comments/suggestions received within three days
of the receipt of the same but not later than Thursday, 9 May 2013 for all the objections and
comments/suggestions received till Monday, 6 May 2013 Stakeholders can submit their
rejoinders on replies provided by MSEDCL either during the public hearing or latest by
Tuesday, 14 May 2013.
8. The detailed Petition document and the executive summary are available on MSEDCL’s website
www.mahadiscom.in and the executive summary is also available on the web site of the
Commission www.mercindia.org.in / www.merc.gov.in in downloadable format (free of cost).
Sd/-
Dattatraya Wavhal
Director (Finance)
Maharashtra State Electricity Distribution Company Ltd.