
England’s Seaside Towns · England’s Seaside Towns | Table 17: New NI registrations by non-UK...
70
England’s Seaside Towns A ‘benchmarking’ study www.communities.gov.uk community, opportunity, prosperity
Transcript of England’s Seaside Towns · England’s Seaside Towns | Table 17: New NI registrations by non-UK...

England’s Seaside TownsA ‘benchmarking’ study
www.communities.gov.ukcommunity, opportunity, prosperity

England’s Seaside TownsA ‘benchmarking’ study
November 2008Christina Beatty, Steve Fothergill and Ian Wilson
Centre for Regional Economic and Social ResearchSheffield Hallam University
Department for Communities and Local Government

Department for Communities and Local GovernmentEland HouseBressenden PlaceLondon SW1E 5DUTelephone: 020 7944 4400Website: www.communities.gov.uk
© Queen’s Printer and Controller of Her Majesty’s Stationery Office, 2008
Copyright in the typographical arrangement rests with the Crown.
This publication, excluding logos, may be reproduced free of charge in any format or medium for research, private study or for internal circulation within an organisation. This is subject to it being reproduced accurately and not used in a misleading context. The material must be acknowledged as Crown copyright and the title of the publication specified.
Any other use of the contents of this publication would require a copyright licence. Please apply for a Click-Use Licence for core material at www.opsi.gov.uk/click-use/system/online/pLogin.asp, or by writing to the Office of Public Sector Information, Information Policy Team, Kew, Richmond, Surrey TW9 4DU
e-mail: [email protected]
If you require this publication in an alternative format please email [email protected]
Communities and Local Government PublicationsPO Box 236WetherbyWest YorkshireLS23 7NBTel: 0300 123 1124Fax: 0300 123 1125Email: [email protected] via the Communities and Local Government website: www.communities.gov.uk
November 2008
Product Code: 08ACST05588
ISBN: 978-1-4098-0620-2
The findings and recommendations in this report are those of the authors and do not necessarily represent the views of the Department for Communities and Local Government.
Many of the statistics presented in this report have been compiled from data held on NOMIS (the National On-line Manpower Information System).
England’s Seaside Towns | �
Contents
Summary 7
1. Purpose and scope of the report 10
2. Geographical coverage 11
3. Statistical evidence 14
3.1 Population 14
3.2 Employment 19
3.3 Economic status 25
3.4 Skills and qualifications 28
3.5 Benefits 31
3.6 Seasonal unemployment 38
3.7 Earnings 40
3.8 Business stock 43
3.9 Migrant workers 45
3.10 Economic output 47
3.11 Housing 49
3.12 Deprivation 53
4. Assessment 64
4.1 Just how disadvantaged are England’s seaside towns? 64
4.2 The variation between towns 64
� | England’s Seaside Towns
List of tables
Table 1: Population of England’s principal seaside towns, 2006 (ranked by size) 16
Table 2: Population growth in England’s principal seaside towns, 1971–2006 (ranked by % growth 2001–2006) 17
Table 3: Age distribution of population of England’s principal seaside towns, 2006 (ranked by share of population aged 60/65+) 18
Table 4: Employment in England’s principal seaside towns, 2006 (ranked by estimated total employment) 21
Table 5: Change in employment in England’s principal seaside towns, 1998–99 to 2005–06 (ranked by percentage growth) 22
Table 6: Employment by sector in England’s principal seaside towns, 2006 (ranked by share in Distribution, hotels and restaurants) 24
Table 7: Employment rate in England’s principal seaside towns, 2006 26
Table 8: Occupational Structure of residents in employment in England’s principal seaside towns, 2001 (ranked by share of managers and professionals) 27
Table 9: Highest qualifications of working age population in England’s principal seaside towns, 2001 (ranked by share with Level 4/5) 29
Table 10: Estimated share of pupils achieving 5 or more A*–C grades at GCSE in England’s principal seaside towns, 2006 30
Table 11: Working age claimant rates in England’s principal seaside towns, May 2007 (ranked by total) 33
Table 12: Change in working age claimant rates in England’s principal seaside towns, August 1999 – May 2007 (ranked by total) 34
Table 13: Pension Credits claimant rate in England’s principal seaside towns, May 2007 37
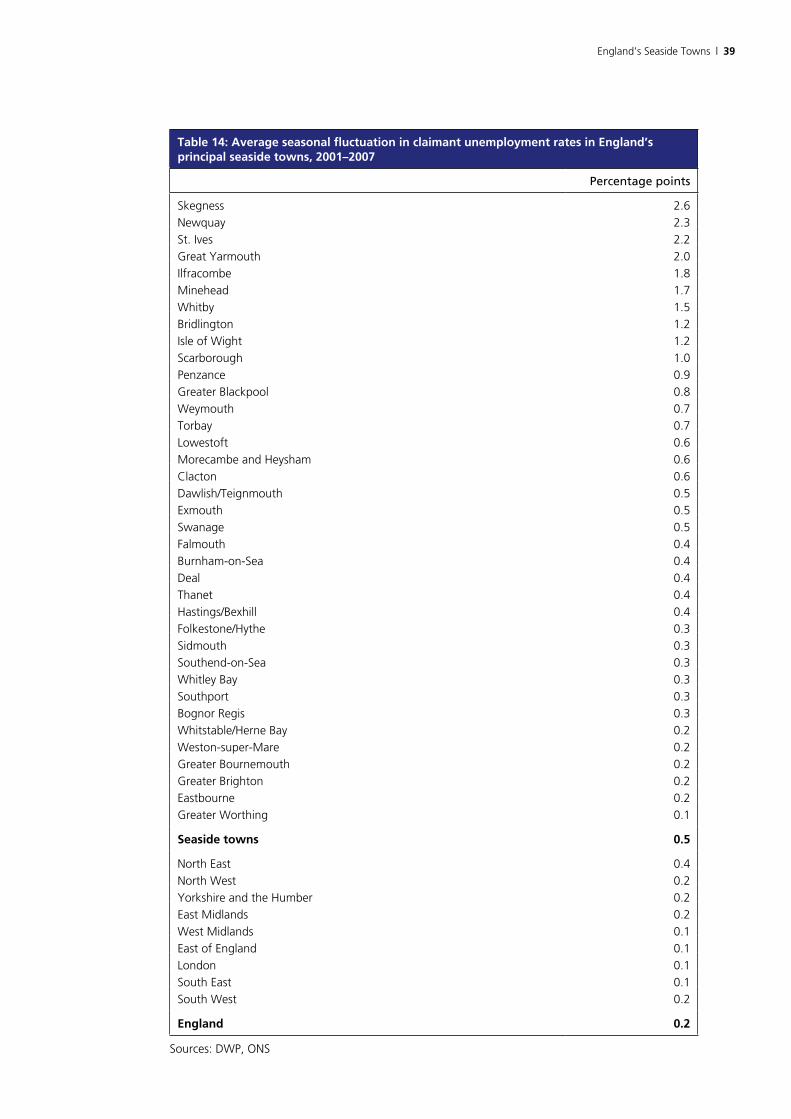
Table 14: Average seasonal fluctuation in claimant unemployment rates in England’s principal seaside towns, 2001–2007 39
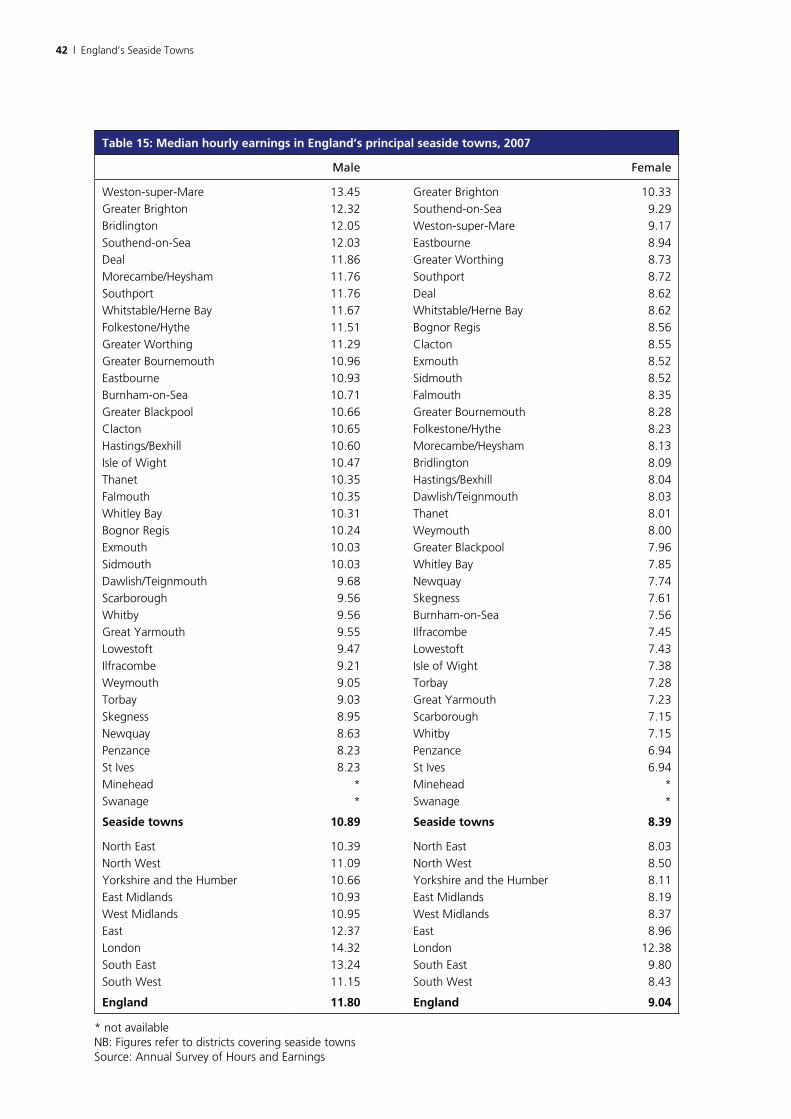
Table 15: Median hourly earnings in England’s principal seaside towns, 2007 42
Table 16: VAT registered businesses in England’s principal seaside towns, 2006 (ranked by stock per 10,000 residents) 44
England’s Seaside Towns | �
Table 17: New NI registrations by non-UK nationals in England’s principal seaside towns, 2005–06 and 2006–07 (ranked by % of local working age population) 46
Table 18: GVA per head in NUTS 3 region containing England’s principal seaside towns, 2004 48
Table 19: Tenure in England’s principal seaside towns, 2001 (ranked by owner occupation rate) 50
Table 20: Overcrowded households in England’s principal seaside towns, 2001 51
Table 21: Households lacking key amenities in England’s principal seaside towns, 2001 52
Table 22: Average overall deprivation ranking of LSOAs in England’s principal seaside towns, 2007 56
Table 23: Average ranking of seaside town LSOAs on income deprivation domain, 2007 57
Table 24: Average ranking of seaside town LSOAs on employment deprivation domain, 2007 58
Table 25: Average ranking of seaside town LSOAs on health deprivation and disability domain, 2007 59
Table 26: Average ranking of seaside town LSOAs on education, skills and training domain, 2007 60
Table 27: Average ranking of seaside town LSOAs on barriers to housing and services domain, 2007 61
Table 28: Average ranking of seaside town LSOAs on crime domain, 2007 62
Table 29: Average ranking of seaside town LSOAs on living environment domain, 2007 63

� | England’s Seaside Towns
List of figures
Figure 1: Location of England’s principal seaside towns 13
Figure 2: Employment change in England’s principal seaside towns, 1998–2006 23
Figure 3: Claimant unemployment rate in England’s principal seaside towns, 1984–2008 35
Figure 4: IS lone parent claimant rates in England’s principal seaside towns, 1999–2007 35
Figure 5: IB/SDA claimant rates in England’s principal seaside towns, 1999–2007 36
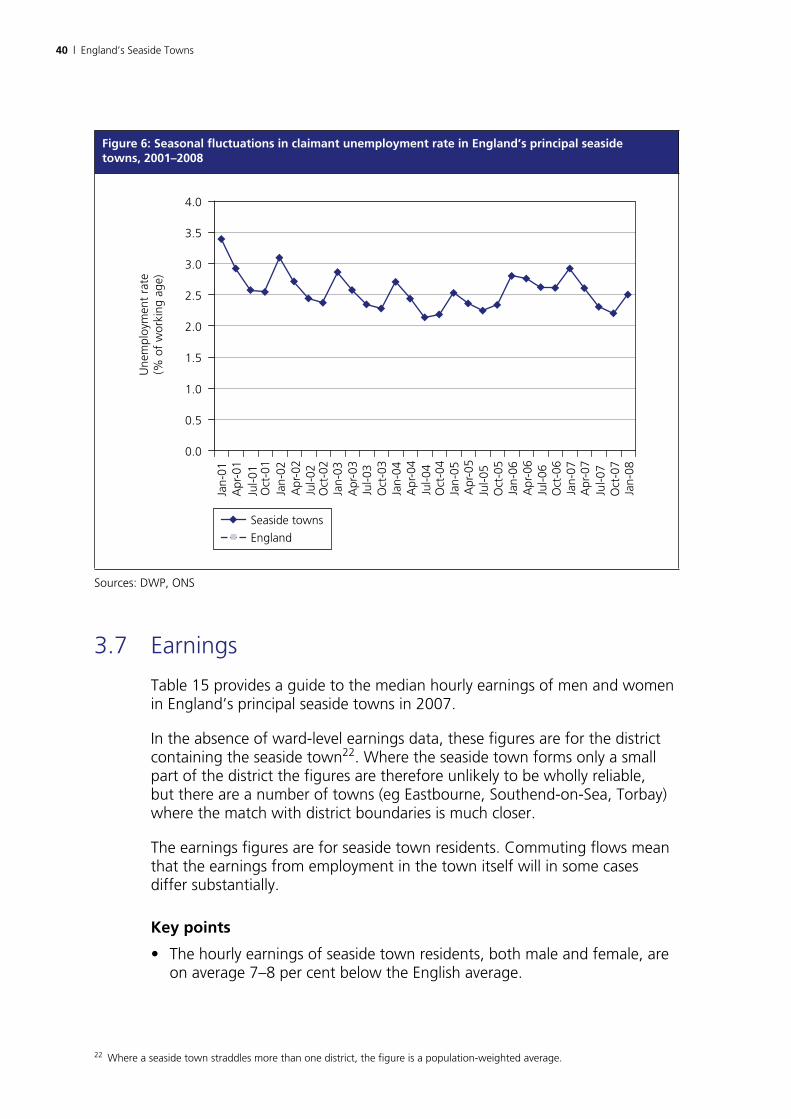
Figure 6: Seasonal fluctuations in claimant unemployment rate in England’s principal seaside towns, 2001–2008 40
England’s Seaside Towns | �
SummaryThis report has been commissioned to help inform policy development in response to the 2007 Select Committee inquiry into England’s coastal towns. The report presents a range of statistical evidence on socio-economic conditions and compares the figures with regional and English averages.
The report focuses on ‘seaside towns’ (or resorts) rather than all places around the coast. The statistics cover the 37 largest seaside towns in England, each with a population of at least 10,000. The towns are accurately defined at ward-level, generally by their built-up area, and sometimes bringing together adjacent towns in the same urban area.
The main body of the report is organised into 12 sections, each dealing with a particular topic such as population, benefits or earnings. The key findings from the data are that:
Population
• England’s principal seaside resorts have a combined population of just under 2.9 million, or nearly 6 per cent of England’s population – as much as a small region.
• Their population is growing, but in recent years more slowly than in England as a whole.
• The share of the population over state pension age is markedly above the English average (24 per cent compared to 19 per cent).
Employment, skills and qualifications
• Employment has also been growing in England’s principal seaside towns as a whole – up by 7.5 per cent between 1998–99 and 2005–06 compared to 6.9 per cent in England as a whole.
• The employment rate is nevertheless below the English average (72 per cent compared to 74 per cent in 2006) but there are big variations between individual seaside towns.
• Skill levels and achievement at school are slightly below average, but again there are variations between towns.
Benefits and seasonal unemployment
• The share of adults of working age claiming the three main benefits for the non-employed is above average – 13.3 per cent compared to 11.2 per cent in England as a whole in May 2007.
� | England’s Seaside Towns
• Incapacity benefit claimants are by far the largest group of non-employed working age benefit claimants in England’s principal seaside towns.
• There is still seasonal unemployment in seaside towns, but on average the claimant unemployment rate across the towns varies by only 0.5 percentage points between summer and winter.
• A sub-set of mainly smaller seaside towns are more badly affected by seasonal unemployment (eg Skegness and Newquay)
Earnings and business stock
• Average earnings for both males and females in the districts containing seaside towns are often substantially below the English average.
• The stock of VAT registered businesses and the rate of new registrations varies between seaside town districts, but overall is not dissimilar to regions outside London.
Migrant workers
• Overall, the districts containing seaside towns have attracted rather fewer migrant workers than the English average, but Brighton and Bournemouth are exceptions and the figures probably understate the situation in the towns themselves.
Economic output
• Gross Value Added (GVA) per head in the sub-regions containing seaside towns is almost always below the English average.
Housing
• Seaside towns have an unusual pattern of housing tenure – a markedly low share of households in social housing and high levels of private renting more akin to London.
• Housing overcrowding in seaside towns is generally not widespread.
England’s Seaside Towns | �
Deprivation
• 26 of the 37 principal seaside towns in England have an overall level of deprivation greater than the English average.
• On most individual domains within the Indices of Deprivation, with the notable exception of crime, a majority of seaside towns have above-average deprivation.
The report concludes that, taking account of a range of evidence, on average England’s principal seaside towns are rather more disadvantaged than the rest of the country, but not markedly so.
However, there is considerable variation between seaside towns, with some towns faring markedly better than others and in quite a number of cases better than England as a whole.
The ‘economic’ data suggests that Bognor Regis, Exmouth, Greater Bournemouth, Greater Brighton, Greater Worthing, Sidmouth, Southport, Swanage, Whitley Bay and Whitstable/Herne Bay have the stronger local economies among seaside towns.
The same data suggests that Bridlington, Clacton, Great Yarmouth, Ilfracombe, Lowestoft, Morecambe/Heysham, Penzance, Skegness, Thanet, Torbay and Whitby have the weaker local economies among seaside towns.
Among the larger seaside towns/areas, with more than 100,000 people, the economic data also points to a ranking of disadvantage from Thanet (the most disadvantaged) through Torbay, Hastings, Greater Blackpool, Isle of Wight, Southend, Greater Brighton and Greater Bournemouth to Greater Worthing (the least disadvantaged).
10 | England’s Seaside Towns
1. Purpose and scope of the report
This report has been commissioned by the Department for Communities and Local Government to help inform the need for policy development in response to the 2007 Select Committee report on England’s coastal towns1. It presents a range of statistical evidence on socio-economic conditions in seaside towns, and compares the figures with regional and English averages.
The report follows specifically from one of the recommendations of the review of evidence on coastal towns2 commissioned by Communities and Local Government to inform the Cross-Whitehall Coastal Towns Working Group established in 2008. The review identified four priorities for research:
• a ‘benchmarking’ exercise for seaside towns
• a study of incapacity claimants in seaside towns
• an assessment of the role of seaside tourism
• a review of the costs and funding of service delivery in seaside towns.
The purpose of the benchmarking exercise is to identify, on a range of up-to-date indicators, the extent to which England’s seaside towns differ from the regions of which they form part and from the national average. The figures are also intended to help identify the towns with the most significant social and economic problems.
The report covers the key socio-economic issues for which data is reasonably readily available. However, the report is not intended to provide a comprehensive digest of all the statistics that might conceivably be assembled for seaside towns, and it has been produced as a timely response to the first priority identified in the evidence review.
1 Communities and Local Government Committee (2007) Coastal Towns, Second report of session 2006–07, House of Commons HC 351, The Stationery Office, London.
2 S Fothergill (2008) England’s Coastal Towns: a short review of the issues, evidence base and research needs, report to Communities and Local Government, published as supplementary government evidence to the Communities and Local Government Committee.
England’s Seaside Towns | 11
2. Geographical coverage The review of existing evidence commissioned by Communities and Local
Government3 argued that for most purposes ‘coastal towns’ are not a coherent category. What coastal towns all share is an exposure to the sea – which is relevant to issues such as erosion, flood protection and pollution – but in other respects they differ enormously. Portsmouth and Sunderland, for example, are major industrial and commercial centres on the coast, very different in character from seaside resorts such as Scarborough, Great Yarmouth or Blackpool.
In contrast, the review argued that ‘seaside towns’ (or ‘seaside resorts’ – these terms are much more interchangeable) are a more clearly identifiable group of places. Because of their history of tourism, and in most cases the continuing significance of this sector, they tend to share a number of features that distinguish them from other places along the coast or inland. This includes a specialist tourist infrastructure (promenades, piers, parks etc), holiday accommodation (hotels, boarding houses, caravan sites) and a distinctive resort character that is often reflected in the built environment. Moreover, while some resorts have fared better than others, they have all to a greater or lesser extent faced challenges arising from the changing structure of the UK holiday trade.
Whilst recognising that some environmental concerns potentially apply to everywhere along the coast, the Cross-Whitehall Coastal Towns Working Group largely shared this view. There was also agreement that in practice the main concern of the 2007 Select Committee report had been with seaside towns/resorts.
The benchmarking study therefore covers seaside towns, not everywhere along the coast.
There are nevertheless practical problems in accurately identifying and defining seaside towns. A key issue is that with a few exceptions they do not match district boundaries. Most seaside towns form only one part of a wider district (Southport, which is part of Sefton district on Merseyside, is a good example). In a few cases the built-up urban area spills over into neighbouring districts (the Greater Blackpool area, which includes Lytham St Anne’s in Fylde district and Fleetwood in Wyre district as well as Blackpool itself, is an example). A further complication is that there is no hard-and-fast dividing line between seaside towns and other places along the coast.
The benchmarking study uses the definition of seaside towns originally developed for the 2003 report, The Seaside Economy�, widely referenced by the Select Committee and in evidence to its inquiry. The Seaside Economy report identified 43 ‘principal seaside towns’ around the coast of Britain, of
3 S Fothergill (2008) op.cit.4 C Beatty and S Fothergill (2003) The Seaside Economy, final report of the seaside towns research project, CRESR, Sheffield
Hallam University.

12 | England’s Seaside Towns
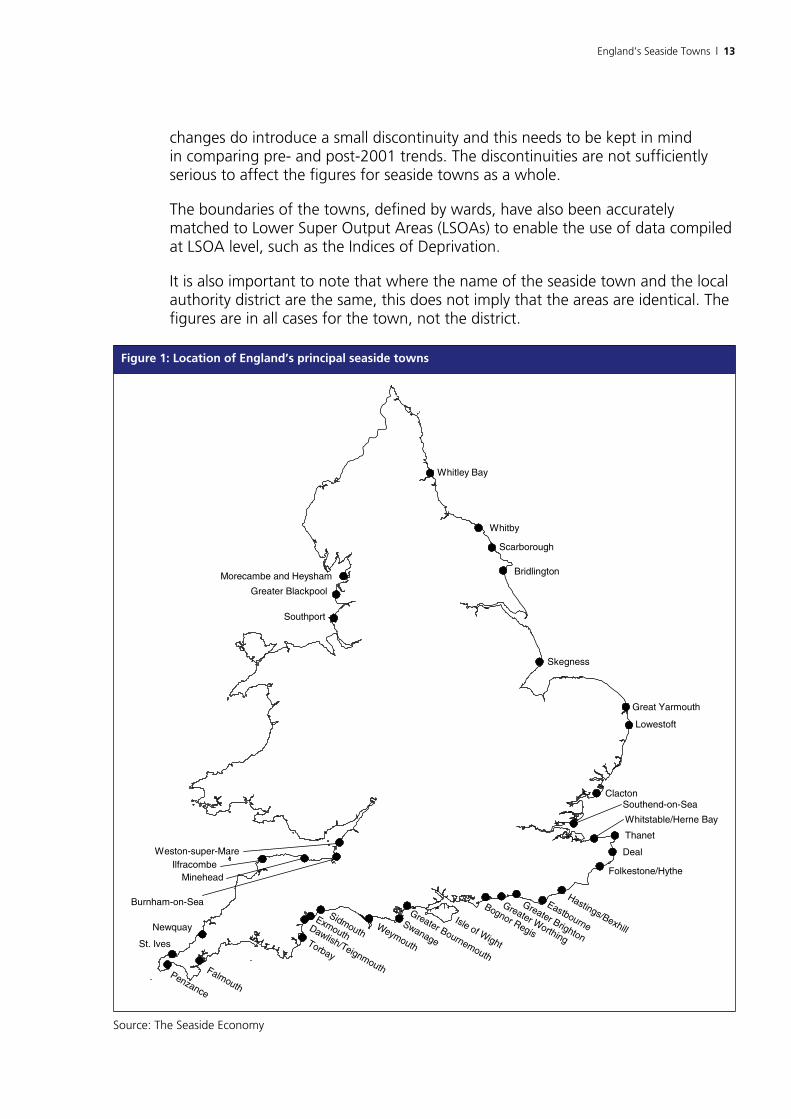
which 37 are in England. These are shown on Figure 1. The list of towns was drawn up in consultation with the British Resorts Association (now BRADA). Its aim was to cover resorts, rather than everywhere along the coast, and to include seaside towns that were places in their own right rather than just part of a bigger town or city.
The Seaside Economy list excludes the very smallest seaside towns with a population of less than 10,0005. Extending the list to include every coastal town with a claim to resort status, including the very smallest, would increase the list to at least 100 towns in England, though some of these would be very small. Accurate identification of the seaside towns with a population of less than 10,000 would require significant new investment in mapping and in data assembly and was ruled out for the present benchmarking study.
A number of points are worth noting about the towns on the Seaside Economy list. Bournemouth, Brighton, Blackpool and Worthing comprise wider areas than just the town at their core. To denote this, the title ‘Greater’ is attached to each of these towns in the present report. For example, ‘Greater Bournemouth’ includes Christchurch and Poole. There are other instances where neighbouring towns have been added together to produce more meaningful units – Margate, Broadstairs and Ramsgate are included together as ‘Thanet’ for example, and Hastings and Bexhill as a single town. The whole of the Isle of Wight is included, partly because seaside tourism is widely spread throughout the island and partly because its separation from the mainland accentuates the extent to which it functions as a discrete labour market.
There are notable omissions from the list. Redcar is excluded because it is essentially an integral part of industrial Teesside. Cleethorpes and Southsea are excluded because they cannot be meaningfully separated from Grimsby and Portsmouth respectively, the bigger towns of which they form part. The population threshold means that places such as Hunstanton, Wells, Sheringham and Cromer along the North Norfolk coast are excluded, along with a number of towns in Devon and Cornwall such as Salcombe, Fowey, Padstow and Bude.
What needs to be emphasised is that the list of ‘principal seaside towns’ used in the study is first and foremost an analytical tool. The list is not intended to suggest that other smaller places do not have a claim to seaside town status or that they should be excluded from any seaside town policy initiative.
For each seaside town covered in the report the boundaries are accurately defined at ward-level6. Where ward boundaries have changed through time the different sets of boundaries have been matched, including by reference to the underlying geography of the area, to allow comparisons through time. In a small number of cases, affecting a handful of smaller towns7, boundary
5 The original criteria was a minimum population of 8,000 in 1971. Population growth means that all the towns on the Seaside Economy list now exceed 10,000.
6 The initial building blocks for defining the towns were the pre-1974 local authority districts, when boundaries were generally drawn tightly around the towns and most seaside towns were typically a county borough, metropolitan borough or urban district in their own right.
7 Bridlington is the most significant example.
England’s Seaside Towns | 1�
changes do introduce a small discontinuity and this needs to be kept in mind in comparing pre- and post-2001 trends. The discontinuities are not sufficiently serious to affect the figures for seaside towns as a whole.
The boundaries of the towns, defined by wards, have also been accurately matched to Lower Super Output Areas (LSOAs) to enable the use of data compiled at LSOA level, such as the Indices of Deprivation.
It is also important to note that where the name of the seaside town and the local authority district are the same, this does not imply that the areas are identical. The figures are in all cases for the town, not the district.
Figure 1: Location of England’s principal seaside towns
Thanet
Whitstable/Herne Bay
Southend-on-Sea
Folkestone/Hythe
Great Yarmouth
Lowestoft
Eastbourne
Clacton
Deal
Hastings/Bexhill
Bognor Regis
Greater Worthing
Greater Brighton
Scarborough
Skegness
Bridlington
Whitley Bay
Whitby
Greater Bournemouth
Isle of Wight
SwanageTorbay
Dawlish/Teignmouth
ExmouthWeymouth
Sidmouth
Morecambe and Heysham
Greater Blackpool
Southport
Penzance
Weston-super-Mare
MineheadIlfracombe
Burnham-on-Sea
Newquay
St. Ives
Falmouth
Source: The Seaside Economy
1� | England’s Seaside Towns
3. Statistical evidence
3.1 Population
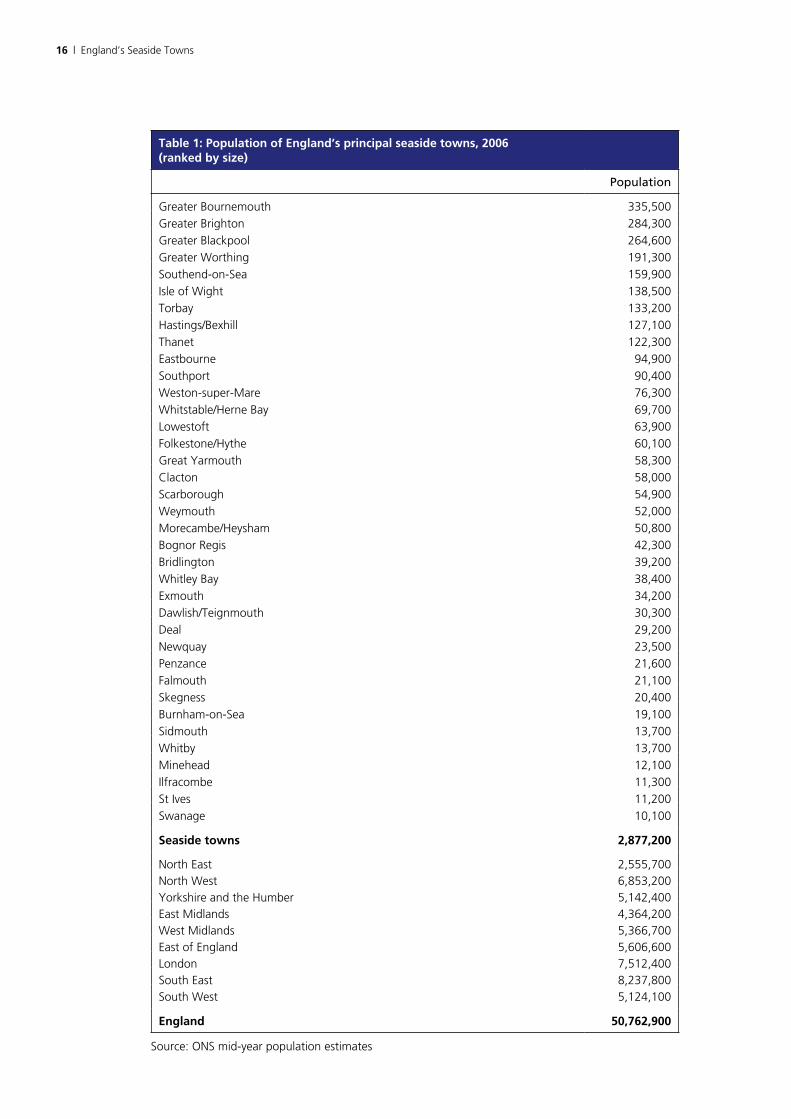
Table 1 shows the population of each of England’s 37 principal seaside towns in 2006.
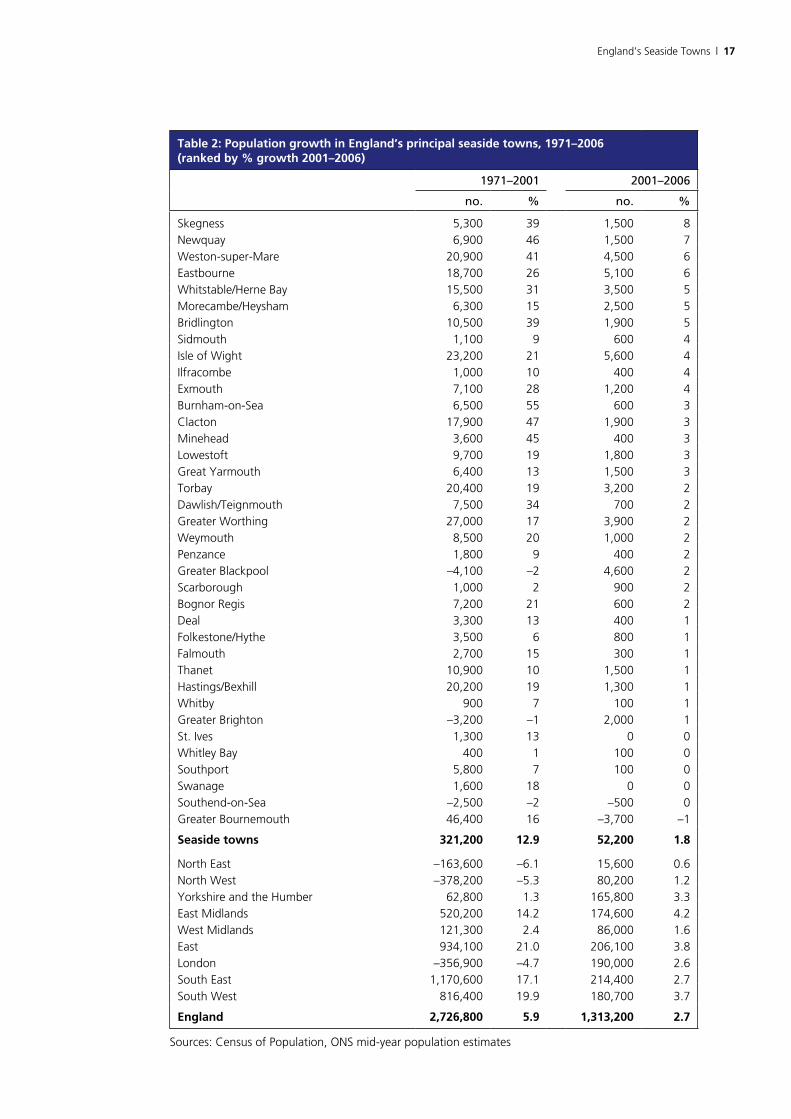
Table 2 shows the population change in these towns between 1971 and 2001 and between 2001 and 2006. The 1971–2001 figures, from Census of Population, are affected by minor definitional changes8 and in some cases by boundary changes9. The 2001–06 figures are the ONS mid-year population estimates and can be subject to error and revision.
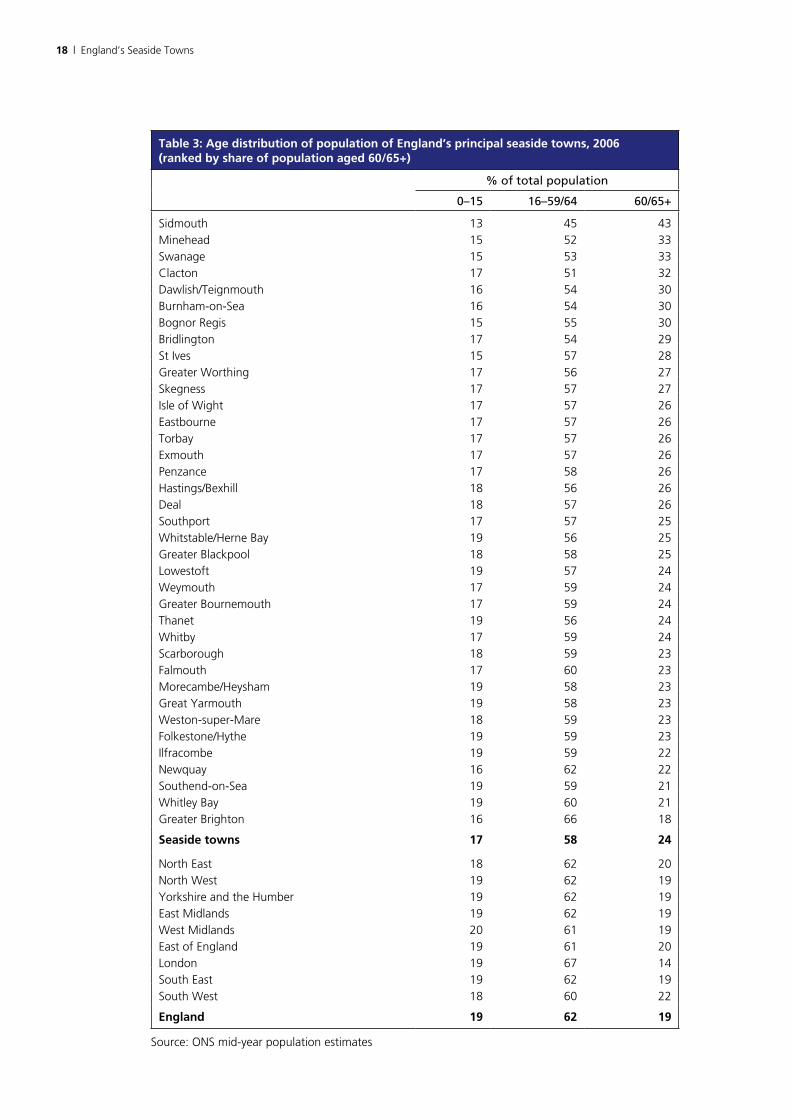
Table 3 shows the age structure of the seaside town population in 2006, differentiating between three groups – the under 16s, those of working age, and those over state pension age (60 for women, 65 for men).
Key points
• England’s 37 principal seaside towns have a combined population of just under 2.9 million. This represents 5.7 per cent of the population of England as a whole. Adding in the smaller seaside towns (with a population of less than 10,000) would probably bring the total to around 3.1 million.
• The population of England’s seaside towns is greater than the total population of the North East region (2.5 million)
• Seaside towns vary a lot in size. The largest (Greater Bournemouth) has a population larger than the combined population of the 15 smallest seaside towns on the list. The seven largest seaside towns account for half of the English seaside town population.
• Seaside towns have a growing population. Over the 2001–06 period their estimated growth (about 0.35 per cent a year) differed only marginally from the average over the previous thirty years (about 0.4 per cent a year).
• However, whereas between 1971 and 2001 population growth in seaside towns was faster than the English average, since 2001 it has fallen behind. If this is confirmed by subsequent data it represents the reversal of a long-established trend.
• Virtually all seaside towns have shared in population growth over the full 1971–2006 period.
8 In 2001 students were recorded where they were living in term-time whereas previously they had been counted at their home address. This has the effect of lowering the recorded population growth in most seaside towns, which mostly lack universities or other higher educational institutions, but may boost the recorded growth in Brighton in particular.
9 Newquay, Skegness and Bridlington are particularly affected.
England’s Seaside Towns | 1�
• Whilst there appear to be some notable changes in trend in individual towns (Greater Blackpool and Greater Bournemouth are examples) the recent figures should be treated with caution.
• Taking the long view, the fastest growth in population has occurred in some of the smaller seaside towns, especially but not exclusively in the South West.
• The seaside town population is skewed towards older age groups. The share of the population over state pension age is 5 percentage points higher than the English average (24 per cent compared to 19 per cent) and higher than the average for any English region.
• The share of the population of working age in seaside towns is correspondingly lower – 58 per cent compared to 62 per cent for England as a whole.
• Only Greater Brighton has a share of the population over state pension age that is below the English average. This may owe something to large numbers of students at Brighton’s two universities.
1� | England’s Seaside Towns
Table 1: Population of England’s principal seaside towns, 200� (ranked by size)
Population
Greater Bournemouth 335,500
Greater Brighton 284,300
Greater Blackpool 264,600
Greater Worthing 191,300
Southend-on-Sea 159,900
Isle of Wight 138,500
Torbay 133,200
Hastings/Bexhill 127,100
Thanet 122,300
Eastbourne 94,900
Southport 90,400
Weston-super-Mare 76,300
Whitstable/Herne Bay 69,700
Lowestoft 63,900
Folkestone/Hythe 60,100
Great Yarmouth 58,300
Clacton 58,000
Scarborough 54,900
Weymouth 52,000
Morecambe/Heysham 50,800
Bognor Regis 42,300
Bridlington 39,200
Whitley Bay 38,400
Exmouth 34,200
Dawlish/Teignmouth 30,300
Deal 29,200
Newquay 23,500
Penzance 21,600
Falmouth 21,100
Skegness 20,400
Burnham-on-Sea 19,100
Sidmouth 13,700
Whitby 13,700
Minehead 12,100
Ilfracombe 11,300
St Ives 11,200
Swanage 10,100
Seaside towns 2,���,200
North East 2,555,700North West 6,853,200Yorkshire and the Humber 5,142,400East Midlands 4,364,200West Midlands 5,366,700East of England 5,606,600London 7,512,400South East 8,237,800South West 5,124,100
England �0,��2,�00
Source: ONS mid-year population estimates
England’s Seaside Towns | 1�
Table 2: Population growth in England’s principal seaside towns, 1��1–200� (ranked by % growth 2001–200�)
1971–2001 2001–2006
no. % no. %
Skegness 5,300 39 1,500 8Newquay 6,900 46 1,500 7Weston-super-Mare 20,900 41 4,500 6Eastbourne 18,700 26 5,100 6Whitstable/Herne Bay 15,500 31 3,500 5Morecambe/Heysham 6,300 15 2,500 5Bridlington 10,500 39 1,900 5Sidmouth 1,100 9 600 4Isle of Wight 23,200 21 5,600 4Ilfracombe 1,000 10 400 4Exmouth 7,100 28 1,200 4Burnham-on-Sea 6,500 55 600 3Clacton 17,900 47 1,900 3Minehead 3,600 45 400 3Lowestoft 9,700 19 1,800 3Great Yarmouth 6,400 13 1,500 3Torbay 20,400 19 3,200 2Dawlish/Teignmouth 7,500 34 700 2Greater Worthing 27,000 17 3,900 2Weymouth 8,500 20 1,000 2Penzance 1,800 9 400 2Greater Blackpool –4,100 –2 4,600 2Scarborough 1,000 2 900 2Bognor Regis 7,200 21 600 2Deal 3,300 13 400 1Folkestone/Hythe 3,500 6 800 1Falmouth 2,700 15 300 1Thanet 10,900 10 1,500 1Hastings/Bexhill 20,200 19 1,300 1Whitby 900 7 100 1Greater Brighton –3,200 –1 2,000 1St. Ives 1,300 13 0 0Whitley Bay 400 1 100 0Southport 5,800 7 100 0Swanage 1,600 18 0 0Southend-on-Sea –2,500 –2 –500 0Greater Bournemouth 46,400 16 –3,700 –1
Seaside towns �21,200 12.� �2,200 1.�
North East –163,600 –6.1 15,600 0.6North West –378,200 –5.3 80,200 1.2Yorkshire and the Humber 62,800 1.3 165,800 3.3East Midlands 520,200 14.2 174,600 4.2West Midlands 121,300 2.4 86,000 1.6East 934,100 21.0 206,100 3.8London –356,900 –4.7 190,000 2.6South East 1,170,600 17.1 214,400 2.7South West 816,400 19.9 180,700 3.7
England 2,�2�,�00 �.� 1,�1�,200 2.�
Sources: Census of Population, ONS mid-year population estimates
1� | England’s Seaside Towns
Table �: Age distribution of population of England’s principal seaside towns, 200� (ranked by share of population aged �0/��+)
% of total population
0–15 16–59/64 60/65+
Sidmouth 13 45 43Minehead 15 52 33Swanage 15 53 33Clacton 17 51 32Dawlish/Teignmouth 16 54 30Burnham-on-Sea 16 54 30Bognor Regis 15 55 30Bridlington 17 54 29St Ives 15 57 28Greater Worthing 17 56 27Skegness 17 57 27Isle of Wight 17 57 26Eastbourne 17 57 26Torbay 17 57 26Exmouth 17 57 26Penzance 17 58 26Hastings/Bexhill 18 56 26Deal 18 57 26Southport 17 57 25Whitstable/Herne Bay 19 56 25Greater Blackpool 18 58 25Lowestoft 19 57 24Weymouth 17 59 24Greater Bournemouth 17 59 24Thanet 19 56 24Whitby 17 59 24Scarborough 18 59 23Falmouth 17 60 23Morecambe/Heysham 19 58 23Great Yarmouth 19 58 23Weston-super-Mare 18 59 23Folkestone/Hythe 19 59 23Ilfracombe 19 59 22Newquay 16 62 22Southend-on-Sea 19 59 21Whitley Bay 19 60 21Greater Brighton 16 66 18
Seaside towns 1� �� 2�
North East 18 62 20North West 19 62 19Yorkshire and the Humber 19 62 19East Midlands 19 62 19West Midlands 20 61 19East of England 19 61 20London 19 67 14South East 19 62 19South West 18 60 22
England 1� �2 1�
Source: ONS mid-year population estimates
England’s Seaside Towns | 1�
3.2 Employment
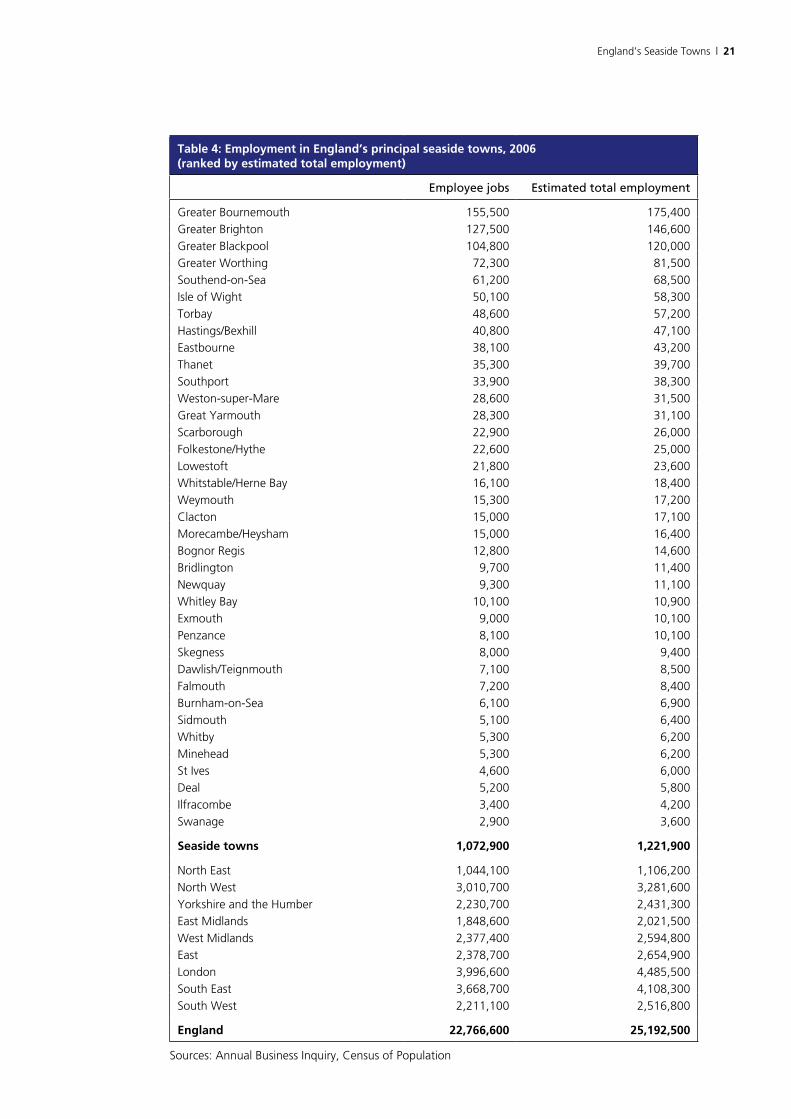
Table 4 shows the employment in England’s principal seaside towns in 2006. Two figures are presented here. The first is the number of employee jobs recorded by the government’s Annual Business Inquiry (ABI). The second is an estimate of the total number of people in work in the towns, adding in the self-employed excluded from the ABI and deducting ‘double jobbing’ (where employees are counted more than once by the ABI). To derive these estimates the 2006 ABI figures have been adjusted upwards by the ratio between the number of self-employed and employees in each town, from the 2001 Census of Population, and downwards by the proportion of double-jobbers from Labour Force Survey data for GB for 2001.
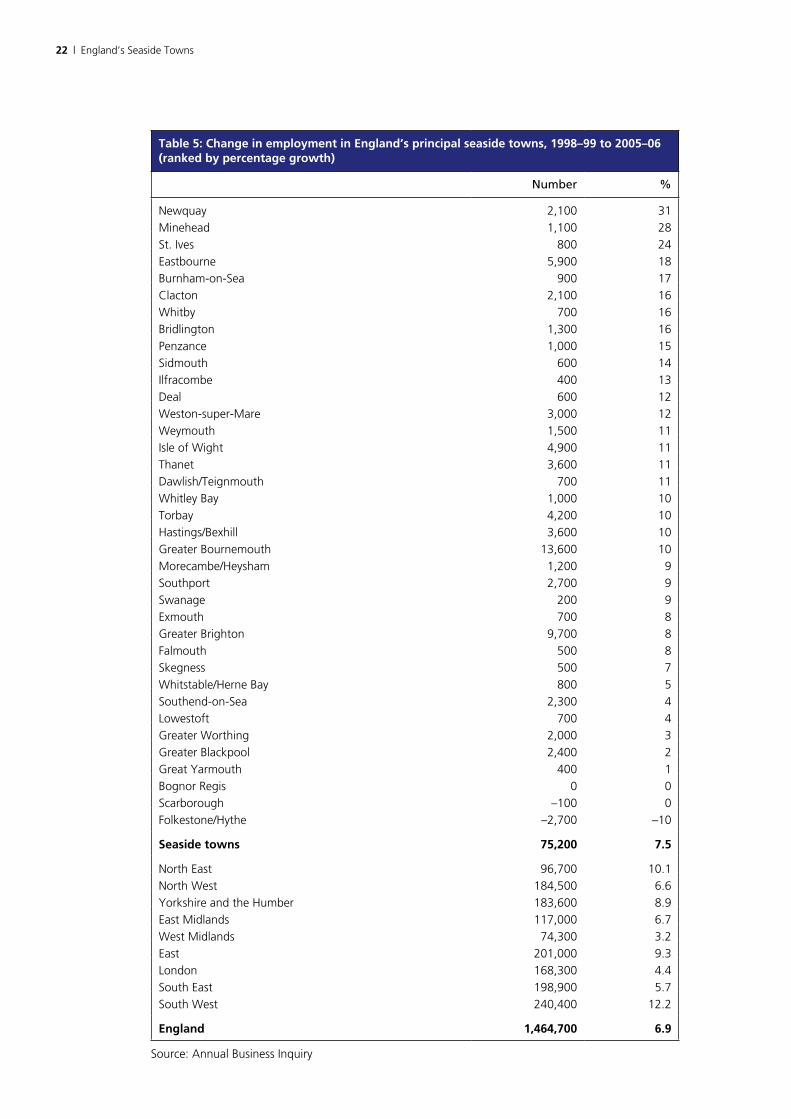
Table 5 shows the change in the number of employee jobs in each town between 1998–99 and 2005–06. The ABI data for small areas can show erratic fluctuations from year to year, which to some extent reflect sampling errors. To help offset these fluctuations, the employment figures here are based on a comparison between two-year averages10.
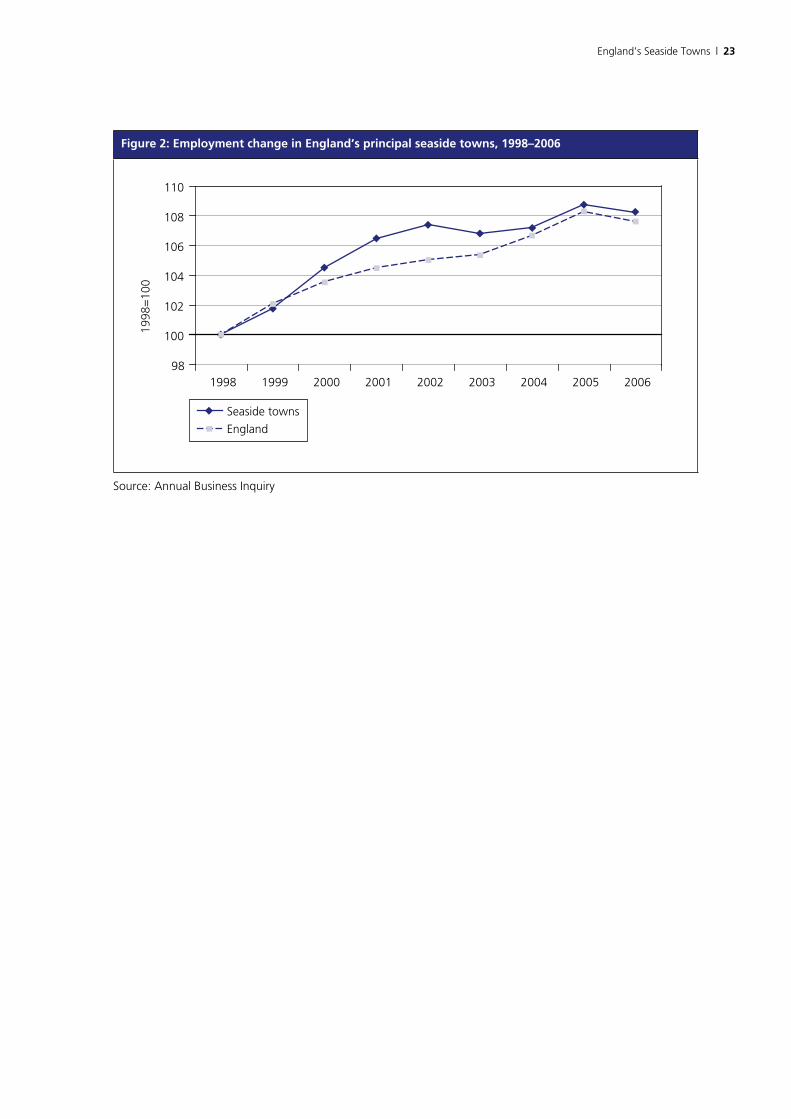
Figure 2 compares the trend in employment in these 37 seaside towns with the trend for England as a whole over the period 1998 to 200611. These figures are from the ABI and exclude the self-employed.
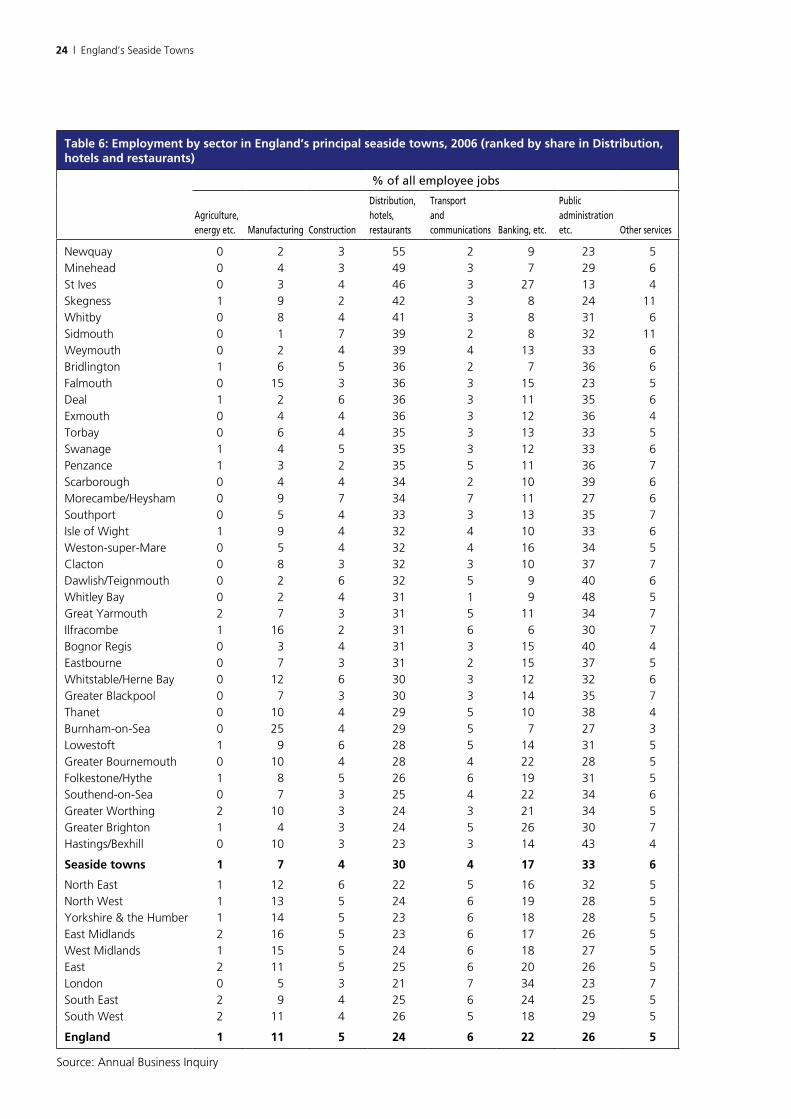
Table 6 shows the structure of employment in 2006, from the ABI. Employment is broken down into eight sectors12 and the figures refer to the jobs located in the towns, not those held by residents, which will differ because of commuting. The figures are ranked by the share of employment in ‘distribution, hotels and restaurants’. This is the sector where many tourist-related jobs are concentrated and the ranking of the towns therefore offers a rough guide to the extent to which local employment depends on tourism.
Key points
• In all, more than 1.2 million jobs are located in England’s principal seaside towns.
• The four largest seaside towns (Bournemouth, Brighton, Blackpool and Worthing) account for more than half a million jobs.
10 In addition a small number of corrections have been made to the raw ABI data to allow for apparent errors and omissions in some years’ data. The towns affected by these corrections are Greater Bournemouth, Greater Brighton and Isle of Wight. The corrections were based on comparisons between earlier and later years’ figures.
11 The figures here are for individual years, not two-year averages. The figures for 2006 are for September whereas the data for earlier years is for December. The Office for National Statistics estimates that the change of month lowers the national employment total by between 150,000 and 350,000 (0.6 to 1.3 per cent), for example because of the exclusion of temporary retailing jobs in the run up to Christmas. However, the effect in seaside towns of the shift may be to raise recorded employment because of the inclusion in September, towards the end of the summer season, of additional jobs related to tourism. These factors should be kept in mind in interpreting small differences between recent trends in seaside towns and the England average. The effect on recorded employment growth will potentially be greatest in the seaside towns where tourism is an especially large component of the local economy.
12 Agriculture and fishing, and energy and water, have been merged in these tables. There is little employment recorded in either of these groups in seaside towns.

20 | England’s Seaside Towns
• Employment in the 37 principal seaside towns has been growing a little faster than the national average – by 7.5 per cent between 1998–99 and 2005–06, compared to 6.9 per cent across England as a whole. This confirms a trend identified in the Seaside Economy report13. The rate of employment growth in seaside towns appears to have accelerated, compared to the 1971–2001 period covered in that report, but the difference between seaside towns and the national average has narrowed.
• All but two seaside towns (Folkestone/Hythe and Scarborough) have shared in the recent employment growth but nine in total, including Greater Blackpool, have seen slower growth than the English average.
• Recent employment growth has been impressive in a number of smaller seaside towns in the south West, including Newquay, Minehead, St Ives, Burnham-on-Sea, Penzance, Sidmouth and Ilfracombe.
• The share of jobs in distribution, hotels and restaurants is markedly higher in seaside towns (30 per cent compared to an English average of 24 per cent). The share of jobs in this sector is lower than the English average in only Hastings/Bexhill.
• In 16 mainly smaller seaside towns, the share of employment in distribution, hotels and restaurants is at least 10 percentage points higher than the national average. In Newquay in Cornwall the share is more than 30 percentage points higher.
• Manufacturing and banking, finance, insurance and business services are under represented in most seaside towns – especially in comparison with levels in London and the South East.
• Jobs in public administration, education and health are over-represented in most seaside towns.
13 C Beatty and S Fothergill (2003) op. cit.
England’s Seaside Towns | 21
Table �: Employment in England’s principal seaside towns, 200� (ranked by estimated total employment)
Employee jobs Estimated total employment
Greater Bournemouth 155,500 175,400
Greater Brighton 127,500 146,600
Greater Blackpool 104,800 120,000
Greater Worthing 72,300 81,500
Southend-on-Sea 61,200 68,500
Isle of Wight 50,100 58,300
Torbay 48,600 57,200
Hastings/Bexhill 40,800 47,100
Eastbourne 38,100 43,200
Thanet 35,300 39,700
Southport 33,900 38,300
Weston-super-Mare 28,600 31,500
Great Yarmouth 28,300 31,100
Scarborough 22,900 26,000
Folkestone/Hythe 22,600 25,000
Lowestoft 21,800 23,600
Whitstable/Herne Bay 16,100 18,400
Weymouth 15,300 17,200
Clacton 15,000 17,100
Morecambe/Heysham 15,000 16,400
Bognor Regis 12,800 14,600
Bridlington 9,700 11,400
Newquay 9,300 11,100
Whitley Bay 10,100 10,900
Exmouth 9,000 10,100
Penzance 8,100 10,100
Skegness 8,000 9,400
Dawlish/Teignmouth 7,100 8,500
Falmouth 7,200 8,400
Burnham-on-Sea 6,100 6,900
Sidmouth 5,100 6,400
Whitby 5,300 6,200
Minehead 5,300 6,200
St Ives 4,600 6,000
Deal 5,200 5,800
Ilfracombe 3,400 4,200
Swanage 2,900 3,600
Seaside towns 1,0�2,�00 1,221,�00
North East 1,044,100 1,106,200
North West 3,010,700 3,281,600
Yorkshire and the Humber 2,230,700 2,431,300
East Midlands 1,848,600 2,021,500
West Midlands 2,377,400 2,594,800
East 2,378,700 2,654,900
London 3,996,600 4,485,500
South East 3,668,700 4,108,300
South West 2,211,100 2,516,800
England 22,���,�00 2�,1�2,�00
Sources: Annual Business Inquiry, Census of Population
22 | England’s Seaside Towns
Table �: Change in employment in England’s principal seaside towns, 1���–�� to 200�–0� (ranked by percentage growth)
Number %
Newquay 2,100 31
Minehead 1,100 28
St. Ives 800 24
Eastbourne 5,900 18
Burnham-on-Sea 900 17
Clacton 2,100 16
Whitby 700 16
Bridlington 1,300 16
Penzance 1,000 15
Sidmouth 600 14
Ilfracombe 400 13
Deal 600 12
Weston-super-Mare 3,000 12
Weymouth 1,500 11
Isle of Wight 4,900 11
Thanet 3,600 11
Dawlish/Teignmouth 700 11
Whitley Bay 1,000 10
Torbay 4,200 10
Hastings/Bexhill 3,600 10
Greater Bournemouth 13,600 10
Morecambe/Heysham 1,200 9
Southport 2,700 9
Swanage 200 9
Exmouth 700 8
Greater Brighton 9,700 8
Falmouth 500 8
Skegness 500 7
Whitstable/Herne Bay 800 5
Southend-on-Sea 2,300 4
Lowestoft 700 4
Greater Worthing 2,000 3
Greater Blackpool 2,400 2
Great Yarmouth 400 1
Bognor Regis 0 0
Scarborough –100 0
Folkestone/Hythe –2,700 –10
Seaside towns ��,200 �.�
North East 96,700 10.1
North West 184,500 6.6
Yorkshire and the Humber 183,600 8.9
East Midlands 117,000 6.7
West Midlands 74,300 3.2
East 201,000 9.3
London 168,300 4.4
South East 198,900 5.7
South West 240,400 12.2
England 1,���,�00 �.�
Source: Annual Business Inquiry
England’s Seaside Towns | 2�
Figure 2: Employment change in England’s principal seaside towns, 1���–200�
98
100
102
104
106
108
110
1998 1999 2000 2001 2002 2003 2004 2005 2006
Seaside towns
England
1998
=10
0
Source: Annual Business Inquiry
2� | England’s Seaside Towns
Table �: Employment by sector in England’s principal seaside towns, 200� (ranked by share in Distribution, hotels and restaurants)
% of all employee jobs
Agriculture, energy etc.
Manufacturing
Construction
Distribution, hotels, restaurants
Transport and communications
Banking, etc.
Public administration etc.
Other services
Newquay 0 2 3 55 2 9 23 5Minehead 0 4 3 49 3 7 29 6St Ives 0 3 4 46 3 27 13 4Skegness 1 9 2 42 3 8 24 11Whitby 0 8 4 41 3 8 31 6Sidmouth 0 1 7 39 2 8 32 11Weymouth 0 2 4 39 4 13 33 6Bridlington 1 6 5 36 2 7 36 6Falmouth 0 15 3 36 3 15 23 5Deal 1 2 6 36 3 11 35 6Exmouth 0 4 4 36 3 12 36 4Torbay 0 6 4 35 3 13 33 5Swanage 1 4 5 35 3 12 33 6Penzance 1 3 2 35 5 11 36 7Scarborough 0 4 4 34 2 10 39 6Morecambe/Heysham 0 9 7 34 7 11 27 6Southport 0 5 4 33 3 13 35 7Isle of Wight 1 9 4 32 4 10 33 6Weston-super-Mare 0 5 4 32 4 16 34 5Clacton 0 8 3 32 3 10 37 7Dawlish/Teignmouth 0 2 6 32 5 9 40 6Whitley Bay 0 2 4 31 1 9 48 5Great Yarmouth 2 7 3 31 5 11 34 7Ilfracombe 1 16 2 31 6 6 30 7Bognor Regis 0 3 4 31 3 15 40 4Eastbourne 0 7 3 31 2 15 37 5Whitstable/Herne Bay 0 12 6 30 3 12 32 6Greater Blackpool 0 7 3 30 3 14 35 7Thanet 0 10 4 29 5 10 38 4Burnham-on-Sea 0 25 4 29 5 7 27 3Lowestoft 1 9 6 28 5 14 31 5Greater Bournemouth 0 10 4 28 4 22 28 5Folkestone/Hythe 1 8 5 26 6 19 31 5Southend-on-Sea 0 7 3 25 4 22 34 6Greater Worthing 2 10 3 24 3 21 34 5Greater Brighton 1 4 3 24 5 26 30 7Hastings/Bexhill 0 10 3 23 3 14 43 4
Seaside towns 1 � � �0 � 1� �� �
North East 1 12 6 22 5 16 32 5North West 1 13 5 24 6 19 28 5Yorkshire & the Humber 1 14 5 23 6 18 28 5East Midlands 2 16 5 23 6 17 26 5West Midlands 1 15 5 24 6 18 27 5East 2 11 5 25 6 20 26 5London 0 5 3 21 7 34 23 7South East 2 9 4 25 6 24 25 5South West 2 11 4 26 5 18 29 5
England 1 11 � 2� � 22 2� �
Source: Annual Business Inquiry
England’s Seaside Towns | 2�
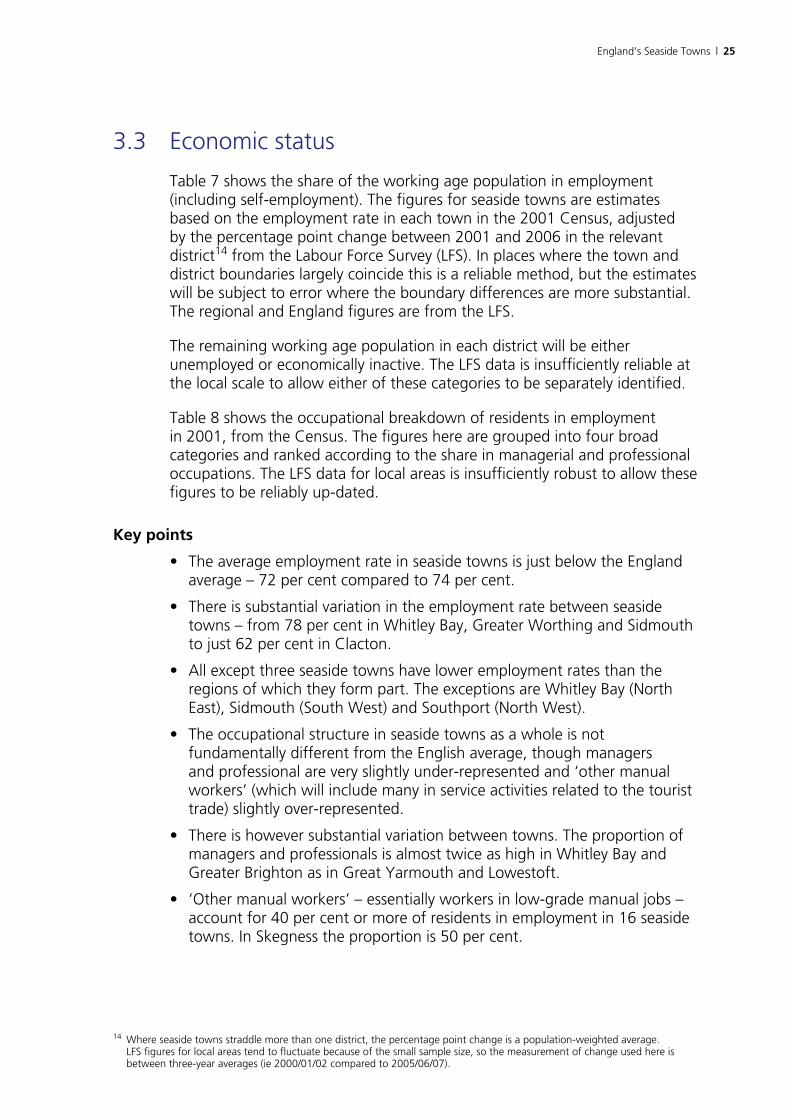
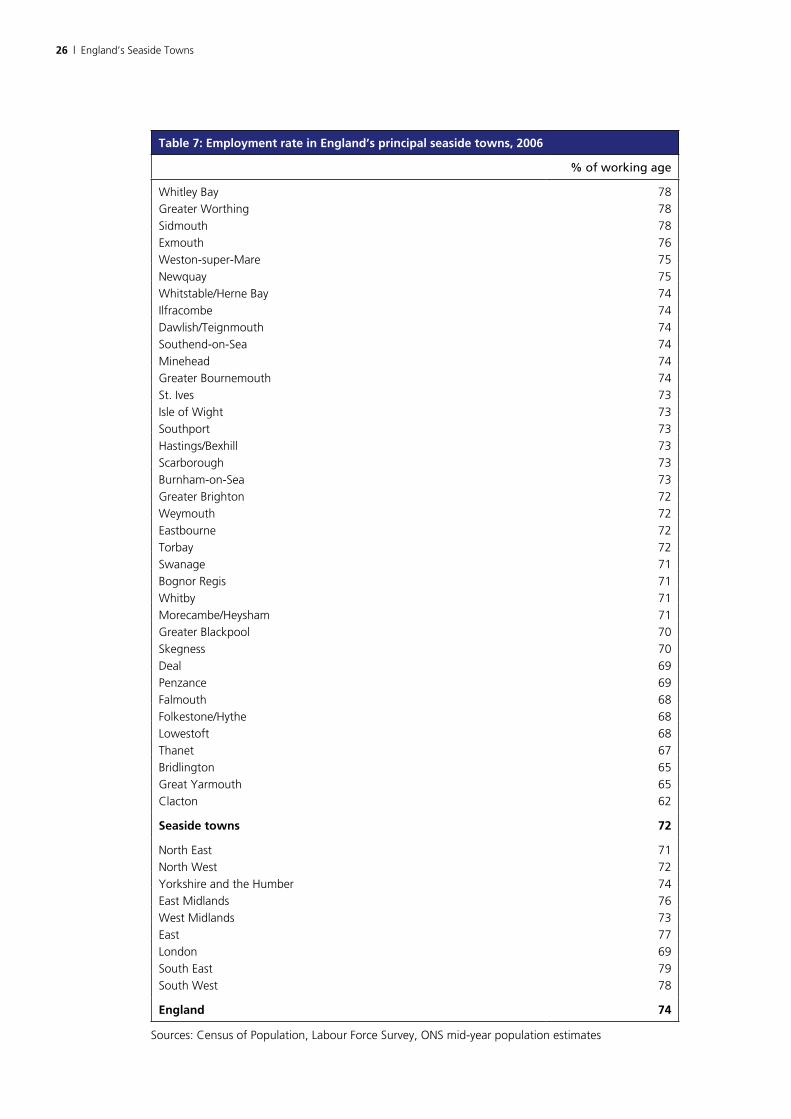
3.3 Economic status
Table 7 shows the share of the working age population in employment (including self-employment). The figures for seaside towns are estimates based on the employment rate in each town in the 2001 Census, adjusted by the percentage point change between 2001 and 2006 in the relevant district14 from the Labour Force Survey (LFS). In places where the town and district boundaries largely coincide this is a reliable method, but the estimates will be subject to error where the boundary differences are more substantial. The regional and England figures are from the LFS.
The remaining working age population in each district will be either unemployed or economically inactive. The LFS data is insufficiently reliable at the local scale to allow either of these categories to be separately identified.
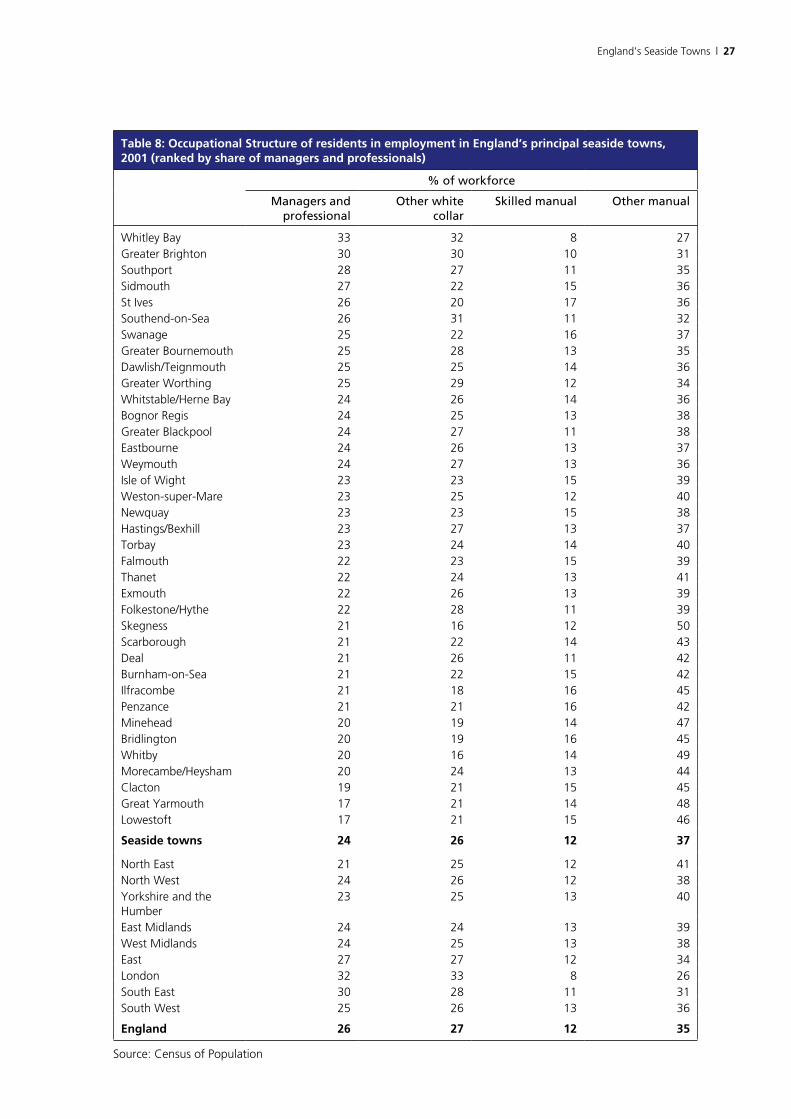
Table 8 shows the occupational breakdown of residents in employment in 2001, from the Census. The figures here are grouped into four broad categories and ranked according to the share in managerial and professional occupations. The LFS data for local areas is insufficiently robust to allow these figures to be reliably up-dated.
Key points
• The average employment rate in seaside towns is just below the England average – 72 per cent compared to 74 per cent.
• There is substantial variation in the employment rate between seaside towns – from 78 per cent in Whitley Bay, Greater Worthing and Sidmouth to just 62 per cent in Clacton.
• All except three seaside towns have lower employment rates than the regions of which they form part. The exceptions are Whitley Bay (North East), Sidmouth (South West) and Southport (North West).
• The occupational structure in seaside towns as a whole is not fundamentally different from the English average, though managers and professional are very slightly under-represented and ‘other manual workers’ (which will include many in service activities related to the tourist trade) slightly over-represented.
• There is however substantial variation between towns. The proportion of managers and professionals is almost twice as high in Whitley Bay and Greater Brighton as in Great Yarmouth and Lowestoft.
• ‘Other manual workers’ – essentially workers in low-grade manual jobs – account for 40 per cent or more of residents in employment in 16 seaside towns. In Skegness the proportion is 50 per cent.
14 Where seaside towns straddle more than one district, the percentage point change is a population-weighted average. LFS figures for local areas tend to fluctuate because of the small sample size, so the measurement of change used here is between three-year averages (ie 2000/01/02 compared to 2005/06/07).
2� | England’s Seaside Towns
Table �: Employment rate in England’s principal seaside towns, 200�
% of working age
Whitley Bay 78
Greater Worthing 78
Sidmouth 78
Exmouth 76
Weston-super-Mare 75
Newquay 75
Whitstable/Herne Bay 74
Ilfracombe 74
Dawlish/Teignmouth 74
Southend-on-Sea 74
Minehead 74
Greater Bournemouth 74
St. Ives 73
Isle of Wight 73
Southport 73
Hastings/Bexhill 73
Scarborough 73
Burnham-on-Sea 73
Greater Brighton 72
Weymouth 72
Eastbourne 72
Torbay 72
Swanage 71
Bognor Regis 71
Whitby 71
Morecambe/Heysham 71
Greater Blackpool 70
Skegness 70
Deal 69
Penzance 69
Falmouth 68
Folkestone/Hythe 68
Lowestoft 68
Thanet 67
Bridlington 65
Great Yarmouth 65
Clacton 62
Seaside towns �2
North East 71
North West 72
Yorkshire and the Humber 74
East Midlands 76
West Midlands 73
East 77
London 69
South East 79
South West 78
England ��
Sources: Census of Population, Labour Force Survey, ONS mid-year population estimates
England’s Seaside Towns | 2�
Table �: Occupational Structure of residents in employment in England’s principal seaside towns, 2001 (ranked by share of managers and professionals)
% of workforce
Managers and professional
Other white collar
Skilled manual Other manual
Whitley Bay 33 32 8 27Greater Brighton 30 30 10 31Southport 28 27 11 35Sidmouth 27 22 15 36St Ives 26 20 17 36Southend-on-Sea 26 31 11 32Swanage 25 22 16 37Greater Bournemouth 25 28 13 35Dawlish/Teignmouth 25 25 14 36Greater Worthing 25 29 12 34Whitstable/Herne Bay 24 26 14 36Bognor Regis 24 25 13 38Greater Blackpool 24 27 11 38Eastbourne 24 26 13 37Weymouth 24 27 13 36Isle of Wight 23 23 15 39Weston-super-Mare 23 25 12 40Newquay 23 23 15 38Hastings/Bexhill 23 27 13 37Torbay 23 24 14 40Falmouth 22 23 15 39Thanet 22 24 13 41Exmouth 22 26 13 39Folkestone/Hythe 22 28 11 39Skegness 21 16 12 50Scarborough 21 22 14 43Deal 21 26 11 42Burnham-on-Sea 21 22 15 42Ilfracombe 21 18 16 45Penzance 21 21 16 42Minehead 20 19 14 47Bridlington 20 19 16 45Whitby 20 16 14 49Morecambe/Heysham 20 24 13 44Clacton 19 21 15 45Great Yarmouth 17 21 14 48Lowestoft 17 21 15 46
Seaside towns 2� 2� 12 ��
North East 21 25 12 41North West 24 26 12 38Yorkshire and the Humber
23 25 13 40
East Midlands 24 24 13 39West Midlands 24 25 13 38East 27 27 12 34London 32 33 8 26South East 30 28 11 31South West 25 26 13 36
England 2� 2� 12 ��
Source: Census of Population

2� | England’s Seaside Towns
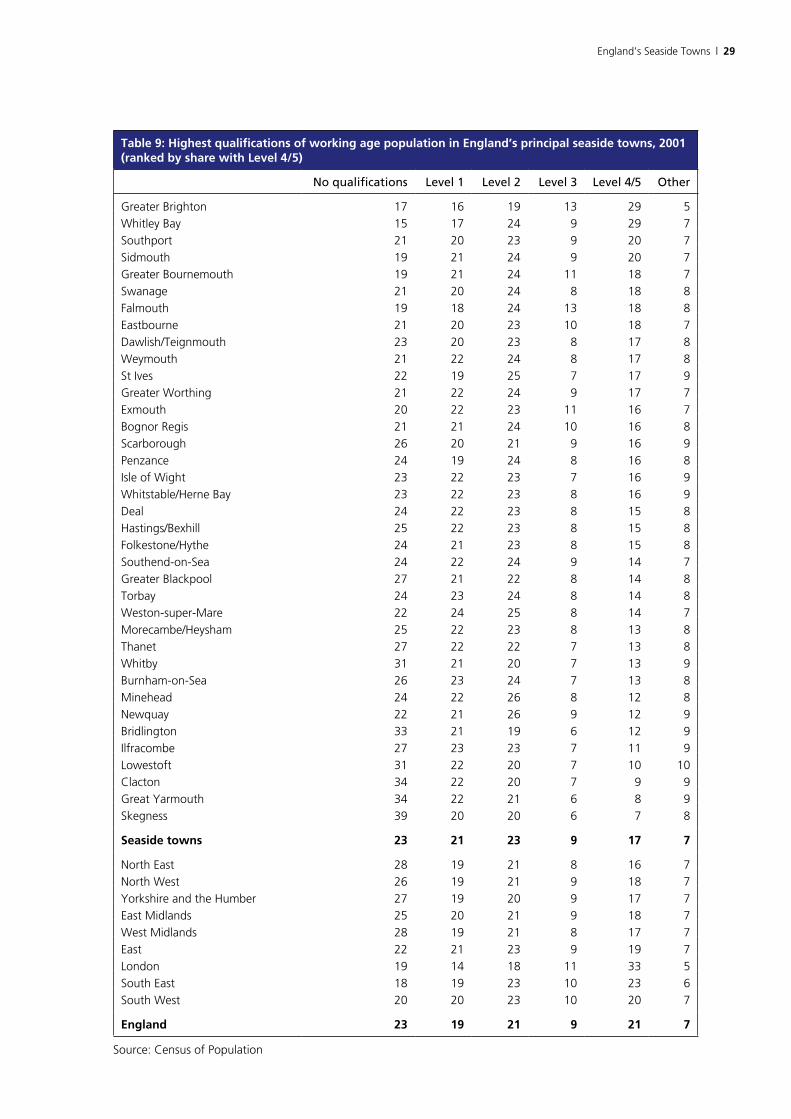
3.4 Skills and qualifications
Table 9 shows the highest qualifications of the working age population. These figures are taken from the 2001 Census. The Labour Force Survey data for small areas is insufficiently robust to allow reliable up-dating. The qualifications are grouped into standard ‘levels’:
Level 4/5 Degree or equivalent
Level 3 A levels, NVQ level 3 or equivalent
Level 2 5 O levels or good GCSEs, NVQ level 2 or equivalent
Level 1 Less than 5 O levels, good GCSEs or equivalent, NVQ level 1
Table 10 shows the estimated share of school pupils achieving 5 or more A*–C grades at GCSE in 2006.
The estimates refer to the pupils living in the towns, rather than the schools located there. The ward-based figures for seaside towns for 2002 have been up-dated by the percentage point change in the relevant district between 2002 and 200615. The published data for 2006 for small areas (LSOAs) has too many omissions to allow pupil performance in seaside towns to be measured directly.
Key points
• Across seaside towns as a whole, the level of qualifications of the workforce is not fundamentally different to the English average.
• Workers with the highest level of qualifications (Level 4/5) are under-represented in seaside towns (17 per cent of the workforce compared to 21 per cent for England as a whole) but not to any important extent compared to the averages for regions outside London and the South East (16–20 per cent).
• A number of seaside towns – Clacton, Great Yarmouth and Skegness in particular – do however have a very low proportion of workers with high-level qualifications. Greater Brighton and Whitley Bay are exceptional in having a share of highly qualified workers well in excess of the English average.
• In 13 seaside towns at least a quarter of the workforce has no formal qualifications – rising to nearly 40 per cent in Skegness.
• The estimated share of pupils in seaside towns achieving 5 or more A*–Cs at GCSE is marginally below the English average – 54 per cent compared to 58 per cent.
• None of the seaside towns have an especially low share achieving 5 A*–Cs, at least compared to some inner urban areas.
15 Where seaside towns straddle more than one district the figure is population-weighted.
England’s Seaside Towns | 2�
Table �: Highest qualifications of working age population in England’s principal seaside towns, 2001 (ranked by share with Level �/�)
No qualifications Level 1 Level 2 Level 3 Level 4/5 Other
Greater Brighton 17 16 19 13 29 5
Whitley Bay 15 17 24 9 29 7
Southport 21 20 23 9 20 7
Sidmouth 19 21 24 9 20 7
Greater Bournemouth 19 21 24 11 18 7
Swanage 21 20 24 8 18 8
Falmouth 19 18 24 13 18 8
Eastbourne 21 20 23 10 18 7
Dawlish/Teignmouth 23 20 23 8 17 8
Weymouth 21 22 24 8 17 8
St Ives 22 19 25 7 17 9
Greater Worthing 21 22 24 9 17 7
Exmouth 20 22 23 11 16 7
Bognor Regis 21 21 24 10 16 8
Scarborough 26 20 21 9 16 9
Penzance 24 19 24 8 16 8
Isle of Wight 23 22 23 7 16 9
Whitstable/Herne Bay 23 22 23 8 16 9
Deal 24 22 23 8 15 8
Hastings/Bexhill 25 22 23 8 15 8
Folkestone/Hythe 24 21 23 8 15 8
Southend-on-Sea 24 22 24 9 14 7
Greater Blackpool 27 21 22 8 14 8
Torbay 24 23 24 8 14 8
Weston-super-Mare 22 24 25 8 14 7
Morecambe/Heysham 25 22 23 8 13 8
Thanet 27 22 22 7 13 8
Whitby 31 21 20 7 13 9
Burnham-on-Sea 26 23 24 7 13 8
Minehead 24 22 26 8 12 8
Newquay 22 21 26 9 12 9
Bridlington 33 21 19 6 12 9
Ilfracombe 27 23 23 7 11 9
Lowestoft 31 22 20 7 10 10
Clacton 34 22 20 7 9 9
Great Yarmouth 34 22 21 6 8 9
Skegness 39 20 20 6 7 8
Seaside towns 2� 21 2� � 1� �
North East 28 19 21 8 16 7
North West 26 19 21 9 18 7
Yorkshire and the Humber 27 19 20 9 17 7
East Midlands 25 20 21 9 18 7
West Midlands 28 19 21 8 17 7
East 22 21 23 9 19 7
London 19 14 18 11 33 5
South East 18 19 23 10 23 6
South West 20 20 23 10 20 7
England 2� 1� 21 � 21 �
Source: Census of Population

�0 | England’s Seaside Towns
Table 10: Estimated share of pupils achieving � or more A*–C grades at GCSE in England’s principal seaside towns, 200�
%
Whitley Bay 81
Deal 69
Minehead 66
Sidmouth 65
St. Ives 65
Southport 65
Whitstable/Herne Bay 63
Swanage 63
Eastbourne 60
Southend-on-Sea 59
Weymouth 59
Folkestone/Hythe 59
Exmouth 56
Greater Bournemouth 56
Penzance 55
Newquay 55
Dawlish/Teignmouth 55
Greater Blackpool 55
Morecambe/Heysham 54
Greater Brighton 54
Thanet 54
Whitby 53
Greater Worthing 52
Falmouth 52
Bognor Regis 52
Bridlington 50
Scarborough 50
Burnham-on-Sea 50
Lowestoft 49
Torbay 48
Isle of Wight 48
Hastings/Bexhill 48
Weston-super-Mare 46
Ilfracombe 45
Skegness 44
Great Yarmouth 43
Clacton 41
Seaside towns ��
North East 57
North West 57
Yorkshire and the Humber 55
East Midlands 55
West Midlands 56
East of England 59
London 58
South East 60
South West 58
England ��
Source: DfES
England’s Seaside Towns | �1
3.5 Benefits
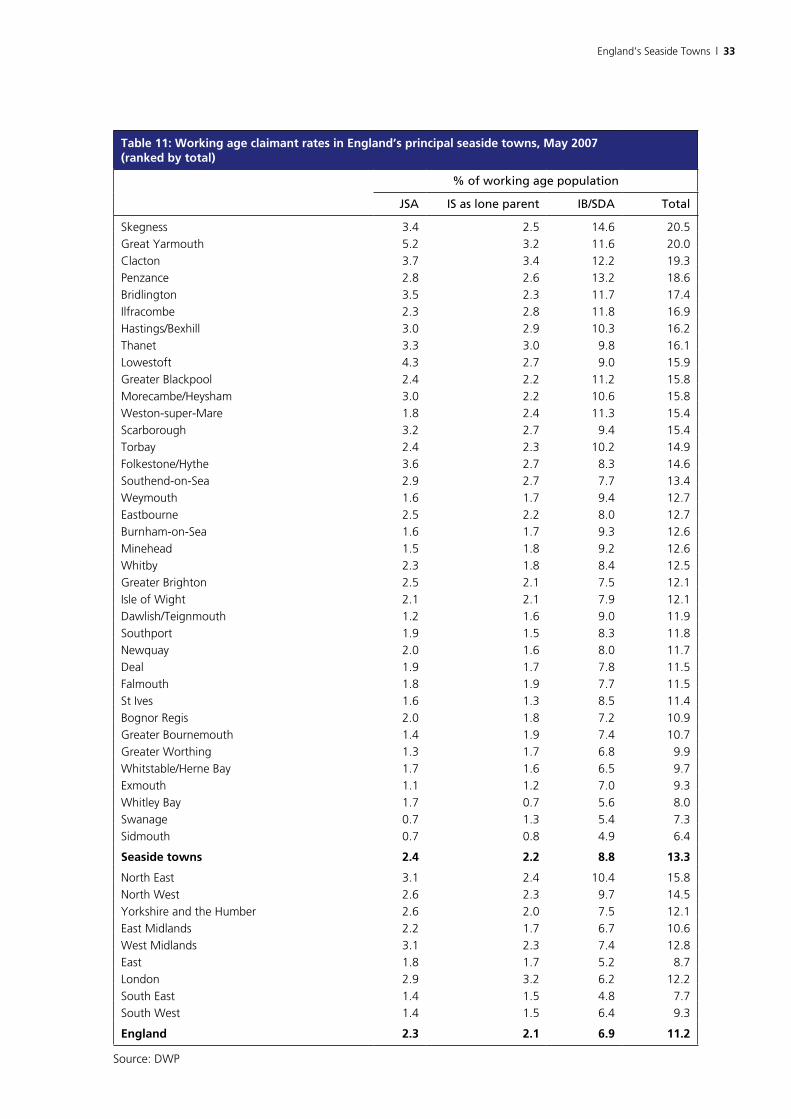
Table 11 shows the percentage of the working age population in May 2007 claiming each of the three main benefits for the non-employed – Jobseeker’s Allowance (JSA)16, Income Support (IS) paid to lone parents, and Incapacity Benefit/Severe Disablement Allowance (IB/SDA)17. These three benefits are mutually exclusive (ie an individual claimant cannot receive more than one at the same time) so there is no double-counting. Seaside towns are ranked by the total claimant rate of the three benefits.
In May 2007 there were 39,000 JSA claimants, 36,000 IS lone parent claimants and 147,000 IB/SDA claimants of working age in England’s 37 principal seaside towns. This compares to figures for England as a whole of 719,000 JSA claimants, 664,000 IS lone parent claimants and 2,166,000 IB/SDA claimants.
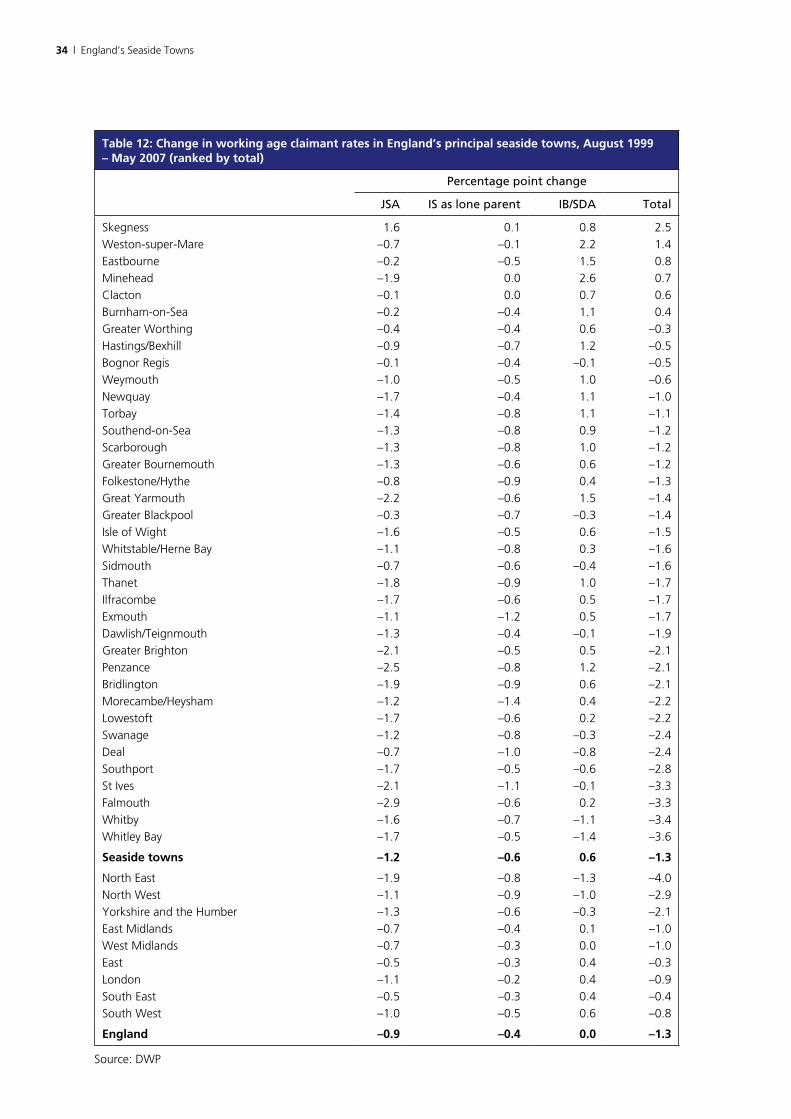
Table 12 shows the percentage point change in the claimant rate of each of these three working-age benefits between August 1999 and May 2007, the longest period for which ward-level data on all three benefits is available18. The seaside towns are ranked by the percentage point increase/decrease.
Over the August 1999 to May 2007 period there was a reduction in the 37 towns of 20,000 in the number of JSA claimants, of 10,000 in the number of IS lone parent claimants, and an increase of 9,000 in the number of IB/SDA claimants. This compares with a reduction of 284,000 JSA claimants and 142,000 IS lone parent claimants, and an increase of 5,000 IB/SDA claimants over the same period for England as a whole.
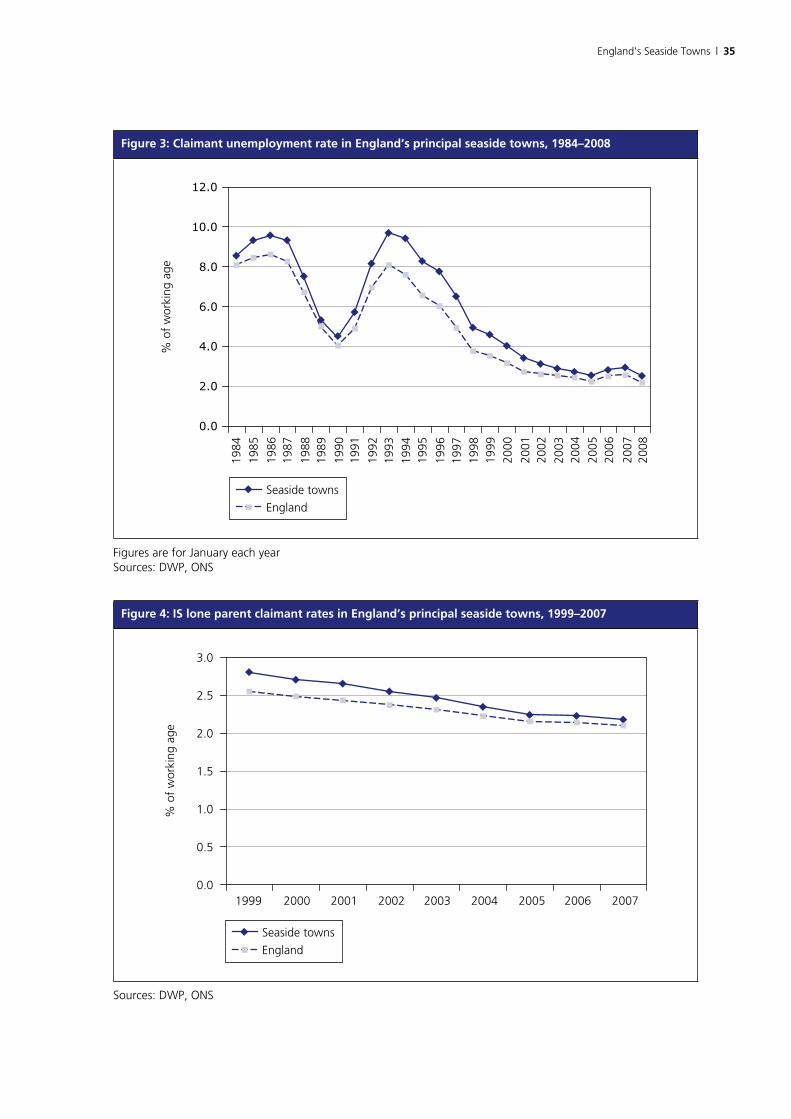
Figure 3 compares the average claimant unemployment rate in seaside towns and in England as a whole between 1984 and 200819. This is the longest period for which this data can be compiled.
Figure 4 compares the claimant rate for IS as a lone parent in seaside towns and in England as a whole between 1999 and 2007. The figures are for August each year except for 2007 (May). This is the longest period for which this data can be compiled.
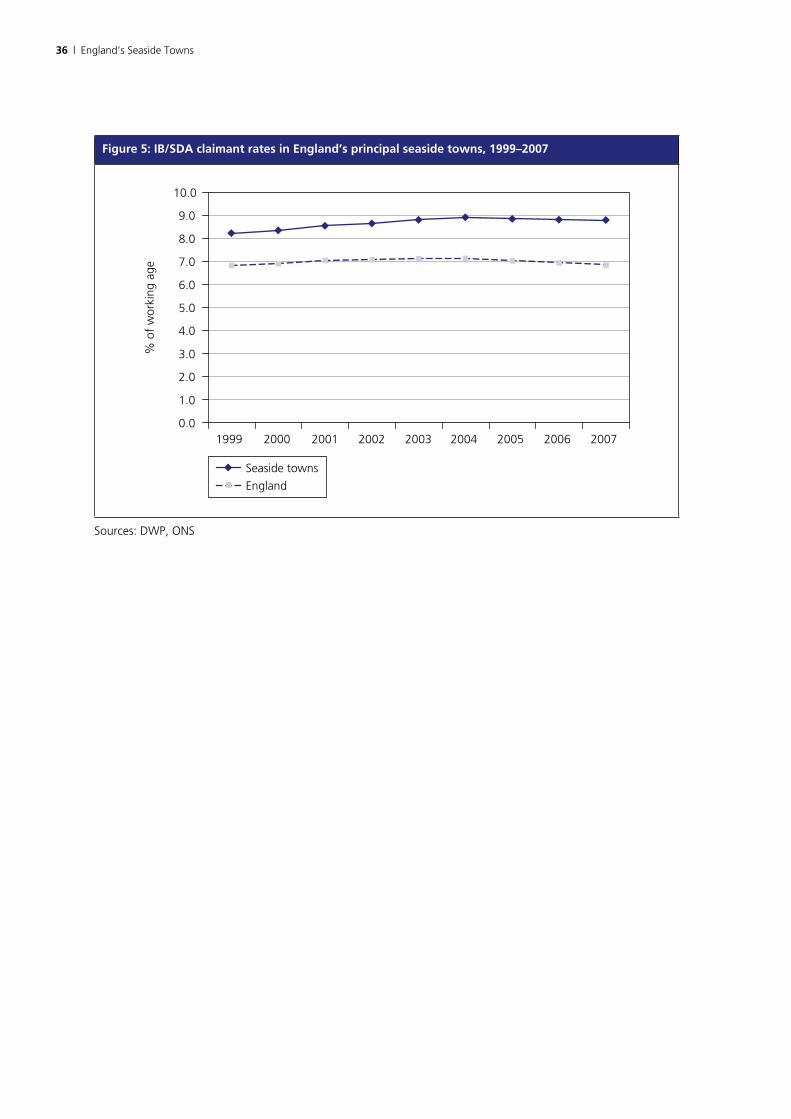
Figure 5 compares the IB/SDA claimant rate in seaside towns and in England as a whole between 1999 and 2007. Once more, the figures are for August (except 2007) and cover the longest period for which this data is available.
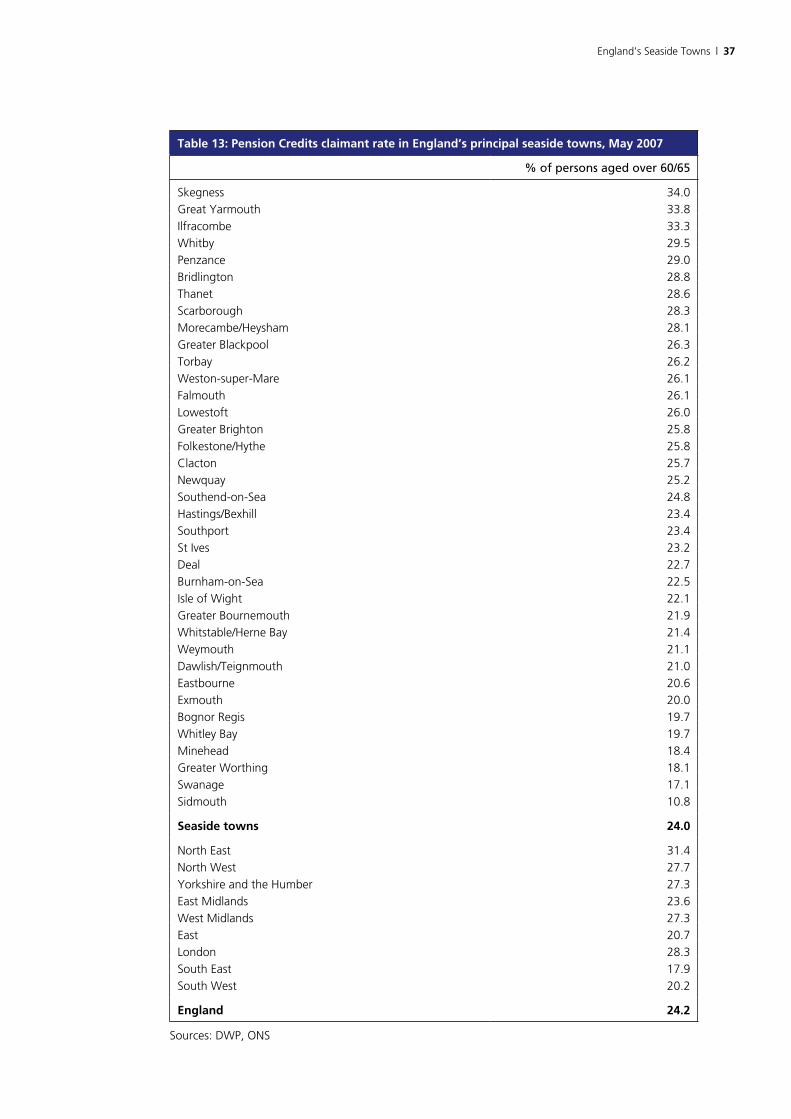
Table 13 shows the share of persons over state pension age (60 for women, 65 for men) claiming pension credits. Although take-up of pension credits
16 Because of the way records are held the figures for JSA claimants differ very marginally (by 0.1 per cent for seaside towns as a whole) from the claimant count unemployment figures.
17 The IB/SDA figures include IB claimants who fail to qualify for IB itself because of a poor National Insurance (NI) record and instead mostly receive IS with a disability premium. The Department for Work and Pensions (DWP) counts these as IB ‘NI credits only’ claimants and includes them in the headline IB figures. Severe Disablement Allowance is a benefit that is closed to new claimants, who now claim IB instead. The DWP also includes SDA claimants in the headline incapacity claimant numbers.
18 The working age population in 2006 is used as the denominator for these calculations.19 The working age population in 2006 is again used as the denominator. Changes in population over this period are not
sufficiently large for the use of a single denominator to introduce a significant distortion.
�2 | England’s Seaside Towns
is less than comprehensive, this is a useful guide to the distribution of pensioners living on low incomes.
Key points
• Across seaside towns as a whole the share of working age adults claiming the three main benefits for the non-employed is above average (13.3 per cent compared to 11.2 per cent in England as a whole).
• Incapacity claimants are by far the largest group of non-employed working age claimants. In England’s 37 principal seaside towns they account for 8.8 per cent of the working age population – or nearly one-in-eleven of all adults aged between 16 and state pension age.
• The average incapacity claimant rate in seaside towns is well ahead of the English average – 8.8 per cent compared to 6.9 per cent.
• The average claimant rates for Jobseeker’s Allowance and for Income Support as a lone parent are much closer to the English average (2.4 and 2.2 per cent respectively in seaside towns, compared to 2.3 and 2.1 per cent).
• There are important variations between seaside towns. The overall claimant rate is roughly three times higher in Skegness, Great Yarmouth and Clacton than in Swanage or Sidmouth.
• The IB/SDA claimant rate in Skegness is very high indeed – 14.6 per cent. If the town of Skegness were a district on its own, it would rank seventh on this indicator out of more than 400 districts across Britain as a whole, and second in England.
• In seaside towns the share of working age residents claiming the three main non-employed benefits fell by 1.3 percentage points between 1999 and 2007 – exactly the same rate as in England as a whole
• Between 1999 and 2007 the number of JSA and IS lone parent claimants in seaside towns fell slightly faster than average (1.2 and 0.6 percentage points compared to 0.9 and 0.4 percentage points in England as a whole) but the IB/SDA claimant rate rose by 0.6 percentage points whilst the England figure remained unchanged.
• Most seaside towns have shared in the reduction in claimant numbers, but there are a handful of exceptions.
• Claimant unemployment in England’s principal seaside towns has followed the national trend, but the gap between the rate in seaside towns and the English average has narrowed since the early 1990s.
• Around a quarter of seaside town resident over 60/65 draw on pension credits – much the same as the English average – but there are important differences between individual towns. Some of these differences are likely to reflect the scale of the influx of affluent retirees.
England’s Seaside Towns | ��
Table 11: Working age claimant rates in England’s principal seaside towns, May 200� (ranked by total)
% of working age population
JSA IS as lone parent IB/SDA Total
Skegness 3.4 2.5 14.6 20.5
Great Yarmouth 5.2 3.2 11.6 20.0
Clacton 3.7 3.4 12.2 19.3
Penzance 2.8 2.6 13.2 18.6
Bridlington 3.5 2.3 11.7 17.4
Ilfracombe 2.3 2.8 11.8 16.9
Hastings/Bexhill 3.0 2.9 10.3 16.2
Thanet 3.3 3.0 9.8 16.1
Lowestoft 4.3 2.7 9.0 15.9
Greater Blackpool 2.4 2.2 11.2 15.8
Morecambe/Heysham 3.0 2.2 10.6 15.8
Weston-super-Mare 1.8 2.4 11.3 15.4
Scarborough 3.2 2.7 9.4 15.4
Torbay 2.4 2.3 10.2 14.9
Folkestone/Hythe 3.6 2.7 8.3 14.6
Southend-on-Sea 2.9 2.7 7.7 13.4
Weymouth 1.6 1.7 9.4 12.7
Eastbourne 2.5 2.2 8.0 12.7
Burnham-on-Sea 1.6 1.7 9.3 12.6
Minehead 1.5 1.8 9.2 12.6
Whitby 2.3 1.8 8.4 12.5
Greater Brighton 2.5 2.1 7.5 12.1
Isle of Wight 2.1 2.1 7.9 12.1
Dawlish/Teignmouth 1.2 1.6 9.0 11.9
Southport 1.9 1.5 8.3 11.8
Newquay 2.0 1.6 8.0 11.7
Deal 1.9 1.7 7.8 11.5
Falmouth 1.8 1.9 7.7 11.5
St Ives 1.6 1.3 8.5 11.4
Bognor Regis 2.0 1.8 7.2 10.9
Greater Bournemouth 1.4 1.9 7.4 10.7
Greater Worthing 1.3 1.7 6.8 9.9
Whitstable/Herne Bay 1.7 1.6 6.5 9.7
Exmouth 1.1 1.2 7.0 9.3
Whitley Bay 1.7 0.7 5.6 8.0
Swanage 0.7 1.3 5.4 7.3
Sidmouth 0.7 0.8 4.9 6.4
Seaside towns 2.� 2.2 �.� 1�.�
North East 3.1 2.4 10.4 15.8
North West 2.6 2.3 9.7 14.5
Yorkshire and the Humber 2.6 2.0 7.5 12.1
East Midlands 2.2 1.7 6.7 10.6
West Midlands 3.1 2.3 7.4 12.8
East 1.8 1.7 5.2 8.7
London 2.9 3.2 6.2 12.2
South East 1.4 1.5 4.8 7.7
South West 1.4 1.5 6.4 9.3
England 2.� 2.1 �.� 11.2
Source: DWP
�� | England’s Seaside Towns
Table 12: Change in working age claimant rates in England’s principal seaside towns, August 1��� – May 200� (ranked by total)
Percentage point change
JSA IS as lone parent IB/SDA Total
Skegness 1.6 0.1 0.8 2.5
Weston-super-Mare –0.7 –0.1 2.2 1.4
Eastbourne –0.2 –0.5 1.5 0.8
Minehead –1.9 0.0 2.6 0.7
Clacton –0.1 0.0 0.7 0.6
Burnham-on-Sea –0.2 –0.4 1.1 0.4
Greater Worthing –0.4 –0.4 0.6 –0.3
Hastings/Bexhill –0.9 –0.7 1.2 –0.5
Bognor Regis –0.1 –0.4 –0.1 –0.5
Weymouth –1.0 –0.5 1.0 –0.6
Newquay –1.7 –0.4 1.1 –1.0
Torbay –1.4 –0.8 1.1 –1.1
Southend-on-Sea –1.3 –0.8 0.9 –1.2
Scarborough –1.3 –0.8 1.0 –1.2
Greater Bournemouth –1.3 –0.6 0.6 –1.2
Folkestone/Hythe –0.8 –0.9 0.4 –1.3
Great Yarmouth –2.2 –0.6 1.5 –1.4
Greater Blackpool –0.3 –0.7 –0.3 –1.4
Isle of Wight –1.6 –0.5 0.6 –1.5
Whitstable/Herne Bay –1.1 –0.8 0.3 –1.6
Sidmouth –0.7 –0.6 –0.4 –1.6
Thanet –1.8 –0.9 1.0 –1.7
Ilfracombe –1.7 –0.6 0.5 –1.7
Exmouth –1.1 –1.2 0.5 –1.7
Dawlish/Teignmouth –1.3 –0.4 –0.1 –1.9
Greater Brighton –2.1 –0.5 0.5 –2.1
Penzance –2.5 –0.8 1.2 –2.1
Bridlington –1.9 –0.9 0.6 –2.1
Morecambe/Heysham –1.2 –1.4 0.4 –2.2
Lowestoft –1.7 –0.6 0.2 –2.2
Swanage –1.2 –0.8 –0.3 –2.4
Deal –0.7 –1.0 –0.8 –2.4
Southport –1.7 –0.5 –0.6 –2.8
St Ives –2.1 –1.1 –0.1 –3.3
Falmouth –2.9 –0.6 0.2 –3.3
Whitby –1.6 –0.7 –1.1 –3.4
Whitley Bay –1.7 –0.5 –1.4 –3.6
Seaside towns –1.2 –0.� 0.� –1.�
North East –1.9 –0.8 –1.3 –4.0
North West –1.1 –0.9 –1.0 –2.9
Yorkshire and the Humber –1.3 –0.6 –0.3 –2.1
East Midlands –0.7 –0.4 0.1 –1.0
West Midlands –0.7 –0.3 0.0 –1.0
East –0.5 –0.3 0.4 –0.3
London –1.1 –0.2 0.4 –0.9
South East –0.5 –0.3 0.4 –0.4
South West –1.0 –0.5 0.6 –0.8
England –0.� –0.� 0.0 –1.�
Source: DWP
England’s Seaside Towns | ��
Figure �: Claimant unemployment rate in England’s principal seaside towns, 1���–200�
Seaside towns
England
0.0
2.0
4.0
6.0
8.0
10.0
12.0
1984
1985
1986
1987
1988
1989
1990
1991
1992
1993
1994
1995
1996
1997
1998
1999
2000
2001
2002
2003
2004
2005
2006
2007
2008
% o
f w
orki
ng a
ge
Figures are for January each yearSources: DWP, ONS
Figure �: IS lone parent claimant rates in England’s principal seaside towns, 1���–200�
Seaside towns
England
0.0
0.5
1.0
1.5
2.0
2.5
3.0
1999 2000 2001 2002 2003 2004 2005 2006 2007
% o
f w
orki
ng a
ge
Sources: DWP, ONS
�� | England’s Seaside Towns
Figure �: IB/SDA claimant rates in England’s principal seaside towns, 1���–200�
Seaside towns
England
0.0
1.0
2.0
3.0
4.0
5.0
6.0
7.0
8.0
9.0
10.0
1999 2000 2001 2002 2003 2004 2005 2006 2007
% o
f w
orki
ng a
ge
Sources: DWP, ONS
England’s Seaside Towns | ��
Table 1�: Pension Credits claimant rate in England’s principal seaside towns, May 200�
% of persons aged over 60/65
Skegness 34.0
Great Yarmouth 33.8
Ilfracombe 33.3
Whitby 29.5
Penzance 29.0
Bridlington 28.8
Thanet 28.6
Scarborough 28.3
Morecambe/Heysham 28.1
Greater Blackpool 26.3
Torbay 26.2
Weston-super-Mare 26.1
Falmouth 26.1
Lowestoft 26.0
Greater Brighton 25.8
Folkestone/Hythe 25.8
Clacton 25.7
Newquay 25.2
Southend-on-Sea 24.8
Hastings/Bexhill 23.4
Southport 23.4
St Ives 23.2
Deal 22.7
Burnham-on-Sea 22.5
Isle of Wight 22.1
Greater Bournemouth 21.9
Whitstable/Herne Bay 21.4
Weymouth 21.1
Dawlish/Teignmouth 21.0
Eastbourne 20.6
Exmouth 20.0
Bognor Regis 19.7
Whitley Bay 19.7
Minehead 18.4
Greater Worthing 18.1
Swanage 17.1
Sidmouth 10.8
Seaside towns 2�.0
North East 31.4
North West 27.7
Yorkshire and the Humber 27.3
East Midlands 23.6
West Midlands 27.3
East 20.7
London 28.3
South East 17.9
South West 20.2
England 2�.2
Sources: DWP, ONS
�� | England’s Seaside Towns
3.6 Seasonal unemployment
Table 14 shows the average annual fluctuation in the claimant unemployment rate20 between January and July in each seaside town, over the period 2001–07. The towns are ranked according to the scale of the seasonal fluctuation.
Figure 6 shows the quarterly claimant unemployment rate in seaside towns for the period January 2001 to January 2008.
Key points
• There is a seasonal cycle in claimant unemployment in seaside towns, but on average this is not large – just 0.5 percentage points.
• Only four seaside towns – Skegness, Newquay, St Ives and Great Yarmouth – experience a seasonal fluctuation of two percentage points or more, and the first three of these towns are quite small.
• 27 of the 37 seaside towns experience seasonal fluctuations in claimant unemployment of less than one percentage point.
• A number of seaside towns, including Greater Bournemouth, Greater Brighton and Greater Worthing (three of the four largest in population terms) experience seasonal fluctuations in claimant unemployment that are the same or less than the average for England as a whole.
• The scale of recent seasonal fluctuations in claimant unemployment in seaside towns is a little smaller than in the first part of the present decade. This is consistent with earlier evidence21.
20 Using the 2006 working age population as the denominator.21 C Beatty, S Fothergill and R Powell (2006) Coastal Proofing the Benefits System, report to Lincolnshire Coastal Action Zone,
CRESR, Sheffield Hallam University.
England’s Seaside Towns | ��
Table 1�: Average seasonal fluctuation in claimant unemployment rates in England’s principal seaside towns, 2001–200�
Percentage points
Skegness 2.6
Newquay 2.3
St. Ives 2.2
Great Yarmouth 2.0
Ilfracombe 1.8
Minehead 1.7
Whitby 1.5
Bridlington 1.2
Isle of Wight 1.2
Scarborough 1.0
Penzance 0.9
Greater Blackpool 0.8
Weymouth 0.7
Torbay 0.7
Lowestoft 0.6
Morecambe and Heysham 0.6
Clacton 0.6
Dawlish/Teignmouth 0.5
Exmouth 0.5
Swanage 0.5
Falmouth 0.4
Burnham-on-Sea 0.4
Deal 0.4
Thanet 0.4
Hastings/Bexhill 0.4
Folkestone/Hythe 0.3
Sidmouth 0.3
Southend-on-Sea 0.3
Whitley Bay 0.3
Southport 0.3
Bognor Regis 0.3
Whitstable/Herne Bay 0.2
Weston-super-Mare 0.2
Greater Bournemouth 0.2
Greater Brighton 0.2
Eastbourne 0.2
Greater Worthing 0.1
Seaside towns 0.�
North East 0.4
North West 0.2
Yorkshire and the Humber 0.2
East Midlands 0.2
West Midlands 0.1
East of England 0.1
London 0.1
South East 0.1
South West 0.2
England 0.2
Sources: DWP, ONS
�0 | England’s Seaside Towns
Figure �: Seasonal fluctuations in claimant unemployment rate in England’s principal seaside towns, 2001–200�
Seaside towns
England
0.0
0.5
1.0
1.5
2.0
2.5
3.0
3.5
4.0
Jan-
01A
pr-0
1Ju
l-01
Oct
-01
Jan-
02A
pr-0
2Ju
l-02
Oct
-02
Jan-
03A
pr-0
3Ju
l-03
Oct
-03
Jan-
04A
pr-0
4Ju
l-04
Oct
-04
Jan-
05A
pr-0
5Ju
l-05
Oct
-05
Jan-
06A
pr-0
6Ju
l-06
Oct
-06
Jan-
07A
pr-0
7Ju
l-07
Oct
-07
Jan-
08
Une
mpl
oym
ent
rate
(% o
f w
orki
ng a
ge)
Sources: DWP, ONS
3.7 Earnings
Table 15 provides a guide to the median hourly earnings of men and women in England’s principal seaside towns in 2007.
In the absence of ward-level earnings data, these figures are for the district containing the seaside town22. Where the seaside town forms only a small part of the district the figures are therefore unlikely to be wholly reliable, but there are a number of towns (eg Eastbourne, Southend-on-Sea, Torbay) where the match with district boundaries is much closer.
The earnings figures are for seaside town residents. Commuting flows mean that the earnings from employment in the town itself will in some cases differ substantially.
Key points
• The hourly earnings of seaside town residents, both male and female, are on average 7–8 per cent below the English average.
22 Where a seaside town straddles more than one district, the figure is a population-weighted average.

England’s Seaside Towns | �1
• The high figures for Weston-super-Mare, Greater Brighton and Southend-on-Sea are likely to be inflated by commuters (to London in two cases). The high figure for Bridlington is unreliable because the town is only a small part of its district (East Riding of Yorkshire).
• Earnings appear especially low in three small seaside towns in Cornwall – Penzance, St Ives and Newquay23.
• In the vast majority of seaside towns, average hourly earnings for both men and women appear to be below the average for the region of which they form part – though precise comparisons are hampered because of the reliance on district data.
23 The figures for Penzance and St Ives are the same because they are both part of Penwith district. Whitby and Scarborough also have the same figures because they are both part of Scarborough district, and Exmouth and Sidmouth because they are both part of East Devon.
�2 | England’s Seaside Towns
Table 1�: Median hourly earnings in England’s principal seaside towns, 200�
Male Female
Weston-super-Mare 13.45 Greater Brighton 10.33
Greater Brighton 12.32 Southend-on-Sea 9.29
Bridlington 12.05 Weston-super-Mare 9.17
Southend-on-Sea 12.03 Eastbourne 8.94
Deal 11.86 Greater Worthing 8.73
Morecambe/Heysham 11.76 Southport 8.72
Southport 11.76 Deal 8.62
Whitstable/Herne Bay 11.67 Whitstable/Herne Bay 8.62
Folkestone/Hythe 11.51 Bognor Regis 8.56
Greater Worthing 11.29 Clacton 8.55
Greater Bournemouth 10.96 Exmouth 8.52
Eastbourne 10.93 Sidmouth 8.52
Burnham-on-Sea 10.71 Falmouth 8.35
Greater Blackpool 10.66 Greater Bournemouth 8.28
Clacton 10.65 Folkestone/Hythe 8.23
Hastings/Bexhill 10.60 Morecambe/Heysham 8.13
Isle of Wight 10.47 Bridlington 8.09
Thanet 10.35 Hastings/Bexhill 8.04
Falmouth 10.35 Dawlish/Teignmouth 8.03
Whitley Bay 10.31 Thanet 8.01
Bognor Regis 10.24 Weymouth 8.00
Exmouth 10.03 Greater Blackpool 7.96
Sidmouth 10.03 Whitley Bay 7.85
Dawlish/Teignmouth 9.68 Newquay 7.74
Scarborough 9.56 Skegness 7.61
Whitby 9.56 Burnham-on-Sea 7.56
Great Yarmouth 9.55 Ilfracombe 7.45
Lowestoft 9.47 Lowestoft 7.43
Ilfracombe 9.21 Isle of Wight 7.38
Weymouth 9.05 Torbay 7.28
Torbay 9.03 Great Yarmouth 7.23
Skegness 8.95 Scarborough 7.15
Newquay 8.63 Whitby 7.15
Penzance 8.23 Penzance 6.94
St Ives 8.23 St Ives 6.94
Minehead * Minehead *
Swanage * Swanage *
Seaside towns 10.�� Seaside towns �.��
North East 10.39 North East 8.03
North West 11.09 North West 8.50
Yorkshire and the Humber 10.66 Yorkshire and the Humber 8.11
East Midlands 10.93 East Midlands 8.19
West Midlands 10.95 West Midlands 8.37
East 12.37 East 8.96
London 14.32 London 12.38
South East 13.24 South East 9.80
South West 11.15 South West 8.43
England 11.�0 England �.0�
* not availableNB: Figures refer to districts covering seaside townsSource: Annual Survey of Hours and Earnings
England’s Seaside Towns | ��
3.8 Business stock
Table 16 shows the number of VAT registered businesses (per 10,000 residents) in seaside towns in 2006 and the number of new VAT registrations (again per 10,000 residents) in that year.
These are indicators of the scale of entrepreneurial activity. The figures exclude very small businesses below the VAT threshold. The nature of some of the businesses serving the seaside tourist industry (small B&Bs, kiosks etc) would suggest that these excluded businesses below the VAT threshold may be quite numerous in seaside towns. Some towns may be affected more than others by this exclusion.
Key points
• In relation to population, the stock of VAT registered businesses in England’s principal seaside towns is a little lower than the English average. The figure for England as a whole is however boosted by London. The average for seaside towns (293 per 10,000) is actually not radically out-of-line with the other English regions (193–373 per 10,000).
• There are sizeable variations between seaside towns in the stock of businesses per 10,000 residents. The low business stock figures for Southport and Whitley Bay are likely to owe something to their role as commuter settlements for Merseyside and Tyneside respectively.
• The top ten slots in terms of the stock of businesses per 10,000 residents are all filled by small seaside towns in the South West.
• The rate of new VAT registrations in England’s principal seaside towns is a little below the English average, though again not greatly out-of-line with the figures for several regions outside London.
• Although there are differences between seaside towns in the rate of new VAT registrations, all bar a few towns fall into a fairly narrow range.
• Greater Brighton and Greater Bournemouth – the two very largest seaside towns in terms of population – have the two highest rates of new VAT registrations (38 and 36 per 10,000 residents respectively).

�� | England’s Seaside Towns
Table 1�: VAT registered businesses in England’s principal seaside towns, 200� (ranked by stock per 10,000 residents)
Stock of VAT registered business per 10,000 residents
New VAT registrations in 2006 per 10,000 residents
Ilfracombe 477 32Minehead 456 23Exmouth 402 30Sidmouth 402 30Falmouth 391 35Dawlish/Teignmouth 376 31Burnham-on-Sea 375 31Penzance 370 30St. Ives 370 30Swanage 365 25Skegness 359 25Greater Brighton 351 38Bridlington 337 29Greater Bournemouth 331 36Scarborough 324 23Whitby 324 23Newquay 321 31Weston-super-Mare 321 31Southend-on-Sea 302 31Bognor Regis 299 25Folkstone/Hythe 292 29Greater Worthing 287 26Isle of Wight 284 23Hastings/Bexhill 280 24Whitstable/Herne Bay 275 27Greater Blackpool 263 24Torbay 262 24Great Yarmouth 262 21Lowestoft 258 21Morecambe/Heysham 253 19Clacton 251 21Deal 244 23Eastbourne 239 25Weymouth 218 22Thanet 211 23Southport 208 19Whitley Bay 169 20
Seaside towns 2�� 2�
North East 193 18North West 271 26Yorkshire and the Humber 272 25East Midlands 307 28West Midlands 307 28East 350 31London 412 46South East 373 35South West 358 31
England �2� �1
NB: Figures refer to districts covering seaside townsSource: DBERR
England’s Seaside Towns | ��
3.9 Migrant workers
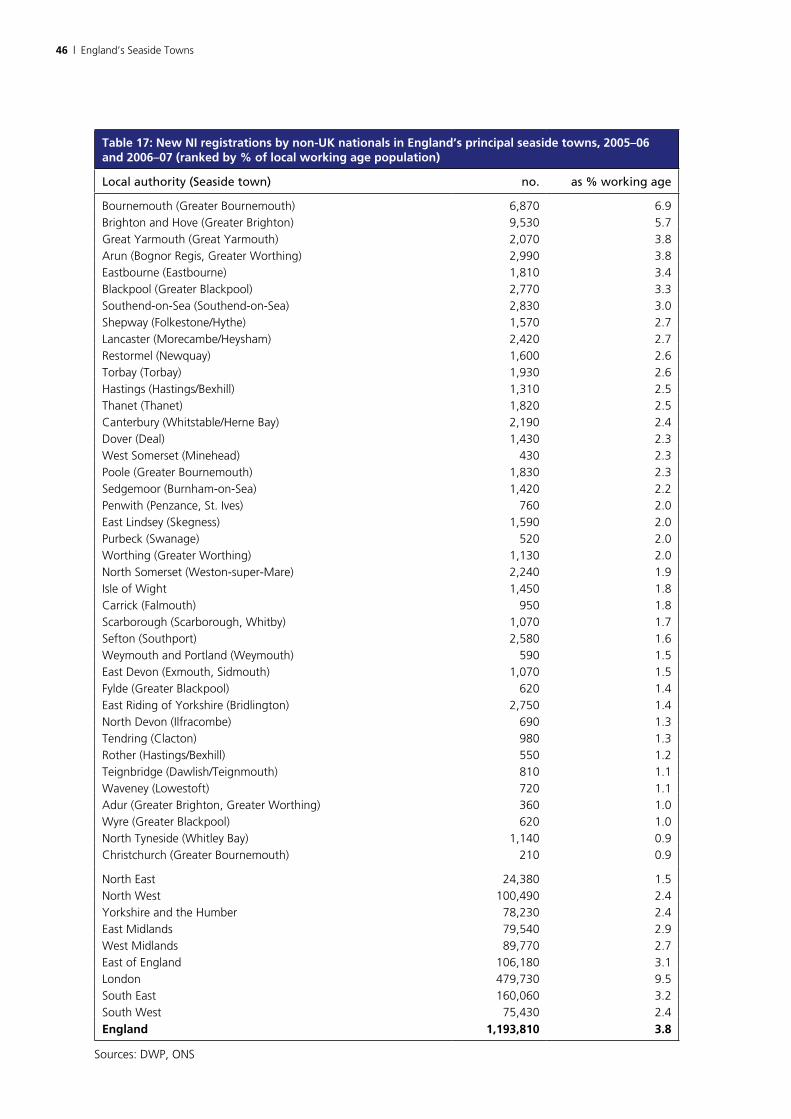
Table 17 shows the total number of new National Insurance registrations by non-UK nationals in 2005–06 and 2006–07 in each of the districts that include the whole or part of one of England’s 37 principal seaside towns. The table also expresses these numbers as a percentage of the working age population24 in the district.
These figures record where migrant workers were living at the time they first registered. They do not necessarily reflect where they are still living, or even whether they remain in the UK. At the present time, however, they are the only systematic local figures available on migrant workers.
Ward-level figures are not available to allow the seaside towns themselves to be distinguished and it is likely that the distribution of migrant workers within each district will be skewed to the places where appropriate accommodation and jobs are readily available. Seaside towns are often able to offer this accommodation, for example in sub-divided former boarding houses and on caravan sites. The seaside tourist economy is also likely to be a prime employer of migrant workers, for example in hotels and catering, bearing in mind the low-wage and often temporary nature of this work. It is therefore likely that where a seaside town forms only a small part of a district the figure will understate the number of migrant workers relative to the seaside town’s working age population.
Key points
• Most of the districts covering seaside towns have attracted rather fewer migrant workers, in relation to their population, than the English average.
• The English average is however biased by London. Most seaside town districts are not radically out-of-line with the averages for regions outside London.
• Bournemouth and Brighton, the districts at the core of the two largest seaside towns, have attracted the greatest number of migrant workers, not only in absolute terms but also in relation to their working age population.
• Great Yarmouth’s high figure may reflect its role as a residential base for migrant agricultural workers in Norfolk and Suffolk.
24 2006 data
�� | England’s Seaside Towns
Table 1�: New NI registrations by non-UK nationals in England’s principal seaside towns, 200�–0� and 200�–0� (ranked by % of local working age population)
Local authority (Seaside town) no. as % working age
Bournemouth (Greater Bournemouth) 6,870 6.9Brighton and Hove (Greater Brighton) 9,530 5.7Great Yarmouth (Great Yarmouth) 2,070 3.8Arun (Bognor Regis, Greater Worthing) 2,990 3.8Eastbourne (Eastbourne) 1,810 3.4Blackpool (Greater Blackpool) 2,770 3.3Southend-on-Sea (Southend-on-Sea) 2,830 3.0Shepway (Folkestone/Hythe) 1,570 2.7Lancaster (Morecambe/Heysham) 2,420 2.7Restormel (Newquay) 1,600 2.6Torbay (Torbay) 1,930 2.6Hastings (Hastings/Bexhill) 1,310 2.5Thanet (Thanet) 1,820 2.5Canterbury (Whitstable/Herne Bay) 2,190 2.4Dover (Deal) 1,430 2.3West Somerset (Minehead) 430 2.3Poole (Greater Bournemouth) 1,830 2.3Sedgemoor (Burnham-on-Sea) 1,420 2.2Penwith (Penzance, St. Ives) 760 2.0East Lindsey (Skegness) 1,590 2.0Purbeck (Swanage) 520 2.0Worthing (Greater Worthing) 1,130 2.0North Somerset (Weston-super-Mare) 2,240 1.9Isle of Wight 1,450 1.8Carrick (Falmouth) 950 1.8Scarborough (Scarborough, Whitby) 1,070 1.7Sefton (Southport) 2,580 1.6Weymouth and Portland (Weymouth) 590 1.5East Devon (Exmouth, Sidmouth) 1,070 1.5Fylde (Greater Blackpool) 620 1.4East Riding of Yorkshire (Bridlington) 2,750 1.4North Devon (Ilfracombe) 690 1.3Tendring (Clacton) 980 1.3Rother (Hastings/Bexhill) 550 1.2Teignbridge (Dawlish/Teignmouth) 810 1.1Waveney (Lowestoft) 720 1.1Adur (Greater Brighton, Greater Worthing) 360 1.0Wyre (Greater Blackpool) 620 1.0North Tyneside (Whitley Bay) 1,140 0.9Christchurch (Greater Bournemouth) 210 0.9
North East 24,380 1.5North West 100,490 2.4Yorkshire and the Humber 78,230 2.4East Midlands 79,540 2.9West Midlands 89,770 2.7East of England 106,180 3.1London 479,730 9.5South East 160,060 3.2South West 75,430 2.4England 1,1��,�10 �.�
Sources: DWP, ONS
England’s Seaside Towns | ��
3.10 Economic output
Table 18 shows Gross Value Added (GVA) per head.
The figures here refer to the NUTS 3 region25 covering each seaside town, rather than the town itself, and generally cover a much larger area. NUTS 3 is the lowest level for which this data is produced.
GVA is a measure of the economic output of an area. In so far as some of the output of the tourist industry falls within the ‘black economy’, and therefore goes unrecorded, and in so far as omissions of this type are more widespread in seaside towns than in the rest of the country, the figures will understate the GVA of seaside towns.
The GVA figures presented here are expressed in relation to the resident population. Commuting has the effect of boosting the recorded GVA per head in areas with net in-commuting (eg London) and lowering the recorded GVA per head in areas with net out-commuting (which includes some seaside towns). In addition, a large retired population – a feature of virtually all seaside towns – lowers GVA per head relative to other areas.
Key points
• GVA per head in the areas containing seaside towns is nearly 20 per cent below the English average – though there are statistical distortions (see above) that are likely to accentuate the difference26.
• In comparison to the averages for regions outside London, the disparities are not so large.
• With the exception of Weston-super-Mare, every one of England’s principal seaside towns is located in an area where GVA per head is below the English average.
• Three of the four largest seaside towns – Greater Bournemouth, Greater Brighton and Greater Worthing – have a GVA per head towards the top end of the range.
25 NUTS 3 regions are part of a standard EU-wide classification. In the UK, a NUTS 3 region is typically a unitary authority (eg Blackpool, Brighton and Hove) or a county (eg West Sussex, Dorset). Where a seaside town straddles more than one NUTS 3 region, the figure quoted here is a population-weighted average.
26 The figure for seaside towns as a whole is weighed by the population of the towns rather than the NUTS 3 region of which they form part.
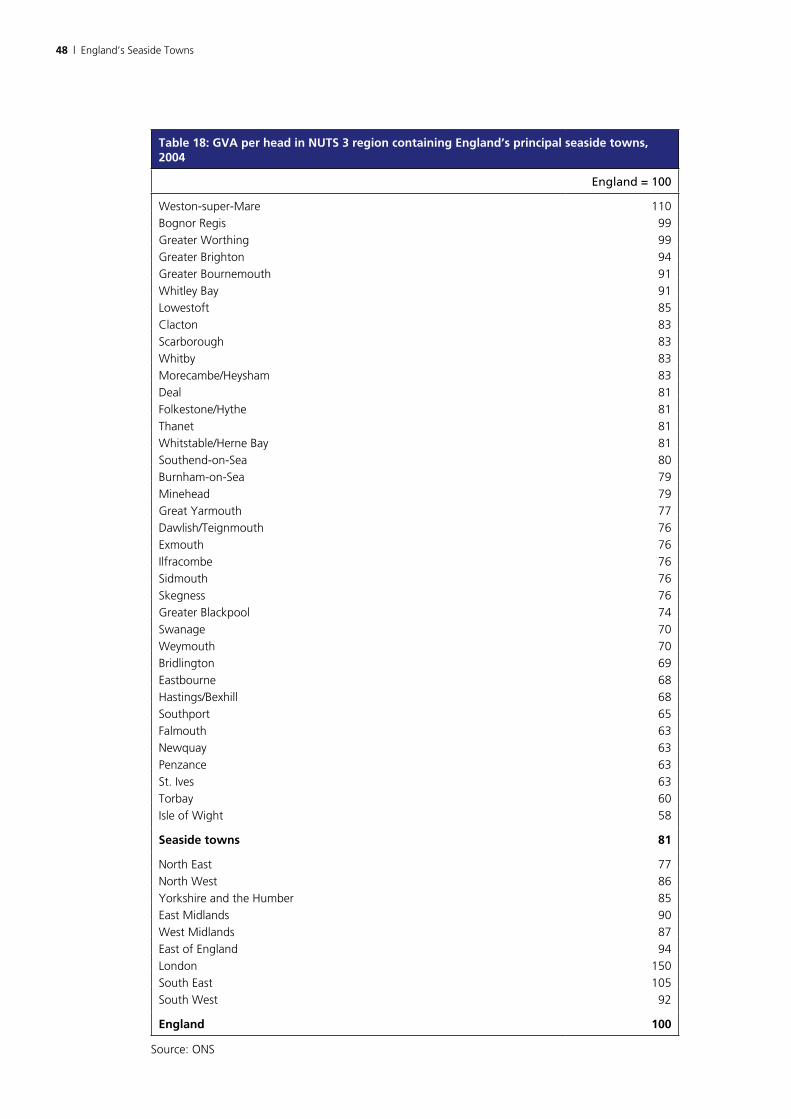
�� | England’s Seaside Towns
Table 1�: GVA per head in NUTS � region containing England’s principal seaside towns, 200�
England = 100
Weston-super-Mare 110
Bognor Regis 99
Greater Worthing 99
Greater Brighton 94
Greater Bournemouth 91
Whitley Bay 91
Lowestoft 85
Clacton 83
Scarborough 83
Whitby 83
Morecambe/Heysham 83
Deal 81
Folkestone/Hythe 81
Thanet 81
Whitstable/Herne Bay 81
Southend-on-Sea 80
Burnham-on-Sea 79
Minehead 79
Great Yarmouth 77
Dawlish/Teignmouth 76
Exmouth 76
Ilfracombe 76
Sidmouth 76
Skegness 76
Greater Blackpool 74
Swanage 70
Weymouth 70
Bridlington 69
Eastbourne 68
Hastings/Bexhill 68
Southport 65
Falmouth 63
Newquay 63
Penzance 63
St. Ives 63
Torbay 60
Isle of Wight 58
Seaside towns �1
North East 77
North West 86
Yorkshire and the Humber 85
East Midlands 90
West Midlands 87
East of England 94
London 150
South East 105
South West 92
England 100
Source: ONS

England’s Seaside Towns | ��
3.11 Housing
Table 19 shows the housing tenure in seaside towns, from the 2001 Census, ranked by the share of owner-occupiers. These are the most up-to-date local figures available.
Table 20 shows the share of households living in overcrowded conditions, again from the 2001 Census. The measure of overcrowding used here is the official standard: the figures are the share of households with an ‘occupancy rating of minus 1 or less’, where the occupancy rating is based on a comparison between the number of rooms and the size and age composition of the household.
Table 21 shows the share of households lacking key amenities – defined as sole use of a bathroom/shower and toilet or central heating. The figures are again from the 2001 Census.
Key points
• Overall, England’s seaside towns have an unusual pattern of housing tenure: a slightly above average share of owner-occupiers, a markedly low share in social rented accommodation (council or housing association) and a distinctly above average share in private rented accommodation.
• In terms of the share in private rented accommodation, seaside towns are more alike London than any of the other English regions.
• There are however important differences between places. Nine seaside towns, including Greater Brighton, have a share in owner-occupation below the English average. Great Yarmouth stands out as having an unusually high share in social housing by the standards of seaside towns.
• The share of households in seaside towns living in overcrowded conditions is low. Two-thirds of seaside towns have an overcrowding rate below the English average, but the English average is inflated by London. By the standards of regions outside London, seaside towns are fairly average.
• Greater Brighton stands out as having a higher overcrowding rate than other seaside towns. This may owe something to Brighton’s high population of young people and students.
• On average, a slightly higher proportion of households lack basic amenities in seaside towns, but this disguises huge variations between individual towns.
• Because the ‘lack of basic amenities’ figures is in practice greatly influenced by the absence of central heating, the presence of five towns in Cornwall or Devon among the top six may reflect a milder climate more than social disadvantage. The two towns at the top of the list – Penzance and St Ives, both in the very far south west of Cornwall – arguably have the mildest climate of all.
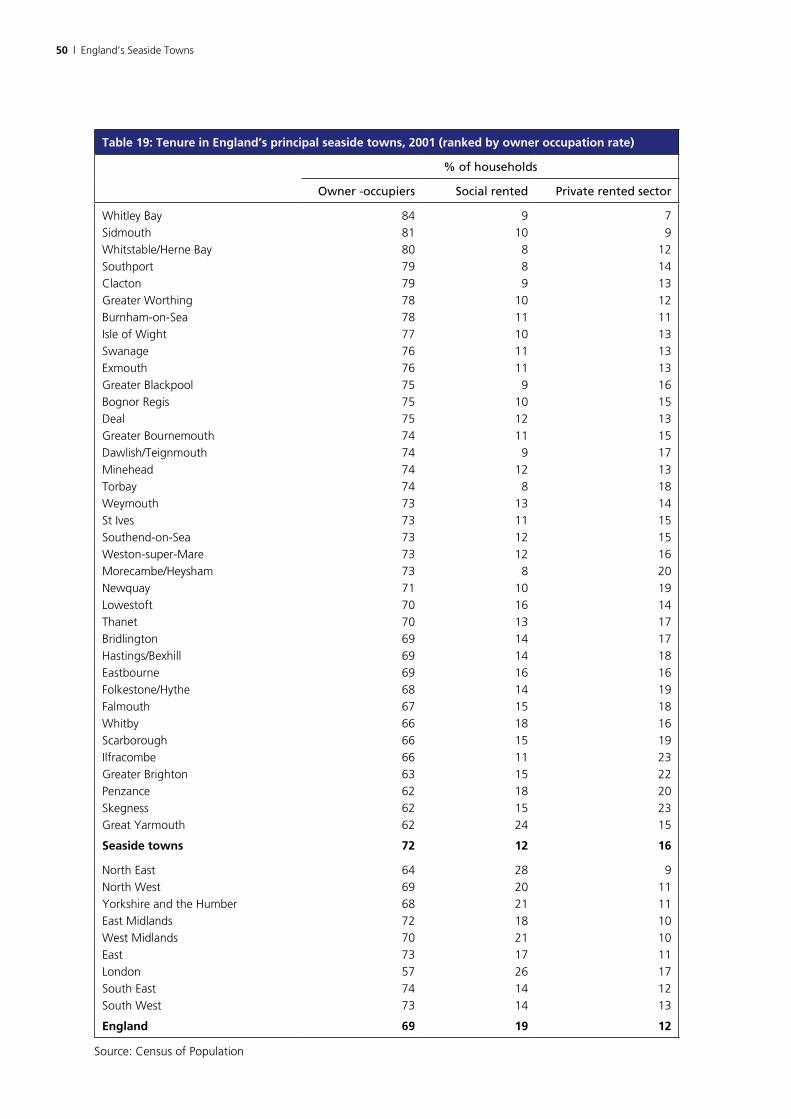
�0 | England’s Seaside Towns
Table 1�: Tenure in England’s principal seaside towns, 2001 (ranked by owner occupation rate)
% of households
Owner -occupiers Social rented Private rented sector
Whitley Bay 84 9 7
Sidmouth 81 10 9
Whitstable/Herne Bay 80 8 12
Southport 79 8 14
Clacton 79 9 13
Greater Worthing 78 10 12
Burnham-on-Sea 78 11 11
Isle of Wight 77 10 13
Swanage 76 11 13
Exmouth 76 11 13
Greater Blackpool 75 9 16
Bognor Regis 75 10 15
Deal 75 12 13
Greater Bournemouth 74 11 15
Dawlish/Teignmouth 74 9 17
Minehead 74 12 13
Torbay 74 8 18
Weymouth 73 13 14
St Ives 73 11 15
Southend-on-Sea 73 12 15
Weston-super-Mare 73 12 16
Morecambe/Heysham 73 8 20
Newquay 71 10 19
Lowestoft 70 16 14
Thanet 70 13 17
Bridlington 69 14 17
Hastings/Bexhill 69 14 18
Eastbourne 69 16 16
Folkestone/Hythe 68 14 19
Falmouth 67 15 18
Whitby 66 18 16
Scarborough 66 15 19
Ilfracombe 66 11 23
Greater Brighton 63 15 22
Penzance 62 18 20
Skegness 62 15 23
Great Yarmouth 62 24 15
Seaside towns �2 12 1�
North East 64 28 9
North West 69 20 11
Yorkshire and the Humber 68 21 11
East Midlands 72 18 10
West Midlands 70 21 10
East 73 17 11
London 57 26 17
South East 74 14 12
South West 73 14 13
England �� 1� 12
Source: Census of Population
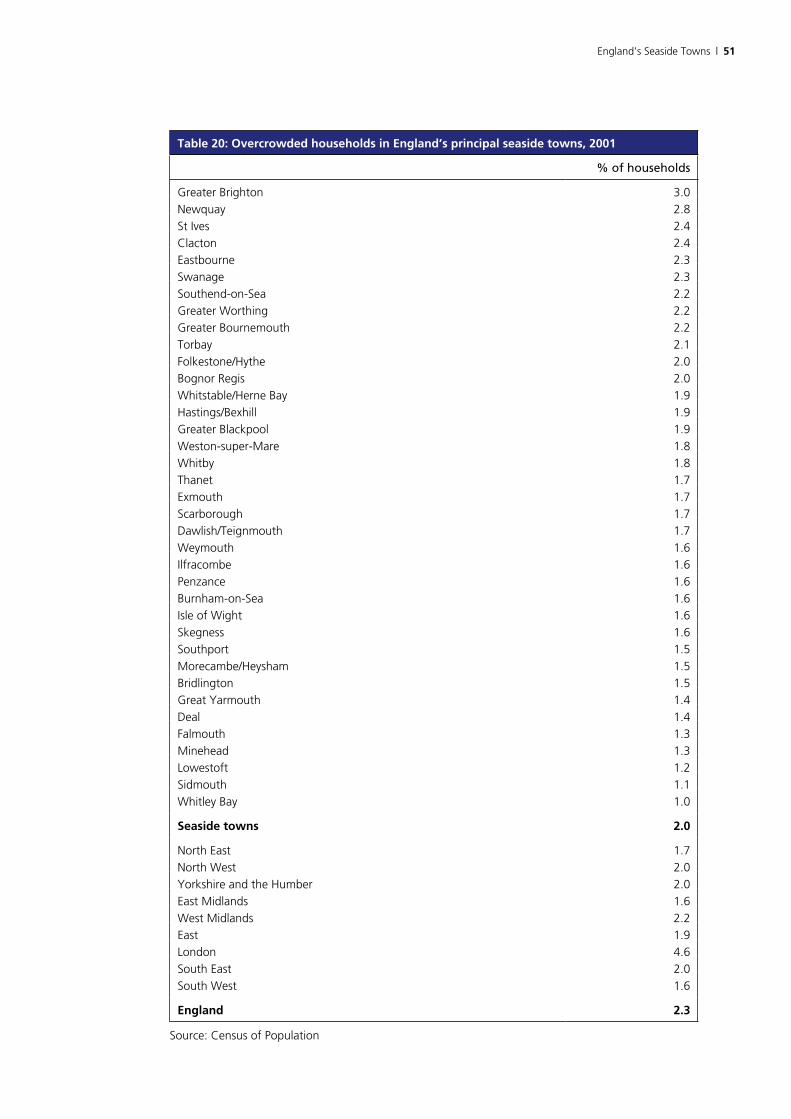
England’s Seaside Towns | �1
Table 20: Overcrowded households in England’s principal seaside towns, 2001
% of households
Greater Brighton 3.0
Newquay 2.8
St Ives 2.4
Clacton 2.4
Eastbourne 2.3
Swanage 2.3
Southend-on-Sea 2.2
Greater Worthing 2.2
Greater Bournemouth 2.2
Torbay 2.1
Folkestone/Hythe 2.0
Bognor Regis 2.0
Whitstable/Herne Bay 1.9
Hastings/Bexhill 1.9
Greater Blackpool 1.9
Weston-super-Mare 1.8
Whitby 1.8
Thanet 1.7
Exmouth 1.7
Scarborough 1.7
Dawlish/Teignmouth 1.7
Weymouth 1.6
Ilfracombe 1.6
Penzance 1.6
Burnham-on-Sea 1.6
Isle of Wight 1.6
Skegness 1.6
Southport 1.5
Morecambe/Heysham 1.5
Bridlington 1.5
Great Yarmouth 1.4
Deal 1.4
Falmouth 1.3
Minehead 1.3
Lowestoft 1.2
Sidmouth 1.1
Whitley Bay 1.0
Seaside towns 2.0
North East 1.7
North West 2.0
Yorkshire and the Humber 2.0
East Midlands 1.6
West Midlands 2.2
East 1.9
London 4.6
South East 2.0
South West 1.6
England 2.�
Source: Census of Population
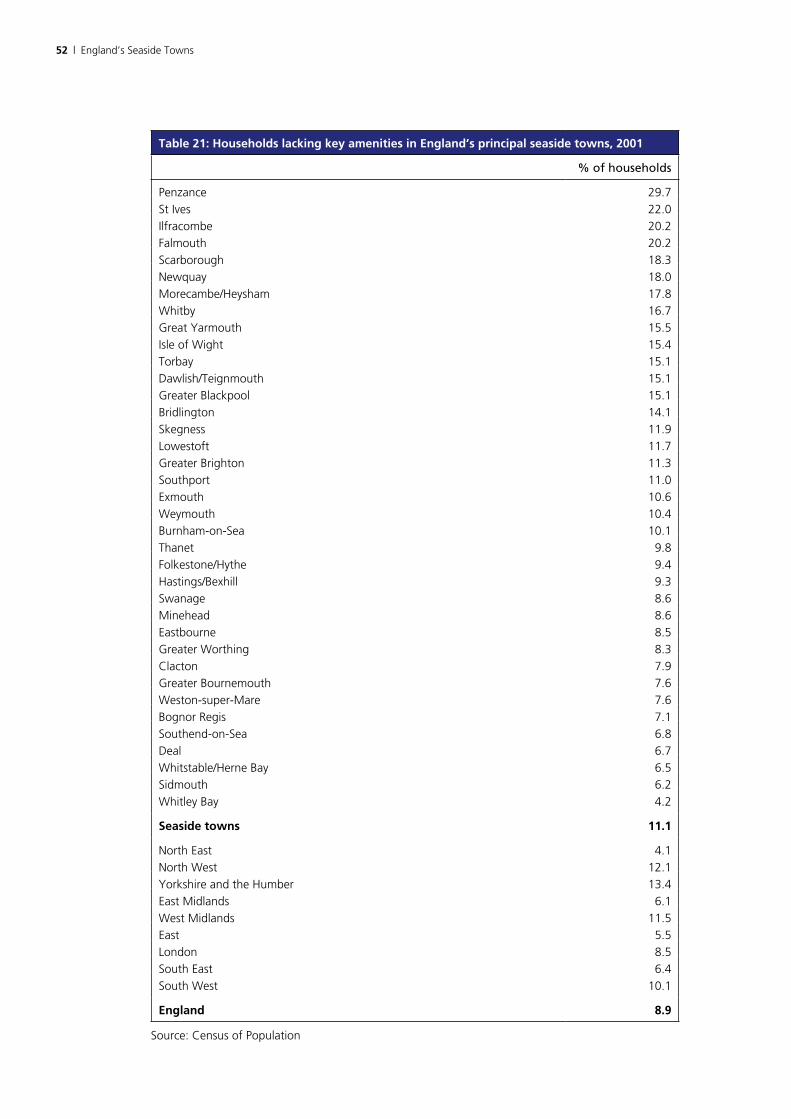
�2 | England’s Seaside Towns
Table 21: Households lacking key amenities in England’s principal seaside towns, 2001
% of households
Penzance 29.7
St Ives 22.0
Ilfracombe 20.2
Falmouth 20.2
Scarborough 18.3
Newquay 18.0
Morecambe/Heysham 17.8
Whitby 16.7
Great Yarmouth 15.5
Isle of Wight 15.4
Torbay 15.1
Dawlish/Teignmouth 15.1
Greater Blackpool 15.1
Bridlington 14.1
Skegness 11.9
Lowestoft 11.7
Greater Brighton 11.3
Southport 11.0
Exmouth 10.6
Weymouth 10.4
Burnham-on-Sea 10.1
Thanet 9.8
Folkestone/Hythe 9.4
Hastings/Bexhill 9.3
Swanage 8.6
Minehead 8.6
Eastbourne 8.5
Greater Worthing 8.3
Clacton 7.9
Greater Bournemouth 7.6
Weston-super-Mare 7.6
Bognor Regis 7.1
Southend-on-Sea 6.8
Deal 6.7
Whitstable/Herne Bay 6.5
Sidmouth 6.2
Whitley Bay 4.2
Seaside towns 11.1
North East 4.1
North West 12.1
Yorkshire and the Humber 13.4
East Midlands 6.1
West Midlands 11.5
East 5.5
London 8.5
South East 6.4
South West 10.1
England �.�
Source: Census of Population
England’s Seaside Towns | ��
3.12 Deprivation
Table 22 shows the average rank of the Lower Super Output Areas (LSOAs) in each of England’s principal seaside towns on the overall Indices of Deprivation for 2007.
Tables 23 to 29 show the same information for each of the seven domains of the Indices of Deprivation 2007:
• Income
• Employment
• Health and disability
• Education and training
• Barriers to housing and access to services
• Crime
• Living environment.
A low number indicates high deprivation; a high number indicates lower deprivation. The average ranking of each town is a population-weighted average of the ranking of each constituent LSOA27.
There are 32,482 LSOAs across England as a whole. Accordingly, an average ranking below 16,242 indicates that a town has an above average level of deprivation.
Because of the averaging process across deprived and more prosperous LSOAs within a town, very high or very low average rankings are on the whole unlikely. An average ranking of, say, 8,000 may in fact mean that a town is among the most deprived in England.
Key points
Overallranking
• 26 of the 37 principal seaside towns have greater overall deprivation than the English average (ie a ranking below 16,242).
• Two substantial seaside towns – Greater Bournemouth and Greater Worthing – do however have lower deprivation than the English average.
• Penzance emerges as the most deprived seaside town of all but this position will partly reflect the town’s unusual statistics on households without central heating.
• The high overall deprivation ranking of Skegness and Great Yarmouth is less evidently affected by unusual statistics.
27 This proven method has previously been deployed by CRESR in research for Communities and Local Government on New Deal for Communities.
�� | England’s Seaside Towns
• Greater Blackpool does not emerge as one of the most deprived seaside towns. This reflects the inclusion of Lytham St Anne’s and Fleetwood in the wider built-up area. Figures for Blackpool borough alone would unquestionably point to a higher level of deprivation.
Incomedeprivation
• 29 of the 37 principal seaside towns have greater income deprivation than the English average (ie a ranking below 16,242).
• Greater Bournemouth is again an important exception.
Employmentdeprivation
• 31 of the 37 principal seaside towns have greater employment deprivation than the English average (ie a ranking below 16,242).
• Skegness, Great Yarmouth, Penzance, Bridlington, Clacton and Ilfracombe all appear especially disadvantaged on this indicator.
Healthanddisability
• 28 of the 37 seaside towns have greater health and disability deprivation than the English average.
• Greater Blackpool and two other towns in the North West, Morecambe/Heysham and Southport fare particularly badly on this indicator, but Skegness is most deprived.
Educationandskills
• 26 of the 37 seaside towns have greater education and skills deprivation than the English average.
• Greater Bournemouth and Greater Brighton are important exceptions.
• Clacton, Great Yarmouth, Skegness and Lowestoft fare particularly badly on this indicator.
Barrierstohousingandaccesstoservices
• Around half the seaside towns have greater barriers to housing and access to services deprivation than the English average and around half have lower deprivation.
• There is an important North-South divide. All the seaside resorts north of a line from the Severn to The Wash have better-than-average access to housing and services – presumably because of lower house prices.
• St Ives and Penzance fare very badly on this indicator. This is likely to reflect to difficulty of accessing owner-occupation caused by a combination of low wages and house prices inflated by buyers from outside the area.
England’s Seaside Towns | ��
Crime
• None of the seaside towns fare particularly badly on this indicator. This is reflected in the lack of average rankings below 10,000.
Livingenvironment
• 25 out of 37 seaside towns have greater living environment deprivation than the English average. This is surprising since air quality is one of the indicators and this is generally good in coastal locations. The figures suggest that the living environment data for seaside towns must be strongly influence by poor housing conditions and the absence of central heating.
• That the five most deprived seaside towns on this indicator are all in Devon or Cornwall, where central heating is often less essential, would seem to confirm this interpretation.
• The poor ranking of Greater Brighton, Scarborough, Great Yarmouth, Morecambe/Heysham, Torbay and Greater Blackpool (in places 6 to 11 on this list) is more likely to reflect shortcomings in houses in multiple occupation.
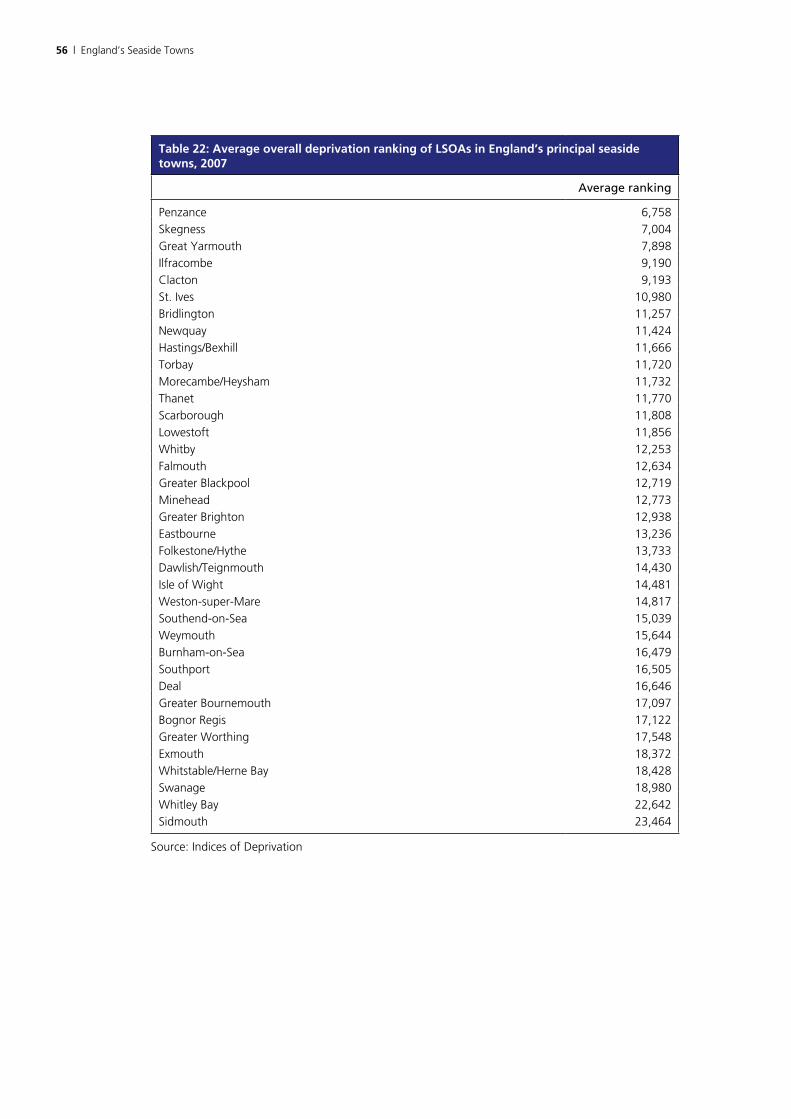
�� | England’s Seaside Towns
Table 22: Average overall deprivation ranking of LSOAs in England’s principal seaside towns, 200�
Average ranking
Penzance 6,758
Skegness 7,004
Great Yarmouth 7,898
Ilfracombe 9,190
Clacton 9,193
St. Ives 10,980
Bridlington 11,257
Newquay 11,424
Hastings/Bexhill 11,666
Torbay 11,720
Morecambe/Heysham 11,732
Thanet 11,770
Scarborough 11,808
Lowestoft 11,856
Whitby 12,253
Falmouth 12,634
Greater Blackpool 12,719
Minehead 12,773
Greater Brighton 12,938
Eastbourne 13,236
Folkestone/Hythe 13,733
Dawlish/Teignmouth 14,430
Isle of Wight 14,481
Weston-super-Mare 14,817
Southend-on-Sea 15,039
Weymouth 15,644
Burnham-on-Sea 16,479
Southport 16,505
Deal 16,646
Greater Bournemouth 17,097
Bognor Regis 17,122
Greater Worthing 17,548
Exmouth 18,372
Whitstable/Herne Bay 18,428
Swanage 18,980
Whitley Bay 22,642
Sidmouth 23,464
Source: Indices of Deprivation
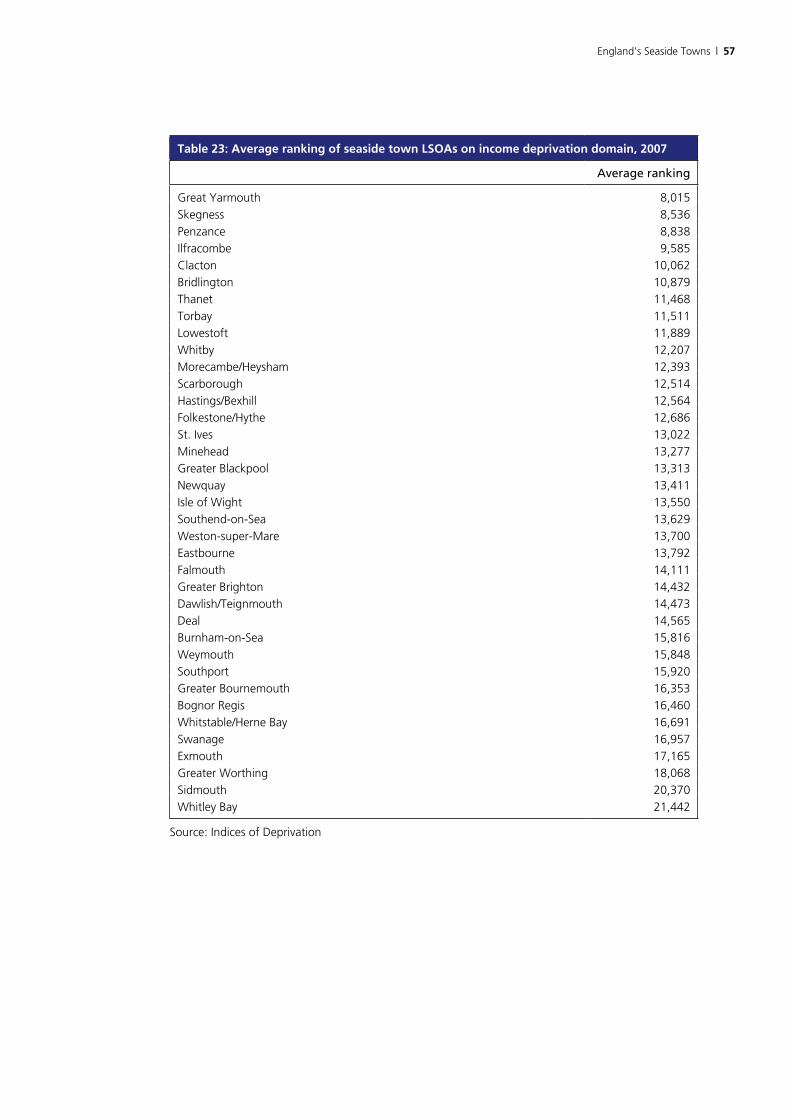
England’s Seaside Towns | ��
Table 2�: Average ranking of seaside town LSOAs on income deprivation domain, 200�
Average ranking
Great Yarmouth 8,015
Skegness 8,536
Penzance 8,838
Ilfracombe 9,585
Clacton 10,062
Bridlington 10,879
Thanet 11,468
Torbay 11,511
Lowestoft 11,889
Whitby 12,207
Morecambe/Heysham 12,393
Scarborough 12,514
Hastings/Bexhill 12,564
Folkestone/Hythe 12,686
St. Ives 13,022
Minehead 13,277
Greater Blackpool 13,313
Newquay 13,411
Isle of Wight 13,550
Southend-on-Sea 13,629
Weston-super-Mare 13,700
Eastbourne 13,792
Falmouth 14,111
Greater Brighton 14,432
Dawlish/Teignmouth 14,473
Deal 14,565
Burnham-on-Sea 15,816
Weymouth 15,848
Southport 15,920
Greater Bournemouth 16,353
Bognor Regis 16,460
Whitstable/Herne Bay 16,691
Swanage 16,957
Exmouth 17,165
Greater Worthing 18,068
Sidmouth 20,370
Whitley Bay 21,442
Source: Indices of Deprivation
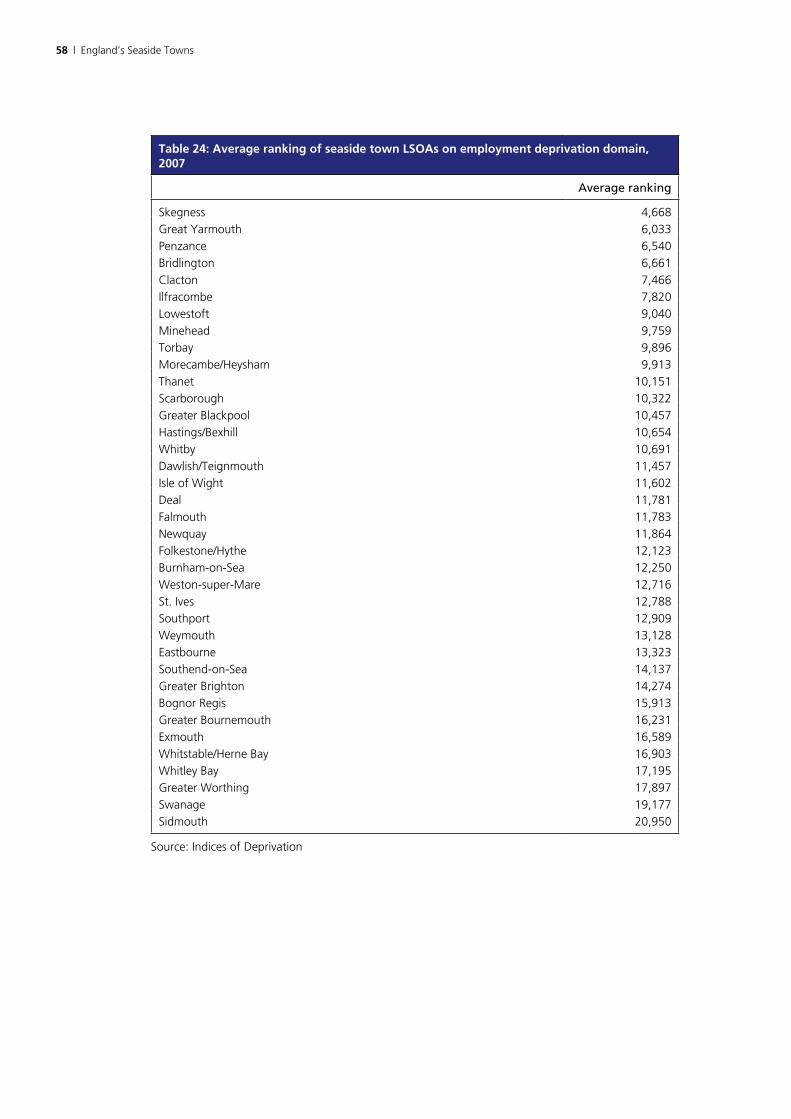
�� | England’s Seaside Towns
Table 2�: Average ranking of seaside town LSOAs on employment deprivation domain, 200�
Average ranking
Skegness 4,668
Great Yarmouth 6,033
Penzance 6,540
Bridlington 6,661
Clacton 7,466
Ilfracombe 7,820
Lowestoft 9,040
Minehead 9,759
Torbay 9,896
Morecambe/Heysham 9,913
Thanet 10,151
Scarborough 10,322
Greater Blackpool 10,457
Hastings/Bexhill 10,654
Whitby 10,691
Dawlish/Teignmouth 11,457
Isle of Wight 11,602
Deal 11,781
Falmouth 11,783
Newquay 11,864
Folkestone/Hythe 12,123
Burnham-on-Sea 12,250
Weston-super-Mare 12,716
St. Ives 12,788
Southport 12,909
Weymouth 13,128
Eastbourne 13,323
Southend-on-Sea 14,137
Greater Brighton 14,274
Bognor Regis 15,913
Greater Bournemouth 16,231
Exmouth 16,589
Whitstable/Herne Bay 16,903
Whitley Bay 17,195
Greater Worthing 17,897
Swanage 19,177
Sidmouth 20,950
Source: Indices of Deprivation
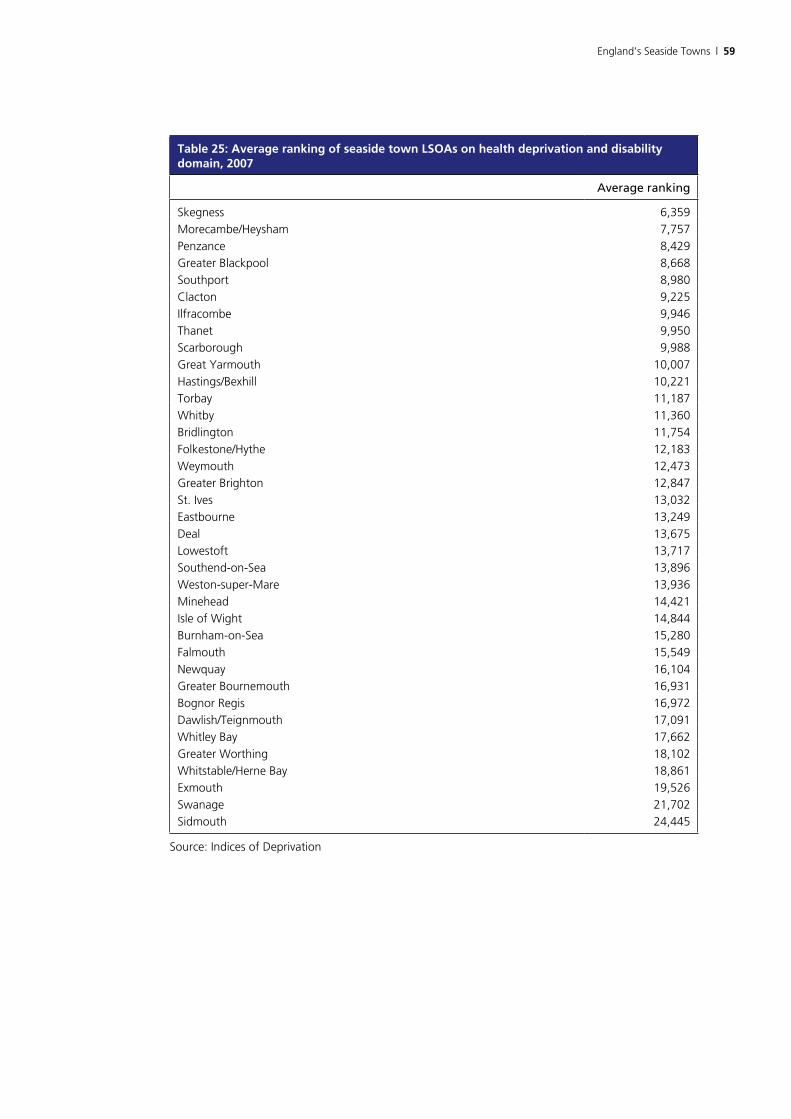
England’s Seaside Towns | ��
Table 2�: Average ranking of seaside town LSOAs on health deprivation and disability domain, 200�
Average ranking
Skegness 6,359
Morecambe/Heysham 7,757
Penzance 8,429
Greater Blackpool 8,668
Southport 8,980
Clacton 9,225
Ilfracombe 9,946
Thanet 9,950
Scarborough 9,988
Great Yarmouth 10,007
Hastings/Bexhill 10,221
Torbay 11,187
Whitby 11,360
Bridlington 11,754
Folkestone/Hythe 12,183
Weymouth 12,473
Greater Brighton 12,847
St. Ives 13,032
Eastbourne 13,249
Deal 13,675
Lowestoft 13,717
Southend-on-Sea 13,896
Weston-super-Mare 13,936
Minehead 14,421
Isle of Wight 14,844
Burnham-on-Sea 15,280
Falmouth 15,549
Newquay 16,104
Greater Bournemouth 16,931
Bognor Regis 16,972
Dawlish/Teignmouth 17,091
Whitley Bay 17,662
Greater Worthing 18,102
Whitstable/Herne Bay 18,861
Exmouth 19,526
Swanage 21,702
Sidmouth 24,445
Source: Indices of Deprivation

�0 | England’s Seaside Towns
Table 2�: Average ranking of seaside town LSOAs on education, skills and training domain, 200�
Average ranking
Clacton 5,174
Great Yarmouth 5,720
Skegness 6,033
Lowestoft 7,953
Whitby 9,828
Bridlington 10,069
Ilfracombe 11,054
Thanet 11,074
Morecambe/Heysham 12,517
Isle of Wight 12,603
Hastings/Bexhill 12,857
Minehead 12,925
Greater Blackpool 13,075
Folkestone/Hythe 13,278
Scarborough 13,295
Burnham-on-Sea 13,790
Torbay 13,913
Southend-on-Sea 14,013
Weston-super-Mare 14,279
Whitstable/Herne Bay 14,616
Greater Worthing 14,795
Deal 15,334
Bognor Regis 15,738
Weymouth 15,814
Penzance 16,095
Newquay 16,226
Exmouth 16,380
Eastbourne 16,441
Swanage 17,236
Greater Bournemouth 17,506
Dawlish/Teignmouth 17,526
Falmouth 17,620
Greater Brighton 17,878
St. Ives 18,886
Southport 20,284
Sidmouth 22,743
Whitley Bay 24,483
Source: Indices of Deprivation
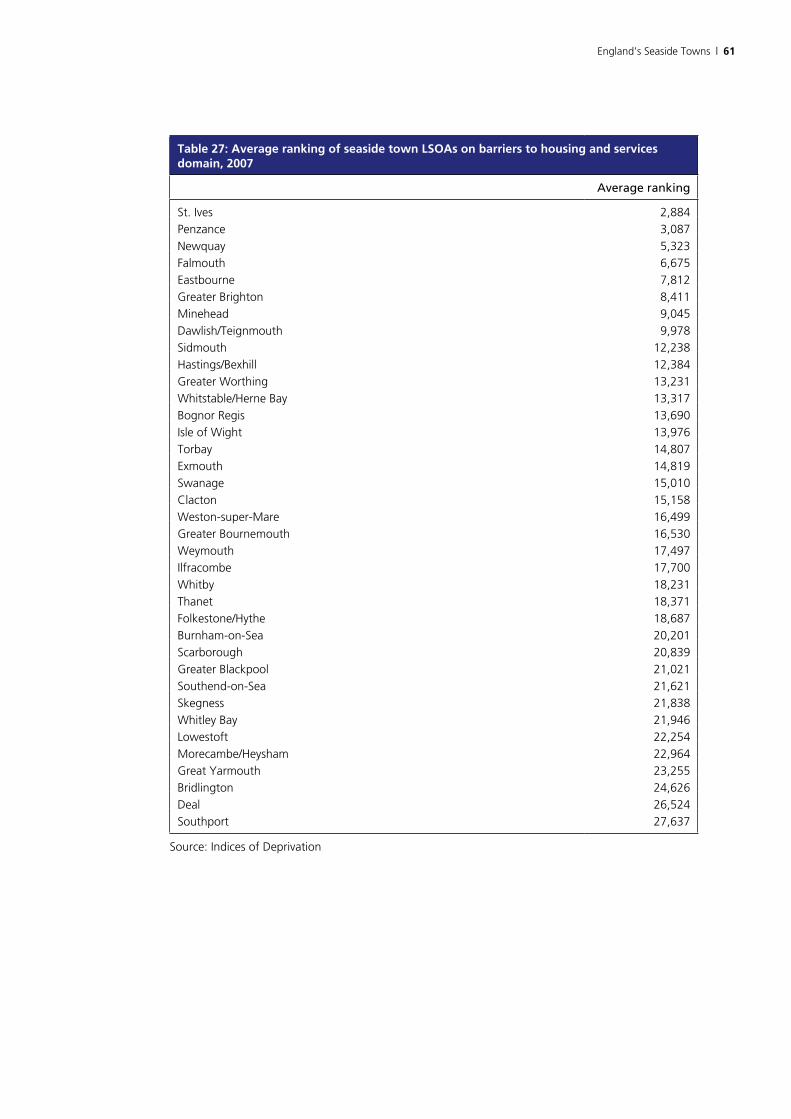
England’s Seaside Towns | �1
Table 2�: Average ranking of seaside town LSOAs on barriers to housing and services domain, 200�
Average ranking
St. Ives 2,884
Penzance 3,087
Newquay 5,323
Falmouth 6,675
Eastbourne 7,812
Greater Brighton 8,411
Minehead 9,045
Dawlish/Teignmouth 9,978
Sidmouth 12,238
Hastings/Bexhill 12,384
Greater Worthing 13,231
Whitstable/Herne Bay 13,317
Bognor Regis 13,690
Isle of Wight 13,976
Torbay 14,807
Exmouth 14,819
Swanage 15,010
Clacton 15,158
Weston-super-Mare 16,499
Greater Bournemouth 16,530
Weymouth 17,497
Ilfracombe 17,700
Whitby 18,231
Thanet 18,371
Folkestone/Hythe 18,687
Burnham-on-Sea 20,201
Scarborough 20,839
Greater Blackpool 21,021
Southend-on-Sea 21,621
Skegness 21,838
Whitley Bay 21,946
Lowestoft 22,254
Morecambe/Heysham 22,964
Great Yarmouth 23,255
Bridlington 24,626
Deal 26,524
Southport 27,637
Source: Indices of Deprivation
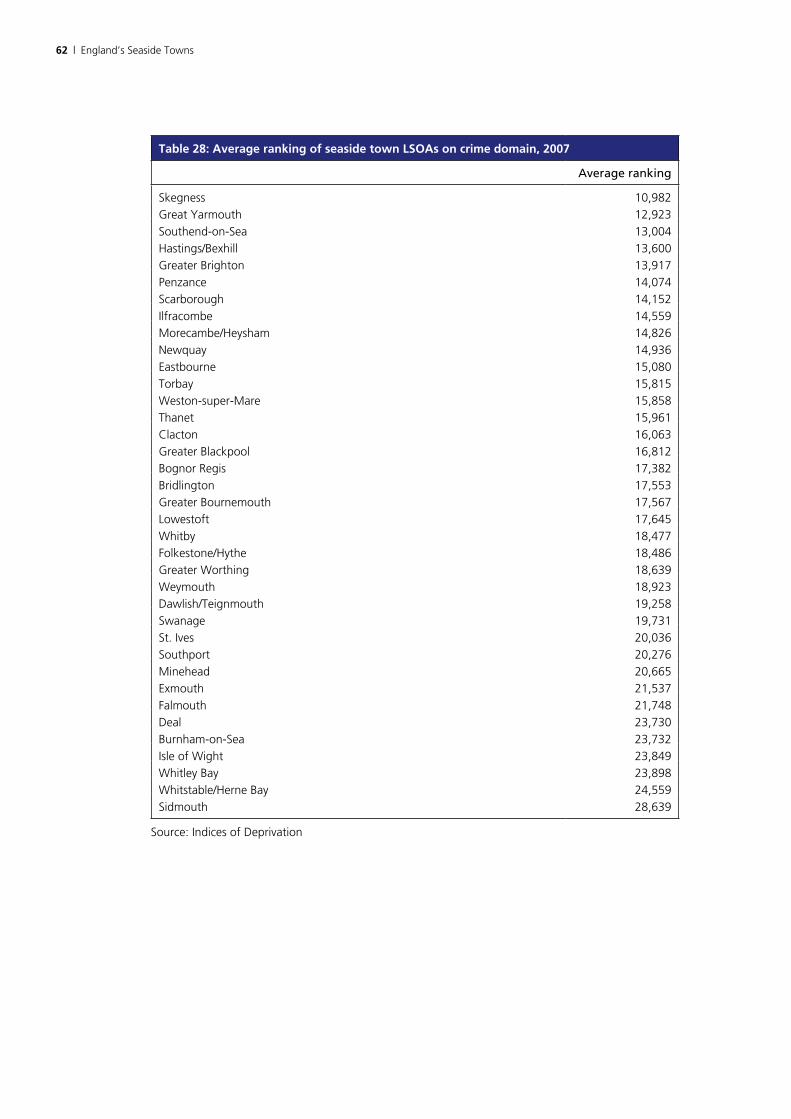
�2 | England’s Seaside Towns
Table 2�: Average ranking of seaside town LSOAs on crime domain, 200�
Average ranking
Skegness 10,982
Great Yarmouth 12,923
Southend-on-Sea 13,004
Hastings/Bexhill 13,600
Greater Brighton 13,917
Penzance 14,074
Scarborough 14,152
Ilfracombe 14,559
Morecambe/Heysham 14,826
Newquay 14,936
Eastbourne 15,080
Torbay 15,815
Weston-super-Mare 15,858
Thanet 15,961
Clacton 16,063
Greater Blackpool 16,812
Bognor Regis 17,382
Bridlington 17,553
Greater Bournemouth 17,567
Lowestoft 17,645
Whitby 18,477
Folkestone/Hythe 18,486
Greater Worthing 18,639
Weymouth 18,923
Dawlish/Teignmouth 19,258
Swanage 19,731
St. Ives 20,036
Southport 20,276
Minehead 20,665
Exmouth 21,537
Falmouth 21,748
Deal 23,730
Burnham-on-Sea 23,732
Isle of Wight 23,849
Whitley Bay 23,898
Whitstable/Herne Bay 24,559
Sidmouth 28,639
Source: Indices of Deprivation
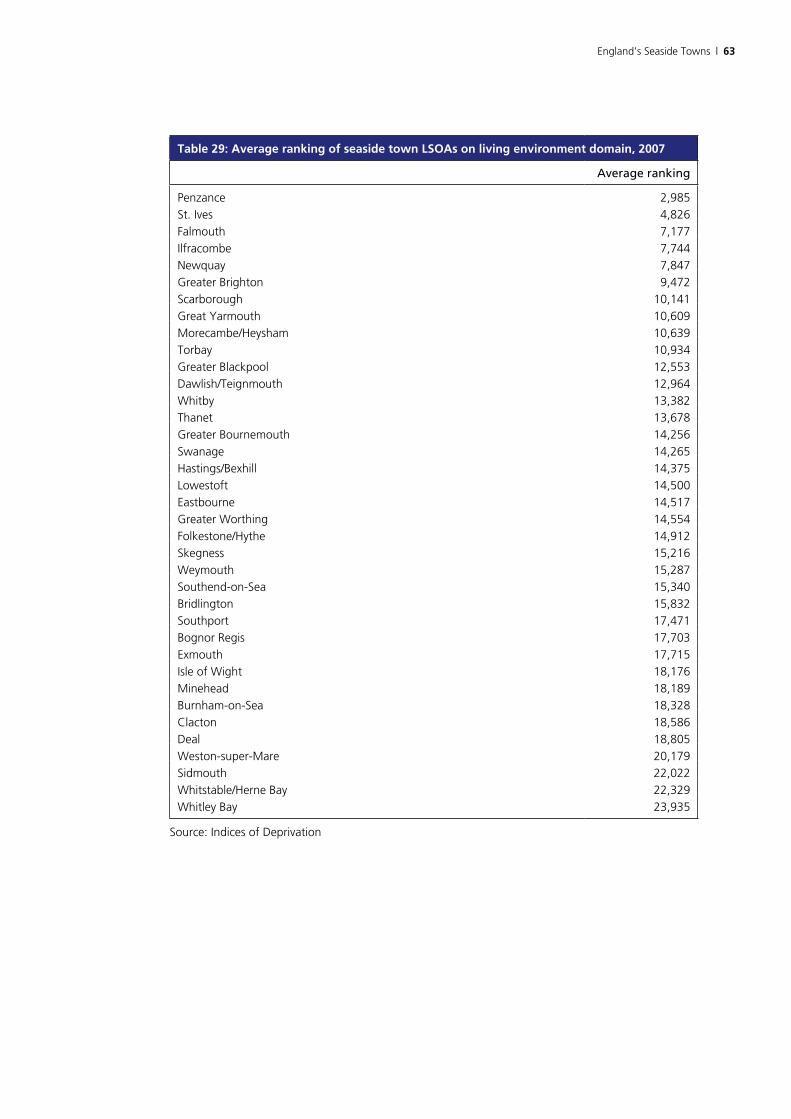
England’s Seaside Towns | ��
Table 2�: Average ranking of seaside town LSOAs on living environment domain, 200�
Average ranking
Penzance 2,985
St. Ives 4,826
Falmouth 7,177
Ilfracombe 7,744
Newquay 7,847
Greater Brighton 9,472
Scarborough 10,141
Great Yarmouth 10,609
Morecambe/Heysham 10,639
Torbay 10,934
Greater Blackpool 12,553
Dawlish/Teignmouth 12,964
Whitby 13,382
Thanet 13,678
Greater Bournemouth 14,256
Swanage 14,265
Hastings/Bexhill 14,375
Lowestoft 14,500
Eastbourne 14,517
Greater Worthing 14,554
Folkestone/Hythe 14,912
Skegness 15,216
Weymouth 15,287
Southend-on-Sea 15,340
Bridlington 15,832
Southport 17,471
Bognor Regis 17,703
Exmouth 17,715
Isle of Wight 18,176
Minehead 18,189
Burnham-on-Sea 18,328
Clacton 18,586
Deal 18,805
Weston-super-Mare 20,179
Sidmouth 22,022
Whitstable/Herne Bay 22,329
Whitley Bay 23,935
Source: Indices of Deprivation
�� | England’s Seaside Towns
4. Assessment The social and economic conditions in a locality tend to be complex and
multi-dimensional, making it hard for any single indicator to encapsulate the full range or extent of disadvantage. This applies to England’s seaside towns as much as anywhere else.
This report presents a range of statistics. Some of these are for a single point in time, others for trends over time. Inevitably, this is a difficult pattern to interpret. There is nevertheless interest in placing England’s seaside towns in the context of wider social and economic patterns of disadvantage, and in identifying the most disadvantaged towns.
4.1 Just how disadvantaged are England’s seaside towns?
The report includes nearly 30 indicators on which England’s principal seaside towns can be ranked and compared with the average for England as a whole. On around three-quarters of these indicators, the average for the seaside towns is worse than for England as a whole. For example, seaside towns as a whole have a lower-than-average employment rate, an above average share of working age adults on benefits, lower average earnings and are more affected by seasonal unemployment than the rest of England.
On the other hand, the scale of the disparity between the seaside town average and the English average is not always large – earnings are a notable exception – and there are some variables on which seaside towns appear to be faring relatively well. For instance, recent employment growth in seaside towns has been faster than the English average and the reduction in benefit numbers is keeping up with the trend for England as a whole.
In addition, on most indicators there is a spread of performance, usually with several seaside towns showing better figures than England as a whole.
A balanced view, taking account of a range of statistical evidence, would be that on average England’s principal seaside towns are rather more disadvantaged than the rest of the country, but not markedly so.
4.2 The variation between towns
The Indices of Deprivation 2007 offer the best composite guide to the degree of disadvantage in individual towns. However, as noted in the present report there is reason to be sceptical about the interpretation of some of the housing data for several places in Cornwall and Devon, where the markedly lower proportion of households with central heating may in part reflect the
England’s Seaside Towns | ��
climate rather than disadvantage. For this reason the overall rankings on the deprivation indices – which place Penzance in West Cornwall at the very top among seaside towns – must be treated with caution.
Three domains within the Indices – income, employment, and education and skills – together offer a reasonable guide to the more ‘economic’ dimension of seaside town disadvantage.
Four towns appear every time on the list of the 10 least disadvantaged seaside towns, in terms of these ’economic’ domains, and a further six appear twice. These towns, which might therefore be seen as having the strongest local economies among England’s seaside towns, are in alphabetical order:
• Bognor Regis
• Exmouth
• Greater Bournemouth
• Greater Brighton
• Greater Worthing
• Sidmouth
• Southport
• Swanage
• Whitley Bay
• Whitstable/Herne Bay
The notable feature of this list is that seven of the 10 towns are located along a relatively short stretch of the south coast from Exmouth to Brighton. Two others on the list (Southport and Whitley Bay) function partly as more affluent commuter settlements for adjacent conurbations.
At the other end of the range, six places figure among the most disadvantaged ten seaside towns in all three of the ‘economic’ domains in the Indices of Deprivation, and a further five appear twice. These seaside towns, which might therefore be seen as having the weakest local economies, are in alphabetical order:
• Bridlington
• Clacton
• Great Yarmouth
• Ilfracombe
• Lowestoft
• Morecambe/Heysham
• Penzance
• Skegness
�� | England’s Seaside Towns
• Thanet
• Torbay
• Whitby
Most of these are small or medium-sized towns. Only one (Torbay) is located along the south coast, though a further two (Penzance and Thanet) could claim to be at its extreme ends.
That leaves 16 towns that, on the basis of the three economic domains in the deprivation indices, neither rank among the strongest or weakest seaside economies. These are, in alphabetical order:
• Burnham-on-Sea
• Dawlish/Teignmouth
• Deal
• Eastbourne
• Falmouth
• Folkestone/Hythe
• Greater Blackpool
• Hastings/Bexhill
• Isle of Wight
• Minehead
• Newquay
• Scarborough
• Southend-on-Sea
• St Ives
• Weston-super-Mare
• Weymouth
Nine of the seaside towns covered in this report have a population of more than 100,000 (in some instances because the figures pool together adjacent towns). These nine towns account for 60 per cent of the total population of England’s 37 principal seaside towns (see Table 1 earlier).
On the basis of the same three domains within the deprivation indices – income, employment, and education and skills – it is possible to rank these nine towns. This ranking, which is the same in relation to all the 37 principal seaside towns or just the nine towns themselves, is in order of disadvantage28:
28 Greater Bournemouth and Greater Worthing actually have an equal average ranking in comparison to all 37 towns.

England’s Seaside Towns | ��
• Thanet
• Torbay
• Hastings/Bexhill
• Greater Blackpool
• Isle of Wight
• Southend-on-Sea
• Greater Brighton
• Greater Bournemouth
• Greater Worthing
It would be wrong to place too much emphasis on lists of this sort. None of the lists here purports to be based on more than a handful of indicators. In addition there are other indicators – the instability of school rolls caused by population turnover for example, which is a serious problem in a number of seaside towns – that are nether included in the Indices of Deprivation nor in the present report.
Detailed local geography also matters. In the case of Greater Blackpool, for example, figures for Blackpool borough in isolation would reveal a distinctly higher level of disadvantage. Likewise, within Thanet the worst deprivation tends to be found in Margate rather than Ramsgate or Broadstairs. More generally, within most seaside towns there are likely to be pockets of acute deprivation that are not reflected in average statistics for the town as a whole.
The lists here do however chime with a range of data and informed perceptions of the strengths and weaknesses of different places.

ISBN 978-1-4098-0620-2 9 7 8 1 4 0 9 8 0 6 2 0 2
ISBN 978-1-4098-0620-2