
Engineering in a Flat World improving the performance of civil · 2017-12-15 · Earthquake...
26
1 Earthquake Engineering in a Flat World ‐ improving the performance of civil infrastructure Ian Buckle Foundation Professor, University of Nevada Reno _____________________________________________________________ Invited Lecture University of Auckland Centre for Earthquake Engineering Research , Department of Civil and Environmental Engineering , Auckland, May 24, 2012 Natural hazards • Hurricanes • Floods • Blizzards Wildfi • Wildfires • Earthquakes
Transcript of Engineering in a Flat World improving the performance of civil · 2017-12-15 · Earthquake...

1
Earthquake Engineering
in a Flat World
‐ improving the performance of civil infrastructure
Ian Buckle
Foundation Professor, University of Nevada Reno
_____________________________________________________________
Invited Lecture
University of Auckland Centre for Earthquake Engineering Research ,
Department of Civil and Environmental Engineering , Auckland, May 24, 2012
Natural hazards
• Hurricanes
• Floods
• Blizzards
Wildfi• Wildfires
• Earthquakes

2
Earthquakes…
• Rapid-onset disasters
• 14,000 lives lost / year
• US Annualized losses– FEMA: $4.4 billion
– EERI: $10 billion
Losses due to natural hazards in the U.S: 1952-1996

3
Earthquakes are costly disasters
For several reasons:
M j it f i t d t t tMajority of our inventory does not meet current seismic design requirements and should be retrofitted to minimize risk of collapse
But even new structures built to current standards will be damaged in the ‘design earthquake’earthquake …
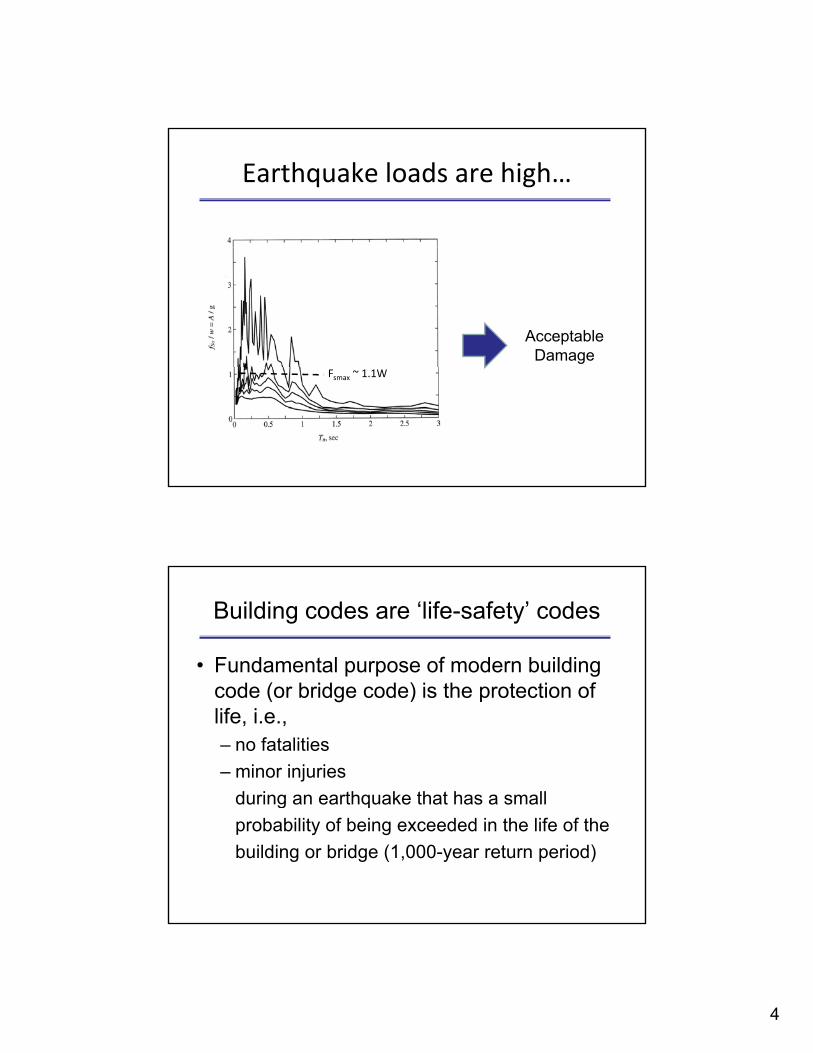
Earthquake loads are high…
Fsmax ~ 1.1W
4
Earthquake loads are high…
Acceptable Damage
Fsmax ~ 1.1W
Building codes are ‘life-safety’ codes
• Fundamental purpose of modern building d ( b id d ) i th t ti fcode (or bridge code) is the protection of
life, i.e., – no fatalities
– minor injuries
during an earthquake that has a smallg q
probability of being exceeded in the life of the
building or bridge (1,000-year return period)

5
For example, US bridge code says…
Bridges shall be designed for… life-safety… considering a seismic hazard corresponding toconsidering a seismic hazard corresponding to a…1,000 year return period.
AASHTO Guide Specifications for Seismic Bridge Design, 2009
For example, US bridge code says…
Bridges shall be designed for… life-safety… considering a seismic hazard corresponding toconsidering a seismic hazard corresponding to a…1,000 year return period.
Life safety design… shall be taken to imply that the bridge has a low probability of collapse, but
AASHTO Guide Specifications for Seismic Bridge Design, 2009

6
For example, US bridge code says…
Bridges shall be designed for… life-safety… considering a seismic hazard corresponding toconsidering a seismic hazard corresponding to a…1,000 year return period.
Life safety design… shall be taken to imply that the bridge has a low probability of collapse butmay suffer significant damage and that significantdisruption to service is possible which maydisruption to service is possible…. which mayrequire closure to repair the bridge. Partial or complete replacement may be required in some cases.
AASHTO Guide Specifications for Seismic Bridge Design, 2009
Life safety vs. functionality
Bridges and buildings are designed to be safe
b t t il i i ibut not necessarily remain in service….
continuing functionality is not assured.
Exceptions exist: critical bridges and facilities
such as hospitals, schools…p ,
But continuing functionality following a large
earthquake is prohibitively expensive

7
Life safety vs. functionality
And for many years life-safety has served uswell… lives lost and injuries are less, andfinancial losses have been ‘contained’ But as Thomas Friedman recently observed…
Life safety vs. functionality
And for many years life-safety has served uswell… lives lost and injuries are less, andfinancial losses have been ‘contained’ But as Thomas Friedman recently observed…

8
The ‘world is flat’
Interconnectedness of society greatly d th i t d f d iexpands the impacted area of a damaging
earthquake far beyond the epicentralregion.
The ‘world is flat’
Interconnectedness of society greatly d th i t d f d iexpands the impacted area of a damaging
earthquake far beyond the epicentralregion.
A local disaster can quickly become a national/global one, which in turn leads tonational/global one, which in turn leads to an escalation in financial loss not seen in earthquakes a decade ago.
______________________________________________________
* Securing society against catastrophic earthquake losses, Earthquake Engineering Research Institute, Oakland CA, 2003

9
Escalating indirect losses
• Well-recognized problem…
• Loma Prieta Earthquake, 1989 – SFO Hyatt Hotel just opened
– No fatalities, no injuries despite
collapsed building across street
Engineers called design ‘success’– Engineers called design success
– But City of Burlingame closed the
hotel because of cracks in shear walls
– The owner was not pleased.
Escalating losses
• This and other similar incidents, as well as the interconnectedness of society has given rise tointerconnectedness of society, has given rise to pressing need to do better, and the concept of ‘Performance-Based Design’ has been born
• Goal is to be able to design a specific building, p g,to have a specific performance, during a specific earthquake [e.g. hotel, closed no more than 7 days, M7 EQ]

10
Performance-based design
0
2
4
6
8
10Relative Effort
Performance
1
2
3
40
1
2
Hazard level
Level
0-2 2-4 4-6
6-8 8-10
Performance-based design
Explicit attempt to satisfy public expectations of bridge performance for earthquakes ranging from small toperformance for earthquakes ranging from small to large… for example:
PerformanceEarthquake
Small Intermediate Large
N i t ti √ √No interruption
Limited access
Closed for repairs
√ √
√ √
√

11
Performance-based design
• Barriers to implementation – Lack of knowledge 10Relative Effort– Lack of knowledge
– No extra cost
• Currently driving the bridge-research agenda
1
2
3
40
1
2
0
2
4
6
8
Hazard level
Performance Level
0-2 2-4 4-6
6-8 8-10
– Damage-free performance
– Little or no extra cost
– Two examples at University of Nevada Reno• Innovative materials
• Hybrid isolation
Large-Scale Structures Laboratory
• George E Brown Jr. Network Earthquake Engineering Si l ti (NEES)Simulation (NEES)
• Established by the National Science Foundation
• UNR LSSL is one of 14 universities providing core facilities to the NEES network
• Multiple shake table site with telepresence capabilities
• Data repository and portals to simulation tools

12
Innovative materials
104ft (31.7 m)
Post-Elastomeric bearing embedded in column Post
tensioned segmental columns with pipe-pin connections
embedded in column at location of plastic hinges
Shape memory alloy rebar and ECC concrete in hinge zones PI: M. Saiid Saiidi, UNR

13
Hybrid vs Seismic (Full) Isolation
• Period shift
• lowers spectral accelerations
• reduces column and foundation shear forces andfoundation shear forces and moments
• but increases superstructuredisplacements (but not column drifts)
Background Experimental study Results Conclusions
Hybrid (Partial) Isolation
Load attracted away from columns to abutments
Abutment isolators (hysteretic energy dissipators)
• Reduces column forces
Background Experimental study Results Conclusions
• Reduces column forces• Reduces superstructure displacements• But increases abutment reactions (shear forces)

14
Hybrid (partial) Isolation
• Reduces column forces• Reduces superstructure displacements• But increase abutment reactions (shear forces)( )
Transverse Direction
F
Longitudinal Direction
F F1
FF2
Background Experimental study Results Conclusions
Hybrid Isolation + Ductile End Cross‐Frames
Yield (FY) ( Y)and buckling in cross‐ frame
Hybrid
Fy
Hybrid protective system
Background Experimental study Results Conclusions

15
Curved highway bridge project at UNR
• To study, experimentally and analytically, the seismic performance of a large scale model ofseismic performance of a large‐scale model of a highly curved bridge using multiple shake tables– With and without protective systems
• Isolated
• Partially isolatedPartially isolated
• Rocking columns
– With and without abutment interaction
– With and without live load
45 tonne, 2-dof shake tables3 span, plate girder, 0.4-scale bridge model
45 tonne, 6-dof shake table
15 m
46 m
Background Experimental study Results Conclusions

16
Prototype and Model Dimensions
Model Scale is 0.4
Dimensions Prototype Model
Total Length (m) 110.5 44.2
Span Lengths (m) 32–46.5‐32 12.8–18.6‐12 812.8
Radius (m) 61.0 24.4
Total Width (m) 9.1 3.7
Girder Spacing (m) 3.4 1.4
Column Height (m) 6.1 2.4
Model weight is 1,423 kN (142 tonnes )
Model weight with live load is 1,690K (169 tonnes )
Background Experimental study Results Conclusions

17
North column: 3.5 x Design Earthquake
• Curved2_Canon2_No_Col_NE_350Des_20110915140114 1(2)915140114_1(2).mpg

18
Curved Highway Bridge Project at UNR
1. Conventional bridge (1040, steel bearings, 24 inch diam. columns, sacrificial shear keys at abutments)
2 C ti l b id ith li l d (6 t k )2. Conventional bridge with live load (6 trucks)
3. Fully isolated bridge with 12 LRB isolators
4. Hybrid isolated bridge with 6 LRB isolators and ductile cross frames
5. Abutment pounding (nonlinear backfill)
6. Rocking columns
Background Experimental study Results Conclusions
Curved Bridge: Full Isolation Case
Lead‐rubber isolator
Abutment isolator
Pier isolators
Background Experimental study Results Conclusions

19
Curved Bridge: Hybrid Protective Systems
Boundary Conditions• Abutments
‐ LRB isolators effective in tangential direction only‐ Buckling Restrained Braces (BRB) in radial direction with shear keyg ( ) y
• Piers‐ Pin connection between the superstructure and pier using steel pot bearings
Background Experimental study Results Conclusions
Input Motion
• Design Earthquake: PGA = 0.472g; Ss = 1.135g; S1 = 0.41g• Sylmar record of the 1994 Northridge Earthquake selected • SYL 360: PGA = 0.84g; S1 = 0.87g• Scale Factor 0 475 (to give same S as Design Earthquake)• Scale Factor = 0.475 (to give same S1as Design Earthquake)
0.8
1
1.2
1.4
1.6
rati
on (
g)
0.475xSyl360
0.475xSyl090
Design
0
0.2
0.4
0.6
0 0.5 1 1.5 2 2.5 3
Acc
eler
Period (sec)

20
Test Protocol
• Same set of ground motions input to all 4 shake tables (synchronous motion)(synchronous motion)
• Motion applied in increments of Design Earthquake (DE):
Run # Motion (DE) Note Run # Motion (DE)
1 10% 6 150%
2 20% 7 200%2 20% 7 200%
3 50% 8 250%
4 75% SK 9 300%
5 100% 10 350%
Background Experimental study Results Conclusions
Periods of Vibration
BridgeLongitudinal
Vibration ModeTransverse
Vibration Mode
Conventional Case 0.50 sec 0.53 sec
Full Isolation1.00 sec*
1.43 sec**1.00 sec*
1.43 sec**
Hybrid Protective System0.50 sec*
**
0.55 sec***Hybrid Protective System
0.90 sec** 0.55 sec**
Notes: * = period at 100% Design Earthquake (DE)** = period at 150% DE (Maximum Considered Earthquake, MCE)
Background Experimental study Results Conclusions

21
Superstructure Displacement
127
152.4
5.000
6.000
Conventional
25 4
50.8
76.2
101.6
1 000
2.000
3.000
4.000
Dis
plac
emen
t (m
m)
Dis
plac
emen
t (in
)
0
25.4
0.000
1.000
0 25 50 75 100 125 150% Design EQ
Note: These are resultant superstructure displacements at the center of the bridge.
Background Experimental study Results Conclusions
Superstructure Displacement
127
152.4
5
6
Full_Iso
C i l
25 4
50.8
76.2
101.6
1
2
3
4
Dis
plac
emen
t (m
m)
Dis
plac
emen
t (in
)
Conventional
0
25.4
0
1
0 25 50 75 100 125 150% Design EQ
Note: These are resultant superstructure displacements at the center of the bridge.
Background Experimental study Results Conclusions

22
Superstructure Displacement
127
152.4
5
6
Full_Iso
Hybrid
25 4
50.8
76.2
101.6
1
2
3
4
Dis
plac
emen
t (m
m)
Dis
plac
emen
t (in
)
Conventional
0
25.4
0
1
0 25 50 75 100 125 150% Design EQ
Note: These are resultant superstructure displacements at the center of the bridge.
Background Experimental study Results Conclusions
Pier Reactions: Resultant Shear Forces
60
Total Resultant Shear: Pier 260
Total Resultant Shear: Pier 3
10
20
30
40
50
Shear (kips)
Full_Iso
Hybrid
Conv.
10
20
30
40
50 Full_iso
Hybrid
Conv.
0
0 25 50 75 100 125 150
% Design EQ
0
0 25 50 75 100 125 150
% Design EQ
Background Experimental study Results Conclusions

23
Abutment Reactions: Isolator Tangential Shear
250
50
60
Full_Iso250
50
60
Full_Iso
North Abutment South Abutment
0
50
100
150
200
0
10
20
30
40
50
She
ar (
kips
)
Hybrid
50
100
150
200
10
20
30
40
50
She
ar (
kN)
Hybrid
000 25 50 75 100 125 150
% Design EQ
000 25 50 75 100 125 150
% Design EQ
Background Experimental study Results Conclusions
Abutment Reactions: Isolator Radial Shear
250
50
60
Full_Iso250
50
60
Full_Iso
North Abutment South Abutment
50
100
150
200
10
20
30
40
50
She
ar (
kips
)
Hybrid
50
100
150
200
10
20
30
40
50
She
ar (
kN)
Hybrid
000 25 50 75 100 125 150
% Design EQ
000 25 50 75 100 125 150
% Design EQ
Background Experimental study Results Conclusions

24
Column Damage at 150% Design Earthquake
Pier 2Conventional
Case
Pier 2Full Isolation
Case(Hybrid Isolation Similar)
Pier 3Conventional
Case
Pier 3Full Isolation
Case (Hybrid Isolation Similar)
Column Damage at 300% Design Earthquake
Pier 2Conventional
Case
Pier 2Full Isolation
Case (Hybrid Isolation Similar)
Pier 3Conventional
Case
Pier 3Full Isolation
Case(Hybrid Isolation Similar)

25
Conclusions
1. Both full and hybrid isolation were effective at keeping the columns elastic under the design earthquake and essentially elastic under the maximum considered earthquake (150% DE)elastic under the maximum considered earthquake (150% DE).
2. Hybrid isolation was also effective at reducing the superstructure displacements (to about one‐third of the displacements in the full isolation case).
Background Experimental study Results Conclusions
Summary
• Earthquakes are costly disasters (in lives and dollars)
• Even though number of fatalities is falling (in the U.S.) dollar losses are increasing – it’s a flat world…
• Building and bridge codes are focused on life-f t d i t b t d d isafety – damage is to be expected and is
considered ‘acceptable’
• Research is underway to remove ‘acceptable damage’ from our vocabulary

26
Acknowledgements
• University of Nevada
• Federal Highway Administration
• California Department of TransportationCalifornia Department of Transportation
• NSF-NEES and –NEESR
Thank you.


