Engineering Experiinent Station -...
25
Engineering Experiinent Station TO IOWA STATE HIGHWAY COMMISSION V061f} RAYHO ANID S1/RIENG1M OIF TWO by Fernando H. Tinoco, Graduate Assistant Richard L. Handy, Professor of Civil Engineering James M. Hoover, Assistant Professor of Civil Engineering Contribution No. 66-6 from the Soil Research Laboratory, Project 516-S Iowa Highway Research Board Project HR-99 Iowa State University Ames, Iowa
Transcript of Engineering Experiinent Station -...
Engineering Experiinent Station
TO
IOWA STATE HIGHWAY COMMISSION
V061f} RAYHO ANID SHIEA~ S1/RIENG1M OIF TWO
by
Fernando H. Tinoco, Graduate Assistant
Richard L. Handy, Professor of Civil Engineering
James M. Hoover, Assistant Professor of Civil Engineering
Contribution No. 66-6
from the Soil Research Laboratory, Project 516-S
Iowa Highway Research Board Project HR-99
Iowa State University
Ames, Iowa
•
1
VOID RATIO AND SHEAR STRENGTH OF
TWO COMPACTED CRUSHED STONESl
by
2 Fernando H. Tinoco, Richard L. Handy and James M. Hoover
ABSTRACT
Triaxial compression tests of two crushed limestones of differing
highway service records indicate a fundamental difference in their shear
strength -- void ratio relationship. Analyses were based on stress <1
parameters at minimum sample volume, i.e., before there was significant
sample dilation due to shear. The better service record sample com-
pacted to higher density, and had a high effective angle of internal
friction and zero effective cohesion. The other sample compacted to
lower density and had a lower friction angle, but gained significant
stability from effec~ive cohesion. Repeated loading-unloading cycles
reduced the cohesion, apparently due to modification of the sample
structure.
Extrapolations of the results to zero void ratio agree with sliding
friction data reported on calcite, or with triaxial parameters reported
on carbonate rocks.
1A repo_rt of Project HR-99 sponsored by the Iowa Highway Research Board witiT":-'ftiGds from the Iowa State Highway Commission and the Bureau of PubfiC Roads. Project 516-S _of the Soil Research Laboratory, Engineering Experiment Station, Iowa State University, Contribution No. 66-6.
2Graduate Research Assistant, Professor and Assistant Professor of Civil Engineering, respectively, Iowa State University, Ames, Iowa.
•
2
INTRODUCTION
Compacted crushed limestone has been in common use for many years
as a base course for flexible pavements. In recent years the greatly
increased traffic loads and intensities have resulted in mixed service
records of this material. The present study is part of a larger research
program being conducted at Iowa State University to discover and com
pare strength characteristics of several Iowa cr.ushed stones with varying
service records, and if possible to explain the performance differences
and relate to compositional differences such as gradation or mineralogy.
BASIS OF THIS INVESTIGATION
The usual use of the Mohr stress circle in soils is to represent
stress conditions at failure, with failure defined as the condition of
the soil at the maximum deviator stress or maximum principal stress
ratio. The Mohr failure envelope is the line representing the locus
of points showing stress conditions on the failure plane. But since
a Mohr circle also represents any two-dimensional stress condition of
equilibrium, it can be used at any strain value before failure is
reached. Thus the envelope formed by points of tangency to Mohr
circles representing effective stresses for a given condition of the
sample can be used to find the cohesion and angle of internal friction
at that given condition.
In this study the selected condition is the minimum void ratio
reached during the shear test. This condition was chosen because it
3
represents a time of maximum density, when stability and strength are
presumed to be maximum. That is, although the Mohr stress parameters
usually become larger as the test continues to failure, they then in
clude energy used to increase the soil volume as grains move over one
another to allow formation of continuous shear planes. When this hap
pens, the soil structure is changed, and successive repetitions of
loading were not expected to follow the same stress paths.
Another alternative might be to use the constant-volume condition,
after the test has progressed to the point where the shear zone is at
the critical void ratio. This condition also was rejected, since it
would be very undesirable in a pavement.
At the minimum void ratio point, the rate of volume change within
the sample is zero and no corrections are necessary due to this effect.
MATERIALS AND TESTING PROCEDURES
Two crushed stones were selected as representative of Iowa State
Highway Commission approved crushed stone for rolled-stone bases. One
is a weathered, moderately hard limestone of the Pennsylvania system.
(Anderson and Welp, 1959) obtained from near Bedford, in Taylor County,
Iowa (hereafter this will be referred to as the Bedford sample). The
second is a hard dolomite of the Devonian system (Anderson and Welp,
loc. cit.) obtained from near Garner, Hancock County, Iowa, and here
after referred to as the Garner sample. Of the two, the Garner has the
better service record.
X-ray diffraction analyses of powdered representative samples
4
showed calcite as the predominant mineral in both stones, but there was /.'/,/~
a considerable difference in calcite-dolomite ratio of ~ in the Bed// :::;5'
ford stone and ,t:;::t::::t:6 in the Garner (Handy, 1965). X-ray tests on
HCl-insoluble residues showed no montmorillonite in either sample, a
0 small amount of 14 A mineral (vermiculite or chlorite) in the Garner,
a predominance of illite in both, plus kaolinite and quartz. Kaolinite
in the Bedford stone was poorly crystalline. The percent of insoluble
residues was 10.9 in the Bedford and 6.7 in the Garner. pH's and cation
exchange capacities of the whole samples were closely comparable.
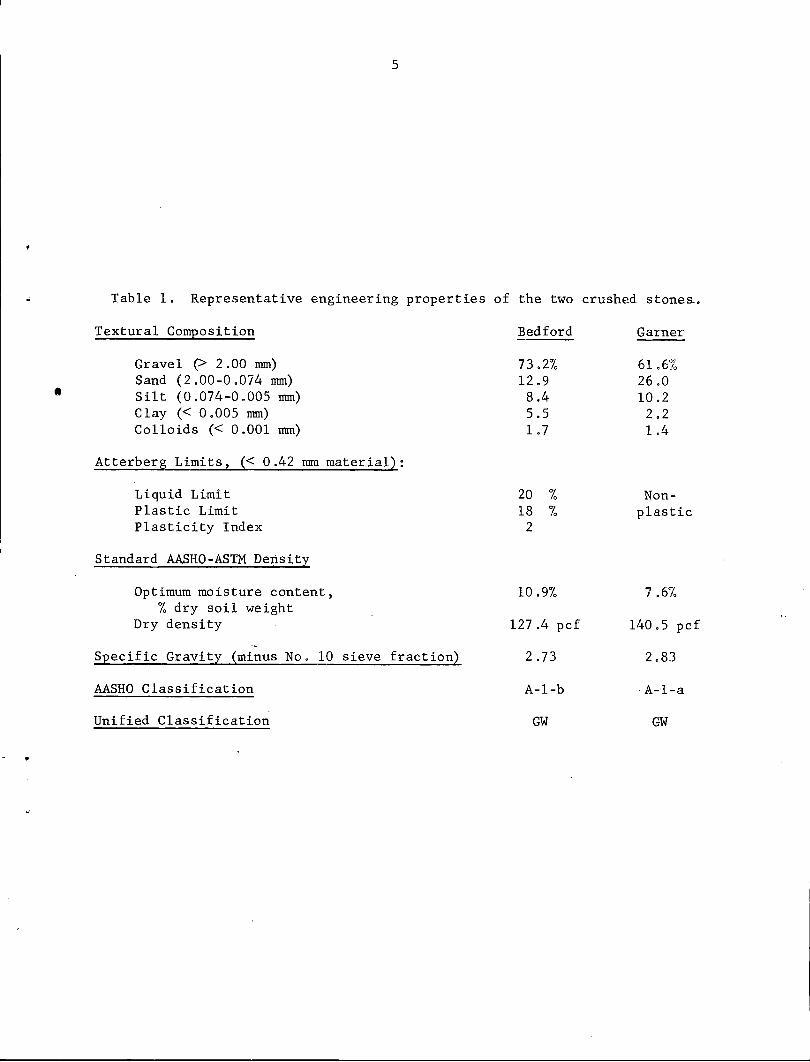
Engineering properties of the two crushed stones are shown.in Table
1. The Bedford stone contains more gravel, less sand and more clay
size particles, and has a measurable plasticity. The optimum moisture
content for compaction is higher and the compacted density lower than
for the Garner sample. The latter of course influences the void ratio,
defined as the volume of voids divided by the volume of solids.
Four-inch diameter by 8-inch high specimens were prepared for
triaxial testing by compacting the crushed stones to standard Proctor
density in a vibratory .mold.
The type of triaxial test used was the consolidated undrained test,
in which the compacted, encased specimen is placed in the triaxial
cell, the cell pressure is applied, and full consolidation is allowed
to take place before testing. The drainage valve is then closed, and
the axial load is applied at a constant strain rate of 0.01 in/min.
Similar procedures were employed to prepare and test the specimens
compacted at modified Proctor density. These data are from the work
of Best (1966) .
•
5
Table 1. Representative engineering properties of the two crushed stones..
Textural Composition
Gravel (> 2 .00 rrnn) Sand (2.00-0.074 mm) Silt (0.074-0.005 rrnn) Clay (< 0.005 rrnn) Colloids (< 0.001 rrnn)
Atterberg Limits, (< 0.42 rrnn material):
Liquid Limit Plastic Limit Plasticity Index
Standard AASHO-ASTM De~sity
Optimum moisture content, % dry soil weight
Dry density
Specific Gravity (minus No. 10 sieve fraction)
AASHO Classification
Unified Classification
Bedford
73.2% 12.9 8.4 5.5 1.7
20 % 18 %
2
10.9%
127 .4 pcf
2.73
A-1-b
GW
Garner
61.6% 26.0 10.2
2.2 1.4
Non-p lastic
7.6%
140.5 pcf
2.83
· A-1-a
GW
6
The triaxial shear tests were run with continuous volume change
and pore water pressure measurements. Data were reduced and plotted
with the aid of computer programs.
ANALYSIS OF THE DATA
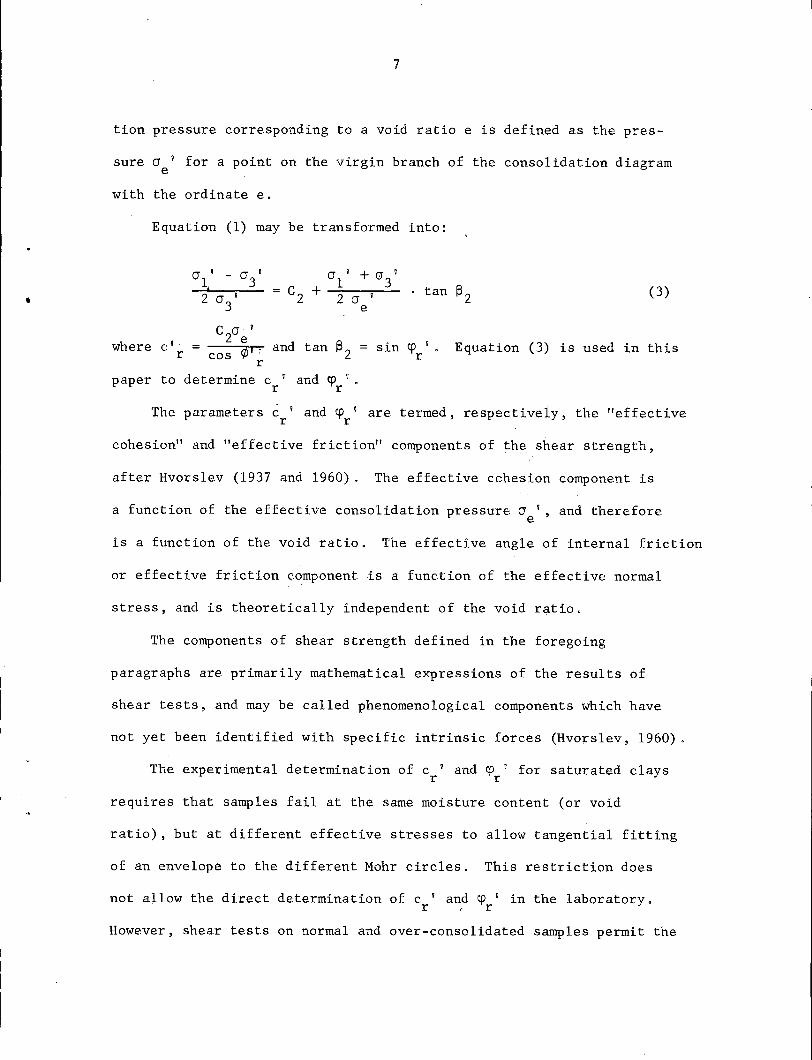
The results may be plotted as shown in Fig. 1? where void ratios (J. v - 03
v Gr v + 03
v
are plotted versus the logarithms of 0'" ( 1 2
) and ( 1 2 ) .
jC
Meanings of these terms are given in Appendix A. This form of pre sen ta-
tion was originated during the Cooperative Triaxial Shear Research Program
of the Corps of Engineers described by Rutledge (1947), and later used
by Henkel (1959 and 1960) for tests on both normal and overconsolidated
clays.
The consolidation history of the sample is taken into considera-
tion in triaxial testing by means of the following equations, after
Bishop and Henkel (1957) .
<\ ' -2 0
e
(J 1 v -
2 0 e
where
I
v
(J 3
cos
1 -
03 v
c = 1
cos cp' r
cp' r sin cpu
r
+tan s1
c' r
1 - sin cp' r
x --· 0 v e
c' r +
(J ' 1 e
(J v
3 (J u
e
' tan sl =
sin cpo
-r
sin cp 0
r
sin cp 0
r 1 - sin cp 0
r
(J 0
3 0 v
e
and
(1)
(2)
0 ' is the equivalent consolidation pressure. The equivalent consolida..,· e
•
7
tion pressure corresponding to a void ratio e is defined as the pres-
sure a v for a point on the virgin branch of the consolidation diagram e
with the ordinate e.
Equation (1) may be transformed into:
a'-au 1 3 2 a u
3
0" I + Q" V
c + 1 3 2 2 0" I
e · tan ~ 2 (3)
C 0" I 2 e
where c'r =cos ¢1: and tan ~ 2 =sin ~rv. Equation (3) is used in this r
paper to determine c v and ~ v • r r
The parameters c ' and~ v are termed, respectively, the "effective r r
cohesion" and "effective friction" components of the shear strength,
after Hvorslev (1937 and 1960). The effective cohesion component is
a function of the effective consolidation pressure a v , and therefore e
is a function of the void ratio. The effective angle of internal friction
or effective friction component is a function of the effective normal
stress, and is theoretically independent of the void r?tio.
The components of shear strength defined in the foregoing
paragraphs are primarily mathematical expressions of the results of
shear tests, and may be called phenomenological components which have
not yet been identified with specific intrinsic forces (Hvorslev, 1960).
The experimental determination of c v and ~ v for saturated clays r r
requires that samples fail at the same moisture content (or void
ratio), but at different effective stresses to allow tangential fitting
of an envelope to the different Mohr circles. This restriction does
not allow the direct determination of c 1 and ~ v in the laboratory. r r
However, shear tests on normal and over-consolidated samples permit the
8
calculation of these parameters by means of equations (1) or (3) .
We may postulate that if the shear strength of a soil is indeed
a function of its void ratio or water content, the line representing
the locus of points of maximum shear stress versus void ratio or moisture
content must be parallel to the line representing the virgin branch
and/or the reloading or unloading branch of consolidation for the
given soil. If this requirement is fulfilled for the soil being tested,
then the shear strength is a unique function of the void ratio and
effective stresses (Hvorslev~ lac. cit.).
DISCUSSION
The data corresponding to the Bedford material are shown in Figs.
1-4. In addition to the usual consolidated-undrained tests, Bedford
samples compacted at standard Proctor density were tested under consolidated-
repeated shear conditions. The repeated shear test was performed in the
following manner: the normal load was applied at the constant axial
strain rate to a maximum axial deflection of 0.075 inches, after which
the axial strain was reversed and run at the same rate back to zero
deflection. This process was repeated twice. The third loading was
carried to failure and/or to constant sample volume.
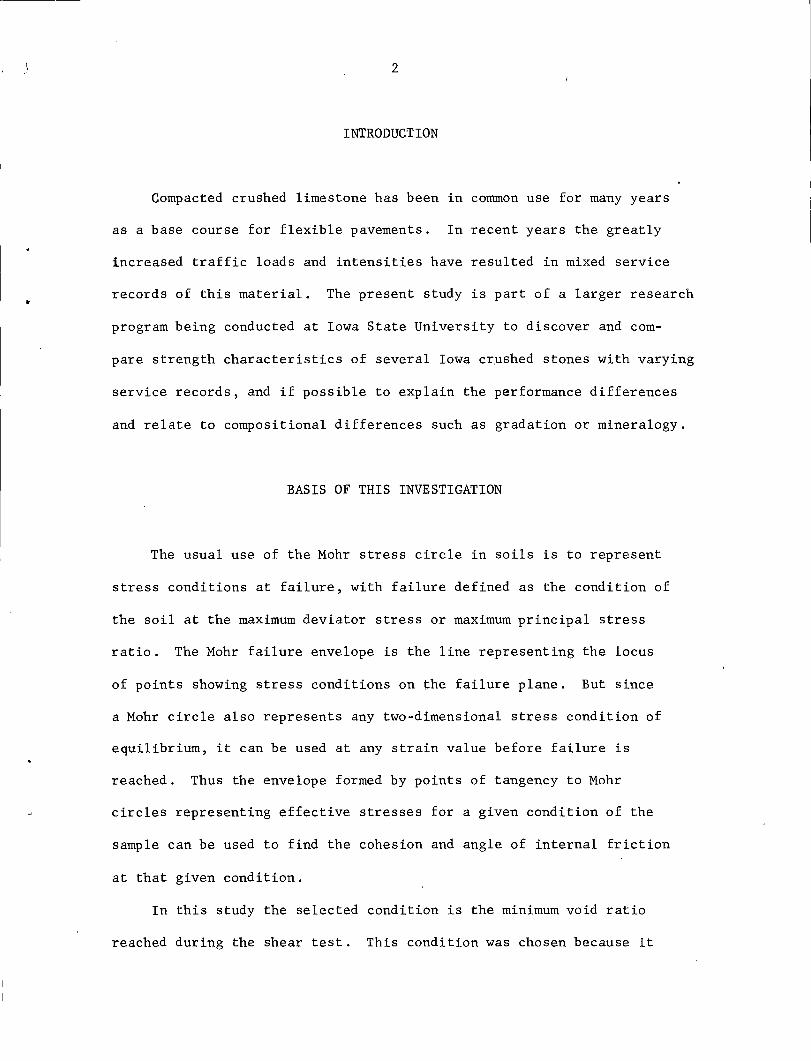
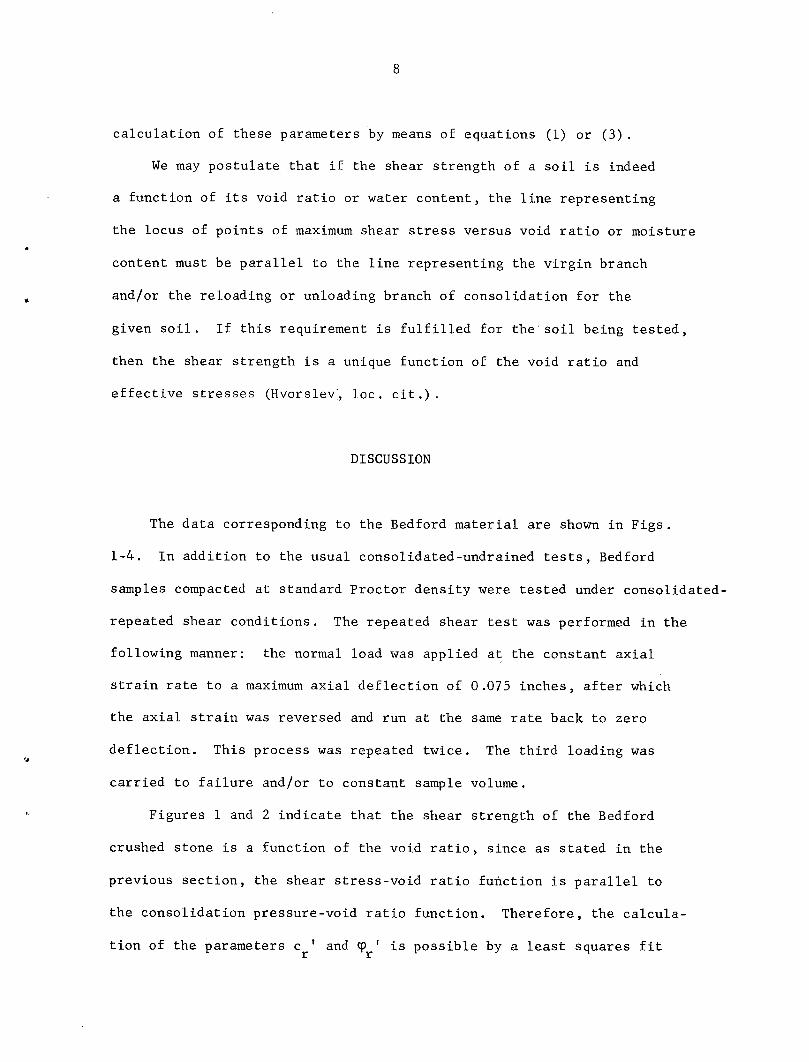
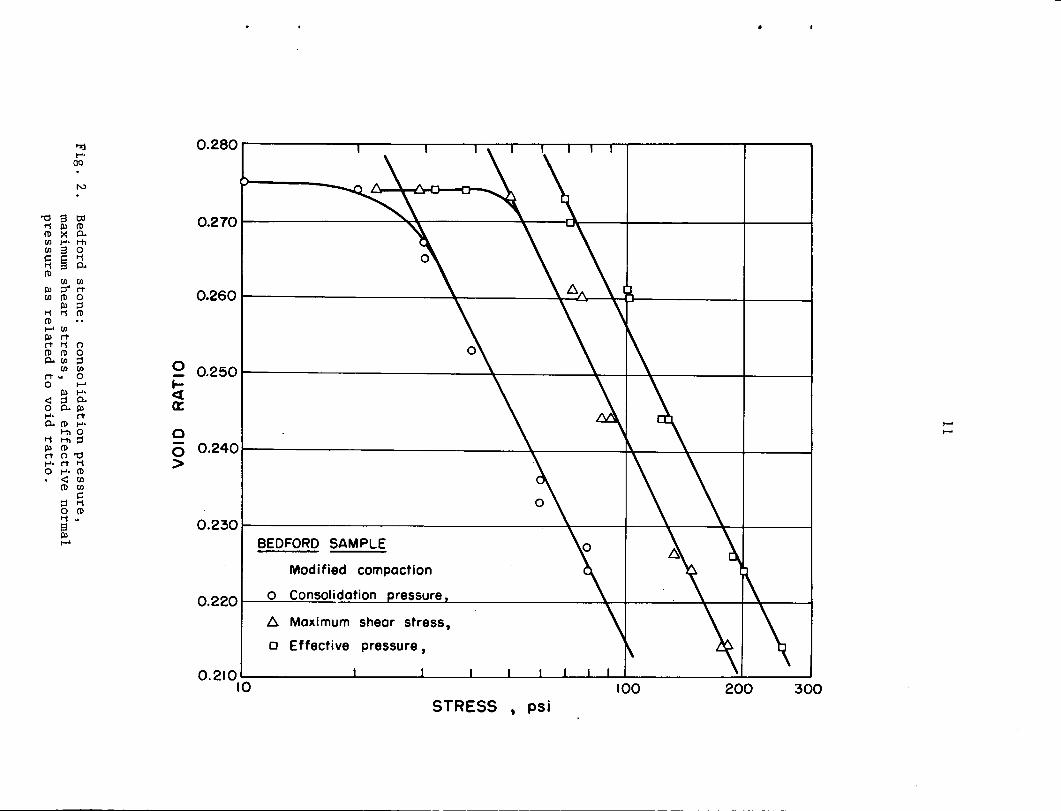
Figures 1 and 2 indicate that the shear strength of the Bedford
crushed stone is a function of the void ratio, since as stated in the
previous section, the shear stress-void ratio function is parallel to
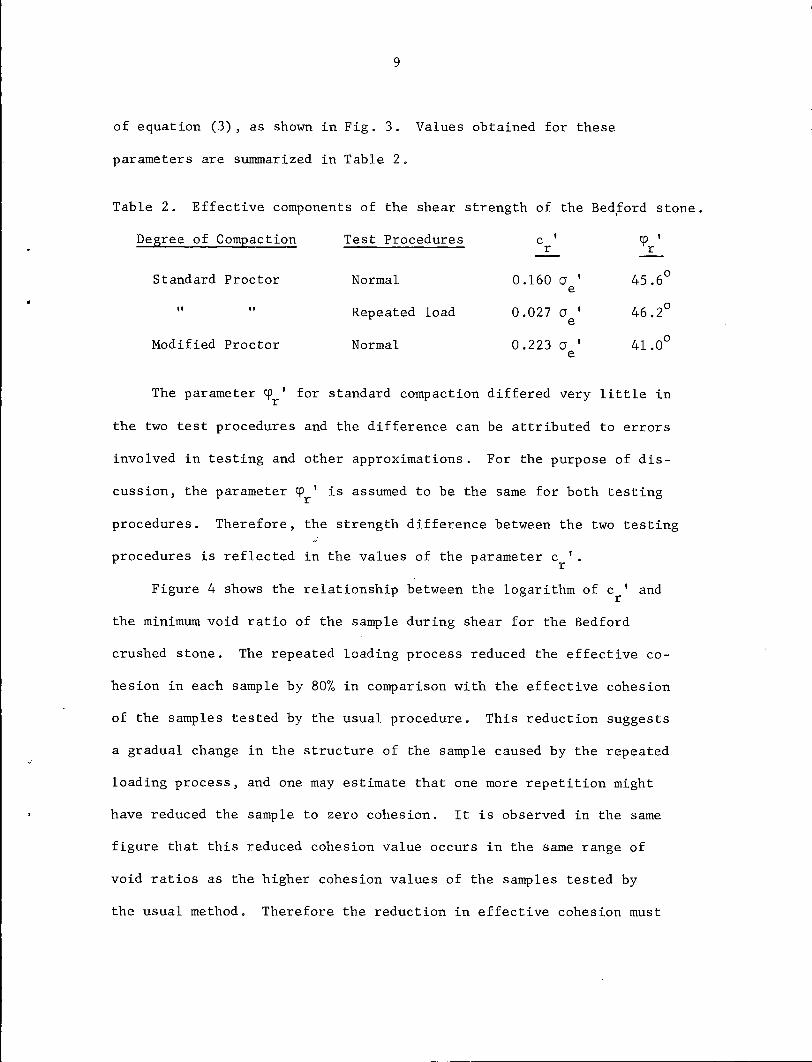
the consolidation pressure-void ratio function. Therefore, the calcula-
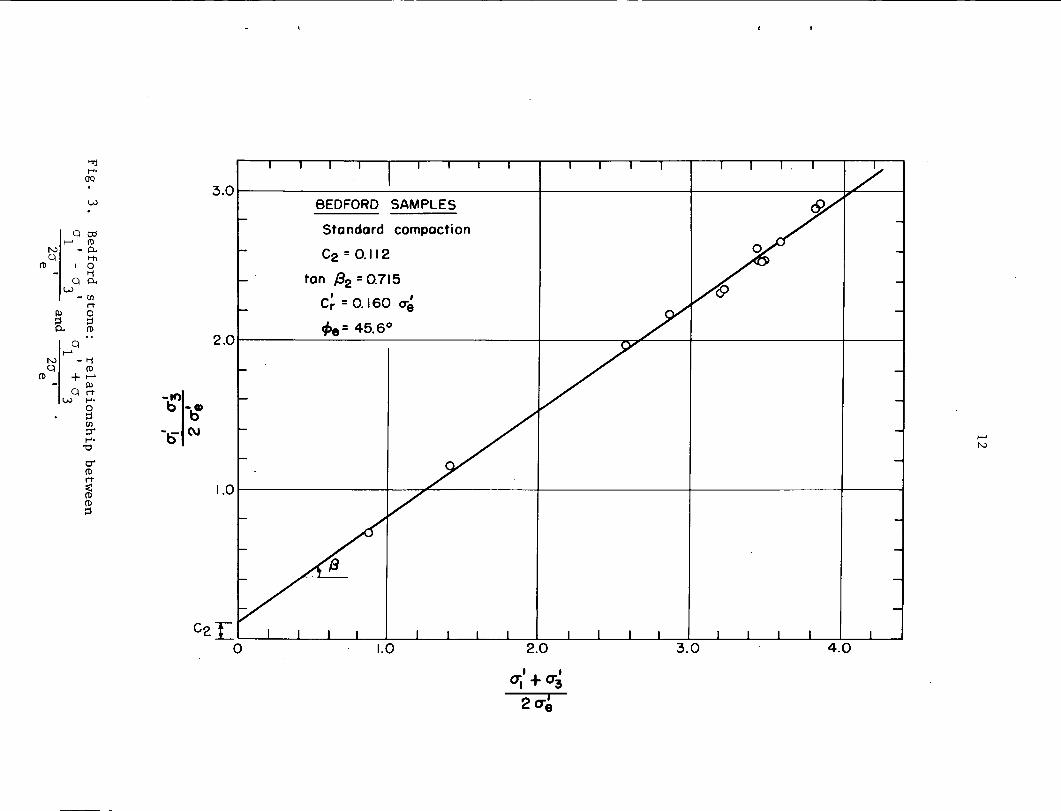
tion of the parameters c ' and ~ ' is possible by a least squares fit r r
9
of equation (3), as shown in Fig. 3. Values obtained for these
parameters are summarized in Table 2.
Table 2. Effective components of the shear strength of the Bed,ford stone.
Degree of Compaction Test Procedures c I cpr
I
r
Standard Proctor Normal 0.160 a 45.6° e
" II Repeated load 0.027 a I 46.2° e
Modified Proctor Normal 0.223 a I 41.0° e
The parameter cp ' for standard compaction differed very little in r
the two test procedures and the difference can be attributed to errors
involved in testing and other approximations. For the purpose of dis-
cussion, the parameter cp ' is assumed to be the same for both testing r
procedures. Therefore, the strength difference between the two testing
procedures is reflected in the values of the parameter c ' . r
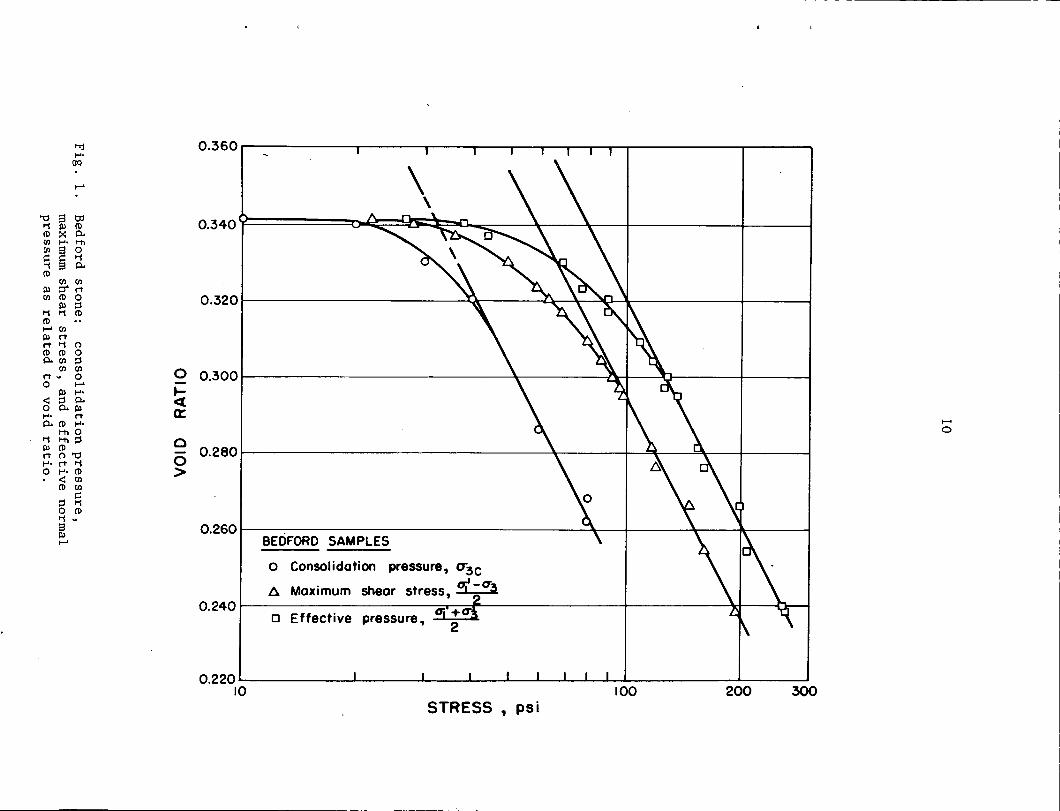
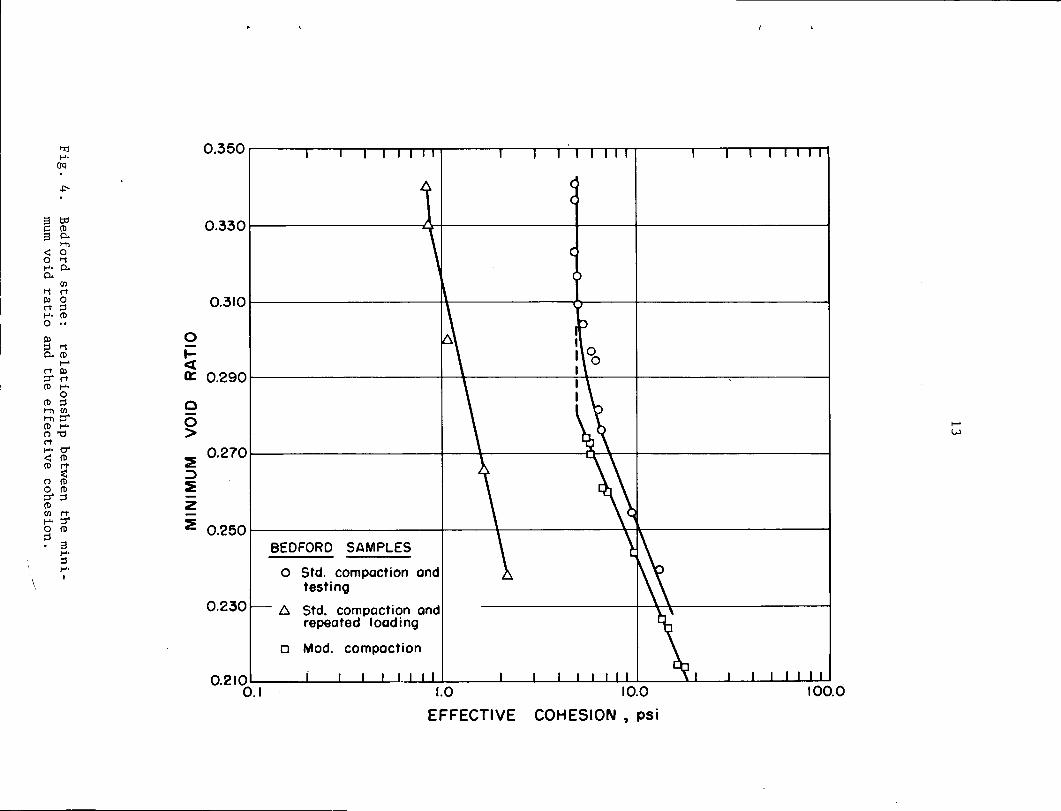
Figure 4 shows the relationship between the logarithm of c ' and r
the minimum void ratio of the sample during shear for the Bedford
crushed stone. The repeated loading process reduced the effective co-
hesion in each sample by 80% in comparison with the effective cohesion
of the samples tested by the usual procedure. This reduction suggests
a gradual change in the structure of the sample caused by the repeated
loading process, and one may estimate that one more repetition might
have reduced the sample to zero cohesion. It is observed in the same
figure that this reduced cohesion value occurs in the same range of
void ratios as the higher cohesion values of the samples tested by
the usual method. Therefore the reduction in effective cohesion must
ti CD ..... (ll
~ rt rt ti CD CD 0. (ll
(ll rt ~ 0
t"rj t-'•
OQ
n 0 ::I (ll
0 ..... ~ t-'•
< ::I 0. 0 0. ~ t-'· rt 0. CD t-'•
1-tt 0 ti 1-tt ::I ~ CD rt n "d t-'• rt ti 0 t-'• CD
< (ll CD en
c ::I ti 0 CD ti ~
~ ..... 0.2601--~~~~~~~~~~~~~~~~~~~--~--1-~~~~~~.._~~-----1
BEDFORD SAMPLES
o Consolidation pressure, CT3c 6. Maximum shear stress, a;'-<T3
0.240t--~~~~~~~~~~~-Oi--r-+-<T-=f"~~~~~~~~~+-~~~~~~1rt-~-tr--t
o Effective pressure, 2
0.220.__~~~~~-'-~~~-'-~--''--~......___._~_._--L..._.__._~~~~~~L--~~--'
10 100 200 300 STRESS , psi
11
r-~~~-,.~~~~-.-~~~~.--~~~-r~~~~..--~~~-r~~~---8
~
r-~~~-;-~~~~-+-~~~~1--~~~-+~~~~+-~~F--4-~~~---10
0 (.\J
I I
oQ
/'
I ~
I I
,,,, 18
UJ
...J Q
.
~
<(
Cf)
0 11:: 0 u. 0 U
J m
0 0
0 0
0 0
CX) ~
<D IO
q
I')
'"" (.\J
N
(.\J t\I
t\I
d d
d d
d 0
0 IJ.'1~ 0101\
Fig
. 2
. B
edfo
rd
ston
e:
co
nso
lidatio
n p
ressu
re,
maxim
um
shear
stre
ss,
and effe
ctiv
e n
orm
al p
ressu
re
as re
late
d
to
vo
id ra
tio.
c 0 -.::: 0 0 Q
. E
0 0
'tJ CD
-= 'tJ 0 ~
.. I
Cl> C
l) .....
Cl)
:J
CD C
l) .....
CD II) - II>
..... Cl>
:J
..... .....
II> 0
II> CD
CD c
.c .....
0 II)
Q.
~
0 E
CD
'tJ :J
>
0
E
:.: 0 II>
II( CD
c 0 -
0 -
u ~
UJ
0 <]
a
0 0
0 (.\J t\I
(\I
d 0
(I)
Q.
.. ff) ff) U
J a: ~
(/)
'Tj t-'•
OQ
3.0 w BEDFORD SAMPLES
q tp Standard compaction ,__.. (1)
N - 0.. C2 = 0.112 q Hl (1) I 0
ti tan {32 = 0.715 q 0.. w
- (/J I I rt Cr = 0.160 <Te
Ill 0 ;:I ;:I
t/>e• 45.6° 0.. (1) .. 2.0 q ,__..
N - ti q (1) (1) +,__..
Ill q rt _.,,
w t-'• 0 b -CD ;:I 0 (/J
::l" -0 (.\J ,__.. t-'•
"O N
0-(1)
rt ~ 1.0 ('!) (1)
;:I
tTj I-'·
()Q
.j:'-
~ td (1l p.. H'l
< 0 0 ti I-'• p.. p..
(/l
ti rt Ill 0 rt ::s I-'• (1l 0 .. Ill ::s ti p.. (1l
t-' rt Ill ::i- rt (1l I-'•
0 (1l ::s H'l (/l
H'l ::i-(1l I-'· n "O rt ..... a" < (1l (1l rt
~ n (1l 0 (1l
::i- ::s (1l (/l rt I-'· ::i-0 (1l
::s . s I-'· ::s I-'•
\ I
0.310
0 .... ~ a: 0.290
0 0 > ~ 0.270 :::::> :E z ~ 0.2501--~~~~~~~~--+~~--+-~~~~~-----i~~~~~~~~~----t
0.230
BEDFORD SAMPLES
o Std. compaction and testing
b. Std. compaction and repeated loading
o Mod. compaction
0.210~~~~~~...._~~~--'-~~~~..__~..___.__.__._........._._._..__~__,._.__~....__.__...._._._.__ ........... 0.1 1.0 10.0 100.0
EFFECTIVE COHESION , psi
t-' VJ
14
in fact be due to a change in the structure rather than difference in
void ratio. "Structure" is understood to mean the arrangement of soil
particles and the electrical forces acting between adjacent particles
(Lambe~ 1958) .
The gradual change from a "cohesive structure" to a "cohesionless
structure" seems to depend on the amount of shearing strain imposed on
the sample rather than on the stress level. It is noteworthy to indicate
that the stress-strain curves were modified by the repeated loading
process. However, the significance of such a change in the stress-
strain diagram is outside the scope of this paper.
Figure 4 also shows that the effective cohesion of the standard
compacted and tested Bedford sample is constant through the higher range
of void ratio, whereas at. lower values the effective cohesion becomes
a linear function of the void ratio. The samples compacted at modi-
fied Proctor density also show a parallel linear relationship. Ap-
parently a certain minimum compactness is required to achieve increasing
cohesive strength with increasing density. The gradual change from a
constant cohesion to a linearly increasing value with a decrease in void
ratio probably indicates a change in structure.
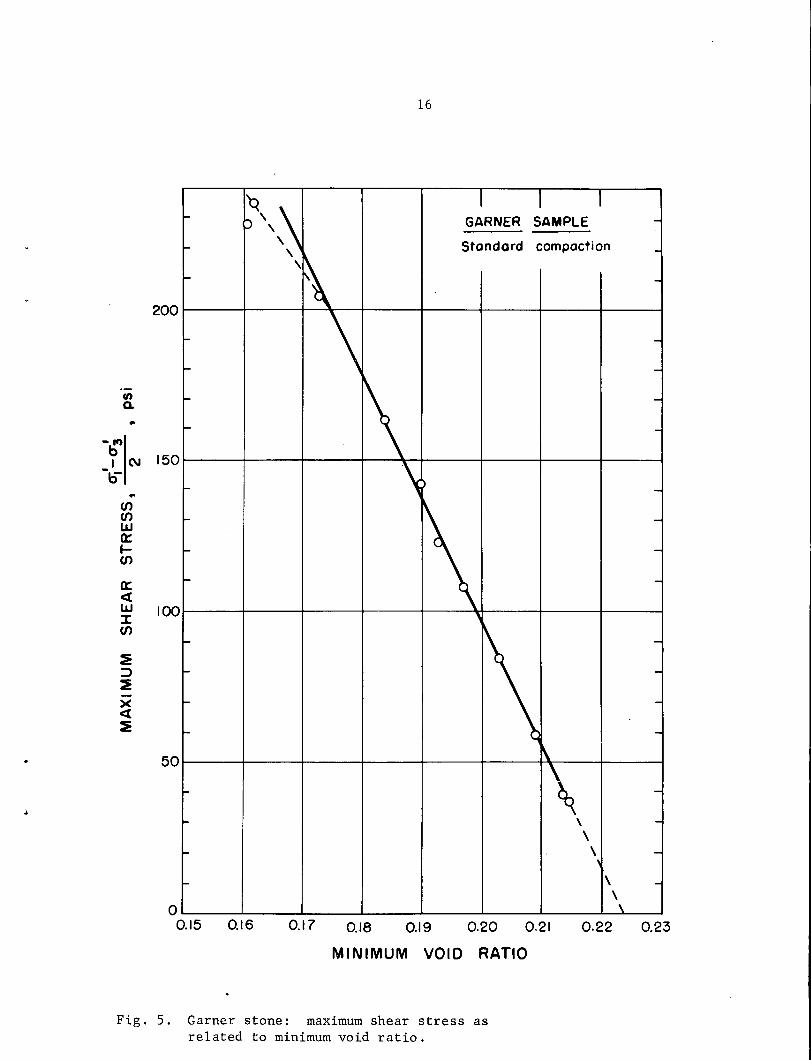
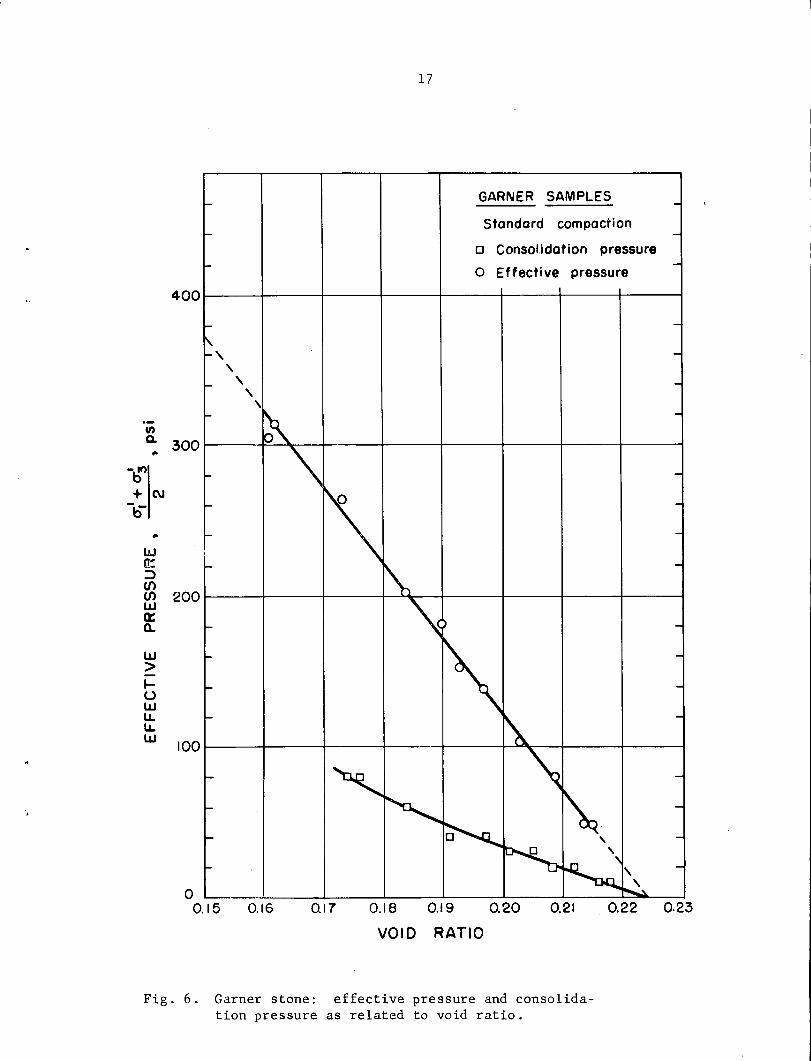
Data corresponding to the Garner material are shown in Figs, 5-7. cr'-cr' cr'+cr'
Figures 5 and 6 indicate that 1 2
3 and 1 2
3 again are linear
functions of the void ratio; they are expressed by:
cr 1 i
- cr 3 I
2 913 - 4075 e min' for e min > 0.175 (4)
cr 1 I - cr3 '
662,5 2640 for < 0.175 2
- e min' e min (5)
and
a ' - a ' 1 3 2
15
1129 ~ 5030 e . min
The effective cohesion, c ', is zero for the Garner specimens. r
( 6)
Therefore the friction component must be a function of the void ratio.
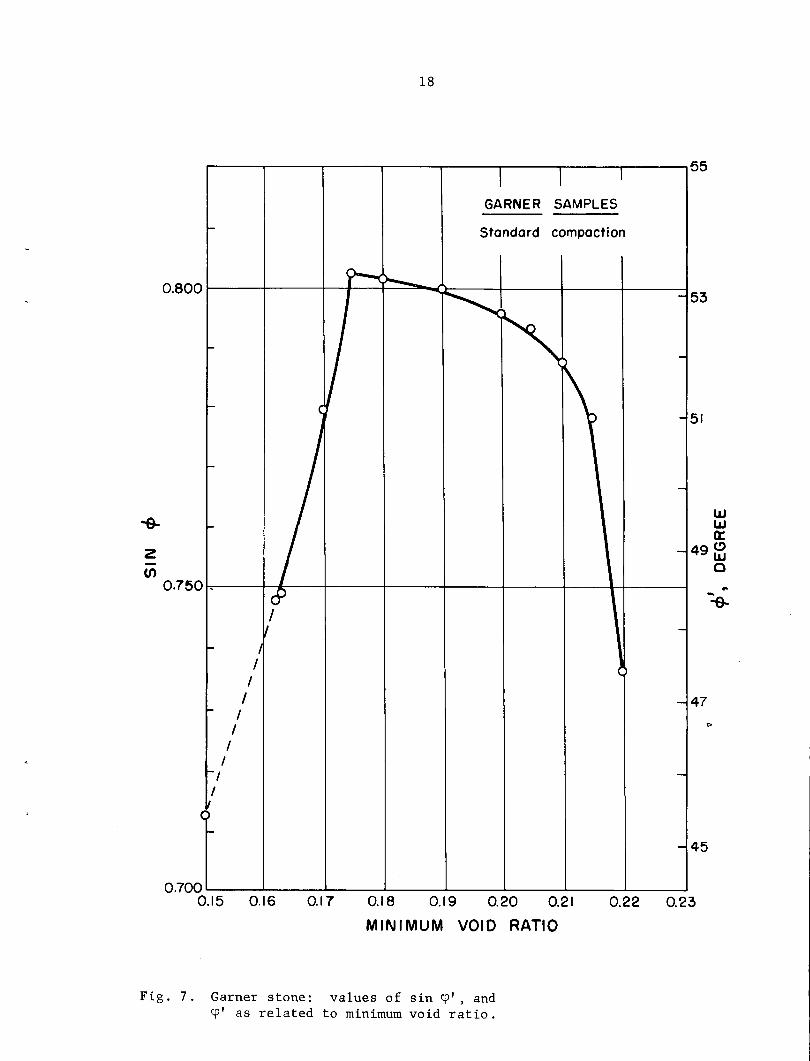
Figure 7 shows the relationship between sin ~' and the minimum
void ratio, where sin~· is given by the following equation:
a ' - a ' 1 3 2
a'+a' 1 3 2 sin ~· (7)
Figure 7 indicates that the angle of friction, ~·, increased as
the void ratio decrease to a value 0.175. Once this void ratio was
reached, there was a change in the relationship and sin~' decreased
as the void ratio decreased. This change may be due to increased
effective pressure causing crushing of interparticle contacts, reducing
friction between the particles. The beneficial increase of sin~·
with decrease in void ratio and increase in effective pressure may
relate to an increasing number of interparticle contacts.
An interesting result is obtained when e . is extrapolated to min
zero in equations (5) and (6):
(J I - 0"3 I
al I +a I
1, 662.4 & 3 2 2 1129, which gives sin~· 0.587
and ~· 0
= 35.9 .
The predominant mineral in the Garner crushed stone is calcite.
Horn (1961) found the friction between surfaces of pure calcite sub-
merged in water was 34.3°, by using a slider which applies shear force
on three small "feet" sticking out of the highly polished contact sur-
faces. The purpose was to obtain an area of contact as small as possible.
Q \
fl) CL ..
\ \
\ \
16
GARNER SAMPLE
Standard compaction
_.., b -I (\I
b- .. en en LLJ a: .... en a: <t LLJ z en
~ :::> ~ )( <t ~
150
100
50
\ \
\
\ \
OL-~~...L._~~....L~~....L~~--L~~___._~~--'-~~---JL...-l....----1
0.15 0.16 0.17 0.18 0.19 0.20 0.21
MINIMUM VOID RATIO
Fig. 5. Garner stone: maximum shear stress as related to minimum void ratio.
0.22 0.23
Cl)
Cl. .. _.,, 0 + C\J
-b-
.. lAJ etc :::> CJ) CJ) UJ a:: a..
UJ > I-u UJ u.. u.. UJ
'\
300
200
100
0 0.15
' ' ' '\
0.16 0.17
17
GARNER SAMPLES
Standard compaction
a Consolidation pressure
o Effective pressure
0.18 0.19 0.20 0.21 0.22
VOID RATIO
Fig. 6. Garner stone: effective pressure and consolidation pressure as related to void ratio.
0.23
-&-
2 (/)
0.750 -
I I
I I
I I
I I
I
18
GARNER SAMPLES
Standard compaction
w w a:
49 C> w 0
.. -=a-
47
45
0.700 .____ __ .____ __ ...i........ __ ...J...._ __ __.._ __ __._ __ __.. __ ___. __ ____.
0.15 0.16 0.17 0.18 0.19 0.20 0.21
MINIMUM VOID RATIO
Fig. 7. Garner stone: values of sin~', and ~· as related to minimum void ratio.
0.22 0.23
19
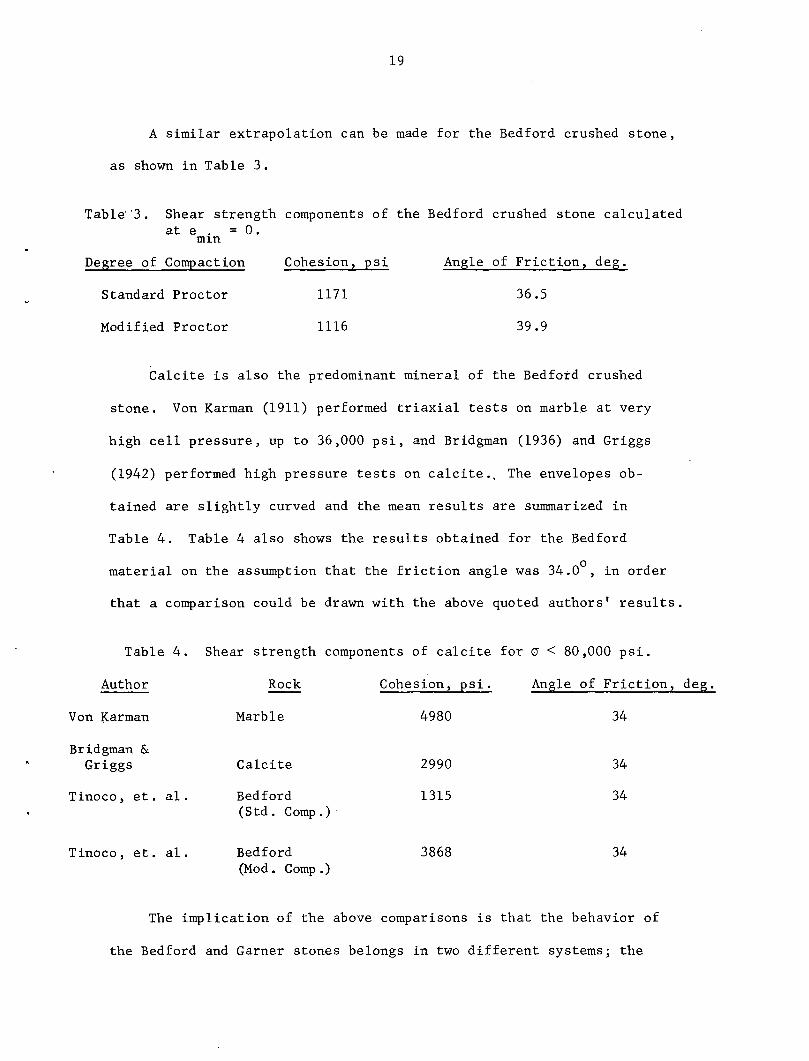
A similar extrapolation can be made for the Bedford crushed stone,
as shown in Table 3.
Table· '3. Shear strength components of the Bedford crushed stone calculated at e . = 0.
min
Degree of Compaction Cohesion, psi Angle of Friction, deg.
Standard Proctor 1171 36.5
Modified Proctor 1116 39.9
Calcite is also the predominant mineral of the Bedford crushed
stone. Von Karman (1911) performed triaxial tests on marbl.e at very
high cell pressure, up to 36,000 psi, and Bridgman (1936) and Griggs
(1942) performed high pressure tests on calcite., The envelopes ob-
tained are slightly curved and the mean results are sunnnarized in
Table 4. Table 4 also shows the results obtained for the Bedford
material on the assumption that the friction angle was 34.0°, in order
that a comparison could be drawn with the above quoted authors' results.
Table 4. Shear strength components of calcite for a< 80,000 psi.
Author
Von Karman
Bridgman & Griggs
Tinoco, et. al.
Tinoco, et. al.
Rock
Marble
Calcite
Bedford (Std. Comp.)·
Bedford (Mod . Comp . )
Cohesion, psi. Angle of Friction, deg.
4980 34
2990 34
1315 34
3868 34
The implication of the above comparisons is that the behavior of
the Bedford and Garner stones belongs in two different systems; the
•
20
Garner extrapolates to pure sliding friction, whereas the Bedford
extrapolates to sliding friction plus a cohesion comparable to values
found in solid rock.
The exponential shear stress-void ratio function for the Bedford
would appear to indicate increased cohesion caused by increased grain
contact areas under higher pressures. This implies a compressibility
of the Bedford stone particles. Under repeated loading, slight inter
granular shear movements could perhaps cause the loss in cohesion,
since grains would rio longer be properly arranged or interlocked to
cause an increase in contact areas with loading. That is, repeated
compressions result in densification and a mass action rather than a
point-contact building-block action of individual grains.
In the case of the Garner material, the shear stress-void ratio
function is linear and therefore reflects the state of packing within
the granular system. The friction parameter is therefore a measure of
the interparticle interaction rather than the frictional characteristics
of the particles. Thus most crushed stones, unlike the Bedford, tend
to maintain strength under repeated loading.
CONCLUSIONS
The shear-stress-void ratio function is an index to the behavior
of compacted crushed stone materials under shear. Two different types
of behavior are inferred: (a) compression of particle contacts under
loading, increasing cohesion and giving an exponential relationship
between shear strength and void ratio, and (b) sliding at point contacts
~
•
21
between particles, giving a linear relationship between shear strength
and void ratio.
Behavior (a) apparently is not stable under repeated loading,
since shear strength is gradually lost. This suggests a structural
rearrangement of the grains which reduces grain-to-grain contact under
pressure, and therefore cohesion. That is, the beneficial effect of
consolidating pressures is gradually lost. Thus under repeated loading
the behavior is similar to that of a clay.
In contrast, behavior (b) should be stable under repeated loading.
The difference in behavior of the two stones thus may relate to
the compression and shear character of the individual grain-to-grain
surface contacts, which in turn should relate to some petrographic
characteristics of the rock.
ACKNOWLEDGEMENTS
The research reported herein is a portion of a project on ''Factors
Influencing Stability of Granular Base Course Mixes" under contract with
the Iowa Highway Research Board, Iowa State Highway Commission and
Bureau of Public Roads, U.S. Department of Commerce.
Appreciation is extended to the following organizations and per
sonnel: to the Iowa Highway Research Board and Bureau of Public Roads
for their continuing support of this project; to Mr. Steve Roberts,
Director of Research, Mr. Tom McElherne, Materials Engineer, and Mr. Ted
Welp, Geologist, Iowa State Highway Commission, for their valuable as
sistance· and counseling; and to Dr. Turgut Demirel, Iowa State University,
for his advice, interest, and criticisms.
•
22
REFERENCES
1. Anderson, A. A. and Welp, T. L. (1960). "An engineering report on the soils, geology, terrain and climate of Iowa." Iowa State Highway Connnission. Ames, Iowa pp. 3-12.
2. Best, T. (1966). Private communication. Ames, Iowa.
3. Bishop, A. W. and Henkel, D. J. 0957,) . "The measurement of soil properties in the triaxial test." 190 pages. Edward Arnold Ltd, London.
4. Bridgman, P. W. (1936). "Shearing phenomena at high pressures." Proc. Amer. Acad. Arts. Sci., 71, pp. 387-469. In Skempton, A. W. (1960). Effective Stress in soils., concrete and rocks." Proc. of Cpnference on Pore Pressure and Suction:in Soils. Butterworths, London, pp. 4-16.
5. Handy, R. L. (1965). "Quantitative X-ray diffraction measurements by fast scanning." Analytical Techniques for Hydraulic Cements and Concrete, ASTM STP 395, Am. Soc. Testing Matl's., pp. 30-44.
6. Henkel, D. J. (1959) , "The relationships between shear strength, pore water pressure and volume-change characteristics of saturated clays". Geotechhique, Vol. 9, pp. 119-135.
7. '· (1960). "The relationship between the effective stresses and water content in saturated clays." Geotechnique, Vol. 10, pp. 41-54.
8. Horn, H. M. (1961) . "An investigation of the frictional characteristics of minerals." Ph.D. Thesis. Department of Civil Engineering, University of Illinois, Urbana.
9. Hvorslev, M. J. (1937). "ueber die Festigkeit seigenschaften gest8rter bindiger B8den" . (On the strength properties of remolded cohesive soils) . Ingeniorvidenskabelige Skrifter A. No. 45, 159 pages. Reviewed in Hvorslev, M. J. (1960) . "Physical components of the shear strength· of saturated clays." Research conference on Shear Strength of Cohesive Soils. Am. Soc. Civ. Engr. Boulder, Colorado, pp. 169-273.
10. < (1960) . "Physical components of the shear strength of saturated clays." Research Conference on Shear Strength of Cohesive Soils. Am. Soc. Civ. Engr. Boulder, Colorado, pp. 169-273.
11. Griggs, D. T. (1942). "Strength and plasticity". Handbook of Physical Constants, Geol. Soc. America. Special Paper, No. 36,
23
pp. 107-130. In Skempton, A. W. (1960). "Effective Stress in Soils, Concrete and Rocks." Proc. of Conference on Pore Pressure and Suction in Soils. Butterworths,-London, pp. 4-16.
12. Karman, Th. Von (1911). "Festigkeitsversuche unter allseitigen Druck". Ziet. Vereines Deutsch. Ing., 55, pp. 1749-57. In Skempton, A. W. (1960). "Effective stress in soils, concrete and rocks." Proc. of Conference on Pore Pressure and Suction in Soils. Butterworths, London, pp. 4-16.
13. Lambe, T. W. ( 1958) . "The structure of compacted clay". Proc. Am. Soc. Civ. Engr. SMF Div., Vol. 84, No. SM2, Paper No. 1654, 34 pages.
14. Rutledge, P. C. (1947). "Review of cooperative triaxial research program of the Corps of Engineers". Progress Report on Soil Mechanics Fact Finding Survey. Waterways Experiment Station, Vicksburg, Mississippi, pp. 1-178.
a' 3c
al I
• al
I a3 I
2
a I + a3 I
1 2
a I
e
c I
r
cp I
r
c 1
Cz
s1
Sz
•
24
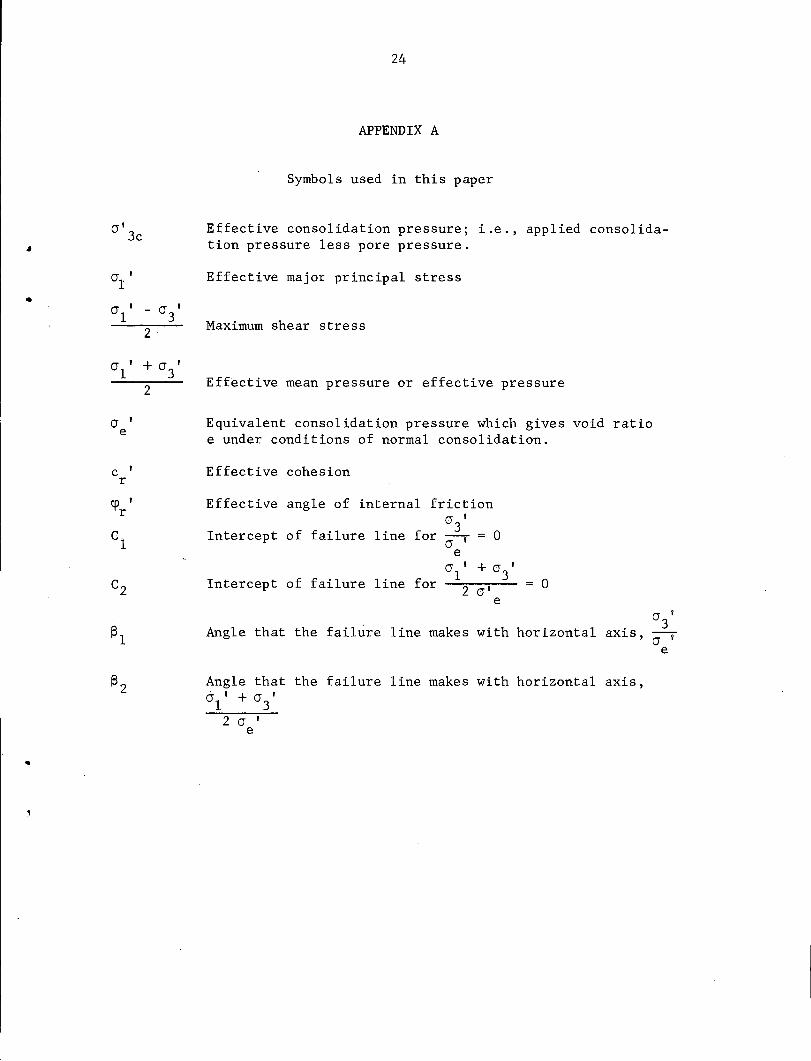
APPENDIX A
Symbols used in this paper
Effective consolidation pressure; i.e., applied consolidation pressure less pore pressure.
Effective major principal stress
Maximum shear stress
Effective mean pressure or effective pressure
Equivalent consolidation pressure which gives void ratio e under conditions of normal consolidation.
Effective cohesion
Effective angle of internal friction Q" I
3 Intercept of failure line for CJ' e
0
a'+a' 1 3 Intercept of failure line for ~-2~a_,...,~-
e 0
a I
3 Angle that the failure line makes with horizontal axis, 0:-V
Angle that the failure line makes with horizontal axis, a ' +a ' 1 3
2 a I e
e