Engineering Economics Ch 2
71
Engineering Economics Dr. Karim Kobeissi
-
Upload
karim-kobeissi -
Category
Documents
-
view
36 -
download
2
description
Dr. Karim Kobeissi
Transcript of Engineering Economics Ch 2

Engineering Economics
Dr. Karim Kobeissi

Chapter 2: Cash-Flow &Time Value of Money
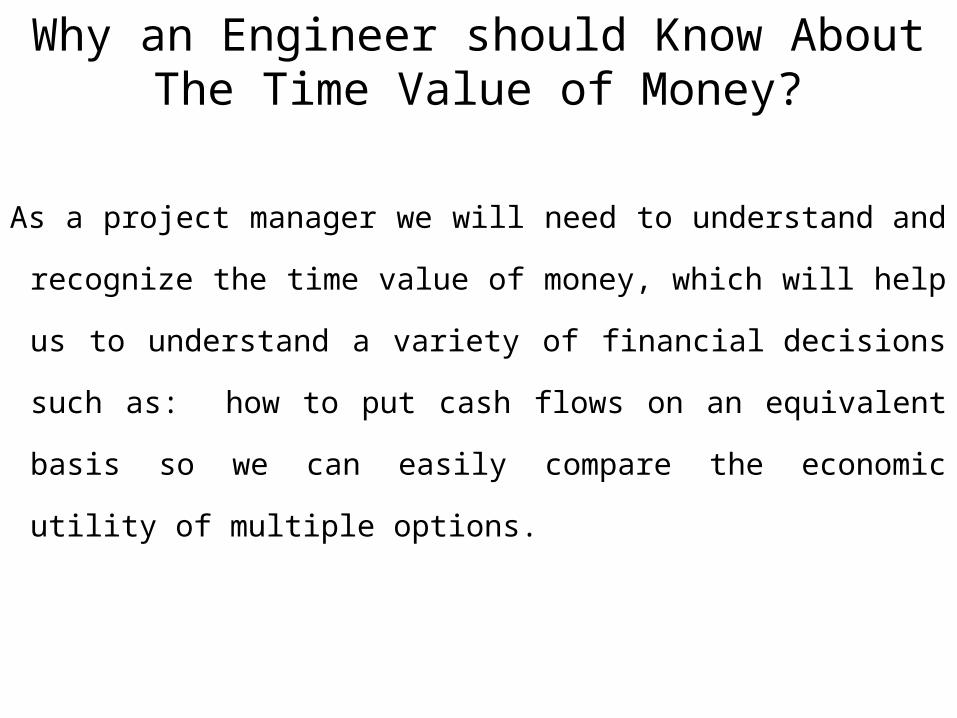
Why an Engineer should Know About The Time Value of Money?
As a project manager we will need to understand and
recognize the time value of money, which will help us to
understand a variety of financial decisions such as: how to
put cash flows on an equivalent basis so we can easily
compare the economic utility of multiple options.

Cash-Flow• Cash flow refers to the money entering or leaving a project or
business during a specific period of time.• When analyzing the economic feasibility of a project or design, we
will compare its cash flow with the cash flow of other alternatives.• The following table shows the cash flow for a simple 6-month project.
The project starts on January 1 with a small initial investment and receives income in two installments.
Date Amount
Jan 1 - 1,500
March 31 + 3,000
June 30 + 3,000

Cash-Flow Diagram• A cash flow diagram shows a visual representation of a cash flow
[receipts and disbursements (money going out)].• For instance, here is the cash flow diagram for the cash flow
described in the table on the previous slide.
0
1 2 3 4 5 6
-$1,500
$3,000 $3,000

Cash-Flow Diagram—Details• The horizontal axis represents time. It is divided into equal time
periods (days, months, years, etc.) and extends for the duration
of the project.
• Up arrow = we receive $; down arrow = we pay $
• Cash flows that occur within a time period (both inflows and
outflows), are added together and represented with a single
arrow at the end of the period.
• When space allows, arrow lengths are drawn proportional to
the magnitude of the cash flow.
• Initial investments are show at time 0.

Cash-Flow Diagram—Perspective• Cash flow diagrams are always from some perspective.
• A transfer of money will be an inflow or outflow depending on your perspective.
• Consider a borrower that takes out a loan for $5,000 at 6% interest. From the
borrower’s perspective, the amount borrowed is an inflow. From the lender’s
perspective, it is an outflow.
-$5,000
+$5,300
-$5,300
+$5,000
Borrower’s Perspective Lender’s Perspective

Cash-Flow Diagram—Example
A grass mower will cost $600. Maintenance costs areexpected to be $180 per year. Income from mowinggrass is expected to be $720 a year. The salvage valueafter 3 years is expected to be $175.
-$600
-$180
+$720 +$720
-$180 -$180
+$720
+$175
-$600
+$540 +$540+$715
Simplified cash flow diagram with net cash-flow shown at the end of each time period.
OR

Time Value of Money
• The process of calculating values of
cash flows is known as time value of
money.
• Time value of money numeral the
sum of interest paid/earned over a
given amount of time.

Time Value of Money• $100 received today is worth more than $100 received one year
from now.• If you don’t believe this, give me $100 and I will gladly give you back
$100 in one year.• That would be a bad deal for you because:
– I could invest the money and keep the interest earned on your money.
– If there was inflation in the economy during the time I was holding onto your
money, the purchasing power of the $100 I give back will be less than the $100
you gave me.
– There is a risk I won’t return the money.
• For all these reasons, when discussing cash flows over time you have
to take into account the time value of money.

Interest• Because of the time value of money, whenever money is
loaned, the lender expects to get back the money loaned
plus interest.
• Interest is the price paid for the use of borrowed money.
• As with any financial transaction, interest is either
something you pay (a disbursement) or something you earn
(a receipt) depending on whether you are doing the
borrowing or the lending.

Interest Rate
Interest rate – Interest paid over a time period
expressed as a percentage of principal:

Rate of Return
• Interest earned over a period of time is expressed as a percentage of the original amount (principal)
interest accrued per time unitRate of return (%) = x 100%
original amount
Borrower’s perspective – interest rate paid
Lender’s or investor’s perspective – rate of return earned
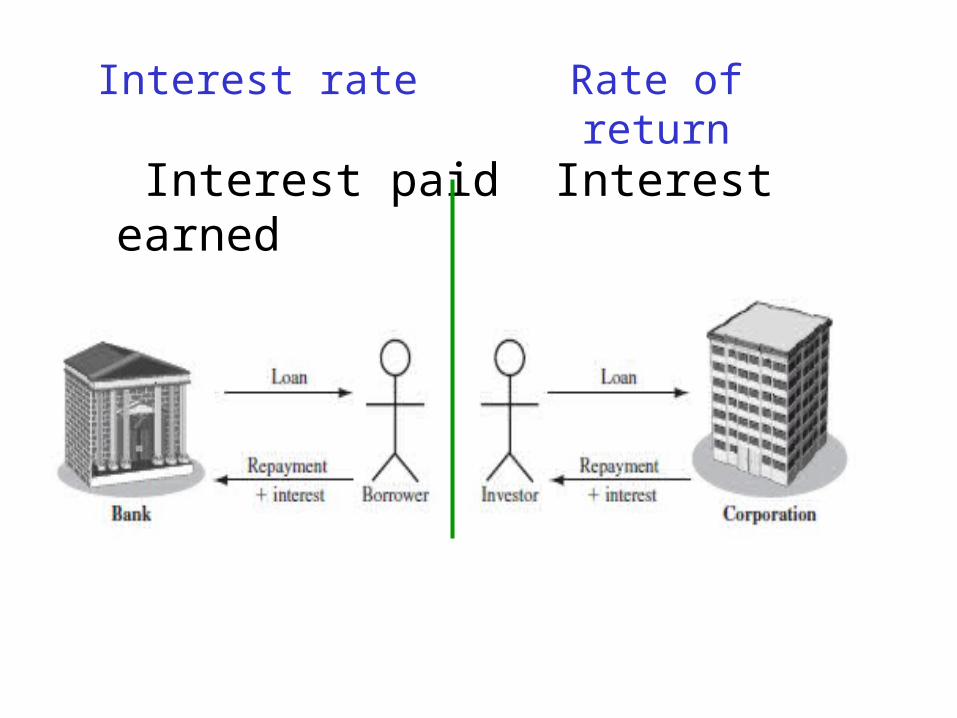
Interest paid Interest earned
Interest rate Rate of return
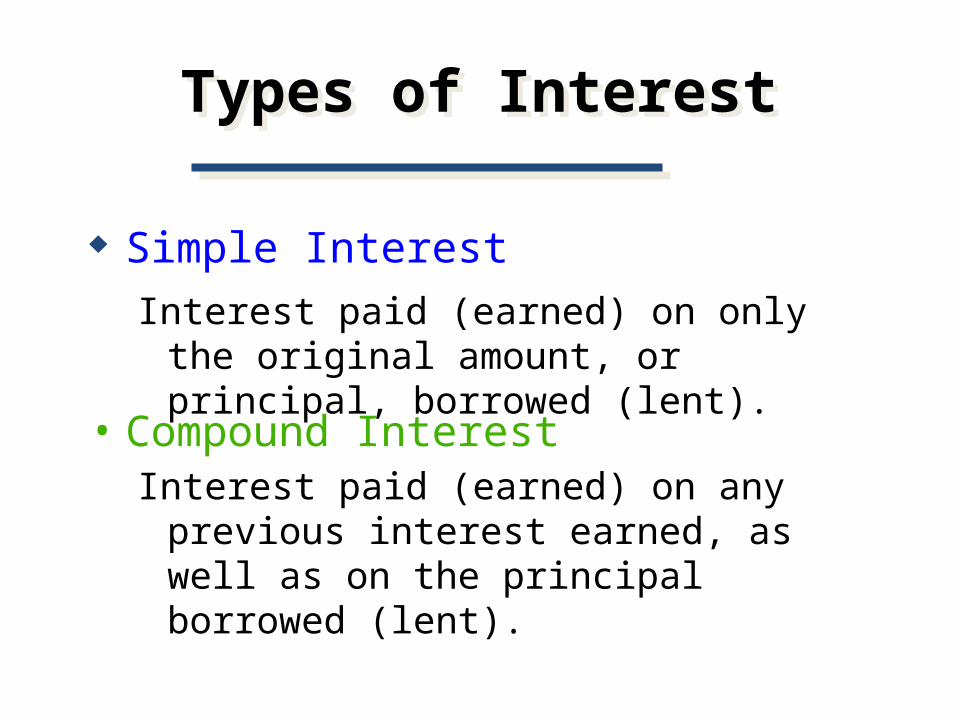
Types of InterestTypes of Interest
• Compound InterestInterest paid (earned) on any previous interest
earned, as well as on the principal borrowed (lent).
Simple InterestInterest paid (earned) on only the original
amount, or principal, borrowed (lent).

Single-Payment Simple Interest
How much a known investment
earning simple interest will be
worth in the future , assuming
an interest rate of (i)%?

Cash Flow Diagram

Simple Interest FormulaSimple Interest Formula
Formula SI = P0(i)(n)
SI: Simple InterestP0: Deposit today (t=0)
i: Interest Rate per Periodn: Number of Time Periods

• SI = P0(i)(n) = $1,000(.07)(2)
= $140
Simple Interest ExampleSimple Interest Example
• Assume that you deposit $1,000 in an account earning 7% simple interest for 2 years. What is the accumulated interest at the end of the 2nd year?

FV = P0 + SI = $1,000 + $140= $1,140
• Future Value is the value at some future time of a present amount of money, or a series of payments, evaluated at a given interest rate.
Simple Interest (FV)Simple Interest (FV)
• What is the Future Value (FV) of the deposit?

The Present Value is simply the $1,000 you originally deposited. That is the value today!
• Present Value is the current value of a future amount of money, or a series of payments, evaluated at a given interest rate.
Simple Interest (PV)Simple Interest (PV)
• What is the Present Value (PV) of the previous problem?

Single-Payment Compound-Amount
How much a known investment
earning compound interest will be
worth in the future , assuming an
interest rate of (i)%?

Cash Flow Diagram


FV1 = P0(1+i)1
FV2 = P0(1+i)2
etc …..
Single Deposit Future Value Formula:FVn = P0 (1+i)n = P0 (FVIFi,n) -- See Table I
Single Deposit Future Value (Compound Interest)
Single Deposit Future Value (Compound Interest)
Accordingly, FV2 = $1,000 (FVIF7%,2)
= $1,000 (1.145)= $1,145 [Due to Rounding]

Table I: FVIFi,n


P r o j e c t E x a m p l eWe are considering a project that will require a $300,000 investment. A
viable alternative that must be considered is to “do nothing” and bank
the money that would have been invested in the project. What is the
value of $300,000 after 8 years assuming an interest rate of 6%? In
shorthand notation:
Using the formula derived earlier:
FVn = P0 (1+i)n = $300,000 * (1+.06)8 = $478,154
If our 8 year project is expected to return less than $478,140 (and
there aren’t any intangibles that make the project a more attractive
alternative), we should pass.
Single-Payment Present-Worth
How much do we need to invest today in order
to have a certain known sum in the future , assuming
an interest rate of (i)%?

Cash Flow Diagram


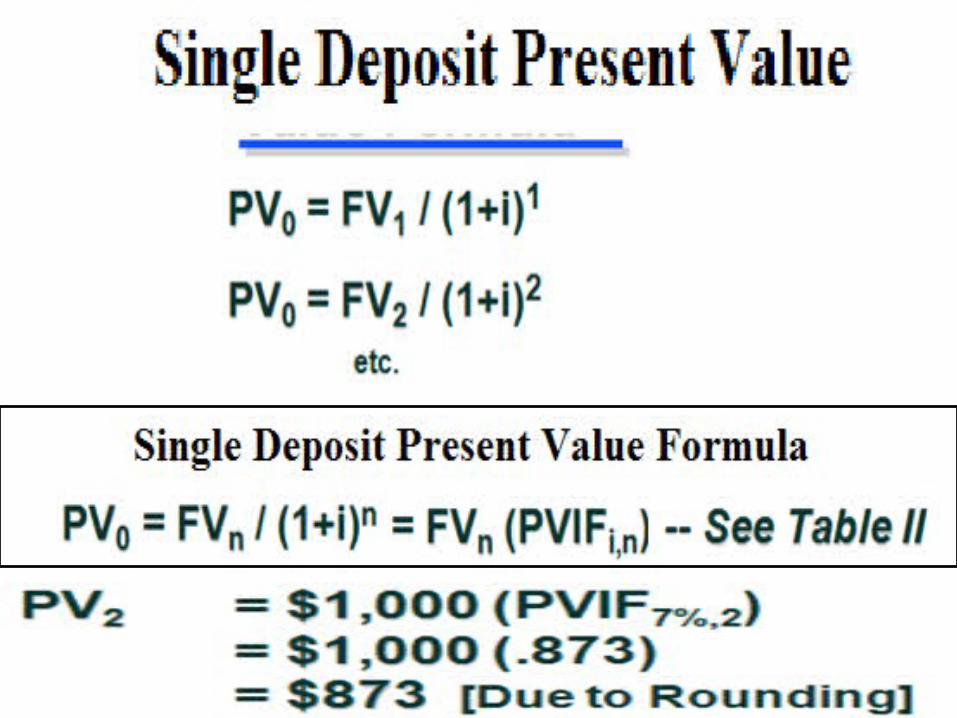

Table II: PVIFi,n = 1 / (1+ i)n


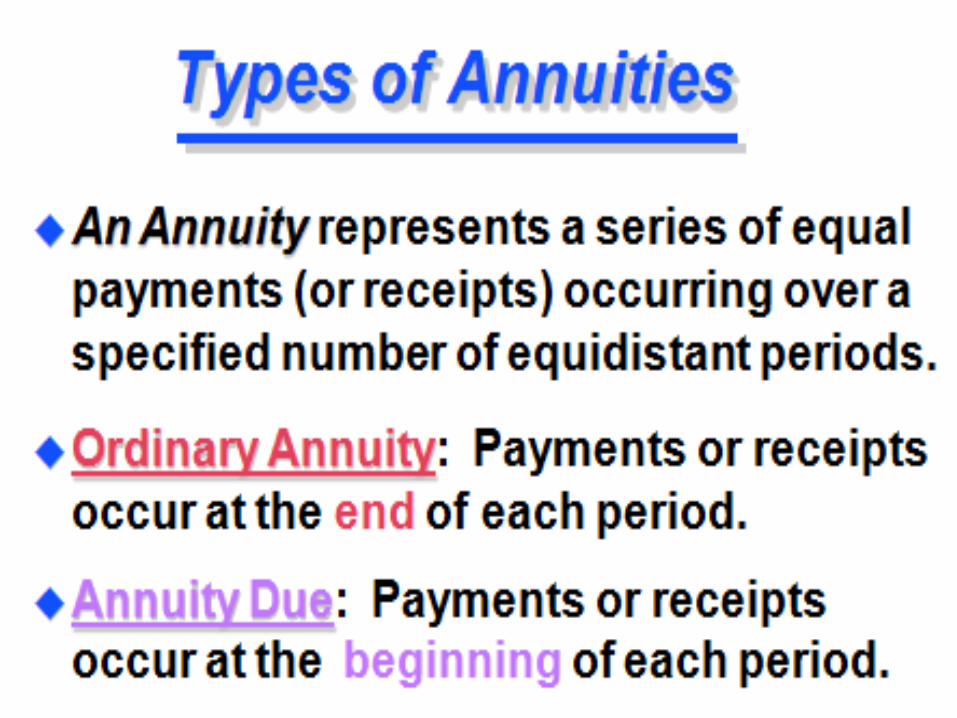
A n n u i ti e s
The previous formulas dealt with the time
value of one-time payments. The next
formulas deal with the time value of a series
of equal payments.
Examples of Annuities
• Student Loan Payments• Car Loan Payments• Insurance Premiums• Mortgage Payments• Retirement Savings


Equal-Payment-Series Compound-Amount
How much we will have after (n)
periods (year/month/etc) if we invest
a known amount every period for (n)
periods, assuming an interest rate of
(i)% ?

Cash Flow Diagram


Future Value of an Ordinary Annuity:
FVAn = R [ ] = R (FVIFAi%,n)
Where:
i is the interest rate per compounding period; n are the number of compounding periods; and R is the fixed periodic payment.
Accordingly, FVA3 = $1,000 (FVIFA7%,3) = $1,000 (3.215)
= $3,215
Va l u ati o n U s i n g Ta b l e I I IVa l u ati o n U s i n g Ta b l e I I I

Table III: (FVIFAi%,n)

Example: Future Value of an Ordinary AnnuityMr A deposited $700 at the end of each month of calendar year 2010 in an
investment account of 9% annual interest rate. Calculate the future value of the annuity on Dec 31, 2011. Compounding is done on monthly basis.
SolutionWe have,Periodic Payment R = $700Number of Periods n = 12Interest Rate i = 9%/12 = 0.75%Future Value FV = $700 × {(1+0.75%)^12-1}/1% = $700 × {1.0075^12-1}/0.01 ≈ $700 × (1.0938069-1)/0.01 ≈ $700 × 0.0938069/0.01 ≈ $700 × 9.38069 ≈ $6,566.48


Future Value of an Annuity Due:FVADn = R [ ](1+i) = R (FVIFAi%,n)(1+i)
Where: i is the interest rate per compounding period;
n are the number of compounding periods; and R is the fixed periodic payment.
Accordingly, FVAD3 = $1,000 (FVIFA7%,3)(1.07) = $1,000 (3.215)(1.07)
= $3,440
Valuation Using Table IIIValuation Using Table III

Table III: (FVIFAi%,n)

Example: Future Value of an Annuity DueCalculate the future value of 12 monthly deposits of $1,000 if
each payment is made on the first day of the month and the interest rate per month is 1.1%.
SolutionPeriodic Payment R = $1,000Number of Periods n = 12
Interest Rate i = 1.1%Future Value = $1,000 × {(1+1.1%)^12-1}/1.1% × (1+1.1%) = $1,000 × {1.011^12-1}/0.011 × (1+0.011) = $1,000 × (1.140286-1)/0.011 × 1.011 ≈ $1,000 × 0.140286/0.011 × 1.011 ≈ $1,000 × 12.75329059 × 1.011 ≈ $12,893.58

Equal-Payment-Series Sinking-Fund
How much we need to set aside
in order to have a known
amount of money at the end of
the equal payments , assuming
an interest rate of (i)%?

Cash Flow Diagram


Present Value of an Ordinary Annuity = R X
PVAn = R (PVIFAi%,n)
PVA3 = $1,000 (PVIFA7%,3)= $1,000 (2.624)
= $2,624
Where, i is the interest rate per compounding period; n are the number of compounding periods; and R is the fixed periodic payment.
V a l u a ti o n U s i n g Ta b l e I VV a l u a ti o n U s i n g Ta b l e I V

Ta b l e I V: (PVIFAi%,n)

Example: Present Value of an Ordinary AnnuityCalculate the present value on Jan 1, 2011 of an annuity of $500 paid at
the end of each month of the calendar year 2011. The annual interest rate is 12%.
SolutionWe have,Periodic Payment R = $500Number of Periods n = 12Interest Rate i = 12%/12 = 1%Present Value PV = $500 × (1-(1+1%)^(-12))/1% = $500 × (1-1.01^-12)/1% ≈ $500 × (1-0.88745)/1% ≈ $500 × 0.11255/1% ≈ $500 × 11.255 ≈ $5,627.54

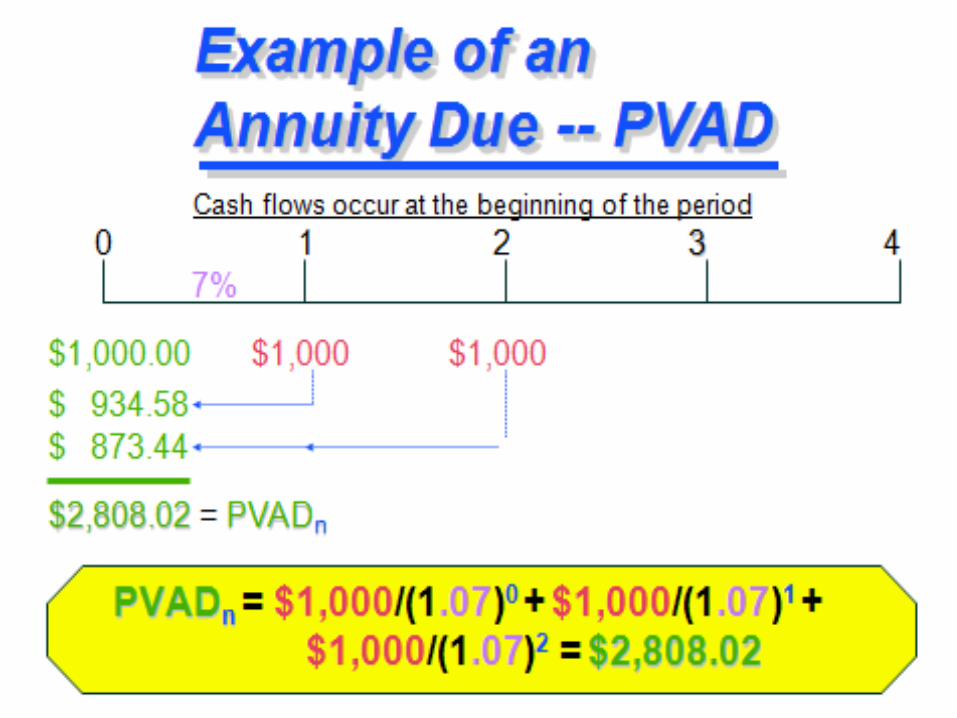

Present Value of an Annuity Due = R X
PVADn = R (PVIFAi%,n)(1+i)PVAD3 = $1,000 (PVIFA7%,3)(1.07)
= $1,000 (2.624)(1.07) = $2,808
Where, i is the interest rate per compounding period; n are the number of compounding periods; and R is the fixed periodic payment.
V a l u a ti o n U s i n g Ta b l e I VV a l u a ti o n U s i n g Ta b l e I V

Ta b l e I V: (PVIFAi%,n)

Example: Present Value of an Annuity DueA certain amount was invested on Jan 1, 2010 such that it generated a periodic
payment of $1,000 at the beginning of each month of the calendar year 2010. The
interest rate on the investment was 13.2%. Calculate the present value of the original
investment.
SolutionPeriodic Payment R = $1,000Number of Periods n = 12Interest Rate i = 13.2%/12 = 1.1%Original Investment = PV of annuity due on Jan 1, 2010 = $1,000 × (1-(1+1.1%)^(-12))/1.1% × (1+1.1%) = $1,000 × (1-1.011^-12)/0.011 × 1.011 ≈ $1,000 × (1-0.876973)/0.011 × 1.011 ≈ $1,000 × 0.123027/0.011 × 1.011 ≈ $1,000 × 11.184289 × 1.011 ≈ $11,307.32

Six Interest Formulas

Steps to Solve Time Value of Money Problems
1. Read problem carefully2. Create a time line3. Put cash flows and arrows on time line4. Determine if it is a PV or FV problem5. Determine if solution involves a single
CF or annuity stream(s)6. Solve the problem7. Check with financial calculator (optional)