
Engineering Change Management 2.0 - Synergy · PDF fileSurvey results show that the firms...
20
thyu Engineering Change Management 2.0: Better Business Decisions from Intelligent Change Management September 2007
Transcript of Engineering Change Management 2.0 - Synergy · PDF fileSurvey results show that the firms...
thyu
Engineering Change Management 2.0: Better Business Decisions from Intelligent Change Management
September 2007

Engineering Change Management 2.0 Page 2
© 2007 Aberdeen Group. Telephone: 617 723 7890
Executive Summary Fast Facts The Best-in-Class are more likely than Industry Average and Laggard performers to adopt advanced technologies to support change management processes, including:
√ Product Data Management Best-in-Class: 71% Industry Average: 39% Laggard: 39%
√ Product Lifecycle Management Best-in-Class: 41% Industry Average: 19% Laggard: 17%
√ Design / Visualization / Markup Best-in-Class: 75% Industry Average: 32% Laggard: 12%
√ Virtual Meeting / Collaboration Best-in-Class: 67% Industry Average: 49%
Laggard: 22%
Managing engineering change has always been hard, and is a regular source of inefficency and irritation for manufacturers. Over the years, many companies have focused on improving the efficiency of change mangement. Recently, there has been a shift in perspective on change management. Companies now recognize that better change processes can drive top-line benefits and, thus, companies are developing change management with an eye towards improving speed to market – Engineering Change Management 2.0. This report serves as a roadmap for those companies seeking to improve productivity in their engineering change processes, but just as importantly make better business decisions that will drive product profitability.
Best-in-Class Performance Aberdeen used six key performance criteria to distinguish Best-in-Class companies. Best-in-Class companies enjoy significant performance advantages over their competitors, including:
• Meeting change deadline targets 96% of the time
• Achieving design project budgets 94% of the time
• Concurrently achieving product performance 99% of the time and quality objectives 98% of the time
To put the performance gap into perspective, the Best-in-Class are 55% more likely than Industry Average companies to hit target deadlines for implementing changes and 2.8 times as likely as Laggards to hit these same targets. These companies are clearly performing better in regards to efficiency, but the Best-in-Class approach involves more than just streamlining tasks.
Competitive Maturity Assessment Survey results show that the firms enjoying Best-in-Class performance shared several common characteristics:
• Best-in-Class performers are almost five times as likely as the Industry Average to possess formal impact analysis processes
• Best-in-Class companies are also twice as likely to utilize a cross-functional Change Review Board (CRB) to perform better impact analysis, taking into consideration all aspects of the product lifecycle
• The Best-in-Class are 82% more likely than Industry Average companies to utilize Product Data Management (PDM) and are 2.2 times as likely to utilize Product Lifecycle Management (PLM) solutions to manage change
www.aberdeen.com Fax: 617 723 7897
Engineering Change Management 2.0 Page 3
© 2007 Aberdeen Group. Telephone: 617 723 7890
Required Actions In addition to the specific recommendations in Chapter Three of this report, to achieve Best-in-Class performance and improve decision-making in change management, manufacturers must address the four fundamentals of Best-in-Class change management:
• Get the right supporting product data to the right people in a timely manner
• Formally analyze the impact of change on the product across the lifecycle and the supply chain, including technical and commercial considerations
• Collaborate visually about product change with visualization and virtual meeting technology
• Develop and execute formal change implementation plans to put the decision into action
www.aberdeen.com Fax: 617 723 7897

Engineering Change Management 2.0 Page 4
© 2007 Aberdeen Group. Telephone: 617 723 7890 www.aberdeen.com Fax: 617 723 7897
Table of Contents Executive Summary....................................................................................................... 2
Best-in-Class Performance......................................................................... 2 Competitive Maturity Assessment........................................................... 2 Required Actions ......................................................................................... 3
Chapter One: Benchmarking the Best-in-Class ..................................................... 5 A New Outlook on Change ...................................................................... 5 The Maturity Class Framework................................................................ 6 The Best-in-Class PACE Model ................................................................ 7 Strategy in Action ........................................................................................ 7
Chapter Two: Benchmarking Requirements for Success .................................... 9 Competitive Assessment............................................................................ 9 Process .........................................................................................................10 Organization................................................................................................11 Knowledge Management and Performance Measurement ...............12 Technology ..................................................................................................12
Chapter Three: Required Actions .........................................................................15 Laggard Steps to Success..........................................................................15 Industry Average Steps to Success.........................................................16 Best-in-Class Steps to Success ................................................................16
Appendix A: Research Methodology.....................................................................18 Appendix B: Related Aberdeen Research............................................................20
Figures Figure 1: The Percent of Products Meeting Targets Across the Competitive Framework...................................................................................................................... 6 Figure 2: Technology Enablers: Managing Knowledge........................................13 Figure 3: Technology Enablers: Change Execution .............................................14
Tables Table 1: The Top Five Pressures ............................................................................... 5 Table 2: The Best-in-Class PACE Framework ....................................................... 7 Table 3: Competitive Framework ............................................................................. 9 Table 4: Criteria Considered in Change Impact Analysis..................................10 Table 5: PACE Framework Key...............................................................................19 Table 6: Competitive Framework Key...................................................................19 Table 7: Relationship Between PACE and Competitive Framework..............19

Engineering Change Management 2.0 Page 5
© 2007 Aberdeen Group. Telephone: 617 723 7890
Chapter One: Benchmarking the Best-in-Class
A New Outlook on Change Fast Facts √ The top pressures pushing
manufactures to rethink change management are shortening development lead times and a market need for rapid response to quality issues
√ Best-in-Class companies are 55% more likely than the Industry Average to hit target deadlines for implementing changes and are 2.8 times as likely as Laggards to hit these same targets
√ These companies improve coordination between engineering and manufacturing across the supply chain in order to make more effective decisions on change orders
Traditionally, change management in product development and engineering has been viewed as a way to control cost and improve efficiencies. The September 2005 Product Innovation Agenda Benchmark Report found that 61% of survey respondents report that they are acting on change management to reduce product costs. Another 50% indicated that their goal was to reduce product development cost. At this time, only 32% identified change management as a driver to improve revenue.
In sharp contrast, research for this report found that 63% of respondents indicated shortening development lead times as the top pressure pushing them to improve change management performance, while only 20% of survey participants report reducing product costs as their driver (Table 1). There has been a shift in perspective on change management. Companies now recognize that better change can drive top-line benefits and so are developing processes with an eye towards improving speed to market. This is significant, given that Aberdeen's August 2006 Product Portfolio Management Benchmark Report found that companies gain, on average, 11% margin advantages for their newer products. Good change management has always been a crucial process, but in today’s fast-paced market it has elevated in importance – it is now being viewed as a competitive tool to increase product profitability through improved market responsiveness in addition to improving efficiency – Engineering Change Management 2.0.
Table 1: The Top Five Pressures
Pressures Response
Shortening development lead times 63%
Market need for a quick response to quality issues 43%
Challenge of implementing change in complex, global supply chains 35%
Rapidly changing market requirements for product capabilities 29%
Reduced product development budgets 20%
Source: Aberdeen Group, September 2007
Getting to market sooner is not the only concern driving companies to improve their change management programs. Quality issues and changing market requirements are also driving a focus on change. Once a product has been released, companies still need to get product updates to market quickly. Change management is important to both initial product launch, and ongoing product management, where quality and product improvement changes are critical to market success and profitability.
www.aberdeen.com Fax: 617 723 7897
Engineering Change Management 2.0 Page 6
© 2007 Aberdeen Group. Telephone: 617 723 7890
The Maturity Class Framework “All of our change requests with supporting information are electronically integrated together. By keeping everything together we save a lot of time because everyone has immediate access and visibility to key information.”
~Scott Douglas, NCE Manager, Engineering Services,
Harman Specialty Group
The increased complexity of the product development process, the number of people affected by change, and its associated costs make managing change more difficult than ever before. To gain an understanding of how organizations are seeing the greatest benefit from change management, Aberdeen categorized companies according to three levels of performance: Best-in-Class, Industry Average, and Laggard.
Aberdeen measured the metrics that drive product profitability in order to determine which companies are achieving peak performance. Survey respondents were ranked according to six key performance criteria, including the ability to:
• Meet change deadline targets
• Meet design product budgets
• Achieve product cost targets
• Achieve product lifecycle cost targets
• Achieve product performance objectives
• Achieve product quality goals
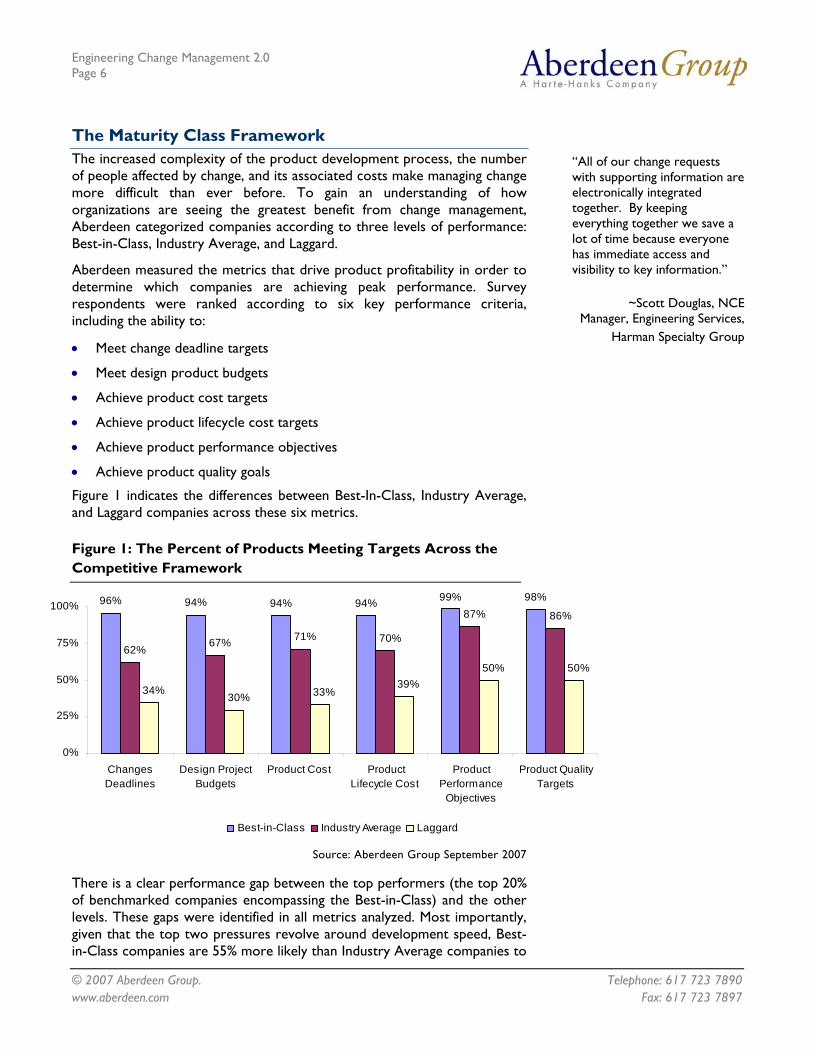
Figure 1 indicates the differences between Best-In-Class, Industry Average, and Laggard companies across these six metrics.
Figure 1: The Percent of Products Meeting Targets Across the Competitive Framework
96% 94% 94% 94% 99% 98%
62%67% 71% 70%
87% 86%
34%30% 33%
39%50% 50%
0%
25%
50%
75%
100%
ChangesDeadlines
Design ProjectBudgets
Product Cost ProductLifecycle Cost
ProductPerformance
Objectives
Product QualityTargets
Best-in-Class Industry Average Laggard
Source: Aberdeen Group September 2007
There is a clear performance gap between the top performers (the top 20% of benchmarked companies encompassing the Best-in-Class) and the other levels. These gaps were identified in all metrics analyzed. Most importantly, given that the top two pressures revolve around development speed, Best-in-Class companies are 55% more likely than Industry Average companies to
www.aberdeen.com Fax: 617 723 7897
Engineering Change Management 2.0 Page 7
© 2007 Aberdeen Group. Telephone: 617 723 7890
hit target deadlines for implementing changes. Even more shocking is that they are 2.8 times as likely as Laggards to hit these same targets.
The Best-in-Class PACE Model It is not hard to see that the Best-in-Class enjoy a significant advantage in achieving all of the above metrics and are thus able to develop more profitable products. What exactly are the business components that drive Best-in-Class performance? Aberdeen assembled the following profile of the strategic actions, organizational capabilities, and enabling technology that support the greatest benefit from change management (Table 2).
Table 2: The Best-in-Class PACE Framework
“We are a highly capital intensive industry so, making a change requires a significant investment. Consequently, we need to ensure a change will justify the expense. The project manager is in the best position to do this. He relies on the feedback and ideas of a team of engineers and then uses his experience and knowledge of the product, processes, and current systems to determine if the change makes sense.”
~John Latham, Manager, Business Planning, Blue Ridge
Paper Products, Inc.
Pressures Actions Capabilities Enablers • Shortening development lead times
• Improve coordination ofchange across the supply chain
• Improve coordination ofchange between engineering and manufacturing
• Involve more organizations in the change process (open up change execution to the company)
• Formal change impact analysis
• Formal change implementation plans and audit procedure
• Formal use of metrics to track effectiveness of change control process
• Cross-functional CRB • Separate meetings / functions for review and approval of change
• Root cause analysis to identify corrective action
• Change request integrated to supporting information
• Centralized access to change status, approval routing, and change history
• Formal change management process
• Workflow • Configuration Management
• Manufacturing Execution Systems (MES)
• Workflow or status alerts
• Product lifecycle management
• Design visualization / markup
• Document visualization / markup
• Product data management
Source: Aberdeen Group, September 2007
Strategy in Action The top pressures reported to be driving change management were the need to improve speed and the need to respond to change. Perhaps counter-intuitively, removing inefficiencies from the change process is not a particularly differentiating factor underlying Best-in-Class performance. Thirty-five percent (35%) of Best-in-Class organizations cite this as an action they are undertaking which falls behind both the Industry Average and the Laggard companies. Forty-three percent (43%) of the Industry Average and just over half of the Laggards are focused on removing inefficiency.
www.aberdeen.com Fax: 617 723 7897

Engineering Change Management 2.0 Page 8
© 2007 Aberdeen Group. Telephone: 617 723 7890 www.aberdeen.com Fax: 617 723 7897
In fact, Aberdeen found that successful change management has less to do with the efficiency of the operation than how effective the decision-making process is in the first place. In particular, the Best-in-Class appear to be investing in improving their ability to make better business decisions on change requests. As such, they are 41% more likely than Industry Average companies to involve more organizations in the change process. This helps them to better understand the full impact of a change and therefore to make better decisions about whether or not to implement change requests and how they should be executed. They are also are 42% more likely than the Industry Average to improve the coordination between engineering and manufacturing and 32% more likely to improve the coordination of change across the supply chain. This demonstrates that the Best-in-Class recognize that the impact of change in today's rapid development and global manufacturing environments goes well beyond the four walls of the company.
Aberdeen Insights – Strategy
Companies are focused on improving their change management processes in order to get to market faster. A rapid and efficient change process allows a company to resolve issues more quickly. This, in turn, reduces the impact a change has on the product launch date or the date that a product change can be implemented in manufacturing. Increasing efficiency also limits non-value added work, enabling engineers to focus on delivering a solution more quickly. But Aberdeen’s research shows that while many companies focus on efficiency, improving efficiency in and of itself is not a differentiating initiative. In fact, Industry Average and Laggard companies demonstrate heavily focus on improving efficiency than the Best-in-Class.
While companies of all classifications are removing inefficiencies and increasing coordination internally, the Best-in-Class stand apart by improving change management decision-making processes. These companies recognize the fact that even a small change can have a large “ripple effect” on downstream processes and even the supply chain at large. As industry leaders, the Best-in-Class are analyzing the impact of change across the product lifecycle and the supply chain, and are involving a broader perspective from different departments in the change process. The end goal is the same, but the path to rapid change is achieved by making the right decisions, at the right time, and avoiding rework – Engineering Change Management 2.0.

Engineering Change Management 2.0 Page 9
© 2007 Aberdeen Group. Telephone: 617 723 7890 www.aberdeen.com Fax: 617 723 7897
Chapter Two: Benchmarking Requirements for Success
Competitive Assessment The aggregated performance of surveyed companies determined whether they ranked as Best-in-Class, Industry Average, or Laggard.
In addition to having common performance levels, each class also shared characteristics supporting change management in five key categories: (1) process (how companies are executing change management in their business); (2) organization (corporate focus and collaboration among stakeholders); (3) knowledge management (contextualizing data and exposing it to key stakeholders); (4) technology (selection of appropriate tools and intelligent deployment of those tools); and (5) performance measurement (the ability of the organization to measure the efficiency and effectiveness of change management).
These characteristics (Table 3) serve as a guideline for best practices and correlate directly with Best-in-Class performance.
Table 3: Competitive Framework
Best-in-Class Average Laggards Formal change impact analysis
69% 14% 5%Formal change implementation plan
71% 25% 15%Root Cause analysis to identify corrective action
Process
75% 46% 35%Cross functional CRB
69% 34% 25% Separate meetings / functions for review and approval versus
implementation of change 69% 35% 25%
Change requests / order approved or rejected by product / program manager
Organization
69% 58% 50%
Formal use of metrics to track effectiveness of change control process
56% 18% 17%
Centralized access to current status and approval routing
63% 42% 24% Centralized access to change history (audit trail)
Knowledge
81% 56% 42%

Engineering Change Management 2.0 Page 10
© 2007 Aberdeen Group. Telephone: 617 723 7890 www.aberdeen.com Fax: 617 723 7897
Best-in-Class Average Laggards Change request integrated to supporting information
(documentation / product data / analysis)Performance Management 69% 50% 22%
Technology enablers supporting change management
Technology
• 65% workflow • 88% configuration
management • 53% MES• 41% product
lifecycle management
• 71% design / visualization markup
• 71% PDM
• 23% workflow • 34% configuration
management • 21% MES• 19% product
lifecycle management
• 32% design / visualization markup
• 39% PDM
• 21% workflow • 26% configuration
management • 22% MES• 17% product
lifecycle management
• 12% design / visualization markup
• 39% PDM
Source: Aberdeen Group, September 2007
Process Overall, Best-in-Class performers take a more structured approach to change processes than the Industry Average or Laggard companies. Best-in-Class companies have implemented two critical processes more frequently than their competitors: formal impact analysis and formal change implementation plans.
The Best-in-Class are almost five-times as likely as Industry Average companies to perform a formal impact analysis processes. By contrast, few Laggard organizations indicated possessing a formal change review process. Impact analysis processes allow companies to make more informed decisions and approach change with greater consideration of the overall implications of the proposed change. These companies take into account a greater number of factors when making a change (Table 4).
Table 4: Criteria Considered in Change Impact Analysis
Criteria Best -in-
Class Industry Average Laggard
Impact on product requirements 82% 61% 45%Change in manufacturing tooling / equipment 94% 70% 60%
Current supply / purchase orders 65% 54% 35%
Current demand / sales orders 65% 54% 35%
Change in manufacturing processes 94% 78% 70%
Related documentation 65% 50% 45% Impact of change on related components or assemblies 94% 78% 70%
Part obsolescence 59% 63% 55%
“We have a product / program manager in the sign off loop for change control. In many cases, the customer has special needs that require notification of changes. Having a product / program manager involved in the sign off ensures the customer is properly notified.”
~Scott A. Brown, Program Manager, GE Fanuc Embedded
Systems
Engineering Change Management 2.0 Page 11
© 2007 Aberdeen Group. Telephone: 617 723 7890 www.aberdeen.com Fax: 617 723 7897
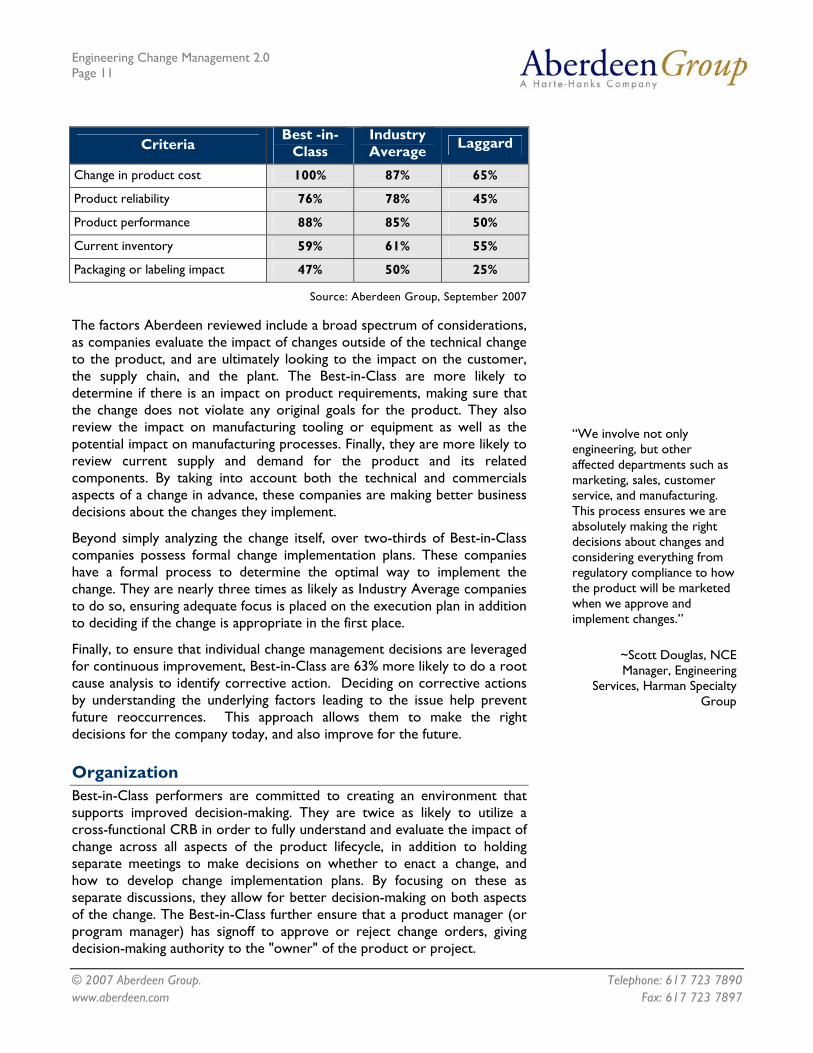
Criteria Best -in- Industry Laggard Class Average
Change in product cost 100% 87% 65%
Product reliability 76% 78% 45%
Product performance 88% 85% 50%
Current inventory 59% 61% 55%
Packaging or labeling impact 47% 50% 25%
Source: Aberdeen Group, September 2007
The factors Aberdeen reviewed include a broad spectrum of considerations, as companies evaluate the impact of changes outside of the technical change to the product, and are ultimately looking to the impact on the customer, the supply chain, and the plant. The Best-in-Class are more likely to determine if there is an impact on product requirements, making sure that the change does not violate any original goals for the product. They also review the impact on manufacturing tooling or equipment as well as the potential impact on manufacturing processes. Finally, they are more likely to review current supply and demand for the product and its related components. By taking into account both the technical and commercials aspects of a change in advance, these companies are making better business decisions about the changes they implement.
“We involve not only engineering, but other affected departments such as marketing, sales, customer service, and manufacturing. This process ensures we are absolutely making the right decisions about changes and considering everything from regulatory compliance to how the product will be marketed when we approve and implement changes.”
~Scott Douglas, NCE Manager, Engineering
Services, Harman Specialty Group
Beyond simply analyzing the change itself, over two-thirds of Best-in-Class companies possess formal change implementation plans. These companies have a formal process to determine the optimal way to implement the change. They are nearly three times as likely as Industry Average companies to do so, ensuring adequate focus is placed on the execution plan in addition to deciding if the change is appropriate in the first place.
Finally, to ensure that individual change management decisions are leveraged for continuous improvement, Best-in-Class are 63% more likely to do a root cause analysis to identify corrective action. Deciding on corrective actions by understanding the underlying factors leading to the issue help prevent future reoccurrences. This approach allows them to make the right decisions for the company today, and also improve for the future.
Organization Best-in-Class performers are committed to creating an environment that supports improved decision-making. They are twice as likely to utilize a cross-functional CRB in order to fully understand and evaluate the impact of change across all aspects of the product lifecycle, in addition to holding separate meetings to make decisions on whether to enact a change, and how to develop change implementation plans. By focusing on these as separate discussions, they allow for better decision-making on both aspects of the change. The Best-in-Class further ensure that a product manager (or program manager) has signoff to approve or reject change orders, giving decision-making authority to the "owner" of the product or project.

Engineering Change Management 2.0 Page 12
© 2007 Aberdeen Group. Telephone: 617 723 7890
Knowledge Management and Performance Measurement To support better decisions on change, companies must be able to act on the right information in a timely manner. The difference in the Best-in-Class approach to knowledge management is one of the more important aspects identified by the survey respondents. These companies are over three times as likely as Laggards to integrate supporting information to improve change decision-making on a change request. Further, they are 2.6 times as likely as Laggards to implement centralized access to the status of change orders decisions. This not only helps with decisions, but makes the decision more efficient and transparent to all stake-holders. They also provide centralized access to the change history which creates more accountability on the decisions made.
“The cross functional CRB allows manufacturing and procurement to respond to engineering change and plan accordingly.”
~Larry Ensler, Manager Mechanical Engineering,
Optovue
Finally, to be able to improve change management, companies must measure it. The Best-in-Class are over three-times as likely as Industry Average companies to use formal metrics to track the effectiveness of the change control process. Metrics allow companies to track what works and what doesn’t work, and make more informed decisions in the future, thus ensuring smarter and better change orders.
Technology “Visualization and mark up tools are important to our change management process. These tools enable even those without access to the CAD tools to review the change. In addition, all the markups and notations are stored with the engineering data so a complete record is preserved.”
~Scott Douglas, NCE Manager, Engineering Services
Harman Specialty Group
In today's global, dispersed environment, Best-in-Class companies are also turning to technology to help support their change processes. The technology enablers can be divided into two groups, knowledge and execution.
Having the right information at hand is critical to making better business decisions. Best-in-Class companies are 82% more likely than Industry Average companies to keep centralized data in Product Data Management (PDM) and 2.6 times more likely to us Configuration Management (CM). Further, they are 2.2 times as likely to utilize PLM solutions, which for the purposes of this report are defined as the extension of PDM with business processes and / or collaboration capabilities (Figure 2).
Having the right information is key to making better decisions. Frequently the information for engineering change is better communicated visually than verbally. To this end, Best-in-Class companies are considerably more likely (2.3 times) than Industry Average companies and are 6.3 times more likely than Laggards to use design visualization and markup technology. Document visualization is common among the Best-in-Class as well; in fact they are 2.1 times as likely to leverage these capabilities as Industry Average companies.
www.aberdeen.com Fax: 617 723 7897

Engineering Change Management 2.0 Page 13
© 2007 Aberdeen Group. Telephone: 617 723 7890
Figure 2: Technology Enablers: Managing Knowledge
“Our change management process has standard workflows that electrically route the change. We modify the flexible workflows according to the type of change so that the affected departments are involved in the review. This optimizes the speed and efficiency with which we process change requests.
~Scott Douglas, NCE Manager, Engineering Services
Harman Specialty Group
88%75% 71% 71%
41%34%32%
39%34%
19%26%
12%
39% 39%
17%
0%
25%
50%
75%
100%
ConfigurationManagement
DesignVisualization /
Mark-up
Product datamanagement
(PDM)
DocumentVisualization /
Markup
Productlifecycle
management(PLM)
Best-in-Document Industry Average Laggard
Source: Aberdeen Group September 2007
Not only do individuals need to be provided with access to the right information, they also need to see what they are talking about - and actively discuss it with the other members of their cross-functional change review board – many of whom may be spread across a virtual organization. Real-time collaboration about change is clearly a key enabler of improved change decision making. At an almost elementary level, the Best-in-Class are 37% more likely to use virtual meetings or meeting collaboration technologies as Industry Average companies (Figure 3). This gap extends to over three times when comparing the Best-in-Class to Laggards. Given the trend towards global design and manufacturing, the need to extend personal collaboration and decision-making to the virtual team is critical.
As identified earlier, Best-in-Class take a more structured approach to their change process to further ensure that decisions are being made. Consequently, Best-in-Class incorporate technology tools that facilitate the change management process itself. To ensure that the information reaches the right decision makers promptly, Best-in-Class are nearly 3 times as likely as Industry Average companies to use workflows. This allows them to ensure they are involving the right people to make the decisions. They are also 2.2 times more likely to have workflow or status alerts. Best-in-Class are about 2.5 times more likely to use Manufacturing Execution Systems (MES). Using MES supports their ability to consider the full impact of a change when evaluating it, and then ensures that it is properly communicated to the plant to execute it.
www.aberdeen.com Fax: 617 723 7897

Engineering Change Management 2.0 Page 14
© 2007 Aberdeen Group. Telephone: 617 723 7890
Figure 3: Technology Enablers: Change Execution
67% 65%57% 53%
23% 26%
49%
21%22%
5%
21% 22%
0%
20%
40%
60%
80%
Virtual meeting /meeting
collaboration (videoconference)
Workflow Workflow or statusalerts
ManufacturingExecution Systems
(MES)
Best-in-Class Industry Average Laggard
Source: Aberdeen Group September 2007
Aberdeen Insights — Technology
Making better business decisions about change is at the heart of the Best-in-Class approach to change management. These leading companies have put in place the actions, capabilities, and technology enablers to make this happen. The essential difference between the change management approaches of those companies that are hitting the metrics that drive product profitability and those that don’t is their ability to evaluate and understand the impact of change.
In order to make solid decisions on change, companies must be able to do four key things in Engineering Change Management 2.0:
• Get the right supporting product data to the right people in a timely manner
• Formally analyze the impact of change on the product across the lifecycle and the supply chain, including technical and commercial considerations
• Collaborate visually about product change, with visualization and virtual meeting technology
• Develop and execute formal change implementation plans to put the decision into action
These four key capabilities are the core requirements to Best-in-Class change management processes, and will help companies make the business decisions that will drive product profitability. The PLM and collaboration technologies, knowledge management approaches, organizational approaches, and actions that Best-in-Class companies have taken can all be summarized with these four core fundamentals of change management.
www.aberdeen.com Fax: 617 723 7897

Engineering Change Management 2.0 Page 15
© 2007 Aberdeen Group. Telephone: 617 723 7890
Chapter Three: Required Actions
Fast Facts
√ Industry Average and Laggard organizations need to take a broader view of the commercial impact of change than by formally analyzing the impact of changes across the lifecycle and the supply chain, including technical and commercial considerations.
√ The Best-in-Class have a sizeable lead on their competition, but only half have integrated centralized data with processes and collaboration capabilities. The remaining companies should leverage PLM solutions to support a change management process that integrated directly with underlying product information, providing a natural extension to current PDM solutions.
Aberdeen Group identified four key capabilities that are helping Best-in-Class companies achieve their superior levels of performance, allowing them to hit the metrics that drive product profitability. The following required actions identify the path for companies to adopt these four capabilities. Whether a company is trying to move its performance Laggard to Industry Average, or Industry Average to Best-in-Class, the following actions will help spur the necessary performance improvements:
Laggard Steps to Success • Step 1: Centralize Product Data
Data must be captured and managed in the first place in order to get the right information to the right people. Laggards lack the ability to integrate the right data into their process because they do not have the fundamental product data management capabilities required to easily capture and share product information. Developing this capability is a fundamental requirement to success.
• Step 2: Extend Change Impact Analysis
Laggards should look at a broader spectrum of product information to ensure that decisions on proposed changes are not having unintended impacts on downstream departments and the supply chain. These companies take a limited view on the impact of change, and should extend their view to beyond the technical impact of change to consider commercial impacts such as changes to requirements or current supply and demand.
• Step 3: Leverage Collaboration and Collaboration Technology
Put in place capabilities to better collaborate on change requests. Organizationally, develop a cross-functional CRB. Enable the CRB and other impacted parties to participate more fully in evaluating the change by making it accessible, through visualization technology so non-engineers can interpret and discuss the change to arrive at a better business decision.
• Step 4: Formalize Change Management Processes
Develop formal change management processes, including a formal split between change analysis and change implementation planning. Formal processes provide consistency in decision-making and continuous improvement. This process should follow the best practices identified in Best-in-Class companies, including formal change implementation plans and separate functions for review and approval versus implementation of change.
www.aberdeen.com Fax: 617 723 7897

Engineering Change Management 2.0 Page 16
© 2007 Aberdeen Group. Telephone: 617 723 7890 www.aberdeen.com Fax: 617 723 7897
Industry Average Steps to Success • Step 1: Centralize Product Data, Process, and Status
Average companies are more likely than Laggards to have supporting data about proposed changes integrated with their process, but are less likely to have centralized access to status and approval routings. These companies should develop a centralized, integrated approach utilizing PLM, Configuration Management, and workflow capabilities more commonly found in Best-in-Class companies.
• Step 2: Formalize Change Impact Analysis
Average companies should develop a formal process to analyze changes in advance to ensure that decisions on proposed changes are not having unintended impacts on downstream departments and the supply chain. These companies take a broader view of the commercial impact of change than Laggards, but lack a formal process to ensure consistency in analysis and decision-making.
• Step 3: Leverage Collaboration and Collaboration Technology
Average companies are slightly further ahead in their collaborative approaches, but can benefit from the same advice as Laggards because they are still far from Best-in-Class performance in this aspect. As such, they should put in place capabilities to better collaborate on change requests. Organizationally, develop a cross-functional CRB. Enable the CRB and other impacted parties to participate more fully in evaluating the change by making the details accessible, through visualization technology so non-engineers can interpret and discuss the change to arrive at a better business decision.
• Step 4: Increase Focus on Change Execution
Best-in-Class companies are much more likely to develop formal change implementation plans than Industry Average companies. These companies should enhance their processes to include more focus on the execution of change, including separating the functions for review and approval versus the implementation of change, ensuring adequate focus is placed on the execution plan in addition to deciding if the change is appropriate in the first place. Average companies should also focus on better decision making and subsequent execution utilizing Manufacturing Execution Systems (MES).
Best-in-Class Steps to Success • Step 1: Extend the Lead with Technology
Best-in-Class companies hold a significant edge over their competition in making better change management decisions and bringing more profitable products to market. Only about half,

Engineering Change Management 2.0 Page 17
© 2007 Aberdeen Group. Telephone: 617 723 7890
however, have extended their centralized data with integrated processes and collaboration capabilities. PLM solutions offer a change management process that integrated directly with underlying product information, providing a natural extension to current PDM solutions. Additionally, almost half still have the opportunity to take advantage of MES to improve decision-making and execute change management effectively.
• Step 2: Measure and Improve Change Processes
Most Best-in-Class companies have adopted the four key capabilities of change management, but still have room for improvement. These companies are much more likely to be using metrics to track the effectiveness of their change management process, and should leverage this information to identify further sources of improvement. While all companies can benefit from this, many Industry Average and Laggard companies do not have the proper infrastructure in place to adequately analyze these metrics and identify actionable improvements.
Aberdeen Insights – Summary
Most companies are standardizing their processes, with Best-in-Class companies more frequently implementing them through automation. Because of the number of people involved in the process, automation can help enforce a best practice process and improve efficiency. The key to success in change management, however, is in improving decision-making. Best-in-Class companies are going beyond improving efficiency, and are focusing on improvements that improve the ability to analyze and act on change requests.
Aberdeen identified four key capabilities required for Best-in-Class change management or Engineering Change Management 2.0. These capabilities deliver on the promise of better decision-making, and in the process are leading to strategic results. Best-in-Class companies are integrating product data into their decision-making process, formally evaluating the impact of change on the product lifecycle and supply chain, collaborating to make better decisions, and placing emphasis on the implementation of the change in addition to the change itself. The results from these four key capabilities are the increased ability to meet key metrics such as time to market and development budgets, which are the metrics that drive product profitability.
www.aberdeen.com Fax: 617 723 7897

Engineering Change Management 2.0 Page 18
© 2007 Aberdeen Group. Telephone: 617 723 7890 www.aberdeen.com Fax: 617 723 7897
Appendix A: Research Methodology
Between August and September 2007, Aberdeen Group examined the use of the change management process of more than 135 enterprises in aerospace and defense, automotive, high-tech, industrial products, and other manufacturing industries. Responding executives completed an online survey that included questions designed to determine the following:
• The pressures and subsequent strategies driving the focus of resources on change management
• The organizational approaches and level of process standardization in their change management process
• The business capabilities that they have put in place, including technology used to support change management
• The ability for these companies to meet the product development targets that drive product profitability
Aberdeen supplemented this online survey effort with telephone interviews with select survey respondents, gathering additional information on product development strategies, experiences, and results. The study aimed to identify emerging best practices for product development in manufacturing industries and to provide a framework by which readers could assess their management capabilities. Responding enterprises included the following:
• Job title/function: The research sample included respondents with the following job titles: director or manager (50%), vice president or above (15%), as well as logistics / supply chain, sales, procurement, and others.
• Department: Survey respondents represented individuals from the following departments: engineering (39%), manufacturing (14%), information technology (12%), as well as others.
• Industry: The research sample included respondents predominantly from manufacturing industries. Industrial equipment manufacturers represented 29% of the sample, followed by aerospace and defense at 19%, automotive at 13%, and high-technology / software at 11%. Computer equipment and peripherals was 10%, while medical devices accounted for 7% of the sample. Other sectors responding included consumer electronics, telecommunications, and metals and metal products.
• Geography: The majority of respondents (79%) were from North America. Other respondents were from Europe (11%) and the Asia-Pacific region (7%). The remaining respondents were from South/Central America, the Middle East, and Africa.
• Company size: Large enterprises (annual revenues above US$1 billion) comprised 33% of respondents; 40% were from midsize enterprises (annual revenues between $50 million and $1 billion); and 27% were from small businesses (annual revenues of $50 million or less).

Engineering Change Management 2.0 Page 19
© 2007 Aberdeen Group. Telephone: 617 723 7890
Solution providers recognized as sponsors of this report were solicited after the fact and had no substantive influence on the direction of the Managing the Chaos of Change: Better Business Decisions from Intelligent Change Management Benchmark Report. Their sponsorship has made it possible for Aberdeen Group to make these findings available to readers at no charge.
Table 5: PACE Framework Key
Overview Aberdeen applies a methodology to benchmark research that evaluates the business pressures, actions, capabilities, and enablers (PACE) that indicate corporate behavior in specific business processes. These terms are defined as follows: Pressures — external forces that impact an organization’s market position, competitiveness, or business operations (e.g., economic, political and regulatory, technology, changing customer preferences, competitive) Actions — the strategic approaches that an organization takes in response to industry pressures (e.g., align the corporate business model to leverage industry opportunities, such as product/service strategy, target markets, financial strategy, go-to-market, and sales strategy) Capabilities — the business process competencies required to execute corporate strategy (e.g., skilled people, brand, market positioning, viable products/services, ecosystem partners, financing) Enablers — the key functionality of technology solutions required to support the organization’s enabling business practices (e.g., development platform, applications, network connectivity, user interface, training and support, partner interfaces, data cleansing, and management)
Source: Aberdeen Group, September 2007
Table 6: Competitive Framework Key
Overview The Aberdeen Competitive Framework defines enterprises as falling into one of the following three levels of practices and performance Best-in-Class (20%) — Practices that are the best currently being employed and significantly superior to the Industry Average, and result in the top industry performance. Industry Average (50%) — Practices that represent the average or norm, and result in average industry performance. Laggards (30%) — Practices that are significantly behind the average of the industry, and result in below average performance
In the following categories:
Process — What is the scope of process standardization? What is the efficiency and effectiveness of this process? Organization — How is your company currently organized to manage and optimize this particular process? Knowledge — What visibility do you have into key data and intelligence required to manage this process? Technology — What level of automation have you used to support this process? How is this automation integrated and aligned? Performance — What do you measure? How frequently? What’s your actual performance?
Source: Aberdeen Group, September 2007
Table 7: Relationship Between PACE and Competitive Framework
PACE and Competitive Framework How They Interact
Aberdeen research indicates that companies that identify the most impactful pressures and take the most transformational and effective actions are most likely to achieve superior performance. The level of competitive performance that a company achieves is strongly determined by the PACE choices that they make and how well they execute.
Source: Aberdeen Group, September 2007
www.aberdeen.com Fax: 617 723 7897

Engineering Change Management 2.0 Page 20
© 2007 Aberdeen Group. Telephone: 617 723 7890 www.aberdeen.com Fax: 617 723 7897
Appendix B: Related Aberdeen Research
Related Aberdeen research that forms a companion or reference to this report include:
• The Configuration Management Report: Formalizing and Extending CM to Drive Quality February, 2007
• The Mechatronics Design Benchmark Report: Coordinating
Engineering Disciplines August, 2006
• The Product Innovation Agenda Benchmark Report September, 2005
Information on these and any other Aberdeen publications can be found at www.Aberdeen.com.
Author(s): Jim Brown, VP Product Innovation & Engineering Research ([email protected]), Michelle Boucher, Analyst Product Innovation & Engineering Research ([email protected])
Aberdeen is a leading provider of fact-based research and market intelligence that delivers demonstrable results. Having benchmarked more than 30,000 companies in the past two years, Aberdeen is uniquely positioned to educate users to action: driving market awareness, creating demand, enabling sales, and delivering meaningful return-on-investment analysis. As the trusted advisor to the global technology markets, corporations turn to Aberdeen for insights that drive decisions. As a Harte-Hanks Company, Aberdeen plays a key role of putting content in context for the global direct and targeted marketing company. Aberdeen's analytical and independent view of the "customer optimization" process of Harte-Hanks (Information – Opportunity – Insight – Engagement – Interaction) extends the client value and accentuates the strategic role Harte-Hanks brings to the market. For additional information, visit Aberdeen http://www.aberdeen.com or call (617) 723-7890, or to learn more about Harte-Hanks, call (800) 456-9748 or go to http://www.harte-hanks.com