Eng stp - to - presentation - transportation and transit referendum - the hive - 2015-04-10 copy
37
The Hive Neal Peacocke Transit Office Strategic Transportation Planning April 10, 2015 The Transportation and Transit Referendum
-
Upload
anthony-c-taylor -
Category
Business
-
view
105 -
download
0
Transcript of Eng stp - to - presentation - transportation and transit referendum - the hive - 2015-04-10 copy
The Hive
Neal PeacockeTransit Office
Strategic Transportation Planning
April 10, 2015
The Transportation
and Transit Referendum
Agenda
1. The Case for Regional Transit Investment
2. The Mayors’ Council Plan and its benefits for Vancouver

The Case for
Regional Transit Investment

Ridership in Metro Vancouver vastly outperforms cities of similar size
• Ten peer cities of similar size in the US and Canada (300k)
Metro Vancouver has higher ridership than 9 of these peer cities combined
CityMetro
PopulationAnnual Rides (thousands)
Annual Boardings /
CapitaDenver
2,645,209 86,659.7 33/capita
Pittsburgh
2,360,733 65,464.0 28/capita
Vancouver
2,313,328 363,163.0 157/capita
Charlotte
2,296,569 26,411.6 12/capita
Portland
2,289,800 113,727.7 50/capita
San Antonio
2,234,003 47,147.1 21/capita
Orlando
2,223,674 29,364.2 13/capita
Sacramento
2,196,482 27,280.6 12/capita
Cincinnati
2,128,603 16,356.9 8/capita
Cleveland
2,063,535 48,152.7 23/capita
Kansas City
2,038,724 16,506.5 8/capita
CityMetro
PopulationAnnual
Boardings
Denver
2,645,209 86,660,000
Pittsburgh
2,360,733 65,464,000
Vancouver
2,313,328 363,163,000
Charlotte
2,296,569 26,412,000
Portland
2,289,800 113,728,000
San Antonio
2,234,003 47,147,000
Orlando
2,223,674 29,364,000
Sacramento
2,196,482 27,281,000
Cincinnati
2,128,603 16,357,000
Cleveland
2,063,535 48,153,000
Kansas City
2,038,724 16,507,000
CityMetro
Population
Denver 2,645,209
Pittsburgh 2,360,733
Metro Vancouver
2,313,328
Charlotte 2,296,569
Portland 2,289,800
San Antonio 2,234,003
Orlando 2,223,674
Sacramento 2,196,482
Cincinnati 2,128,603
Cleveland 2,063,535
Kansas City 2,038,724
CityMetro
PopulationAnnual
Boardings
Annual Boardings /
Capita
Metro Vancouver
2,313,328 363,163,000 157/capita
Portland 2,289,800 113,728,000 50/capita
Denver 2,645,209 86,660,000 33/capita
Pittsburgh 2,360,733 65,464,000 28/capita
Cleveland 2,063,535 48,153,000 23/capita
San Antonio 2,234,003 47,147,000 21/capita
Orlando 2,223,674 29,364,000 13/capita
Sacramento 2,196,482 27,281,000 12/capita
Charlotte 2,296,569 26,412,000 12/capita
Kansas City 2,038,724 16,507,000 8/capita
Cincinnati 2,128,603 16,357,000 8/capita
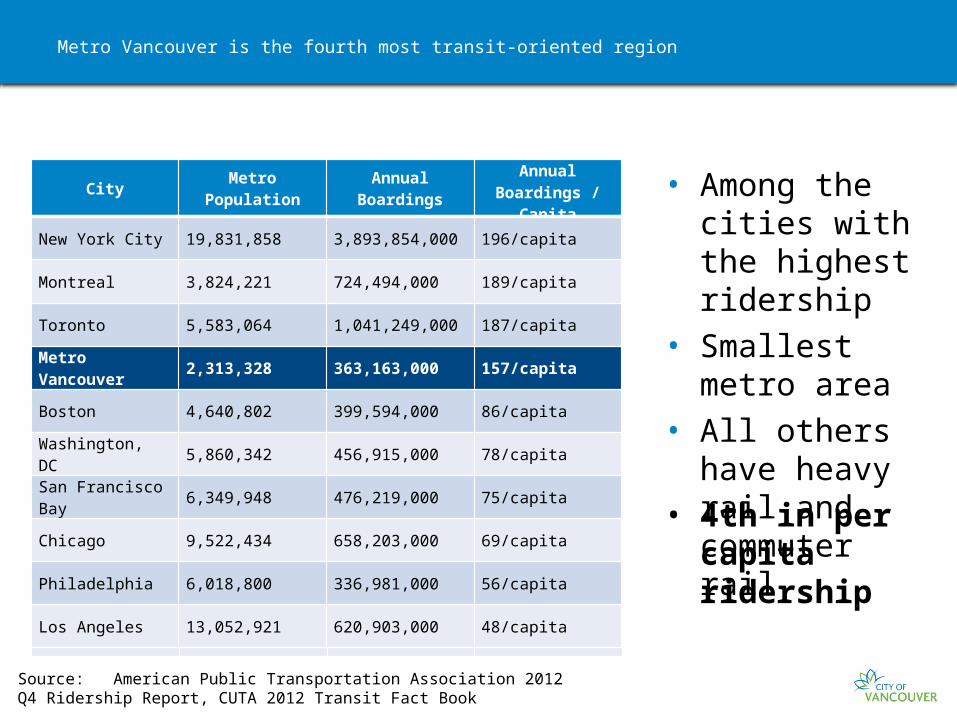
Metro Vancouver is the fourth most transit-oriented region
• Among the cities with the highest ridership
• Smallest metro area
• All others have heavy rail and commuter rail
• 4th in per capita ridership
CityMetro
PopulationAnnual
Boardings
Annual Boardings /
Capita
New York City 19,831,858 3,893,854,000 196/capita
Toronto 5,583,064 1,041,249,000 187/capita
Montreal 3,824,221 724,494,000 189/capita
Chicago 9,522,434 658,203,000 69/capita
Los Angeles 13,052,921 620,903,000 48/capita
San Francisco Bay
6,349,948 476,219,000 75/capita
Washington, DC 5,860,342 456,915,000 78/capita
Boston 4,640,802 399,594,000 86/capita
Metro Vancouver
2,313,328 363,163,000 157/capita
Philadelphia 6,018,800 336,981,000 56/capita
Source: American Public Transportation Association 2012 Q4 Ridership Report, CUTA 2012 Transit Fact Book
CityMetro
PopulationAnnual
Boardings
Annual Boardings /
Capita
New York City 19,831,858 3,893,854,000 196/capita
Montreal 3,824,221 724,494,000 189/capita
Toronto 5,583,064 1,041,249,000 187/capita
Metro Vancouver
2,313,328 363,163,000 157/capita
Boston 4,640,802 399,594,000 86/capita
Washington, DC 5,860,342 456,915,000 78/capita
San Francisco Bay
6,349,948 476,219,000 75/capita
Chicago 9,522,434 658,203,000 69/capita
Philadelphia 6,018,800 336,981,000 56/capita
Los Angeles 13,052,921 620,903,000 48/capita
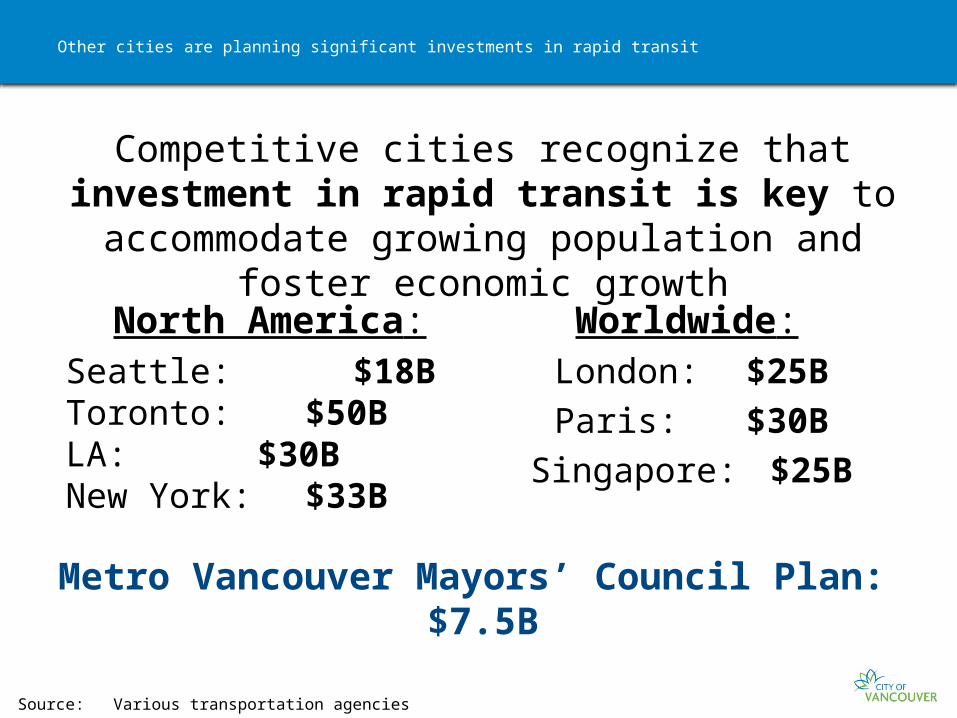
Other cities are planning significant investments in rapid transit
Competitive cities recognize that investment in rapid transit is key to accommodate growing
population and foster economic growth
Source: Various transportation agencies
North America:Seattle: $18BToronto: $50BLA: $30BNew York: $33B
Worldwide:London: $25B
Paris: $30B
Singapore: $25B
Metro Vancouver Mayors’ Council Plan: $7.5B

Metro Vancouver is a rapidly growing region
Source: Data from Regional Growth Strategy, 2011
Metro Vancouver’s population will increase by more than
1 million people and 600 thousand jobs
over the next 30 years
3.4 Million1.8 Million
2.3 Million1.2 Million
2011 2041
People:Jobs:

Past growth has occurred along rapid transit
Source: Data from Regional Growth Strategy, 2011. Map from Regional Transportation Strategy, 2013
2011

Future growth will continue along rapid transit
2041
Source: Data from Regional Growth Strategy, 2011. Map from Regional Transportation Strategy, 2013

Rapid transit expansion is key to serving future growth
2041 with new rapid transit
Source: Data from Regional Growth Strategy, 2011. Map from Regional Transportation Strategy, 2013

Past investments have led to ridership growth
• Metro Vancouver transit ridership has doubled over the past 20 years
• Ridership spikes when we invest in the system
Source: Ridership data from TransLink Annual Reports. 2001 (transit strike year) has not been plotted.

Transit needs to accommodate future growth
• The Provincial Transit Plan (2008) set ambitious targets for transit use in Metro Vancouver
• Achieving these targets requires significant investment in transit
Source: Data from TransLink Trip Diary (1994-2011); Provincial Transit Plan (2008)
The Need

Transit investment is essential to support economic growth
Recent studies found:• Significant, sustained transit
investment results in more than $3.7 billion per year of additional GDP per $1 billion invested. (APTA 2014)
• Transit supports the development of high growth business clusters. The competitiveness of these clusters depends on travel time and reliability. (APTA 2013)

Lack of transit connectivity on Broadway is limiting its economic potential
Studies of the Broadway Corridor found:• The UBC-Broadway corridor is
home to an expanding high-tech sector, the largest hospital and the largest university in Western Canada (KPMG)
• Transit on the corridor is insufficient
• ULI found that development along the corridor should consider the context
Source: KPMG, 2013; ULI, 2014

Broadway is a high-density corridor
Source: 2006 Canada Census; TransLink Trip Diary 2008
Half of all trips to the UBC-Broadway Corridor begin outside Vancouver

Jobs

Jobs
SkyTrain Extension
SkyTrain Extension – Phase 2 to UBC

Why a Tunneled SkyTrain Extension is Right for Broadway
SkyTrain:• Has the lowest operating costs• Offers almost three times the
benefits per dollar spent• Cuts the travel time from
Commercial-Broadway to Arbutus in half
• Attracts the most daily riders – more than 3X the B-Line today
Source: SDG (for TransLink): UBC Line Rapid Transit Study, Phase 2 Final Evaluation Report, Aug 2012.

Why a tunnelled SkyTrain is right for Broadway
Alternate route to Downtown
Reduces transfers at Commercial-Broadway
Extends life of the Expo Line
Regional connection to YVR and Richmond
1
2
3
4

Photo: TransLink
Mayors’ Council Plan:
Benefits for Vancouver
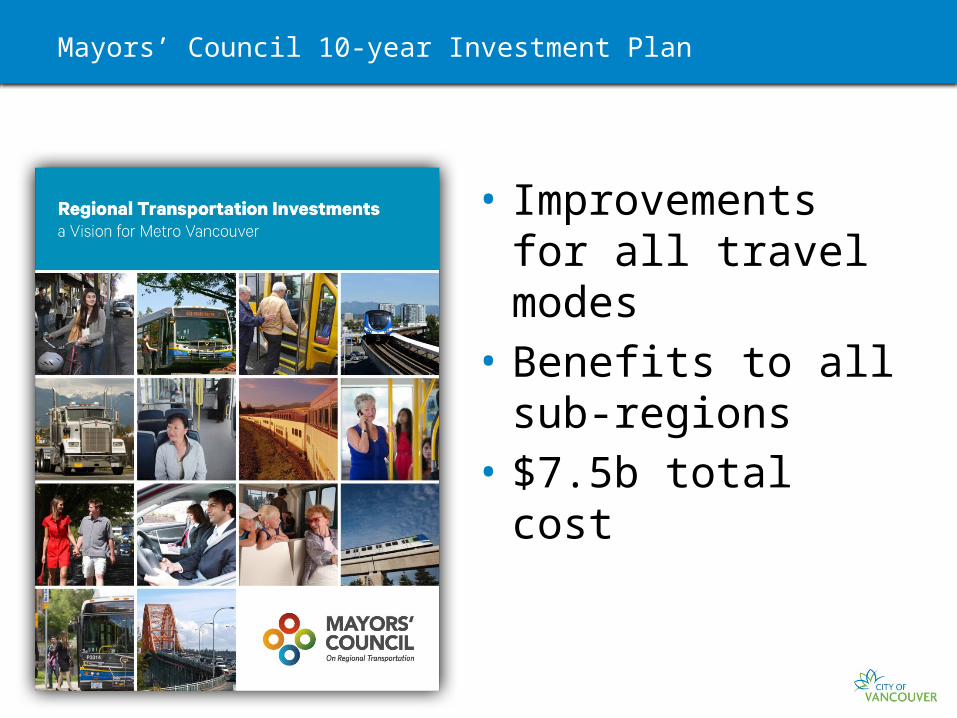
Mayors’ Council 10-year Investment Plan
• Improvements for all travel modes
• Benefits to all sub-regions
• $7.5b total cost

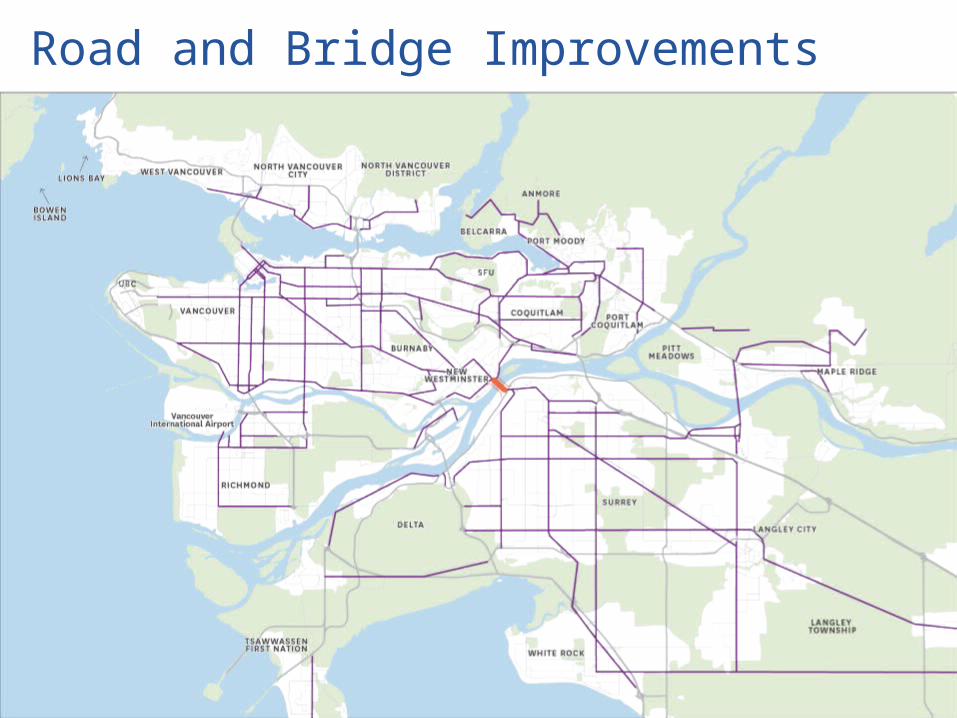
Road and Bridge Improvements


25% Increase in Bus Service
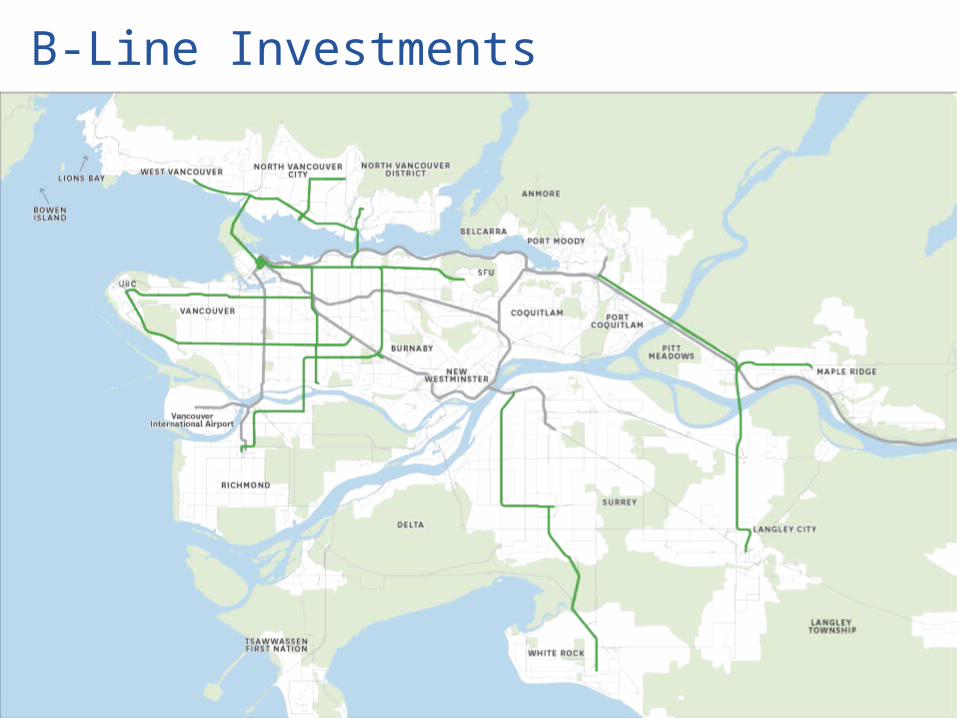
B-Line Investments


Light Rail Transit in Surrey
MILLENNIUM LINE
EXPO LINE
CA
NA
DA
LIN
E
WEST COAST EXPRESS

Broadway Rapid TransitTunneled Broadway SkyTrain Extension
MILLENNIUM LINE
EXPO LINE
CA
NA
DA
LIN
E
WEST COAST EXPRESS


32
Mayors’ Council 10-year Investment Plan
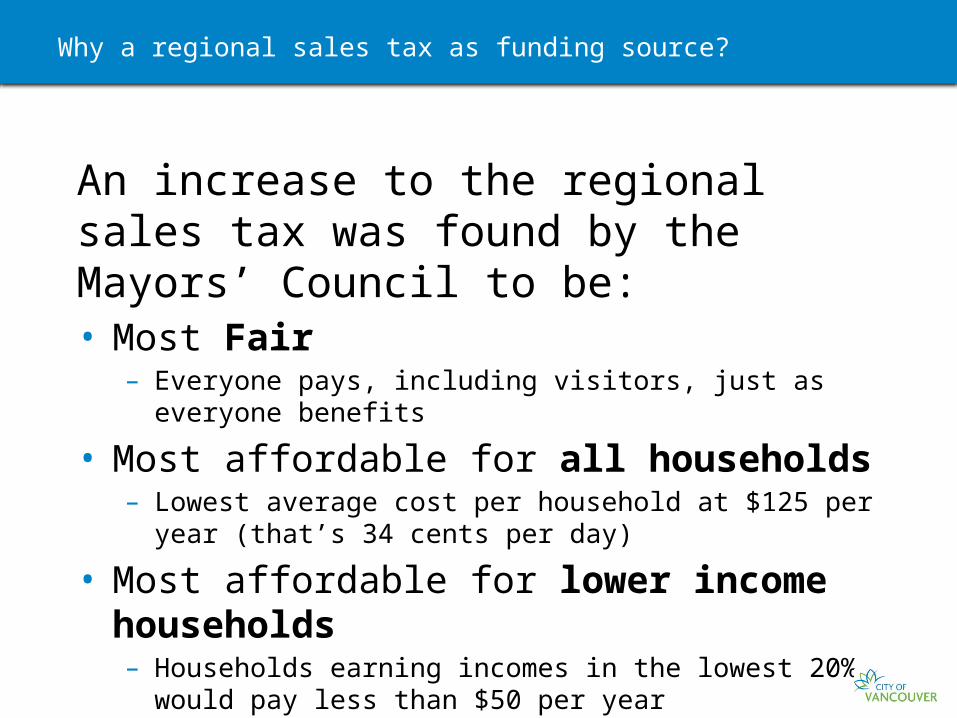
Why a regional sales tax as funding source?
An increase to the regional sales tax was found by the Mayors’ Council to be:• Most Fair
– Everyone pays, including visitors, just as everyone benefits
• Most affordable for all households– Lowest average cost per household at $125 per year (that’s 34
cents per day)
• Most affordable for lower income households– Households earning incomes in the lowest 20% would pay less
than $50 per year

New Funding Will Be Dedicated to the Plan
Accountability
Measures
Dedicated to implement the Mayors’ Plan
Independent audit process,
reporting to Mayors and the public
Annual public reporting on all expenditures and
Plan progress

• Voting period: – March 16 to May
29, 2015
• Official Province-approved ballot (left)
Referendum (Plebiscite) Ballot
Source: Elections BC

What can you do to help?
1. Spread the word about the importance of transit in Vancouver
2. Connect us to others
3. Visit the following websites: – www.bettertransit.info– mayorscouncil.ca– vancouver.ca/transitreferendum– movinginalivableregion.ca
4. Use #yes4transit to promote a yes vote with your social networks
36
Call to Action