ENERGY - Finance · energy use is limited to 7.0 percent and 1.0 percent, ... Consumption of...
42
225 Chapter 15 ENERGY The International Energy Outlook 2006, projected strong growth in energy demand globally over the next 27-years on the back of equally strong world economic growth. World economic growth will averaging 3.8 percent per annum during the same period. Much of the growth in world energy demand will come from non-OECD Asia, which includes China and South Asian countries; demand in the region will nearly triple over the projection period. Total primary energy consumption in the non-OECD countries will grow at an average annual rate of 3.0 percent between 2003 and 2030. In contrast, for the Organization for Economic Cooperation and Development (OECD)—countries energy use will grow at a much slower pace of 1.0 percent per year over the same period. Pakistan’s economy has been growing at an average rate of over 7.6 percent per annum over the last three years and the government is making efforts to sustain the momentum going forward. Knowing well that there exists strong relationship between economic growth and energy demand government is making efforts to address the challenges of rising energy demand. These include, import of piped natural gas from Iran and Turkmenistan, import of LNG; increase in oil and gas exploration in the country; utilizing 175 billion tones of Thar coal reserves; setting up of new nuclear power plants; exploiting the affordable alternate energy resources and overhauling existing power generation plants to enhance their generation capacity. In addition to increasing supply, there is a need to promote efficient use of energy resources as well. At present Pakistan meets its energy requirement of over 75 percent from domestic resources. As Fig-15.1 shows, around 50.4 percent of its energy need is met by the indigenous gas, 28.4 percent by domestic and imported oil and 12.7 percent by hydro electricity. Coal and nuclear contribution to energy use is limited to 7.0 percent and 1.0 percent, respectively. While the widening of energy supply and demand gap remains a challenge for Pakistan, it also provides viable investment opportunities for both local and international investors. Energy Consumption: An update Energy sector in Pakistan comprises electricity, gas, petroleum and coal. The primary commercial energy supplies increased by 4.3 percent by to 57.9 million tones of oil equivalent (MTOE) during 2005-06 as compared to 55.5 (MTOE) in 2004-05. The supply of energy increased by 9.2 percent and 8 percent in 2004-05 and 2003-04 respectively. The slower growth of primary energy supplies during 2005-06, can be attributed to: (i) lower consumption of High Speed Diesel (HSD) in transport sector, and (ii) sharp reduction in coal imports by Pakistan Steel. The decline in primary energy supplies has been compensated by sizeable increase of 20.2 percent in hydel generation during 2005-06. The share of natural gas in primary energy supplies during 2005-06 reached 50.4 percent followed by oil (28.4 percent), hydro electricity (12.7 percent), coal (7.0 percent), nuclear electricity (1.0 percent) and LPG (0.4 percent) (Fig- 15.1). To address the issue of bridging the gap between demand and supply the government is working on many fronts. It is in this perspective that the proposed Iran-Pakistan-India (IPI) gas pipeline project has reached at fairly advanced stage. The proposed gas pipeline project will take Iranian gas across Pakistan to India which will spur industrial, commercial and domestic economic activities in all the three counties. The Government has approved the gas sharing formula with other stakeholders. Pakistan and India will share equally when Iran starts delivering 2.1 billion cub feet of gas per day in the first phase. In the second phase, the total gas
Transcript of ENERGY - Finance · energy use is limited to 7.0 percent and 1.0 percent, ... Consumption of...

225
Chapter 15
ENERGY
The International Energy Outlook 2006, projected strong growth in energy demand globally over the next 27-years on the back of equally strong world economic growth. World economic growth will averaging 3.8 percent per annum during the same period. Much of the growth in world energy demand will come from non-OECD Asia, which includes China and South Asian countries; demand in the region will nearly triple over the projection period. Total primary energy consumption in the non-OECD countries will grow at an average annual rate of 3.0 percent between 2003 and 2030. In contrast, for the Organization for Economic Cooperation and Development (OECD)—countries energy use will grow at a much slower pace of 1.0 percent per year over the same period.
Pakistan’s economy has been growing at an average rate of over 7.6 percent per annum over the last three years and the government is making efforts to sustain the momentum going forward. Knowing well that there exists strong relationship between economic growth and energy demand government is making efforts to address the challenges of rising energy demand. These include, import of piped natural gas from Iran and Turkmenistan, import of LNG; increase in oil and gas exploration in the country; utilizing 175 billion tones of Thar coal reserves; setting up of new nuclear power plants; exploiting the affordable alternate energy resources and overhauling existing power generation plants to enhance their generation capacity. In addition to increasing supply, there is a need to promote efficient use of energy resources as well.
At present Pakistan meets its energy requirement of over 75 percent from domestic resources. As Fig-15.1 shows, around 50.4 percent of its energy need is met by the indigenous gas, 28.4 percent by domestic and imported oil and 12.7 percent by
hydro electricity. Coal and nuclear contribution to energy use is limited to 7.0 percent and 1.0 percent, respectively. While the widening of energy supply and demand gap remains a challenge for Pakistan, it also provides viable investment opportunities for both local and international investors.
Energy Consumption: An update
Energy sector in Pakistan comprises electricity, gas, petroleum and coal. The primary commercial energy supplies increased by 4.3 percent by to 57.9 million tones of oil equivalent (MTOE) during 2005-06 as compared to 55.5 (MTOE) in 2004-05. The supply of energy increased by 9.2 percent and 8 percent in 2004-05 and 2003-04 respectively. The slower growth of primary energy supplies during 2005-06, can be attributed to: (i) lower consumption of High Speed Diesel (HSD) in transport sector, and (ii) sharp reduction in coal imports by Pakistan Steel. The decline in primary energy supplies has been compensated by sizeable increase of 20.2 percent in hydel generation during 2005-06. The share of natural gas in primary energy supplies during 2005-06 reached 50.4 percent followed by oil (28.4 percent), hydro electricity (12.7 percent), coal (7.0 percent), nuclear electricity (1.0 percent) and LPG (0.4 percent) (Fig-15.1).
To address the issue of bridging the gap between demand and supply the government is working on many fronts. It is in this perspective that the proposed Iran-Pakistan-India (IPI) gas pipeline project has reached at fairly advanced stage. The proposed gas pipeline project will take Iranian gas across Pakistan to India which will spur industrial, commercial and domestic economic activities in all the three counties. The Government has approved the gas sharing formula with other stakeholders. Pakistan and India will share equally when Iran starts delivering 2.1 billion cub feet of gas per day in the first phase. In the second phase, the total gas

Economic Survey 2006-07
226
delivery will be enhanced to 5.3 billion cubic feet per day (BCFD) which Pakistan and India will share 2.1 BCFD and 3.2 BCFD, respectively. The IPI gas pipeline project is expected to start delivery by 2009-10. Termed as a peace pipeline, the IPI project aims at helping the two energy-starved South Asian countries meet their growing energy demand. Pakistan will also earn up to $700 million a year as transit fee from India. Strategically Pakistan is well placed in Asia to play the role of an energy corridor between the energy rich and the energy deficient countries.
The consumption of oil decreased by 0.3 percent during 2005-06 over the corresponding period last year. This was mainly due to lower consumption of oil in transport, agriculture and domestic sectors by 10 percent, 42 percent and 33 percent, respectively. Consumption of furnace oil in cement industry also dropped by 17 percent in 2004-05. Despite the slight decrease in oil consumption Pakistan remains dependent on costly oil imports. The crude oil and petroleum products import for the first nine month of the year 2006-07 amounted to about 6.1 million tonnes and 5.9 million tonnes, with values of US$ 2.64 billion and US$ 2.59 billion, respectively. The total oil import bill for the year 2006-07 (July-March) was US$ 5.23 billion.
The growth in consumption of natural gas at 5.4 percent outpaced the growth of production at 4.1 percent during 2005-06. The industry-wise break down of higher consumption was a follows: general industry (141 MMCFD); transport sector (40 MMCFD); fertilizer industry (22 MMCFD);
commercial sector (6 MMCFD) and cement industry (5 MMCFD). However, consumption of gas decreased in power sector by (43 MMCFD) and in domestic sector by (3 MMCFD) despite an increase in number of domestic consumers by 6.5 percent over 2004-05. CNG sector continued to show high growth rate of 59 percent and gas consumption increasing from 67 to 107 MMCFD.
I . Energy Consumption
During the last ten years (1996-97 to 2005-06), the consumption of petroleum products has decreased by an average rate of 0.4 percent per annum. The consumption of gas, electricity and coal on the other hand, has increased at an average rate of 7.8 percent, 5.1 percent and 8.8 percent per annum, respectively. The annual trend of energy consumption for the period 1996-97 to 2005-06 is given in Table 15.1. It is important to note that a structural change is taking place in energy consumption pattern in Pakistan since 2000-01. While consumption of petroleum products is declining except in 2004-05, the consumption of other components of energy is rising. The average consumption of petroleum products has in fact, registered a decline of 2.8 percent per annum since 2000-01, due to lower consumption of oil in the household and agriculture sectors. On the other hand, since 2000-01 consumption of gas, electricity and coal have grown at average rates of 9.6 percent, 6.8 percent and 16.7 percent, respectively.
The consumption of petroleum products and coal, during July-March 2006-07 of the current fiscal year witnessed significant increases by 19.2 percent and 24.6 percent, respectively. This is most likely due to higher demand of oil in agriculture and power sectors, non-availability of alternative fuel and the mixing of indigenous coal with imported coal. Further, the consumption of coal has also increased due to higher consumption in bricks kilns industry. These trends reflect the high agriculture growth and boom in infrastructure development like housing and buildings.
The acceleration in growth of all components of energy during 2006-07, is also driven by 8.8 percent growth in large-scale manufacturing and 7.0 percent growth in real GDP 2006-07. Higher consumption of energy especially oil, in agriculture sector reflects higher growth in this
Fig-15.1: Primary Energy Supplies by Source (2005-06)
Hydro12.7%Coal
7.0%Oil
28.4%
Nuclear1%
Gas50.4%
Source: HDIP

Energy
227
sector, despite heavy fluctuation in its prices ranging between US $ 50 to US $ 80 per barrel in international oil markets. The fluctuating prices
have not affected the rising level of economic activities and expansion of middle class in the country.
Table 15.1: Annual Energy Consumption
Petroleum Products Gas Electricity Coal Fiscal Year (000
tones) %
Change (mmcft) % Change (Gwh) %
Change (000 M.T) % Change
1996-97 15,606 0.0 597,799 2.6 42,914 3.4 3,553 -2.3 1997-98 16,624 6.5 607,890 1.7 44,572 3.9 3,159 -11.1 1998-99 16,647 0.1 635,891 4.6 43,296 -2.9 3,461 9.6 1999-00 17,768 6.7 712,101 12.0 45,586 5.3 3,168 -8.5 2000-01 17,648 -0.7 768,068 7.9 48,584 6.6 3,095 -2.3 2001-02 16,960 -3.9 824,604 7.4 50,622 4.2 3,492 12.8 2002-03 16,452 -3.0 872,264 5.8 52,656 4.0 3,768 7.9 2003-04 13,421 -18.4 1,051,418 20.5 57,491 9.2 5,284 40.2 2004-05 14,671 9.3 1,161,043 10.4 61,327 6.7 6,622 25.3 2005-06 14,627 -0.3 1,223,385 5.4 67,603 10.2 7,714 16.5 Avg. 10 years -0.4 7.8 5.1 8.8 Jul-Mar 2005-06 10,164 922,112 49,416 4,345 2006-07 12,114 19.2 929,516 0.8 52,246 5.7 5,414 24.6
Source: Hydrocarbon Development Institute of Pakistan a. Petroleum Products
During the first nine months of the current fiscal year (2006-07), the consumption of petroleum products in households sector, industry, transport and other government sector, exhibited sharp declines of 20.2 percent, 2.5 percent, 4.2 percent and 2.7 percent, respectively. The declines were mainly due to the availability of alternative and relatively cheaper fuels (natural gas and LPG), decrease in the consumption of furnace oil in industry, massive increase of CNG and natural gas in transport and low demand for JP-8 by defence. On the other hand, consumption in agriculture and power sectors showed marked increases of 11.7
percent and 89.9 percent, respectively due to higher demand in agriculture sector and non-availability of alternative source of energy to power sector. The annual growth in the consumption of petroleum products by major sectors and their relative shares between1996-97 to 2006-07 are given in Tables 15.2 & 15.3, respectively. Between1996-2006, the transport sector was the largest user of petroleum products accounting for 50.7 percent of consumption on average followed by the power sector (32.1 percent), industry (11.4 percent), other government (2.3 percent), households (2.2 percent) and agriculture (1.3 percent) (Table 15.3).
Table 15.2: Consumption of Petroleum Products (000 tones) (Percentage Change)
Year House holds
% Change Industry %
Change Agriculture % Change Trans-port %
Change Power % Change
Other Govt.
% Change Total
1996-97 510 -14.4 2,141 -11.4 269 7.6 7,172 0.5 5,110 6.8 404 -3.2 15,606 1997-98 499 -2.2 2,081 -2.8 245 -8.9 7,364 2.7 6,054 18.5 381 -5.7 16,624 1998-99 493 -1.2 2,140 2.8 249 1.6 7,864 6.8 5,526 -8.7 376 -1.3 16,648 1999-00 477 -3.2 2,116 -1.1 293 17.8 8,308 5.6 6,228 12.7 346 -8.0 17,768 2000-01 451 -5.5 1,924 -9.1 255 -13.0 8,158 -1.8 6,488 4.2 372 7.5 17,648 2001-02 335 -25.7 1,612 -16.2 226 -11.4 8,019 -1.7 6,305 -2.8 464 24.7 16,960 2002-03 283 -15.5 1,604 -0.5 197 -12.8 8,082 0.8 6,020 -4.5 266 -42.7 16,452 2003-04 231 -18.4 1,493 -6.9 184 -6.6 8,464 4.7 2,740 -54.5 309 16.2 13,421 2004-05 193 -16.5 1,542 3.3 142 -22.8 9,025 6.6 3,452 26.0 317 2.6 14,671 2005-06 129 -33.2 1,681 9.1 82 -42.3 8,157 -9.6 4,219 22.2 358 13.0 14,627 Jul-Mar 2005-06 99 1,256 60 5,981 2,508 259 10,164 2006-07 79 -20.2 1,224 -2.5 67 11.7 57,30 -4.2 4,762 89.9 252 -2.7 12,114
Source: Hydrocarbon Development Institute of Pakistan

Economic Survey 2006-07
228
Table 15.3: Consumption of Petroleum Products (Percentage Share) Year Households Industry Agriculture Transport Power Other Govt. 1996-97 3.3 13.7 1.7 45.9 32.7 2.6 1997-98 3.0 12.5 1.5 44.3 36.4 2.3 1998-99 2.9 12.9 1.5 47.2 33.2 2.3 1999-00 2.7 11.9 1.6 46.8 35.0 1.9 2000-01 2.6 10.9 1.4 46.2 36.8 2.1 2001-02 2.0 9.5 1.3 47.3 37.2 2.7 2002-03 1.7 9.7 1.2 49.1 36.5 1.6 2003-04 1.7 11.12 1.4 63.1 20.4 2.3 2004-05 1.3 10.5 1.0 61.5 23.5 2.2 2005-06 0.9 11.5 0.6 55.8 28.8 2.5 Avg10 years 2.2 11.4 1.3 50.7 32.1 2.3 Jul-Mar 2005-06 1.0 12.4 0.6 58.8 24.8 2.5 2006-07 0.7 10.1 0.5 47.3 39.3 2.1
Source: Hydrocarbon Development Institute of Pakistan
b. Consumption of Gas
Pakistan has a well-developed and integrated infrastructure of transporting, distributing and utilization of natural gas. Table 15.4 gives the annual change in the consumption of gas by various users between 1996-97―2006-07. Commercial, cement, fertilizer, industrial and transport sectors have registered a sharp rise in the consumption of gas during 2005-06. The consumption of gas in transport sector increased by 49.4 percent during July-March 2006-07, while the industrial consumption grew by 29.4 percent followed by the commercial sector (27.3 percent) and household sector (4.7). However, the consumption of gas declined in cement, fertilizer
and power sector by 10 percent, 2.7 percent and 16.9 percent respectively. (see Table 15.4). The relative shares of gas consumption by various users during the last ten years are documented in Table 15.5. The Power sector has emerged as the largest consumer of gas (36.4 percent), followed by fertilizer (21.6 percent), industries (19.1 percent) households (17.8 percent), commercial (2.7 percent), cement (1.1 percent) and transport sector (CNG) (1.0 percent). It may be noted that the share of the transport sector in gas consumption has been rising continuously since 1998-99. The transport sector is also gradually reducing its dependency on imported fuel oil because of its ever-escalating prices and availability of cheaper fuel in the shape of CNG.
Table -15.4:Consumption of Gas (Billion cft) ( Percent change)
Year House hold
% Change
Comm- ercial
% Change Cement %
Change Ferti- lizer
% Change Power %
Change Indus-
trial %
Change
TransportCNG
mmcft
% Change
1996-97 115 4.5 18 5.9 9 12.5 150 0.0 194 4.3 110 -0.9 358 1997-98 134 16.5 19 5.6 12 33.3 148 -1.3 179 -7.7 115 4.5 490 36.9 1998-99 131 -2.2 21 10.5 8 -33.3 167 12.8 184 2.8 121 5.2 2,182 345.3 1999-00 139 6.1 22 4.6 9 12.8 177 6.0 227 23.3 135 11.6 2,426 11.2 2000-01 141 1.4 21 -4.5 7 -22.2 175 -1.1 281 23.8 139 3.0 4,423 82.3 2001-02 144 2.1 22 4.8 7 0.0 178 1.1 315 12.1 151 8.6 7,369 66.6 2002-03 154 6.9 23 4.5 3 -57.1 181 1.7 336 6.7 165 9.3 11,320 53.6 2003-04 155 0.6 24 4.3 8 166.7 185 2.2 470 39.9 193 17 15,858 40.1 2004-05 172 11 27 12.5 13 62.5 190 2.7 507 7.9 226 17.1 24,443 54.1 2005-06 171 -0.6 29 7.4 15 15.4 198 4.2 492 -3.0 279 23.5 38,885 59.1 Jul-Mar 2005-06 148 22 10 148 390 177 27,077 2006-07 155 4.7 28 27.3 9 -10.0 144 -2.7 324 -16.9 229 29.4 40,459 49.4
Source: Hydrocarbon Development Institute of Pakistan

Energy
229
Table 15.5: Consumption of Gas (Percentage Share)
Year Households Commercial Cement Fertilizer Power Industrial Transport CNG
1996-97 19.3 3.1 1.5 25.2 32.4 18.4 0.1 1997-98 22.1 3.1 2.0 24.3 29.4 18.9 0.1 1998-99 20.7 3.4 1.3 26.3 28.9 19.1 0.3 1999-00 19.6 3.0 1.2 24.8 32.2 18.9 0.3 2000-01 18.2 2.7 0.9 22.6 37.0 17.8 0.6 2001-02 17.5 2.7 0.9 21.6 38.2 18.5 0.9 2002-03 17.6 2.6 0.4 20.7 38.5 18.9 1.3 2003-04 14.8 2.3 0.7 17.6 44.7 18.4 1.5 2004-05 14.8 2.3 1.2 16.4 43.7 19.5 2.1 2005-06 13.9 2.4 1.2 16.2 40.2 22.8 3.2 AVG 17.8 2..7 1.1 21.6 36.4 19.1 1.0 Jul-Mar 2005-06 16.0 2.4 1.1 16.1 42.3 19.2 2.9 2006-07 16.6 3.0 1.0 15.5 34.8 24.6 4.4
Source: Hydrocarbon Development Institute of Pakistan.
c. Electricity Consumption
Tables 15.6 and 15.7 show the position of electricity consumption in Pakistan from 1996-97 to 2005-06. On average, the household sector has been the largest consumer of electricity, accounting for 44.8 percent of total electricity consumption, followed by industrial (29.4 percent), agriculture (12.2 percent), other government sector (7.2 percent), commercial sector (5.9 percent), and street lights (0.6 percent). A substantial increase in the consumption of electricity has also been witnessed during the first 9 months of the current fiscal year (Fig-15.2).
Table 15.6: Consumption of Electricity by Sectors (000 GWH) (Percentage Change)
House hold Commercial Industrial Agriculture Street Light (Total) Other Govt. Year Gwh %Change Gwh %Change Gwh %Change Gwh %Change Gwh %Change Gwh %Change
1996-97 17.8 4.1 2.2 0 11.9 -1.7 7.0 4.5 390 3.2 3.4 3.01997-98 18.8 5.6 2.3 4.5 12.3 3.4 6.9 -1.4 387 -0.8 3.9 14.71998-99 19.4 3.2 2.4 4.3 12.0 -2.4 5.6 -18.8 224 -42.1 3.6 -7.71999-00 21.4 10.3 2.5 5.2 13.2 10.0 4.5 -19.9 239 6.7 3.6 02000-01 22.8 6.5 2.8 12 14.3 8.3 4.9 8.9 213 -10.9 3.5 -2.82001-02 23.2 1.8 3.0 7.1 15.1 5.6 5.6 14.3 212 -0.5 3.5 0.02002-03 23.7 2.2 3.2 6.7 16.2 7.3 6.0 7.1 244 15.1 3.4 -2.92003-04 25.8 8.9 3.7 15.6 17.4 7.4 6.7 11.7 262 7.4 3.7 8.82004-05 27.6 6.8 4.1 10.6 18.6 7.1 7.0 4.8 305 16.4 3.8 2.72005-06 30.7 11.2 4.7 14.6 19.8 6.5 7.9 12.9 353 15.7 4.0 5.3Jul-Mar 2005-06 22.1 3.4 14.7 5.9 261 3.02006-07 23.5 6.3 3.8 11.8 15.5 5.4 6.0 1.7 284 8.8 3.1 3.3
Source: Hydrocarbon Development Institute of Pakistan
Fig15.2: Consumption of Electricity - Sectoral Share (2006-07)
Industrial29.7%
Agriculture11.5%
Other Govt.6.0%
Street Light 0.5%
Households45.1%
Commercial 7.2%
Source: HDIP

Economic Survey 2006-07
230
Table 15.7: Consumption of Electricity (Percentage Share) Year Households Commercial Industrial Agriculture Street Light Other Govt. 1996-97 41.4 5.2 27.9 16.5 0.9 8.0 1997-98 42.1 5.2 27.6 15.5 0.9 8.7 1998-99 44.8 5.5 27.9 12.9 0.5 8.3 1999-2000 47.1 5.6 28.9 9.9 0.5 7.9 2000-01 46.9 5.7 29.5 10.1 0.4 7.3 2001-02 45.9 5.8 29.9 11.1 0.4 6.9 2002-03 44.9 6.1 30.7 11.4 0.5 6.4 2003-04 45.0 6.4 30.2 11.6 0.5 6.4 2004-05 45.0 6.0 31.3 14.4 0.5 6.1 2005-06 45.4 7.0 29.3 11.8 0.5 6.0 AVG 44.8 5.9 29.4 12.2 0.6 7.2 Jul-Mar 2005-06 44.8 6.9 29.7 12.1 0.5 6.0 2006-07 45.1 7.2 29.7 11.5 0.5 6.0
Source: Hydrocarbon Development Institute of Pakistan
II. Primary Energy Supply
Primary energy refers to the energy sources at the beginning of the energy conversion chains. The total primary energy supplies in Pakistan amounted to 57.9 million tons of oil equivalent (MTOE) in 2005-06. The annual trends of primary energy supplies and their per capita availability, measured in tonnes of oil equivalent (TOE) from 1996-97 to 2006-07 are given in Table (15.8 and Fig-15.3 & Fig-15.4). The supply of primary energy has increased by 50.2 percent in the last 10 years. The per capita availability rose from 0.295 TOE in 1996-97 to 0.372 TOE in 2005-06 −an increase of 26.1 percent in the last 10 years. The energy supplies during the first 9
months of the current fiscal year increased to 45.35 million TOE from 42.44 million TOE in the same period last year or an increase of 6.8 percent. The per capita availability has also increased by almost the same ratio. This increase in primary energy supplies is mainly due to appropriate and timely measures taken by the government to provide an investment-friendly environment for the energy sector to attract more local and foreign investors. The flow of foreign investment in the energy sector has remained buoyant and is projected to further accelerate in the near future. The supply of primary energy by various sources of energy as well as their rates of increases, are illustrated in Table 15.9.
Table 15.8: Primary Energy Supply and Per Capita Availability
Energy Supply Per Capita Year Million TOE %Change Availability (TOE) % Change
1996-97 38.515 -0.6 0.295 (3.0) 1997-98 40.403 4.9 0.305 3.3 1998-99 41.721 3.3 0.313 2.7 1999-00 43.185 3.5 0.317 1.2 2000-01 44.404 2.8 0.319 0.6 2001-02 45.068 1.5 0.315 -0.1 2002-03 47.056 4.4 0.324 2.7 2003-04 50.831 8.0 0.341 5.3 2004-05 55.533 9.3 0.363 6.7 2005-06 57.855 4.2 0.372 2.2 Jul-Mar - 2005-06 42.449 0.274 2006-07 45.350 6.8 0.288 6.6 TOE- Tons of Oil Equivalent Source: Hydrocarbon Development Institute of Pakistan.

Energy
231
Fig-15.3: Energy Supply(Million TOE)
25
30
35
40
45
50
55
60
19
96
-97
19
97
-98
19
98
-99
19
99
-00
20
00
-01
20
01
-02
20
02
-03
20
03
-04
20
04
-05
20
05
-06
`
Source: HDIP Source: HDIP
Table 15.9: Composition of Energy Supplies
Crude Oil Gas Petroleum Products Coal Electricity Year Million
Barrels %
Change (bcf)* % Change (Mln. T.) %Change Mln.T) %Change (000Gwh)(a) %Change
1996-97 49.9 -4.3 697.8 4.7 15.9 -0.6 4.4 -6.4 59.1 3.9 1997-98 50.4 1.2 700 0.3 16.9 6.3 4.1 -6.8 62.1 5.1 1998-99 52.6 4.5 744.9 6.4 16.8 -0.6 4.4 7.3 65.4 5.3 1999-00 53.3 1.3 818.3 9.9 17.9 6.5 4.1 -6.8 65.7 0.5 2000-01 73.6 38 857.4 4.8 18.4 4.5 4.0 -2.4 68.1 3.7 2001-02 75.1 2.0 923.8 7.7 18.0 -1.6 4.4 10.0 72.4 6.3 2002-03 76.0 1.2 992.6 7.5 17.5 -3.8 4.9 11.4 75.7 4.5 2003-04 80.3 5.7 1,202.7 21.2 14.9 -14.9 6.0 22.4 80.8 6.8 2004-05 85.3 6.2 1,344.9 11.8 16.1 8.1 7.9 31.7 85.6 5.9 2006-07 87.5 2.6 1,400.0 4.1 16.5 2.5 7.7 -2.5 93.6 9.3 Jul-Mar 2005-06 66.7 1,048.2 -- 4.2 66.1 2006-07 62.0 -7.0 1,062.1 1.3 13.6 -- 5.4 28.6 71.0 7.4 *: Billion cubic feet Source: Hydrocarbon Development Institute of Pakistan. a: Giga Watt hour e: Estimated - : Not Available
a) Crude Oil The balance recoverable reserves of crude oil as on January 1st 2007 have been estimated at 317.82 million barrels in the country. The average crude oil production during July- March 2006-07 was 66,485 barrels per day as against 65,385 barrels per day during the corresponding period of last year, showing an increase of 1.68 percent. During the period under review, 28,507(42.88 percent) barrels per day were produced in northern region and 37,978 (57.12 percent) barrels per day in southern
region, as against 29,151 (44.58 percent) barrels and 36,234(55.42 percent) barrels produced per day respectively in the same period last year. During July-March 2006-07, production of crude oil has decline by 2.21 percent from northern region and the production efficiency has increased in southern region by 4.81 percent, as compared to same period last year. The company wise detail of production of cured oil during July-March 2006-07 and corresponding period of the last fiscal year is given in Table 15.10.
Fig-15.4: Per Capita Availability (TOE)
0.2
0.22
0.24
0.26
0.28
0.3
0.32
0.34
0.36
0.38
96-97
97-98
98-99
99-00
2000-01
2001-02
2002-03
2003-04
2004-05
2005-06

Economic Survey 2006-07
232
Table 15.10: Production of Crude Oil
Region 2005-06 July-March 2005-06
July-March 2006-07 % Change
Northern Region 29,073.51 29,150.93 28,507.30 -2.21 OGDCL 11,081.62 11,155.03 12,273.52 10.03 OPI 639.28 663.16 550.15 -17.04 POL 13,077.80 12,984.92 9,111.55 -29.83 PPL 3,437.89 3,558.97 4,892.20 37.46 MOL 836.90 788.84 1,679.89 112.96
Southern Region 6,503.56 36,234.22 37,977.82 4.81 OGDCL 20,429.06 20,240.42 22,623.81 11.78 BP (Pakistan) 12,674.97 12,640.15 11,377.12 -9.99 PPL 136.88 146.29 138.85 -5.09 BHP 1,796.87 1,744.61 2,039.16 16.88 OMV 96.60 98.54 91.93 -6.71 OPI 947.89 927.70 1,276.87 37.64 ENI 317.03 327.62 343.23 4.77
Petronas 104.26 108.90 86.86 -20.24 Total: 65,577.07 65,385.16 66,485.13 1.68
Source: Ministry of Petroleum & Natural Resources
b) Natural Gas
The importance of natural gas to the county has been increasing rapidly. As on January 1st 2007, the balance recoverable natural gas reserves have been estimated at 31.81 trillion cubic feet. The average production of natural gas during July-March 2006-07 was 3,876.38 million cubic feet per day (mmcfd) as against 3,825.51 (mmcfd) during the corresponding period of last year, showing an increase of 1.33 percent. Natural gas is used in general industry to prepare consumer items, to produce cement and to generate electricity. In the
form of CNG, it is used in transport sector and most importantly to manufacture fertilizer to boost the agricultural sector. Many private and public companies are currently engaged in oil and gas exploration & production activities including BHP, OPI, PEL, MOL and OGDCL. The company wise position reveals that a sizable increase in the production of natural gas was contributed by BHP (18 percent), ENI (5.5 percent), OPI (25 percent), PEL (49 percent) and MOL (32.4 percent). Company wise total natural gas production is shown in Table 15.11.
Table- 15.11: Production of Natural Gas (mmcfd)
Company 2005-06 July-March 2005-06
July-March 2006-07 % change
BHP 272.19 263.90 310.82 17.78 ENI 368.52 368.94 389.14 5.47 MGCL 468.62 467.05 473.39 1.36 OGDCL 846.86 849.17 834.07 -1.78 OMV 547.55 544.66 539.73 -0.90 OPI 86.07 82.85 103.65 25.11 POL 56.19 55.45 43.57 -21.44 PPL 841.93 846.44 828.61 -2.11 TULLOW 5.00 4.89 2.48 -49.18 PEL 24.34 21.34 31.75 48.79 BP(Pakistan) 240.55 241.34 299.26 -5.01 Petronas 30.92 31.99 27.06 -15.42 MOL 47.44 47.48 62.85 32.37 Total: 3,836.15 3,825.51 3,876.38 1.33
Source: Ministry of Petroleum & Natural Resources

Energy
233
c. Drilling Activities
During July-March 2006-07, altogether 46 wells have been drilled, including 19 wells in the public sector and 27 in the private sector as against 41 in the same period last year registering an increase of 12.2 percent. Total investment of US$ 700.88
million has so far been made in the current financial year in the upstream petroleum sector. Table 15.12 gives the detail of drilling activities of the public and private sector companies, engaged in the exploration and development of wells, with achievement during July-March 2006-07 and corresponding period last year.
Table 15.12: Drilling Activities (Achievements) (No. of Wells)
Sector 2005-06 July-March 2005-06
July-March 2006-07 % Change
Public Sector 30 18 19 5.5 (OGDCL)
i) Exploratory 23 14 14 0.00 ii)Appraisal/Dev 7 4 5 25.0
Private Sector 34 23 27 17.39 iii) Exploratory 10 5 13 160.00 iv) Appraisal/Dev 24 18 14 -22.22
Total: 64 41 46 12.19 Source: Ministry of Petroleum & Natural Resources
d) Liquefied Petroleum Gas (LPG)
Use of LPG as domestic fuel is being encouraged to slow the ongoing deforestation in the areas where supply of natural gas is technically not feasible. As a result of the government’s investment-friendly policies, production of LPG has reached 1,650 M.T per day in 2006-07 from 540 MT per day in 2000-almost four fold increase in the last six years. LPG is also being increasingly used in cars, pickups, rickshaws and even motorcycles in area where CNG is not available due to the absence of natural gas distribution network. The supply of LPG was streamlined with its distribution at affordable prices, promoting healthy competition and ensuring safety standards across LPG supply chain. The custom duty at 5 percent imposed on the import of LPG has been waived to further enhance availability of LPG. The LPG marketing companies have planned to import approximately 43,000 M.T during 2006-07.
e) Compressed Natural Gas (CNG)
The Government is promoting the use of Compressed Natural Gas (CNG) aggressively to reduce pollution caused by vehicles using motor gasoline and to improve the ambient air quality. A growing number of vehicles have been converted
to CNG power by the private sector to take advantage of the relatively low price of CNG fuel. Some 1,414 CNG stations (as on April 2007) are operational in 85 cities and towns of the country and about 1.35 million vehicles are using CNG as against one million vehicles during same period last year showing an increase of 35 percent. On average 29,167 vehicles are being converted to CNG every month. With these developments, Pakistan has become the leading country in Asia and the third largest user of CNG in the world after Argentina and Brazil. An investment of Rs. 60 billion has been made in the CNG sector during July-March 2006-07 as compared Rs. 20 billion invested upto end March 2006, registering a growth of 200 percent in investment. Similarly CNG industry has created 60,000 new jobs.
In view of short supply of indigenous oil/liquid fuels, there is a scope for development of alternate fuels, especially natural gas that is locally available at low price along with a widespread infrastructure for transmission and distribution network. Research, development and demonstration efforts led to a successful implementation and commercialization of CNG in Pakistan as an environment-friendly, cheap and safe road transport fuel.

Economic Survey 2006-07
234
Pakistan imported nearly 4.1 million tones of diesel oil at a cost of US$ 2.2 billion during 2005-06. Since the air pollution caused by diesel oil is more severe than CNG, there is a need for replacing diesel oil to the extent possible with CNG. The technology/economics of converting diesel engines to CNG, however, are not very attractive due to high conversion cost, little differential in the price of diesel oil and CNG, and several engineering and management problems related to conversion of bus fleets. In order to address these problems, the Provincial Governments are working on a programme with the support of Federal Government to gradually phase out diesel buses and induct intra-city CNG buses in major cities of Pakistan. The programme will also include infrastructure development and manufacturing of CNG buses. Government policy is to promote a market driven industrial development of the CNG industry rather than through administrative directives. This programm will have a major impact on air quality of the urban areas, which will improve health standards.
f. Liquefied Natural Gas (LNG)
Augmenting gas supply through LNG import is an important element of the Government’s energy security strategy. The government is encouraging LNG import by the Private sector and announced its first-ever LNG policy during 2005-06. The government plans to establish an offshore LNG import terminal at Port Qasim which will be a major step towards increased availability of liquefied natural gas in the country through import. In this regard, an agreement has been signed between Port Qasim Authority and Pakistan Gas Port Limited. The use of LNG and its demand worldwide has increased by nearly 40 percent between 2002 and 2005 because it is cleaner and less carbon intensive than oil or coal. LNG also has many advantages for storage and distribution over natural gas. Pakistan has the world’s second largest pipeline network of the natural gas after the United States. Liquefied natural gas technology has revolutionized the energy sector, and demonstrated its worth as a more commercially viable option.
Performance of major oil and gas companies The operational performance of the three major oil and gas companies in the public sector is reviewed in the following paragraphs.
a. Oil and Gas Development Company Limited (OGDCL):
OGDCL is the first Pakistani exploration and production company to list its shares on the London Stock Exchange through the issuance of GDR. The successful listing was a result of a well developed business and strategic plan; a debt-free and robust balance sheet and healthy cash reserves.
During July-March 2006-07, company’s average oil and gas production remained at 34,893 barrels per day and 834 mmcfd per day respectively. This reflects an increase of 11 percent in oil and 7.1 percent in natural gas as against the same period last year. The LPG and sulphur production reached 310 metric ton per day and 65 metric ton per day showing an increase of 7.6 percent in LPG production and 16.0 percent in sulphur as against same period last year.
The company has discovered four new gas and oil producing fields during July -March 2006-07. For example, the Mela oil and gas mix field located in NWFP is producing 4,100 barrel per day of crude and 12 mmcfd of natural gas. The other three fields are situated in Sindh. Unar-1 is a mix field, producing 150 barrel per day of oil and 13.7 mmcfd of gas. While Pasaki and Nim West-1 produced 1,800 barrels of oil and 6.26 mmcfd of natural gas respectively. These discoveries when fully developed will help the country save millions of dollar in foreign exchange. OGDCL has drilled 19 wells (14 exploratory/appraisal and 5 development) during July- March 2006-07, as against 18 wells (14 exploratory/appraisal and 4 development) in the same period last year. The physical performance of the OGDCL is given in Table-15-13

Energy
235
TABLE 15.13: PHYSICAL PERFORMANCE OF OGDCL
S. No Name of Activity July-March 2005-06
July-March 2006-07 % Change
i Exploratory Wells 14 14 - 1. ii Development Wells 4 5 25
2. Production Unit
i Oil US Barrels 8,602,700 (31,397)
9,560,816 (34,893)
11
ii Gas MMcft 213,570 (779)
228,531 (834)
7
iii LPG Tonnes 78,907 (288)
85,040 (310)
8
iv Sulphur Tonnes 15,414 (56)
17,882 (65)
16
(Figures in bracket show daily average production) Source: OGDCL
b. Sui Northern Gas Pipelines Limited (SNGPL):
Sui Northern is supplying gas to 897 towns/villages of Punjab and NWFP. During the period July- March 2006-07, the company connected 469 industrial 2,503 commercial and 163,704 domestic consumers bringing the total number of consumers to 2,839,237. These include 4242 industrial, 46,422 commercial and 2,788,573 domestic consumers. During July-March 2006-07, the company carried out development work for extension of gas network to the tune of Rs. 1077 million on transmission project, Rs. 3,906 million on distribution projects and Rs. 252 million on other projects under Khushal Pakistan programme. During next fiscal year 2007-08, the Company has plans to invest Rs. 11,376 on transmission and distribution projects.
c. Sui Southern Gas Company Limited: (SSGC)
By end March 2007 Sui Southern Gas Company Limited had expanded its network to 1,351 towns/villages of Sindh and Baluchistan. During the period July-March 2006-07, SSGC provided new connections to 221 Industrial, 1,232 Commercial and 67,373 Domestic consumers bringing the total number of consumers to 1,929,237. These include 3,199 industrial, 21,170 commercial and 1,904,868 domestic consumers. During July-March 2006-07, Sui Southern Gas
Company Limited carried out development work for extension of gas net work to the tune of Rs. 4,433 million on transmission project, Rs. 3,137 million on distribution projects and Rs. 680 million on other projects under Khushal Pakistan programme with the collaboration of district governments. During the next fiscal year the company plans to invest Rs. 10,384 million on transmission and distribution projects.
III. Power Sector
Historically Pakistan faced electricity deficit from 1990 to 1997. The demand and supply of electricity was balanced in 1997. From 1997, the generation capacity increased and it was expected that the demand and supply position of electricity will remain in equilibrium up to 2009. However, as existing peak demand approached 6.6 percent growth per annum during 2001 to 2007 the supply shortage occurred much earlier than 2009. Brisk pace of economic activity, rising levels of income of the people, the double-digit growth of large scale manufacturing, higher agricultural production and village electrification programme have all resulted in higher demand of power in Pakistan. The Government has prepared plans to respond to this challenge. As a first step the government has encouraged the private sector power projects to meet this additional demand. The following table shows the future power generation plan in Pakistan (Table.15.14).

Economic Survey 2006-07
236
Table No.15.14 : POWER GENERATION PLAN Nuclear Hydel Coal Renewable Oil Gas Total Cumulative
Existing (2005) 400
6460
160 180
6400
5940
19540
Addition - - - - 2010 - 1260 900 700 160 4860 7880 27420
2015 900 7570 3000 800 300 7550 20120 47540
2020 1500 4700 4200 1470 300 12560 24730 72270
2025 2000 5600 5400 2700 300 22490 38490 110760
2030 4000 7070 6250 3850 300 30360 51830 162590
Total 8800 32660 19910 9700 7760 83760 162590
Sources: Planning Commission of Pakistan
a) Electricity Generation
The total installed capacity of electricity generation witnessed no change during July-March 2006-07, remaining at 19,440 MW. The Water and Power Development Authority (WAPDA), Karachi Electric Supply Corporation (KESC), Karachi Nuclear Power Plant (KANUPP) and Chashma Nuclear Power Plant are the four main public sector organizations involved in power generation, transmission and distribution of electricity in the country. In addition, the Independent power
projects (IPPs) are also involved in power generation. The total installed capacity of WAPDA stood at 11,363 MW during July-March 2006-07 which accounts for 58 percent of total installed capacity. Of this, hydel power accounts for 56.9 percent or 6,463 MW and thermal accounts for 43.1 percent or 4,900 MW. The total installed capacity of IPPs is 5,859 MW (30.1 percent), KESC’s is 1,756 MW (9.0 percent) and nuclear power is 462 MW (2.4 percent) of the total installed capacity. The details are given in Table 15.15.
Table 15.15: Total Installed Generation Capacity (MW)
Name of Power Company
Installed Capacity 2005-
06 % Share
Installed Capacity 2006-
07 % Share % Change
WAPDA 11363 58.2 11363 58.5 0.0 Hydel 6463 57.7* 6463 56.9* 0.0 Thermal 4900 42.3* 4900 43.1* 0.0 IPPs 5858 30.3 5859 30.1 0.0 Nuclear 462 2.4 462 2.4 0.0 KESC 1756 9.1 1756 9.0 0.0 Total 19439 100 19440 100 0.0
* Share in WAPDA system Source: Hydrocarbon Development Institute of Pakistan
b) WAPDA
The electricity generated by WAPDA during July-March 2006-07 was 63,020 Gwh, as against 58,928 Gwh during the corresponding period last year,
thus registering an increase of 6.9 percent due to higher generation through thermal by 12.8 percent. The hydropower electricity generation accounts for 36 percent and the remaining 64 percent come from thermal. The detail is given in Table 15.16.

Energy
237
Table 15.16: Electricity Generation by WAPDA (GWh)
Year Hydro Percentage share Thermal Percentage
share Total
1996-97 20,858 41.1 29,924 58.9 50,782 1997-98 22,060 41.4 31,199 58.6 53,259 1998-99 22,448 41.8 31,235 58.2 53,683 1999-2000 19,287 34.3 36,585 65.7 55,872 2000-01 17,259 29.5 41,196 70.5 58.455 2001-02 19,056 31.3 41,804 68.7 60,860 2002-03 22,348 34.9 41,690 65.1 64,040 2003-04 27,477 39.8 41,617 60.2 69,094 2004-05 25,671 34.9 47,849 65.0 73,520 2005-06 30,855 37.53 51370 62.47 82225 July-March 2005-06 23,316 39.6 35,612 60.4 58,928 2006-07 22,863 36.27 40,157 63.73 63,020 Includes purchase from IPPs. Source: Water and Power Development Authority
i) Growth in Electricity Consumers
The number of electricity consumers has increased over the years due to rapid extension of electric supply to villages and fast urbanization. The number of consumers has increased to 16.7 million
till March 2007, up from 15.9 million in 2005-06, showing an increase of 5 percent over the last year and a growth of about 70 percent since 1996-97. The trend of increase in a number of consumers during last 10-years since 1996-97 is given in Table 15.17.
Table 15.17: Consumers by Economic Groups (Thousands) Year Domestic Commercial Industrial Agriculture Others Total 1996-97 8155 1365 184 167 7 9878 1997-98 8455 1397 187 171 8 10218 1998-99 8912 1517 190 173 8 10800 1999-00 9554 1654 195 175 8 11586 2000-01 10045 1737 196 180 8 12166 2001-02 10483 1803 200 184 8 12678 2002-03 11044 1867 206 192 9 13318 2003-04 11737 1935 210 199 10 14092 2004-05 12490 1983 212 201 10 14896 2005-06 13390 2068 222 220 10 15911 July-March 2005-06 13144 2044 219 214 10 15632 2006-07 14069 2132 230 233 11 16675
Source: Water and Power development Authority
Village Electrification
In order to increase the productive capacity and socio-economic standard of the population living in the far-flung areas of the country, the government plans to electrify all the villages in the country by 2007. Nearly 7000 villages from Balochistan and 900 villages of Sindh provinces will be provided with electricity through renewable energy sources. The number of electrified villages had increased to 113,605 by the
end of March 2007. The trend of village electrification during past 10 years is provided in table 15.18 & Fig-15.5. It is important to note that village electrification has increased at an average rate of 12.3 percent per annum, over the last four years as against 2.5 percent in the last seven years, prior to 2003-04. Furthermore, it took seven years (1996/97- 2002/03) to provide electricity to 11,680 villages but in just four years (2003/04-2006/07) 39,798 villages have been provided electricity.

Economic Survey 2006-07
238
Table 15.18: Village Electrification (Number) Year Target Realization * Progressive Total % Growth 1996-97 4,000 2,441 64,568 3.9 1997-98 4,000 1,383 65,951 2.1 1998-99 4,000 1,232 67,183 1.9 1999-2000 1,852 1,109 68,292 1.6 2000-01 - 1,595 69,887 2.3 2001-02 - 1,674 71,561 2.4 2002-03 - 2,246 73,807 3.1 2003-04 - 7,193 81,000 9.7 2004-05 - 9,467 90,467 11.7 2005-06 - 12,764 103,231 13.5 July-March) - 2005-06 9,128 99,595 13.5 2006-07 10,374 113,605 14.1 *Including FATA Source: Water and Power Development Authority
iii) Electricity Consumption by Economic Groups
The sectoral consumption of electricity by economic groups identifies the domestic sector as the largest consumer of electricity. During the current financial year July- March 2006-07, the
sector wise consumption remained at 42.4 percent for domestic consumers, 26.5 percent for industrial consumers, 12.1 percent for agriculture consumers and 6.2 percent for commercial consumers. The consumption trend for the past 10 years is given in Table 15.19 & Fig .15.6
Table 15.19: Electricity Consumption by Economic Groups (% Share)
Year Domestic Commercial Industrial Agriculture Bulk Supply & Public Lighting Traction
1996-97 40.5 4.6 26.3 18.2 10.4 0.05 1997-98 41.5 4.5 26.0 17.5 10.3 0.04 1998-99 43.6 4.7 25.6 14.3 11.8 0.04 1999-2000 46.3 4.9 26.3 11.0 11.3 0.04 2000-01 46.1 4.9 27.1 11.3 10.6 0.03
Fig-15.5 Village Electrification (000 Nos).
64.6 66 67.2 68.3 69.9 71.6 73.881
90.5
103
114
0
20
40
60
80
100
120
1996-97 1997-98 1998-99 1999-00 2000-01 2001-02 2002-03 2003-04 2004-05 2005-06 2006-07
Source: Water and Power Development Authority

Energy
239
2006-07
Commercial6%
Bulk-Sup.& Pub. Lighting
12.7%
Industrial26.5%
Domestic42.4%
Agriculture12.1%
Table 15.19: Electricity Consumption by Economic Groups (% Share)
Year Domestic Commercial Industrial Agriculture Bulk Supply & Public Lighting Traction
2001-02 45.5 5.1 28.0 12.3 9.2 0.03 2002-03 44.0 5.3 28.4 12.6 9.7 0.02 2003-04 44.0 5.6 28.1 12.9 9.4 0.02 2004-05 43.5 5.8 28.1 12.5 10.1 0.02 2005-06 43.3 6.0 26.6 12.6 4.9 0.02 July-March 2005-06 42.7 5.7 27.1 13.0 11.3 0.02 2006-07 42.4 6.2 26.5 12.1 12.7 0.02
Source: Water and Power Development Authority
Fig-15.6: Electricity Consumption by Economic Groups (% Share) WAPDA
Source: WAPDA Source: WAPDA
iv) Power Losses
The National Transmission & Dispatch Company (NTDC) and DISCOs (Distribution Companies) have taken several technical and administrative measures to improve operational and managerial efficiency and reduce power losses. These measures have resulted in reduction in power losses and an increase in revenue. Other measures such as renovation, rehabilitation, capacitor installation and strengthening consumer-end distribution supply network will continue to control wastage of power/energy. The system losses of the WAPDA are on a declining trend. During 2006-07, the power losses incurred by WAPDA were 22.1 percent as against 22.8 percent in 2005-06. The transmission and distribution losses for last ten years up to July-March 2006 are given in Table 15.20.
v. Power Development Programme.
In order to enhance and strengthen its power generation capacity, WAPDA has under-taken feasibility studies/construction work for a number of hydro/thermal power projects under the VISION 2025 Programme. Work on Allai Khawr (21 MW), Khan Khawar (72 MW) and Dubair Khawar (130 MW) hydropower projects is in full swing. Implementation of Neelum-Jhelum (969 MW) hydropower project will commence shortly. Feasibility studies of a number of the hydropower projects are underway include Bunji (5400 MW) and Kohala (600 MW). After the completion of these projects, the installed capacity is expected to increase from 17431 MW to about 42000 MW by the end of Financial Year 2016.
1996-97
Industrial26.3%
Agriculture18.2%
Bulk Supply & Public Lighting
10.4%
Domestic40.5%
Commercial4.6%

Economic Survey 2006-07
240
TABLE 15.20: WAPDA Power Losses (Percent)
Year Auxiliary Consumption T&D Losses* Total 1995-96 2.9 21.5 24.4 1996-97 2.4 21.7 24.1 1997-98 2.0 23.9 25.9 1998-99 1.7 25.8 27.5 1999-2000 2.1 24.6 26.7 2000-01 2.0 23.8 25.8 2001-02 2.2 23.6 25.8 2002-03 2.1 23.8 25.9 2003-04 2.0 23.5 25.5 2004-05 2.5 22.3 24.8 2005-06 2.2 21.9 22.1 (July-March) 2005-06 1.8 21.0 22.8 2006-07 2.1 20.0 22.1 * T&D = Transmission and Distribution Source: Water and Power Development Authority
c. Karachi Electric Supply Corporation Ltd (KESC).
The installed capacity of KESC’s various generating stations remained at 1,756 MW as against the maximum demand of 2,222 MW during July-March 2006-07. KESC’s own generation has declined by 12.6 percent from 6,711 million kWh in 2005-06 to 5,867 million kWh in July-March 2006-07 due to the major overhauling of some of its power plants. The gap of 466 MW between demand and supply was bridged from different sources including 1,093 million kWh from two IPPs, 3,753 million kWh from WAPDA, KANUPP, PASMIC and Anoud Power. The total energy made available to KESC system, after taking into account the imports from various agencies (excluding auxiliary consumption), stood at 10,246 million kWh during July-March 2006-07 as against 9,981 million kWh in the same period last year, thus registering a growth of 2.7 percent. The T&D losses have increased from 33.5 percent during July-March 2005-06 to 34.1 percent in first nine months of the current financial year. KESC has undertaken a comprehensive rehabilitation program, for the restoration of its generating capacity. Under this program, major overhauling of three large units was scheduled, of which two have been completed and the third is presently under shutdown and will be completed by end May 2007. Thus additional 200 MW will be available thereafter. In addition to restoration of lost capacity, KESC plans to bring new generating plants, in two phases. Phase I, for which KESC has
already entered into a contract for installation of 220 MW Combined Cycle Power Plant at Korangi. In Phase II, KESC will install a Combined Cycle Power Plant of approximately 560 MW at Bin Qasim Station. On the transmission and distribution side KESC will continue to implement network expansion and rehabilitation of existing network with a comprehensive loss reduction program. To streamline the transmission and distribution system the KESC will establish 11 new 132 kV Grid Stations. These will be commissioned along with their allied transmission lines during the year 2007-08 with a total increase of 880 MVA (Mega Volt Ampere) transformation capacity at 132/11 kV voltage level.
d. Nuclear Power Energy
Pakistan Atomic Energy Commission (PAEC) is responsible for implementation of nuclear power programme. At present, two nuclear power plants; Karachi Nuclear Power Plant (KANUPP) and Chashma Nuclear Power Plant (CHASNUPP) unit-1 are in operation, while a third plant, CHASNUPP unit-2, is under construction. KANUPP has completed its designed life of 30-years is now operating on extended life. It generated 93 million kWh of electricity during the period July-March 2006-07, rising the lifetime generation to 11.39 billion kWh. CHASNUPP -1 having a gross capacity of 325 MW generated 1,682 million kWh of electricity during July-March 2006-07, rising the lifetime generation to 13.18 billion kWh. The construction work of CHASNUPP-2 is ahead of planned schedule. It is expected that plant will be

Energy
241
commissioned in 2011. Government has set a target of 8,800 MW nuclear power capacity by the year 2030 with increasing share of indigenisation. To meet this target, PAEC has restructured its power sector to gradually assume greater technical responsibility in the construction of future nuclear power plants. Enhancement in indigenisation in nuclear power programme, will not only provide cheap, reliable and clean electricity, but will also help in the growth of local engineering and construction industry and creation of additional employment opportunities.
e. Alternative Energy
Presently power shortage is a worldwide phenomenon due to the accelerating levels of economic activity. According to the International Energy Agency, which acts as energy policy advisor to 26 developed countries, the world can only meet its energy needs till 2030-35 through traditional sources. Realizing the gravity of the situation many countries are taking steps to develop alternate source of energy to meet their future requirements. Similarly, Pakistan is also
seeking to develop generation capacity through alternate energy including the wind and solar technologies. The goal is to ensure that at least 7 percent of total power generation capacity is met through wind & solar energy by year 2030. Installation of 700 MW wind power by year 2010 and 9700 MW wind power by year 2030 is being planned. It will electrify 7874 remote off-grid villages in Sindh and Balochistan provinces utilizing alternative energy technologies. The Alternative Energy Development Board (AEDB) has issued letter of interest (LOIs) to eighty-two national and international companies for generation of 700 MW power through wind energy by year 2010 and 9700 MW by year 2030. The AEDB has initiated the first phase of the Roshan Pakistan Program in which 400 villages in Sindh and Balochistan would be electrified within next two years. The government has planned to formulate medium-term wind energy development plan 2011-2020. The board has been working on different development projects since 2003. The brief description of renewable energy projects for 2003-06 is given in Box 15.1.
BOX 15.1
Roshan Pakistan: National Rural electrification programe through alternative/renewable Energy Technologies
Solar Homes Project in Each province.
Development of Supply Chain Mechanism for Pedal Generators, Hand Generators and LED Lanterns.
Pilot Project of Production Plant of Bio-Diesel
Research on Development of 1 kW Fuel Cell Electric Vehicle in Pakistan using Existing Fuel Cell
Solar Water Pumping & Desalination
Solar Thermal Power Plant Technologies (Demonstration Units)
Electrification of Villages through Micro Wind Turbines
Pilot Project for Development and Installation of 02 Micro Hydro Kaplan Turbines
Pilot project for Emerging Alternative Energy technologies Demonstration in Pakistan
f. Private Power & Infrastructure Board
Pursuant to the Government’s strategy to attract private investment in the power sector, the government had drafted power policies with the objectives of removing financial burden from the
exchequer; improving systems efficiency; and rationalizing prices and social subsidies. The Government has already announced Policy for Power Generation Projects 2002 (Power Policy 2002), which emphasized on provision of sufficient capacity for power generation at the least cost

Economic Survey 2006-07
242
through exploitation of indigenous resources like hydro, coal, gas and human resources. It is important to note that although the Power Policy 2002 provided attractive incentives for private investors, the Government of Pakistan’s obligations were not reduced to a great extent. As per new Security Agreements negotiated under the Power Policy 2002, the Government’s guarantee for fuel supplier’s obligation has been withdrawn which was there under 1994 Policy. Besides, plant availability has been increased from 86 percent to 90 percent and the basis for capacity payments (CP) has been changed. The CP will now be made on declared ‘hourly’ available capacities of the plants. In response to attractive incentives offered by the Government through the Power Policy 2002, private investors have offered investment for various projects. Consequently, a number of proposals from international investors for establishment of multi-fuel power projects at various locations of the country have been received by the Private Power & Infrastructure Board (PPIB). The PPIB is currently processing forty nine projects with a combined generation capacity of 12000 MW and estimated cost of over US $ 11 billion. Out of these projects, Letters of Interest (LOI) for 28 projects with capacity of 7630 MW and estimated cost of US $ 7.43 billions have been issued so far by the PPIB. These include ten gas based / dual fired projects, nine hydro projects, five coal based projects and four projects based on oil. Further, the PPIB is processing various projects on fast track basis, including 405 MW capacity expansion of existing IPPs, 1250 MW of capacity creation through new IPPs, and 600 MW through projects proposed by the leading business houses. Through these initiatives, it is expected that a total of 2,255 MW will be available by first quarter of 2009.
Due to investor-friendly polices of the government, the economy of Pakistan is at a historical boom and the industrial growth has remained robust. Due to this unprecedented growth, the immediate power requirement has also increased manifolds. The rapid growth of the economy has resulted in sharp increase in the demand for electricity over the last couple of years, which has necessitated increase in the generation capacity. Since fossil fuel prices have been rising over the past few years there is need to shift away from fuel based electricity generation to greater
reliance on hydel power. The Government is giving priority to exploiting the abundant hydel potential of the country of about 40,000 MW, of which only 15 percent has been utilized so far. The PPIB has awarded Letter of interest (LOIs) to nine hydel projects with a cumulative capacity of 2,062 MW under the 2002 Power Policy, which are envisaged to bring a direct investment of around US $ 8 billion in the country and create many job opportunities. To diversify the energy resources it is important to increase the proportion of coal based power projects in the country. In addition, the rising prices of oil in the international market as well as the depletion of natural gas resources warrant an emphasis on the coal based power generation. The option of imported coal based power projects has also been given serious considerations. Consequently, the PPIB has initiated two 1000-1200 MW imported coal based Integrated Power Projects near Karachi. The two imported coal based projects, substituting the costly fuel oil based projects, would result in potential foreign exchange savings of more than US $ 500 million annually for fuel. The projects will also bring a direct investment of more than US$ 2.5 billion in the country.
g. National Electric Power Regulatory Authority (NEPRA)
NEPRA is responsible for granting licenses, tariff determination, prescribing performance standards and addressing the complaints of electric power consumers. NEPRA gives due consideration to the financial strength of the sponsors as well as their professional ability to execute the project while granting licenses. A set procedure is followed to determine the appropriate level of expenses and rate of return allowed to a utility. The process also involves public hearings, if deemed necessary before a final determination is made. During the period July-March 2006-07, NEPRA granted licence to 13 different Independent Power Project (IPPs) and Small Power Producers (SPPs) for generation. NEPRA is also processing an application by the Karachi Electric Supply Corporation (KESC) for the grant of Special Purpose Transmission License (SPTL). Applications of three Small Power Producers (SPPs) were also under process for the modification of the Generation License during this period.

Energy
243
IV. Coal
Thar coalfield in the Sindh province has coal resources estimated at 175 billion tonnes. Due to high cost of imported energy government has decided to enhance the share of coal in the over all energy mix from 5 percent to 19 percent by 2030. Energy Security Action Plan has set a target of generating 20,000 MW power from coal by 2030 and 50 percent by 2050. The total national coal production from operational coalmines increased by 6.5 percent from 4.6 millions ton in 2005-06 to 4.9 million ton in 2006-07. Over 80 percent of coal was consumed by the brick kiln industry thus reducing the supply available for power generation. Approximately 80 percent of cement industry has also switched over to indigenous coal from furnace oil that has saved considerable foreign exchange being spent on the import of furnace oil. The conversion of cement industry from furnace oil to coal has generated a demand for 2.5 - 3.0 million tons coal per annum. To ascertain commercial viability of mining coal from Thar, German consultant M/s Rheinbraun
Engineering has completed a mining feasibility on a specific block in Thar coalfield. The same block has been assigned to an international firm for commissioning of integrated coal mining and 1000 MW power generation project. Moreover, a local group has been assigned a block in Thar coalfield for conducting feasibility study for integrated coal mining and commissioning two 250 MW coal fired power-generating plants. Government has also decided to establish a coal mining company for harnessing Thar coal resource. As a part of promotional activities to increase share of coal, the Government of Sindh has leased out a coal block to M/s Fatteh Group of Hyderabad to commission a coal-based power plant of 250 MW in Lakhra coalfield. Government has signed an agreement with Chinese company M/s China National Chemical Engineering Group Corporation (CNCEC) to conduct feasibility study on a coal block in Sonda Jerrick coalfields in Sindh province for integrated mining project of one million ton and a 250 MW coal based power plant.

TABLE 14.1
1. Oil/Petroleum (tonnes)Fiscal Agricul-Year Households Industry ture(a) Transport Power Other Govt. Total1990-91 944,256 1,147,698 265,229 4,841,362 2,434,136 328,592 9,961,2731991-92 613,706 1,369,525 281,539 5,619,552 2,775,418 323,228 10,982,9681992-93 622,075 1,479,935 287,181 6,107,416 3,158,124 357,115 12,011,8461993-94 589,851 1,653,516 307,795 6,414,582 3,902,308 357,529 13,225,5811994-95 585,173 1,889,443 268,631 6,646,175 4,215,635 355,110 13,960,1671995-96 596,031 2,416,278 250,031 7,135,631 4,785,856 417,254 15,601,0811996-97 509,738 2,141,065 268,866 7,172,269 5,110,233 403,795 15,605,9661997-98 498,949 2,081,172 244,977 7,364,767 6,053,784 380,756 16,624,4051998-99 492,768 2,139,889 249,229 7,864,063 5,525,669 376,133 16,647,7511999-00 477,305 2,115,860 293,034 8,307,977 6,227,595 346,050 17,767,8212000-01 450,960 1,924,048 254,833 8,157,893 6,487,988 372,176 17,647,8982001-02 334,501 1,611,995 225,742 8,018,777 6,305,419 463,654 16,960,0882002-03 282,521 1,604,068 196,747 8,082,273 6,019,958 266,387 16,451,9542003-04 231,459 1,493,080 183,506 8,464,042 2,739,763 309,263 13,421,1132004-05 192,750 1,542,398 142,062 9,024,783 3,452,581 316,686 14,671,2602005-06 128,651 1,681,517 81,896 8,156,831 4,218,982 338,807 14,626,684Jul-Mar2005-06 98,849 1,256,357 60,399 5,981,552 2,507,882 258,808 10,164,288 2006-07 79,502 1,223,587 66,781 5,729,946 4,762,329 252,070 12,114,215(a): HSD consumption in agricultural sector is not available seprately and is included under (Contd.) transport sector. Agricultural sector represents LDO only.
TABLE 14.1
(Contd.)2. Gas (mm cft)(b)
Fiscal TransportYear Households Commercial Cement Fertilizer Power Industry (CNG) Total1990-91 66,797 12,317 13,020 107,954 176,409 88,841 - 465,338 1991-92 70,741 13,057 11,761 101,493 193,893 95,661 25 486,631 1992-93 75,783 14,326 11,914 119,628 186,853 102,991 31 511,526 1993-94 82,461 15,239 10,187 144,514 197,694 100,631 43 550,769 1994-95 97,045 16,064 6,730 141,697 181,107 104,098 47 546,788 1995-96 110,103 16,960 7,569 150,374 186,507 111,202 153 582,868 1996-97 115,488 18,403 8,718 150,483 193,984 110,365 358 597,799 1997-98 134,500 18,764 12,092 147,752 179,042 115,250 490 607,890 1998-99 131,656 21,466 7,988 167,474 183,694 121,431 2,182 635,891 1999-00 139,973 21,712 8,558 177,152 227,364 134,916 2,426 712,101 2000-01 140,899 20,618 6,977 175,393 281,255 138,503 4,423 768,068 2001-02 144 186 22 130 7 063 177 589 314 851 151 416 7 369 824 604
COMMERCIAL ENERGY CONSUMPTION
COMMERCIAL ENERGY CONSUMPTION

TABLE 14.1
(..Contd.)3. Electricity (Gwh) 4. Coal (000 metric tonne)
Fiscal Trac- House- Commer- Indus Agricul- Street Other Total House- Power Brick TotalYear tion hold cial trial tural Light Govt. hold Kilns Cement1990-91 33 10,409 2,072 11,229 5,620 .. 2,171 31,534 3.8 24.6 3,025.5 .. 3,053.91991-92 29 11,458 2,143 12,289 5,847 .. 2,112 33,878 6.8 39.5 3,052.4 .. 3,098.71992-93 27 13,170 2,333 13,043 5,635 297 1,987 36,493 3.2 46.7 3,216.6 .. 3,266.61993-94 27 14,080 1,786 12,637 5,772 298 2,781 37,381 3.3 43.6 3,487.0 .. 3,533.91994-95 22 15,585 2,623 12,528 6,251 324 2,116 39,448 3.2 40.7 2,998.9 .. 3,042.81995-96 20 17,116 2,962 12,183 6,696 378 2,382 41,737 3.1 398.9 3,235.8 .. 3,637.8 1996-97 18 17,757 2,241 11,982 7,086 390 3,440 42,914 9.7 351.9 3,191.3 .. 3,552.91997-98 16 18,750 2,334 12,297 6,937 387 3,851 44,572 2.3 346.5 2,809.9 .. 3,158.71998-99 15 19,394 2,409 12,061 5,620 224 3,573 43,296 1.3 415.3 3,044.8 .. 3,461.41999-00 15 21,455 2,544 13,202 4,540 239 3,591 45,586 1.0 348.1 2,818.8 .. 3,167.92000-01 13 22,765 2,774 14,349 4,924 213 3,547 48,585 1.0 205.8 2,837.9 50.0 3,094.72001-02 11 23,210 2,951 15,141 5,607 212 3,490 50,622 1.1 249.4 2,577.5 664.0 3,491.62002-03 10 23,624 3,218 16,181 6,016 244 3,363 52,656 1.1 203.6 2,607.0 957.0 3,768.72003-04 9 25,846 3,689 17,366 6,669 262 3,650 57,491 1.0 184.9 2,589.4 2,508.0 5,283.52004-05 12 27,601 4,080 18,591 6,988 305 3,750 61,327 .. 180.0 3,906.7 2,535.2 6,621.82005-06 13 30,720 4,730 19,803 7,949 353 4,035 67,603 .. 149.3 4,221.8 3,342.8 7,714.0 Jul-Mar2005-06 11 22,127 3,411 14,659 5,971 261 2,976 49,416 .. 92.0 2,008.0 2,100.0 4,200.0 2006-07 9 23,537 3,777 15,495 6,010 284 3,134 52,246 0.8 95.2 3,018.0 2,300.0 5,414.0 .. not available. Source: Hydrocarbon Development Institute of Pakistan (HDIP)
COMMERCIAL ENERGY CONSUMPTION

TABLE 14.2
Oil Gas Petroleum Products Coal ElectricityCrude Local (mcf) + Installed Generation
Oil Crude Produc- Produc- Capacity (Gwh)(b)Fiscal Imports Extraction Imports tion Imports tion (MW)(a)Year (000 barrels) (000 barrels) (000 tonnes) (000 tonnes) (000 tonnes) (000 tonnes)1990-91 28,178 23,485 518,483 4,310 6,036 917 3,054 8,356 41,042 1991-92 30,016 22,469 550,715 5,275 5,961 1,069 3,099 9,369 45,040 1992-93 29,407 21,895 583,545 6,612 5,694 994 3,266 10,586 48,750 1993-94 30,770 20,675 624,229 7,910 5,841 1,094 3,534 11,319 50,640 1994-95 28,386 19,858 628,211 8,737 5,434 1,096 3,043 12,100 53,545 1995-96 31,044 21,063 666,580 10,137 5,874 1,080 3,638 12,969 56,946 1996-97 28,588 21,270 697,763 10,398 5,495 840 3,553 14,818 59,125 1997-98 29,826 20,543 699,709 11,064 5,858 960 3,159 15,659 62,104 1998-99 32,855 19,986 744,942 10,926 5,925 910 3,461 15,663 65,402 1999-00 32,938 20,395 818,342 11,878 6,115 957 3,168 17,399 65,751 2000-01 52,505 21,084 857,433 10,029 8,337 950 3,095 17,488 68,117 2001-02 51,982 23,195 923,758 9,023 9,028 1,081 3,328 17,789 72,405 2002-03 52,512 23,458 992,589 8,437 9,084 1,578 3,312 17,787 75,682 2003-04 57,699 22,625 1,202,750 5,170 9,740 2,789 3,275 19,252 80,827 2004-05 61,161 24,119 1,344,953 5,676 10,474 3,307 4,587 19,379 85,629 2005-06 63,546 23,936 1,400,026 6,009 10,498 2,384 4,871 19,450 93,629Jul-Mar2005-06 48,813 17,916 1,048,190 .. .. 1,700 2,500 19,440 66,110 2006-07 43,764 18,217 1,062,124 6,039 7,581 2,825 2,589 19,440 71,033+ Million cubic feet Source: Hydrocarbon Development Institute of Pakistan (HDIP)(a) MW: Mega Watt(b) Gwh: Giga Watt Hour.. : not available
COMMERCIAL ENERGY SUPPLIES

TABLE 14.3
ElectricityHydroelctric (Hydel) Thermal Nuclear
Fiscal Installed Generation Installed Generation Installed GenerationYear Capacity (Gwh) b Capacity (Gwh) b Capacity (Gwh) b
(MW) a (MW) a (MW) a1990-91 2,898 18,343 5,741 22,354 137 385 1991-92 3,330 18,647 5,902 26,375 137 418 1992-93 4,626 21,112 5,823 27,057 137 582 1993-94 4,726 19,436 6,456 30,707 137 497 1994-95 4,826 22,858 7,137 30,176 137 511 1995-96 4,826 23,206 8,006 33,257 137 483 1996-97 4,826 20,858 9,855 37,921 137 346 1997-98 4,826 22,060 10,696 39,669 137 375 1998-99 4,826 22,449 10,700 42,669 137 284 1999-00 4,826 19,288 12,436 46,064 137 399 2000-01 4,857 17,194 12,169 48,926 462 1,997 2001-02 5,041 18,941 12,286 51,174 462 2,291 2002-03 5,041 22,351 12,285 51,591 462 1,740 2003-04 6,491 26,944 12,299 52,122 462 1,760 2004-05 6,494 25,671 12,423 57,162 462 2,795 2005-06 6,499 30,854 12,489 60,283 462 2,484Jul-Mar2005-06 6,499 23,324 12,479 40,963 462 1,8232006-07 6,499 22,875 12,479 46,383 462 1,775(a) MW: Mega Watt. Source: Hydrocarbon Development Institute of Pakistan (HDIP).(b) Gwh: Giga Watt Hour.
COMMERCIAL ENERGY SUPPLIES

TABLE 14.4
Tariff Category/ Fixed/Min Energy Additional F.A.SParticulars Charges Charges F.A.S. Surcharge Subsidies
(Rs/KwM) (Rs/Kwh) (Rs/Kwh) (Rs/Kwh) Rs/kwhGENERAL SUPPLY TARIFF A-1( including FATA)
Upto 50 Units - 0.61 0.73 For Consumption > 50 units upto 1000 units - - - For First 100 units - 0.41 0.50 1.58 0.44 For next 200 units - 0.58 0.50 2.29 0.44 (101-300)For next 700 units - 1.51 0.50 3.55 0.44 (301-1000)Above 1000 units - 1.88 0.38 4.42 0.32 Minimum Monthly Charges: a) Single Phase Connections Rs 45/-
b) Three Phase Connection: Rs 100/- GENERAL SUPPLY TARRIF A-2( including FATA)
For first 100 units - 2.77 0 3.82Above 100 Units - 3.01 0 3.92For peak load requirment above 20kv 220 1.09 0.19 2.83Minimum Monthly Charges: a) Single Phase Connections Rs 150/-
b) Three Phase Connection: Rs 300/-
INDUSTRIAL SUPPLYB-1 upto 40 kw - 1.81 0.20 3.07There shall be minimum monthly charges of Rs 70/Kw for first 20 Kilowatts of load and Rs 90/Kw for rest load between 21 - 40 kw
B-2 (>41-500 kw) 300 1.3 0.20 2.09B-2 TOD ( Peak) 300 1.98 0.20 2.78B-2 TOD (Off Peak) 300 1.2 0.20 2.07B-3 (Normal) 11&33 kv not exceeding 5000 k 290 1.29 0.20 2.01B-3 TOD (Peak) 290 1.97 0.20 2.26B-3 TOD (off Peak) 290 1.15 0.20 1.60B-4 Normal 66/132/220 kv - All loads 280 1.24 0.20 1.86B-4 TOD (Peak) 280 1.87 0.20 2.20B-4 TOD (off Peak) 280 1.11 0.20 1.49
Note: 1) The above figures cover some portion of the tariffs schedule. For full details, WAPDA may be consulted. (Contd.)2) In addition to above, the "Surcharge" @ 10.4% of supply charges was also leviable3) Supply charges include fixed charges, energy charges, FAS and low power factor penalty.
Effective 10-5-2003
SCHEDULE OF ELECTRICITY TARIFFS

TABLE 14.4
Effective 10-5-2003Tariff Category/ Fixed/Min Energy Additional F.A.SParticulars Charges Charges F.A.S. Surcharge Subsidies
(Rs/KwM) (Rs/Kwh) (Rs/Kwh) (Rs/Kwh) Rs/kwhBULK SUPPLY TARIFFS
C-1(a) 400 Volts upto 20kw 1.24 0.41 3.42C-1(b) 400 Volts above 20kw upto 500 kw 220 1.09 0.41 3.21C-2 (a) 11/33KV upto 5000 kw 216 1.06 0.41 2.96C-3 66 / 132 / 220 kv - All loads 214 1.04 0.41 2.90
AGRICULTURAL TUBE-WELL TARIFF-DD-1 SCARP - 1.26 0.50 3.13 0.37 D-2 (i) Punjab & Sindh 82 0.9 0.50 1.59 0.37 D-2 ( ii) NWFP & Baluchistan 72 0.75 0.50 1.38 0.37
Districr Mainwali,Bhawalpur and Tharparkar.TEMPORARY SUPPLY TARIFFS
E-1 (I) Domestic Supply 2.11 0.50 3.68E-1 (ii) Commercial Supply 3.79 0 4.74Minimum charges E-1(I) and E-1(ii) Rs.46/- per day but not less than Rs.200/-.E-2 (I) Industrial Supply 2.36 0.20 3.51E-2(II)a Bulk Supply at (400KV) 1.76 0.41 3.85E-2(II)b Bulk Supply at (11KV) 1.64 0.41 3.62E-2 (III) Bulk Supply to Other Consumers 1.85 0.41 3.67F-Seasonal Supply to industries 125% of "Supply and Additioan charges" cor. Industrial TariffG-1 (I) Public Lighting Supply Unit Charges as per Tariff A-1aboveG-1(ii) Other than above in G-1(i) 1.93 0.36 4.57RESIDENTIAL COLONIES OF INDUSTRIESH-1Residential Colonies with own transformer 1.45 0.50 4.02H-2 Residential Colonies (others) 1.46 0.50 4.04OTHERSI Railway Traction 1.02 0.46 3.50 J-1 Cogeneration Tariff (Sale by WAPDA) 1.74 0.37 3.36 J-2 (a) COG. Tariff (Purchase by WAPDA Dec.July 1.03J-2 (b) COG. Tariff (Purchase by WAPDA Aug-Nov 0.78SPECIAL CONTRACT TARIFFK-a AJ&K 1.10 0.42 2.53K-b KESC 3.80K-c Rawat Lab. 1.88 0.25 2.11
Note: 1) The above figures cover some portion of the tariffs schedule. For full details, WAPDA may be consulted.2) In addition to above, the "Surcharge" @ 10.4% of supply charges was also leviable Source: WAPDA.3) Supply charges include fixed charges, energy charges, FAS and low power factor penalty.
SCHEDULE OF ELECTRICITY TARIFFS

TABLE 14.4
Effective 19-8-2003Tariff Category/ Fixed/Min Energy Additional F.A.SParticulars Charges Charges F.A.S. Surcharge Subsidies
(Rs/KwM) (Rs/Kwh) (Rs/Kwh) (Rs/Kwh) Rs/kwhGENERAL SUPPLY TARIFF A-1( including FATA)
Upto 50 Units - 0.61 0.73 For Consumption > 50 units upto 1000 units - - - For First 100 units - 0.41 0.53 1.58 0.47 For next 200 units - 0.58 0.53 2.29 0.47 (101-300)For next 700 units - 1.51 0.53 3.55 0.47 (301-1000)Above 1000 units - 1.88 0.41 4.42 0.35 Minimum Monthly Charges: a) Single Phase Connections Rs 45/-
b) Three Phase Connection: Rs 100/- GENERAL SUPPLY TARRIF A-2( including FATA)
For first 100 units - 2.77 0.03 3.82Above 100 Units - 3.01 0.03 3.92For peak load requirment above 20kv 220 1.09 0.22 2.83Minimum Monthly Charges: a) Single Phase Connections Rs 150/-
b) Three Phase Connection: Rs 300/-
INDUSTRIAL SUPPLYB-1 upto 40 kw - 1.81 0.23 3.07
B-2 (>41-500 kw) 300 1.3 0.23 2.09B-2 TOD ( Peak) 300 1.98 0.23 2.78B-2 TOD (Off Peak) 300 1.2 0.23 2.07B-3 (Normal) 11&33 kv not exceeding 5000 k 290 1.29 0.23 2.01B-3 TOD (Peak) 290 1.97 0.23 2.26B-3 TOD (off Peak) 290 1.15 0.23 1.60B-4 Normal 66/132/220 kv - All loads 280 1.24 0.23 1.86B-4 TOD (Peak) 280 1.87 0.23 2.20B-4 TOD (off Peak) 280 1.11 0.23 1.49
Note: 1) The above figures cover some portion of the tariffs schedule. For full details, WAPDA may be consulted Contd…..2) In addition to above, the "Surcharge" @ 10.4% of supply charges was also leviable3) Supply charges include fixed charges, energy charges, FAS and low power factor penalty.
There shall be minimum monthly charges of Rs 70/Kw for first 20 Kilowatts of load and Rs 90/Kw for rest load between 21 - 40 kw
SCHEDULE OF ELECTRICITY TARIFFS

TABLE 14.4
Effective 19-8-2003Tariff Category/ Fixed/Min Energy Additional F.A.SParticulars Charges Charges F.A.S. Surcharge Subsidies
(Rs/KwM) (Rs/Kwh) (Rs/Kwh) (Rs/Kwh) Rs/kwhBULK SUPPLY TARIFFS
C-1(a) 400 Volts upto 20kw 1.24 0.44 3.42C-1(b) 400 Volts above 20kw upto 500 kw 220 1.09 0.44 3.21C-2 (a) 11/33KV upto 5000 kw 216 1.06 0.44 2.96C-3 66 / 132 / 220 kv - All loads 214 1.04 0.44 2.90
AGRICULTURAL TUBE-WELL TARIFF-DD-1 SCARP - 1.26 0.53 3.13 0.40 D-2 (i) Punjab & Sindh 82 0.9 0.53 1.59 0.40 D-2 ( ii) NWFP & Baluchistan 72 0.75 0.53 1.38 0.40
Districr Mainwali,Bhawalpur and Tharparkar.TEMPORARY SUPPLY TARIFFS
E-1 (I) Domestic Supply 2.11 0.53 3.68E-1 (ii) Commercial Supply 3.79 0.03 4.74Minimum charges E-1(I) and E-1(ii) Rs.46/- per day but not less than Rs.200/-.E-2 (I) Industrial Supply 2.36 0.23 3.51E-2(II)a Bulk Supply at (400KV) 1.76 0.44 3.85E-2(II)b Bulk Supply at (11KV) 1.64 0.44 3.62E-2 (III) Bulk Supply to Other Consumers 1.85 0.44 3.67F-Seasonal Supply to industries 125% of "Supply and Additioan charges" cor. Industrial TariffG-1 (I) Public Lighting Supply Unit Charges as per Tariff A-1aboveG-1(ii) Other than above in G-1(i) 1.93 0.39 4.57RESIDENTIAL COLONIES OF INDUSTRIESH-1Residential Colonies with own transformer 1.45 0.53 4.02H-2 Residential Colonies (others) 1.46 0.53 4.04OTHERSI Railway Traction 1.02 0.49 3.50 J-1 Cogeneration Tariff (Sale by WAPDA) 1.74 0.4 3.36 J-2 (a) COG. Tariff (Purchase by WAPDA Dec.July 1.03J-2 (b) COG. Tariff (Purchase by WAPDA Aug-Nov 0.78SPECIAL CONTRACT TARIFFK-a AJ&K 1.10 0.45 2.53K-b KESC 3.80K-c Rawat Lab. 1.88 0.28 2.11
Note: 1) The above figures cover some portion of the tariffs schedule. For full details, WAPDA Source: WAPDA.2) In addition to above, the "Surcharge" @ 10.4% of supply charges was also leviable3) Supply charges include fixed charges, energy charges, FAS and low power factor penalty.
SCHEDULE OF ELECTRICITY TARIFFS

TABLE 14.4
Effective 1-11-2003Tariff Category/ Fixed/Min Energy Additional F.A.SParticulars Charges Charges F.A.S. Surcharge Subsidies
(Rs/KwM) (Rs/Kwh) (Rs/Kwh) (Rs/Kwh) Rs/kwhGENERAL SUPPLY TARIFF A-1( including FATA)
Upto 50 Units - 0.61 0.73 For Consumption > 50 units upto 1000 units - - - For First 100 units - 0.41 0.49 1.68 0.43 For next 200 units - 0.58 0.49 2.29 0.43 (101-300)For next 700 units - 1.51 0.49 3.55 0.43 (301-1000)Above 1000 units - 1.88 0.37 4.42 0.31 Minimum Monthly Charges: a) Single Phase Connections Rs 45/-
b) Three Phase Connection: Rs 100/- GENERAL SUPPLY TARRIF A-2( including FATA)
For first 100 units - 2.7 0.0 3.82Above 100 Units - 2.94 0.0 3.92For peak load requirment above 20kv 220 1.09 0.12 2.83Minimum Monthly Charges: a) Single Phase Connections Rs 150/-
b) Three Phase Connection: Rs 300/-
INDUSTRIAL SUPPLYB-1 upto 40 kw - 1.81 0.13 3.07There shall be minimum monthly charges of Rs 70/Kw for first 20 Kilowatts of load and Rs 90/Kw for rest load between 21 - 40 kw
B-2 (>41-500 kw) 300 1.30 0.13 2.09B-2 TOD ( Peak) 300 1.98 0.13 2.87B-2 TOD (Off Peak) 300 1.20 0.13 2.07B-3 (Normal) 11&33 kv not exceeding 5000 k 290 1.29 0.13 2.01B-3 TOD (Peak) 290 1.97 0.13 2.26B-3 TOD (off Peak) 290 1.15 0.13 1.60B-4 Normal 66/132/220 kv - All loads 280 1.24 0.13 1.86B-4 TOD (Peak) 280 1.87 0.13 2.20B-4 TOD (off Peak) 280 1.11 0.13 1.49
Note: 1) The above figures cover some portion of the tariffs schedule. For full details, WAPDA may be consulted Contd…..2) In addition to above, the "Surcharge" @ 10.4% of supply charges was also leviable3) Supply charges include fixed charges, energy charges, FAS and low power factor penalty.
SCHEDULE OF ELECTRICITY TARIFFS

TABLE 14.4
Effective 1-11-2003Tariff Category/ Fixed/Min Energy Additional F.A.SParticulars Charges Charges F.A.S. Surcharge Subsidies
(Rs/KwM) (Rs/Kwh) (Rs/Kwh) (Rs/Kwh) Rs/kwhBULK SUPPLY TARIFFS
C-1(a) 400 Volts upto 20kw 1.24 0.34 3.42C-1(b) 400 Volts above 20kw upto 500 kw 220 1.09 0.34 3.21C-2 (a) 11/33KV upto 5000 kw 216 1.06 0.34 2.96C-3 66 / 132 / 220 kv - All loads 214 1.04 0.34 2.90
AGRICULTURAL TUBE-WELL TARIFF-DD-1 SCARP - 1.26 0.49 3.13 0.36 D-2 (i) Punjab & Sindh 82 0.9 0.49 1.59 0.36 D-2 ( ii) NWFP & Baluchistan 72 0.75 0.49 1.38 0.36
Districr Mainwali,Bhawalpur and Tharparkar.TEMPORARY SUPPLY TARIFFS
E-1 (I) Domestic Supply 2.11 0.49 3.68E-1 (ii) Commercial Supply 3.72 0 4.74Minimum charges E-1(I) and E-1(ii) Rs.46/- per day but not less than Rs.200/-.E-2 (I) Industrial Supply 2.36 0.13 3.51E-2(II)a Bulk Supply at (400KV) 1.76 0.34 3.85E-2(II)b Bulk Supply at (11KV) 1.64 0.34 3.62E-2 (III) Bulk Supply to Other Consumers 1.85 0.34 3.67F-Seasonal Supply to industries 125% of "Supply and Additioan charges" cor. Industrial TariffG-1 (I) Public Lighting Supply Unit Charges as per Tariff A-1aboveG-1(ii) Other than above in G-1(i) 1.93 0.39 4.57RESIDENTIAL COLONIES OF INDUSTRIESH-1Residential Colonies with own transformer 1.45 0.49 4.02H-2 Residential Colonies (others) 1.46 0.49 4.04OTHERSI Railway Traction 1.02 0.49 3.50 J-1 Cogeneration Tariff (Sale by WAPDA) 1.74 0.40 3.36 J-2 (a) COG. Tariff (Purchase by WAPDA Dec.July 1.03J-2 (b) COG. Tariff (Purchase by WAPDA Aug-Nov 0.78SPECIAL CONTRACT TARIFFK-a AJ&K 1.10 0.41 2.53K-b KESC 3.69K-c Rawat Lab. 1.88 0.28 2.11
Note: 1) The above figures cover some portion of the tariffs schedule. For full details, WAPDA Source: WAPDA.2) In addition to above, the "Surcharge" @ 10.4% of supply charges was also leviable3) Supply charges include fixed charges, energy charges, FAS and low power factor penalty.
SCHEDULE OF ELECTRICITY TARIFFS

TABLE 14.4
Effective 1-07-2004Tariff Category/ Fixed/Min Energy F.A.S. Additional Surcharges TotalParticulars Charges Charges Subsidized Surcharge @ 10.4% Avg-Rate
(Rs/KwM) (Rs/Kwh) (Rs/Kwh) (Rs/Kwh) (Rs/Kwh) (Rs/Kwh)GENERAL SUPPLY TARIFF A-1( including FATA)
Upto 50 Units - 0.61 0.73 0.06 1.40For Consumption > 50 units upto 1000 units 0.00 0.00 0.00For First 100 units - 0.41 0.43 1.48 0.09 2.41For next 200 units - 0.58 0.43 2.19 0.11 2.31(101-300)For next 700 units - 1.51 0.43 3.45 0.20 5.59(301-1000)Above 1000 units - 1.88 0.31 4.32 0.23 6.74Minimum Monthly Charges: a) Single Phase Connections Rs 45/-
b) Three Phase Connection: Rs 100/- GENERAL SUPPLY TARRIF A-2( including FATA)
For first 100 units - 2.70 0.00 3.82 0.28 6.80Above 100 Units - 2.94 0.00 3.67 0.31 6.92For peak load requirment above 20kv 220 1.09 0.12 2.83 0.23 5.27Minimum Monthly Charges: a) Single Phase Connections Rs 150/-
b) Three Phase Connection: Rs 300/-
INDUSTRIAL SUPPLYB-1 upto 40 kw - 1.81 0.13 2.97 0.20 5.11There shall be minimum monthly charges of Rs 70/Kw for first 20 Kilowatts of load and Rs 90/Kw for rest load between 21 - 40 kw
B-2 (>41-500 kw) 300 1.30 0.13 1.99 0.26 4.76B-2 TOD ( Peak) 300 1.98 0.13 2.22 0.36 6.01B-2 TOD (Off Peak) 300 1.20 0.13 2.07 0.24 4.57B-3 (Normal) 11&33 kv not exceeding 5000 k 290 1.29 0.13 2.01 0.22 4.38B-3 TOD (Peak) 290 1.97 0.13 2.68 0.28 4.61B-3 TOD (off Peak) 290 1.15 0.13 1.60 0.19 3.62B-4 Normal 66/132/220 kv - All loads 280 1.24 0.13 1.86 0.23 4.29B-4 TOD (Peak) 280 1.87 0.13 1.69 0.27 4.57B-4 TOD (off Peak) 280 1.11 0.13 1.49 0.19 3.50
Note: 1) The above figures cover some portion of the tariffs schedule. For full details, WAPDA may be consulted. Contd.2) The above tariffs are inlusive of GOP subsidy in FAS and discount in addl. Surcharges
SCHEDULE OF ELECTRICITY TARIFFS

TABLE 14.4
Effective 1-07-2004Tariff Category/ Fixed/Min Energy F.A.S. Additional Surcharges TotalParticulars Charges Charges Subsidized Surcharge @ 10.4% Avg-Rate
(Rs/KwM) (Rs/Kwh) (Rs/Kwh) (Rs/Kwh) (Rs/Kwh) (Rs/Kwh)BULK SUPPLY TARIFFS
C-1(a) 400 Volts upto 20kw 1.24 0.34 3.42 0.16 5.16C-1(b) 400 Volts above 20kw upto 500 kw 220 1.09 0.34 3.21 0.20 5.29C-2 (a) 11/33KV upto 5000 kw 216 1.06 0.34 2.96 0.20 5.09C-3 66 / 132 / 220 kv - All loads 214 1.04 0.34 2.90 0.19 4.96
AGRICULTURAL TUBE-WELL TARIFF-DD-1 SCARP - 1.26 0.36 3.13 0.17 4.92D-2 (i) Punjab & Sindh 72 0.90 0.36 1.59 0.16 3.28D-2 ( ii) NWFP & Baluchistan 72 0.75 0.36 1.38 0.13 2.80
Districr Mainwali,Bhawalpur and Tharparkar.TEMPORARY SUPPLY TARIFFS
E-1 (I) Domestic Supply 2.11 0.49 3.68 0.27 6.55E-1 (ii) Commercial Supply 3.72 0.00 4.74 0.39 8.85Minimum charges E-1(I) and E-1(ii) Rs.46/- per day but not less than Rs.200/-.E-2 (I) Industrial Supply 2.36 0.13 3.51 0.26 6.26E-2(II)a Bulk Supply at (400KV) 1.76 0.34 3.85 0.22 6.17E-2(II)b Bulk Supply at (11KV) 1.64 0.34 3.62 0.21 5.81E-2 (III) Bulk Supply to Other Consumers 1.85 0.34 3.67 0.23 6.09F-Seasonal Supply to industries 125% of "Supply and Additioan charges" cor. Industrial TariffG-1 (I) Public Lighting Supply Unit Charges as per Tariff A-1aboveG-1(ii) Other than above in G-1(i) 1.93 0.39 4.57 0.24 7.13RESIDENTIAL COLONIES OF INDUSTRIESH-1Residential Colonies with own transformer 1.45 0.49 4.02 0.20 6.16H-2 Residential Colonies (others) 1.46 0.49 4.04 0.20 6.19OTHERSI Railway Traction 1.02 0.49 3.50 0.16 5.17J-1 Cogeneration Tariff (Sale by WAPDA) 1.74 0.40 3.36 0.22 5.72J-2 (a) COG. Tariff (Purchase by WAPDA Dec.July 1.03 0.00 0.00 0.00 1.03J-2 (b) COG. Tariff (Purchase by WAPDA Aug-Nov 0.78 0.00 0.00 0.00 0.78SPECIAL CONTRACT TARIFFK-a AJ&K 1.10 0.41 2.53 0.16 4.20K-b KESC 0.00 0.00 3.69 0.00 6.69K-c Rawat Lab. 1.88 0.28 2.11 0.22 4.49
Source: WAPDA.Note: 1) The above figures cover some portion of the tariffs schedule. For full details, WAPDA may be consulted.
2) The above tariffs are inlusive of GOP subsidy in FAS and discount in addl. Surcharges
SCHEDULE OF ELECTRICITY TARIFFS

TABLE 14.4
Effective 1-07-2005Tariff Category/ Fixed/Min Energy F.A.S. Additional Surcharges TotalParticulars Charges Charges Subsidized Surcharge @ 10.4% Avg-Rate
(Rs/KwM) (Rs/Kwh) (Rs/Kwh) (Rs/Kwh) (Rs/Kwh) (Rs/Kwh)GENERAL SUPPLY TARIFF A-1( including FATA)
Upto 50 Units - 0.61 0.00 0.73 0.06 1.40For Consumption Exceeding 50 unitsFor First 100 units (1-100) - 0.41 0.43 1.48 0.09 2.41For next 200 units - 0.58 0.43 2.19 0.11 2.31(101-300)For next 700 units - 1.51 0.43 3.45 0.20 5.59(301-1000)Above 1000 units - 1.88 0.31 4.32 0.23 6.74Minimum Monthly Charges: a) Single Phase Connections Rs 45/-
b) Three Phase Connection: Rs 100/- GENERAL SUPPLY TARRIF A-2( including FATA)
For first 100 units - 2.70 0.00 3.82 0.28 6.80Above 100 Units - 2.94 0.00 3.67 0.31 6.92For peak load requirment above 20kv 220 1.09 0.12 2.83 0.23 5.27Minimum Monthly Charges: a) Single Phase Connections Rs 150/-
b) Three Phase Connection: Rs 300/-
INDUSTRIAL SUPPLYB-1 upto 40 kw - 1.81 0.13 2.97 0.20 5.11There shall be minimum monthly charges of Rs 70/Kw for first 20 Kilowatts of load and Rs 90/Kw for rest load between 21 - 40 kw
B-2 (>41-500 kw) 300 1.30 0.13 1.99 0.26 4.76B-2 TOD ( Peak) 300 1.98 0.13 2.22 0.36 6.01B-2 TOD (Off Peak) 300 1.20 0.13 2.07 0.24 4.57B-3 (Normal) 11&33 kv not exceeding 5000 k 290 1.29 0.13 2.01 0.22 4.38B-3 TOD (Peak) 290 1.97 0.13 1.68 0.28 4.61B-3 TOD (off Peak) 290 1.15 0.13 1.60 0.19 3.62B-4 Normal 66/132/220 kv - All loads 280 1.24 0.13 1.86 0.23 4.29B-4 TOD (Peak) 280 1.87 0.13 1.69 0.27 4.57B-4 TOD (off Peak) 280 1.11 0.13 1.49 0.19 3.50
Note: 1) The above figures cover some portion of the tariffs schedule. For full details, WAPDA may be consulted. Contd.2) The above tariffs are inlusive of GOP subsidy in FAS and discount in addl. Surcharges
SCHEDULE OF ELECTRICITY TARIFFS

TABLE 14.4
Tariff Category/ Fixed/Min Energy F.A.S. Additional Surcharges TotalParticulars Charges Charges Subsidized Surcharge @ 10.4% Avg-Rate
(Rs/KwM) (Rs/Kwh) (Rs/Kwh) (Rs/Kwh) (Rs/Kwh) (Rs/Kwh)BULK SUPPLY TARIFFS
C-1(a) 400 Volts upto 20kw 1.24 0.34 3.42 0.16 5.16C-1(b) 400 Volts above 20kw upto 500 kw 220 1.09 0.34 3.21 0.20 5.29C-2 (a) 11/33KV upto 5000 kw 216 1.06 0.34 2.96 0.20 5.09C-3 66 / 132 / 220 kv - All loads 214 1.04 0.34 2.90 0.19 4.96
AGRICULTURAL TUBE-WELL TARIFF-DD-1 SCARP - 1.26 0.36 3.13 0.17 4.92D-2 (i) Punjab & Sindh 72 0.90 0.36 1.59 0.16 3.28D-2 ( ii) NWFP & Baluchistan 72 0.90 0.36 0.84 0.16 2.53
Districr Mainwali,Bhawalpur and Tharparkar.D-2 Normal 72 0.75 0.36 1.38 0.13 2.80D-2 (II) TOD NWFP (OFF-PEAK) 72 0.75 0.36 0.63 0.13 2.05
TEMPORARY SUPPLY TARIFFSE-1 (I) Domestic Supply 2.11 0.49 3.68 0.27 6.55E-1 (ii) Commercial Supply 3.72 0.00 4.74 0.39 8.85Minimum charges E-1(I) and E-1(ii) Rs.46/- per day but not less than Rs.200/-.E-2 (I) Industrial Supply 2.36 0.13 3.51 0.26 6.26E-2(II)a Bulk Supply at (400KV) 1.76 0.34 3.85 0.22 6.17E-2(II)b Bulk Supply at (11KV) 1.64 0.34 3.62 0.21 5.81E-2 (III) Bulk Supply to Other Consumers 1.85 0.34 3.67 0.23 6.09F-Seasonal Supply to industries 125% of "Supply and Additioan charges" cor. Industrial TariffG-1 (I) Public Lighting Supply Unit Charges as per Tariff A-1aboveG-1(ii) Other than above in G-1(i) 1.93 0.39 4.57 0.24 7.13RESIDENTIAL COLONIES OF INDUSTRIESH-1Residential Colonies with own transformer 1.45 0.49 4.02 0.20 6.16H-2 Residential Colonies (others) 1.46 0.49 4.04 0.20 6.19OTHERSI Railway Traction 1.02 0.49 3.50 0.16 5.17J-1 Cogeneration Tariff (Sale by WAPDA) 1.74 0.40 3.36 0.22 5.72J-2 (a) COG. Tariff (Purchase by WAPDA Dec.July 1.03 0.00 0.00 0.00 1.03J-2 (b) COG. Tariff (Purchase by WAPDA Aug-Nov 0.78 0.00 0.00 0.00 0.78SPECIAL CONTRACT TARIFFK-a AJ&K 1.10 0.41 2.53 0.16 4.20K-b KESC 0.00 0.00 3.69 0.00 6.69K-c Rawat Lab. 1.88 0.28 2.11 0.22 4.49
Source: WAPDA.Note: 1) The above figures cover some portion of the tariffs schedule. For full details, WAPDA may be consulted.
2) The above tariffs are inlusive of GOP subsidy in FAS and discount in addl. Surcharges
SCHEDULE OF ELECTRICITY TARIFFS
Effective 1-07-2005

Table 14.4
TARIFF CATEGORY Fixed Charges Variable ChargesRs/KW Rs/KWh
A-1 GENERAL SUPPLY TARIFF- RESIDENTIAL Upto 50 UNITS 1.40FOR CONSUMPTION EXCEEDING 50 UNITS 1 - 100 Units per month 2.65 101 - 300 Units per month 3.64 301 - 1000 Units per month 6.15 Above 1000 UNITS 7.41 Time of Day (TOD) - Peak 365 6.00 Time of Day (TOD) - Off-Peak 365 3.55A-2 GENERAL SUPPLY TARIFF - COMMERCIALa) For Sanctioned Load upto 20 KW
i) For First 100 units 7.48ii) Above 100 units 7.61
b) For Sanctioned Load exceding 20 KW 267.17 4.59c) Time of Use - Peak 365.00 6.00 Time of Use -Off- Peak 365.00 3.55INDUSTRIAL SUPPLY TARIFFS B-1 upto 40 KW (230/400 Volts) 5.62 B-2 Load >40 to 500 KW at 400 Volts. 364.32 3.93 B-2 TOD (Peak) 364.32 5.01 B-2 TOD (Off-Peak) 364.32 3.89 B-3 TOD (Peak) 352.18 4.40 B-3 TOD (Off-Peak) 352.18 3.31 B-4 TOD (Peak) 340.03 4.29 B-4 TOD (Off-Peak) 340.03 3.15BULK SUPPLY TARIFFS C-1 (a) 400-Volts Load upto 20 KW 5.68 C-1 (b) 400-V Load above 20 KW 267.17 5.27 Time of Day (TOD) Peak 365.00 6.00 Time of Day (TOD) Off-Peak 365.00 3.55 C-2 at 11/33-KV 262.31 4.96 Time of Day (TOD) Peak 355.00 5.95 Time of Day (TOD) Off-Peak 355.00 3.45 C-3 all loads 259.88 4.86 Time of Day (TOD) Peak 340.00 5.90 Time of Day (TOD) Off-Peak 340.00 3.40AGRICUTURAL TUBEWELL TARIFFS D-1 - Scarp 5.41 D-2(I)- Punjab / Sindh (Normal) 87.44 3.28 D-2(II)- NWFP/Blochistan (Normal), Distts. Mianwali, Bhawalpur & Tharparkar.
87.44 2.87
Time of Day (TOD) Peak 355.00 6.00 Time of Day (TOD) Off-Peak 355.00 3.55PUBLIC LIGHTING TARIFF G 7.59RESIDENTIAL COLONIES OF INDUSTRIES H 6.78RAILWAY TRACTION I 5.69SPECIAL CONTRACT TARIFFS K(a) - AJ&K 355 1.90 Time of Day (TOD) Peak 355 6.00 Time of Day (TOD) Off-Peak 355 3.55 K(c) - Rawat Lab. 4.94
Source: WAPDANote: 1) The above figures cover some portion of the tariffs schedule. For full details, WAPDA may be consulted.
SCHEDULE OF ELECTRICITY TARIFFS
Effective from 24-02-2007

TABLE 14.5
Rs/LtrsDate 1-1-2004 6-1-2004 1-2-2004 16-2-2004 1-3-2004 15-3-2004 1-4-2004 16-4-2004 1-5-2004 16-5-2004Ex-Depot Sale PriceMotor GasolinePremium Motor Gasoline 33.78 35.48 35.33 34.47 34.80 34.75 34.57 35.37 36.92 36.92 HOBC (Automotive 100 Octane) 37.67 39.42 39.42 38.43 38.74 38.97 38.32 39.39 40.87 40.87 Super (90 Octane) Blend of Motor
Gasoline @ 60% and HOBC 40%)Kerosene 22.38 23.22 23.55 22.18 22.41 21.98 21.98 23.00 24.00 24.00 HSD 22.78 23.85 23.85 23.77 23.77 23.77 23.44 24.02 24.37 24.37 LDO 18.63 19.62 20.29 19.84 19.91 19.75 19.45 20.03 21.05 21.05 Aviation gasoline (100LL)JP-1:
i) For sale to PIA Domestic Flight 15.96 16.72 17.02 15.31 15.70 15.41 15.88 16.17 18.23 19.72 ii) For sale to PIA foreign
flights & foreign airlineiii) For Cargo & Technical
Landing FlightsJP-4 19.68 20.91 21.00 19.15 16.69 19.75 19.94 20.37 21.82 23.03
Source: Hydrocarban Development Institute of Pakistan(HDIP)
TABLE 14.5
Rs/LtrsDate 1-6-2004 16-6-2004 1-7-2004 16-7-2004 1-8-2004 16-8-2004 1-9-2004 16-9-2004 1-10-2004 16-10-2004Ex-Depot Sale PriceMotor Gasoline 36.92 36.92 36.92 36.92 36.92 36.92 36.92 36.92 36.92 36.92HOBC (Automotive 100 Octane) 40.87 40.87 40.87 40.87 40.87 40.87 40.87 40.87 40.87 40.87Super (90 Octane) Blend of Motor
Gasoline @ 60% and HOBC 40%)Kerosene 24.00 24.00 24.00 24.00 24.00 24.00 24.00 24.00 24.00 24.00HSD 24.37 24.37 24.37 24.37 24.37 24.37 24.37 24.37 24.37 24.37LDO 21.05 21.05 21.05 21.05 21.05 21.05 21.05 21.50 12.05 21.05Aviation gasoline (100LL)JP-1:
i) For sale to PIA Domestic Flight 19.65 18.47 18.40 19.60 20.85 22.20 23.29 22.76 24.86 26.06ii) For sale to PIA foreign
flights & foreign airlineiii) For Cargo & Technical
Landing FlightsJP-4 23.41 22.26 21.80 22.47 23.64 25.53 26.54 25.62 27.39 28.90
Source: Hydrocarban Development Institute of Pakistan(HDIP)
OIL SALE PRICES
OIL SALE PRICES

TABLE 14.5
Rs/LtrsDate 1-11-2004 16-11-2004 1-12-2004 16-12-2004 1-1-2005 16-1-2005 2-2-2005 16-2-2005Ex-Depot Sale PriceMotor Gasoline 36.92 36.92 36.92 39.50 40.39 40.39 42.39 42.39Premium Motor GasolineHOBC (Automotive 100 Octane) 40.87 40.87 40.87 43.73 44.59 44.59 47.32 47.32Super (90 Octane) Blend of Motor
Gasoline @ 60% and HOBC 40%)Kerosene 24.00 24.00 24.00 25.50 26.04 26.04 27.04 27.04HSD 24.37 24.37 24.37 25.96 26.21 26.21 27.16 27.16LDO 21.50 21.05 21.05 22.41 22.92 22.92 24.33 24.33Aviation gasoline (100LL)JP-1:
i) For sale to PIA Domestic Flight 27.55 25.36 24.24 21.84 21.68 20.88 23.21 23.18ii) For sale to PIA foreign
flights & foreign airlineiii) For Cargo & Technical
Landing FlightsJP-4 29.83 27.84 27.06 25.21 24.71 23.65 25.98 26.29
Source: Hydrocarban Development Institute of Pakistan(HDIP)
TABLE 14.5
Rs/LtrsDate 1-3-2005 16-3-2005 1-4-2005 16-04-2005 01-05-2005 17-05-2005 01-06-2005 16-06-2005Ex-Depot Sale PriceMotor Gasoline 43.96 45.53 45.53 45.53 45.53 45.53 45.53 45.53HOBC (Automotive 100 Octane) 48.94 50.52 50.52 50.52 50.52 50.52 50.52 50.52Super (90 Octane) Blend of Motor
Gasoline @ 60% and HOBC 40%)Kerosene 27.98 27.98 27.98 27.98 27.98 27.98 27.98 27.98HSD 28.21 29.06 29.06 29.06 29.06 29.06 29.06 29.06LDO 25.37 26.39 26.39 26.39 26.39 26.39 26.39 26.39Aviation gasoline (100LL)JP-1:
i) For sale to PIA Domestic Flight 24.77 28.16 29.83 31.82 31.03 29.15 27.19 29.36ii) For sale to PIA foreign
flights & foreign airlineiii) For Cargo & Technical
Landing FlightsJP-4 27.89 30.39 31.81 32.89 31.76 29.97 28.61 29.87
Source: Hydrocarban Development Institute of Pakistan(HDIP)
OIL SALE PRICES
OIL SALE PRICES

TABLE 14.5
Rs/LtrsDate 01-07-2005 01-08-2005 16-08-2005 01-09-2005 16-09-2005 01-10-2005Ex-Depot Sale PriceMotor Gasoline 48.94 48.94 48.94 52.61 52.29 56.29HOBC (Automotive 100 Octane) 54.33 54.33 54.33 58.40 58.40 62.77Super (90 Octane) Blend of Motor
Gasoline @ 60% and HOBC 40%)Kerosene 29.53 29.53 29.53 31.00 31.00 32.87HSD 31.74 31.74 31.74 34.59 34.59 37.18LDO 27.84 27.84 27.84 29.22 29.22 30.97Aviation gasoline (100LL)JP-1:
i) For sale to PIA Domestic Flight 31.27 30.48 32.10 33.75 34.88 34.07ii) For sale to PIA foreign
flights & foreign airlineiii) For Cargo & Technical
Landing FlightsJP-4 31.54 31.51 33.53 35.31 36.9 35.93
Source: Hydrocarban Development Institute of Pakistan(HDIP)
TABLE 14.5
Date 01-11-2005 16-11-2005 01-12-2005 16-12-2005 01-01-2006Ex-Depot Sale PriceMotor Gasoline 56.29 56.29 56.29 56.29 56.29HOBC (Automotive 100 Octane) 62.77 62.77 62.77 62.77 62.77Super (90 Octane) Blend of Motor
Gasoline @ 60% and HOBC 40%)Kerosene 32.87 32.87 32.87 32.87 32.87HSD 37.18 37.18 37.18 37.18 37.18LDO 30.97 30.97 30.97 30.97 30.97Aviation gasoline (100LL)JP-1:
i) For sale to PIA Domestic Flight 31.59 28.34 28.78 29.89 32.15ii) For sale to PIA foreign
flights & foreign airlineiii) For Cargo & Technical
Landing FlightsJP-4 33.87 31.44 31.33 32.36 33.37
Source: Hydrocarban Development Institute of Pakistan(HDIP)
OIL SALE PRICES
OIL SALE PRICES
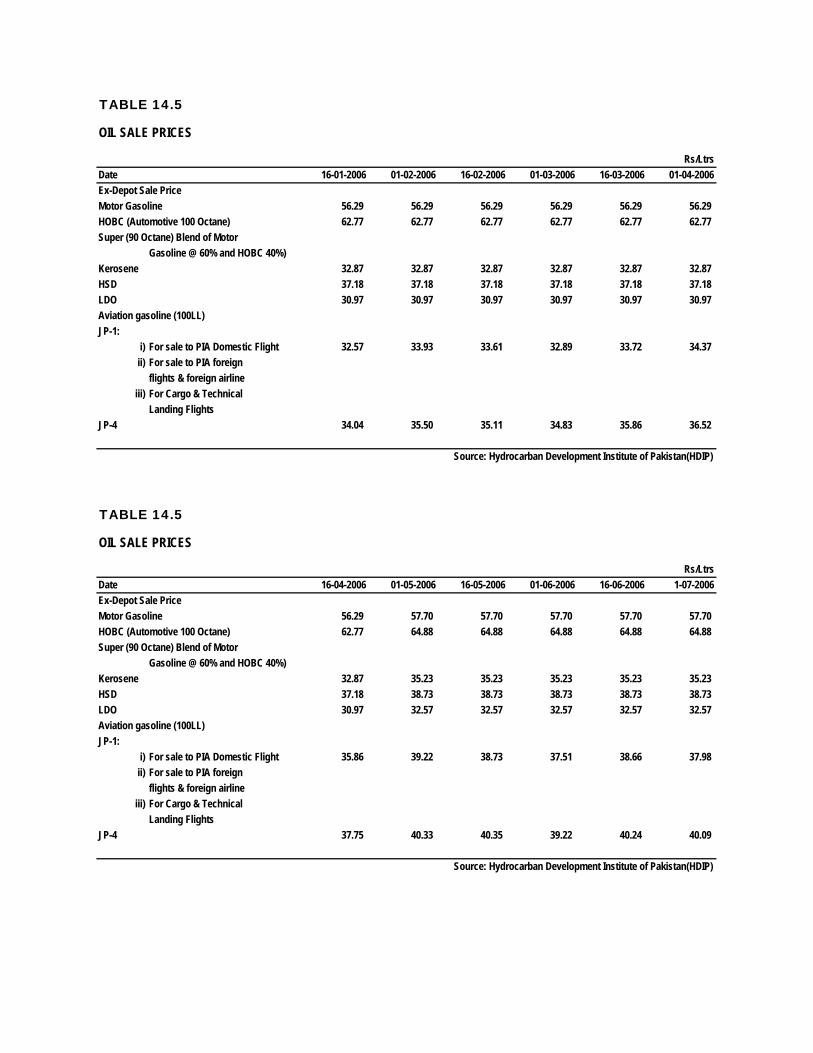
TABLE 14.5
Rs/LtrsDate 16-01-2006 01-02-2006 16-02-2006 01-03-2006 16-03-2006 01-04-2006Ex-Depot Sale PriceMotor Gasoline 56.29 56.29 56.29 56.29 56.29 56.29HOBC (Automotive 100 Octane) 62.77 62.77 62.77 62.77 62.77 62.77Super (90 Octane) Blend of Motor
Gasoline @ 60% and HOBC 40%)Kerosene 32.87 32.87 32.87 32.87 32.87 32.87HSD 37.18 37.18 37.18 37.18 37.18 37.18LDO 30.97 30.97 30.97 30.97 30.97 30.97Aviation gasoline (100LL)JP-1:
i) For sale to PIA Domestic Flight 32.57 33.93 33.61 32.89 33.72 34.37ii) For sale to PIA foreign
flights & foreign airlineiii) For Cargo & Technical
Landing FlightsJP-4 34.04 35.50 35.11 34.83 35.86 36.52
Source: Hydrocarban Development Institute of Pakistan(HDIP)
TABLE 14.5
Rs/LtrsDate 16-04-2006 01-05-2006 16-05-2006 01-06-2006 16-06-2006 1-07-2006Ex-Depot Sale PriceMotor Gasoline 56.29 57.70 57.70 57.70 57.70 57.70 HOBC (Automotive 100 Octane) 62.77 64.88 64.88 64.88 64.88 64.88 Super (90 Octane) Blend of Motor
Gasoline @ 60% and HOBC 40%)Kerosene 32.87 35.23 35.23 35.23 35.23 35.23HSD 37.18 38.73 38.73 38.73 38.73 38.73LDO 30.97 32.57 32.57 32.57 32.57 32.57Aviation gasoline (100LL)JP-1:
i) For sale to PIA Domestic Flight 35.86 39.22 38.73 37.51 38.66 37.98ii) For sale to PIA foreign
flights & foreign airlineiii) For Cargo & Technical
Landing FlightsJP-4 37.75 40.33 40.35 39.22 40.24 40.09
Source: Hydrocarban Development Institute of Pakistan(HDIP)
OIL SALE PRICES
OIL SALE PRICES

TABLE 14.5
Rs/LtrsDate 16-07-2006 01-08-2006 16-08-2006 01-09-2006 16-09-2006 01-10-2006Ex-Depot Sale PriceMotor Gasoline 57.70 57.70 57.70 57.70 57.70 57.70 HOBC (Automotive 100 Octane) 64.88 64.88 64.88 64.88 64.88 64.88 Super (90 Octane) Blend of Motor
Gasoline @ 60% and HOBC 40%)Kerosene 35.23 35.23 35.23 35.23 35.23 35.23 HSD 38.73 38.73 38.73 38.73 38.73 38.73 LDO 32.57 32.57 32.57 32.57 32.57 32.57 Aviation gasoline (100LL)JP-1:
i) For sale to PIA Domestic Flight 38.64 39.48 40.00 39.40 38.04 34.22 ii) For sale to PIA foreign
flights & foreign airlineiii) For Cargo & Technical
Landing FlightsJP-4 41.30 44.71 41.52 40.48 38.39 35.41
Source: Hydrocarban Development Institute of Pakistan(HDIP)
TABLE 14.5
Rs/LtrsDate 16-10-2006 01-11-2006 16-11-2006 01-12-2006 16-12-2006 01-01-2007Ex-Depot Sale PriceMotor Gasoline 57.70 57.70 57.70 57.70 57.70 57.70 HOBC (Automotive 100 Octane) 64.88 64.88 64.88 64.88 64.88 64.88 Super (90 Octane) Blend of Motor
Gasoline @ 60% and HOBC 40%)Kerosene 35.23 35.23 35.23 35.23 35.23 35.23 HSD 38.73 38.73 38.73 38.73 38.73 38.73 LDO 32.57 32.57 32.57 32.57 32.57 32.57 Aviation gasoline (100LL)JP-1:
i) For sale to PIA Domestic Flight 33.49 33.05 32.66 33.25 35.20 34.32 ii) For sale to PIA foreign
flights & foreign airlineiii) For Cargo & Technical
Landing FlightsJP-4 35.03 34.86 34.82 35.34 37.09 36.49 JP-8 39.61
Source: Hydrocarban Development Institute of Pakistan(HDIP)
OIL SALE PRICES
OIL SALE PRICES
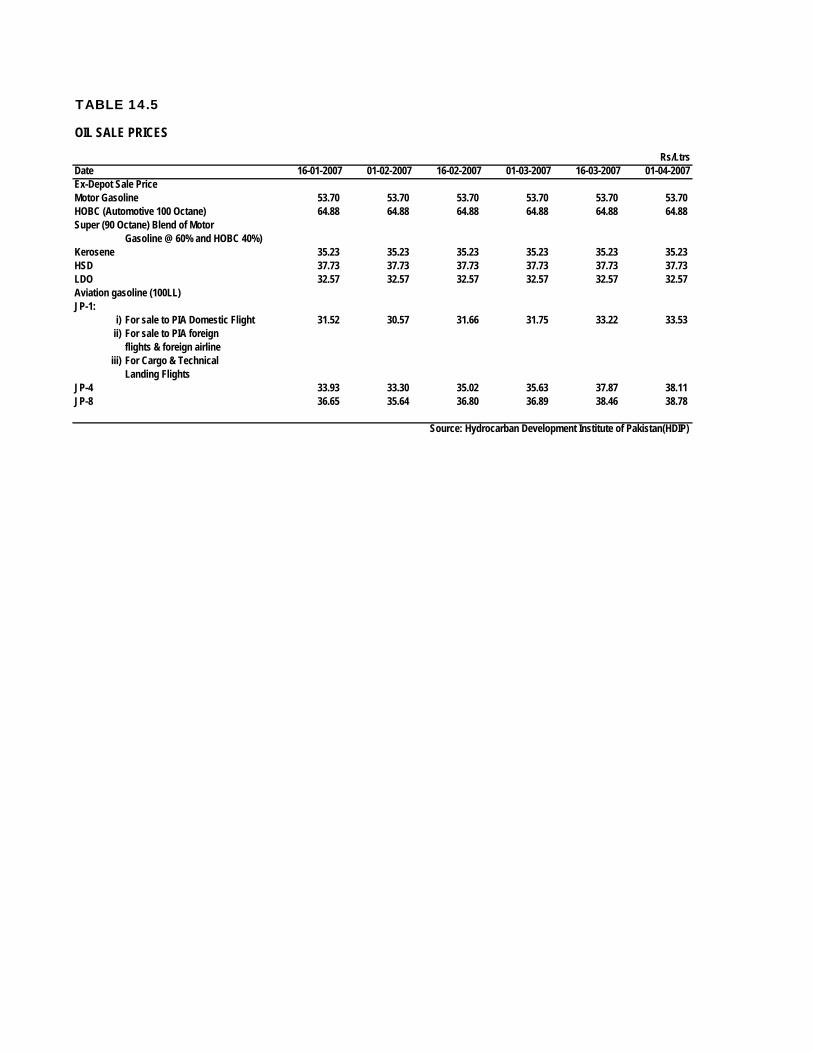
TABLE 14.5
Rs/LtrsDate 16-01-2007 01-02-2007 16-02-2007 01-03-2007 16-03-2007 01-04-2007Ex-Depot Sale PriceMotor Gasoline 53.70 53.70 53.70 53.70 53.70 53.70 HOBC (Automotive 100 Octane) 64.88 64.88 64.88 64.88 64.88 64.88 Super (90 Octane) Blend of Motor
Gasoline @ 60% and HOBC 40%)Kerosene 35.23 35.23 35.23 35.23 35.23 35.23 HSD 37.73 37.73 37.73 37.73 37.73 37.73 LDO 32.57 32.57 32.57 32.57 32.57 32.57 Aviation gasoline (100LL)JP-1:
i) For sale to PIA Domestic Flight 31.52 30.57 31.66 31.75 33.22 33.53 ii) For sale to PIA foreign
flights & foreign airlineiii) For Cargo & Technical
Landing FlightsJP-4 33.93 33.30 35.02 35.63 37.87 38.11 JP-8 36.65 35.64 36.80 36.89 38.46 38.78
Source: Hydrocarban Development Institute of Pakistan(HDIP)
OIL SALE PRICES

TABLE 14.6
(Rs/mcft)
/ Category 01.3.2002 23.7.2002 20-8-2002 25.10.2002 1-7-2003 1.1.2004 1-7-2004
DOMESTIC (Slab)Upto 1.77 MCUFT / Month .. .. .. .. .. .. ..
I Upto 3.55 66.86 66.86 66.86 67.95 69.31 69.31 73.95II 3.55 to 7.1 100.73 100.73 100.73 102.37 104.42 104.42 111.42III 7.1 to 10.64 161.16 161.16 161.16 163.78 167.06 167.06 178.25IV 10.64 to 14.20 (MCFT/M) 201.45 201.45 201.45 213.06 217.32 217.32 231.88V All over 14.20 217.85 217.85 217.85
COMMERCIAL 186.98 186.98 186.98 190.02 193.82 193.82 204.88General 166.18 166.18 166.18 168.88 172.26 172.26 182.09Captive PowerCement 194.68 194.68 222.32 222.32 209.78 209.78 209.78CNG Station 166.18 166.18 166.18 168.88 172.26 172.26 182.09FERTILIZER
SNGPL'S SYSTEM(i)For Feed StockPak.Americal Fertilizer Ltd.PAFL 36.77 36.77 36.77 36.77 36.77 36.77 36.77F.F.C Jorden 36.77 36.77 36.77 36.77 36.77 36.77 36.77Dadoud/ Pak Arab 59.59 59.59 62.57 62.57 67.26 67.26 73.99Pak china/ Hazara 63.24 63.24 66.40 66.40 71.38 71.38 78.52(ii)For Fuel Generation 166.18 166.18 166.88 168.88 172.26 172.26 182.09
FOR MARI GAS CO. SYSTEM(i)For Feed Stock FFC Engro Chemical 13.09 13.09 13.09 13.09 66.31 66.31 72.94Pak Saudi 58.74 61.68 61.68 61.68 66.31 66.31 72.94(ii)For Power Generation 166.18 166.18 166.18 168.88 172.26 172.26 182.09
SNGPL & SSGCL'S SYSTEM 166.18 166.18 166.18 168.88 172.26 172.26 182.09Liberty Power Ltd. 202.98 202.98 190.8 190.8 235.77 225.78 234.33GAS DIRECTLY SOLD TOWAPDA'S GUDDU POWER STATIONSUI FIELD (917 BTU) 145.51 145.51 145.51KANDHKOT FIELD (866 BTU) 160.54 160.54 160.54 163.15 166.41 166.41 175.90MARI FIELD (754 BTU) 156.14 156.14 156.14 158.68 161.85 161.85 171.08SARA/SURI FIELD 156.14 156.14 156.14 158.68 161.85 161.85 171.08
(Contd.)
Billing/pricing system changed from Rs. Per thousand cubic feet to Rs. Per million btu w.e.f.1-1-2002
GAS SALE PRICES

TABLE 14.6
(Rs/mcft) / Category 1.1.2005 2-2-2005 1-7-2005 1-1-2006 1-7-2006 1-2-2007
DOMESTIC (Slab)Upto 1.77 MCUFT / Month .. .. .. .. 85.03 78.38
I Upto 3.55 73.95 73.95 73.95 80.98 89.03 82.07II 3.55 to 7.1 111.42 120.61 127.92 147.41 162.07 149.4III 7.1 to 10.64 178.25 192.96 204.17 235.84 259.29 239.01IV 10.64 to 14.20 (MCFT/M) 231.88 251.01 265.59 306.79 337.30 310.92V All over 14.20
COMMERCIAL 204.88 221.78 234.67 271.07 298.03 268.23General 182.09 197.11 208.56 240.91 264.87 238.38Captive Power 179.11 208.56 240.91 264.87 238.38Cement 209.78 227.09 240.28 277.55 305.15 305.15CNG Station 182.09 197.11 208.56 240.91 264.87 264.87FERTILIZER
SNGPL'S SYSTEM(i)For Feed StockPak.Americal Fertilizer Ltd.PAFL 36.77 36.77 36.77 36.77 36.77 36.77F.F.C Jorden 36.77 36.77 36.77 36.77 36.77 36.77Dadoud/ Pak Arab 73.99 73.99 83.24 83.24 91.52 91.52Pak china/ Hazara 78.52 78.52 88.34 88.34 97.11 97.11(ii)For Fuel Generation 182.09 197.11 208.56 240.91 264.87 238.38
FOR MARI GAS CO. SYSTEM(i)For Feed Stock FFC Engro Chemical 72.94 72.94 82.06 82.06 90.22 90.22Pak Saudi(ii)For Power Generation 182.09 182.09 208.56 240.91 264.87 238.38
SNGPL & SSGCL'S SYSTEM 182.09 197.11 208.56 240.91 264.87 238.88Liberty Power Ltd. 262.03 262.03 303.25 413.46 467.52 445.98GAS DIRECTLY SOLD TOWAPDA'S GUDDU POWER STATIONSUI FIELD (917 BTU)KANDHKOT FIELD (866 BTU) 175.90 190.41 201.47 232.72 255.86 230.28MARI FIELD (754 BTU) 171.08 185.19 195.95 226.34 248.85 223.96SARA/SURI FIELD 171.08 185.19 195.95 226.34 248.85 223.96
Source : Hydrocabon Development Institute of Pakistan
Billing/pricing system changed from Rs. Per thousand cubic feet to Rs. Per million btu w.e.f.1-1-2002