Energy Efficiency Improvement Opportunities for the Cement Industry
Upload
necdetdalgicCategory
view
132download
8
Energy Use in the Cement Industry in North America: Emissions, Waste Generation and
Pollution Control, 1990-2001
Prepared by
Marisa Jacott, Fronteras Comunes
Cyrus Reed, Texas Center for Policy Studies
Amy Taylor and Mark Winfield, The Pembina Institute for Sustainable Development
For:
Commission for Environmental Cooperation
2nd North American Symposium on Assessing the Environmental Effects of Trade
May 30, 2003
ii
Table of Contents
Acknowledgements
Executive Summary
1.0 Introduction Side Bar: How Cement is Made
2.0 NAFTA and Cement: A Connection 2.1 Introduction 2.2 Disappearing Tariffs 2.3 Investor Protections and Disputes 2.4 Hazardous Waste, Cement and NAFTA 2.5 The Environmental Side Agreement, the CEC and Cement
3.0 The United States Cement Industry 3.1. Introduction 3.2 An Overview of Trends in Production, Exports, Energy Sources and
Pollutant Releases. 3.2.1 Cement and Clinker Production and Consumption, 1990 - 2001 3.2.2 Cement Location, Ownership Structure and Investment 3.2.3. Cement Industry Clinker Process and Electricity Use 3.2.4 Fuel Use and Total Energy Consumption in the Cement Industry 3.2.5 Cement Industry Pollutant Releases: CO2, NOX and Toxics 3.2.6 Cement Industry Waste Management
3.3 Regulatory Structure for Waste and Emissions Management 3.3.1 Emission Controls 3.3.2 Cement Kiln Dust Management 3.3.3. Controling Ozone Precursors 3.3.4. Greenhouse Gas Controls
3.4 Conclusions
4.0 The Mexican Cement Industry 4.1 Introduction 4.2 An Overview of Trends in Production, Exports, Ownership, Investments,
Energy Use and Pollutant Releases. 4.2.1 Number of Plants, Production and Exports 4.2.2 Ownership and Investments of the Mexican Cement Industry 4.2.3 Mexican Cement Industry Investment in the U.S. Market 4.2.4. Cement Industry Clinker Process and Electricity Use 4.2.5 Energy and Fuel Use in the Mexican Cement Industry 4.2.6 Use of Alternative Fuels in the Mexican Cement Industry
iii
4.2.7 Air Emissions in the Mexican Cement Industry 4.3. Environmental Regulations in the Cement Making Process in Mexico 4.4. International Regulations: The Stockholm Convention 4.5 Conclusions
5.0 The Canadian Cement Industry 5.1 Introduction 5.2 An Overview of Trends in Production, Exports, Energy Sources and
Pollutant Releases. 5.2.1. Cement Production and Shipments 5.2.2 Canadian Cement Exports 5.2.3. Cement Industry Plants and Employees 5.2.4 Fuel Consumption in the Canadian Cement Industry 5.2.5 Cement Industry Pollutant Releases 5.2.6 Canadian Cement Industry Trends: Summary
5.3 The Canadian Regulatory Framework for the use of Wastes as
Supplemental Fuels in Cement Kilns 5.4 Conclusions
6.0 Conclusions and Recommendations
7.0 Bibliography
iv
ACKNOWLEDGEMENTS.
The authors would like to thank several individuals who assisted in the production of this report. Scott McClain of Austin, Texas provided the initial research on the U.S. cement industry for the report, including production data, investment information and environmental regulations, while TCPS intern Greta MacDonald helped with graphics and calculations. Special thanks also to Hendrik G. van Oss, cement commodity specialist at the United States Geological Survey for providing insight and access to government data on the cement industry, particularly in regards to energy use, efficiency and carbon dioxide emissions. In addition, in Mexico, CANACEM, the National Cement Chamber, was particularly helpful in providing information about the use of alternative fuels and data on energy efficiency in the cement industry there. In addition, the authors would like to recognize the hard work of the staff at the North American Comission on Environmental Cooperation, both for their financial assistance as well as their comments and insights. Finally, several independent reviewers provided insights that proved helpful to the final version of this study.
Energy Use in the Cement Industry in North America: Emissions, Waste Generation and Pollution Control
a
EXECUTIVE SUMMARY
This paper examines issues related to the use of energy inputs in the manufacture of cement clinker and cement in Mexico, Canada and the U.S since 1990 and particularly since implementation of the North American Free Trade Agreement (NAFTA) in 1994. Cement manufacturing is a key – and growing -- industry in all three countries, and a major user of energy. In recent years, trade and investment between the three NAFTA countries has increased in this important sector of the economy. As part of this increased production, trade and investment, cement producers make decisions about the type of energy used to fuel the kilns where the cement clinker is produced. Cement manufacturing requires very large amounts of energy and cement manufacturers have used a variety of energy inputs. Among the most common types of fuels are fuel oils, coal, petroleum coke and natural gas. In addition, in all three countries, certain hazardous – such as used lubricants and contaminated soils -- and non-hazardous wastes – such as scrap tires -- can be burned as fuel in the rotary kilns. These decisions in turn have environmental consequences in terms of the emissions of toxics and other atmospheric contaminants, global greenhouse gases and the generation of large quantities of cement kiln dust (CKD) waste. It is important to note that this report focuses narrowly on the production of clinker in cement kiln and upon fuel use and does not address the mining of the inputs used in the cement manufacturing process, nor the transportation and use of cement products. Key research questions for this paper include the following:
• How has energy use –including fuel type -- in the cement manufacturing industry changed over the last ten years, and what have been the the environmental impacts of that change?
• How has the regulatory structure governing the sector changed, specifically with respect to energy efficiency and the prevention and control of pollutant releases and transfers?
• What has been the impact of trade liberalization on these trends? Specifically: o Are companies investing in cement manufacturing in any country to take
advantage of less stringent environmental regulations and enforcement; or o Has foreign investment led to improvements in energy efficiency and
pollution prevention, including through the use of new technologies and pollution control equipment.
The report finds that the cement industry is a continental industry in North America, although the trends in the sector tend to be driven by US demand. Over the past decade, US demand has exceeded domestic supply by a wide margin. In this context, Canada has emerged as a major source of supply to the US, with major increases in production and particularly exports since the early 1990s. Mexico exports to the U.S. have also outpaced a nearly stagnant growth in production for its domestic market, although anti-dumping tariffs stemming from 1989 have prevented Mexican-based

Energy Use in the Cement Industry in North America: Emissions, Waste Generation and Pollution Control
b
companies from gaining a major market share of the U.S. market. Within the last few years, two Mexican cement companies have been building plants in US to gain access to the market and have become major producers of cement in the US. These investment decisions have not been driven by less stringent environmental regulations, but simply by the economics of tariffs and transportation costs versus investment as a way to enter the U.S. market. Still, the lack of environmental regulations for the cement industry has until now allowed cement manufacturers significant freedom in their choice of fuels and pollution control equipment.
Table A. Production and Exports of Cement in NAFTA countries, 1990 – 2001 in Thousand Metric Tons
Year U.S.
Production U.S. Exports to NAFTA Countries
Mexican Production
Mexican Exports to NAFTA Countries
Canadian Production
Canadian Exports to NAFTA Countries
1990 69,954 450 23,824 363 11,083 2,916 1991 67,193 504 25,093 47 9,446 2,669 1992 69,585 555 26,886 824 8,612 2,353 1993 73,807 523 27,506 783 9,284 3,096 1994 77,948 572 30,029 640 10,457 3,803 1995 76,906 599 23,971 850 10,600 3,831 1996 79,266 641 25,365 1,272 11,003 4,339 1997 85,582 650 27,548 995 11,790 4,413 1998 83,931 619 27,744 1,280 12,168 4,693 1999 85,952 577 29,413 1,286 12,643 4,037 2000 87,846 632 31,677 1,409 12,753 4,583 2001 88,900 657 29,966 1,645 12,793 4,748 1993-2001 % Change 20.45% 25.62% 8.94% 110.09% 37.80% 53.36%
Energy use – and in particular fuel use – is a major price factor in the production of cement. Because of this, companies in all three countries have invested in energy efficiency measures, such as converting wet kilns to dry kilns, or to adding precalciners and predryers to their cement production process, a more efficient process in terms of fuel use. Despite these investments, electric and total energy consumption per unit of output appears to have risen slightly in the US over the past decade. In contrast, the Canadian and Mexican cement industries appear to be more efficient and in general energy efficiency has increased (i.e. energy use per unit of output decreased) over the last decade. In Canada, a number of newer plants have come on-line since the early 1990s in part in response to the increased US demand. The Mexican plants tend to be newer, “dry” process facilities and most have preheaters and/or precalcinators as well. Still, efficiency gains in the early 1990s have not continued at the same pace, and in fact, in recent years there has been a slight decline in energy efficiency, in part because of the shift toward petroleum coke.
Energy Use in the Cement Industry in North America: Emissions, Waste Generation and Pollution Control
c
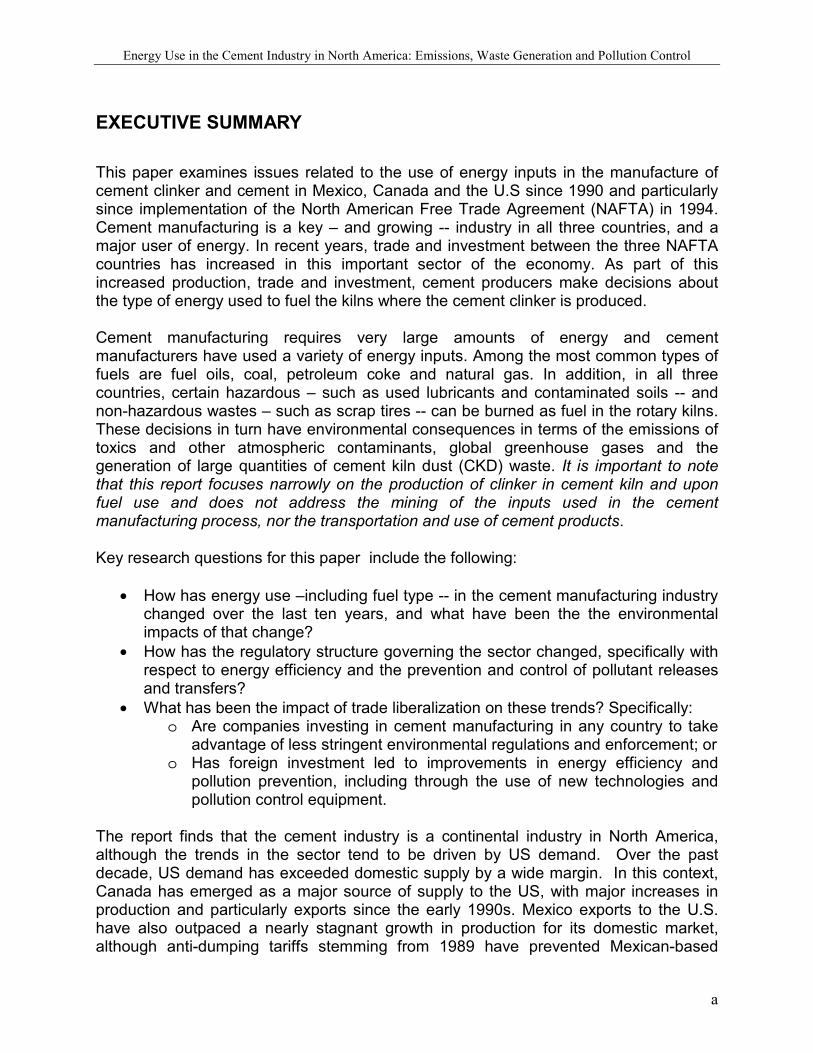
Table B. Total Energy Intensity in Cement Manufacturing Process, NAFTA Countries, 1990 –2001 Year U.S. Energy
Consumption (TJs) (1)
Estimated Energy Efficiency (TJs per Thousnd Metric Tonne)
Mexican Energy Consumption (TJs) (2)
Mexican Estimated Energy Efficiency (TJs per Thousand Metric Tonne)
Canadian Energy Consumption (TJs)
Canadian Estimated Energy Efficiency (TJs per Thousand Metric Tonne)
1990 303,647 5.06 100,532 4.22 58,909 5.32 1991 326,564 5.65 104,872 4.18 50,985 5.40 1992 310,868 5.10 112,643 4.19 51,485 5.99 1993 353,715 5.26 110,856 4.03 53,215 5.73 1994 362,259 5.30 107,554 3.58 53,311 5.29 1995 388,889 5.69 91,593 3.82 61,005 5.76 1996 387,138 5.39 98,452 3.88 58,997 5.27 1997 391,115 5.24 96,609 3.51 57,746 4.90 1998 408,526 5.34 105,235 3.79 63,752 5.24 1999 436,768 5.63 96,890 3.29 67,013 5.30 2000 440,348 5.54 118,284 3.73 64,043 5.02 2001 426,301 5.36 116,164 3.88 NA NA 1990-2001% Change(3) 40.39% 5.93% 15.55% -8.06% 8.72% -5.64% 1993-2001% Change(3) 20.52% 1.90% 4.79% -3.72 20.35% -12.39% Notes:
1) U.S. 1990-1992 totals do not include alternative fuels and are therefore likely slightly undercounted.
2) Similarly, to account for use of alternative fuels in total for Mexico, between one and two percent were added to Mexican totals between 1994 and 2001, based upon data provided by the Mexican Cement Association. While some alternative fuels were in use in Mexico since 1991, the amounts were less than one percent of total energy consumption.
3) Canadian data only through the year 2000.
In all three countries, the use of fuels has changed significantly over the last five to ten years. In the U.S., there has been a general shift toward coal, petroleum coke and alternative wastes such as liquid and solid hazardous wastes, and a lessening dependence upon natural gas to fuel the cement making process. As in the U.S., kilns in Mexico have been shifting their use of fuels, in this case from an almost universal reliance on fuel oils to fuel oils, petroleum coke and alternative fuels. Interestingly, this new reliance on hazardous wastes has continued at the same time as Mexico has become a signatory to the Stockholm Convention, calling for the control and phase-out of the production of dioxins and furans. In Canada, there has been less of shift in terms of the type of fuel used, although there has been a decrease in the use of natural gas and an increase in the use of coal. This shift may reflect the changing price of natural gas rather than a major change in fuel use.
Energy Use in the Cement Industry in North America: Emissions, Waste Generation and Pollution Control
d
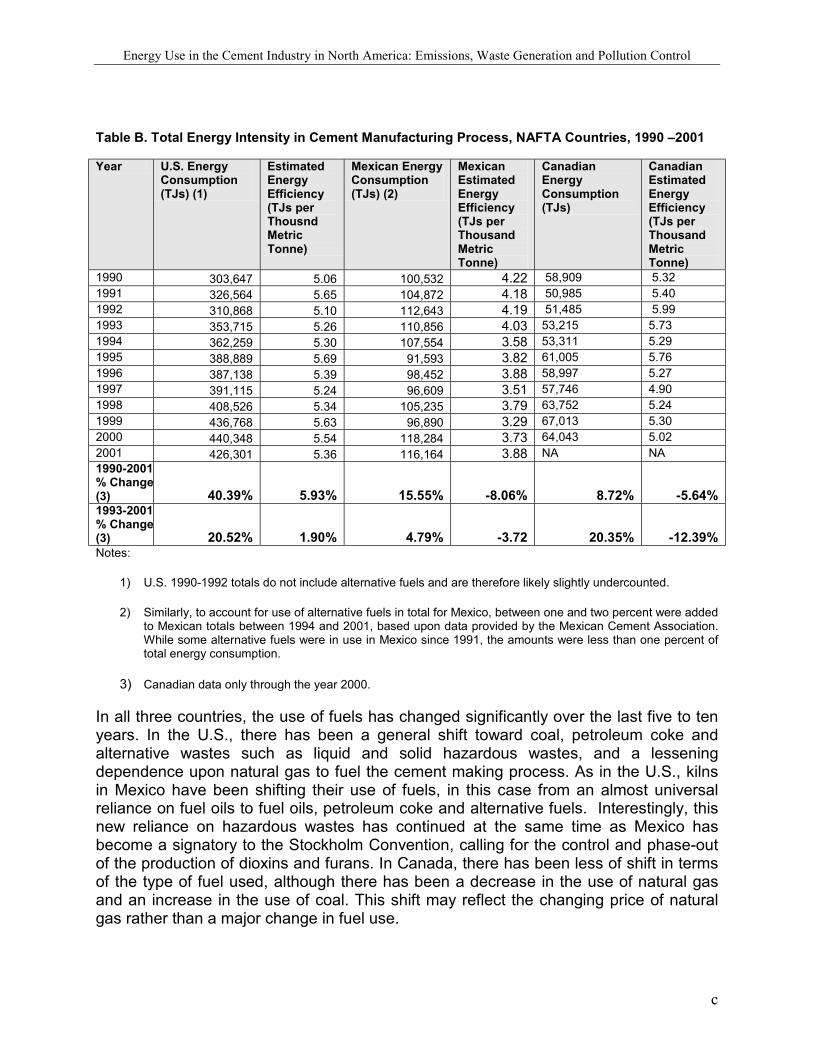
The volume of ‘alternative’ fuels (tires, solid hazardous waste and liquid hazardous and non-hazardous wastes) used by the cement sector is increasing in all three countries, although it still makes up a relatively small percentage of total waste. In the US and Mexico the industry has emerged as a major manager of hazardous wastes. This has not, however, been the case in Canada where emphasis has been on the use of tires and non-hazardous wastes, including wood waste, as alternative fuels. Cement facilities burning hazardous wastes as fuels in Canada continue to be approved and regulated as hazardous waste disposal facilities despite opposition from the industry.
Table C. Percentage of Total Fuel Use by Type in NAFTA Countries and total Energy Consumption in Terajoules, 1994 - 2000 Fuel Type 1994 U.S. 2000 U.S. 1994 Mexico 2000 Mexico 1994 Canada 2000
Canada Coal 84.88% 67.24% 0.00% 0.00% 46.94% 53.21% Coke from Coal Not Reported 2.86% 0.00% 0.00% 0.55% 1.61% Petroleum Coke Not Reported 10.78% 0.00% 22.33% 14.64% 14.56% Fuel Oils 0.55% 1.15% 87.27% 67.55% 3.50% 3.91% Natural Gas 6.91% 2.96% 11.19% 7.63% 25.34% 21.00% Tires
1.07% 2.74% 0.27% 0.72% Not Reported Not Reported
Other Solid Waste 0.39% 4.38% 0.06% 0.20% Not Reported
Not Reported
Liquid Waste 6.20% 7.90% 1.20% 1.56% Not Reported
Not Reported
Total Alternative Fuels 7.66% 15.02% 1.54% 2.48% 9.02% 5.70% Total TJs 362,258 440,348 93,991 104,380 49,010 56,737 Note: Does not include electricity.
Air emissions are determined both by the type of fuel burned as well as the types of pollution control equipment used by cement manufacturers. In all three countries, data on emissions is somewhat limited and is often based upon emission factors rather than direct measurement. Cement manufacturing – by its very nature – leads to carbon dioxide (greenhouse gas) emissions, both because carbon dioxide is released in the process of turning limestone into clinker, as well as in the combustion of fuels. In the U.S., continued reliance on coal, as well as the sustained use of petroleum coke, as well as of tires, has probably resulted in increased emissions of greenhouse gas emissions, both as a total and on a per tonne basis. Toxic pollution, including dioxins and furans and heavy metals – mainly as a result of the increased use of hazardous wastes as fuels – appears to have also increased since 1993.
Canadian data suggests that there has been a slight decrease in per tonne emissions of carbon dioxide, although preliminary toxic data suggests an increase in toxics. Unfortunately, data on emissions in Mexico is either not available or inaccessible. Nonetheless, emission factors widely used would suggest that the shift from fuel oils to petroleum coke has probably increased greenhouse gas emissions in the sector over the period. Very limited data from Mexico suggests that the small use of hazardous
Energy Use in the Cement Industry in North America: Emissions, Waste Generation and Pollution Control
e
wastes as fuels in the sector has not led to major releases of dioxins and furans or other toxics, but it is important to note that only very limited company testing has been done thus far to measure such emissions.
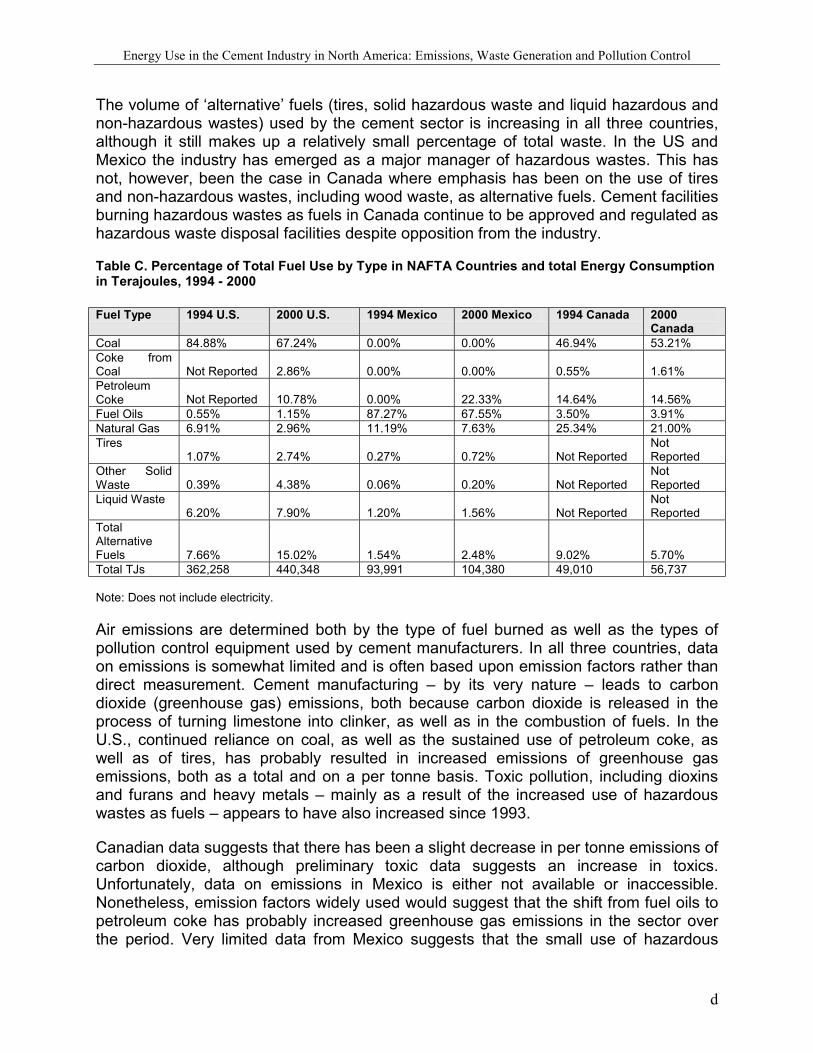
Table D. Carbon Dioxide Emissions due to Fuel Consumption, U.S. and Canadian Cement Industry
Year Thousand Metric Tons of
Carbon Dioxide Emissions due to Fuel Combustion, U.S.
Tons per ton of cement, U.S.
Thousand Metric Tons of Carbon Dioxide Emissions due to Fuel Use, Canada
Tons per ton of cement, Canada
1990 26,599 0.38 3,721 0.34 1991 28,054 0.42 3,191 0.34 1992 26,109 0.38 3,294 0.38 1993 30,007 0.41 3,453 0.37 1994 30,906 0.40 3,604 0.34 1995 32,814 0.43 3,981 0.38 1996 33,717 0.43 3,822 0.35 1997 33,560 0.39 3,720 0.32 1998 34,662 0.41 4,131 0.34 1999 38,263 0.45 4,429 0.35 2000 39,133 0.45 4,195 0.33 2001 37,348 0.42 NA NA 1993-2000% Change
30.4% 2.4% 21.5% (10.8%)
Notes: This table only shows carbon dioxide emissions resulting from fuel combustion. Both the U.S. and Canada use a factor of approximately 0.51 tons of carbon dioxide emissions per ton of cement produced to account for carbon dioxide “process” emissions.
The multipliers used to determine greenhouse gas emissions from fuel combustion vary slightly in Canada and the U.S.
The US and Mexico have recently adopted new, more comprehensive emission standards for cement kilns after years of relatively lax regulation and enforcement. The US applies more comprehensive standards to kilns burning hazardous wastes, while the Mexican standards apply to all kilns regardless of fuel type. Nonetheless, these rules are still being implemented and have yet to be enforced. Still, these regulations are leading to more investment in pollution control equipment, including baghouses, scrubbers and electrostatic precipitators. It is important to note that the standards are significantly less stringent than similar standards for incinerators of hazardous waste. There is also concern that the limited amount of monitoring required, particularly in Mexico, will not gaurantee compliance with the new standards.
In contrast, Canada has no enforceable national emission standards for the sector. National emission guidelines, adopted by the federal government in 1991 only deal with NOx emissions and are not legally enforceable. The CCME adopted guidelines for cement kilns using wastes as fuels in 1996, but again these standards are not legally enforceable. More recent CCME standards for emissions of dioxins and furans and mercury from incinerators have not been applied to cement facilities.
Energy Use in the Cement Industry in North America: Emissions, Waste Generation and Pollution Control
f
In all three countries, there are currently no standards for greenhouse gas emissions, although ratification of the Kyoto Agreement in Canada and Mexico could eventually lead to some standards or goals for the cement industry. In the U.S., action is more likely through voluntary measures taken by cement companies, led by international companies like Lafarge and CEMEX. The lack of a requirement to report greenhouse gas emissions is also problematic, although again major cement companies have pledged to institute a common framework for reporting such emissions.
The report also found that Cement Kiln Dust is the major waste stream produced by the cement manufacturing process. Nevertheless, a lack of data makes it difficult to determine what the trend is in terms of generation and management of this waste stream. Limited data from the U.S. suggests that hazardous waste burning increases the amount and toxicity of this waste, although overall the amount of CKD waste generated has declined as cement kilns put CKD back into the production process. In all three countries, regulations regarding cement kiln dust have gaps. While the U.S. began the process of regulating management of CKD, it appears it will delay final implementation until further study of current management practices, despite major, well-documented environmental problems. Standards in Mexico and Canada are similarly ill-defined or non-existent.
It does not appear that companies are investing in cement manufacturing in any country to take advantage of less stringent environmental regulations and enforcement but rather to gain access to the market. Whether or not new pollution control rules in the U.S. will cause a shift in investment strategy among the three countries is unclear, although the major factors in decisions about fuel use will probably continue to be price and availability, not energy efficiency or environmental cleanliness. It is also unclear whether the burning of hazardous wastes could lead to major shipments of hazardous wastes across international lines for cement kiln incineration, as some have proposed. This report was not able to determine with precision whether the recent investment by Mexican companies in the U.S. or the consolidation of the industry has led to important technology transfer gains in terms of energy efficiency or pollution control, although initial evidence suggests that plants purchased by the Mexican companies have been upgraded in terms of pollution control and energy efficiency. Further study – including direct surveys and examination of company documents -- could help determine with precision whether the consolidation of the cement industry in North America and particularly within the U.S. has led to any such improvements.
The report recommends, however, that given the international nature of the cement industry, that some common guidelines and/or regulations be adopted in all three countries. Recommendations include:
• Cement kilns burning hazardous wastes should be regulated as hazardous waste disposal facilities
• Canada needs to adopt updated enforceable emission standards for kilns burning both conventional fuels and hazardous wastes, as have
Energy Use in the Cement Industry in North America: Emissions, Waste Generation and Pollution Control
g
the US and Mexico.
• Energy efficiency standards and greenhouse emission standards for the cement sector should be adopted in all three countries;
• A continued dialogue about the burning of alternative wastes in
cement kilns with a specific focus on dioxin and furan monitoring and emissions and the control of CKD, with the CEC having an important role in that process.
• The CEC should continue to strengthen its Sound Management of
Chemicals program to emphasize a North American Management Strategy of hazardous wastes and reduction of dioxin and furan emissions.
Energy Use in the Cement Industry in North America: Emissions, Waste Generation and Pollution Control
5
1.0 Introduction This paper examines issues related to the use of energy inputs in the manufacture of cement clinker and cement in Mexico, Canada and the U.S since 1990 and since implementation of the North American Free Trade Agreement (NAFTA) in 1994. Cement manufacturing is a key – and growing -- industry in all three countries, and a major user of energy. In recent years, trade and investment between the three NAFTA countries has increased in this important sector of the economy. As part of this increased production, trade and investment in cement manufacturing, decisions have been made about the type of energy used to fuel the kilns where the cement clinker is produced. Cement manufacturing requires large amounts of energy and cement manufacturers have used a variety of energy inputs. Among the most common types of fuels are fuel oils, coal, petroleum coke and natural gas. In addition, in all three countries, certain hazardous – such as used lubricants and contaminated soils -- and non-hazardous wastes – such as scrap tires -- can be burned as fuel in the rotary. These decisions in turn have environmental consequences in terms of the emissions of toxics and other atmospheric contaminants, global greenhouse gases and the generation of large quantities of cement kiln dust (CKD) waste. Following a discussion of the direct and indirect impacts of NAFTA on the cement industry, the report will focus on the cement manufacturing industry in each of the three countries, including production, imports, exports, energy (and fuel) use, electricity, emissions, generation of waste, and regulatory and technological issues. Conclusions and policy recommendations follow. But first a few caveats. This report does not examine the economics or environmental consequences of the initial mining of limestone, gypsum and other cement inputs, nor does it examine the economic or environmental consequences of other related products like concrete and cement batching plants nor the transport of these products throughout North America. Instead, it focuses narrowly on what happens within the confines of the cement manufacturing process itself, and even more narrowly, within the rotary kilns which turn the raw materials into cement clinker. It is here, however, where key decisions are made about fuel choices, pollution control equipment and waste management – choices which by their very nature have local and potentially worldwide environmental consequences. Key research questions for this paper include the following:
• How has energy use –including fuel type -- in the cement manufacturing industry changed over the last ten years, and what have been the the environmental impacts of that change?
Energy Use in the Cement Industry in North America: Emissions, Waste Generation and Pollution Control
6
• How has the regulatory structure governing the sector changed, specifically with respect to energy efficiency and the prevention and control of pollutant releases and transfers?
• What has been the impact of trade liberalization on these trends? Specifically: o Are companies investing in cement manufacturing in any country to take
advantage of less stringent environmental regulations and enforcement; or o Has foreign investment led to improvements in energy efficiency and
pollution prevention, including through the use of new technologies and pollution control equipment.
How is Cement Produced
Cement is produced through a five-step process:
A) It begins with the extraction of its prime materials, principally limestone (70%), but also other materials like clay, aluminum oxide, iron, shale and silica. B) The materials are ground and stored separately. C) The material is measured to achieve a specific combination, depending upon the type of cement desired, and ground to produce a very fine powder. D) The powder is pumped to silos, where the blend is standardized before being placed in long, rotating kilns, where the material is calcinated at high temperatures (approximately 1,500 degrees centigrade), causing chemical and physical reactions. A new material is formed, which is called pre-cement or more commonly clinker, which are composed of small balls about the size of a nut. E) Finally, the clinker is ground up, combined with calcium sulfate – usually gypsum -- and other materials and packaged. When this product -- cement -- is mixed with sand, stone, other materials and water, concrete is produced.
The calcination process, turning the limestone into clinker in the kiln, is the fundamental step described above. This process requires a substantial amount of energy, provided by the burning of fuels, which are injected at the opposite end of the kiln, and it represents the major economic cost in cement production.
Energy Use in the Cement Industry in North America: Emissions, Waste Generation and Pollution Control
7
2.0 NAFTA and Cement: A Connection?
2.1 Introduction
This section briefly reviews the connection between NAFTA and the North American cement industry. The North American Free Trade Agreement is a treaty designed to open trade and investment – though not completely -- between Mexico, the United States and Canada. Although it called for the immediate elimination of tariffs on some products, NAFTA has served as a system to gradually reduce tariffs over time – usually 10 to 15 years – while providing investment protection and mechanisms to resolve trade and investment disputes. In terms of cement and clinker production, NAFTA has eliminated tariffs nearly completely on most cement and clinker, while also providing increased protection to foreign investors.
Nevertheless, because of an ongoing dispute between the U.S. and Mexico over prices of cement produced in Mexico, since 1989 the U.S. Commerce Department has continued to assess “anti-dumping” tariffs on Mexican portland cement and clinker through an annual assessment – first through pre-NAFTA mechanisms and currently through Chapter 19 of NAFTA. Moreover, as cement producers have increasingly turned to hazardous waste as a fuel source, certain provisions of NAFTA potentially impact this practice. Finally, the creation of the North American Commission on Environmental Cooperation has served to focus international attention upon certain chemicals which can be produced by the cement industry, including emissions of dioxins and furans.
2.2 Disappearing Tariffs
Provisions within NAFTA have served to gradually reduce tariffs over time and to carefully regulate trade between the three countries. In many cases, the elimination of tariffs takes up to 15 years to complete. Five years after NAFTA, 76.2% of Mexico's exports to the United States and 66.2% of Mexico's imports from the United States crossed the border without tariffs. Most of this trade involved the import of inputs for the maquiladora export sector and the export of its maquiladora-made products to the United States. Cement products, on the other hand, were largely exempt from tariffs when NAFTA went into effect on January 1, 1994. Thus, under Annex 302.2, “Tariff Elimination”, with the exception of white cement, both the U.S and Canada had placed most cement products in the Duty-Free Category D (NAFTA, Annex 302.2) 1(e). White cement had a relatively small tariff of 22 cents per ton in the U.S. and 54.25 cents in Canada. Mexico did have a 10 percent duty on most cement products and placed cement in category B, such that all goods were made duty-free on January 1, 1998. Thus, at the signing of

Energy Use in the Cement Industry in North America: Emissions, Waste Generation and Pollution Control
8
NAFTA, most cement products already could be traded freely among the three countries with minimal tariffs, and even those were scheduled to be phased out by 1998 (NAFTA, Annex 302.2, Schedule of Canada, Schedule of Mexico, Schedule of U.S). Currently, for example, in theory, all countries – including Mexico and Canada -- enjoying “Normal Trade Relations” with the U.S. can export clinkers and finished cement duty-free and even exports from countries with non-NTR status can export cement clinker with only a duty of $1.32 per ton.1
Nonetheless, the reality is that since 1989 Mexico has not been able to enjoy these low or nonexistent duties because the U.S. has been applying anti-dumping tariffs against Mexican grey portland cement and clinker under the Tariff Act of 1930.
In 1989, motivated by growing imports from CEMEX, a group of southern U.S. producers –many of them actually owned by foreign companies – petitioned the U.S. government under the Tariff Act of 1930 to impose anti-dumping2 tariffs against Mexican grey portland cement and clinker. In that year, the number of cement plants in the U.S. had been decreasing, as had sales and income.3 For example, in 1989, the U.S. imported nearly 15 million metric tons of clinker and cement, and Mexico accounted for about a third of total imports, and about half of the total going to the Southern States -- $124 million in all -- came from CEMEX. While imports remained steady or declined in the late 1980s, Mexican exports increased by 22 percent between 1986 and 1989. Data used in the petition showed that Mexican cement was selling for significantly less than domestically-produced cement even though in most cases they had to transport the cement several hundred miles. Transportation of cement and clinker is extremely expensive, averaging at that time $9.86 per ton within 100 miles, but almost three times that amount for cement shipped more than 500 miles. Despite these high transportation costs, a review of prices over 24 months in the case revealed that Mexican cement undersold the domestic product in all 24 months between 7.2 to 18 percent. In 1990, the Department of Commerce found that the Mexican cement was being sold at dumping margins ranging from 3.69 to 57.96 percent and U.S. Customs began imposing an anti-dumping deposit of 43 percent. In 1990, the Department of Commerce found that the Mexican cement was being sold at dumping margins ranging from 3.69 to 57.96 percent and U.S. Customs began imposing an anti-dumping deposit of 43 percent.
In response, Mexico brought the issue to the GATT Committee on Antidumping Practices and 1992 the Committee determined that the duties were inconsistent with GATT Articles 1 -- guaranteeing most favored nation status -- and 5:1 -- because the U.S. had not established prior to the initiation that the petition was on behalf of all or most of the producers in the region. Rather than going through a lengthy process to revoke the standard, the U.S and Mexico agreed to try and resolve the dispute (see
1 U.S. International Trade Commission, 2003 Tariff Database, HTS Number 25231000. 2 “Dumping” occurs when: A company exports its goods at a price below the sales price in its own country; A company exports its goods at a price lower than the cost of production. 3 Much of the information for this section is from Robert Cook “Cement Exports from Mexico,” TED (Trade and Environment) Case Studies: An Online Journal, American University, (Vol. 3, No. 2, June 1994), available at www.american.edu/TED/CEMEX.HTM.
Energy Use in the Cement Industry in North America: Emissions, Waste Generation and Pollution Control
9
next section). In the meantime, under U.S. law, each year an administrative review of the antidumping duty order must be conducted. During the third such review, the Department of Commerce found that CEMEX was continuing to dump into the U.S. and increased the antidumping duty deposit from 43 to 62 percent. The latest – the tenth administrative review – resulted in an anti-dumping duty of 48.53% (GCC, Annual Report 2001).
2.3 Investor Protections and Disputes
Although NAFTA serves principally to facilitate commercial exchange between the three countries, it also promotes foreign direct investment in the region. According to four of the Agreement’s objectives, NAFTA seeks to:
• Promote conditions of fair competition in the free trade area;
• Increase substantially investment opportunities in the territories of the Parties;
• Provide adequate and effective protection and enforcement of intellectual property rights in each Party’s territory: and
• Create effective procedures for the implementation and application of this Agreement, for joint administration and for the resolution of disputes.
These provisions offer much more explicit protection of foreign investment, including Chapter 11 of NAFTA, a dispute resolution mechanism which has been controversial. The provision allows foreign companies to seek compensation if a government either expropriates its investments or takes actions that could be tantamount to expropriation. Thus far, no cases have directly involved either cement manufacturing, mining or disposition of cement kiln wastes. NAFTA’s Chapter 19 specifically deals with disputes over anti-dumping tariffs or export subsidies (so called Antidumping and Countervailing Duty (AD/CVD) disputes). The litigants are typically both the importer or exporter concerned with anti-dumping duties as well as their governmental authorities. The provision allows for a binational panel of experts to review any domestic law or provision leading to such duties, and the panel must make a decision within 315 days. Once a decision is reached, Chapter 19 allows a party to initiate an “extraordinary challenge” alleging gross misconduct by the panel. Mexico began seeking settlement through NAFTA on the anti-dumping duties on cement as far back as 1994. The case took several years to make its way through the NAFTA Chapter 19 process as rules were still being implemented at the federal level. Finally, on June 18,1999, a binational panel ruled against certain aspects of the antidumping determination by the U.S. Department of Commerce. In response, the U.S. requested an Extraordinary Challenge Committee (ECC) in 2000, a move also supported by the Southern Tier Cement Committee (STCC), an ad-hoc groups of 27
Energy Use in the Cement Industry in North America: Emissions, Waste Generation and Pollution Control
10
cement producers, after continued inaction.4 However, the case is currently stalled. Thus, while NAFTA has served to provide a mechanism to review the tariffs, due to inaction from both parties, and continued legal challenges, the dispute is still ongoing and has not been resolved to the satisfaction of either party. In the meantime, the U.S. continues to require duty deposits on Mexican cement and clinker, both from CEMEX and other companies. These duties effectively limit the imports of Mexican cement into the U.S., while at the same time NAFTA has encouraged capital investment flows into the U.S..
2.4 Hazardous Waste, Cement and NAFTA
Because cement manufacturers in all three countries have begun using alternative fuels – including solid and liquid hazardous wastes and tires – to provide fuel to their kilns, provisions in NAFTA regarding waste could potentially influence cement manufacturer decisions about fuel use. A key question for this section is whether a country could prohibit the export or import of wastes designed to be used for fuel in cement kilns.
First of all, NAFTA assumes the free flow of goods, including wastes. Chapter 3 of the NAFTA sets out requirements for the “national treatment” of goods. Article 309 specifically provides:
“1.Except as otherwise provided in this agreement, no party may adopt or maintain any prohibition or restriction on the importation of any good of another Party -- except in accordance with Art. XI of the GATT.”
Article 415 of the NAFTA defines good to include “waste and scrap derived from (I) production in the territory of one or more of the Parties.” Therefore hazardous wastes and tires are likely to be considered a good for the purposes of the Agreement, and the right of Parties to prohibit or restrict their import -- or for that matter their export -- may therefore be limited. Article XI of the GATT does, however, permit countries to impose restrictions or bans on imports of goods, via article XX, where such measures are “necessary to protect human, animal or plant life or health.” The term “necessary” has been interpreted to mean that the country maintaining the ban must show: (1) there is no reasonable available alternative measure consistent with the GATT to achieve the desired end and (2) the measure taken is the least trade restrictive measure available. Thus, by incorporating Article XI, NAFTA allows countries to ban or restrict exports and imports of hazardous wastes only to the extent that they can show there is no alternative and that it is the least restrictive trade measure.
4 Cement America, ‘U.S. Cement Producers allege Government Inaction Violates Constitutional Rights,” Mar 1, 2002.
Energy Use in the Cement Industry in North America: Emissions, Waste Generation and Pollution Control
11
NAFTA declares that major multilateral conventions on hazardous waste disposal, as well as bilateral agreement on hazardous waste shipments and disposal take precedence over NAFTA itself. Specifically, Article 104 provides that:
In the event of any inconsistency between this agreement (NAFTA) and the specific trade obligations set out in: (c) the Basel Convention on the Transboundary Movement of Hazardous Wastes, on its entry into force for Canada, Mexico and the US, such obligations shall prevail to the extent of the inconsistency, provided that where a party has a choice among equally effective and reasonably available means of complying with such obligations, the Party choose the alternative that is least inconsistent with the other provisions of (NAFTA). (d) the agreements set out in Annex 104.1 (these are the 1986 U.S. Canada Agreement on Transboundary Movement of Hazardous Waste and the 1983 U.S.-Mexico Agreement on Cooperation for the Protection and Improvement of the Environment in the Border Area (the La Paz Agreement )
Article 4 of the Basel convention permits countries to ban or restrict imports of hazardous waste if they have reason to believe that the wastes will not be managed in an “environmentally sound manner.” While both Canada and Mexico have ratified the Basel convention, the U.S. has not, making the two binational agreements currently more relevant to NAFTA. Both of these agreements establish the mechanisms for imports and exports between the countries. Of particular importance is Annex III of the La Paz agreement, which states that as long as applicable hazardous waste regulations are met, either country must accept the return of hazardous waste generated by production from raw materials that were imported under a temporary import regime. In practice, this requirement, along with Mexican regulations adopted under federal law, has meant that most maquiladoras are required to send their hazardous wastes back to the U.S. Mexico does import a significant amount of waste from the U.S. Under Mexican law, however, Mexico only allows the import of hazardous wastes from the United States for “recycling”, which thus far has conisted mainly of recycling lead batteries and extracting metals from electric arc furnace dust. Between 1995 and 1999, hazardous waste imports from U.S. companies grew from 160,000 to 255,000 tons5. Where have these imports been going? Apparently to recycling facilities. Since 1994, there has been a tremendous growth in hazardous waste facilities authorized in Mexico, particularly in terms of recycling facilities, which includes metal recycling, solvent recycling and “energy” recycling such as that practiced in cement kilns. According to the most recent data available, Mexican officials have not authorized imports for fuel blending or energy recovery. Nonetheless, because the use of wastes in cement kilns is sometimes defined as disposal and sometimes as “energy recycling” it is unclear whether wastes in the future could be imported for burning in cement kilns in Mexico. Some waste sent from Mexico to the U.S. does go to fuel blenders and ends up in cement kilns in the U.S.
5 Ibid.
Energy Use in the Cement Industry in North America: Emissions, Waste Generation and Pollution Control
12
2.5 Environmental Side Agreement, the CEC and Cement
The North American Agreement for Environmental Cooperation (NAAEC), sometimes referred to as the Environmental Side-Agreement to the NAFTA, came into effect at the same time as NAFTA. Articles 5,6,7, 10(4), 12 (2) collectively impose obligations on parties to effectively enforce laws; to pursue avenues of cooperation to this end; to effect specified private enforcement rights and opportunities; and to provide an annual public report on the enforcement of environmental laws. The Agreement also provided for the creation of the North American Commission for Environmental Cooperation (CEC). Articles 14 and 15 of the NAAEC establish a mechanism through which any resident of a NAFTA country may file a submission that assert that a NAFTA country “is failing to effectively enforce its environmental law.” To date, no cases involving cement manufacturing or burning of waste in cement kilns have been brought by citizens through this process. In 1995, the CEC initiated a program through its Pollutants and Health Program known as the Sound Management of Chemicals (SMOC) Project. Through this project, the three governments have committed to assessing and then taking steps to reduce the production of and exposure to organic pollutants such as dioxins and furans, PCBs and mercury. This is accomplished through North American Regional Action Plans, or NARAPs.. In 1999, the Council authorized development of a NARAP for dioxins and furans. In the decision document leading up to the decision, part of the rationale for choosing both dioxins and furans are both their persistence in the environment, and how easily they can be transported thousands of miles, and thus a regional approach is needed. The decision document made the recommendation to identify technological changes that can be made in industrial sectors to reduce dioxins and furans, as well as to identify control strategies and develop measures -- potentially including regulations as well as voluntary measures -- that could lead to reductions (North American Working Group for Sound Management of Chemicals 1999: 8). Because cement kilns can be major emission sources of such chemicals, in theory the CEC focus on these substances could eventually lead to new regulations or voluntary measures for the cement industry. Nevertheless, thus far a NARAP for dioxins and furans has not been developed. In addition to a NARAP for dioxins and furans, in 1999 the CEC Council passed a resolution to develop a NARAP on Environmental Monitoring and Assessment, which was completed in June of 2002. If successfully implemented, the NARAP on Environmental Monitoring and Assessment will lead to improved identification of risks from chemicals like dioxins and furans and the development of a more extensive monitoring network for environmental contaminants (CEC 2002).
Energy Use in the Cement Industry in North America: Emissions, Waste Generation and Pollution Control
13
3.0 The U.S. Cement Industry
3.1. Introduction
This section provides an overview of trends in production, exports, energy sources and usage and pollutant releases by the cement industry located in the U.S., the use of waste fuels and management of cement kiln dust as well as providing an overview of the regulatory regime in U.S. regarding emissions and waste management.
3.2 An Overview of Trends in Production, Exports, Energy Sources and Pollutant Releases.
3.2.1 Cement and Clinker Production and Consumption, 1990 - 2001
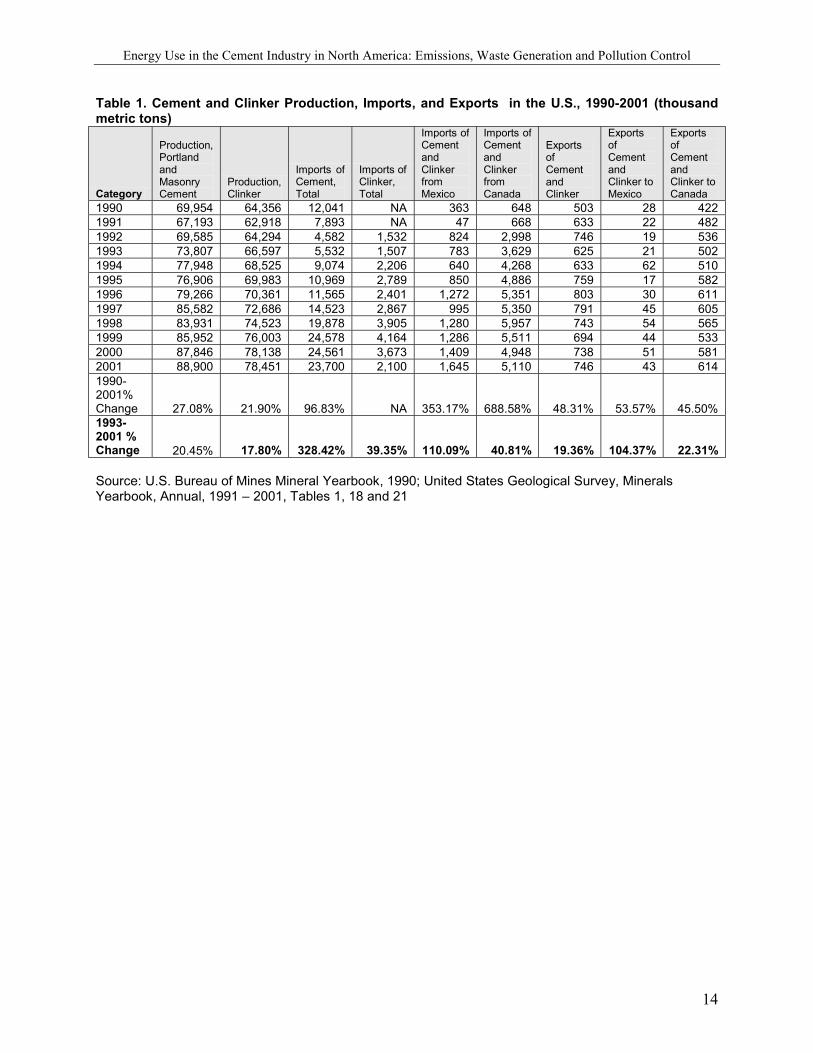
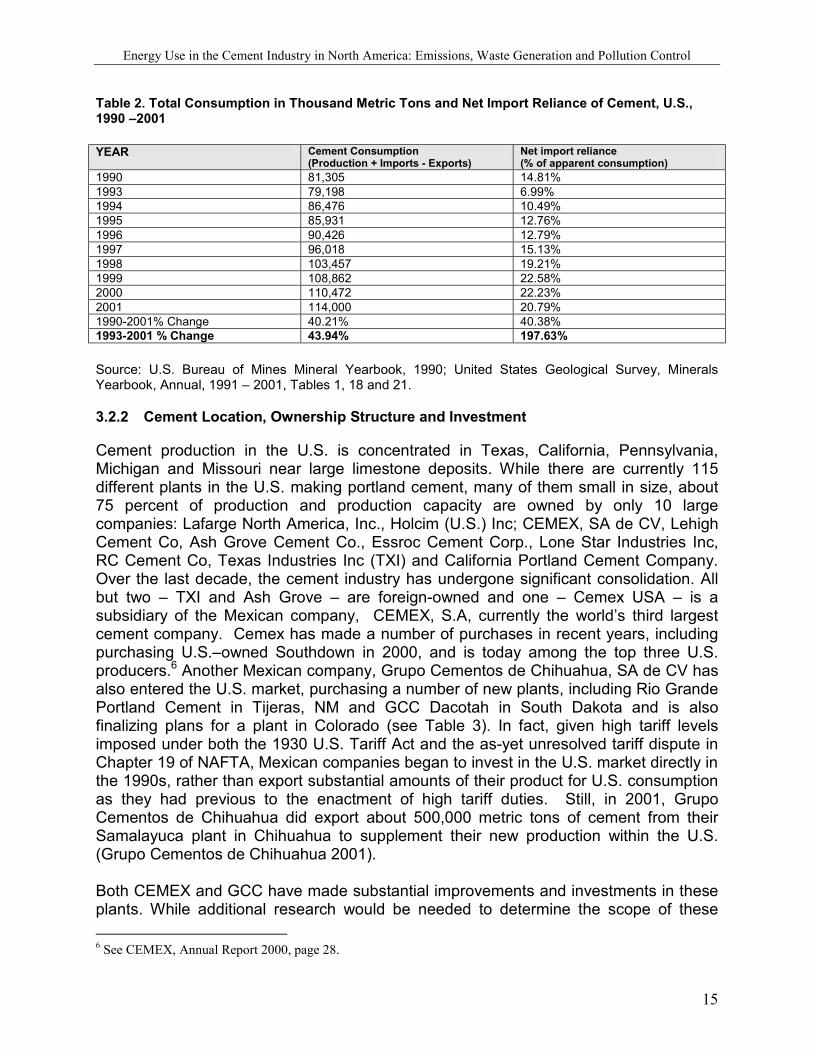
Tables 1 and 2 provide information on cement production, imports, exports and consumption over the last decade. Currently, the U.S. produces more cement than any country except for China and India. Production of cement and its main intermediate product – cement clinker – has risen steadily over the last decade through two minor recessions, indicating that the sector is less cyclical in nature than other manufacturing sectors. Consumption increased even more than production (40% vs. 27%), as the U.S. imported more cement to meet growing internal demand. Imports seem to have steadied in recent years, making up approximately 20 percent of apparent consumption. A significant amount of clinker and finished cement comes from Mexico and Canada. For example, between 1993 and 2001, the quantity of imports from Mexico increased more than 110 percent, while imports from Canada increased by some 40 percent. While the percentage increase was higher from Mexico, the actual amount of cement imported was significantly greater from Canada. In fact, currently the U.S. imports more cement and clinker from Canada than from any other country, although countries like Thailand and Korea are close behind. As the previous section noted, if not for anti-dumping tariffs placed on cement products from Mexico, it could be argued that Mexican cement would have replaced some of the Asian producers, particularly in Southern California. For example, in 1989, when significant import anti-dumping tariffs were imposed, there were more than 4 million metric tons of cement and cement clinker imported from Mexico. As Table 1 shows by the following year, imports had been reduced to a trickle. Despite the high transport cost, the U.S. also imported significant amounts of cement from other non-NAFTA countries, mainly from Asia, including cement from countries like Thailand, Korea and China. Not surprisingly, the cement imported from Canada flows to the Seattle, Detroit, Buffalo and Cleveland areas, a fact that was true in both 1993 and 2001, while cement from Mexico is imported through Nogales, Arizona, El Paso and Laredo, Texas. Interestingly, in the early 1990s, Los Angeles was a key importing area, while today there are virtually no imports of Mexican cement to California, which is dominated by imports from Asia. The rise in imports particularly in El Paso and Arizona is probably due to the emergence of a network of Mexican-owned cement importers, concrete batch plants and cement manufacturers in the U.S. Southwest (see following sections).
Energy Use in the Cement Industry in North America: Emissions, Waste Generation and Pollution Control
14
Table 1. Cement and Clinker Production, Imports, and Exports in the U.S., 1990-2001 (thousand metric tons)
Category
Production, Portland and Masonry Cement
Production, Clinker
Imports of Cement, Total
Imports of Clinker, Total
Imports of Cement and Clinker from Mexico
Imports of Cement and Clinker from Canada
Exports of Cement and Clinker
Exports of Cement and Clinker to Mexico
Exports of Cement and Clinker to Canada
1990 69,954 64,356 12,041 NA 363 648 503 28 422 1991 67,193 62,918 7,893 NA 47 668 633 22 482 1992 69,585 64,294 4,582 1,532 824 2,998 746 19 536 1993 73,807 66,597 5,532 1,507 783 3,629 625 21 502 1994 77,948 68,525 9,074 2,206 640 4,268 633 62 510 1995 76,906 69,983 10,969 2,789 850 4,886 759 17 582 1996 79,266 70,361 11,565 2,401 1,272 5,351 803 30 611 1997 85,582 72,686 14,523 2,867 995 5,350 791 45 605 1998 83,931 74,523 19,878 3,905 1,280 5,957 743 54 565 1999 85,952 76,003 24,578 4,164 1,286 5,511 694 44 533 2000 87,846 78,138 24,561 3,673 1,409 4,948 738 51 581 2001 88,900 78,451 23,700 2,100 1,645 5,110 746 43 614 1990-2001% Change 27.08% 21.90% 96.83% NA 353.17% 688.58% 48.31% 53.57% 45.50% 1993- 2001 % Change 20.45% 17.80% 328.42% 39.35% 110.09% 40.81% 19.36% 104.37% 22.31% Source: U.S. Bureau of Mines Mineral Yearbook, 1990; United States Geological Survey, Minerals Yearbook, Annual, 1991 – 2001, Tables 1, 18 and 21
Energy Use in the Cement Industry in North America: Emissions, Waste Generation and Pollution Control
15
Table 2. Total Consumption in Thousand Metric Tons and Net Import Reliance of Cement, U.S., 1990 –2001 YEAR Cement Consumption
(Production + Imports - Exports) Net import reliance (% of apparent consumption)
1990 81,305 14.81% 1993 79,198 6.99% 1994 86,476 10.49% 1995 85,931 12.76% 1996 90,426 12.79% 1997 96,018 15.13% 1998 103,457 19.21% 1999 108,862 22.58% 2000 110,472 22.23% 2001 114,000 20.79% 1990-2001% Change 40.21% 40.38% 1993-2001 % Change 43.94% 197.63% Source: U.S. Bureau of Mines Mineral Yearbook, 1990; United States Geological Survey, Minerals Yearbook, Annual, 1991 – 2001, Tables 1, 18 and 21.
3.2.2 Cement Location, Ownership Structure and Investment
Cement production in the U.S. is concentrated in Texas, California, Pennsylvania, Michigan and Missouri near large limestone deposits. While there are currently 115 different plants in the U.S. making portland cement, many of them small in size, about 75 percent of production and production capacity are owned by only 10 large companies: Lafarge North America, Inc., Holcim (U.S.) Inc; CEMEX, SA de CV, Lehigh Cement Co, Ash Grove Cement Co., Essroc Cement Corp., Lone Star Industries Inc, RC Cement Co, Texas Industries Inc (TXI) and California Portland Cement Company. Over the last decade, the cement industry has undergone significant consolidation. All but two – TXI and Ash Grove – are foreign-owned and one – Cemex USA – is a subsidiary of the Mexican company, CEMEX, S.A, currently the world’s third largest cement company. Cemex has made a number of purchases in recent years, including purchasing U.S.–owned Southdown in 2000, and is today among the top three U.S. producers.6 Another Mexican company, Grupo Cementos de Chihuahua, SA de CV has also entered the U.S. market, purchasing a number of new plants, including Rio Grande Portland Cement in Tijeras, NM and GCC Dacotah in South Dakota and is also finalizing plans for a plant in Colorado (see Table 3). In fact, given high tariff levels imposed under both the 1930 U.S. Tariff Act and the as-yet unresolved tariff dispute in Chapter 19 of NAFTA, Mexican companies began to invest in the U.S. market directly in the 1990s, rather than export substantial amounts of their product for U.S. consumption as they had previous to the enactment of high tariff duties. Still, in 2001, Grupo Cementos de Chihuahua did export about 500,000 metric tons of cement from their Samalayuca plant in Chihuahua to supplement their new production within the U.S. (Grupo Cementos de Chihuahua 2001). Both CEMEX and GCC have made substantial improvements and investments in these plants. While additional research would be needed to determine the scope of these 6 See CEMEX, Annual Report 2000, page 28.
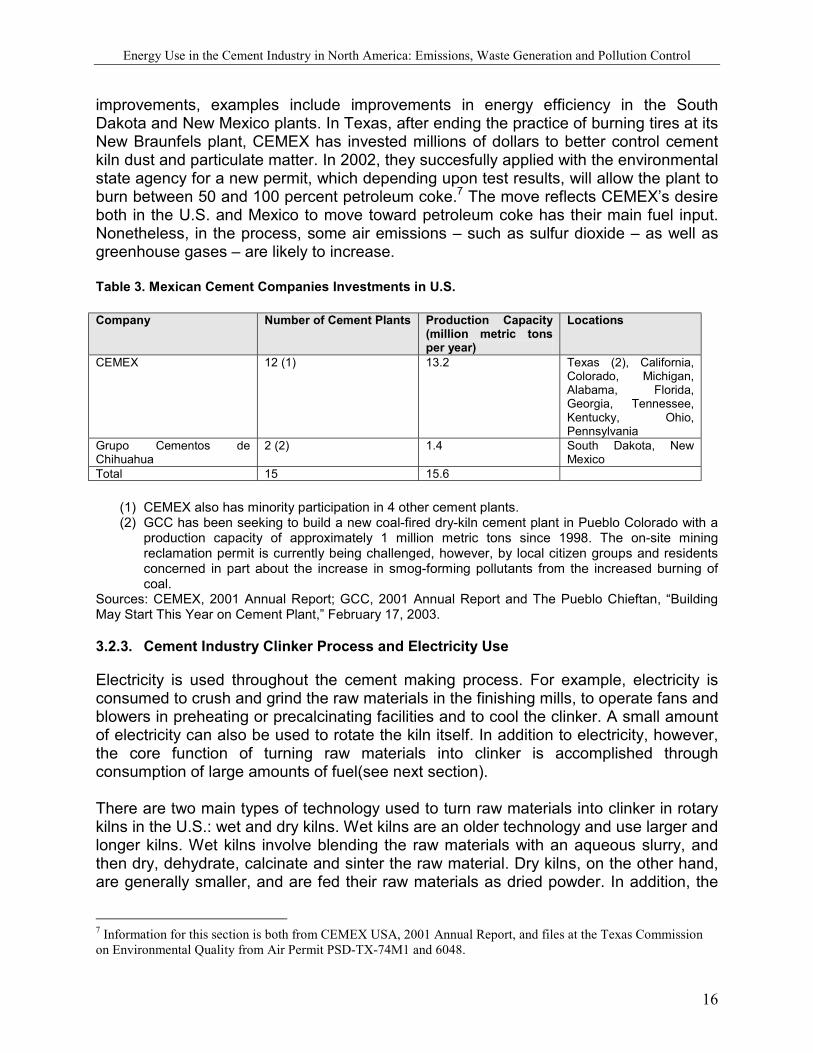
Energy Use in the Cement Industry in North America: Emissions, Waste Generation and Pollution Control
16
improvements, examples include improvements in energy efficiency in the South Dakota and New Mexico plants. In Texas, after ending the practice of burning tires at its New Braunfels plant, CEMEX has invested millions of dollars to better control cement kiln dust and particulate matter. In 2002, they succesfully applied with the environmental state agency for a new permit, which depending upon test results, will allow the plant to burn between 50 and 100 percent petroleum coke.7 The move reflects CEMEX’s desire both in the U.S. and Mexico to move toward petroleum coke has their main fuel input. Nonetheless, in the process, some air emissions – such as sulfur dioxide – as well as greenhouse gases – are likely to increase. Table 3. Mexican Cement Companies Investments in U.S. Company Number of Cement Plants Production Capacity
(million metric tons per year)
Locations
CEMEX 12 (1) 13.2 Texas (2), California, Colorado, Michigan, Alabama, Florida, Georgia, Tennessee, Kentucky, Ohio, Pennsylvania
Grupo Cementos de Chihuahua
2 (2) 1.4 South Dakota, New Mexico
Total 15 15.6
(1) CEMEX also has minority participation in 4 other cement plants. (2) GCC has been seeking to build a new coal-fired dry-kiln cement plant in Pueblo Colorado with a
production capacity of approximately 1 million metric tons since 1998. The on-site mining reclamation permit is currently being challenged, however, by local citizen groups and residents concerned in part about the increase in smog-forming pollutants from the increased burning of coal.
Sources: CEMEX, 2001 Annual Report; GCC, 2001 Annual Report and The Pueblo Chieftan, “Building May Start This Year on Cement Plant,” February 17, 2003.
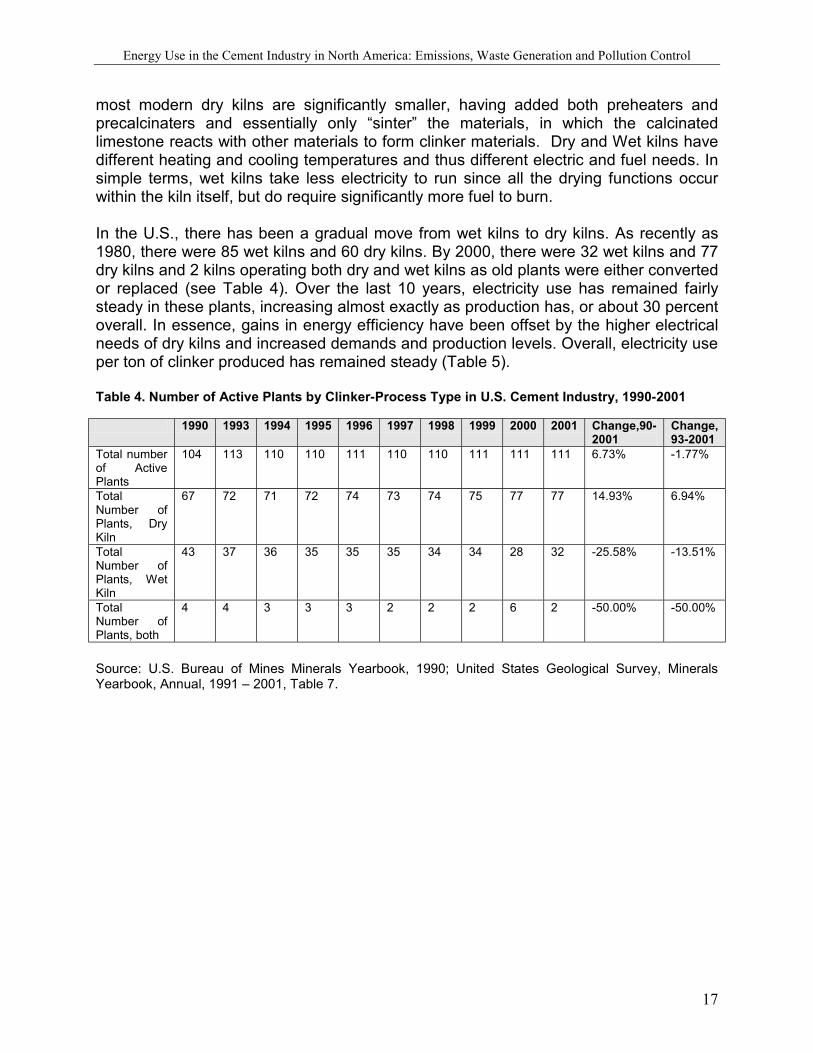
3.2.3. Cement Industry Clinker Process and Electricity Use
Electricity is used throughout the cement making process. For example, electricity is consumed to crush and grind the raw materials in the finishing mills, to operate fans and blowers in preheating or precalcinating facilities and to cool the clinker. A small amount of electricity can also be used to rotate the kiln itself. In addition to electricity, however, the core function of turning raw materials into clinker is accomplished through consumption of large amounts of fuel(see next section). There are two main types of technology used to turn raw materials into clinker in rotary kilns in the U.S.: wet and dry kilns. Wet kilns are an older technology and use larger and longer kilns. Wet kilns involve blending the raw materials with an aqueous slurry, and then dry, dehydrate, calcinate and sinter the raw material. Dry kilns, on the other hand, are generally smaller, and are fed their raw materials as dried powder. In addition, the
7 Information for this section is both from CEMEX USA, 2001 Annual Report, and files at the Texas Commission on Environmental Quality from Air Permit PSD-TX-74M1 and 6048.
Energy Use in the Cement Industry in North America: Emissions, Waste Generation and Pollution Control
17
most modern dry kilns are significantly smaller, having added both preheaters and precalcinaters and essentially only “sinter” the materials, in which the calcinated limestone reacts with other materials to form clinker materials. Dry and Wet kilns have different heating and cooling temperatures and thus different electric and fuel needs. In simple terms, wet kilns take less electricity to run since all the drying functions occur within the kiln itself, but do require significantly more fuel to burn. In the U.S., there has been a gradual move from wet kilns to dry kilns. As recently as 1980, there were 85 wet kilns and 60 dry kilns. By 2000, there were 32 wet kilns and 77 dry kilns and 2 kilns operating both dry and wet kilns as old plants were either converted or replaced (see Table 4). Over the last 10 years, electricity use has remained fairly steady in these plants, increasing almost exactly as production has, or about 30 percent overall. In essence, gains in energy efficiency have been offset by the higher electrical needs of dry kilns and increased demands and production levels. Overall, electricity use per ton of clinker produced has remained steady (Table 5). Table 4. Number of Active Plants by Clinker-Process Type in U.S. Cement Industry, 1990-2001 1990 1993 1994 1995 1996 1997 1998 1999 2000 2001 Change,90-
2001 Change, 93-2001
Total number of Active Plants
104 113 110 110 111 110 110 111 111 111 6.73% -1.77%
Total Number of Plants, Dry Kiln
67 72 71 72 74 73 74 75 77 77 14.93% 6.94%
Total Number of Plants, Wet Kiln
43 37 36 35 35 35 34 34 28 32 -25.58% -13.51%
Total Number of Plants, both
4 4 3 3 3 2 2 2 6 2 -50.00% -50.00%
Source: U.S. Bureau of Mines Minerals Yearbook, 1990; United States Geological Survey, Minerals Yearbook, Annual, 1991 – 2001, Table 7.

Energy Use in the Cement Industry in North America: Emissions, Waste Generation and Pollution Control
18
Table 5. Average Consumption of Electricity at Cement Kilns, U.S. (kilowatt hours per ton of cement produced) 1990 1993 1994 1995 1996 1997 1998 1999 2000 2001 90-
2001 93-2001
Average Consumption of Electricity at Wet Kiln Cement Plants
135 126 139 137 137 132 133 131 131 136 0.74% 7.94%
Average Consumption of Electricity at Dry Kiln Cement Plants
153 148 153 149 150 149 148 147 148 148 (3.27)%
0.00%
Average Consumption of Electricity at Average Cement Plant
147 142 150 145 146 145 144 143 144 146 (0.68)%
2.82%
Source: U.S. Bureau of Mines Mineral Yearbook, 1990; United States Geological Survey, Minerals Yearbook, Annual, 1991 – 2001, Table 8.
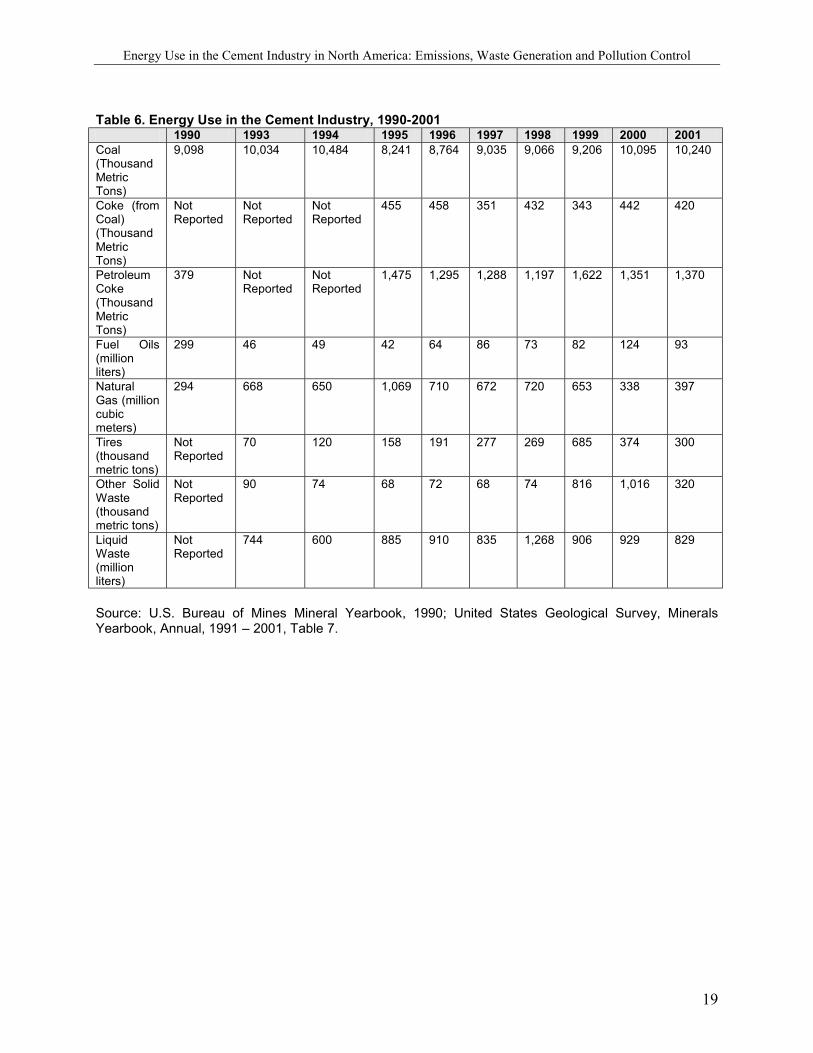
3.2.4 Fuel Use and Total Energy Consumption in the Cement Industry
While total electrical consumption per unit of production has remained steady over the last decade in all types of kilns, total energy consumption – including fuels in the clinker process – has varied considerably. The change has resulted both from the switch from wet kilns to dry kilns in many cases – requiring less heat input and fuel use – greater production – requiring greater fuel use -- and a change in fuel use itself, with coal, petroleum coke and “alternative” fuels favored over natural gas and fuel oils. Thus, back in 1970, cement plants burned over 1,594 million liters of fuel oils and 5,998 million cubic meters of natural gas, while today only 124 million liters of fuel oils and a little more than a thousand million cubic meters of natural gas is burned, mainly to start kilns up. Instead, cement plants in the U.S. rely principally upon coal, and petroleum coke to turn limestone and other raw materials into clinker. In addition, since the 1980s, cement kilns have been burning a variety of alternative fuels, including tires, solid hazardous wastes and liquid hazardous and non-hazardous wastes such as used oils and solvents to run their kilns. In particular, the use of tires and solid wastes appear to have increased significantly in recent years (Table 6). In order to compare these fuels, these volumes must be converted to a common heat input index, such as MBTUs or TJs. Using common “gross heat” conversion factors, Table 7 shows energy consumption in the cement industry over the decade. The table shows that by 2000, alternative fuels had become the second leading fuel category behind coal for the cement industry.
Energy Use in the Cement Industry in North America: Emissions, Waste Generation and Pollution Control
19
Table 6. Energy Use in the Cement Industry, 1990-2001 1990 1993 1994 1995 1996 1997 1998 1999 2000 2001 Coal (Thousand Metric Tons)
9,098 10,034 10,484 8,241 8,764 9,035 9,066 9,206 10,095 10,240
Coke (from Coal) (Thousand Metric Tons)
Not Reported
Not Reported
Not Reported
455 458 351 432 343 442 420
Petroleum Coke (Thousand Metric Tons)
379 Not Reported
Not Reported
1,475 1,295 1,288 1,197 1,622 1,351 1,370
Fuel Oils (million liters)
299 46 49 42 64 86 73 82 124 93
Natural Gas (million cubic meters)
294 668 650 1,069 710 672 720 653 338 397
Tires (thousand metric tons)
Not Reported
70 120 158 191 277 269 685 374 300
Other Solid Waste (thousand metric tons)
Not Reported
90 74 68 72 68 74 816 1,016 320
Liquid Waste (million liters)
Not Reported
744 600 885 910 835 1,268 906 929 829
Source: U.S. Bureau of Mines Mineral Yearbook, 1990; United States Geological Survey, Minerals Yearbook, Annual, 1991 – 2001, Table 7.
Energy Use in the Cement Industry in North America: Emissions, Waste Generation and Pollution Control
20
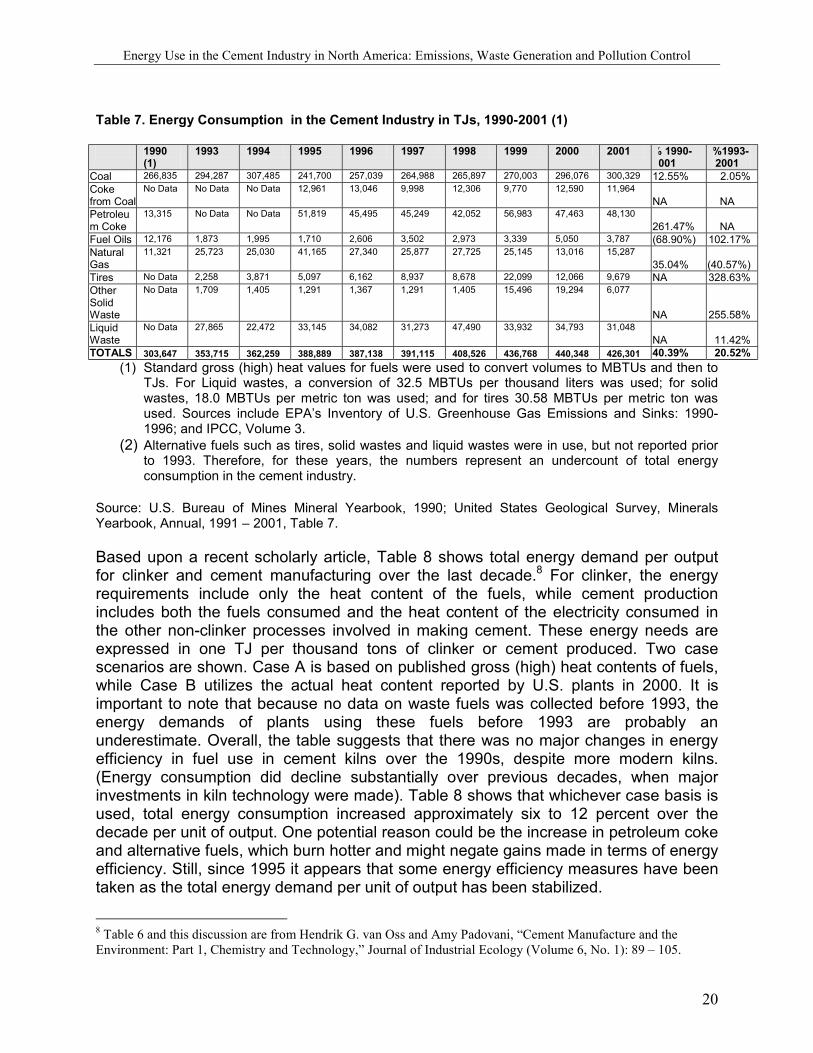
Table 7. Energy Consumption in the Cement Industry in TJs, 1990-2001 (1)
1990 (1)
1993 1994 1995 1996 1997 1998 1999 2000 2001 % 1990-2001
%1993- 2001
Coal 266,835 294,287 307,485 241,700 257,039 264,988 265,897 270,003 296,076 300,329 12.55% 2.05% Coke from Coal
No Data No Data No Data 12,961 13,046 9,998 12,306 9,770 12,590 11,964 NA NA
Petroleum Coke
13,315 No Data No Data 51,819 45,495 45,249 42,052 56,983 47,463 48,130 261.47% NA
Fuel Oils 12,176 1,873 1,995 1,710 2,606 3,502 2,973 3,339 5,050 3,787 (68.90%) 102.17% Natural Gas
11,321 25,723 25,030 41,165 27,340 25,877 27,725 25,145 13,016 15,287 35.04% (40.57%)
Tires No Data 2,258 3,871 5,097 6,162 8,937 8,678 22,099 12,066 9,679 NA 328.63% Other Solid Waste
No Data 1,709 1,405 1,291 1,367 1,291 1,405 15,496 19,294 6,077
NA 255.58% Liquid Waste
No Data 27,865 22,472 33,145 34,082 31,273 47,490 33,932 34,793 31,048 NA 11.42%
TOTALS 303,647 353,715 362,259 388,889 387,138 391,115 408,526 436,768 440,348 426,301 40.39% 20.52% (1) Standard gross (high) heat values for fuels were used to convert volumes to MBTUs and then to
TJs. For Liquid wastes, a conversion of 32.5 MBTUs per thousand liters was used; for solid wastes, 18.0 MBTUs per metric ton was used; and for tires 30.58 MBTUs per metric ton was used. Sources include EPA’s Inventory of U.S. Greenhouse Gas Emissions and Sinks: 1990-1996; and IPCC, Volume 3.
(2) Alternative fuels such as tires, solid wastes and liquid wastes were in use, but not reported prior to 1993. Therefore, for these years, the numbers represent an undercount of total energy consumption in the cement industry.
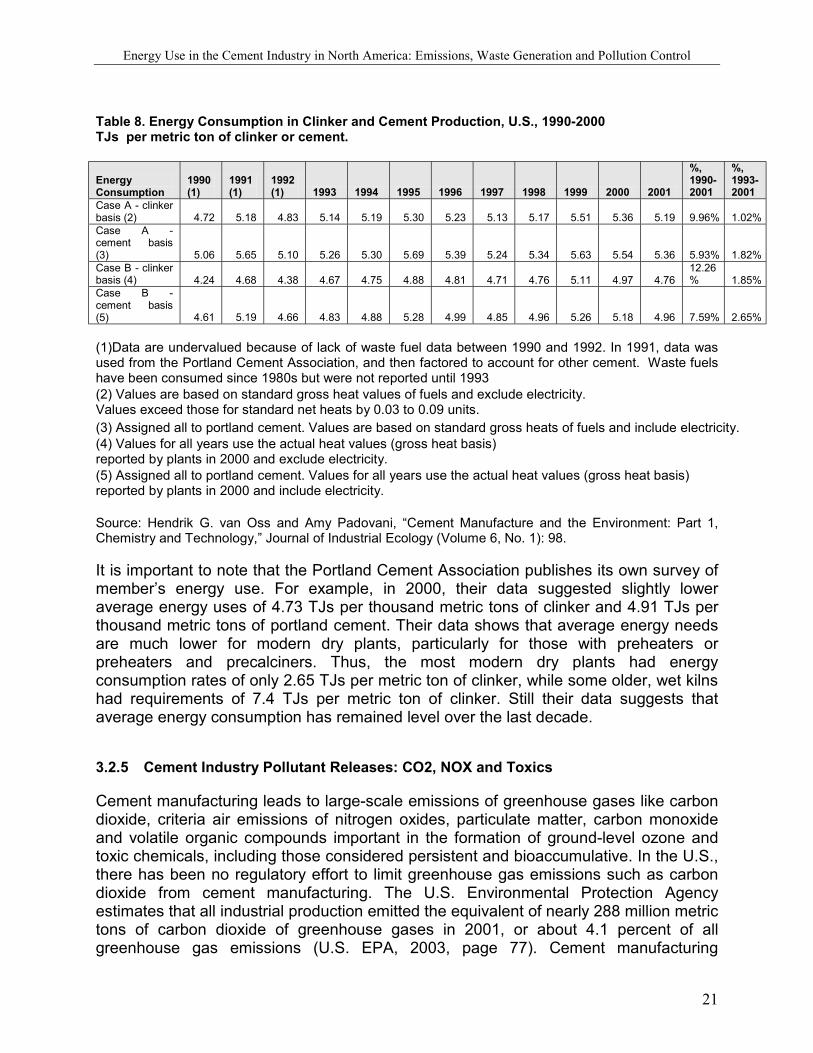
Source: U.S. Bureau of Mines Mineral Yearbook, 1990; United States Geological Survey, Minerals Yearbook, Annual, 1991 – 2001, Table 7. Based upon a recent scholarly article, Table 8 shows total energy demand per output for clinker and cement manufacturing over the last decade.8 For clinker, the energy requirements include only the heat content of the fuels, while cement production includes both the fuels consumed and the heat content of the electricity consumed in the other non-clinker processes involved in making cement. These energy needs are expressed in one TJ per thousand tons of clinker or cement produced. Two case scenarios are shown. Case A is based on published gross (high) heat contents of fuels, while Case B utilizes the actual heat content reported by U.S. plants in 2000. It is important to note that because no data on waste fuels was collected before 1993, the energy demands of plants using these fuels before 1993 are probably an underestimate. Overall, the table suggests that there was no major changes in energy efficiency in fuel use in cement kilns over the 1990s, despite more modern kilns. (Energy consumption did decline substantially over previous decades, when major investments in kiln technology were made). Table 8 shows that whichever case basis is used, total energy consumption increased approximately six to 12 percent over the decade per unit of output. One potential reason could be the increase in petroleum coke and alternative fuels, which burn hotter and might negate gains made in terms of energy efficiency. Still, since 1995 it appears that some energy efficiency measures have been taken as the total energy demand per unit of output has been stabilized.
8 Table 6 and this discussion are from Hendrik G. van Oss and Amy Padovani, “Cement Manufacture and the Environment: Part 1, Chemistry and Technology,” Journal of Industrial Ecology (Volume 6, No. 1): 89 – 105.
Energy Use in the Cement Industry in North America: Emissions, Waste Generation and Pollution Control
21
Table 8. Energy Consumption in Clinker and Cement Production, U.S., 1990-2000 TJs per metric ton of clinker or cement.
Energy Consumption
1990 (1)
1991 (1)
1992 (1) 1993 1994 1995 1996 1997 1998 1999 2000 2001
%, 1990-2001
%, 1993-2001
Case A - clinker basis (2) 4.72 5.18 4.83 5.14 5.19 5.30 5.23 5.13 5.17 5.51 5.36 5.19 9.96% 1.02% Case A - cement basis (3) 5.06 5.65 5.10 5.26 5.30 5.69 5.39 5.24 5.34 5.63 5.54 5.36 5.93% 1.82% Case B - clinker basis (4) 4.24 4.68 4.38 4.67 4.75 4.88 4.81 4.71 4.76 5.11 4.97 4.76
12.26% 1.85%
Case B - cement basis (5) 4.61 5.19 4.66 4.83 4.88 5.28 4.99 4.85 4.96 5.26 5.18 4.96 7.59% 2.65% (1)Data are undervalued because of lack of waste fuel data between 1990 and 1992. In 1991, data was used from the Portland Cement Association, and then factored to account for other cement. Waste fuels have been consumed since 1980s but were not reported until 1993 (2) Values are based on standard gross heat values of fuels and exclude electricity. Values exceed those for standard net heats by 0.03 to 0.09 units. (3) Assigned all to portland cement. Values are based on standard gross heats of fuels and include electricity. (4) Values for all years use the actual heat values (gross heat basis) reported by plants in 2000 and exclude electricity. (5) Assigned all to portland cement. Values for all years use the actual heat values (gross heat basis) reported by plants in 2000 and include electricity. Source: Hendrik G. van Oss and Amy Padovani, “Cement Manufacture and the Environment: Part 1, Chemistry and Technology,” Journal of Industrial Ecology (Volume 6, No. 1): 98. It is important to note that the Portland Cement Association publishes its own survey of member’s energy use. For example, in 2000, their data suggested slightly lower average energy uses of 4.73 TJs per thousand metric tons of clinker and 4.91 TJs per thousand metric tons of portland cement. Their data shows that average energy needs are much lower for modern dry plants, particularly for those with preheaters or preheaters and precalciners. Thus, the most modern dry plants had energy consumption rates of only 2.65 TJs per metric ton of clinker, while some older, wet kilns had requirements of 7.4 TJs per metric ton of clinker. Still their data suggests that average energy consumption has remained level over the last decade.
3.2.5 Cement Industry Pollutant Releases: CO2, NOX and Toxics
Cement manufacturing leads to large-scale emissions of greenhouse gases like carbon dioxide, criteria air emissions of nitrogen oxides, particulate matter, carbon monoxide and volatile organic compounds important in the formation of ground-level ozone and toxic chemicals, including those considered persistent and bioaccumulative. In the U.S., there has been no regulatory effort to limit greenhouse gas emissions such as carbon dioxide from cement manufacturing. The U.S. Environmental Protection Agency estimates that all industrial production emitted the equivalent of nearly 288 million metric tons of carbon dioxide of greenhouse gases in 2001, or about 4.1 percent of all greenhouse gas emissions (U.S. EPA, 2003, page 77). Cement manufacturing
Energy Use in the Cement Industry in North America: Emissions, Waste Generation and Pollution Control
22
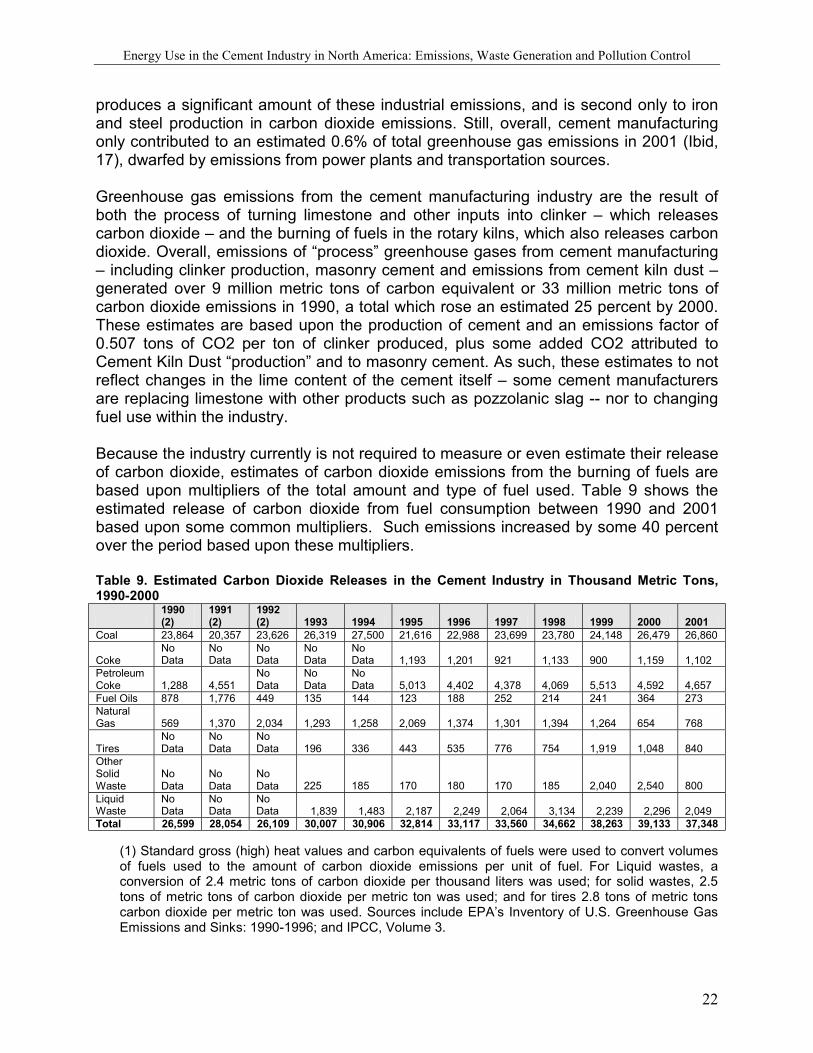
produces a significant amount of these industrial emissions, and is second only to iron and steel production in carbon dioxide emissions. Still, overall, cement manufacturing only contributed to an estimated 0.6% of total greenhouse gas emissions in 2001 (Ibid, 17), dwarfed by emissions from power plants and transportation sources. Greenhouse gas emissions from the cement manufacturing industry are the result of both the process of turning limestone and other inputs into clinker – which releases carbon dioxide – and the burning of fuels in the rotary kilns, which also releases carbon dioxide. Overall, emissions of “process” greenhouse gases from cement manufacturing – including clinker production, masonry cement and emissions from cement kiln dust – generated over 9 million metric tons of carbon equivalent or 33 million metric tons of carbon dioxide emissions in 1990, a total which rose an estimated 25 percent by 2000. These estimates are based upon the production of cement and an emissions factor of 0.507 tons of CO2 per ton of clinker produced, plus some added CO2 attributed to Cement Kiln Dust “production” and to masonry cement. As such, these estimates to not reflect changes in the lime content of the cement itself – some cement manufacturers are replacing limestone with other products such as pozzolanic slag -- nor to changing fuel use within the industry. Because the industry currently is not required to measure or even estimate their release of carbon dioxide, estimates of carbon dioxide emissions from the burning of fuels are based upon multipliers of the total amount and type of fuel used. Table 9 shows the estimated release of carbon dioxide from fuel consumption between 1990 and 2001 based upon some common multipliers. Such emissions increased by some 40 percent over the period based upon these multipliers. Table 9. Estimated Carbon Dioxide Releases in the Cement Industry in Thousand Metric Tons, 1990-2000
1990 (2)
1991 (2)
1992 (2) 1993 1994 1995 1996 1997 1998 1999 2000 2001
Coal 23,864 20,357 23,626 26,319 27,500 21,616 22,988 23,699 23,780 24,148 26,479 26,860
Coke No Data
No Data
No Data
No Data
No Data 1,193 1,201 921 1,133 900 1,159 1,102
Petroleum Coke 1,288 4,551
No Data
No Data
No Data 5,013 4,402 4,378 4,069 5,513 4,592 4,657
Fuel Oils 878 1,776 449 135 144 123 188 252 214 241 364 273 Natural Gas 569 1,370 2,034 1,293 1,258 2,069 1,374 1,301 1,394 1,264 654 768
Tires No Data
No Data
No Data 196 336 443 535 776 754 1,919 1,048 840
Other Solid Waste
No Data
No Data
No Data 225 185 170 180 170 185 2,040 2,540 800
Liquid Waste
No Data
No Data
No Data 1,839 1,483 2,187 2,249 2,064 3,134 2,239 2,296 2,049
Total 26,599 28,054 26,109 30,007 30,906 32,814 33,117 33,560 34,662 38,263 39,133 37,348
(1) Standard gross (high) heat values and carbon equivalents of fuels were used to convert volumes of fuels used to the amount of carbon dioxide emissions per unit of fuel. For Liquid wastes, a conversion of 2.4 metric tons of carbon dioxide per thousand liters was used; for solid wastes, 2.5 tons of metric tons of carbon dioxide per metric ton was used; and for tires 2.8 tons of metric tons carbon dioxide per metric ton was used. Sources include EPA’s Inventory of U.S. Greenhouse Gas Emissions and Sinks: 1990-1996; and IPCC, Volume 3.
Energy Use in the Cement Industry in North America: Emissions, Waste Generation and Pollution Control
23
(2) Alternative fuels such as tires, solid wastes and liquid wastes were in use, but not reported prior to 1993. Therefore, for these years, the numbers represent an undercount of total carbon dioxide emissions in the cement industry.
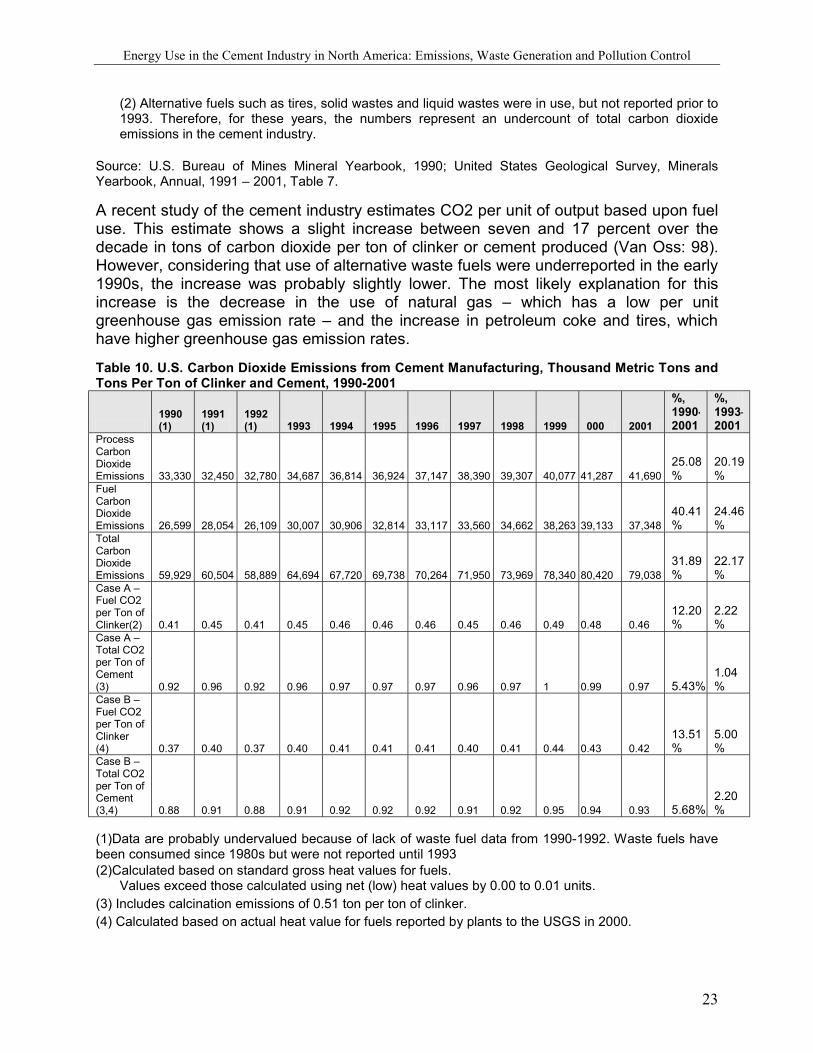
Source: U.S. Bureau of Mines Mineral Yearbook, 1990; United States Geological Survey, Minerals Yearbook, Annual, 1991 – 2001, Table 7. A recent study of the cement industry estimates CO2 per unit of output based upon fuel use. This estimate shows a slight increase between seven and 17 percent over the decade in tons of carbon dioxide per ton of clinker or cement produced (Van Oss: 98). However, considering that use of alternative waste fuels were underreported in the early 1990s, the increase was probably slightly lower. The most likely explanation for this increase is the decrease in the use of natural gas – which has a low per unit greenhouse gas emission rate – and the increase in petroleum coke and tires, which have higher greenhouse gas emission rates. Table 10. U.S. Carbon Dioxide Emissions from Cement Manufacturing, Thousand Metric Tons and Tons Per Ton of Clinker and Cement, 1990-2001
1990 (1)
1991 (1)
1992 (1) 1993 1994 1995 1996 1997 1998 1999 2000 2001
%, 1990-2001
%, 1993-2001
Process Carbon Dioxide Emissions 33,330 32,450 32,780 34,687 36,814 36,924 37,147 38,390 39,307 40,077 41,287 41,690
25.08%
20.19%
Fuel Carbon Dioxide Emissions 26,599 28,054 26,109 30,007 30,906 32,814 33,117 33,560 34,662 38,263 39,133 37,348
40.41%
24.46%
Total Carbon Dioxide Emissions 59,929 60,504 58,889 64,694 67,720 69,738 70,264 71,950 73,969 78,340 80,420 79,038
31.89%
22.17%
Case A – Fuel CO2 per Ton of Clinker(2) 0.41 0.45 0.41 0.45 0.46 0.46 0.46 0.45 0.46 0.49 0.48 0.46
12.20%
2.22%
Case A – Total CO2 per Ton of Cement (3) 0.92 0.96 0.92 0.96 0.97 0.97 0.97 0.96 0.97 1 0.99 0.97 5.43%
1.04%
Case B – Fuel CO2 per Ton of Clinker (4) 0.37 0.40 0.37 0.40 0.41 0.41 0.41 0.40 0.41 0.44 0.43 0.42
13.51%
5.00%
Case B – Total CO2 per Ton of Cement (3,4) 0.88 0.91 0.88 0.91 0.92 0.92 0.92 0.91 0.92 0.95 0.94 0.93 5.68%
2.20%
(1)Data are probably undervalued because of lack of waste fuel data from 1990-1992. Waste fuels have been consumed since 1980s but were not reported until 1993 (2)Calculated based on standard gross heat values for fuels.
Values exceed those calculated using net (low) heat values by 0.00 to 0.01 units. (3) Includes calcination emissions of 0.51 ton per ton of clinker. (4) Calculated based on actual heat value for fuels reported by plants to the USGS in 2000.
Energy Use in the Cement Industry in North America: Emissions, Waste Generation and Pollution Control
24
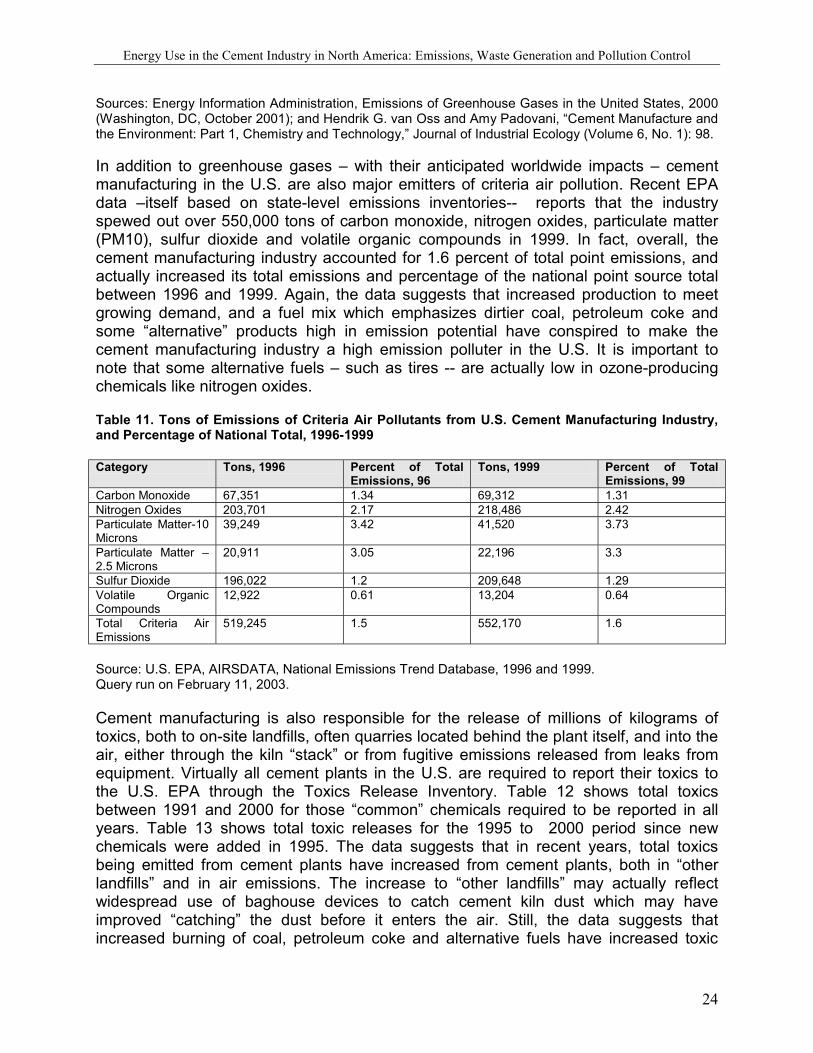
Sources: Energy Information Administration, Emissions of Greenhouse Gases in the United States, 2000 (Washington, DC, October 2001); and Hendrik G. van Oss and Amy Padovani, “Cement Manufacture and the Environment: Part 1, Chemistry and Technology,” Journal of Industrial Ecology (Volume 6, No. 1): 98. In addition to greenhouse gases – with their anticipated worldwide impacts – cement manufacturing in the U.S. are also major emitters of criteria air pollution. Recent EPA data –itself based on state-level emissions inventories-- reports that the industry spewed out over 550,000 tons of carbon monoxide, nitrogen oxides, particulate matter (PM10), sulfur dioxide and volatile organic compounds in 1999. In fact, overall, the cement manufacturing industry accounted for 1.6 percent of total point emissions, and actually increased its total emissions and percentage of the national point source total between 1996 and 1999. Again, the data suggests that increased production to meet growing demand, and a fuel mix which emphasizes dirtier coal, petroleum coke and some “alternative” products high in emission potential have conspired to make the cement manufacturing industry a high emission polluter in the U.S. It is important to note that some alternative fuels – such as tires -- are actually low in ozone-producing chemicals like nitrogen oxides. Table 11. Tons of Emissions of Criteria Air Pollutants from U.S. Cement Manufacturing Industry, and Percentage of National Total, 1996-1999 Category Tons, 1996 Percent of Total
Emissions, 96 Tons, 1999 Percent of Total
Emissions, 99 Carbon Monoxide 67,351 1.34 69,312 1.31 Nitrogen Oxides 203,701 2.17 218,486 2.42 Particulate Matter-10 Microns
39,249 3.42 41,520 3.73
Particulate Matter – 2.5 Microns
20,911 3.05 22,196 3.3
Sulfur Dioxide 196,022 1.2 209,648 1.29 Volatile Organic Compounds
12,922 0.61 13,204 0.64
Total Criteria Air Emissions
519,245 1.5 552,170 1.6
Source: U.S. EPA, AIRSDATA, National Emissions Trend Database, 1996 and 1999. Query run on February 11, 2003. Cement manufacturing is also responsible for the release of millions of kilograms of toxics, both to on-site landfills, often quarries located behind the plant itself, and into the air, either through the kiln “stack” or from fugitive emissions released from leaks from equipment. Virtually all cement plants in the U.S. are required to report their toxics to the U.S. EPA through the Toxics Release Inventory. Table 12 shows total toxics between 1991 and 2000 for those “common” chemicals required to be reported in all years. Table 13 shows total toxic releases for the 1995 to 2000 period since new chemicals were added in 1995. The data suggests that in recent years, total toxics being emitted from cement plants have increased from cement plants, both in “other landfills” and in air emissions. The increase to “other landfills” may actually reflect widespread use of baghouse devices to catch cement kiln dust which may have improved “catching” the dust before it enters the air. Still, the data suggests that increased burning of coal, petroleum coke and alternative fuels have increased toxic
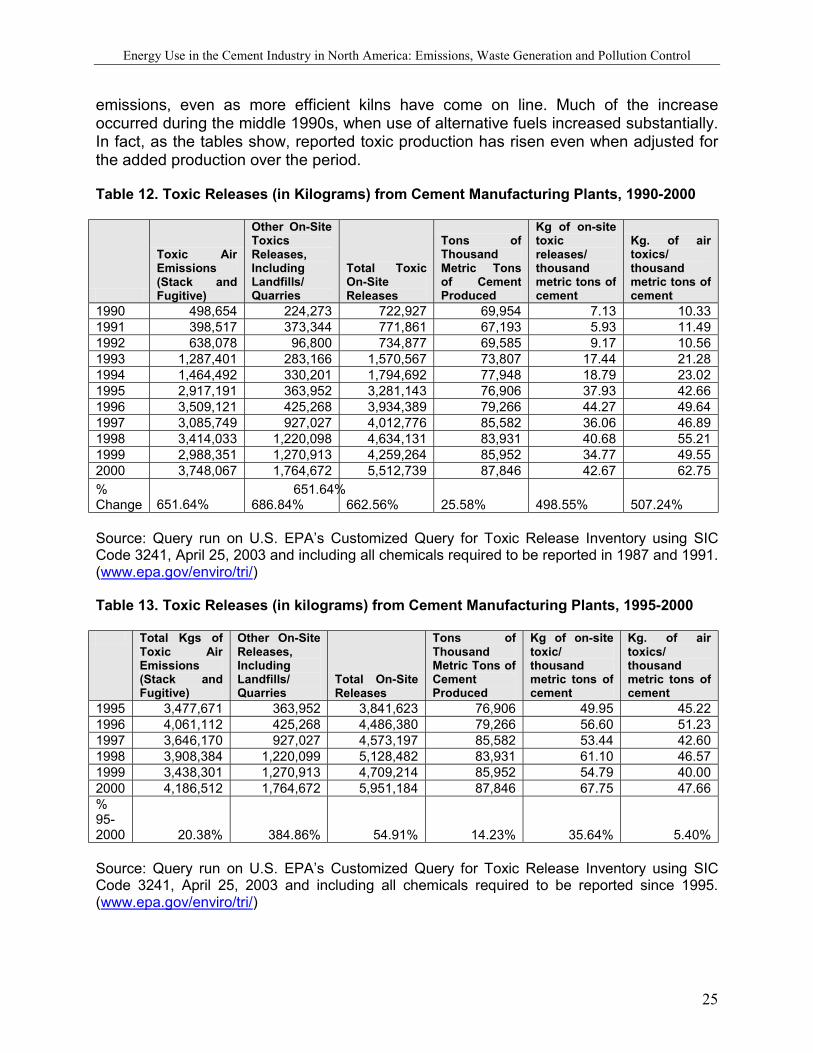
Energy Use in the Cement Industry in North America: Emissions, Waste Generation and Pollution Control
25
emissions, even as more efficient kilns have come on line. Much of the increase occurred during the middle 1990s, when use of alternative fuels increased substantially. In fact, as the tables show, reported toxic production has risen even when adjusted for the added production over the period. Table 12. Toxic Releases (in Kilograms) from Cement Manufacturing Plants, 1990-2000
Toxic Air Emissions (Stack and Fugitive)
Other On-Site Toxics Releases, Including Landfills/ Quarries
Total Toxic On-Site Releases
Tons of Thousand Metric Tons of Cement Produced
Kg of on-site toxic releases/ thousand metric tons of cement
Kg. of air toxics/ thousand metric tons of cement
1990 498,654 224,273 722,927 69,954 7.13 10.33 1991 398,517 373,344 771,861 67,193 5.93 11.49 1992 638,078 96,800 734,877 69,585 9.17 10.56 1993 1,287,401 283,166 1,570,567 73,807 17.44 21.28 1994 1,464,492 330,201 1,794,692 77,948 18.79 23.02 1995 2,917,191 363,952 3,281,143 76,906 37.93 42.66 1996 3,509,121 425,268 3,934,389 79,266 44.27 49.64 1997 3,085,749 927,027 4,012,776 85,582 36.06 46.89 1998 3,414,033 1,220,098 4,634,131 83,931 40.68 55.21 1999 2,988,351 1,270,913 4,259,264 85,952 34.77 49.55 2000 3,748,067 1,764,672 5,512,739 87,846 42.67 62.75 % Change
651.64% 651.64% 686.84% 662.56% 25.58% 498.55% 507.24%
Source: Query run on U.S. EPA’s Customized Query for Toxic Release Inventory using SIC Code 3241, April 25, 2003 and including all chemicals required to be reported in 1987 and 1991. (www.epa.gov/enviro/tri/) Table 13. Toxic Releases (in kilograms) from Cement Manufacturing Plants, 1995-2000 Total Kgs of
Toxic Air Emissions (Stack and Fugitive)
Other On-Site Releases, Including Landfills/ Quarries
Total On-Site Releases
Tons of Thousand Metric Tons of Cement Produced
Kg of on-site toxic/ thousand metric tons of cement
Kg. of air toxics/ thousand metric tons of cement
1995 3,477,671 363,952 3,841,623 76,906 49.95 45.22 1996 4,061,112 425,268 4,486,380 79,266 56.60 51.23 1997 3,646,170 927,027 4,573,197 85,582 53.44 42.60 1998 3,908,384 1,220,099 5,128,482 83,931 61.10 46.57 1999 3,438,301 1,270,913 4,709,214 85,952 54.79 40.00 2000 4,186,512 1,764,672 5,951,184 87,846 67.75 47.66 % 95-2000 20.38% 384.86% 54.91% 14.23% 35.64% 5.40% Source: Query run on U.S. EPA’s Customized Query for Toxic Release Inventory using SIC Code 3241, April 25, 2003 and including all chemicals required to be reported since 1995. (www.epa.gov/enviro/tri/)
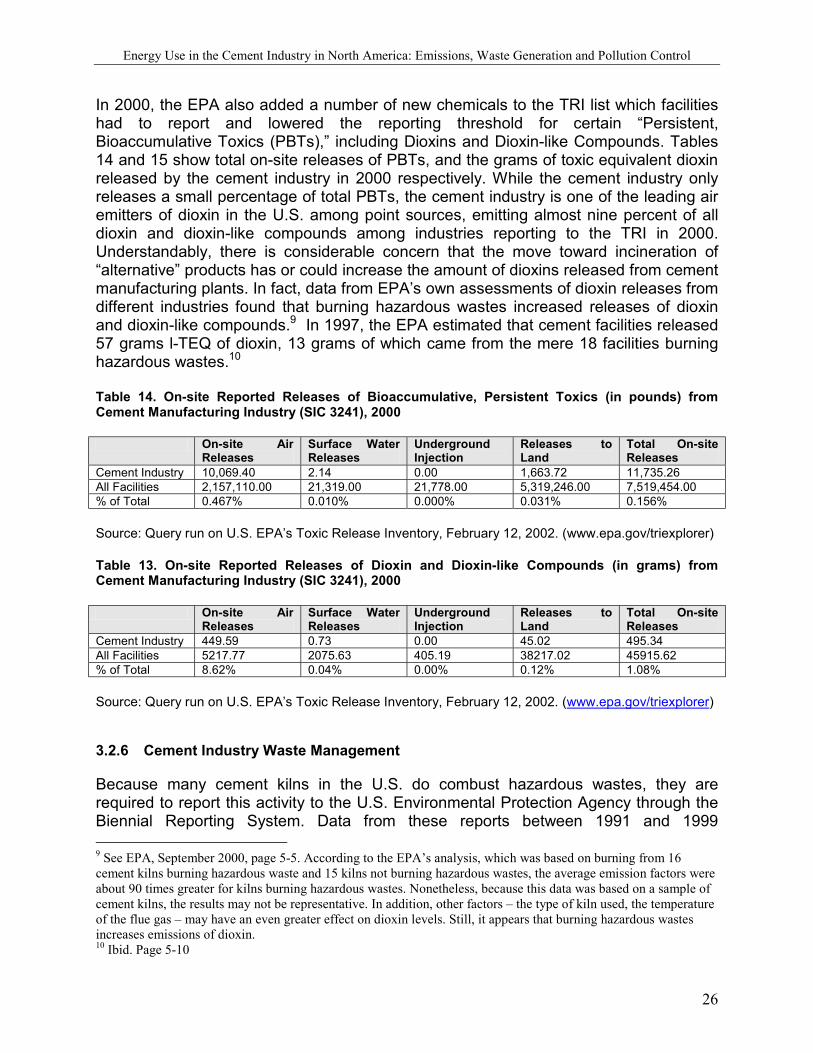
Energy Use in the Cement Industry in North America: Emissions, Waste Generation and Pollution Control
26
In 2000, the EPA also added a number of new chemicals to the TRI list which facilities had to report and lowered the reporting threshold for certain “Persistent, Bioaccumulative Toxics (PBTs),” including Dioxins and Dioxin-like Compounds. Tables 14 and 15 show total on-site releases of PBTs, and the grams of toxic equivalent dioxin released by the cement industry in 2000 respectively. While the cement industry only releases a small percentage of total PBTs, the cement industry is one of the leading air emitters of dioxin in the U.S. among point sources, emitting almost nine percent of all dioxin and dioxin-like compounds among industries reporting to the TRI in 2000. Understandably, there is considerable concern that the move toward incineration of “alternative” products has or could increase the amount of dioxins released from cement manufacturing plants. In fact, data from EPA’s own assessments of dioxin releases from different industries found that burning hazardous wastes increased releases of dioxin and dioxin-like compounds.9 In 1997, the EPA estimated that cement facilities released 57 grams l-TEQ of dioxin, 13 grams of which came from the mere 18 facilities burning hazardous wastes.10 Table 14. On-site Reported Releases of Bioaccumulative, Persistent Toxics (in pounds) from Cement Manufacturing Industry (SIC 3241), 2000 On-site Air
Releases Surface Water Releases
Underground Injection
Releases to Land
Total On-site Releases
Cement Industry 10,069.40 2.14 0.00 1,663.72 11,735.26 All Facilities 2,157,110.00 21,319.00 21,778.00 5,319,246.00 7,519,454.00 % of Total 0.467% 0.010% 0.000% 0.031% 0.156% Source: Query run on U.S. EPA’s Toxic Release Inventory, February 12, 2002. (www.epa.gov/triexplorer) Table 13. On-site Reported Releases of Dioxin and Dioxin-like Compounds (in grams) from Cement Manufacturing Industry (SIC 3241), 2000 On-site Air
Releases Surface Water Releases
Underground Injection
Releases to Land
Total On-site Releases
Cement Industry 449.59 0.73 0.00 45.02 495.34 All Facilities 5217.77 2075.63 405.19 38217.02 45915.62 % of Total 8.62% 0.04% 0.00% 0.12% 1.08% Source: Query run on U.S. EPA’s Toxic Release Inventory, February 12, 2002. (www.epa.gov/triexplorer)
3.2.6 Cement Industry Waste Management
Because many cement kilns in the U.S. do combust hazardous wastes, they are required to report this activity to the U.S. Environmental Protection Agency through the Biennial Reporting System. Data from these reports between 1991 and 1999 9 See EPA, September 2000, page 5-5. According to the EPA’s analysis, which was based on burning from 16 cement kilns burning hazardous waste and 15 kilns not burning hazardous wastes, the average emission factors were about 90 times greater for kilns burning hazardous wastes. Nonetheless, because this data was based on a sample of cement kilns, the results may not be representative. In addition, other factors – the type of kiln used, the temperature of the flue gas – may have an even greater effect on dioxin levels. Still, it appears that burning hazardous wastes increases emissions of dioxin. 10 Ibid. Page 5-10
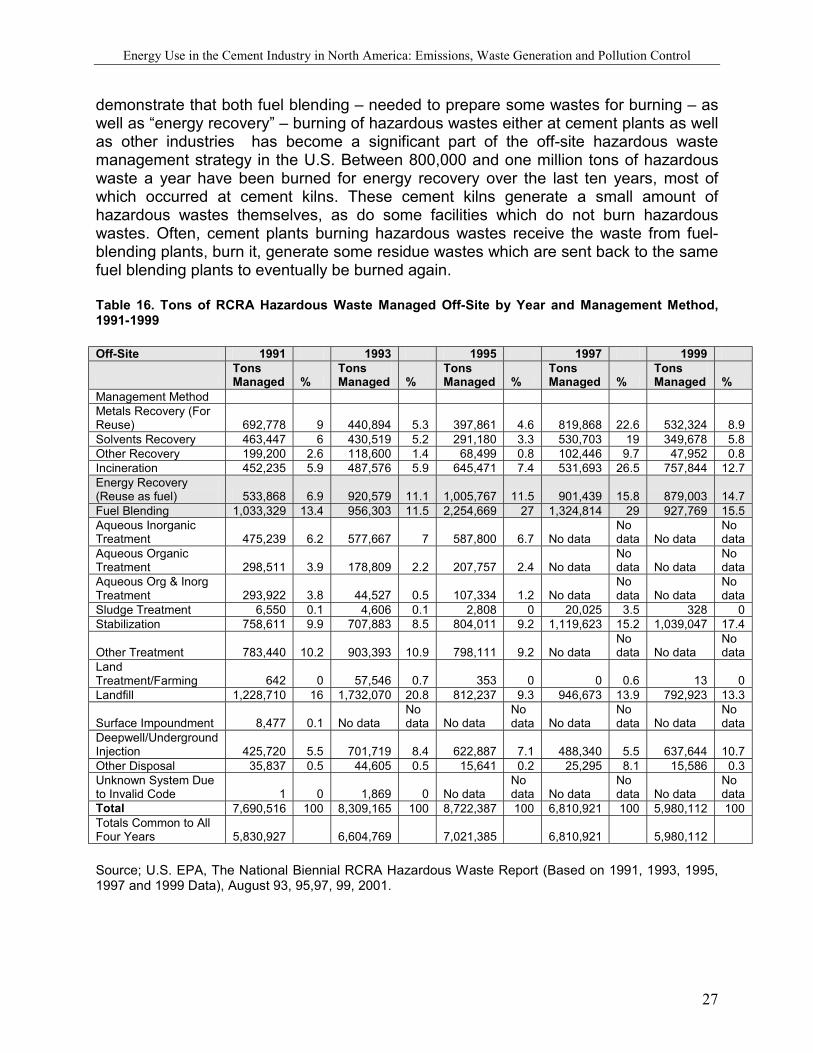
Energy Use in the Cement Industry in North America: Emissions, Waste Generation and Pollution Control
27
demonstrate that both fuel blending – needed to prepare some wastes for burning – as well as “energy recovery” – burning of hazardous wastes either at cement plants as well as other industries has become a significant part of the off-site hazardous waste management strategy in the U.S. Between 800,000 and one million tons of hazardous waste a year have been burned for energy recovery over the last ten years, most of which occurred at cement kilns. These cement kilns generate a small amount of hazardous wastes themselves, as do some facilities which do not burn hazardous wastes. Often, cement plants burning hazardous wastes receive the waste from fuel-blending plants, burn it, generate some residue wastes which are sent back to the same fuel blending plants to eventually be burned again. Table 16. Tons of RCRA Hazardous Waste Managed Off-Site by Year and Management Method, 1991-1999 Off-Site 1991 1993 1995 1997 1999
Tons Managed %
Tons Managed %
Tons Managed %
Tons Managed %
Tons Managed %
Management Method Metals Recovery (For Reuse) 692,778 9 440,894 5.3 397,861 4.6 819,868 22.6 532,324 8.9 Solvents Recovery 463,447 6 430,519 5.2 291,180 3.3 530,703 19 349,678 5.8 Other Recovery 199,200 2.6 118,600 1.4 68,499 0.8 102,446 9.7 47,952 0.8 Incineration 452,235 5.9 487,576 5.9 645,471 7.4 531,693 26.5 757,844 12.7 Energy Recovery (Reuse as fuel) 533,868 6.9 920,579 11.1 1,005,767 11.5 901,439 15.8 879,003 14.7 Fuel Blending 1,033,329 13.4 956,303 11.5 2,254,669 27 1,324,814 29 927,769 15.5 Aqueous Inorganic Treatment 475,239 6.2 577,667 7 587,800 6.7 No data
No data No data
No data
Aqueous Organic Treatment 298,511 3.9 178,809 2.2 207,757 2.4 No data
No data No data
No data
Aqueous Org & Inorg Treatment 293,922 3.8 44,527 0.5 107,334 1.2 No data
No data No data
No data
Sludge Treatment 6,550 0.1 4,606 0.1 2,808 0 20,025 3.5 328 0 Stabilization 758,611 9.9 707,883 8.5 804,011 9.2 1,119,623 15.2 1,039,047 17.4
Other Treatment 783,440 10.2 903,393 10.9 798,111 9.2 No data No data No data
No data
Land Treatment/Farming 642 0 57,546 0.7 353 0 0 0.6 13 0 Landfill 1,228,710 16 1,732,070 20.8 812,237 9.3 946,673 13.9 792,923 13.3
Surface Impoundment 8,477 0.1 No data No data No data
No data No data
No data No data
No data
Deepwell/Underground Injection 425,720 5.5 701,719 8.4 622,887 7.1 488,340 5.5 637,644 10.7 Other Disposal 35,837 0.5 44,605 0.5 15,641 0.2 25,295 8.1 15,586 0.3 Unknown System Due to Invalid Code 1 0 1,869 0 No data
No data No data
No data No data
No data
Total 7,690,516 100 8,309,165 100 8,722,387 100 6,810,921 100 5,980,112 100 Totals Common to All Four Years 5,830,927 6,604,769 7,021,385 6,810,921 5,980,112 Source; U.S. EPA, The National Biennial RCRA Hazardous Waste Report (Based on 1991, 1993, 1995, 1997 and 1999 Data), August 93, 95,97, 99, 2001.
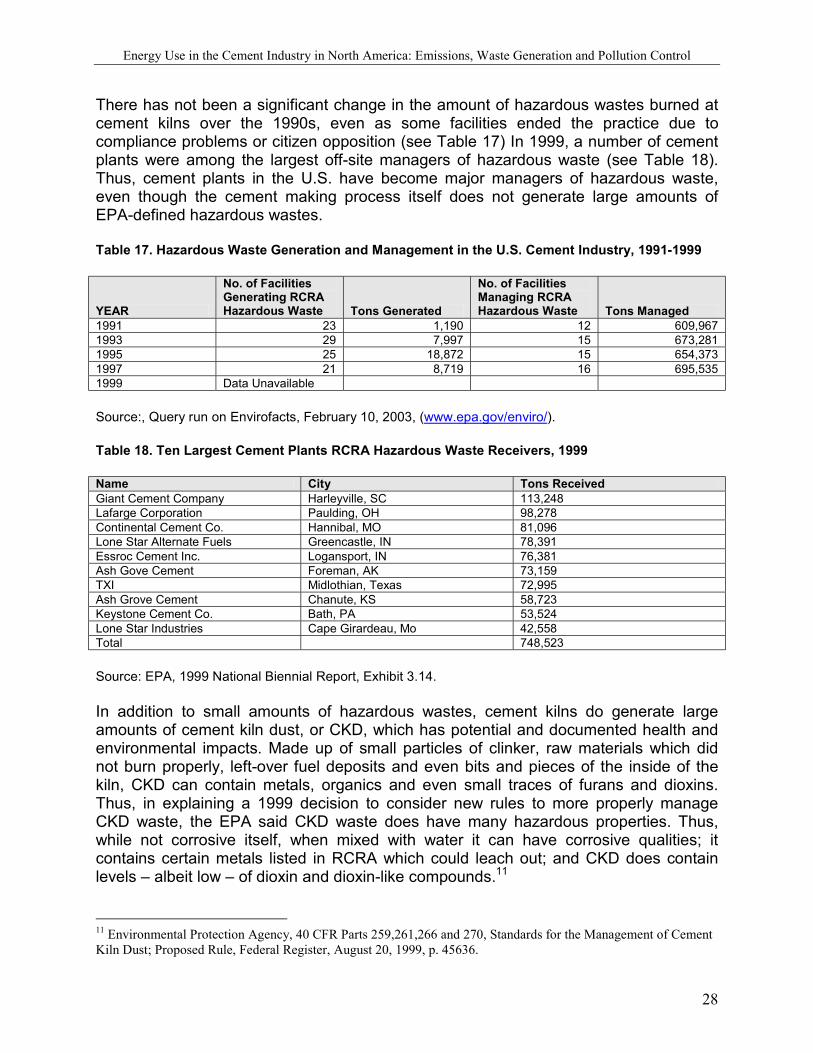
Energy Use in the Cement Industry in North America: Emissions, Waste Generation and Pollution Control
28
There has not been a significant change in the amount of hazardous wastes burned at cement kilns over the 1990s, even as some facilities ended the practice due to compliance problems or citizen opposition (see Table 17) In 1999, a number of cement plants were among the largest off-site managers of hazardous waste (see Table 18). Thus, cement plants in the U.S. have become major managers of hazardous waste, even though the cement making process itself does not generate large amounts of EPA-defined hazardous wastes. Table 17. Hazardous Waste Generation and Management in the U.S. Cement Industry, 1991-1999
YEAR
No. of Facilities Generating RCRA Hazardous Waste Tons Generated
No. of Facilities Managing RCRA Hazardous Waste Tons Managed
1991 23 1,190 12 609,967 1993 29 7,997 15 673,281 1995 25 18,872 15 654,373 1997 21 8,719 16 695,535 1999 Data Unavailable Source:, Query run on Envirofacts, February 10, 2003, (www.epa.gov/enviro/). Table 18. Ten Largest Cement Plants RCRA Hazardous Waste Receivers, 1999 Name City Tons Received Giant Cement Company Harleyville, SC 113,248 Lafarge Corporation Paulding, OH 98,278 Continental Cement Co. Hannibal, MO 81,096 Lone Star Alternate Fuels Greencastle, IN 78,391 Essroc Cement Inc. Logansport, IN 76,381 Ash Gove Cement Foreman, AK 73,159 TXI Midlothian, Texas 72,995 Ash Grove Cement Chanute, KS 58,723 Keystone Cement Co. Bath, PA 53,524 Lone Star Industries Cape Girardeau, Mo 42,558 Total 748,523 Source: EPA, 1999 National Biennial Report, Exhibit 3.14. In addition to small amounts of hazardous wastes, cement kilns do generate large amounts of cement kiln dust, or CKD, which has potential and documented health and environmental impacts. Made up of small particles of clinker, raw materials which did not burn properly, left-over fuel deposits and even bits and pieces of the inside of the kiln, CKD can contain metals, organics and even small traces of furans and dioxins. Thus, in explaining a 1999 decision to consider new rules to more properly manage CKD waste, the EPA said CKD waste does have many hazardous properties. Thus, while not corrosive itself, when mixed with water it can have corrosive qualities; it contains certain metals listed in RCRA which could leach out; and CKD does contain levels – albeit low – of dioxin and dioxin-like compounds.11 11 Environmental Protection Agency, 40 CFR Parts 259,261,266 and 270, Standards for the Management of Cement Kiln Dust; Proposed Rule, Federal Register, August 20, 1999, p. 45636.
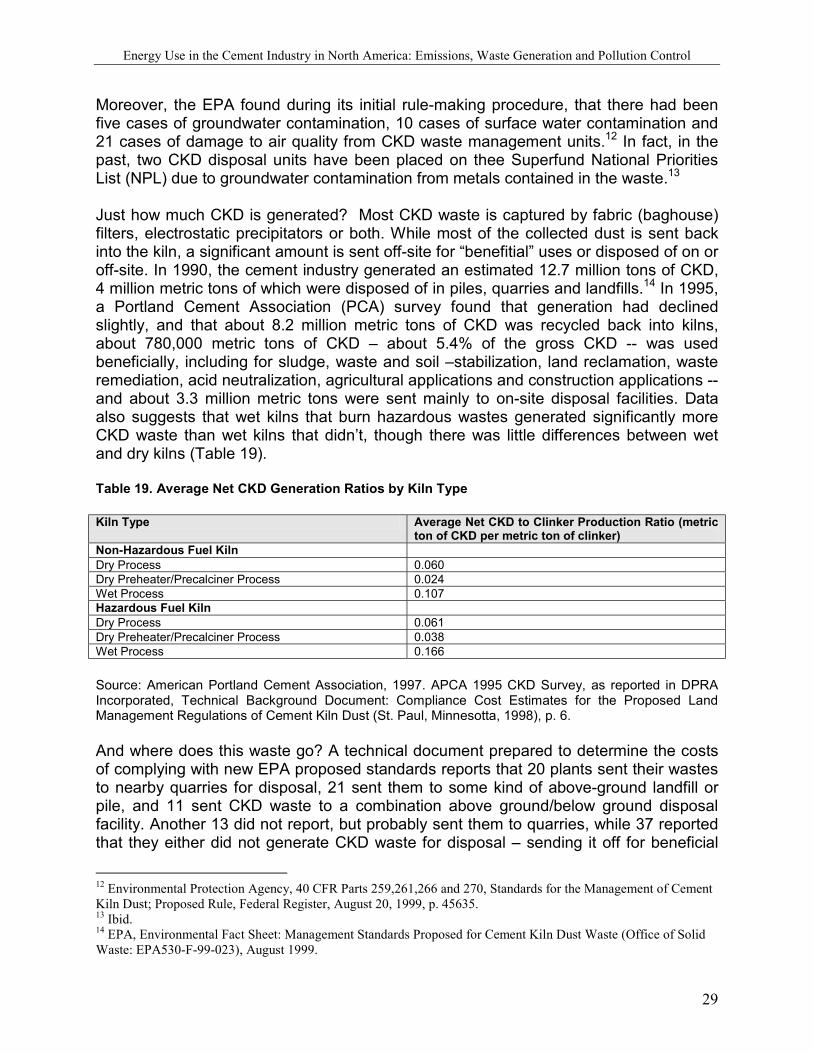
Energy Use in the Cement Industry in North America: Emissions, Waste Generation and Pollution Control
29
Moreover, the EPA found during its initial rule-making procedure, that there had been five cases of groundwater contamination, 10 cases of surface water contamination and 21 cases of damage to air quality from CKD waste management units.12 In fact, in the past, two CKD disposal units have been placed on thee Superfund National Priorities List (NPL) due to groundwater contamination from metals contained in the waste.13 Just how much CKD is generated? Most CKD waste is captured by fabric (baghouse) filters, electrostatic precipitators or both. While most of the collected dust is sent back into the kiln, a significant amount is sent off-site for “benefitial” uses or disposed of on or off-site. In 1990, the cement industry generated an estimated 12.7 million tons of CKD, 4 million metric tons of which were disposed of in piles, quarries and landfills.14 In 1995, a Portland Cement Association (PCA) survey found that generation had declined slightly, and that about 8.2 million metric tons of CKD was recycled back into kilns, about 780,000 metric tons of CKD – about 5.4% of the gross CKD -- was used beneficially, including for sludge, waste and soil –stabilization, land reclamation, waste remediation, acid neutralization, agricultural applications and construction applications -- and about 3.3 million metric tons were sent mainly to on-site disposal facilities. Data also suggests that wet kilns that burn hazardous wastes generated significantly more CKD waste than wet kilns that didn’t, though there was little differences between wet and dry kilns (Table 19). Table 19. Average Net CKD Generation Ratios by Kiln Type Kiln Type Average Net CKD to Clinker Production Ratio (metric
ton of CKD per metric ton of clinker) Non-Hazardous Fuel Kiln Dry Process 0.060 Dry Preheater/Precalciner Process 0.024 Wet Process 0.107 Hazardous Fuel Kiln Dry Process 0.061 Dry Preheater/Precalciner Process 0.038 Wet Process 0.166 Source: American Portland Cement Association, 1997. APCA 1995 CKD Survey, as reported in DPRA Incorporated, Technical Background Document: Compliance Cost Estimates for the Proposed Land Management Regulations of Cement Kiln Dust (St. Paul, Minnesotta, 1998), p. 6. And where does this waste go? A technical document prepared to determine the costs of complying with new EPA proposed standards reports that 20 plants sent their wastes to nearby quarries for disposal, 21 sent them to some kind of above-ground landfill or pile, and 11 sent CKD waste to a combination above ground/below ground disposal facility. Another 13 did not report, but probably sent them to quarries, while 37 reported that they either did not generate CKD waste for disposal – sending it off for beneficial
12 Environmental Protection Agency, 40 CFR Parts 259,261,266 and 270, Standards for the Management of Cement Kiln Dust; Proposed Rule, Federal Register, August 20, 1999, p. 45635. 13 Ibid. 14 EPA, Environmental Fact Sheet: Management Standards Proposed for Cement Kiln Dust Waste (Office of Solid Waste: EPA530-F-99-023), August 1999.
Energy Use in the Cement Industry in North America: Emissions, Waste Generation and Pollution Control
30
use – or sent it off-site.15 In citing the need for regulation, the EPA specifically noted that in 1991, only 17 percent of the CKD facilities had ground-water monitoriing systems.16 More recent data submitted by the industry suggests that the “net” amount of CKD has been reduced as industries have begun to reuse more dust in the kiln. Thus, in a filing with the EPA arguing against new standards for CKD management, the Portland Cement Association reported that CKD disposal has decreased by 22 percent since 1990.17
3.3 Regulatory Structure for Waste and Emissions Management
Over the last decade there has been considerable effort by the Environmental Protection Agency and state regulatory agencies to improve regulations on several areas where cement manufacturing contributes to environmental degradation, including CKD management, toxic emissions and criteria air pollutants. There has not been a regulatory effort to curb greenhouse gas emissions. Still, the implementation of new regulations have been slow, in part because of considerable effort by the cement industry itself to delay and weaken new regulations. It should also be stated that in general new regulations came about when citizen groups and others forced the EPA to take action through political pressure and lawsuits, rather than through EPA-led initiative.
3.3.1 Emission Controls
The EPA has been pursuing so-called Maximum Achievable Control Technologies to control air emissions both for cement kilns that burn hazardous wastes and those that do not separately, although the final rules are very similar. First of all, in April of 1996, the EPA issued proposed standards for hazardous waste combustion facilities, including aggregate kilns, incinerators and cement kilns through the Clean Air Act. In September of 1999, the EPA issued the final standards to control emissions of hazardous air pollutants from these facilities, including dioxin and furans, toxic organic compounds, hydrocarbons and mercury. Under the standards, facilities would have until September of 2002 to comply. However, both industry and environmental groups sought judicial review of the rules – albeit for different reasons -- and on July 24, 2001, the United States Court of Appeals for the District of Columbia Circuit granted the Sierra Club’s petition for review and vacated some portions of the rules. EPA asked for authority to develop interim standards which the Court granted. Finally, on February 14, 2002, the EPA issued “interim” emission standards for hazardous waste combustion facilities. In
15 DPRA Incorporated, Technical Background Document: Compliance Cost Estimates for the Proposed Land Management Regulations of Cement Kiln Dust (St. Paul, Minnesotta, 1998), p. 8. 16 Environmental Protection Agency, 40 CFR Parts 259,261,266 and 270, Standards for the Management of Cement Kiln Dust; Proposed Rule, Federal Register, August 20, 1999, p. 45635. 17 U.S. Environmental Protection Agency, “Additional Data Available on Wastes Studies in Report to Congresson Cement Kiln Dust,” Federal Register, July 25, 2002.
Energy Use in the Cement Industry in North America: Emissions, Waste Generation and Pollution Control
31
the process, the EPA pushed back the compliance deadline until September 30 of 2003.18 The estimated cost to the 18 facilities presently burning hazardous wastes to meet the final standards is between $0.53 and $0.72 million, and the annual post-consolidation compliance costs are estimated to range from $17 to $24 million. Potentially, the new standards could increase the price of cement about $13 per ton.19 According to the EPA, the new controls are expected to cause one or two cement kilns to decide not to burn hazardous wastes because of the added cost, but they are not expected to lead to a decline in the total volume of hazardous waste combusted. At the same as MACT standards were being developed for hazardous waste combustion, the EPA also published MACT standards for all cement kilns on June 14, 1999, also challenged legally. On December 6, 2002, the EPA settled the lawsuit by making relatively small changes to the MACT standard. The MACT standards apply new emission limited on hazardous and non-hazardous burning cement kilns alike for dioxin/furans, particulate matter, and hydrocarbons. However, the MACT standard for non-hazardous burning cement kilns does not establish standards for some hazardous pollutants like mercury. As such the standards for hazardous waste burning cement kilns are somewhat stricter. Still, taken together, the new MACT standards are expected to reduce emissions of dioxins from all cement plants by nearly 40 percent. Hazardous waste-burning cement kilns are not required to meet the same emission standards as incinerators under the new MACT standards, giving cement operators a regulatory advantage over incinerators in the burning of hazardous waste.
3.3.2 Cement Kiln Dust Management
Since the Resource Conservation and Recovery Act (RCRA) was passed by Congress in 1980, cement kiln dust and certain other “mining” wastes have been exempt from otherwise applicable hazardous waste regulations under Subtitle C of the federal law. Nonetheless, EPA was given the task of studying the issue of CKD waste and reporting back to Congress. Only after considerable delay and various lawsuits, did the EPA issue a report in 1993 which found widespread problems with the management of CKD waste. At Congress’ urging, EPA determined that additional controls were needed in 1995. Finally in August of 1999, EPA came up with a compromise solution between those who wanted to consider CKD waste as hazardous waste and those who felt no additional controls – beyond a voluntary agreement between EPA and the cement industry – were needed. The 1999 proposed standards accepted that CKD waste would be considered non-hazardous so long as basic management standards were met. 18 United States Environmental Protection Agency, Environmental Fact Sheet: Interim Emission Standards for 1999 Hazardous Waste Combustor Rule, EPA530-F-02-008, February 2002. 19 U.S. EPA, Office of Solid Waste, Information from website (http://www.epa.gov/epaoswer/hazwaste/combust/faqs.htm#ck).

Energy Use in the Cement Industry in North America: Emissions, Waste Generation and Pollution Control
32
Options outlined in the proposal included both performance based standards and technology-based standards. Only if these performance and/or technology standards are not complied with can waste be considered hazardous. Thus, under the standards, CKD waste which can not be used beneficially as a lime agent because of high levels of contamination would have to be managed in landfills designed to prevent groundwater contamination. Liners, groundwater monitoring, corrective action, closure and post-closure are among the technical requirements. In addition, to prevent continued releases of cement kiln to the air, EPA proposed requiring additional control measures to prevent releases from landfills, storage areas, or conveyance areas. The EPA invited public testimony on the proposed standards. According to a study done to determine the compliance costs, the new regulations for the land management of cement kiln dust would increase costs of CKD management from about $55 million per year to nearly $100 million. However, the increased costs would only impact about 68 plants, and the annual increase in management costs would only average about $650,000.20 Still, the cement industry responded with a litany of complaints about the proposed standards. In July of 2002, the EPA announced that it was accepting comments on a slightly new proposal: finalizing the proposed management options in rulemaking under RCRA Subtitle D (non-hazardous waste), and withdrawing any consideration of mismanaged CKD waste as hazardous under Subtitle C. Instead, the agency would “assess” CKD practices and regulatory programs over the next three to five years to determine if consideration of the waste as hazardous is warranted. In doing so, the proposal significantly curtails EPA’s enforcement abilities and the liability of the cement industry for mismanaged wastes. Instead, in order to seek enforcement, citizens would have to instead rely upon states and citizen suits to enforce CKD management regulations against the industry. In proposing to delay considering mismanaged CKD waste as hazardous, the EPA accepted arguments from the cement industry that it had made significant improvements in management practices.21 According to the Portland Cement Association, a survey of 18 CKD disposal facilities where 95 percent of the CKD is landfilled, found that 57 percent of the facilities already monitor groundwater, 97 percent practice landfill dust control techniques, 86% employ compaction techniques, 77% have water runoff controls and 91 % practice road-dust control.22 The EPA is still studying its options, however, and has not made a final determination.
20 DPRA Incorporated, Technical Background Document: Compliance Cost Estimates for the Proposed Land Management Regulations of Cement Kiln Dust (St. Paul, Minnesotta, 1998), p. 21. 21 U.S. Environmental Protection Agency, “Additional Data Available on Wastes Studies in Report to Congresson Cement Kiln Dust,” Federal Register, July 25, 2002. 22 U.S. Environmental Protection Agency, “Additional Data Available on Wastes Studies in Report to Congresson Cement Kiln Dust,” Federal Register, July 25, 2002.
Energy Use in the Cement Industry in North America: Emissions, Waste Generation and Pollution Control
33
3.3.3. Controling Ozone Precursors
New Source Review Standards controling “criteria” air pollutants like particulate matter were developed back in 1986 for new cement plants or existing plants which were undergoing major changes. Since that time, states with cities violating national ambient air standards for ozone, particulate matter and other criteria pollutants have been developing new emission standards for cement kilns. A recent example occurred in Texas, where the Texas Natural Resource Conservation Commission imposed significant new reductions on nitrogen oxide emissions for cement kilns in central and eastern counties of Texas to meet standards in the Dallas/Ft. Worth Area. Specifically, the cement industries in these areas were told to reduce nitrogen oxide emissions by an average of 30 percent, with the actual rate dependent upon the type of kiln process. However, following a lawsuit, the TNRCC agreed to allow increased burning of tires at cement facilities as a way to reduce nitrogen oxides, as opposed to requiring new pollution control equipment. In fact, as part of the settlement, the Texas legislature set aside $9.5 million to help deal with surplus tires. Of that, $7.5 million will be spent eliminating two of the largest stockpiles—in Atlanta in Northeast Texas and Stamford in North Texas. The remaining funds may be used to retrofit several cement kilns to burn tires as fuel. Permits are currently being rewritten to allow increase tire burning at these cement kilns, including at TXI’s Midlothian Plant, one of the largest burners of alternative fuels and the subject of contentious permit and legal battles. Thus, one way the cement industry has met its Clean Air obligations to reduce nitrogen oxides is to increase the burning of tires. While use of tire-derived fuel is on the upswing in both Texas and the U.S., the practice is not without critics. Many environmental organizations argue that facilities have inadequate air pollution controls for tire-derived fuels and that while some pollutants may be reduced – such as nitrogen oxide – others – like heavy metals –can be increased. Supporters maintain that tires burn cleaner than coal and the process uses 100 percent of the tire, including the metal. It also is preferable to open air burning of tires, as often happens at illegal dump sites. In Texas, the TNRCC requires all companies burning tires to do trial burns and to meet the emissions requirements of their air permits. Permits limit that total amount of tires that can be burned.
3.3.4. Greenhouse Gas Controls
Unlike the efforts to control hazardous emissions from cement kilns, or the attempt to better manage cement kiln dust, there has not been regulatory efforts in the U.S. to control carbon dioxide emissions. In part this stems from the present administration’s decision to withdraw from the Kyoto Treaty, which would have required substantial reduction commitments from the cement industry as a leading greenhouse gas emitter. Still, one of the industry’s main concerns is that eventually carbon dioxide emission reductions will be required. Members of the Portland Cement Association have agreed to a voluntary goal of reducing their average CO2 emission by 10 percent below 1990 levels by 2020 on a per-ton cement product basis.23 Such reductions would imply 23 Hendrik G. van Oss, “Cement,” Annual Minerals Yearbook, Cement: 2001, 16.2.
Energy Use in the Cement Industry in North America: Emissions, Waste Generation and Pollution Control
34
substantial pollution control expenditures, a change in the type of fuel used, or changing the main input of cement from limestone to alternative materials, including fly ash, slag and other “pozzolanic” materials. These alternative inputs have the potential to reduce process carbon dioxide emissions (see especially Humphreys and Mahasenan 2002). Recently, ten major world cement makers –including companies like CEMEX, Holcim and Lafarge operating in the U.S.-- came up with a set of “sustainable” strategies, including reduction of CO2, and other measures to make their plants “greener.” Produced in association with the World Business Council on Sustainable Development, the “Agenda for Action on Sustainable Development” includes a pledge to develop and publish individual performance data and targets for carbon dioxide emissions by 2006 and stakeholder dialogues to develop guidelines on fuel use.24
3.4. Conclusions
Over the last ten years, production of cement and clinker has increased at U.S. plants. So has consumption, in fact at a faster rate than production, and therefore imports have made up a growing portion of total consumption. Imports from Canada and Mexico have grown substantially over the period. At the same time, however, anti-dumping tariffs on certain types of cement products from Mexico have limited imports from that country since NAFTA. Instead, several Mexican-owned cement companies have begun investing heavily in the U.S. Ownership in the cement industry has become more consolidated in the U.S. even thought the total number of plants has remained steady. There is some evidence of some gains in technology transfer because of this ownership, though further, more detailed study would need to be conducted to determine if this represents a truly “cleaner” more efficient technology transfer. There has been a continued change from wet kilns to dry kilns in recent years. While this has reduced fuel use on a per ton basis, total electricity and energy use in the U.S. has increased, both in total volume and on a per-ton basis. A major reason for this continued increase in total energy consumption is the continued use of coal and petroluem coke in U.S. cement kilns, as well as the increasing use of “alternative” fuels, including hazardous wastes and tires. In fact, the cement industry in the U.S. has become one of the major “managers” of hazardous waste sent off-site, a trend that appears to be continuing based on EPA data. Because of these choices on fuel, carbon dioxide, criteria air pollutants and toxic emissions have increased, both on a total and per-ton of cement produced basis. The volume of cement kiln dust appears to be declining, and according to industry data, is 24 CEMEX, “10 Cement Companies Pledge Specific Actions on 6 High Priority Issues for Sustainable Development,” July 3, 2003 Press Release. Available at www.cemex.com/qr/mc_pr_070302.asp.
Energy Use in the Cement Industry in North America: Emissions, Waste Generation and Pollution Control
35
being better managed, in part in response to proposed EPA standards. However, significant problems with CKD management appear to continue, and the threat of considering CKD as a hazardous waste – requring more stringent regulations – has been put on hold. New toxic air emission standards known as “MACT” standards will gradually force the cement industry to reduce toxic and other emissions, however. Still, new regulations will not likely influence fuel choices to a great degree, even as it forces the industry to burn fuel more cleanly by installing more modern pollution control equipment. Requirements to reduce nitrogen oxide and other criteria air pollutants has led some cement kilns to turn toward greater use of alternative fuels like tires. While nitrogen oxide emissions are decreased, other emissions may be increased by this energy input decision. New regulations on global greenhouse emissions are unlikely in the U.S., although pressure for voluntary cuts, as well as steps being taken by international cement companies to better account for their emissions could eventually lead to significant cuts in this area and potentially influence fuel choice as well as the choice of alternatives to limestone to decrease process carbon dioxide emissions.
4.0. The Mexican Cement Industry
4.1 Introduction
This section reviews the present situation of the Mexican cement industry, with a particular focus on energy consumed and on the increasing use of hazardous and other wastes as an alternative to traditional fuels. Commercial and environmental factors are discussed, as well as the present regulatory approach to control emissions and waste products from the cement manufacturing process. A central concern of this section is the lack of information in Mexico about the use of hazardous wastes as a fuel and their impacts, which throughout the world are being promoted as an input to those industries – like cement manufacturing – which consume vast quantities of energy.
4.2 An Overview of Trends in Production, Exports, Ownership, Investments, Energy Use and Pollutant Releases.
4.2.1 Number of Plants, Production and Exports
Production of cement in Mexico rose more than 25 percent between 1990 and 2001. Nonetheless, production rose most rapidly between 1990 and 1994, when more than 30,000 tons were produced. Devaluation of the peso and a subsequent loss of demand
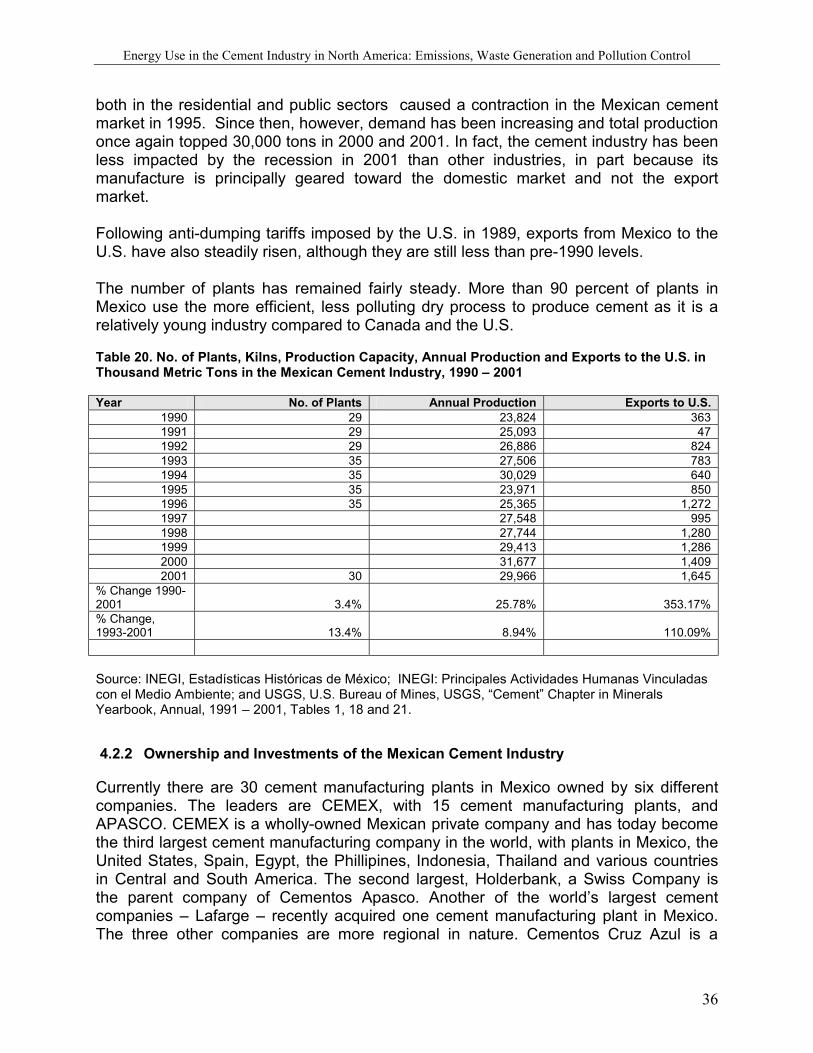
Energy Use in the Cement Industry in North America: Emissions, Waste Generation and Pollution Control
36
both in the residential and public sectors caused a contraction in the Mexican cement market in 1995. Since then, however, demand has been increasing and total production once again topped 30,000 tons in 2000 and 2001. In fact, the cement industry has been less impacted by the recession in 2001 than other industries, in part because its manufacture is principally geared toward the domestic market and not the export market. Following anti-dumping tariffs imposed by the U.S. in 1989, exports from Mexico to the U.S. have also steadily risen, although they are still less than pre-1990 levels. The number of plants has remained fairly steady. More than 90 percent of plants in Mexico use the more efficient, less polluting dry process to produce cement as it is a relatively young industry compared to Canada and the U.S. Table 20. No. of Plants, Kilns, Production Capacity, Annual Production and Exports to the U.S. in Thousand Metric Tons in the Mexican Cement Industry, 1990 – 2001 Year No. of Plants Annual Production Exports to U.S.
1990 29 23,824 363 1991 29 25,093 47 1992 29 26,886 824 1993 35 27,506 783 1994 35 30,029 640 1995 35 23,971 850 1996 35 25,365 1,272 1997 27,548 995 1998 27,744 1,280 1999 29,413 1,286 2000 31,677 1,409 2001 30 29,966 1,645
% Change 1990-2001 3.4% 25.78% 353.17% % Change, 1993-2001 13.4% 8.94% 110.09% Source: INEGI, Estadísticas Históricas de México; INEGI: Principales Actividades Humanas Vinculadas con el Medio Ambiente; and USGS, U.S. Bureau of Mines, USGS, “Cement” Chapter in Minerals Yearbook, Annual, 1991 – 2001, Tables 1, 18 and 21.
4.2.2 Ownership and Investments of the Mexican Cement Industry
Currently there are 30 cement manufacturing plants in Mexico owned by six different companies. The leaders are CEMEX, with 15 cement manufacturing plants, and APASCO. CEMEX is a wholly-owned Mexican private company and has today become the third largest cement manufacturing company in the world, with plants in Mexico, the United States, Spain, Egypt, the Phillipines, Indonesia, Thailand and various countries in Central and South America. The second largest, Holderbank, a Swiss Company is the parent company of Cementos Apasco. Another of the world’s largest cement companies – Lafarge – recently acquired one cement manufacturing plant in Mexico. The three other companies are more regional in nature. Cementos Cruz Azul is a
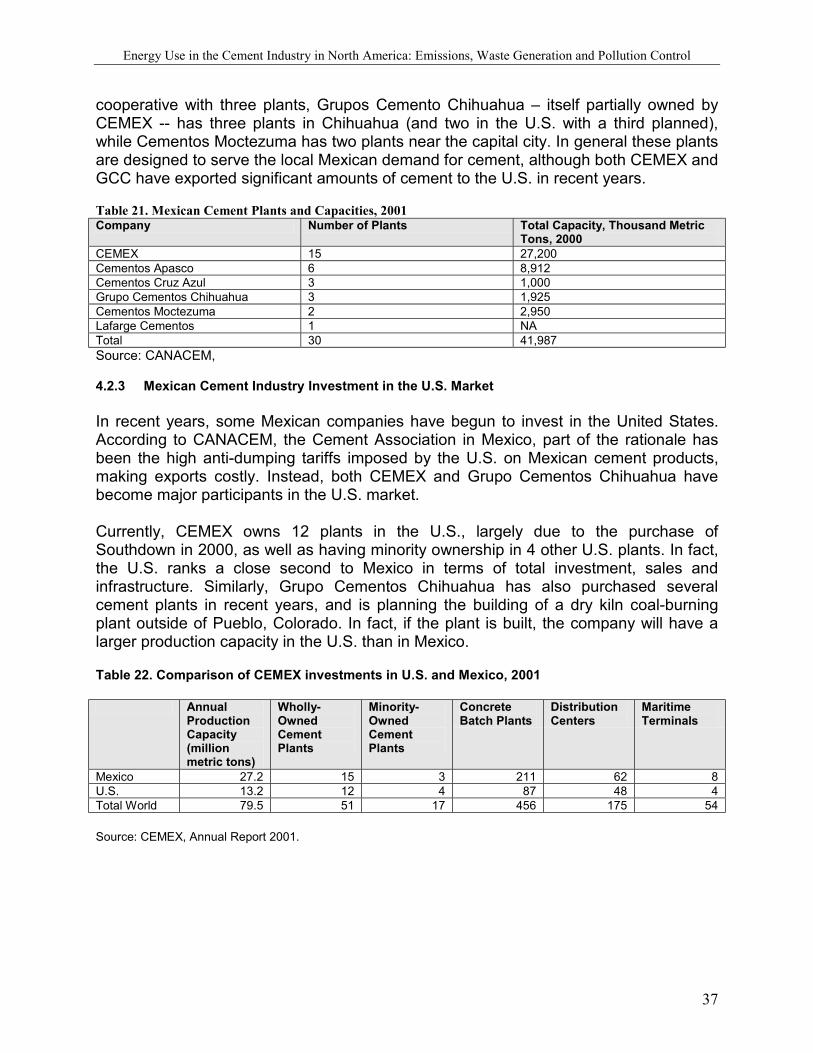
Energy Use in the Cement Industry in North America: Emissions, Waste Generation and Pollution Control
37
cooperative with three plants, Grupos Cemento Chihuahua – itself partially owned by CEMEX -- has three plants in Chihuahua (and two in the U.S. with a third planned), while Cementos Moctezuma has two plants near the capital city. In general these plants are designed to serve the local Mexican demand for cement, although both CEMEX and GCC have exported significant amounts of cement to the U.S. in recent years. Table 21. Mexican Cement Plants and Capacities, 2001 Company Number of Plants Total Capacity, Thousand Metric
Tons, 2000 CEMEX 15 27,200 Cementos Apasco 6 8,912 Cementos Cruz Azul 3 1,000 Grupo Cementos Chihuahua 3 1,925 Cementos Moctezuma 2 2,950 Lafarge Cementos 1 NA Total 30 41,987 Source: CANACEM, 4.2.3 Mexican Cement Industry Investment in the U.S. Market In recent years, some Mexican companies have begun to invest in the United States. According to CANACEM, the Cement Association in Mexico, part of the rationale has been the high anti-dumping tariffs imposed by the U.S. on Mexican cement products, making exports costly. Instead, both CEMEX and Grupo Cementos Chihuahua have become major participants in the U.S. market. Currently, CEMEX owns 12 plants in the U.S., largely due to the purchase of Southdown in 2000, as well as having minority ownership in 4 other U.S. plants. In fact, the U.S. ranks a close second to Mexico in terms of total investment, sales and infrastructure. Similarly, Grupo Cementos Chihuahua has also purchased several cement plants in recent years, and is planning the building of a dry kiln coal-burning plant outside of Pueblo, Colorado. In fact, if the plant is built, the company will have a larger production capacity in the U.S. than in Mexico. Table 22. Comparison of CEMEX investments in U.S. and Mexico, 2001 Annual
Production Capacity (million metric tons)
Wholly-Owned Cement Plants
Minority-Owned Cement Plants
Concrete Batch Plants
Distribution Centers
Maritime Terminals
Mexico 27.2 15 3 211 62 8 U.S. 13.2 12 4 87 48 4 Total World 79.5 51 17 456 175 54 Source: CEMEX, Annual Report 2001.
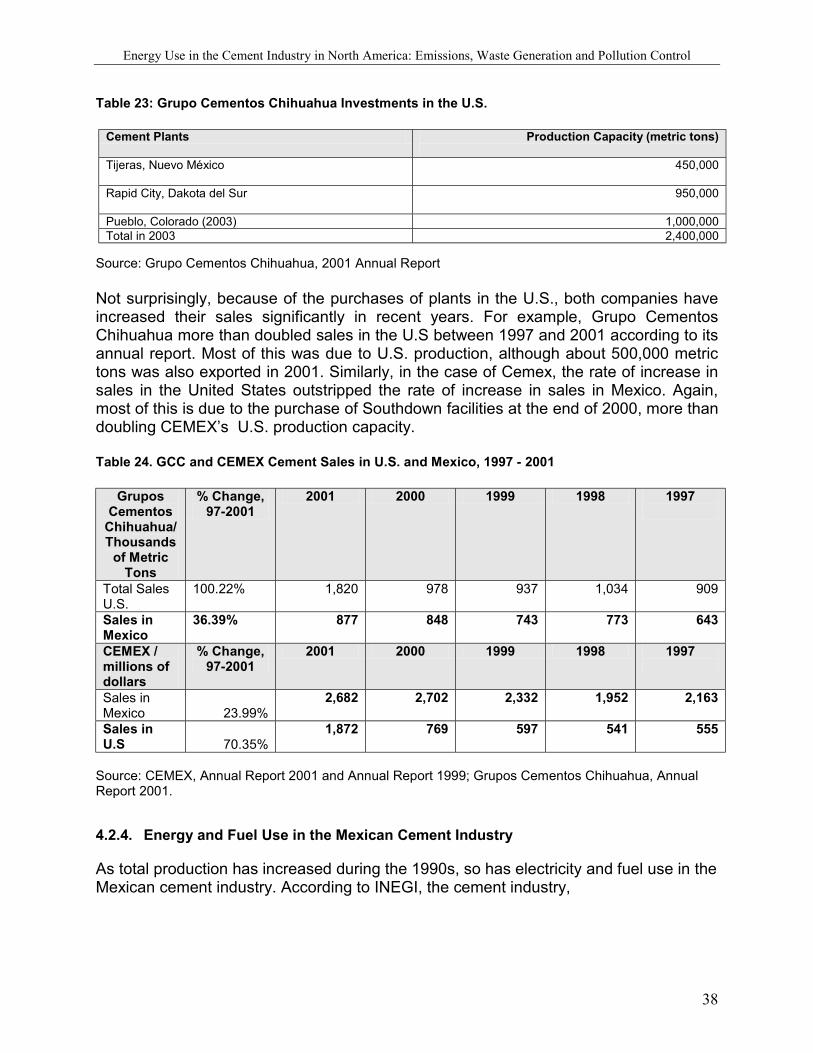
Energy Use in the Cement Industry in North America: Emissions, Waste Generation and Pollution Control
38
Table 23: Grupo Cementos Chihuahua Investments in the U.S.
Cement Plants Production Capacity (metric tons)
Tijeras, Nuevo México
450,000
Rapid City, Dakota del Sur
950,000
Pueblo, Colorado (2003) 1,000,000 Total in 2003 2,400,000
Source: Grupo Cementos Chihuahua, 2001 Annual Report Not surprisingly, because of the purchases of plants in the U.S., both companies have increased their sales significantly in recent years. For example, Grupo Cementos Chihuahua more than doubled sales in the U.S between 1997 and 2001 according to its annual report. Most of this was due to U.S. production, although about 500,000 metric tons was also exported in 2001. Similarly, in the case of Cemex, the rate of increase in sales in the United States outstripped the rate of increase in sales in Mexico. Again, most of this is due to the purchase of Southdown facilities at the end of 2000, more than doubling CEMEX’s U.S. production capacity. Table 24. GCC and CEMEX Cement Sales in U.S. and Mexico, 1997 - 2001
Grupos Cementos
Chihuahua/ Thousands
of Metric Tons
% Change, 97-2001
2001 2000 1999 1998 1997
Total Sales U.S.
100.22% 1,820 978 937 1,034 909
Sales in Mexico
36.39% 877 848 743 773 643
CEMEX / millions of dollars
% Change, 97-2001
2001 2000 1999 1998 1997
Sales in Mexico 23.99%
2,682 2,702 2,332 1,952 2,163
Sales in U.S 70.35%
1,872 769 597 541 555
Source: CEMEX, Annual Report 2001 and Annual Report 1999; Grupos Cementos Chihuahua, Annual Report 2001.
4.2.4. Energy and Fuel Use in the Mexican Cement Industry
As total production has increased during the 1990s, so has electricity and fuel use in the Mexican cement industry. According to INEGI, the cement industry,
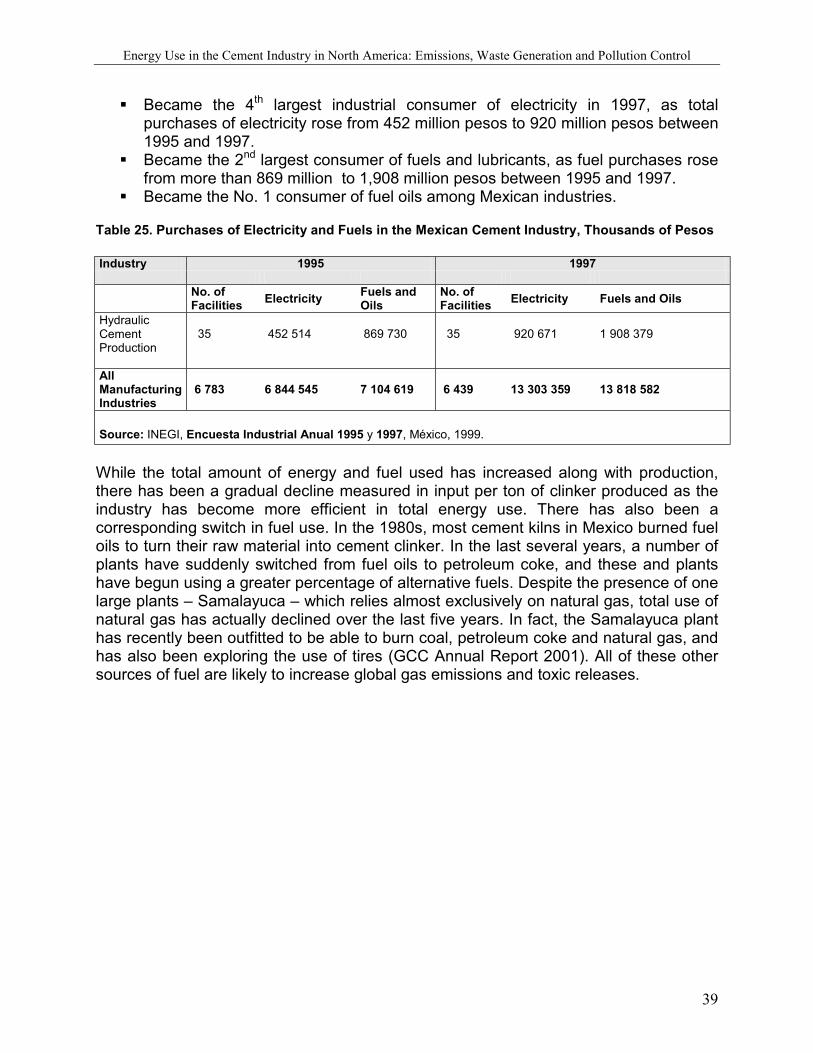
Energy Use in the Cement Industry in North America: Emissions, Waste Generation and Pollution Control
39
Became the 4th largest industrial consumer of electricity in 1997, as total purchases of electricity rose from 452 million pesos to 920 million pesos between 1995 and 1997.
Became the 2nd largest consumer of fuels and lubricants, as fuel purchases rose from more than 869 million to 1,908 million pesos between 1995 and 1997.
Became the No. 1 consumer of fuel oils among Mexican industries. Table 25. Purchases of Electricity and Fuels in the Mexican Cement Industry, Thousands of Pesos Industry 1995 1997 No. of
Facilities Electricity Fuels and Oils
No. of Facilities Electricity Fuels and Oils
Hydraulic Cement Production
35 452 514 869 730 35 920 671 1 908 379
All Manufacturing Industries
6 783 6 844 545 7 104 619 6 439 13 303 359 13 818 582
Source: INEGI, Encuesta Industrial Anual 1995 y 1997, México, 1999.
While the total amount of energy and fuel used has increased along with production, there has been a gradual decline measured in input per ton of clinker produced as the industry has become more efficient in total energy use. There has also been a corresponding switch in fuel use. In the 1980s, most cement kilns in Mexico burned fuel oils to turn their raw material into cement clinker. In the last several years, a number of plants have suddenly switched from fuel oils to petroleum coke, and these and plants have begun using a greater percentage of alternative fuels. Despite the presence of one large plants – Samalayuca – which relies almost exclusively on natural gas, total use of natural gas has actually declined over the last five years. In fact, the Samalayuca plant has recently been outfitted to be able to burn coal, petroleum coke and natural gas, and has also been exploring the use of tires (GCC Annual Report 2001). All of these other sources of fuel are likely to increase global gas emissions and toxic releases.
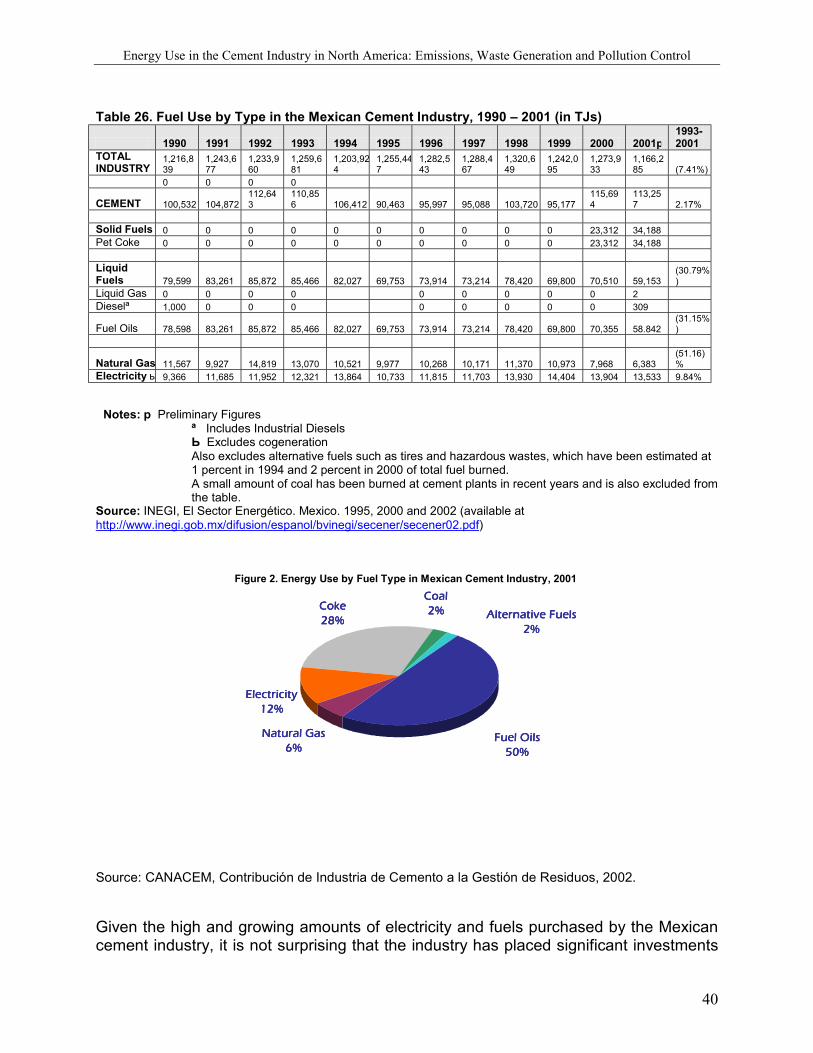
Energy Use in the Cement Industry in North America: Emissions, Waste Generation and Pollution Control
40
Table 26. Fuel Use by Type in the Mexican Cement Industry, 1990 – 2001 (in TJs)
1990 1991 1992 1993 1994 1995 1996 1997 1998 1999 2000 2001р 1993-2001
TOTAL INDUSTRY
1,216,839
1,243,677
1,233,960
1,259,681
1,203,924
1,255,447
1,282,543
1,288,467
1,320,649
1,242,095
1,273,933
1,166,285 (7.41%)
0 0 0 0
CEMENT 100,532 104,872 112,643
110,856 106,412 90,463 95,997 95,088 103,720 95,177
115,694
113,257 2.17%
Solid Fuels 0 0 0 0 0 0 0 0 0 0 23,312 34,188 Pet Coke 0 0 0 0 0 0 0 0 0 0 23,312 34,188 Liquid Fuels 79,599 83,261 85,872 85,466 82,027 69,753 73,914 73,214 78,420 69,800 70,510 59,153
(30.79%)
Liquid Gas 0 0 0 0 0 0 0 0 0 2 Dieselª 1,000 0 0 0 0 0 0 0 0 309
Fuel Oils 78,598 83,261 85,872 85,466 82,027 69,753 73,914 73,214 78,420 69,800 70,355 58.842 (31.15%)
Natural Gas 11,567 9,927 14,819 13,070 10,521 9,977 10,268 10,171 11,370 10,973 7,968 6,383 (51.16)%
Electricity ь 9,366 11,685 11,952 12,321 13,864 10,733 11,815 11,703 13,930 14,404 13,904 13,533 9.84%
Notes: р Preliminary Figures
ª Includes Industrial Diesels Ь Excludes cogeneration Also excludes alternative fuels such as tires and hazardous wastes, which have been estimated at 1 percent in 1994 and 2 percent in 2000 of total fuel burned. A small amount of coal has been burned at cement plants in recent years and is also excluded from the table.
Source: INEGI, El Sector Energético. Mexico. 1995, 2000 and 2002 (available at http://www.inegi.gob.mx/difusion/espanol/bvinegi/secener/secener02.pdf)
Figure 2. Energy Use by Fuel Type in Mexican Cement Industry, 2001
Natural GasNatural GasNatural GasNatural Gas6%6%6%6%
ElectricityElectricityElectricityElectricity12%12%12%12%
Fuel OilsFuel OilsFuel OilsFuel Oils50%50%50%50%
CokeCokeCokeCoke28%28%28%28%
CoalCoalCoalCoal2%2%2%2% Alternative FuelsAlternative FuelsAlternative FuelsAlternative Fuels
2%2%2%2%
Source: CANACEM, Contribución de Industria de Cemento a la Gestión de Residuos, 2002.
Given the high and growing amounts of electricity and fuels purchased by the Mexican cement industry, it is not surprising that the industry has placed significant investments
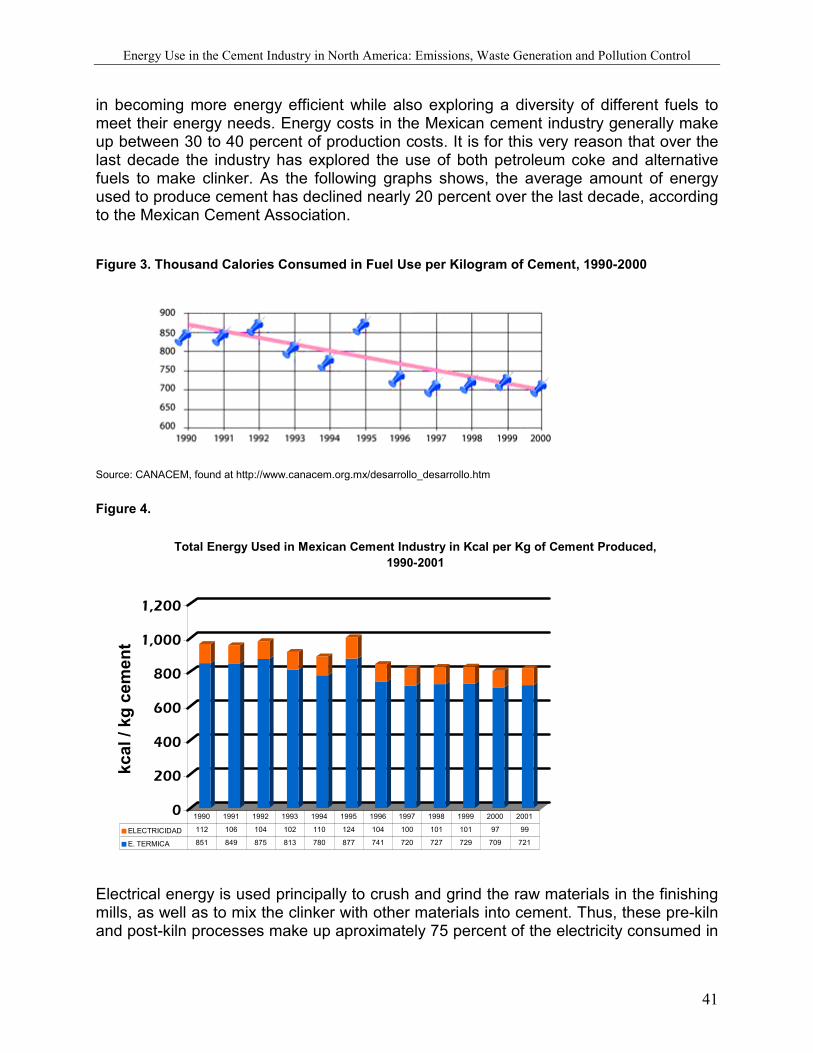
Energy Use in the Cement Industry in North America: Emissions, Waste Generation and Pollution Control
41
in becoming more energy efficient while also exploring a diversity of different fuels to meet their energy needs. Energy costs in the Mexican cement industry generally make up between 30 to 40 percent of production costs. It is for this very reason that over the last decade the industry has explored the use of both petroleum coke and alternative fuels to make clinker. As the following graphs shows, the average amount of energy used to produce cement has declined nearly 20 percent over the last decade, according to the Mexican Cement Association. Figure 3. Thousand Calories Consumed in Fuel Use per Kilogram of Cement, 1990-2000
Source: CANACEM, found at http://www.canacem.org.mx/desarrollo_desarrollo.htm
Figure 4.
0
200
400
600
800
1,000
1,200
kcal
/ kg
cem
ent
Total Energy Used in Mexican Cement Industry in Kcal per Kg of Cement Produced, 1990-2001
ELECTRICIDAD 112 106 104 102 110 124 104 100 101 101 97 99
E. TERMICA 851 849 875 813 780 877 741 720 727 729 709 721
1990 1991 1992 1993 1994 1995 1996 1997 1998 1999 2000 2001
Electrical energy is used principally to crush and grind the raw materials in the finishing mills, as well as to mix the clinker with other materials into cement. Thus, these pre-kiln and post-kiln processes make up aproximately 75 percent of the electricity consumed in
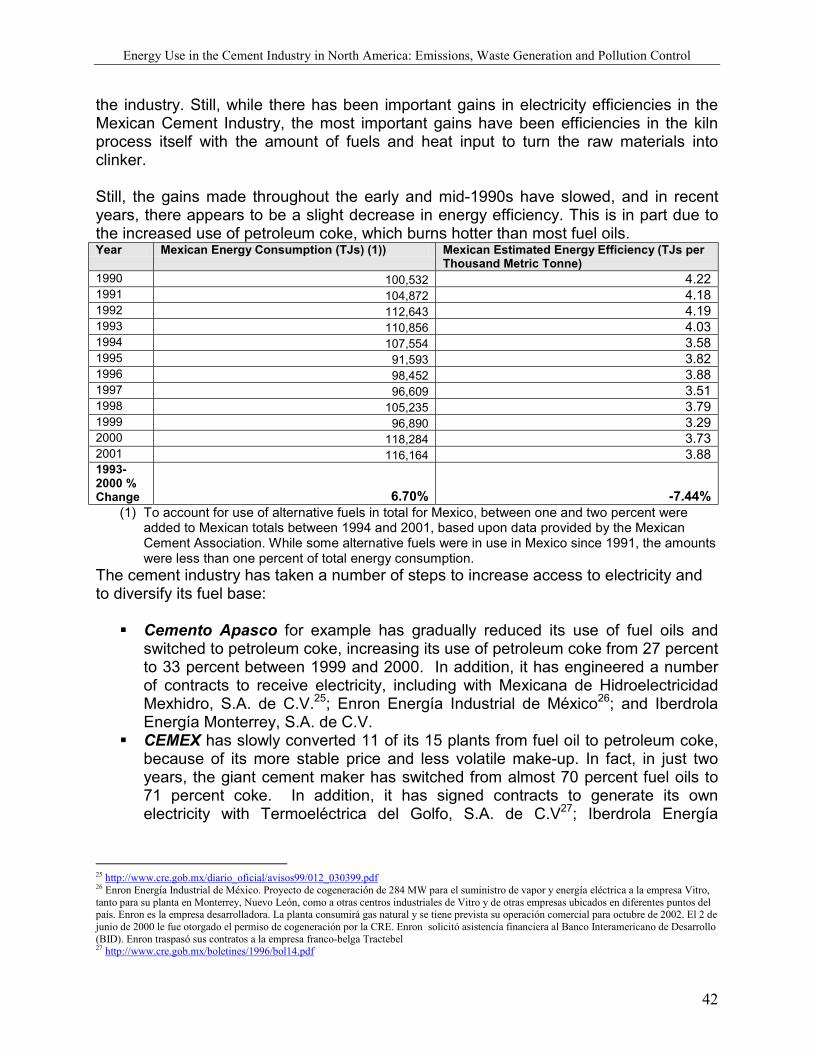
Energy Use in the Cement Industry in North America: Emissions, Waste Generation and Pollution Control
42
the industry. Still, while there has been important gains in electricity efficiencies in the Mexican Cement Industry, the most important gains have been efficiencies in the kiln process itself with the amount of fuels and heat input to turn the raw materials into clinker. Still, the gains made throughout the early and mid-1990s have slowed, and in recent years, there appears to be a slight decrease in energy efficiency. This is in part due to the increased use of petroleum coke, which burns hotter than most fuel oils. Year Mexican Energy Consumption (TJs) (1)) Mexican Estimated Energy Efficiency (TJs per
Thousand Metric Tonne) 1990 100,532 4.22 1991 104,872 4.18 1992 112,643 4.19 1993 110,856 4.03 1994 107,554 3.58 1995 91,593 3.82 1996 98,452 3.88 1997 96,609 3.51 1998 105,235 3.79 1999 96,890 3.29 2000 118,284 3.73 2001 116,164 3.88 1993-2000 % Change 6.70% -7.44%
(1) To account for use of alternative fuels in total for Mexico, between one and two percent were added to Mexican totals between 1994 and 2001, based upon data provided by the Mexican Cement Association. While some alternative fuels were in use in Mexico since 1991, the amounts were less than one percent of total energy consumption.
The cement industry has taken a number of steps to increase access to electricity and to diversify its fuel base: Cemento Apasco for example has gradually reduced its use of fuel oils and
switched to petroleum coke, increasing its use of petroleum coke from 27 percent to 33 percent between 1999 and 2000. In addition, it has engineered a number of contracts to receive electricity, including with Mexicana de Hidroelectricidad Mexhidro, S.A. de C.V.25; Enron Energía Industrial de México26; and Iberdrola Energía Monterrey, S.A. de C.V.
CEMEX has slowly converted 11 of its 15 plants from fuel oil to petroleum coke, because of its more stable price and less volatile make-up. In fact, in just two years, the giant cement maker has switched from almost 70 percent fuel oils to 71 percent coke. In addition, it has signed contracts to generate its own electricity with Termoeléctrica del Golfo, S.A. de C.V27; Iberdrola Energía
25 http://www.cre.gob.mx/diario_oficial/avisos99/012_030399.pdf 26 Enron Energía Industrial de México. Proyecto de cogeneración de 284 MW para el suministro de vapor y energía eléctrica a la empresa Vitro, tanto para su planta en Monterrey, Nuevo León, como a otras centros industriales de Vitro y de otras empresas ubicados en diferentes puntos del país. Enron es la empresa desarrolladora. La planta consumirá gas natural y se tiene prevista su operación comercial para octubre de 2002. El 2 de junio de 2000 le fue otorgado el permiso de cogeneración por la CRE. Enron solicitó asistencia financiera al Banco Interamericano de Desarrollo (BID). Enron traspasó sus contratos a la empresa franco-belga Tractebel 27 http://www.cre.gob.mx/boletines/1996/bol14.pdf
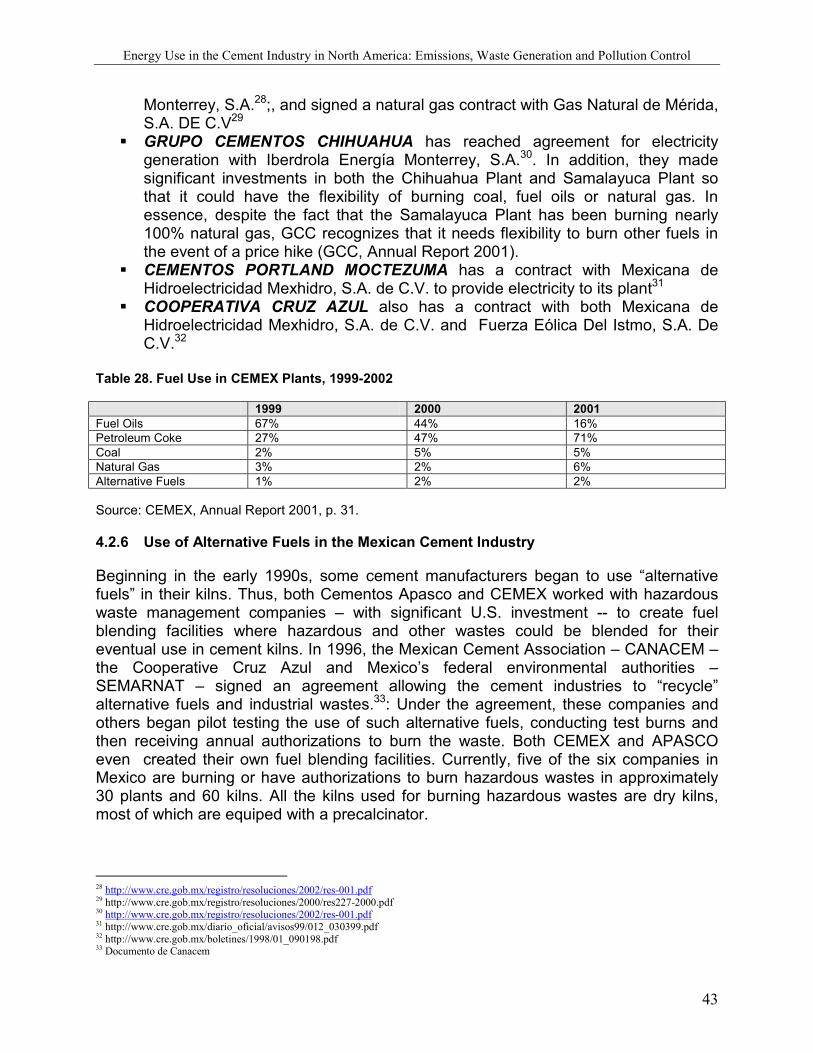
Energy Use in the Cement Industry in North America: Emissions, Waste Generation and Pollution Control
43
Monterrey, S.A.28;, and signed a natural gas contract with Gas Natural de Mérida, S.A. DE C.V29
GRUPO CEMENTOS CHIHUAHUA has reached agreement for electricity generation with Iberdrola Energía Monterrey, S.A.30. In addition, they made significant investments in both the Chihuahua Plant and Samalayuca Plant so that it could have the flexibility of burning coal, fuel oils or natural gas. In essence, despite the fact that the Samalayuca Plant has been burning nearly 100% natural gas, GCC recognizes that it needs flexibility to burn other fuels in the event of a price hike (GCC, Annual Report 2001).
CEMENTOS PORTLAND MOCTEZUMA has a contract with Mexicana de Hidroelectricidad Mexhidro, S.A. de C.V. to provide electricity to its plant31
COOPERATIVA CRUZ AZUL also has a contract with both Mexicana de Hidroelectricidad Mexhidro, S.A. de C.V. and Fuerza Eólica Del Istmo, S.A. De C.V.32
Table 28. Fuel Use in CEMEX Plants, 1999-2002 1999 2000 2001 Fuel Oils 67% 44% 16% Petroleum Coke 27% 47% 71% Coal 2% 5% 5% Natural Gas 3% 2% 6% Alternative Fuels 1% 2% 2% Source: CEMEX, Annual Report 2001, p. 31.
4.2.6 Use of Alternative Fuels in the Mexican Cement Industry
Beginning in the early 1990s, some cement manufacturers began to use “alternative fuels” in their kilns. Thus, both Cementos Apasco and CEMEX worked with hazardous waste management companies – with significant U.S. investment -- to create fuel blending facilities where hazardous and other wastes could be blended for their eventual use in cement kilns. In 1996, the Mexican Cement Association – CANACEM – the Cooperative Cruz Azul and Mexico’s federal environmental authorities – SEMARNAT – signed an agreement allowing the cement industries to “recycle” alternative fuels and industrial wastes.33: Under the agreement, these companies and others began pilot testing the use of such alternative fuels, conducting test burns and then receiving annual authorizations to burn the waste. Both CEMEX and APASCO even created their own fuel blending facilities. Currently, five of the six companies in Mexico are burning or have authorizations to burn hazardous wastes in approximately 30 plants and 60 kilns. All the kilns used for burning hazardous wastes are dry kilns, most of which are equiped with a precalcinator.
28 http://www.cre.gob.mx/registro/resoluciones/2002/res-001.pdf 29 http://www.cre.gob.mx/registro/resoluciones/2000/res227-2000.pdf 30 http://www.cre.gob.mx/registro/resoluciones/2002/res-001.pdf 31 http://www.cre.gob.mx/diario_oficial/avisos99/012_030399.pdf 32 http://www.cre.gob.mx/boletines/1998/01_090198.pdf 33 Documento de Canacem
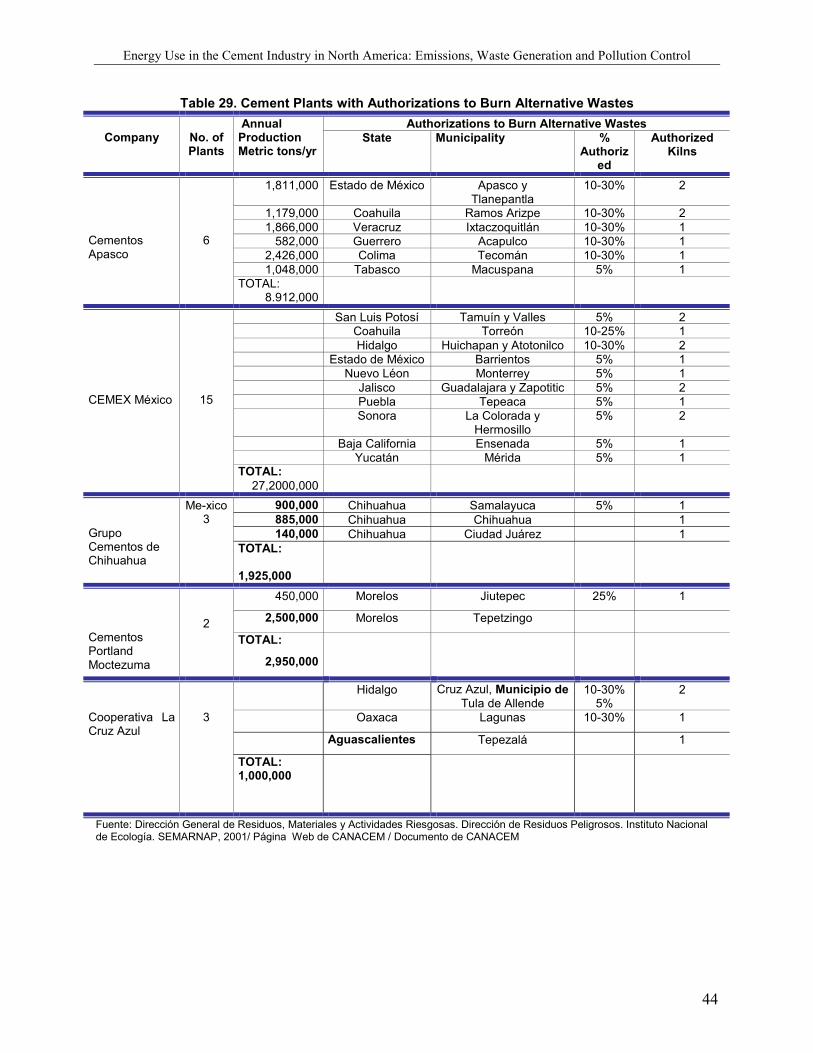
Energy Use in the Cement Industry in North America: Emissions, Waste Generation and Pollution Control
44
Table 29. Cement Plants with Authorizations to Burn Alternative Wastes Authorizations to Burn Alternative Wastes
Company
No. of Plants
Annual Production Metric tons/yr
State Municipality % Authoriz
ed
Authorized Kilns
1,811,000 Estado de México Apasco y Tlanepantla
10-30% 2
1,179,000 Coahuila Ramos Arizpe 10-30% 2 1,866,000 Veracruz Ixtaczoquitlán 10-30% 1
582,000 Guerrero Acapulco 10-30% 1 2,426,000 Colima Tecomán 10-30% 1 1,048,000 Tabasco Macuspana 5% 1
Cementos Apasco
6
TOTAL: 8.912,000
San Luis Potosí Tamuín y Valles 5% 2 Coahuila Torreón 10-25% 1 Hidalgo Huichapan y Atotonilco 10-30% 2 Estado de México Barrientos 5% 1 Nuevo Léon Monterrey 5% 1 Jalisco Guadalajara y Zapotitic 5% 2 Puebla Tepeaca 5% 1 Sonora La Colorada y
Hermosillo 5% 2
Baja California Ensenada 5% 1 Yucatán Mérida 5% 1
CEMEX México
15
TOTAL: 27,2000,000
900,000 Chihuahua Samalayuca 5% 1 885,000 Chihuahua Chihuahua 1 140,000 Chihuahua Ciudad Juárez 1
Grupo Cementos de Chihuahua
Me-xico 3
TOTAL: 1,925,000
450,000 Morelos Jiutepec 25% 1
2,500,000 Morelos Tepetzingo
Cementos Portland Moctezuma
2
TOTAL:
2,950,000
Hidalgo Cruz Azul, Municipio de Tula de Allende
10-30% 5%
2
Oaxaca Lagunas 10-30% 1
Aguascalientes Tepezalá 1
Cooperativa La Cruz Azul
3
TOTAL: 1,000,000
Fuente: Dirección General de Residuos, Materiales y Actividades Riesgosas. Dirección de Residuos Peligrosos. Instituto Nacional de Ecología. SEMARNAP, 2001/ Página Web de CANACEM / Documento de CANACEM
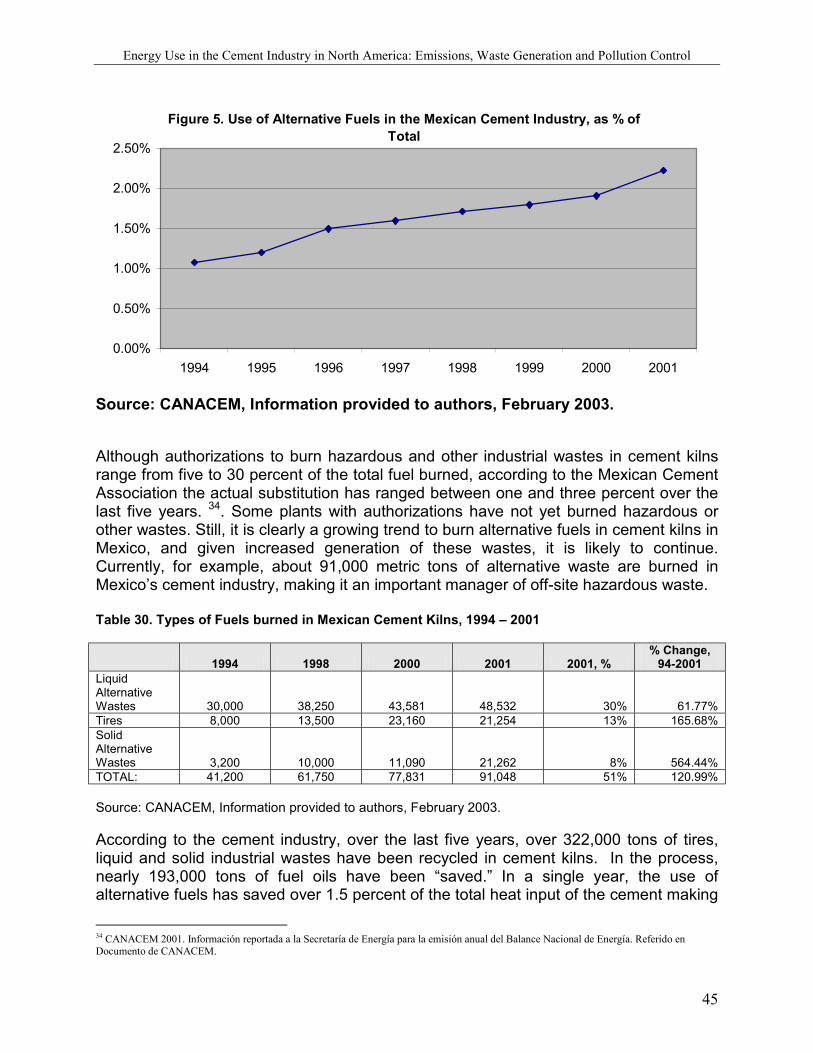
Energy Use in the Cement Industry in North America: Emissions, Waste Generation and Pollution Control
45
Figure 5. Use of Alternative Fuels in the Mexican Cement Industry, as % of Total
0.00%
0.50%
1.00%
1.50%
2.00%
2.50%
1994 1995 1996 1997 1998 1999 2000 2001
Source: CANACEM, Information provided to authors, February 2003. Although authorizations to burn hazardous and other industrial wastes in cement kilns range from five to 30 percent of the total fuel burned, according to the Mexican Cement Association the actual substitution has ranged between one and three percent over the last five years. 34. Some plants with authorizations have not yet burned hazardous or other wastes. Still, it is clearly a growing trend to burn alternative fuels in cement kilns in Mexico, and given increased generation of these wastes, it is likely to continue. Currently, for example, about 91,000 metric tons of alternative waste are burned in Mexico’s cement industry, making it an important manager of off-site hazardous waste. Table 30. Types of Fuels burned in Mexican Cement Kilns, 1994 – 2001
1994 1998 2000 2001 2001, % % Change,
94-2001 Liquid Alternative Wastes 30,000 38,250 43,581 48,532 30% 61.77% Tires 8,000 13,500 23,160 21,254 13% 165.68% Solid Alternative Wastes 3,200 10,000 11,090 21,262 8% 564.44% TOTAL: 41,200 61,750 77,831 91,048 51% 120.99% Source: CANACEM, Information provided to authors, February 2003. According to the cement industry, over the last five years, over 322,000 tons of tires, liquid and solid industrial wastes have been recycled in cement kilns. In the process, nearly 193,000 tons of fuel oils have been “saved.” In a single year, the use of alternative fuels has saved over 1.5 percent of the total heat input of the cement making
34 CANACEM 2001. Información reportada a la Secretaría de Energía para la emisión anual del Balance Nacional de Energía. Referido en Documento de CANACEM.

Energy Use in the Cement Industry in North America: Emissions, Waste Generation and Pollution Control
46
process, equivalent to gasoline use of 125,000 cars over an entire year. In essence the use of alternative fuels has allowed the cement industry to save money and fuel Table 31. Wastes Utilized in Mexican Cement Kilns
Liquids Solids Used Oils and Solvents Resins Contaminated Solids Fondos de columnas de destilación Textiles Tires Paints, Thiners, Varnishes Leather Contaminated Soils Contaminated Hydrocarbons Rubber Used Catalytic Converters Greases and Waxes Plastics Organic and Refining Sludge Woods Recortes de perforación Papers Source:Instituto Nacional de Ecología In the process, the cement industry has become one of the leading “recyclers” of hazardous waste in Mexico. It is estimated that the cement kilns authorized to burn industrial wastes represent about 50 percent of all capacity to “recycle” hazardous wastes and about 20 percent of the total capacity to manage hazardous waste in Mexico (see table). Table 32. Installed Capacity to Recycle Hazardous Waste in Mexico, 2000 Type of Facility Installed Capacity (metric tons/year). Used Oil Recycling 116,181 Used Solvents 197,369 Liquid Photography Recycling 5 Textile Recycling 300 Metal Recycling 504,913 Used Drum Recycling 44,863 Paints 17,655 Others 3,668 Energy Recycling (*) 1'249,841 TOTAL 2'134,795 (*) Fuel Blending 806,756 Source: Instituto Nactional de Ecología, July 2000. The cement industry argues that both the high temperatures in the kilns (above 2000ºC); the long duration of time of the fuels within the kilns (3 seconds at more than 1200 ºC); as well as the highly turbulent nature of the process permits alternative fuels to be used in a controled, safe fashion. Nonetheless, there is currently a lack of information about the types of emissions and the impact they might have on human health and the environment. In addition, it is unclear whether the added burning of these industrial wastes could lead to higher levels of metals or organics in the clinker itself or cement kiln dust, or what the impacts of these might be. The next section discusses the possible impacts on air emissions of the burning of both conventional and alternative fuels in Mexico
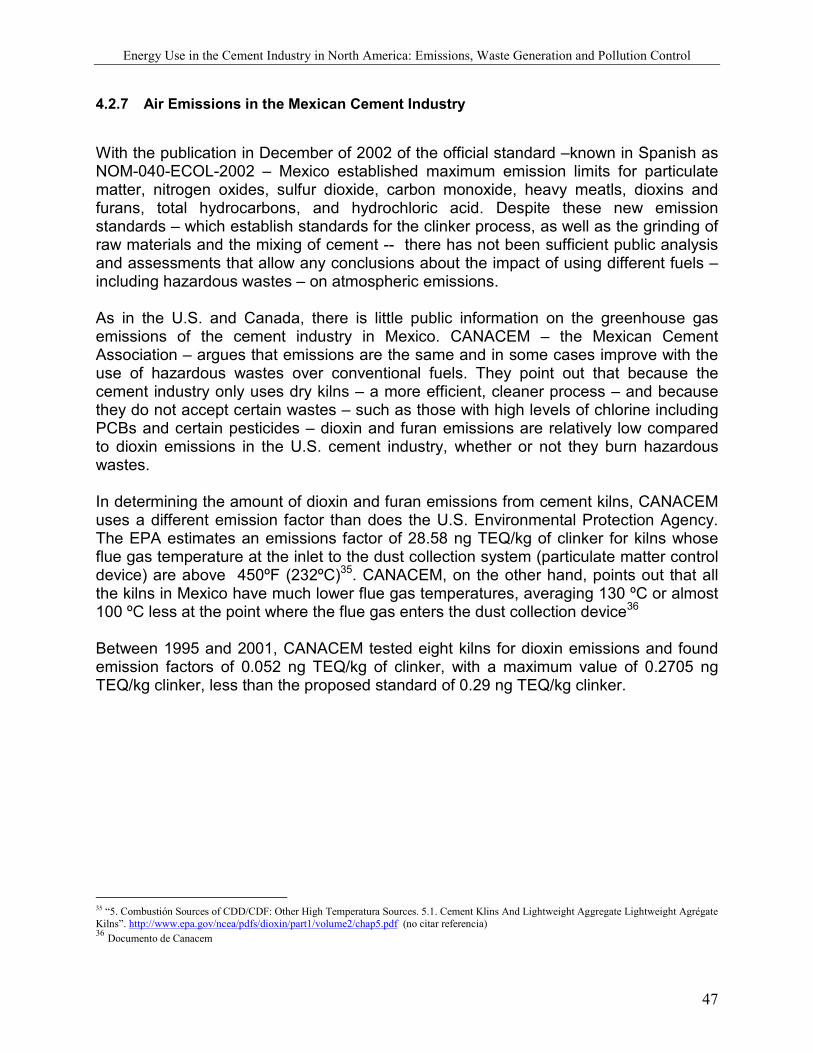
Energy Use in the Cement Industry in North America: Emissions, Waste Generation and Pollution Control
47
4.2.7 Air Emissions in the Mexican Cement Industry
With the publication in December of 2002 of the official standard –known in Spanish as NOM-040-ECOL-2002 – Mexico established maximum emission limits for particulate matter, nitrogen oxides, sulfur dioxide, carbon monoxide, heavy meatls, dioxins and furans, total hydrocarbons, and hydrochloric acid. Despite these new emission standards – which establish standards for the clinker process, as well as the grinding of raw materials and the mixing of cement -- there has not been sufficient public analysis and assessments that allow any conclusions about the impact of using different fuels – including hazardous wastes – on atmospheric emissions. As in the U.S. and Canada, there is little public information on the greenhouse gas emissions of the cement industry in Mexico. CANACEM – the Mexican Cement Association – argues that emissions are the same and in some cases improve with the use of hazardous wastes over conventional fuels. They point out that because the cement industry only uses dry kilns – a more efficient, cleaner process – and because they do not accept certain wastes – such as those with high levels of chlorine including PCBs and certain pesticides – dioxin and furan emissions are relatively low compared to dioxin emissions in the U.S. cement industry, whether or not they burn hazardous wastes. In determining the amount of dioxin and furan emissions from cement kilns, CANACEM uses a different emission factor than does the U.S. Environmental Protection Agency. The EPA estimates an emissions factor of 28.58 ng TEQ/kg of clinker for kilns whose flue gas temperature at the inlet to the dust collection system (particulate matter control device) are above 450ºF (232ºC)35. CANACEM, on the other hand, points out that all the kilns in Mexico have much lower flue gas temperatures, averaging 130 ºC or almost 100 ºC less at the point where the flue gas enters the dust collection device36 Between 1995 and 2001, CANACEM tested eight kilns for dioxin emissions and found emission factors of 0.052 ng TEQ/kg of clinker, with a maximum value of 0.2705 ng TEQ/kg clinker, less than the proposed standard of 0.29 ng TEQ/kg clinker.
35 “5. Combustión Sources of CDD/CDF: Other High Temperatura Sources. 5.1. Cement Klins And Lightweight Aggregate Lightweight Agrégate Kilns”. http://www.epa.gov/ncea/pdfs/dioxin/part1/volume2/chap5.pdf (no citar referencia) 36 Documento de Canacem
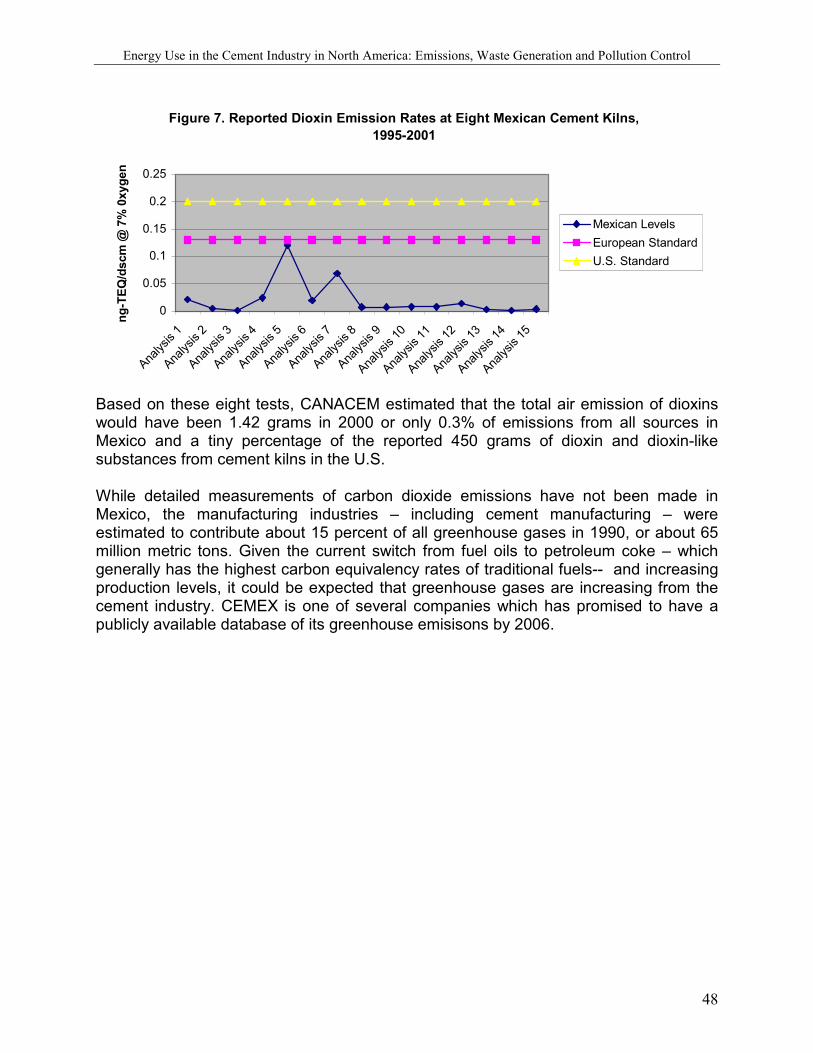
Energy Use in the Cement Industry in North America: Emissions, Waste Generation and Pollution Control
48
Figure 7. Reported Dioxin Emission Rates at Eight Mexican Cement Kilns, 1995-2001
0
0.05
0.1
0.15
0.2
0.25
Analys
is 1
Analys
is 2
Analys
is 3
Analys
is 4
Analys
is 5
Analys
is 6
Analys
is 7
Analys
is 8
Analys
is 9
Analys
is 10
Analys
is 11
Analys
is 12
Analys
is 13
Analys
is 14
Analys
is 15
ng-T
EQ/d
scm
@ 7
% 0
xyge
n
Mexican LevelsEuropean StandardU.S. Standard
Based on these eight tests, CANACEM estimated that the total air emission of dioxins would have been 1.42 grams in 2000 or only 0.3% of emissions from all sources in Mexico and a tiny percentage of the reported 450 grams of dioxin and dioxin-like substances from cement kilns in the U.S. While detailed measurements of carbon dioxide emissions have not been made in Mexico, the manufacturing industries – including cement manufacturing – were estimated to contribute about 15 percent of all greenhouse gases in 1990, or about 65 million metric tons. Given the current switch from fuel oils to petroleum coke – which generally has the highest carbon equivalency rates of traditional fuels-- and increasing production levels, it could be expected that greenhouse gases are increasing from the cement industry. CEMEX is one of several companies which has promised to have a publicly available database of its greenhouse emisisons by 2006.
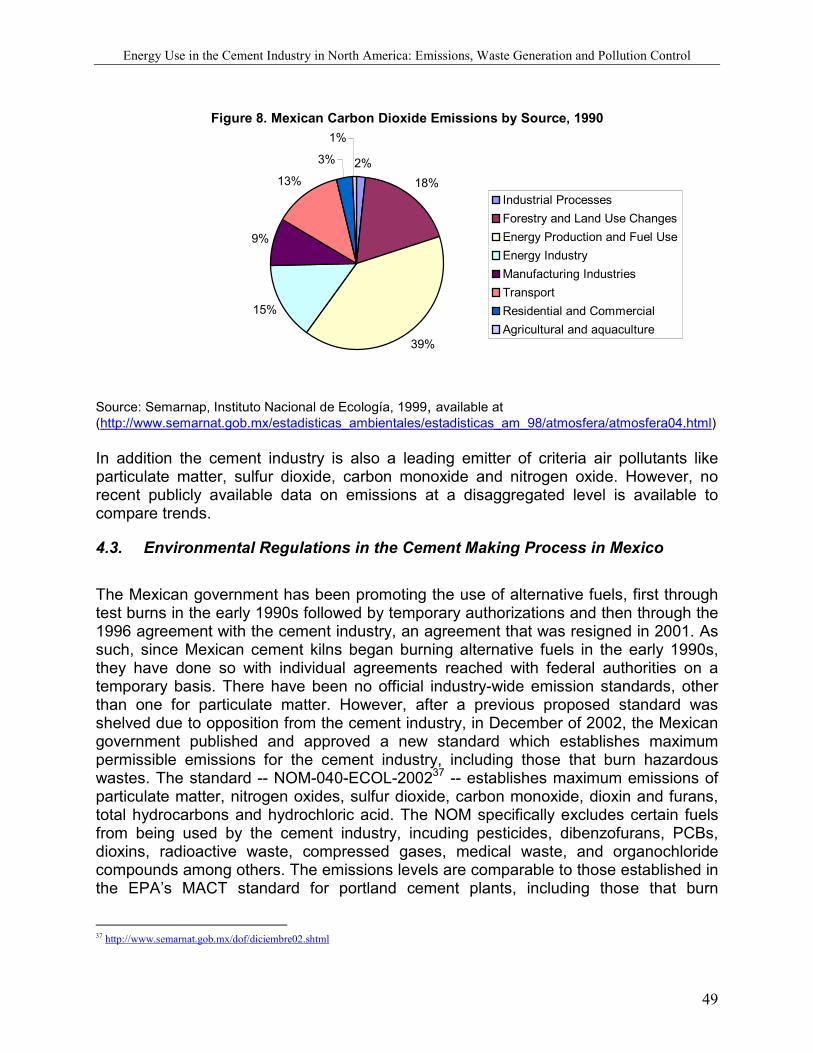
Energy Use in the Cement Industry in North America: Emissions, Waste Generation and Pollution Control
49
Figure 8. Mexican Carbon Dioxide Emissions by Source, 1990
2%18%
39%
15%
9%
13%
3%
1%
Industrial ProcessesForestry and Land Use ChangesEnergy Production and Fuel UseEnergy IndustryManufacturing IndustriesTransportResidential and CommercialAgricultural and aquaculture
Source: Semarnap, Instituto Nacional de Ecología, 1999, available at (http://www.semarnat.gob.mx/estadisticas_ambientales/estadisticas_am_98/atmosfera/atmosfera04.html) In addition the cement industry is also a leading emitter of criteria air pollutants like particulate matter, sulfur dioxide, carbon monoxide and nitrogen oxide. However, no recent publicly available data on emissions at a disaggregated level is available to compare trends.
4.3. Environmental Regulations in the Cement Making Process in Mexico
The Mexican government has been promoting the use of alternative fuels, first through test burns in the early 1990s followed by temporary authorizations and then through the 1996 agreement with the cement industry, an agreement that was resigned in 2001. As such, since Mexican cement kilns began burning alternative fuels in the early 1990s, they have done so with individual agreements reached with federal authorities on a temporary basis. There have been no official industry-wide emission standards, other than one for particulate matter. However, after a previous proposed standard was shelved due to opposition from the cement industry, in December of 2002, the Mexican government published and approved a new standard which establishes maximum permissible emissions for the cement industry, including those that burn hazardous wastes. The standard -- NOM-040-ECOL-200237 -- establishes maximum emissions of particulate matter, nitrogen oxides, sulfur dioxide, carbon monoxide, dioxin and furans, total hydrocarbons and hydrochloric acid. The NOM specifically excludes certain fuels from being used by the cement industry, incuding pesticides, dibenzofurans, PCBs, dioxins, radioactive waste, compressed gases, medical waste, and organochloride compounds among others. The emissions levels are comparable to those established in the EPA’s MACT standard for portland cement plants, including those that burn
37 http://www.semarnat.gob.mx/dof/diciembre02.shtml
Energy Use in the Cement Industry in North America: Emissions, Waste Generation and Pollution Control
50
hazardous wastes, although they are not as stringent as proposed European Union standards. By establishing the same standards for both those factories that burn hazardous wastes and those that do not, the standard states that “the recuperation of energy from wastes does not substantially modify emissions from the cement industry compared to those using conventional fuels.” In fact, the only change in the standard is in the frequency with which the industry is required to measure its emissions. Thus, measurements of dioxins and furans are only required once every two years, unless more than a certain percentage of alternative fuel is used. Nonetheless, and despite some analysis and samples from the National Cement Industry Chamber (CANACEM), there is still no publicly available toxic or emissions database proving this statement. One promising development is the recent passage of ammendments to the main environmental law in Mexico, the LGEEPA, or “General Law on Ecological Equilibrium and Environmental Protection.” These amendments include for the first time the requirement of an obligatory Pollutant Release and Transfer Registry (PRTR or RETC in Spanish), similar to the Toxic Release Inventory in the U.S.. The change will require manufacturing facilities and hazardous waste management facilities in Mexico to report toxic releases, air emissions, hazardous waste generation and wastewater discharges to a publicly accessible database. In the past, this reporting has been voluntary and few companies have participated. While the rules and regulations governing the new law are still being implemented, having publicly available data on pollution in Mexico is a positive step since NAFTA and a direct result of both pressure by civic organizations and by the NAFTA side agreement. The following tables show the maximum emission levels established in the new NOM.
TABLE 33.- Maximum Emissions Levels of Particulate Matter
OPERATION MAXIMUM EMISSION LEVEL MEASUREMENT FREQUENCY
Grinding (1) 80 mg/m3
Milling raw materials (1) 80 mg/m3
Milling Hydrualic Cement (1) 80 mg/m3 ANNUAL
Cooling of Clinker (1) 100 mg/m3
Calcination of Clinker (2) 0,15 * C kg of particulate matter/ton de raw material feed
(1) Normal conditions, dry base, based on 7% oxygen (O2) en volume. (2) If C is the quantity of material feed to the kiln, in tons per hour dry base, the maximum emissions level will be 0,15 * C (kg/h).

Energy Use in the Cement Industry in North America: Emissions, Waste Generation and Pollution Control
51
TABLE 34.- MAXIMUM EMISSION LEVELS FOR GASES (1)
Pollutant White Portland Cement
mg/m3
Grey Portland Cement
mg/m3
MEASUREMENT FREQUENCY
Mexico City
Areas
Urbanized Zones
Rest of Country
Mexico City
Areas
Urbanized Zones
Rest of Country
Sulfur Dioxide
400
2200
2500
400
800
1200
ANNUAL
Nitrogen Oxides(2)
800
1400
1600
800
1000
1200
Carbon Monoxide
3000 3500 4000 3000 3500 4000
(1) Normal conditions, dry base, based on 7% oxygen (O2) en volume. (2) Measured as Nitrogen Oxide.
TABLE 35.- COMPLIANCE LEVELS, TYPE AND VOLUME OF ALTERNATIVE FUELS
Substitution of Conventional Fuels * (%)
TIRES
RECOVERED FUELS
BLENDED FUELS
0 a 5 Level 0 Level 0 Level 1
5 a 15 Level 1 Level 1 Level 2
15 a 30 Level 1 Level 2 Level 3
> 30 Level 2 Subject to Testing
• Maximum substitution at any one time compared to calories of conventional fuels.
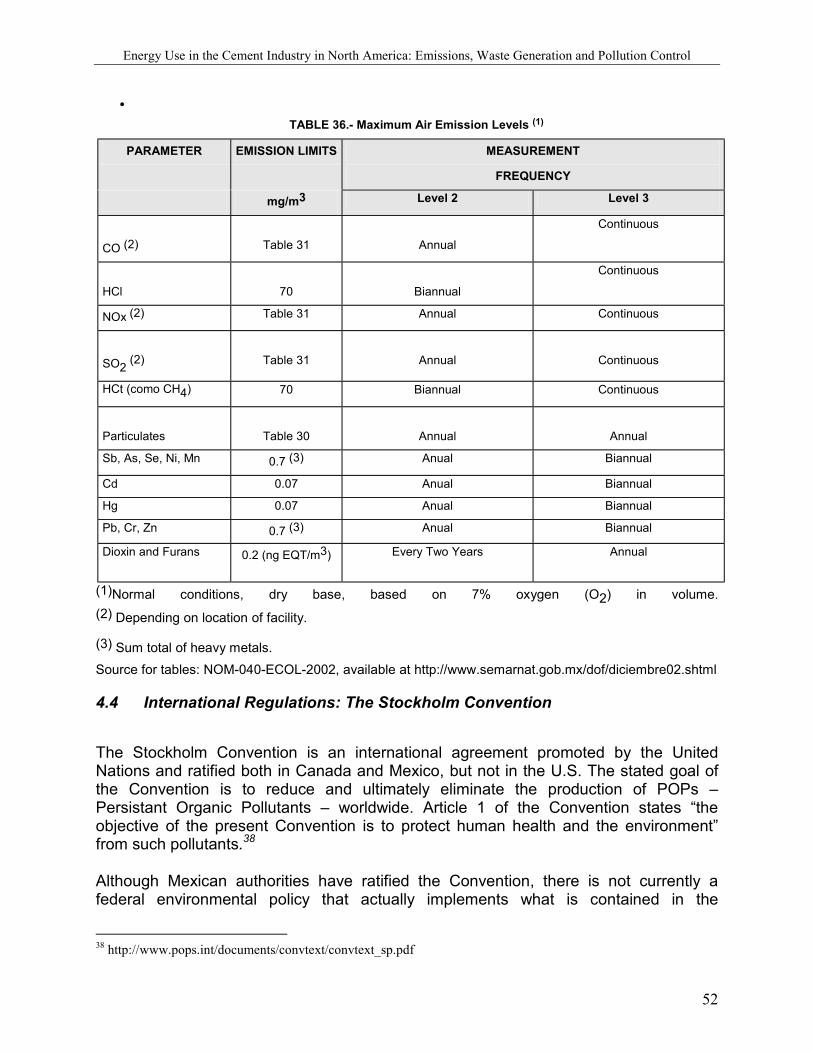
Energy Use in the Cement Industry in North America: Emissions, Waste Generation and Pollution Control
52
•
TABLE 36.- Maximum Air Emission Levels (1)
PARAMETER EMISSION LIMITS MEASUREMENT
FREQUENCY
mg/m3 Level 2 Level 3
CO (2)
Table 31
Annual
Continuous
HCl
70
Biannual
Continuous
NOx (2) Table 31 Annual Continuous
SO2 (2)
Table 31
Annual
Continuous
HCt (como CH4) 70 Biannual Continuous
Particulates
Table 30
Annual
Annual
Sb, As, Se, Ni, Mn 0.7 (3) Anual Biannual
Cd 0.07 Anual Biannual
Hg 0.07 Anual Biannual
Pb, Cr, Zn 0.7 (3) Anual Biannual
Dioxin and Furans 0.2 (ng EQT/m3) Every Two Years Annual
(1)Normal conditions, dry base, based on 7% oxygen (O2) in volume. (2) Depending on location of facility.
(3) Sum total of heavy metals. Source for tables: NOM-040-ECOL-2002, available at http://www.semarnat.gob.mx/dof/diciembre02.shtml
4.4 International Regulations: The Stockholm Convention
The Stockholm Convention is an international agreement promoted by the United Nations and ratified both in Canada and Mexico, but not in the U.S. The stated goal of the Convention is to reduce and ultimately eliminate the production of POPs – Persistant Organic Pollutants – worldwide. Article 1 of the Convention states “the objective of the present Convention is to protect human health and the environment” from such pollutants.38 Although Mexican authorities have ratified the Convention, there is not currently a federal environmental policy that actually implements what is contained in the
38 http://www.pops.int/documents/convtext/convtext_sp.pdf
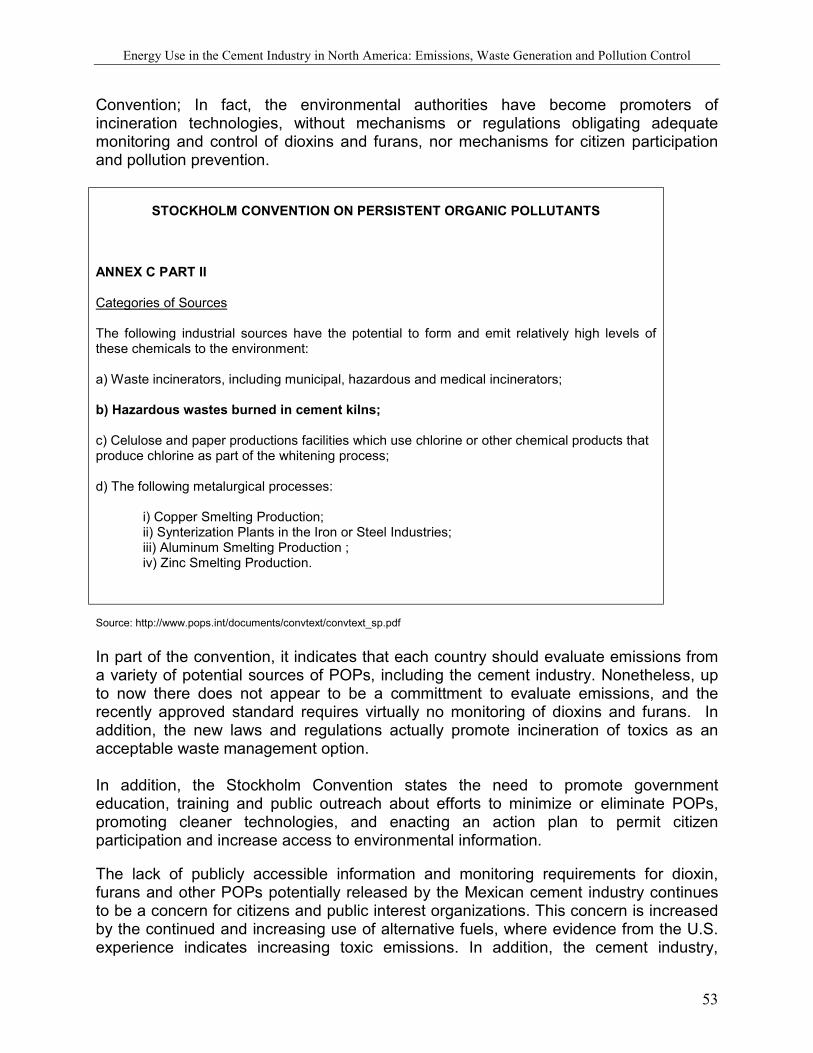
Energy Use in the Cement Industry in North America: Emissions, Waste Generation and Pollution Control
53
Convention; In fact, the environmental authorities have become promoters of incineration technologies, without mechanisms or regulations obligating adequate monitoring and control of dioxins and furans, nor mechanisms for citizen participation and pollution prevention.
STOCKHOLM CONVENTION ON PERSISTENT ORGANIC POLLUTANTS
ANNEX C PART II Categories of Sources The following industrial sources have the potential to form and emit relatively high levels of these chemicals to the environment: a) Waste incinerators, including municipal, hazardous and medical incinerators; b) Hazardous wastes burned in cement kilns; c) Celulose and paper productions facilities which use chlorine or other chemical products that produce chlorine as part of the whitening process; d) The following metalurgical processes:
i) Copper Smelting Production; ii) Synterization Plants in the Iron or Steel Industries; iii) Aluminum Smelting Production ; iv) Zinc Smelting Production.
Source: http://www.pops.int/documents/convtext/convtext_sp.pdf In part of the convention, it indicates that each country should evaluate emissions from a variety of potential sources of POPs, including the cement industry. Nonetheless, up to now there does not appear to be a committment to evaluate emissions, and the recently approved standard requires virtually no monitoring of dioxins and furans. In addition, the new laws and regulations actually promote incineration of toxics as an acceptable waste management option. In addition, the Stockholm Convention states the need to promote government education, training and public outreach about efforts to minimize or eliminate POPs, promoting cleaner technologies, and enacting an action plan to permit citizen participation and increase access to environmental information. The lack of publicly accessible information and monitoring requirements for dioxin, furans and other POPs potentially released by the Mexican cement industry continues to be a concern for citizens and public interest organizations. This concern is increased by the continued and increasing use of alternative fuels, where evidence from the U.S. experience indicates increasing toxic emissions. In addition, the cement industry,
Energy Use in the Cement Industry in North America: Emissions, Waste Generation and Pollution Control
54
academics, CENICA – an environmental testing lab – and federal environmental authorities still have not reached agreement on establishing real and verifiable emission factors.
4.5 CONCLUSIONS
Cement production in Mexico has been fairly level throughout the 1990s, first rising, the falling with the contraction of the economy in 1995, and then rising again. While a small part of this overall rise in production is due to exports, the high tariffs on Mexican cement and the growing demand in Mexico have kept most production from Mexican plants within Mexico. At the same time, two of Mexico’s companies – GCC and CEMEX – have made major investments directly in the U.S. in the last few years, significantly increasing their presence and production capacity there. Since 1990, the cement industry in Mexico has become more efficient in its use of electricity and fuel by making major investments in its production process. All currently operating kilns in Mexico use a dry process, and most have preheaters and precalcinators, the most efficient processes. At the same time, there has been an increasing trend in diversification of fuel, from fuel oils to coal, petroleum coke and increasingly, alternative fuels including tires and solid and liquid hazardous waste. While the switch to petroleum coke has to do with both price and the less volatile nature of the quality of the fuel, the switch to hazardous wastes, albeit it small, is principally to save money or receive payment for hazardous waste management, not to become more efficient in cement production. Whether or not this switch to petroleum coke, coal and alternative fuels has impacted total atmospheric emissions, transfers, generation of waste and disposal is unclear because environmental information is partial and aggregated. Clearly, the increased use of petroleum coke is likely leading to higher global gas emissions. The recently approved change forcing companies to report their toxic and criteria air emissions and generation of wastes could eventually help shed some light on the environmental impacts, but for the moment the information is confidential or not even reported. The fact that the cement industry – on a production basis – has reduced the use of fuels and electricity over the last decade does not mean that it does not continue to generate emissions of dusts, dioxins, furans, heavy metals and other chemical compounds. Whether or not the incineration of hazardous wastes has increased these emissions – as it appears to have done in the U.S. – is still open for debate. The fact that Mexico finally has adopted a standard – after ten years without one even as more and more hazardous waste was burned – does not mean that the “controled” emissions of these pollutants does not harm human health or the environment. There is still no way to compare which types of fuels in Mexico generate the most emissions, or rather the use of hazardous wastes as an additive in the fuel mix increases emissions. And disturbingly, the standard only requires minimal measurements of most pollutants, meaning that there will be little information on whether the industry is actually complying with the new standard.
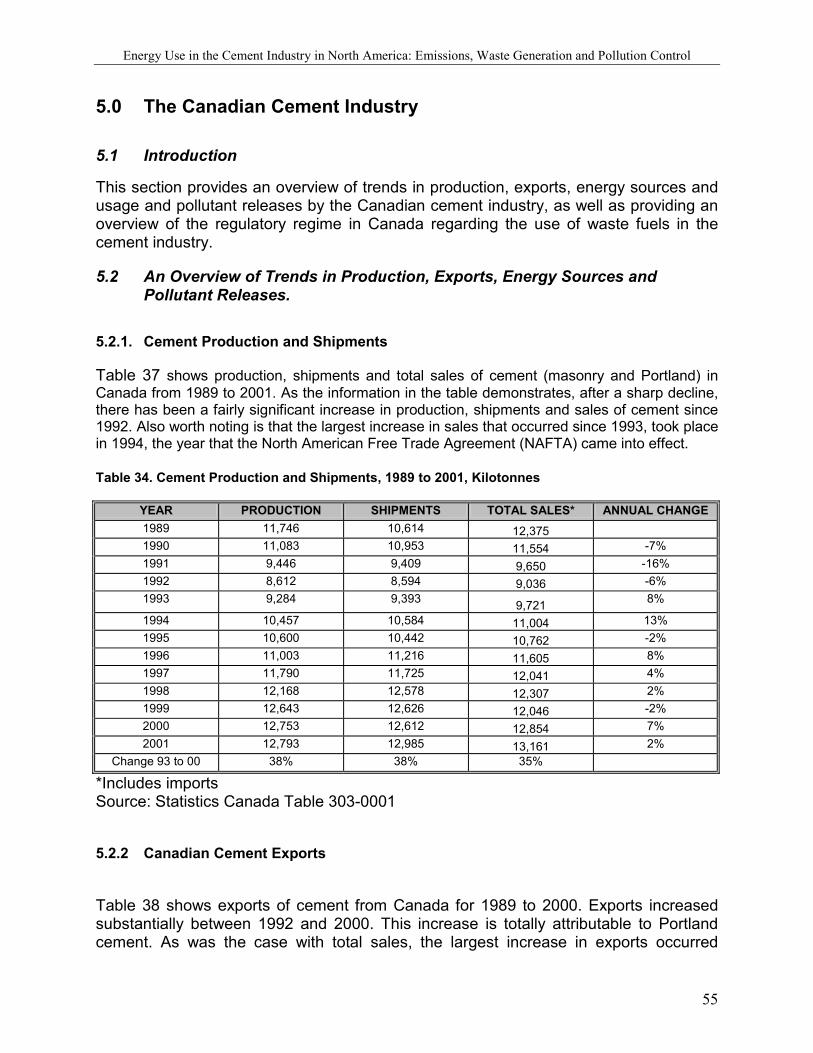
Energy Use in the Cement Industry in North America: Emissions, Waste Generation and Pollution Control
55
5.0 The Canadian Cement Industry
5.1 Introduction
This section provides an overview of trends in production, exports, energy sources and usage and pollutant releases by the Canadian cement industry, as well as providing an overview of the regulatory regime in Canada regarding the use of waste fuels in the cement industry.
5.2 An Overview of Trends in Production, Exports, Energy Sources and Pollutant Releases.
5.2.1. Cement Production and Shipments
Table 37 shows production, shipments and total sales of cement (masonry and Portland) in Canada from 1989 to 2001. As the information in the table demonstrates, after a sharp decline, there has been a fairly significant increase in production, shipments and sales of cement since 1992. Also worth noting is that the largest increase in sales that occurred since 1993, took place in 1994, the year that the North American Free Trade Agreement (NAFTA) came into effect. Table 34. Cement Production and Shipments, 1989 to 2001, Kilotonnes
YEAR PRODUCTION SHIPMENTS TOTAL SALES* ANNUAL CHANGE 1989 11,746 10,614 12,375 1990 11,083 10,953 11,554 -7% 1991 9,446 9,409 9,650 -16% 1992 8,612 8,594 9,036 -6% 1993 9,284 9,393 9,721 8%
1994 10,457 10,584 11,004 13% 1995 10,600 10,442 10,762 -2% 1996 11,003 11,216 11,605 8% 1997 11,790 11,725 12,041 4% 1998 12,168 12,578 12,307 2% 1999 12,643 12,626 12,046 -2% 2000 12,753 12,612 12,854 7% 2001 12,793 12,985 13,161 2%
Change 93 to 00 38% 38% 35%
*Includes imports Source: Statistics Canada Table 303-0001
5.2.2 Canadian Cement Exports
Table 38 shows exports of cement from Canada for 1989 to 2000. Exports increased substantially between 1992 and 2000. This increase is totally attributable to Portland cement. As was the case with total sales, the largest increase in exports occurred
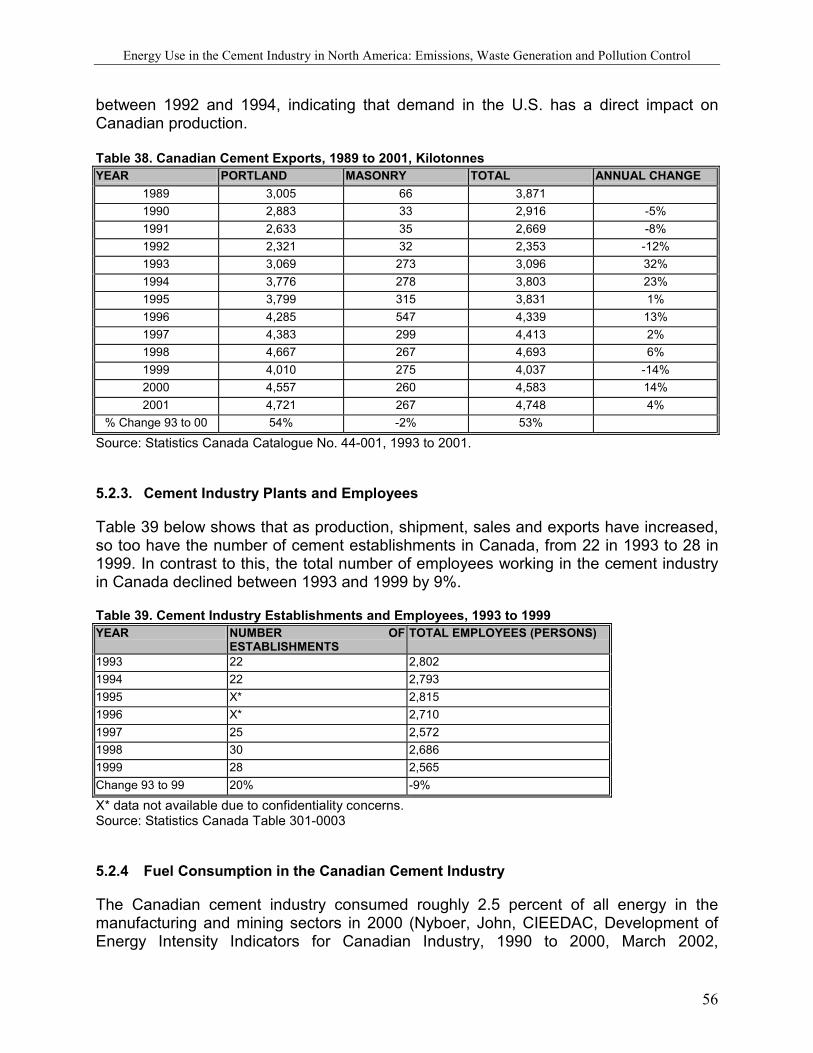
Energy Use in the Cement Industry in North America: Emissions, Waste Generation and Pollution Control
56
between 1992 and 1994, indicating that demand in the U.S. has a direct impact on Canadian production. Table 38. Canadian Cement Exports, 1989 to 2001, Kilotonnes YEAR PORTLAND MASONRY TOTAL ANNUAL CHANGE
1989 3,005 66 3,871 1990 2,883 33 2,916 -5% 1991 2,633 35 2,669 -8% 1992 2,321 32 2,353 -12% 1993 3,069 273 3,096 32% 1994 3,776 278 3,803 23% 1995 3,799 315 3,831 1% 1996 4,285 547 4,339 13% 1997 4,383 299 4,413 2% 1998 4,667 267 4,693 6% 1999 4,010 275 4,037 -14% 2000 4,557 260 4,583 14% 2001 4,721 267 4,748 4%
% Change 93 to 00 54% -2% 53%
Source: Statistics Canada Catalogue No. 44-001, 1993 to 2001.
5.2.3. Cement Industry Plants and Employees
Table 39 below shows that as production, shipment, sales and exports have increased, so too have the number of cement establishments in Canada, from 22 in 1993 to 28 in 1999. In contrast to this, the total number of employees working in the cement industry in Canada declined between 1993 and 1999 by 9%. Table 39. Cement Industry Establishments and Employees, 1993 to 1999 YEAR NUMBER OF
ESTABLISHMENTS TOTAL EMPLOYEES (PERSONS)
1993 22 2,802 1994 22 2,793 1995 X* 2,815 1996 X* 2,710 1997 25 2,572 1998 30 2,686 1999 28 2,565 Change 93 to 99 20% -9%
X* data not available due to confidentiality concerns. Source: Statistics Canada Table 301-0003
5.2.4 Fuel Consumption in the Canadian Cement Industry
The Canadian cement industry consumed roughly 2.5 percent of all energy in the manufacturing and mining sectors in 2000 (Nyboer, John, CIEEDAC, Development of Energy Intensity Indicators for Canadian Industry, 1990 to 2000, March 2002,
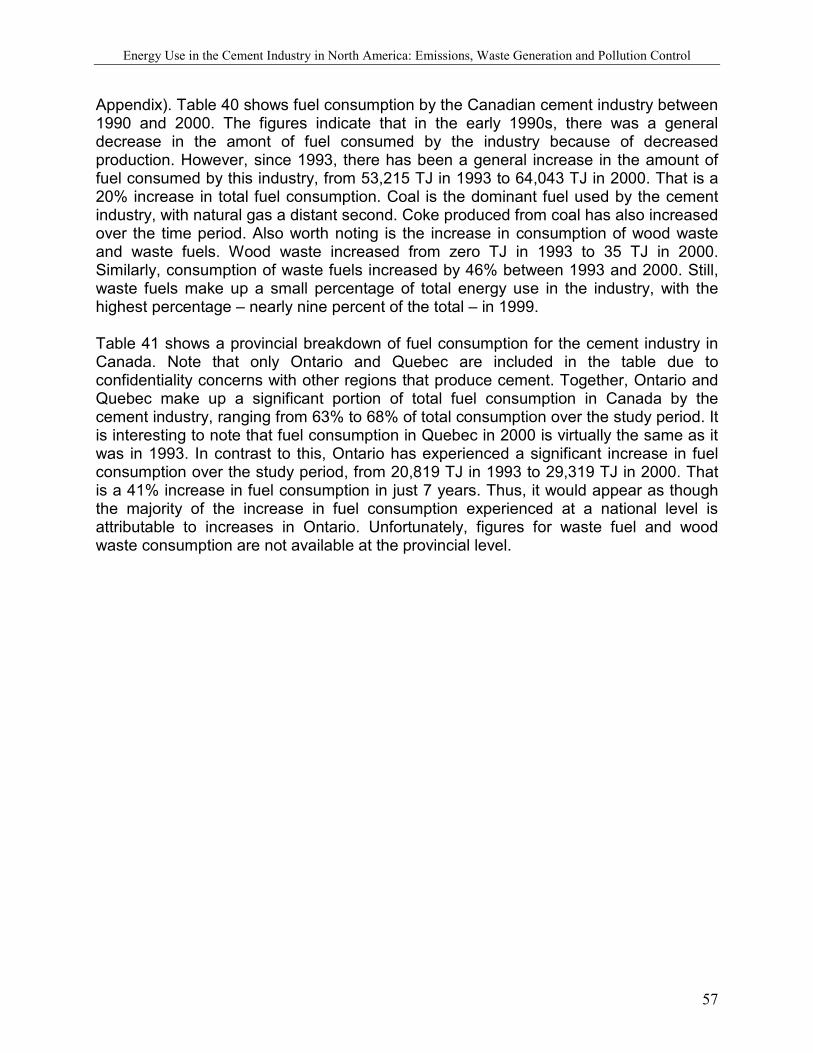
Energy Use in the Cement Industry in North America: Emissions, Waste Generation and Pollution Control
57
Appendix). Table 40 shows fuel consumption by the Canadian cement industry between 1990 and 2000. The figures indicate that in the early 1990s, there was a general decrease in the amont of fuel consumed by the industry because of decreased production. However, since 1993, there has been a general increase in the amount of fuel consumed by this industry, from 53,215 TJ in 1993 to 64,043 TJ in 2000. That is a 20% increase in total fuel consumption. Coal is the dominant fuel used by the cement industry, with natural gas a distant second. Coke produced from coal has also increased over the time period. Also worth noting is the increase in consumption of wood waste and waste fuels. Wood waste increased from zero TJ in 1993 to 35 TJ in 2000. Similarly, consumption of waste fuels increased by 46% between 1993 and 2000. Still, waste fuels make up a small percentage of total energy use in the industry, with the highest percentage – nearly nine percent of the total – in 1999. Table 41 shows a provincial breakdown of fuel consumption for the cement industry in Canada. Note that only Ontario and Quebec are included in the table due to confidentiality concerns with other regions that produce cement. Together, Ontario and Quebec make up a significant portion of total fuel consumption in Canada by the cement industry, ranging from 63% to 68% of total consumption over the study period. It is interesting to note that fuel consumption in Quebec in 2000 is virtually the same as it was in 1993. In contrast to this, Ontario has experienced a significant increase in fuel consumption over the study period, from 20,819 TJ in 1993 to 29,319 TJ in 2000. That is a 41% increase in fuel consumption in just 7 years. Thus, it would appear as though the majority of the increase in fuel consumption experienced at a national level is attributable to increases in Ontario. Unfortunately, figures for waste fuel and wood waste consumption are not available at the provincial level.
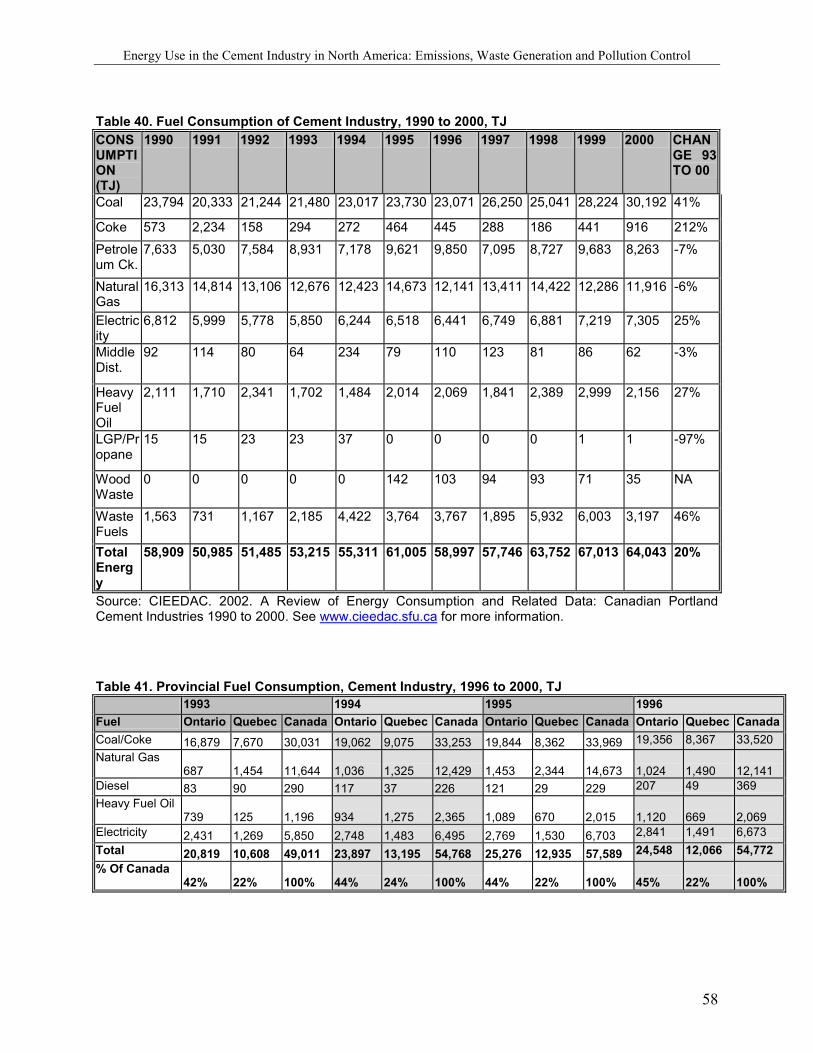
Energy Use in the Cement Industry in North America: Emissions, Waste Generation and Pollution Control
58
Table 40. Fuel Consumption of Cement Industry, 1990 to 2000, TJ CONSUMPTION (TJ)
1990 1991 1992 1993 1994 1995 1996 1997 1998 1999 2000 CHANGE 93 TO 00
Coal 23,794 20,333 21,244 21,480 23,017 23,730 23,071 26,250 25,041 28,224 30,192 41%
Coke 573 2,234 158 294 272 464 445 288 186 441 916 212% Petroleum Ck.
7,633 5,030 7,584 8,931 7,178 9,621 9,850 7,095 8,727 9,683 8,263 -7%
Natural Gas
16,313 14,814 13,106 12,676 12,423 14,673 12,141 13,411 14,422 12,286 11,916 -6%
Electricity
6,812 5,999 5,778 5,850 6,244 6,518 6,441 6,749 6,881 7,219 7,305 25%
Middle Dist.
92 114 80 64 234 79 110 123 81 86 62 -3%
Heavy Fuel Oil
2,111 1,710 2,341 1,702 1,484 2,014 2,069 1,841 2,389 2,999 2,156 27%
LGP/Propane
15 15 23 23 37 0 0 0 0 1 1 -97%
Wood Waste
0 0 0 0 0 142 103 94 93 71 35 NA
Waste Fuels
1,563 731 1,167 2,185 4,422 3,764 3,767 1,895 5,932 6,003 3,197 46%
Total Energy
58,909 50,985 51,485 53,215 55,311 61,005 58,997 57,746 63,752 67,013 64,043 20%
Source: CIEEDAC. 2002. A Review of Energy Consumption and Related Data: Canadian Portland Cement Industries 1990 to 2000. See www.cieedac.sfu.ca for more information. Table 41. Provincial Fuel Consumption, Cement Industry, 1996 to 2000, TJ 1993 1994 1995 1996 Fuel Ontario Quebec Canada Ontario Quebec Canada Ontario Quebec Canada Ontario Quebec Canada Coal/Coke 16,879 7,670 30,031 19,062 9,075 33,253 19,844 8,362 33,969 19,356 8,367 33,520 Natural Gas
687 1,454 11,644 1,036 1,325 12,429 1,453 2,344 14,673 1,024
1,490
12,141
Diesel 83 90 290 117 37 226 121 29 229 207 49 369 Heavy Fuel Oil
739 125 1,196 934 1,275 2,365 1,089 670 2,015 1,120
669
2,069
Electricity 2,431 1,269 5,850 2,748 1,483 6,495 2,769 1,530 6,703 2,841 1,491 6,673 Total 20,819 10,608 49,011 23,897 13,195 54,768 25,276 12,935 57,589 24,548 12,066 54,772 % Of Canada
42% 22% 100% 44% 24% 100% 44% 22% 100% 45%
22%
100%
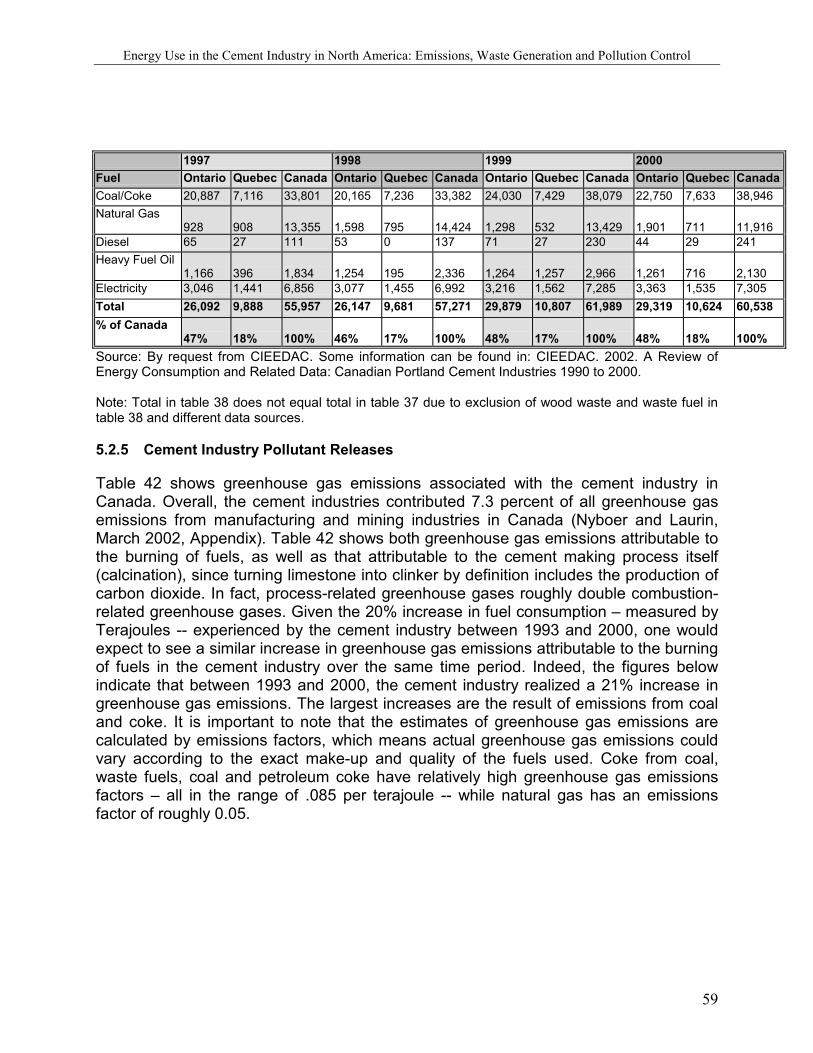
Energy Use in the Cement Industry in North America: Emissions, Waste Generation and Pollution Control
59
1997 1998 1999 2000 Fuel Ontario Quebec Canada Ontario Quebec Canada Ontario Quebec Canada Ontario Quebec Canada Coal/Coke 20,887 7,116 33,801 20,165 7,236 33,382 24,030 7,429 38,079 22,750 7,633 38,946 Natural Gas
928 908
13,355
1,598
795
14,424
1,298
532
13,429
1,901
711
11,916
Diesel 65 27 111 53 0 137 71 27 230 44 29 241 Heavy Fuel Oil
1,166 396
1,834
1,254
195
2,336
1,264
1,257
2,966
1,261
716
2,130
Electricity 3,046 1,441 6,856 3,077 1,455 6,992 3,216 1,562 7,285 3,363 1,535 7,305 Total 26,092 9,888 55,957 26,147 9,681 57,271 29,879 10,807 61,989 29,319 10,624 60,538 % of Canada
47% 18%
100%
46%
17%
100%
48%
17%
100%
48%
18%
100%
Source: By request from CIEEDAC. Some information can be found in: CIEEDAC. 2002. A Review of Energy Consumption and Related Data: Canadian Portland Cement Industries 1990 to 2000. Note: Total in table 38 does not equal total in table 37 due to exclusion of wood waste and waste fuel in table 38 and different data sources.
5.2.5 Cement Industry Pollutant Releases
Table 42 shows greenhouse gas emissions associated with the cement industry in Canada. Overall, the cement industries contributed 7.3 percent of all greenhouse gas emissions from manufacturing and mining industries in Canada (Nyboer and Laurin, March 2002, Appendix). Table 42 shows both greenhouse gas emissions attributable to the burning of fuels, as well as that attributable to the cement making process itself (calcination), since turning limestone into clinker by definition includes the production of carbon dioxide. In fact, process-related greenhouse gases roughly double combustion-related greenhouse gases. Given the 20% increase in fuel consumption – measured by Terajoules -- experienced by the cement industry between 1993 and 2000, one would expect to see a similar increase in greenhouse gas emissions attributable to the burning of fuels in the cement industry over the same time period. Indeed, the figures below indicate that between 1993 and 2000, the cement industry realized a 21% increase in greenhouse gas emissions. The largest increases are the result of emissions from coal and coke. It is important to note that the estimates of greenhouse gas emissions are calculated by emissions factors, which means actual greenhouse gas emissions could vary according to the exact make-up and quality of the fuels used. Coke from coal, waste fuels, coal and petroleum coke have relatively high greenhouse gas emissions factors – all in the range of .085 per terajoule -- while natural gas has an emissions factor of roughly 0.05.
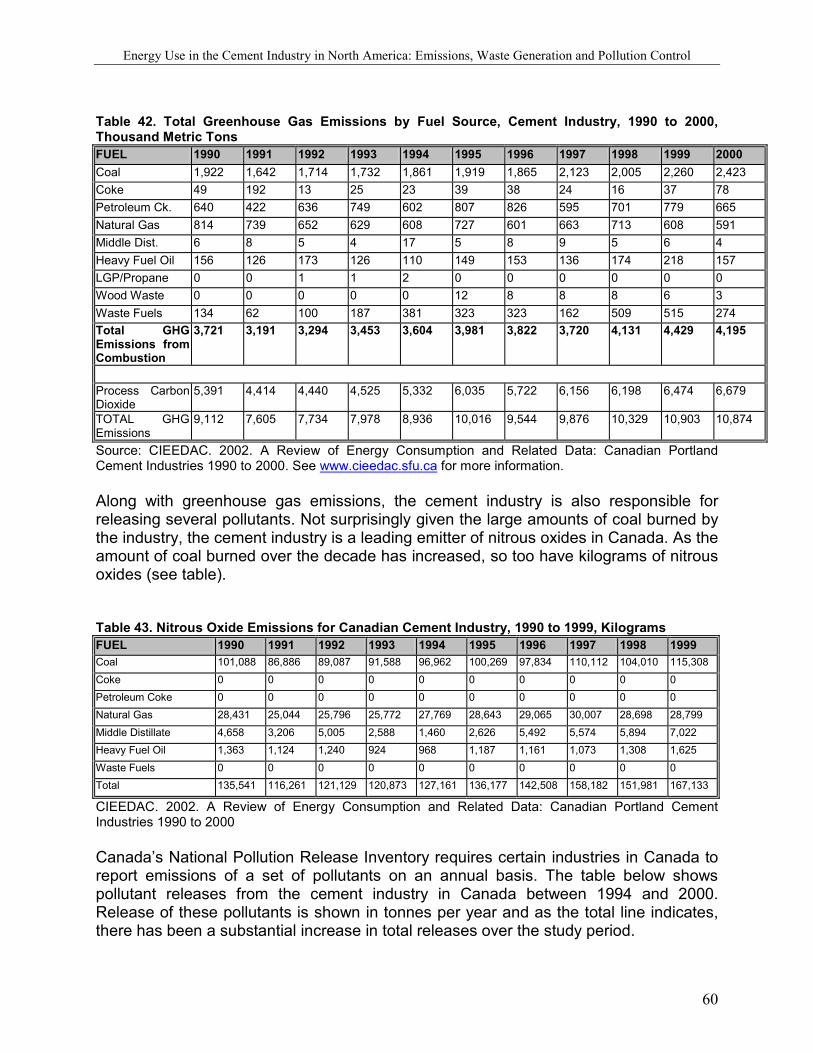
Energy Use in the Cement Industry in North America: Emissions, Waste Generation and Pollution Control
60
Table 42. Total Greenhouse Gas Emissions by Fuel Source, Cement Industry, 1990 to 2000, Thousand Metric Tons FUEL 1990 1991 1992 1993 1994 1995 1996 1997 1998 1999 2000 Coal 1,922 1,642 1,714 1,732 1,861 1,919 1,865 2,123 2,005 2,260 2,423 Coke 49 192 13 25 23 39 38 24 16 37 78 Petroleum Ck. 640 422 636 749 602 807 826 595 701 779 665 Natural Gas 814 739 652 629 608 727 601 663 713 608 591 Middle Dist. 6 8 5 4 17 5 8 9 5 6 4 Heavy Fuel Oil 156 126 173 126 110 149 153 136 174 218 157 LGP/Propane 0 0 1 1 2 0 0 0 0 0 0 Wood Waste 0 0 0 0 0 12 8 8 8 6 3 Waste Fuels 134 62 100 187 381 323 323 162 509 515 274 Total GHG Emissions from Combustion
3,721
3,191 3,294 3,453 3,604 3,981 3,822 3,720 4,131 4,429 4,195
Process Carbon Dioxide
5,391 4,414 4,440 4,525 5,332 6,035 5,722 6,156 6,198 6,474 6,679
TOTAL GHG Emissions
9,112 7,605 7,734 7,978 8,936 10,016 9,544 9,876 10,329 10,903 10,874
Source: CIEEDAC. 2002. A Review of Energy Consumption and Related Data: Canadian Portland Cement Industries 1990 to 2000. See www.cieedac.sfu.ca for more information. Along with greenhouse gas emissions, the cement industry is also responsible for releasing several pollutants. Not surprisingly given the large amounts of coal burned by the industry, the cement industry is a leading emitter of nitrous oxides in Canada. As the amount of coal burned over the decade has increased, so too have kilograms of nitrous oxides (see table). Table 43. Nitrous Oxide Emissions for Canadian Cement Industry, 1990 to 1999, Kilograms FUEL 1990 1991 1992 1993 1994 1995 1996 1997 1998 1999 Coal 101,088 86,886 89,087 91,588 96,962 100,269 97,834 110,112 104,010 115,308 Coke 0 0 0 0 0 0 0 0 0 0 Petroleum Coke 0 0 0 0 0 0 0 0 0 0 Natural Gas 28,431 25,044 25,796 25,772 27,769 28,643 29,065 30,007 28,698 28,799 Middle Distillate 4,658 3,206 5,005 2,588 1,460 2,626 5,492 5,574 5,894 7,022 Heavy Fuel Oil 1,363 1,124 1,240 924 968 1,187 1,161 1,073 1,308 1,625 Waste Fuels 0 0 0 0 0 0 0 0 0 0 Total 135,541 116,261 121,129 120,873 127,161 136,177 142,508 158,182 151,981 167,133
CIEEDAC. 2002. A Review of Energy Consumption and Related Data: Canadian Portland Cement Industries 1990 to 2000 Canada’s National Pollution Release Inventory requires certain industries in Canada to report emissions of a set of pollutants on an annual basis. The table below shows pollutant releases from the cement industry in Canada between 1994 and 2000. Release of these pollutants is shown in tonnes per year and as the total line indicates, there has been a substantial increase in total releases over the study period.
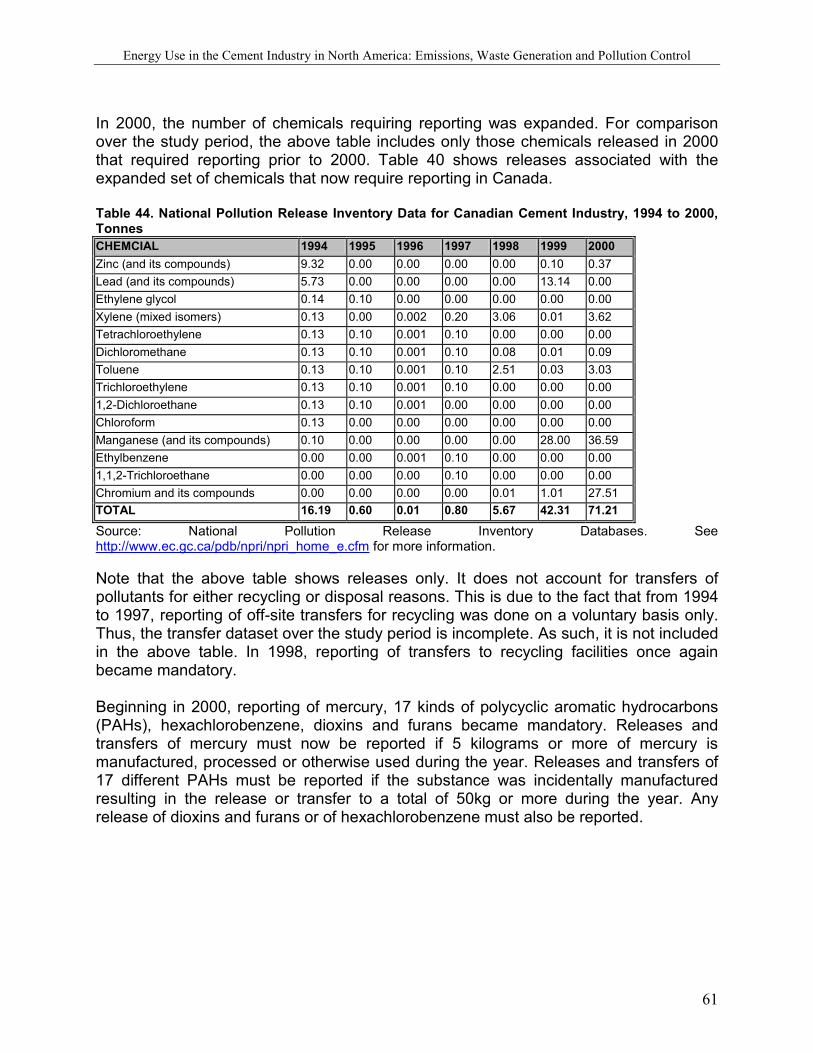
Energy Use in the Cement Industry in North America: Emissions, Waste Generation and Pollution Control
61
In 2000, the number of chemicals requiring reporting was expanded. For comparison over the study period, the above table includes only those chemicals released in 2000 that required reporting prior to 2000. Table 40 shows releases associated with the expanded set of chemicals that now require reporting in Canada. Table 44. National Pollution Release Inventory Data for Canadian Cement Industry, 1994 to 2000, Tonnes CHEMCIAL 1994 1995 1996 1997 1998 1999 2000 Zinc (and its compounds) 9.32 0.00 0.00 0.00 0.00 0.10 0.37 Lead (and its compounds) 5.73 0.00 0.00 0.00 0.00 13.14 0.00 Ethylene glycol 0.14 0.10 0.00 0.00 0.00 0.00 0.00 Xylene (mixed isomers) 0.13 0.00 0.002 0.20 3.06 0.01 3.62 Tetrachloroethylene 0.13 0.10 0.001 0.10 0.00 0.00 0.00 Dichloromethane 0.13 0.10 0.001 0.10 0.08 0.01 0.09 Toluene 0.13 0.10 0.001 0.10 2.51 0.03 3.03 Trichloroethylene 0.13 0.10 0.001 0.10 0.00 0.00 0.00 1,2-Dichloroethane 0.13 0.10 0.001 0.00 0.00 0.00 0.00 Chloroform 0.13 0.00 0.00 0.00 0.00 0.00 0.00 Manganese (and its compounds) 0.10 0.00 0.00 0.00 0.00 28.00 36.59 Ethylbenzene 0.00 0.00 0.001 0.10 0.00 0.00 0.00 1,1,2-Trichloroethane 0.00 0.00 0.00 0.10 0.00 0.00 0.00 Chromium and its compounds 0.00 0.00 0.00 0.00 0.01 1.01 27.51 TOTAL 16.19 0.60 0.01 0.80 5.67 42.31 71.21 Source: National Pollution Release Inventory Databases. See http://www.ec.gc.ca/pdb/npri/npri_home_e.cfm for more information. Note that the above table shows releases only. It does not account for transfers of pollutants for either recycling or disposal reasons. This is due to the fact that from 1994 to 1997, reporting of off-site transfers for recycling was done on a voluntary basis only. Thus, the transfer dataset over the study period is incomplete. As such, it is not included in the above table. In 1998, reporting of transfers to recycling facilities once again became mandatory. Beginning in 2000, reporting of mercury, 17 kinds of polycyclic aromatic hydrocarbons (PAHs), hexachlorobenzene, dioxins and furans became mandatory. Releases and transfers of mercury must now be reported if 5 kilograms or more of mercury is manufactured, processed or otherwise used during the year. Releases and transfers of 17 different PAHs must be reported if the substance was incidentally manufactured resulting in the release or transfer to a total of 50kg or more during the year. Any release of dioxins and furans or of hexachlorobenzene must also be reported.
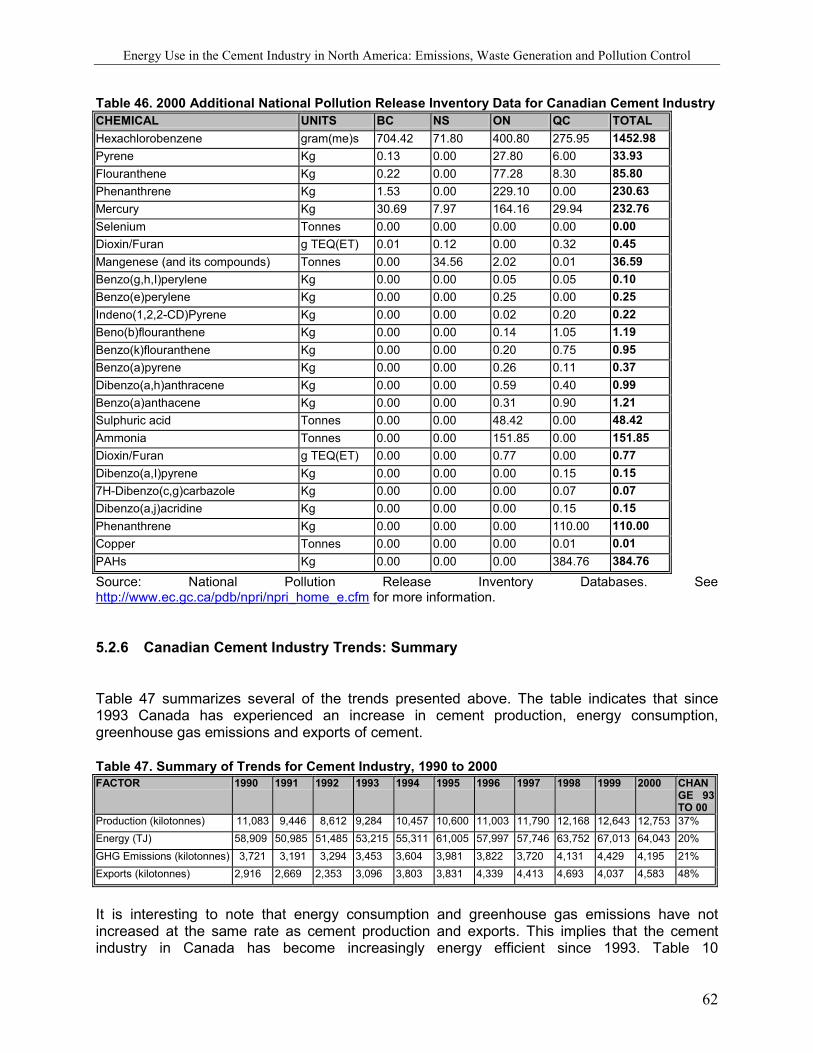
Energy Use in the Cement Industry in North America: Emissions, Waste Generation and Pollution Control
62
Table 46. 2000 Additional National Pollution Release Inventory Data for Canadian Cement Industry CHEMICAL UNITS BC NS ON QC TOTAL Hexachlorobenzene gram(me)s 704.42 71.80 400.80 275.95 1452.98 Pyrene Kg 0.13 0.00 27.80 6.00 33.93 Flouranthene Kg 0.22 0.00 77.28 8.30 85.80 Phenanthrene Kg 1.53 0.00 229.10 0.00 230.63 Mercury Kg 30.69 7.97 164.16 29.94 232.76 Selenium Tonnes 0.00 0.00 0.00 0.00 0.00 Dioxin/Furan g TEQ(ET) 0.01 0.12 0.00 0.32 0.45 Mangenese (and its compounds) Tonnes 0.00 34.56 2.02 0.01 36.59 Benzo(g,h,I)perylene Kg 0.00 0.00 0.05 0.05 0.10 Benzo(e)perylene Kg 0.00 0.00 0.25 0.00 0.25 Indeno(1,2,2-CD)Pyrene Kg 0.00 0.00 0.02 0.20 0.22 Beno(b)flouranthene Kg 0.00 0.00 0.14 1.05 1.19 Benzo(k)flouranthene Kg 0.00 0.00 0.20 0.75 0.95 Benzo(a)pyrene Kg 0.00 0.00 0.26 0.11 0.37 Dibenzo(a,h)anthracene Kg 0.00 0.00 0.59 0.40 0.99 Benzo(a)anthacene Kg 0.00 0.00 0.31 0.90 1.21 Sulphuric acid Tonnes 0.00 0.00 48.42 0.00 48.42 Ammonia Tonnes 0.00 0.00 151.85 0.00 151.85 Dioxin/Furan g TEQ(ET) 0.00 0.00 0.77 0.00 0.77 Dibenzo(a,I)pyrene Kg 0.00 0.00 0.00 0.15 0.15 7H-Dibenzo(c,g)carbazole Kg 0.00 0.00 0.00 0.07 0.07 Dibenzo(a,j)acridine Kg 0.00 0.00 0.00 0.15 0.15 Phenanthrene Kg 0.00 0.00 0.00 110.00 110.00 Copper Tonnes 0.00 0.00 0.00 0.01 0.01 PAHs Kg 0.00 0.00 0.00 384.76 384.76 Source: National Pollution Release Inventory Databases. See http://www.ec.gc.ca/pdb/npri/npri_home_e.cfm for more information.
5.2.6 Canadian Cement Industry Trends: Summary
Table 47 summarizes several of the trends presented above. The table indicates that since 1993 Canada has experienced an increase in cement production, energy consumption, greenhouse gas emissions and exports of cement. Table 47. Summary of Trends for Cement Industry, 1990 to 2000 FACTOR 1990 1991 1992 1993 1994 1995 1996 1997 1998 1999 2000 CHAN
GE 93 TO 00
Production (kilotonnes) 11,083 9,446 8,612 9,284 10,457 10,600 11,003 11,790 12,168 12,643 12,753 37% Energy (TJ) 58,909 50,985 51,485 53,215 55,311 61,005 57,997 57,746 63,752 67,013 64,043 20% GHG Emissions (kilotonnes) 3,721 3,191 3,294 3,453 3,604 3,981 3,822 3,720 4,131 4,429 4,195 21% Exports (kilotonnes) 2,916 2,669 2,353 3,096 3,803 3,831 4,339 4,413 4,693 4,037 4,583 48%
It is interesting to note that energy consumption and greenhouse gas emissions have not increased at the same rate as cement production and exports. This implies that the cement industry in Canada has become increasingly energy efficient since 1993. Table 10
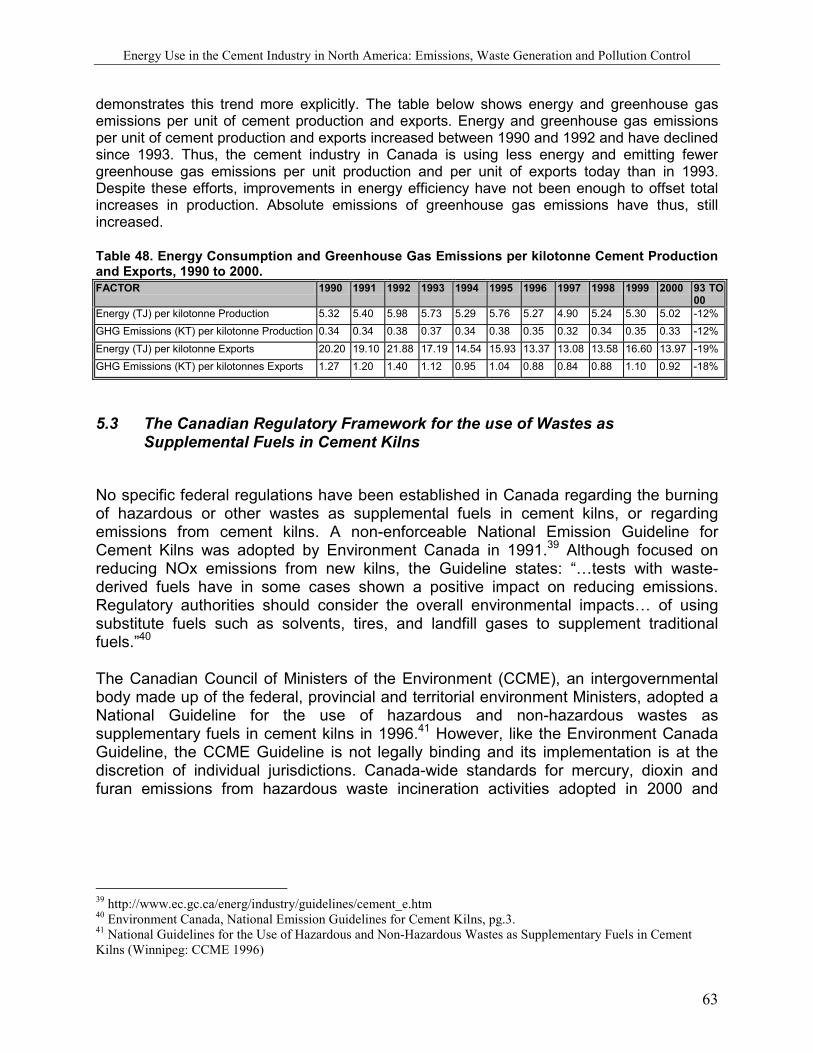
Energy Use in the Cement Industry in North America: Emissions, Waste Generation and Pollution Control
63
demonstrates this trend more explicitly. The table below shows energy and greenhouse gas emissions per unit of cement production and exports. Energy and greenhouse gas emissions per unit of cement production and exports increased between 1990 and 1992 and have declined since 1993. Thus, the cement industry in Canada is using less energy and emitting fewer greenhouse gas emissions per unit production and per unit of exports today than in 1993. Despite these efforts, improvements in energy efficiency have not been enough to offset total increases in production. Absolute emissions of greenhouse gas emissions have thus, still increased. Table 48. Energy Consumption and Greenhouse Gas Emissions per kilotonne Cement Production and Exports, 1990 to 2000. FACTOR 1990 1991 1992 1993 1994 1995 1996 1997 1998 1999 2000 93 TO
00 Energy (TJ) per kilotonne Production 5.32 5.40 5.98 5.73 5.29 5.76 5.27 4.90 5.24 5.30 5.02 -12% GHG Emissions (KT) per kilotonne Production 0.34 0.34 0.38 0.37 0.34 0.38 0.35 0.32 0.34 0.35 0.33 -12% Energy (TJ) per kilotonne Exports 20.20 19.10 21.88 17.19 14.54 15.93 13.37 13.08 13.58 16.60 13.97 -19% GHG Emissions (KT) per kilotonnes Exports 1.27 1.20 1.40 1.12 0.95 1.04 0.88 0.84 0.88 1.10 0.92 -18%
5.3 The Canadian Regulatory Framework for the use of Wastes as Supplemental Fuels in Cement Kilns
No specific federal regulations have been established in Canada regarding the burning of hazardous or other wastes as supplemental fuels in cement kilns, or regarding emissions from cement kilns. A non-enforceable National Emission Guideline for Cement Kilns was adopted by Environment Canada in 1991.39 Although focused on reducing NOx emissions from new kilns, the Guideline states: “…tests with waste-derived fuels have in some cases shown a positive impact on reducing emissions. Regulatory authorities should consider the overall environmental impacts… of using substitute fuels such as solvents, tires, and landfill gases to supplement traditional fuels.”40 The Canadian Council of Ministers of the Environment (CCME), an intergovernmental body made up of the federal, provincial and territorial environment Ministers, adopted a National Guideline for the use of hazardous and non-hazardous wastes as supplementary fuels in cement kilns in 1996.41 However, like the Environment Canada Guideline, the CCME Guideline is not legally binding and its implementation is at the discretion of individual jurisdictions. Canada-wide standards for mercury, dioxin and furan emissions from hazardous waste incineration activities adopted in 2000 and
39 http://www.ec.gc.ca/energ/industry/guidelines/cement_e.htm 40 Environment Canada, National Emission Guidelines for Cement Kilns, pg.3. 41 National Guidelines for the Use of Hazardous and Non-Hazardous Wastes as Supplementary Fuels in Cement Kilns (Winnipeg: CCME 1996)
Energy Use in the Cement Industry in North America: Emissions, Waste Generation and Pollution Control
64
200142 do not apply to “energy recovery” activities, providing a type of exemption to the cement industry. The burning of hazardous wastes as supplemental fuels is therefore regulated at the provincial and territorial levels. In general, despite pressures from the cement industry to follow the US approach to permit the general use of hazardous wastes as supplemental fuels in cement kilns,43 such activities continue to require approval under provincial legislation as hazardous waste disposal operations, and waste manifesting requirements would apply to shipments of wastes to cement making operations for use as fuel.44 Most jurisdictions rely on the CCME guidelines as the basis for the requirements written into facility approvals regarding acceptable waste quality as fuel and emissions requirements. In summary, although Canadian governments have been supportive in principle of the use of hazardous wastes as supplemental fuel in cement kilns, such practices still require specific approval under provincial hazardous waste legislation and regulations. No major regulatory changes have been undertaken since the adoption of the CCME guidelines in 1996, and the primary focus of recent proposals has been on the use of used tires rather than hazardous wastes as fuel. The Ontario Ministry of the Environment for example, has recently approved collection and processing facility that will export scrap tires to Mexico.45
5.4 Conclusions
• Total Canadian cement production and shipments have risen substantially since
1993, rising by 37% between 1993 and 2000. • Exports have also increased substantially (48%) over this period. This increase is
almost exclusively for Portland cement. Canadian cement exports are almost entirely to the US.
• The number of cement production facilities in Canada has increased 20%, but employment in the sector is down by 9%.
• Energy efficiency of the sector has increased substantially over the past decade. Production rose by 38% between 1993 and 2001, while energy use grew by only 20%, resulting in a 12% reduction in energy use per tonne of production.
42 See the Canada Wide Standard for Dioxins and Furans for Incineration, CCME May 2001 http://www.ccme.ca/initiatives/standards.html?category_id=50#23; and the Canada Wide-Standard for Mercury Emissions, CCME June 2000, http://www.ccme.ca/assets/pdf/mercury_emis_std_e1.pdf. 43 See, for example, the Cement Association of Canada, http://www.cement.ca/cement.nsf/internetE/9F51AD42A60BFA0205256AFD004EA325?OpenDocument#integrity. 44 In Ontario, for example, exemptions from hazardous waste approvals requirements are only provided for the burning of wastes as fuel on the site of their generation. Off-site operations using waste as fuel do not fall within the recycling exemptions contained in the province’s hazardous waste regulations. See Ontario Regulation 247. 45 See EBR Posting EBR IA9E1123 re: Entireco Inc., Catham, Ontario, February 2, 2000.
Energy Use in the Cement Industry in North America: Emissions, Waste Generation and Pollution Control
65
• There has been a significant growth in the use of waste fuels since the early 1990’s, with a 46% increase from 1990 to 2000, although waste fuels remain a relatively small portion of total fuel usage (<10%) even at peak levels of use (1999). The portion of total fuel provided from wastes varies significantly from year to year. This is likely a function of both waste fuel availability and cost.
o Provincial breakdowns of the use of waste fuel in cement kilns are not available.
• The total reported pollutant releases for the sector for 1994 to 2000 rose substantially, particularly releases of manganese and chromium. However this may due to improved reporting rather than actual increases in emissions.
• Although Canadian governments have adopted guidelines that are generally supportive of the use of certain types of hazardous wastes as supplemental fuels in cement kilns, despite pressures from the cement industry, the use of hazardous wastes in this way continues to be regulated as a hazardous waste disposal activity, and requires specific provincial approvals in order to take place. Still, nationwide emission standards for dioxins, furans and other toxics have not been developed for the hazardous or non-hazardous waste burning cement industry.
• In the past few years, the industry has demonstrated a greater interest in the use of scrap tires, rather than hazardous wastes, as supplemental fuel. In addition, in the few years a number of new facilities have been established for the purpose of collecting scrap tires and exporting them to Mexico.
6.0 Conclusions The report finds that the cement industry is a continental industry in North America, although the trends in the sector tend to be driven by US demand. Over the past decade, US demand has exceeded domestic supply by a wide margin. In this context, Canada has emerged as a major source of supply to the US, with major increases in production and particularly exports since the early 1990s. Mexico exports to the U.S. have also outpaced a nearly stagnant growth in production for its domestic market, although anti-dumping tariffs stemming from 1989 have prevented Mexican-based companies from gaining a major market share of the U.S. market. Within the last few years, two Mexican cement companies have been building plants in US to gain access to the market and have become major producers of cement in the US. These investment decisions have not been driven by less stringent environmental regulations, but simply by the economics of tariffs and transportation costs versus investment as a way to enter the U.S. market. Still, the lack of environmental regulations for the cement industry has until now allowed cement manufacturers significant freedom in their choice of fuels and pollution control equipment.
Energy use – and in particular fuel use – is a major price factor in the production of cement. Because of this, companies in all three countries have invested in energy
Energy Use in the Cement Industry in North America: Emissions, Waste Generation and Pollution Control
66
efficiency measures, such as converting wet kilns to dry kilns, or to adding precalciners and predryers to their cement production process, a more efficient process in terms of fuel use. Despite these investments, electric and total energy consumption per unit of output appears to have risen slightly in the US over the past decade. In contrast, the Canadian and Mexican cement industries appear to be more efficient and in general energy efficiency has increased (i.e. energy use per unit of output decreased) over the last decade. In Canada, a number of newer plants have come on-line since the early 1990s in part in response to the increased US demand. The Mexican plants tend to be newer, “dry” process facilities and most have preheaters and/or precalcinators as well. Still, efficiency gains in the early 1990s have not continued at the same pace, and in fact, in recent years there has been a slight decline in energy efficiency, possibly in part because of the shift toward petroleum coke.
In all three countries, the use of fuels has changed significantly over the last five to ten years. In the U.S., there has been a general shift toward coal, petroleum coke and alternative wastes such as liquid and solid hazardous wastes, and a lessening dependence upon natural gas to fuel the cement making process. As in the U.S., kilns in Mexico have been shifting their use of fuels, in this case from an almost universal reliance on fuel oils to fuel oils, petroleum coke and alternative fuels. Interestingly, this new reliance on hazardous wastes has continued at the same time as Mexico has become a signatory to the Stockholm Convention, calling for the control and phase-out of the production of dioxins and furans. In Canada, there has been less of shift in terms of the type of fuel used, although there has been a decrease in the use of natural gas and an increase in the use of coal. This shift may reflect the changing price of natural gas rather than a major change in fuel use.
The volume of ‘alternative’ fuels (tires, solid hazardous waste and liquid hazardous and non-hazardous wastes) used by the cement sector is increasing in all three countries, although it still makes up a relatively small percentage of total waste. In the US and Mexico the industry has emerged as a major manager of hazardous wastes. This has not, however, been the case in Canada where emphasis has been on the use of tires and non-hazardous wastes, including wood waste, as alternative fuels. Cement facilities burning hazardous wastes as fuels in Canada continue to be approved and regulated as hazardous waste disposal facilities despite opposition from the industry.
Air emissions are determined both by the type of fuel burned as well as the types of pollution control equipment used by cement manufacturers. In all three countries, data on emissions is somewhat limited and is often based upon emission factors rather than direct measurement. Cement manufacturing – by its very nature – leads to carbon dioxide (greenhouse gas) emissions, both because carbon dioxide is released in the process of turning limestone into clinker, as well as in the combustion of fuels. In the U.S., continued reliance on coal, as well as the sustained use of petroleum coke, as well as of tires, has probably resulted in increased emissions of greenhouse gas emissions, both as a total and on a per tonne basis. Toxic pollution, including dioxins and furans and heavy metals – mainly as a result of the increased use of hazardous wastes as fuels – appears to have also increased since 1993.
Energy Use in the Cement Industry in North America: Emissions, Waste Generation and Pollution Control
67
Canadian data suggests that there has been a slight decrease in per tonne emissions of carbon dioxide, although preliminary toxic data suggests an increase in toxics. Unfortunately, data on emissions in Mexico is either not available or inaccessible. Nonetheless, emission factors widely used would suggest that the shift from fuel oils to petroleum coke has probably increased greenhouse gas emissions in the sector over the period. Very limited data from Mexico suggests that the small use of hazardous wastes as fuels in the sector has not led to major releases of dioxins and furans or other toxics, but it is important to note that only very limited company testing has been done thus far to measure such emissions.
The US and Mexico have recently adopted new, more comprehensive emission standards for cement kilns after years of relatively lax regulation and enforcement. The US applies more comprehensive standards to kilns burning hazardous wastes, while the Mexican standards apply to all kilns regardless of fuel type. Nonetheless, these rules are still being implemented and have yet to be enforced. While these regulations are leading to more investment in pollution control equipment, including baghouses, scrubbers and electrostatic precipitators, it is important to note that the standards are significantly less stringent than similar standards for incinerators of hazardous waste, and will continue to allow for increased burning of hazardous wastes. There is also concern that the limited amount of monitoring required, particularly in Mexico, will not gaurantee compliance with the new standards. In fact, the new standards allow for significant increases in the burning of hazardous wastes with limited monitoring might be considered in direct contradiction to the recent ratification by Mexico of the Stockholm Convention on POPs, which calls for increased monitoring and phase-out of such sources of contamination.
In contrast, Canada has no enforceable national emission standards for the sector. National emission guidelines, adopted by the federal government in 1991 only deal with NOx emissions and are not legally enforceable. The CCME adopted guidelines for cement kilns using wastes as fuels in 1996, but again these standards are not legally enforceable. More recent CCME standards for emissions of dioxins and furans and mercury from incinerators have not been applied to cement facilities.
The report also found that Cement Kiln Dust is the major waste stream produced by the cement manufacturing process. Nevertheless, a lack of data makes it difficult to determine what the trend is in terms of generation and management of this waste stream. Limited data from the U.S. suggests that hazardous waste burning increases the amount and toxicity of this waste, although overall the amount of CKD waste generated has declined as cement kilns put CKD back into the production process. In all three countries, regulations regarding cement kiln dust have gaps. While the U.S. began the process of regulating management of CKD, it appears it will delay final implementation until further study of current management practices, despite major, well-documented environmental problems. Standards in Mexico and Canada are similarly ill-defined or non-existent.
It does not appear that companies are investing in cement manufacturing in any country to take advantage of less stringent environmental regulations and enforcement but
Energy Use in the Cement Industry in North America: Emissions, Waste Generation and Pollution Control
68
rather to gain access to the market. Whether or not new pollution control rules in the U.S. and Mexico will cause a shift in investment strategy among the three countries is unclear, although the major factors in decisions about fuel use will probably continue to be price and availability, not energy efficiency, regulations, or environmental cleanliness. It is also unclear whether the burning of hazardous wastes could lead to major shipments of hazardous wastes across international lines for cement kiln incineration, as some have proposed. This report was not able to determine with precision whether the recent investment by Mexican companies in the U.S. or the consolidation of the industry has led to important technology transfer gains in terms of energy efficiency or pollution control, although initial evidence suggests that plants purchased by the Mexican companies have been upgraded in terms of pollution control and energy efficiency. Further study – including direct surveys and examination of company documents -- could help determine with precision whether the consolidation of the cement industry in North America and NAFTA-led investment, particularly within the U.S., has led to any such improvements.
The report recommends, however, that given the international nature of the cement industry, that some common guidelines and/or regulations be adopted in all three countries. Recommendations include:
Cement kilns burning hazardous wastes should be regulated as hazardous waste disposal facilities
Canada needs to adopt updated enforceable emission standards for kilns burning both conventional fuels and hazardous wastes, as have the US and Mexico.
Energy efficiency standards and greenhouse emission standards for the cement sector should be adopted in all three countries.
The CEC should initiate a dialogue about the burning of alternative wastes in cement kilns with a specific focus on dioxin and furan emissions and the control of CKD.
The CEC should continue to strengthen its Sound Management of Chemicals program to emphasize a North American Management Strategy of hazardous wastes and reduction of dioxin and furan emissions.
Energy Use in the Cement Industry in North America: Emissions, Waste Generation and Pollution Control
69
7.0 Bibliography American Portland Cement Association, 1997. APCA 1995 CKD Survey.
Batelle Industries, Toward A Sustainable Cement Industry, Commissioned by World Business Council for Sustainable Development, March 2002.
“Building May Start This Year on Cement Plant,” The Pueblo Chieftan, February 17, 2003.
Cámara Nacional del Cemento. Internal Documents Provided to Authors. México, D.F. 2002
Canadian Industrial Energy End-Use Data and Analysis Centre, A Review of Energy Consumption and Related Data: Canadian Portland Cement Industries 1990-2000 (Burnably, B.C.: School of Resource and Environmental Management, Simon Fraser Unviversity, 2002).
Canadian Council of Ministers of the Environment, National Guidelines for the Use of Hazardous and Non-Hazardous Wastes as Supplementary Fuels in Cement Kilns (Winnipeg, CCME, 1996)
Canadian Council of Ministers of the Environment, Canada-Wide Standard for Dioxins and Furans for Incineration (Winnipeg, CCME, May 2001)
Canadian Council of Ministers of the Environment, Canada-Wide Standard for Mercury Emissions (Winnipeg: CCME, June 2000).
Cement America, ‘U.S. Cement Producers allege Government Inaction Violates Constitutional Rights,” Mar 1, 2002.
Cement Association of Canada, www.cement.ca
CEMEX, 2001 Annual Report (Mexico, DF: CEMEX, 2002).
CEMEX, “10 Cement Companies Pledge Specific Actions on 6 High Priority Issues for Sustainable Development,” July 3, 2003 Press Release. Available at www.cemex.com/qr/mc_pr_070302.asp.
Centro Nacional de Investigación y Capacitación Ambiental (CENICA). Informe de la situación y los conocimientos actuales sobre las principales fuentes y emisiones de dioxinas en México. Segundo Reporte. .México. 2001
Club Español de Residuos (CER). Contribución de la industria del cemento a la gestión de residuos en Europa. Cuadernos del CER Nº 3. España. Septiembre 2001.
Energy Use in the Cement Industry in North America: Emissions, Waste Generation and Pollution Control
70
Commission on Environmental Cooperation, North American Regional Action Plan on Environmental Monitoring and Assessment (Montreal, CA: CEC, June 3, 2002).
Robert Cook “Cement Exports from Mexico,” TED (Trade and Environment) Case Studies: An Online Journal, American University, (Vol. 3, No. 2, June 1994), available at www.american.edu/TED/CEMEX.HTM.
E.Craig and R.Mirza, "Developement of National Guidelines for the Use of Hazardous and Non-Hazardous Wastes in Cement Kilns in Canada," in Waste Combustion in Boilers and Industrial Furnances: Conference Proceedings (Pittsburgh: AIr & Waste Management Association, 1994).
DPRA Incorporated, Technical Background Document: Compliance Cost Estimates for the Proposed Land Management Regulations of Cement Kiln Dust (St. Paul, Minnesotta, 1998), p. 6.
Energy Information Administration, Emissions of Greenhouse Gases in the United States, 2000 (Washington, DC: US EIA, October 2001)
Energy Information Administration, Emissions of Greenhouse Gases in the United States (Washington, D.C.: U.S.EIA, December 2002).
Environment Canada, National Pollutant Release Inventory Databases, www.ec.gc.ca/pbd/npri/npri_home_e.cfm
Environment Canada, National Emissions Guidelines for Cement Kilns (1991). www.ec.gc.ca/energ/industry/guidelines/cement_e.htm
Grupo Cementos Chihuahua, Annual Report 2001 (GCC: Chihuahua City, Chihuahua, Mexico, 2002).
Ken Humphreys and Maha Mahasenan, Toward a Sustainable Cement Industry: Climate Change, Substudy 8 (Batelle, Commissioned by World Business Council for Sustainable Development), March 2002.
Instituto Nacional de Estadística, Geografía e Informática (INEGI). El Sector Energético. México. 2002
Instituto Nacional de Estadística, Geografía e Informática (INEGI), Secretaría de Medio Ambiente, Recursos Naturales y Pesca (Semarnap). Estadísticas del Medio Ambiente, México 1999. México. 1999
Instituto Nacional de Estadística, Geografía e Informática (INEGI). Encuesta Industrial Anual 1995 y 1997. México.
N. Martin, E. Worrell, M. Ruth,. L. Price, Emerging Energy-Efficient Industrial Technologies (Ernest Orlando Lawrence Berkeley National Laboratory. Berkeley, California) October 2000.
Energy Use in the Cement Industry in North America: Emissions, Waste Generation and Pollution Control
71
NAFTA, Annex 302.2, Schedule of Canada, Schedule of Mexico, Schedule of United States
North American Working Group for the Sound Management of Chemicals, Decision Document on Dioxins and Furans under the Process for Identifying Candidate Substances for Regional Action under the Sound Management of Chemicals Initiative. (Montreal, CA: Commission on Environmental Cooperation, March 31, 1999).
Nyboer, John and Alison Laurin, CIEEDAC, Development of Greenhouse Gas Intensity Indicators for Canadian Industry, 1990 to 2000 (March 2002).
Ontario Ministry of the Environment, Environmental Bill of Rights Registry, http://www.ene.gov.on.ca/envision/env_reg/ebr/english/index.htm
Mark A. Richardson, An Introduction to Policy and Legal Issues Associated with Burning Hazardous Waste in Cement Kilns: A Briefing Paper of the American Lung Association (Washington, D.C.: American Lung Association, April, 1995)
Statistics Canada, Catalogue No. 44-001, Table 303-0001
U.S. Environmental Protection Agency, AIRSDATA, National Emissions Trend Database, 1996 and 1999.
U.S. Environmental Protection Agency, Toxics Release Inventory Query (www.epa.gov/enviro/tri/)
U.S. Environmental Protection Agency, The National Biennial RCRA Hazardous Waste Report (Based on 1991 Data), (Washington, D.C.: US EPA, August 1993).
U.S. Environmental Protection Agency, The National Biennial RCRA Hazardous Waste Report (Based on 1993 Data), (Washington, D.C.: US EPA, August 1995).
U.S. Environmental Protection Agency, The National Biennial RCRA Hazardous Waste Report (Based on 1995 Data), (Washington, D.C.: US EPA, August 1997).
U.S. Environmental Protection Agency, The National Biennial RCRA Hazardous Waste Report (Based on 1997 Data), (Washington, D.C.: US EPA, August 1999).
U.S. Environmental Protection Agency, 40 CFR Parts 259,261,266 and 270, Standards for the Management of Cement Kiln Dust; Proposed Rule, Federal Register, August 20, 1999, p. 45636.
U.S. Environmental Protection Agency, Environmental Fact Sheet: Management Standards Proposed for Cement Kiln Dust Waste (Office of Solid Waste: EPA530-F-99-023), August 1999.
U.S. Environmental Protection Agency, The National Biennial RCRA Hazardous Waste
Energy Use in the Cement Industry in North America: Emissions, Waste Generation and Pollution Control
72
Report (Based on 1999 Data), (Washington, D.C.: US EPA, August 2001).
United States Environmental Protection Agency, Environmental Fact Sheet: Interim Emission Standards for 1999 Hazardous Waste Combustor Rule, EPA530-F-02-008, February 2002
U.S. Environmental Protection Agency, “Additional Data Available on Wastes Studies in Report to Congresson Cement Kiln Dust,” Federal Register, July 25, 2002.
United States Geographic Service, U.S. Bureau of Mines, “Cement” Chapter in Minerals Yearbook, Annual, 1991 – 2001 (Washington, D.C., USGS).
U.S. International Trade Commission, 2003 Tariff Database, HTS Number 25231000.
Hendrik G. van Oss and Amy Padovani, “Cement Manufacture and the Environment: Part 1, Chemistry and Technology,” Journal of Industrial Ecology (Volume 6, No. 1): 98.