ENERGY UDIT FINAL EPORT - Amazon S3Twp+MUA...Raw Water Pump Station Generator Building ECM NO.ECM...
68
ENERGY AUDIT – FINAL REPORT BRICK TOWNSHIP M.U.A. WATER TREATMENT PLANT BRICK, NJ 08724 ATTN: MR. JAY DELANEY PROJECT MANAGER CEG PROJECT NO. 9C09064 CONCORD ENGINEERING GROUP 520 SOUTH BURNT MILL ROAD VOORHEES, NJ 08043 TELEPHONE: (856) 427-0200 FACSIMILE: (856) 427-6529 WWW.CEG-INC.NET CONTACT: Michael Fischette, PRINCIPAL EMAIL: [email protected]
Transcript of ENERGY UDIT FINAL EPORT - Amazon S3Twp+MUA...Raw Water Pump Station Generator Building ECM NO.ECM...

ENERGY AUDIT – FINAL REPORT
BRICK TOWNSHIP M.U.A.
WATER TREATMENT PLANT BRICK, NJ 08724
ATTN: MR. JAY DELANEY
PROJECT MANAGER
CEG PROJECT NO. 9C09064
CONCORD ENGINEERING GROUP
520 SOUTH BURNT MILL ROAD VOORHEES, NJ 08043 TELEPHONE: (856) 427-0200 FACSIMILE: (856) 427-6529 WWW.CEG-INC.NET
CONTACT: Michael Fischette, PRINCIPAL
EMAIL: [email protected]

Brick Township MUA Water Treatment Plant Energy Audit
Concord Engineering Group, Inc. 9C09064 January 19, 2010– FINAL Page 1 of 48
Table of Contents
I. EXECUTIVE SUMMARY ................................................................................................. 3
II. INTRODUCTION ............................................................................................................... 8
III. METHOD OF ANALYSIS................................................................................................ 10
IV. HISTORIC ENERGY CONSUMPTION/COST ............................................................... 14
A. ENERGY USAGE / TARIFFS .................................................................................................. 14
B. ENERGY USE INDEX (EUI) .................................................................................................. 19
C. EPA ENERGY BENCHMARKING SYSTEM ............................................................................. 20
V. FACILITY DESCRIPTION .............................................................................................. 21
VI. MAJOR EQUIPMENT LIST ............................................................................................ 25
VII. ENERGY CONSERVATION MEASURES ..................................................................... 26
VIII. RENEWABLE/DISTRIBUTED ENERGY MEASURES ................................................ 43
IX. ENERGY PURCHASING AND PROCUREMENT STRATEGY .................................. 44
X. INSTALLATION FUNDING OPTIONS.......................................................................... 46
XI. ADDITIONAL RECOMMENDATIONS ......................................................................... 48
Appendix A – ECM Cost & Savings Breakdown
Appendix B – New Jersey Smart Start® Program Incentives
Appendix C – Portfolio Manager “Statement of Energy Performance”
Appendix D – Major Equipment List
Appendix E – Investment Grade Lighting Audit
Appendix F – Detailed Lighting Controls Audit

Brick Township MUA Water Treatment Plant Energy Audit
Concord Engineering Group, Inc. 9C09064 January 19, 2010– FINAL Page 2 of 48
REPORT DISCLAIMER
The information contained within this report, including any attachment(s), is intended solely for use by the named addressee(s). If you are not the intended recipient, or a person designated as responsible for delivering such messages to the intended recipient, you are not authorized to disclose, copy, distribute or retain this report, in whole or in part, without written authorization from Concord Engineering Group, Inc., 520 S. Burnt Mill Road, Voorhees, NJ 08043.
This report may contain proprietary, confidential or privileged information. If you have received this report in error, please notify the sender immediately. Thank you for your anticipated cooperation.

Brick Township MUA Water Treatment Plant Energy Audit
Concord Engineering Group, Inc. 9C09064 January 19, 2010– FINAL Page 3 of 48
I. EXECUTIVE SUMMARY
This report presents the findings of the energy audit conducted for:
Brick Township Municipal Utilities Authority Water Treatment Plant which includes the following:
A. Raw Water Pump Station B. Pre-Treatment Building C. Control Building D. Finished Water Pump Station E. Generator Building
1551 Route 88 Brick, NJ 08724 Municipal Contact Person: Jay Delaney, Project Manager This audit is performed in connection with the New Jersey Clean Energy - Local Government Energy Audit Program. The energy audit is conducted to promote the mission of the office of Clean Energy, which is to use innovation and technology to solve energy and environmental problems in a way that improves the State’s economy. This can be achieved through the wiser and more efficient use of energy. The annual energy costs at this facility are as follows: The potential annual energy cost savings for each energy conservation measure (ECM) are shown below in Table 1. Be aware that the ECM’s are not additive because of the interrelation of some of the measures. This audit is consistent with an ASHRAE level 2 audit. The cost and savings for each measure is ± 20%. The evaluations are based on engineering estimations and industry standard calculation methods. More detailed analyses would require engineering simulation models, hard equipment specifications, and contractor bid pricing.
Electricity $1,003,386
Natural Gas $57,943
Diesel Fuel $9,477
Total $1,070,806

Brick Township MUA Water Treatment Plant Energy Audit
Concord Engineering Group, Inc. 9C09064 January 19, 2010– FINAL Page 4 of 48
Table 1A Energy Conservation Measures (ECM #1)
ENERGY CONSERVATION MEASURES (ECM's)
ECM #1A Lighting Upgrade $1,760 $350 5.0 198.3%
ECM #2A Lighting Controls $530 $125 4.2 253.8%
ECM #3A Pump and Motor System Upgrade $598,400 $1,663 359.8 -94.4%
ECM #1B Lighting Upgrade $2,640 $940 2.8 434.1%
ECM #2B Lighting Controls $420 $277 1.5 889.3%
ECM #1C Lighting Upgrade $4,190 $595 7.0 113.0%
ECM #2C Lighting Controls $2,240 $626 3.6 319.2%
ECM #3C Pump and Motor System Upgrade $521,000 $4,057 128.4 -84.4%
ECM #1D Lighting Upgrade $655 $814 0.8 1764.1%
ECM #2D Lighting Controls $550 $247 2.2 573.6%
ECM #3D Pump and Motor System Upgrade $155,887 $21,401 7.3 174.6%
ECM #1E Lighting Upgrade $1,700 $288 5.9 154.1%
ECM #2E Lighting Controls $930 $104 8.9 67.7%
Notes:
Finished Water Pump Station
NET INSTALLATION
COSTA
A. Cost takes into consideration applicable NJ Smart StartTM incentives.B. Savings takes into consideration applicable maintenance savings.
ANNUAL SAVINGSB
Raw Water Pump Station
Generator Building
ECM NO.ECM NO. DESCRIPTION SIMPLE PAYBACK (Yrs)
SIMPLE LIFETIME ROI
Pre-Treatment Building
Water Treatment Plant Control Building
Brick Township MUA Water Treatment Plant Energy Audit
Concord Engineering Group, Inc. 9C09064 January 19, 2010– FINAL Page 5 of 48
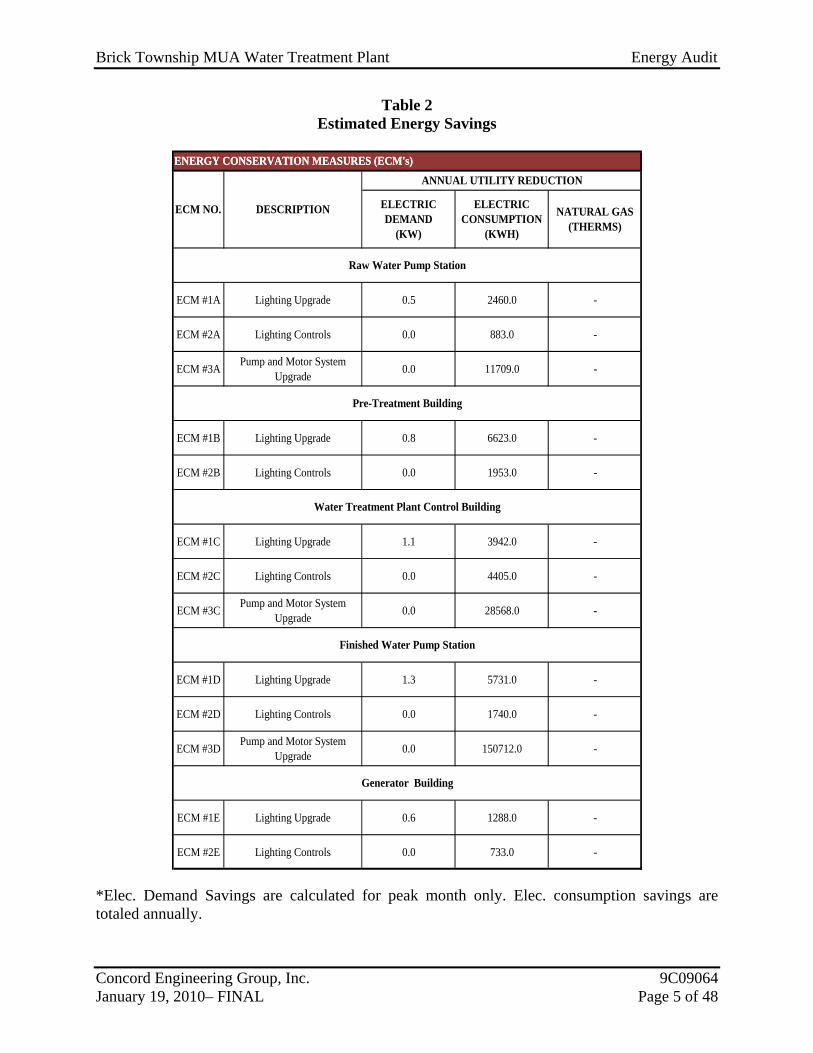
Table 2 Estimated Energy Savings
ECM #1A Lighting Upgrade 0.5 2460.0 -
ECM #2A Lighting Controls 0.0 883.0 -
ECM #3A Pump and Motor System Upgrade 0.0 11709.0 -
ECM #1B Lighting Upgrade 0.8 6623.0 -
ECM #2B Lighting Controls 0.0 1953.0 -
ECM #1C Lighting Upgrade 1.1 3942.0 -
ECM #2C Lighting Controls 0.0 4405.0 -
ECM #3C Pump and Motor System Upgrade 0.0 28568.0 -
ECM #1D Lighting Upgrade 1.3 5731.0 -
ECM #2D Lighting Controls 0.0 1740.0 -
ECM #3D Pump and Motor System Upgrade 0.0 150712.0 -
ECM #1E Lighting Upgrade 0.6 1288.0 -
ECM #2E Lighting Controls 0.0 733.0 -
ECM NO. DESCRIPTION
ANNUAL UTILITY REDUCTION
ENERGY CONSERVATION MEASURES (ECM's)ENERGY CONSERVATION MEASURES (ECM's)
ELECTRIC DEMAND
(KW)
ELECTRIC CONSUMPTION
(KWH)
NATURAL GAS (THERMS)
Raw Water Pump Station
Pre-Treatment Building
Water Treatment Plant Control Building
Finished Water Pump Station
Generator Building
*Elec. Demand Savings are calculated for peak month only. Elec. consumption savings are totaled annually.

Brick Township MUA Water Treatment Plant Energy Audit
Concord Engineering Group, Inc. 9C09064 January 19, 2010– FINAL Page 6 of 48
Concord Engineering Group (CEG) recommends proceeding with the implementation of all ECM’s that provide a calculated simple payback at or under ten (10) years. The following Energy Conservation Measures are recommended for the facility:
• ECM #1: Lighting Upgrade (subject to Authority Safety Officer approval)
• ECM #2: Lighting Controls (subject to Authority Safety Officer approval)
• ECM #3: Finished Water Pumps and Motors Systems Upgrade (Finished Water Pump Station)
In addition to the ECMs, there are maintenance and operational measures that can provide energy savings and provide immediate benefits. The ECMs listed above represent investments that can be made to the facility which are justified by the savings seen overtime. However, the maintenance items and small operational improvements below are typically achievable with on site staff or maintenance contractors and in turn have the potential to provide operational savings compared to the costs associated. The following are recommendations which should be considered a priority in achieving an energy efficient building:
A. Maintain all weather stripping on windows and doors.
B. Clean all light fixtures to maximize light output.
C. Provide more frequent air filter changes to decrease overall system power usage and maintain better IAQ.
D. Several of the larger pumps at the WTP (125 hp and up) do not qualify for Smart Start® Incentives due to annual kWh savings falling below the incentives’ threshold of 25,000 kWh. Several of the pump and motor combinations have exceeded normal service lives due to the aggressive maintenance program adhered to by Authority staff. When the pumps are eventually replaced the energy savings shown on the major equipment appendix can be realized.
E. The four rapid mixers do not qualify for Smart Start® Incentives due to the small horsepower motors below the incentives’ threshold of 25 hp. Philadelphia and Lighting Mixers currently available incorporate mixing propellers that require less energy to achieve the same mixing. When the mixers are eventually replaced a small energy savings can be realized.
F. The Authority may want to study the feasibility of installing a water turbine on the waterline from the reservoir to the WTP. A flow of 10 mgd and a positional head of 65 feet indicate a potential for a 110 hp turbine. A Flowserve brand TKW type water turbine can operate within the range of BTMUA flows from the reservoir.
G. Retro-commissioning - In addition to the recommendations above, expanding Retro-
Commissioning to include all of the older larger pumps and motors would be beneficial for this facility. Retro-Commissioning is a means to verify your current equipment is

Brick Township MUA Water Treatment Plant Energy Audit
Concord Engineering Group, Inc. 9C09064 January 19, 2010– FINAL Page 7 of 48
operating at its designed mechanical efficiency range, hydraulic flow capacity, designed motor efficiency and overall performance. Retro-Commissioning provides valuable insight into systems or components not performing correctly or efficiently. The commissioning process defines the original system design parameters and recommends revisions to the current system operating characteristics.
Brick Township MUA Water Treatment Plant Energy Audit
Concord Engineering Group, Inc. 9C09064 January 19, 2010– FINAL Page 8 of 48
II. INTRODUCTION
This comprehensive energy audit covers the Brick MUA’s Water Treatment Facility: Raw Water Pump Station, Pre-Treatment Building, Control Building, Finished Water Pump Station and the Generator Building. The building footprints collectively encompass approximately 26,013 square feet. Electrical and diesel fuel utility information is collected and analyzed for one full year’s energy use of all three buildings separately. The utility information allows for analysis of the buildings’ operational characteristics, estimated savings potential, and baseline usage/cost to monitor the effectiveness of implemented measures. Computer spreadsheets are used to graph utility information and are depicted in section IV of this report. The Energy Use Index (EUI) is established for each building. Energy Use Index (EUI) is expressed in British Thermal Units/square foot/year (BTU/ft2/yr), which is used to compare energy consumption to similar building types or to track consumption from year to year in the same building. The EUI is calculated by converting the annual consumption of all energy sources to BTUs and dividing it by the area (gross square footage) of the building. Blueprints (where available) are utilized to verify the gross area of the facility. The EUI is a good indicator of the relative potential for energy savings. However when considering a pump station, EUI may not be a good representative. In a pump station all major equipment items must be considered separately. Energy saving measures which are specific to the industry must be considered In addition to simply looking at the EUI. In general, a low EUI indicates less potential for energy savings, while a high EUI indicates poor building performance therefore a high potential for energy savings. Existing building architectural and engineering drawings (where available) are utilized for additional background information. The building envelope, lighting systems, HVAC equipment, process equipment and controls information gathered from building drawings allow for a more accurate and detailed review of the building. The information is compared to the energy usage profiles developed from utility data. Through the review of the architectural and engineering drawings a building profile can be defined that documents building age, type, usage, major energy consuming equipment or systems, etc. The preliminary audit information is gathered in preparation for the site survey. The site survey provides critical information in deciphering where energy is spent and opportunities exist within a facility. The entire site is surveyed to inventory the following to gain an understanding of how each facility operates:
• Building envelope (roof, windows, etc.) • Heating, ventilation, and air conditioning equipment (HVAC) • Lighting systems and controls • Facility-specific equipment
The building site visit is performed to survey all major building components and systems. The site visit includes detailed inspection of energy consuming components. Summary of building occupancy schedules, operating and maintenance practices, and energy management programs

Brick Township MUA Water Treatment Plant Energy Audit
Concord Engineering Group, Inc. 9C09064 January 19, 2010– FINAL Page 9 of 48
provided by the building manager are collected along with the system and components to determine a more accurate impact on energy consumption.

Brick Township MUA Water Treatment Plant Energy Audit
Concord Engineering Group, Inc. 9C09064 January 19, 2010– FINAL Page 10 of 48
III. METHOD OF ANALYSIS General: Post site visit work includes evaluation of the information gathered, researching possible conservation opportunities, organizing the audit into a comprehensive report, and making recommendations on HVAC, lighting, process equipment and building envelope improvements. Data collected is processed using energy engineering calculations to anticipate energy usage for each of the proposed energy conservation measures (ECMs). The actual building’s energy usage is entered directly from the utility bills provided by the owner. The anticipated energy usage is compared to the historical data to determine energy savings for the proposed ECMs. It is pertinent to note, that the savings noted in this report are not additive. The savings for each recommendation is calculated as standalone energy conservation measures. Implementation of more than one ECM may in some cases affect the savings of each ECM. The savings may in some cases be relatively higher if an individual ECM is implemented in lieu of multiple recommended ECMs. For example implementing reduced operating schedules for inefficient lighting will result in a greater relative savings. Implementing reduced operating schedules for newly installed efficient lighting will result in a lower relative savings, because there is less energy to be saved. If multiple ECM’s are recommended to be implemented, the combined savings is calculated and identified appropriately. ECMs are determined by identifying the building’s unique properties and deciphering the most beneficial energy saving measures available that meet the specific needs of the facility. The building construction type, function, operational schedule, existing conditions, and foreseen future plans are critical in the evaluation and final recommendations. Energy savings are calculated based on industry standard methods and engineering estimations. Energy consumption is calculated based on manufacturer’s cataloged information when new equipment is proposed. Specific Process Equipment Energy Method of Analysis: Dramatic increases in energy prices have made the water and wastewater industry aware of the significance of energy costs. Energy plays an important role in decisions that pertain to equipment replacement, design and operation of water, wastewater treatment plants and pump stations. An energy audit is an inspection, survey and analysis of energy flows in a process or system with the objective of understanding the energy dynamics of the system and study. An energy audit is conducted to seek opportunities to reduce the amount of energy input into the system without negatively affecting the output. It is a survey of major areas of energy usage in treatment plants and pump stations followed by a cost effectiveness analysis of methods that can be used to reduce energy usage.

Brick Township MUA Water Treatment Plant Energy Audit
Concord Engineering Group, Inc. 9C09064 January 19, 2010– FINAL Page 11 of 48
The greatest energy consumers in water and wastewater treatment facilities and pump stations are the motors that drive pumping equipment. Overall wire-to-water efficiency is calculated by the following equation: Where: H: differential head across the pump, ft. Q: flow rate, gpm Hp: horse power
960,3)(
××
=hp
QHeEfficiencyWatertoWire
The wire-to-water efficiency can also be calculated as follows: e = pump eff. x drive eff. x motor eff. To minimize energy consumption each of the efficiency components of the above efficiency equation must be examined and maximized. The overall wire-to-water efficiency formula reveals that the efficiency of the pump can be maximized by operating the pump at design flows and total dynamic head that coincides with the pumps most efficient operation range In other words, pumps with the highest flow per kWh should be operated where there is more than one pump available. It should be noted that pump wear can have a significant effect on pump performance. The next element in the overall efficiency equation is the electric motors. Two approaches are used to improve efficiency in existing systems: - use of more efficient motors - operation of motors at or near the nameplate rating Motors can be loosely categorized as premium efficiency and standard efficiency motors. Premium efficiency motors generally cost more than comparable standard efficiency motors. These motors offer exceptional value if they are operated more than 50% of the time. The last major element affecting overall efficiency is the drive. The constant speed drive with simple on-off control is the most efficient overall drive unit when it is operated at or near the most efficient point on the pump curve. However, most pumping applications require more flexibility in pump output. One of the most efficient methods of varying the pump output is using variable speed drives; one of the most efficient variable speed drives is the variable frequency drive.
Brick Township MUA Water Treatment Plant Energy Audit
Concord Engineering Group, Inc. 9C09064 January 19, 2010– FINAL Page 12 of 48
There are number of other factors that may be considered in an energy audit in addition to equipment selection. They are as follows: - power factor - demand - time of use The demand and time-of-use factors can be defined for each specific process application. It is worthwhile to add a few comments regarding the potential of a low power factor at the Authority’s facilities and the resultant inefficient operation of the facilities. A review of the Authority’s energy distributor, Jersey Central Power and Light (JCP&L) and energy supplier Con Edison Solutions (Con Ed), electric bills reveal the Authority is billed for kW used and kvar used. Power factor evaluation (cosine of the ratio of kW/kvar) found that the water plant generally operates above a power factor of 0.90 at around 0.92-0.93. A power factor of 1.00 is ideal; however power factors above 0.85 are generally considered good and does not warrant capacitor bank correction to lower the total reactive kvar. New Jersey electric utility companies generally do not penalize consumers with power factors greater than 0.85. However, if the power factor drops below 0.85 JCP&L may impose penalties upon the Authority unless corrective action is taken. JCP&L will give notice before imposing dollar penalties. The energy efficiency improvement methods described above, i.e. premium motors, operating equipment in an efficient range, variable frequency drives, will all service to raise the ratio closer to 1.0. A quick method to improve the power factor is to add capacitor banks to lower the total reactive kvar. Further review of the electric bills reveals that JCP&L charges the Authority for kvar even though the Authority power factor is considerably higher than 0.85. The annual cost is $3,000-$4,000 representing a small fraction of the annual billings; however, monitoring this charge is warranted. An effective method to take all of the factors into account is to periodically run equipment performance tests. For motors and pumps new equipment is typically tested during the startup to determine compliance with procurement specifications. Subsequent testing can be compared to establish efficiency trends of motor and pump combinations. Small pumps and motors typically receive very little testing whereas larger pieces of equipment receive increased levels of attention. For situations where test results are available a reasonably reliable increased cost of energy can be calculated for a loss of efficiency. For situations where test results are not available the energy audit engineer must estimate loss of efficiency based upon other equipment factors, data that may be available, maintenance records and personal experiences. Confirmation performance testing may be conducted during a subsequent design phase. The costs and savings are applied and a simple payback, simple lifetime savings, and simple return on investment are calculated. See below for calculation methods:

Brick Township MUA Water Treatment Plant Energy Audit
Concord Engineering Group, Inc. 9C09064 January 19, 2010– FINAL Page 13 of 48
ECM Calculation Equations:
⎟⎟⎠
⎞⎜⎜⎝
⎛=
SavingsYearlyCostNetPaybackSimple
( )LifetimeECMSavingsYearlySavingsLifetimeSimple ×=
CostNetCostNetSavingsLifetimeSimpleROILifetimeSimple )( −
=
( )LifetimeECMSavingsenanceMaYearlySavingsenanceMaLifetime ×= intint
( )∑=
⎟⎟⎠
⎞⎜⎜⎝
⎛
+=
N
nnIRRPeriodofFlowCashturnofRateInternal
0 1Re
( )∑=
⎟⎟⎠
⎞⎜⎜⎝
⎛
+=
N
nnDRPeriodofFlowCashValueesentNet
0 1Pr
Net Present Value calculations are based on Interest Rate of 3%.

Brick Township MUA Water Treatment Plant Energy Audit
Concord Engineering Group, Inc. 9C09064 January 19, 2010– FINAL Page 14 of 48
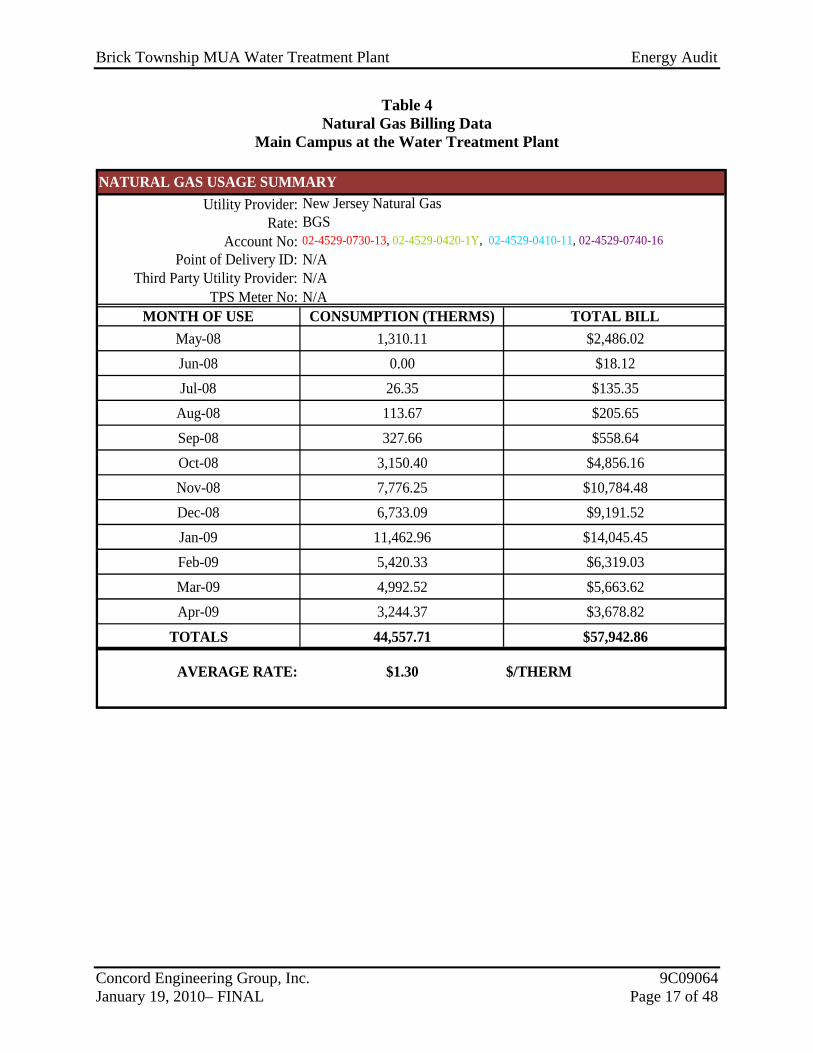
IV. HISTORIC ENERGY CONSUMPTION/COST A. Energy Usage / Tariffs Table 3 and Figure 1 represent the electrical usage for the entire Main Campus at the Water Treatment Plant from May-08 to April-09. The Authority receives primary power through one master meter and distributes power on a plant grid to all main campus buildings, process equipment and site lighting without the benefit of electric meters to individual end uses. The Authority contracts for supply from Con Edison Solutions of White Plains, NY. The Con Edison billing is based upon usage of kWh only. The Authority contracts for delivery from Jersey Central Power and Light (JCP&L). The JCP&L delivery rate schedule used is the General Service Primary – JC_GP_01D. The delivery rate includes supply availability charges, kvar delivery charge, societal benefits charges, and delivery service charges. The total monthly billings are divided approximately 2/3 Con Edison Solutions and 1/3 JCP&L. The electric rates have a component for consumption that is measured in kilowatt-hours (kWh). It is calculated by multiplying the wattage of the equipment times the hours that it operates. For example, a 1,000 Watt lamp operating for 5 hours would measure 5,000 Watt-hours. Since one kilowatt is equal to 1,000 Watts, the measured consumption would be 5 kWh. Rates used in this report reflect the historical data received for the facility. Table 4 and Figure 2 depict the natural gas energy usage for the Pre-Treatment Building, the Control Building, the Finished Water Pump Station and the Generator building from May-08 to April-09; the Raw Water Pump Station does not have a natural gas service. The Brick Township MUA Water Treatment Plant receives natural gas from New Jersey Natural Gas “Multi-Family/Use” rate structure. The Main Campus also has 3 diesel fuel driven electric generators. The generators are used for standby power on an intermittent basis in the latest one year period May 2008 through April 2009 the generators consumed 2901 gallons of diesel fuel. The average cost for each respective utility for the facility studied are as follows: Description Average Electricity 14.2¢ / kWh Natural Gas $1.30 /Therm Diesel Fuel $3.27 / Gallon

Brick Township MUA Water Treatment Plant Energy Audit
Concord Engineering Group, Inc. 9C09064 January 19, 2010– FINAL Page 15 of 48
Table 3 Electric Billing Data
Main Campus at the Water Treatment Plant
Utility Provider: JCP&LRate: JC_GP_01D
Meter No: L97024331 / Customer ID No: 0801431959
Third Party Utility ConEdisonTPS Meter / Acct No: 517809
MONTH OF USE CONSUMPTION KWH TOTAL BILL
May-08 496,245 $69,412 Jun-08 779,938 $111,093 Jul-08 754,427 $105,271
Aug-08 725,072 $101,046 Sep-08 728,453 $102,106 Oct-08 481,309 $70,051 Nov-08 472,382 $69,192 Dec-08 500,951 $69,134 Jan-09 519,121 $75,703 Feb-09 616,249 $88,262 Mar-09 545,960 $78,496 Apr-09 430,501 $63,620
Totals 7,050,608 1765.4 Max $1,003,386
AVERAGE DEMAND 1352.9 KW averageAVERAGE RATE $0.142 $/kWh
ELECTRIC USAGE SUMMARY
1009.9
1399.2
1350.0
1765.41400.41322.6
1507.7
1415.3
1382.4
1385.3823.0
1473.1
DEMAND

Brick Township MUA Water Treatment Plant Energy Audit
Concord Engineering Group, Inc. 9C09064 January 19, 2010– FINAL Page 16 of 48
Figure 1 Electric Usage Profile
Main Campus at the Water Treatment Plant
Brick Township MUA Water Treatment Plant Energy Audit
Concord Engineering Group, Inc. 9C09064 January 19, 2010– FINAL Page 17 of 48
Table 4 Natural Gas Billing Data
Main Campus at the Water Treatment Plant
Utility Provider: New Jersey Natural GasRate: BGS
Account No: 02-4529-0730-13, 02-4529-0420-1Y, 02-4529-0410-11, 02-4529-0740-16Point of Delivery ID: N/A
Third Party Utility Provider: N/ATPS Meter No:
MONTH OF USE CONSUMPTION (THERMS) TOTAL BILLMay-08 1,310.11 $2,486.02Jun-08 0.00 $18.12Jul-08 26.35 $135.35
Aug-08 113.67 $205.65Sep-08 327.66 $558.64Oct-08 3,150.40 $4,856.16Nov-08 7,776.25 $10,784.48Dec-08 6,733.09 $9,191.52Jan-09 11,462.96 $14,045.45Feb-09 5,420.33 $6,319.03Mar-09 4,992.52 $5,663.62Apr-09 3,244.37 $3,678.82
TOTALS 44,557.71 $57,942.86
AVERAGE RATE: $1.30 $/THERM
N/A
NATURAL GAS USAGE SUMMARY

Brick Township MUA Water Treatment Plant Energy Audit
Concord Engineering Group, Inc. 9C09064 January 19, 2010– FINAL Page 18 of 48
Figure 2 Natural Gas Usage Profile
Main Campus at the Water Treatment Plant

Brick Township MUA Water Treatment Plant Energy Audit
Concord Engineering Group, Inc. 9C09064 January 19, 2010– FINAL Page 19 of 48
B. Energy Use Index (EUI) Energy Use Index (EUI) is a measure of a building’s annual energy utilization per square foot of building. This calculation is completed by converting all utility usage consumed by a building for one year, to British Thermal Units (BTU) and dividing this number by the building square footage. EUI is a good measure of a building’s energy use and is utilized regularly for comparison of energy performance for similar building types. The Oak Ridge National Laboratory (ORNL) Buildings Technology Center under a contract with the U.S. Department of Energy maintains a Benchmarking Building Energy Performance Program. The ORNL website determines how a building’s energy use compares with similar facilities throughout the U.S. and in a specific region or state. Source use differs from site usage when comparing a building’s energy consumption with the national average. Site energy use is the energy consumed by the building at the building site only. Source energy use includes the site energy use as well as all of the losses to create and distribute the energy to the building. Source energy represents the total amount of raw fuel that is required to operate the building. It incorporates all transmission, delivery, and production losses, which allows for a complete assessment of energy efficiency in a building. The type of utility purchased has a substantial impact on the source energy use of a building. The EPA has determined that source energy is the most comparable unit for evaluation purposes and overall global impact. Both the site and source EUI ratings for the building are provided to understand and compare the differences in energy use. The site and source EUI for this facility is calculated as follows:
FootageSquareBuildingkBtuinUsageGaskBtuinUsageElectricEUISiteBuilding )( +
=
FootageSquareBuildingRatioSSXkBtuinUsageGasRatioSSXkBtuinUsageElectricEUISourceBuilding )( +
=
The site and source EUI cannot be accurately calculated for these buildings. There are nine (9) buildings on the campus electric meter and the individual buildings are not sub-metered. It would not be an accurate estimate to average the usage based on building square footage as this would improperly proportion the loading on the larger buildings like the Administration building where the pump stations would have the larger electrical loading.

Brick Township MUA Water Treatment Plant Energy Audit
Concord Engineering Group, Inc. 9C09064 January 19, 2010– FINAL Page 20 of 48
C. EPA Energy Benchmarking System The United States Environmental Protection Agency (EPA) in an effort to promote energy management has created a system for benchmarking energy use amongst various end users. The benchmarking tool utilized for this analysis is entitled Portfolio Manager. The Portfolio Manager tool allows tracking and assessment of energy consumption via the template forms located on the ENERGY STAR website (www.energystar.gov). The importance of benchmarking for local government municipalities is becoming more important as utility costs continue to increase and emphasis is being placed on carbon reduction, greenhouse gas emissions and other environmental impacts. Based on information gathered from the ENERGY STAR website, Government agencies spend more than $10 billion a year on energy to provide public services and meet constituent needs. Furthermore, energy use in commercial buildings and industrial facilities is responsible for more than 50 percent of U.S. carbon dioxide emissions. It is vital that local government municipalities assess facility energy usage, benchmark energy usage utilizing Portfolio Manager, set priorities and goals to lessen energy usage and move forward with priorities and goals. In accordance with the Local Government Energy Audit Program, CEG has created an ENERGY STAR account for the municipality to access and monitoring the facility’s yearly energy usage as it compares to facilities of similar type. The login page for the account can be accessed at the following web address; the username and password are also listed below:
https://www.energystar.gov/istar/pmpam/index.cfm?fuseaction=login.login The utility bills and other information gathered during the energy audit process are entered into the Portfolio Manager. The following is a summary of the results for the facility:
Table 5 ENERGY STAR Performance Rating
FACILITY DESCRIPTION
ENERGY PERFORMANCE
RATING
NATIONAL AVERAGE
Brick Main Campus Water Treatment Plant N/A N/A
A Statement of Energy Performance detailing energy summary cannot be provided for this campus facility. The electric service to this building is not separately metered and an accurate estimate cannot be made.

Brick Township MUA Water Treatment Plant Energy Audit
Concord Engineering Group, Inc. 9C09064 January 19, 2010– FINAL Page 21 of 48
V. FACILITY DESCRIPTION
General/Facility Limits
The facilities covered by this energy audit are limited to the buildings and a few building related process equipment components located at 1551 Highway 88 West commonly referred to as the main campus of the Brick Township Municipal Utilities Authority.
Background and BTUMUA Overview
The Brick Township Municipal Utilities Authority (Brick Utilities), established in 1969, provides potable water treatment and distribution services to the mainland areas of the Township of Brick, the adjoining Ramtown section of Howell Township, and provides bulk water supply to the communities of Point Pleasant and Point Pleasant Beach. The service area comprises nearly 100,000 residential, commercial, and light industrial customers. Brick Utilities also provides wastewater collection services for the entire 26.4 square miles of Brick Township which includes both mainland and barrier island areas. Energy audit studies relating to the wastewater collection system are covered under a separate report.
Water System Overview
Brick Utilities Authority maintains and operates a comprehensive water system which includes raw water supply, raw water treatment, potable water storage, and distribution facilities.
Raw water supply resources include surface water intake from the Metedeconk River at Forge Pond; 12 wells drawing groundwater from the Potomac-Raritan-Magothy and the Kirkwood-Cohansy aquifers; and an Aquifer Storage and Recovery (ASR) Well. These resources together with the water treatment facilities are maintained on the 46 acre main campus located on Route 88 West in Brick Township. Raw water supply is also stored in the one billion gallon Brick Reservoir, located on a 120 acre site situated approximately 3 ½ miles north of the main campus. The reservoir is supplied with water pumped from the Metedeconk River. This energy audit is restricted to the main campus buildings and water treatment plant process equipment.
Main Campus Facilities Description
The main campus facilities covered by this energy audit report consists of several buildings, water treatment process equipment and power systems. Listed below are the facilities, facility size and facility function.
Facility Name Function Facility Size (S.F.)
Raw Water Pump Station Process Equipment 2,490
Pre-Treatment Building Process Equipment 4,079
Wm Miller Jr. WTP Control Bldg Process Equipment 12,582

Brick Township MUA Water Treatment Plant Energy Audit
Concord Engineering Group, Inc. 9C09064 January 19, 2010– FINAL Page 22 of 48
Finished Water Pump Station Process Equipment 2,424
Generator Building Power 4,438
TOTAL 26,013 SF
Water treatment facilities utilize a conventional process consisting of pre-disinfection, oxidation, aeration, coagulation, flocculation, sedimentation, filtration, post-disinfection and pH adjustment for corrosion control. The water treatment plant was constructed in the 1970’s, upgraded to a capacity of 12-MGD in 1986 and to 16-MGD in 1994. The treatment complex also includes a state-certified water testing laboratory and the Supervisory Control and Data Acquisition (SCADA) system which provides real-time monitoring of treatment and system operating parameters providing the ability to continuously monitor and optimize flow and treatment conditions. The SCADA system is also used to support a comprehensive system of equipment maintenance and repair record keeping. Equipment testing is extensive and trend analysis is performed to evaluate energy costs and maintenance and repair costs. Management, operational support and emergency power generating facilities are also maintenance on-site.
Main Campus Electric Service
The main campus electric service is extensive and large enough that Brick Utilities Authority maintains close coordination with Jersey Central Power and Light (JCP&L) to time shift peak loads so as not to overload the JCP&L power grid.
Brick Utilities Authority owns all of the electrical distribution equipment which service the main campus, including the main sub-station transformers, which means the facility benefits from 13.8kV primary metering and billing. The main distribution system is divided into two distinct service voltages at the 15 kV main switchgear service entrance.
The 4,160-volt system is served by one (1) main 13.8-kV/4,160-volt, 1,500 kVa transformer, providing power to two (2) 4,160-volt 400 HP raw water pumps that were installed in 2004.
The 480-volt distribution system is normally serviced by one (1) main 13.8-kV/480-277-volt, 2,500 kVA transformer, which feeds the main 480-volt power distribution bus rated at 3,000 amps. The entire 480-volt distribution system is rated at 3,000 amps, including the automatic transfer switch (ATS), and the emergency generator bus, which is fed by two (2) 750 kW Detroit Diesel generators and one (1) 600 kW caterpillar diesel generator. The speed governor on the 600 kW generator is an older unit that will not load share automatically and requires manual intervention to maintain stable operating conditions.
There is a second 13.8-kV/480-277-volt transformer, rated 1,500 kVa, which is connected to a portion of the main 480-volt bus. This transformer is normally energized, but operates unloaded.

Brick Township MUA Water Treatment Plant Energy Audit
Concord Engineering Group, Inc. 9C09064 January 19, 2010– FINAL Page 23 of 48
William Miller Jr. Water Treatment Plant Process Equipment Description
The sequence of buildings and process equipment is as follows:
1. Raw Water Pump Station – The pump station draws water from the Metedeconk River in accordance with diversion rights authorized by the NJDEP. The building contains a manual bar rack, two traveling screens and four vertical turbine water pumps. Two raw water pumps are dedicated to service the treatment plant; they are 125 hp pumps rated 5,600 gpm at 55 feet T.D.H. Two pumps are dedicated to divert water to the reservoir; they are 400 hp pumps rated 8,333 gpm at 145 feet T.D.H. The four pumps are more fully described in The Major Equipment List Appendix. Note: the wells and aeration system provide raw water to the treatment plant, but have not been included in the scope of this energy audit.
2. Pre-Treatment Building – The pretreatment building receives raw water from the raw water pump station. The process associated with the building include several chemical feed systems, rapid mixers with 10 hp motors, a flow distribution chamber, flocculation tanks, settling tanks and sludge drawoff chambers and pumps. The process equipment motors are less than 10 hp and are more fully described in The Major Equipment List Appendix.
3. Water Treatment Plant Control Building – The plant receives partially treated water from the pre-treatment settling tanks and from well water. The building contains gravity filters, a clear well, disinfection with chlorine gas facilities, the rapid mixer for the well water flow stream, laboratories, a SCADA control room and operator offices. Five large vertical turbine pumps are in the building. One backwash pump for the gravity filters is a 125 hp pump rated 5,800 gpm at 51 feet T.D.H. Two high service units can pump directly into the distribution system, fill the finished water storage tank or one of the pumps can backwash the gravity filter if the speed is reduced. The high service pumps have 250 hp motors and are rated 5,400 gpm at 155 feet T.D.H. Two transfer pumps are used to fill the finished water storage tank and are 200 hp pumps rated 5,600 gpm at 95 feet T.D.H. Two rapid mixers service aerated well water for delivery to the flocculation tanks. The pumps and mixers are more fully described in The Major Equipment List Appendix.
4. Finished Water Pump Station – The finished water pump station draws water from the finished water tank for delivery into the water distribution system. The building contains four vertical turbine pumps each with a variable frequency drive. The pumps have 200 hp motors and are rated 3,700 gpm @ 148.2 feet T.D.H. The four pumps are fully described in The Major Equipment List Appendix.
5. Generator Building and Main Campus Electric – The Generator Building controls power distribution to the main complex. Primary power is run by JCP&L to Brick transformers adjacent to the building. A power distribution center is in the building. Three standby generators are located in the building. A transfer switch controls the operation of the generators. Two generators are rated 750 kW and one generator is rated 600 kW. The

Brick Township MUA Water Treatment Plant Energy Audit
Concord Engineering Group, Inc. 9C09064 January 19, 2010– FINAL Page 24 of 48
generators are only run for standby power when JCP&L service is temporarily interrupted and test run for 3 hours each month.
HVAC Systems
With the exception of the Raw Water Pump Station gas is used to heat the buildings throughout the main complex. Two electric unit heaters are used in the Raw Water Pump Station. Heat pumps are used in some buildings and rooftop units are used in others for heating and cooling.
Exhaust System
Air is ventilated from the toilet rooms through roof exhausters. Chemical use areas for chlorine, lime, alum and other water treatment chemicals are ventilated by low power fans connected to roof exhausts and diffusers to dissipate chemical vapor concentrations. The Brick Utilities Authority uses gaseous chlorine which requires special ventilation in dose mixing areas and special surveillance is provided. Laboratory areas are provided with vapor hoods and dedicated exhaust equipment that is exhausted through roof exhausters and dissipaters.
Domestic Hot Water
Domestic hot water for the restrooms, office lounge and laboratories is provided by gas hot water heaters in each of the buildings with offices, locker rooms or visitor areas.
Lighting
Typical lighting throughout the building is almost universally fluorescent tube lay in or industrial style hanging fixtures with T-8 lamps and electronic ballasts. The use of T-8 lamps is especially true in high use areas where Brick Utilities policy is to have lights on for operational and safety reasons. Storage rooms and closets are typically lit with older style T-12 fluorescent lamps. Building exterior lighting over doors and walkways is a mixture of incandescent and compact fluorescent lamps. Parking lots and other large lit areas use light poles and energy efficient metal halide or sodium vapor luminaries.

Brick Township MUA Water Treatment Plant Energy Audit
Concord Engineering Group, Inc. 9C09064 January 19, 2010– FINAL Page 25 of 48
VI. MAJOR EQUIPMENT LIST The equipment list describes the major energy consuming equipment, which through energy conservation measures could yield substantial energy savings. The list shows the major equipment in the facility and all pertinent information utilized in energy savings calculations. An approximate age was assigned to the equipment in some cases if a manufactures date was not shown on the equipment’s nameplate. The ASHRAE service life for the equipment along with the remaining useful life is also shown in the Appendix. National studies show that by far the largest consumption of energy at water and wastewater facilities occurs from the transfer of fluids by pumping equipment. The handbook of Public Water Systems by Robert William and Gordon Culp, Van Nostrand Reinhold, 1986 presents data that pumping consumes about 80% of the electric consumption at water treatment facilities. The energy consumption by electric motor driven pumps at pumping stations is probably closer to 95% of all electric power consumed at the pumping station motor. Refer to the “Major Equipment List” Appendix for this facility.

Brick Township MUA Water Treatment Plant Energy Audit
Concord Engineering Group, Inc. 9C09064 January 19, 2010– FINAL Page 26 of 48
VII. ENERGY CONSERVATION MEASURES
ECM #1: Lighting Upgrade Description: The Water Treatment Plant process units consist of a raw water pump station, a finished water pump station, a pretreatment building, a filter building, and a generator building. The lighting in the majority of these buildings is primarily made up of fluorescent fixtures with T-8 and T-12 lamps. The raw water pump station lighting is metal halide type. This ECM includes replacement of the existing fixtures containing T12 lamps and magnetic ballasts with fixtures containing T8 lamps and electronic ballasts mainly in the generator building, filter room lower level hallway and storage rooms. The new energy efficient, T8 fixtures will provide adequate lighting and will save the owner on electrical costs due to the better performance of the lamp and ballasts. This ECM will also provide maintenance savings through the reduced number of lamps replaced per year. The expected lamp life of a T8 lamp is approximately 30,000 burn-hours, in comparison to the existing T12 lamps which is approximately 20,000 burn-hours. This ECM also includes replacement of the pump room basement level incandescent fixtures with compact fluorescent fixtures. The energy usage of an incandescent compared to a compact fluorescent is approximately 3 to 4 times greater. In addition to the energy savings, compact fluorescent fixtures burn-hours are 8 to 15 times longer than incandescent fixtures ranging from 6,000 to 15,000 burn-hours compared to incandescent fixtures ranging from 750 to 1000 burn-hours. Energy Savings Calculations: The Investment Grade Lighting Audit Appendix outlines the proposed retrofits, costs, savings, and payback periods for each of the individual buildings. NJ Smart Start® Program Incentives are calculated as follows individually for each building included in this report: From the Smart Start Incentive appendix, the replacement of a T-12 fixture to a T-8 fixture warrants the following incentive: T-8 (1-2 lamp) = $25 per fixture; T-8 (3-4 lamp) = $30 per fixture. From the Smart Start Incentive appendix, the replacement of a HID fixture (100-174 Watts) warrants the following incentive: Conversion to T8 or T5= $30 per fixture

Brick Township MUA Water Treatment Plant Energy Audit
Concord Engineering Group, Inc. 9C09064 January 19, 2010– FINAL Page 27 of 48
ECM 1A: Raw Water Pump Station
( ) 240$30$8StartSmart =×=® FixtureHIDIncentive Maintenance savings do not apply to HID Lighting replacements. Energy Savings Summary:
Installation Cost ($): $2,000
NJ Smart Start Equipment Incentive ($): $240
Net Installation Cost ($): $1,760
Maintenance Savings ($/Yr): $0
Energy Savings ($/Yr): $350
Total Yearly Savings ($/Yr): $350
Estimated ECM Lifetime (Yr): 15
Simple Payback 5.0
Simple Lifetime ROI 198.3%
Simple Lifetime Maintenance Savings $0
Simple Lifetime Savings $5,250Internal Rate of Return (IRR) 18%Net Present Value (NPV) $2,418.28
ECM #1A - ENERGY SAVINGS SUMMARY

Brick Township MUA Water Treatment Plant Energy Audit
Concord Engineering Group, Inc. 9C09064 January 19, 2010– FINAL Page 28 of 48
ECM 1B: Pre-Treatment Building
( ) 360$30$12StartSmart =×=® FixtureHIDIncentive Maintenance savings do not apply to HID Lighting replacements. Energy Savings Summary:
Installation Cost ($): $3,000
NJ Smart Start Equipment Incentive ($): $360
Net Installation Cost ($): $2,640
Maintenance Savings ($/Yr): $0
Energy Savings ($/Yr): $940
Total Yearly Savings ($/Yr): $940
Estimated ECM Lifetime (Yr): 15
Simple Payback 2.8
Simple Lifetime ROI 434.1%
Simple Lifetime Maintenance Savings $0
Simple Lifetime Savings $14,100Internal Rate of Return (IRR) 35%Net Present Value (NPV) $8,581.66
ECM #1B - ENERGY SAVINGS SUMMARY

Brick Township MUA Water Treatment Plant Energy Audit
Concord Engineering Group, Inc. 9C09064 January 19, 2010– FINAL Page 29 of 48
ECM #1C: Water Treatment Plant Control Building
( ) 390$30$13StartSmart =×=® FixtureHIDIncentive
( ) ( )20$43#10$21#StartSmart ×−+×−=® fixtureslampoffixtureslampofIncentive
( ) ( ) 350$30$025$14StartSmart =×+×=® Incentive Total Smart Start Incentive = $390 + $350 = $740 Replacement and Maintenance Savings are calculated as follows:
( )lampperLaborlampperrepacmentyearperreplacedlampsinreductionSavings $$() +×=
( ) ( ) 35$00.5$00.2$5 =+×= yearperlampsSavings Energy Savings Summary:
Installation Cost ($): $4,930
NJ Smart Start Equipment Incentive ($): $740
Net Installation Cost ($): $4,190
Maintenance Savings ($/Yr): $35
Energy Savings ($/Yr): $560
Total Yearly Savings ($/Yr): $595
Estimated ECM Lifetime (Yr): 15
Simple Payback 7.0
Simple Lifetime ROI 113.0%
Simple Lifetime Maintenance Savings $525
Simple Lifetime Savings $8,925Internal Rate of Return (IRR) 11%Net Present Value (NPV) $2,913.07
ECM #1C - ENERGY SAVINGS SUMMARY

Brick Township MUA Water Treatment Plant Energy Audit
Concord Engineering Group, Inc. 9C09064 January 19, 2010– FINAL Page 30 of 48
ECM #1D: Finished Water Pump Station
( ) 270$30$9StartSmart =×=® FixtureHIDIncentive Maintenance savings do not apply to HID Lighting replacements. Energy Savings Summary:
Installation Cost ($): $925
NJ Smart Start Equipment Incentive ($): $270
Net Installation Cost ($): $655
Maintenance Savings ($/Yr): $0
Energy Savings ($/Yr): $814
Total Yearly Savings ($/Yr): $814
Estimated ECM Lifetime (Yr): 15
Simple Payback 0.8
Simple Lifetime ROI 1764.1%
Simple Lifetime Maintenance Savings $0
Simple Lifetime Savings $12,210Internal Rate of Return (IRR) 124%Net Present Value (NPV) $9,062.48
ECM #1D - ENERGY SAVINGS SUMMARY
Brick Township MUA Water Treatment Plant Energy Audit
Concord Engineering Group, Inc. 9C09064 January 19, 2010– FINAL Page 31 of 48
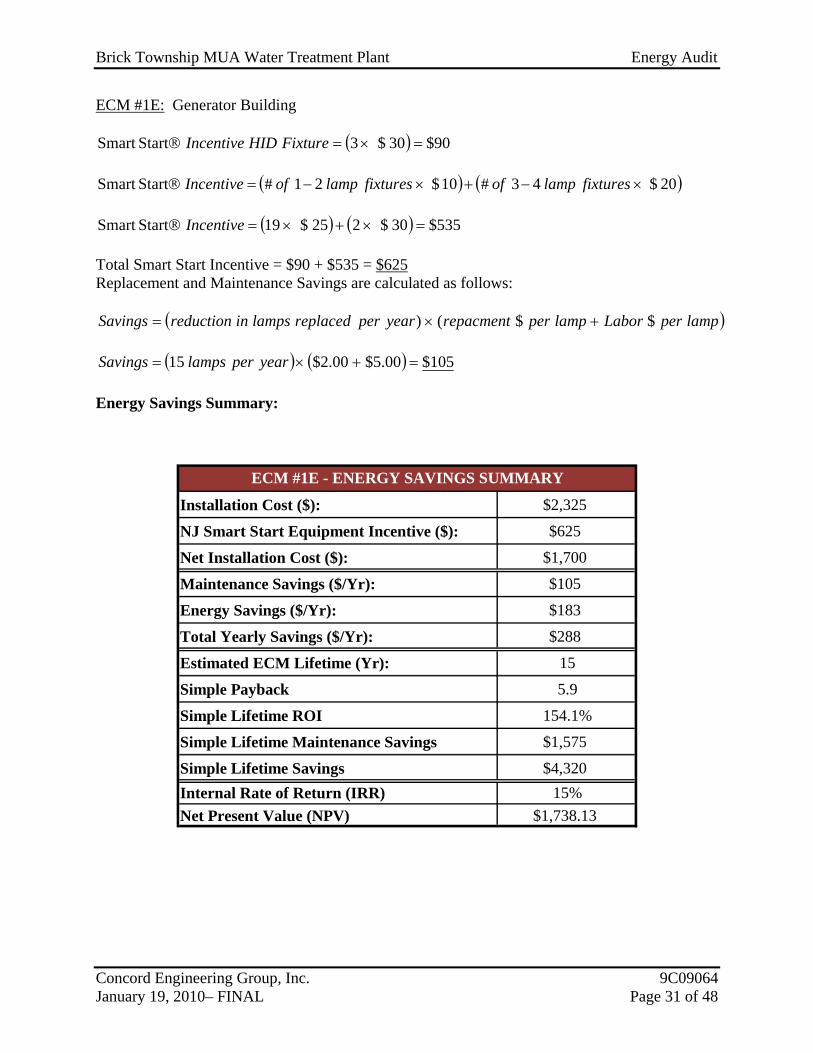
ECM #1E: Generator Building
( ) 90$30$3StartSmart =×=® FixtureHIDIncentive
( ) ( )20$43#10$21#StartSmart ×−+×−=® fixtureslampoffixtureslampofIncentive
( ) ( ) 535$30$225$19StartSmart =×+×=® Incentive Total Smart Start Incentive = $90 + $535 = $625 Replacement and Maintenance Savings are calculated as follows:
( )lampperLaborlampperrepacmentyearperreplacedlampsinreductionSavings $$() +×=
( ) ( ) 105$00.5$00.2$15 =+×= yearperlampsSavings Energy Savings Summary:
Installation Cost ($): $2,325
NJ Smart Start Equipment Incentive ($): $625
Net Installation Cost ($): $1,700
Maintenance Savings ($/Yr): $105
Energy Savings ($/Yr): $183
Total Yearly Savings ($/Yr): $288
Estimated ECM Lifetime (Yr): 15
Simple Payback 5.9
Simple Lifetime ROI 154.1%
Simple Lifetime Maintenance Savings $1,575
Simple Lifetime Savings $4,320Internal Rate of Return (IRR) 15%Net Present Value (NPV) $1,738.13
ECM #1E - ENERGY SAVINGS SUMMARY
Brick Township MUA Water Treatment Plant Energy Audit
Concord Engineering Group, Inc. 9C09064 January 19, 2010– FINAL Page 32 of 48
ECM #2: Lighting Controls Description: Authority safety policy requires most lights be on whether the building is occupied or not; however, in some areas the lighting may be left on unnecessarily. In some cases the lights are left on because of the inconvenience to manually switch lights off when a room is left or on when an equipment area at a lower level is first occupied. This is possible in lower floor rooms that are occupied for only short periods and only a few times per day. In some instances lights are left on due to the misconception that it is better to keep the lights on rather than continuously switching the lights on and off. Although increased switching reduces lamp life, the energy savings outweigh the lamp replacement costs. The payback timeframe for when to turn the lights off is approximately 2 minutes. If the lights are off for a least a two minute interval, then it pays to shut them off. Lighting controls come in many forms. Sometimes an additional switch is adequate to provide reduced lighting levels when full light output is not needed. Occupancy sensors detect motion and will switch the lights on when the room is occupied. Occupancy sensors can either be mounted in place of a current wall switch, or on the ceiling to cover large areas. Photocell control senses light levels and turn off or reduce lights when there is adequate daylight. Photocells are mostly used outside, but are becoming more popular in energy-efficient interior lighting designs as well. ASHRAE Standard 90.1-2004, Appendix G is a reference standard for modeling building efficiency. The standard estimates that lighting controls provide a 10% reduction in lighting power usage for daytime occupancies in buildings over 5,000 SF, and 15% reduction in buildings under 5,000 SF. This ECM includes occupancy sensors in the raw water pump station, generator building, the finished water pump station, the pretreatment building and the filter building as well as a dual technology motion and photocell daylight sensor controlling the exterior lighting. The ECM includes replacement of standard wall switches with sensor wall switches for individual areas and photocell sensors for the exterior lighting. Sensors shall be manufactured by Sensorswitch, Watt Stopper or equivalent. See the “Investment Grade Lighting Audit” appendix for details. The “Investment Grade Lighting Audit” appendix of this report includes the summary of lighting controls implemented in this ECM and outlines the proposed controls, costs, savings, and payback periods. The calculations adjust the lighting power usage by 10% for all areas that include occupancy sensor lighting controls and 20% for areas that include photocell daylight sensors. Refer to the Detailed Lighting Control Audit Appendix for a detailed listing of sensor locations and energy saving calculations.

Brick Township MUA Water Treatment Plant Energy Audit
Concord Engineering Group, Inc. 9C09064 January 19, 2010– FINAL Page 33 of 48
Energy Savings Calculations: Energy Savings = 10% x Electric Usage (kWh) x Electric Cost ($/kWh) Installation cost per occupancy sensor (Basis: Sensorswitch or equivalent) is $160/unit including material and labor. Installation cost per daylight sensor with dual motion sensor technology is $238/unit From the NJ Smart Start appendix, the installation of a lighting control device warrants the following incentive: occupancy = $20 per fixture, daylight = $25 per fixture. Smart Start® Incentive = (# of wall mount devices x $20) Smart Start® Incentive = (# of day light devices x $25) ECM #2A: Raw Water Pump Station Smart Start® Incentive = (# of wall mount devices x $20) = (2 x $20) = $40 Energy Savings Summary:
Installation Cost ($): $570
NJ Smart Start Equipment Incentive ($): $40
Net Installation Cost ($): $530
Maintenance Savings ($/Yr): $0
Energy Savings ($/Yr): $125
Total Yearly Savings ($/Yr): $125
Estimated ECM Lifetime (Yr): 15
Simple Payback 4.2
Simple Lifetime ROI 253.8%
Simple Lifetime Maintenance Savings $0
Simple Lifetime Savings $1,875Internal Rate of Return (IRR) 22%Net Present Value (NPV) $962.24
ECM #2A - ENERGY SAVINGS SUMMARY
*ECM#2 Calculations DO NOT include lighting changes implemented in ECM #1. If ECM #1 and #2 are implemented together the savings will be relatively lower than shown above.

Brick Township MUA Water Treatment Plant Energy Audit
Concord Engineering Group, Inc. 9C09064 January 19, 2010– FINAL Page 34 of 48
ECM #2B: Pre-Treatment Building Smart Start® Incentive = (# of wall mount devices x $20) = (2 x $20) = $60 Energy Savings Summary:
Installation Cost ($): $480
NJ Smart Start Equipment Incentive ($): $60
Net Installation Cost ($): $420
Maintenance Savings ($/Yr): $0
Energy Savings ($/Yr): $277
Total Yearly Savings ($/Yr): $277
Estimated ECM Lifetime (Yr): 15
Simple Payback 1.5
Simple Lifetime ROI 889.3%
Simple Lifetime Maintenance Savings $0
Simple Lifetime Savings $4,155Internal Rate of Return (IRR) 66%Net Present Value (NPV) $2,886.81
ECM #2B - ENERGY SAVINGS SUMMARY
*ECM#2 Calculations DO NOT include lighting changes implemented in ECM #1. If ECM #1 and #2 are implemented together the savings will be relatively lower than shown above.

Brick Township MUA Water Treatment Plant Energy Audit
Concord Engineering Group, Inc. 9C09064 January 19, 2010– FINAL Page 35 of 48
ECM #2C: Water Treatment Plant Control Building Smart Start® Incentive = (# of wall mount devices x $20) = (16 x $20) = $320 Energy Savings Summary:
Installation Cost ($): $2,560
NJ Smart Start Equipment Incentive ($): $320
Net Installation Cost ($): $2,240
Maintenance Savings ($/Yr): $0
Energy Savings ($/Yr): $626
Total Yearly Savings ($/Yr): $626
Estimated ECM Lifetime (Yr): 15
Simple Payback 3.6
Simple Lifetime ROI 319.2%
Simple Lifetime Maintenance Savings $0
Simple Lifetime Savings $9,390Internal Rate of Return (IRR) 27%Net Present Value (NPV) $5,233.15
ECM #2C - ENERGY SAVINGS SUMMARY
*ECM#2 Calculations DO NOT include lighting changes implemented in ECM #1. If ECM #1 and #2 are implemented together the savings will be relatively lower than shown above.

Brick Township MUA Water Treatment Plant Energy Audit
Concord Engineering Group, Inc. 9C09064 January 19, 2010– FINAL Page 36 of 48
ECM #2D: Finished Water Pump Station Smart Start® Incentive = (# of wall mount devices x $20) = (1 x $20) = $20 Energy Savings Summary:
Installation Cost ($): $570
NJ Smart Start Equipment Incentive ($): $20
Net Installation Cost ($): $550
Maintenance Savings ($/Yr): $0
Energy Savings ($/Yr): $247
Total Yearly Savings ($/Yr): $247
Estimated ECM Lifetime (Yr): 15
Simple Payback 2.2
Simple Lifetime ROI 573.6%
Simple Lifetime Maintenance Savings $0
Simple Lifetime Savings $3,705Internal Rate of Return (IRR) 45%Net Present Value (NPV) $2,398.67
ECM #2D - ENERGY SAVINGS SUMMARY
*ECM#2 Calculations DO NOT include lighting changes implemented in ECM #1. If ECM #1 and #2 are implemented together the savings will be relatively lower than shown above.

Brick Township MUA Water Treatment Plant Energy Audit
Concord Engineering Group, Inc. 9C09064 January 19, 2010– FINAL Page 37 of 48
ECM #2E: Generator Building Smart Start® Incentive = (# of wall mount devices x $20) = (2 x $20) = $40 Energy Savings Summary:
Installation Cost ($): $1,050
NJ Smart Start Equipment Incentive ($): $120
Net Installation Cost ($): $930
Maintenance Savings ($/Yr): $0
Energy Savings ($/Yr): $104
Total Yearly Savings ($/Yr): $104
Estimated ECM Lifetime (Yr): 15
Simple Payback 8.9
Simple Lifetime ROI 67.7%
Simple Lifetime Maintenance Savings $0
Simple Lifetime Savings $1,560Internal Rate of Return (IRR) 7%Net Present Value (NPV) $311.55
ECM #2E - ENERGY SAVINGS SUMMARY
*ECM#2 Calculations DO NOT include lighting changes implemented in ECM #1. If ECM #1 and #2 are implemented together the savings will be relatively lower than shown above.

Brick Township MUA Water Treatment Plant Energy Audit
Concord Engineering Group, Inc. 9C09064 January 19, 2010– FINAL Page 38 of 48
ECM #3: Pump and Motor System Upgrade Description: The process equipment covered by this energy audit includes the following buildings: - Raw Water Pump Station; - Pretreatment Building; - Treatment Plant/Control Building; - Finished Water Pump Station - Generator Building
• Raw Water Pump Station
The pump station has two raw water pumps, 125 hp, rated at 5,600 gpm at 55 feet TDH each. The raw water pumps are used to convey water from an intake on the Metedeconk River to the treatment plant. The raw water pumps are Peerless Pumps with GE motors. These pumps are approximately seventeen (17) years old. The pumps are equipped with 125 hp Benshaw VFDs. The pump station also has two 250 hp pumps rated at 8,333 gpm at 145 feet TDH each which are used to divert water to the reservoir. The reservoir pumps are Peerless Pumps with motors made by US Electric Motors. These pumps are approximately 17 years old. The pumps are equipped with 400 hp Benshaw VFDs.
ECM #3A evaluated replacing the existing motors, pumps, and VFDs with new premium motors and high efficiency pumps. The kWh savings fell below the Smart Start® Incentive threshold of 25,000 kWh for both the 125 hp pumps and the 400 hp pumps; therefore, the analysis did not proceed further. The Major Equipment List Appendix provides the potential kWh annual dollar savings and retro-unit costs. This study noted that the energy to the pump-storage reservoir is not currently recovered when the stored water is returned to the plant. An electric turbine has the potential to recover 113 hp when 10 mgd is returned to the plant with as much as 65 feet of elevation head.
• Pretreatment Building
The process equipment associated with the building include several chemical feed systems, rapid mixers with 10 hp motors, a flow distribution chamber, flocculation tanks, settling tanks and sludge drawoff chambers and pumps. The process equipment motors are less than 10 hp and are considered deminimis.
Brick Township MUA Water Treatment Plant Energy Audit
Concord Engineering Group, Inc. 9C09064 January 19, 2010– FINAL Page 39 of 48
Replacing the two rapid mixer propellers with high efficiency propellers was evaluated after the field survey was conducted. The rapid mixers fall below the 25 hp motor threshold for eligibility in the Smart Start® Incentive Program; therefore the analysis did not proceed further. This study suggests that replacement units purchased at the end of the service life of the existing equipment consider high efficiency motor and propellers.
• Water Treatment Plant/Control Building
This building contains five large Peerless Pumps with GE Motors. A single backwash pump has a 125 hp motor, two 200 hp transfer pumps and two 250 hp high service pumps are located in a lower level pump gallery. The back wash pump and the two transfer pumps are equipped with VFDs. The backwash and high service pumps are approximately 36 years old. High service pump #4 also serves as a backup to the backwash pump. The transfer pumps are approximately 18 years old. ECM #3C evaluated replacing the existing motors, pumps, and VFDs with new premium motors and high efficiency pumps. The kWh savings fell below the Smart Start® Incentive threshold of 25,000 kWh for all 5 pumps. The Major Equipment List Appendix provides the potential kWh annual dollar savings and retro-unit costs.
• Finished Water Pump Station
This building contains four (4) vertical Peerless Turbine Pumps with 200 hp GE Motors. All the motors have VFDs. The pumps are 36 years old. ECM #3D evaluated replacing the four existing motors, pumps, and VFDs with new premium motors and high efficiency pumps. The kWh savings and horsepower minimums are above the Smart Start® Incentive threshold for the four 200 hp pumps. The Major Equipment List Appendix provides the potential kWh annual dollar savings and retro-unit costs. NJ Smart® program incentives are calculated as follows: From this Smart Start® Incentive appendix, the use of variable frequency drives for the new pumps greater than 200 hp and premium motors over 25 hp warrants an incentive of $0.16 per kWh saved provided at least 25,000 kWh are saved each year. Smart Start® Incentive = 150,712 x $0.16 = $24,113.92
• Generator Building
No pump or motor systems upgrades apply to this building at the current time.

Brick Township MUA Water Treatment Plant Energy Audit
Concord Engineering Group, Inc. 9C09064 January 19, 2010– FINAL Page 40 of 48
Operations and maintenance savings are estimated to be negligible for all pump and motor savings ECM’s. Energy Savings Summary: ECM #3A: Raw Water Pump Station
Installation Cost ($): $598,400
NJ Smart Start Equipment Incentive ($): $0
Net Installation Cost ($): $598,400
Maintenance Savings ($/Yr): $0
Energy Savings ($/Yr): $1,663
Total Yearly Savings ($/Yr): $1,663
Estimated ECM Lifetime (Yr): 20
Simple Payback 359.8
Simple Lifetime ROI -94.4%
Simple Lifetime Maintenance Savings $0
Simple Lifetime Savings $33,260Internal Rate of Return (IRR) -19%Net Present Value (NPV) ($573,658.76)
ECM #3A - ENERGY SAVINGS SUMMARY
Note: ECM#3A Calculations are based upon a pumping system replacement with premium efficient motor, pumps and VFDs. The existing pumps, motors and VFDs are approximately 17 years old and have been conscientiously maintained. The analysis presumed 32% of their service life remains. Differential cost is used in this analysis to better account for the regular and necessary replacement of the equipment. This cost represents the difference in cost of a high efficiency replacement and a like kind replacement. The actual replacement cost estimate can be found in the Major Equipment List Appendix under the “Unit Installed Cost” heading.

Brick Township MUA Water Treatment Plant Energy Audit
Concord Engineering Group, Inc. 9C09064 January 19, 2010– FINAL Page 41 of 48
ECM #3C: Water Treatment Plant / Control Building.
Installation Cost ($): $521,000
NJ Smart Start Equipment Incentive ($): $0
Net Installation Cost ($): $521,000
Maintenance Savings ($/Yr): $0
Energy Savings ($/Yr): $4,057
Total Yearly Savings ($/Yr): $4,057
Estimated ECM Lifetime (Yr): 20
Simple Payback 128.4
Simple Lifetime ROI -84.4%
Simple Lifetime Maintenance Savings $0
Simple Lifetime Savings $81,140Internal Rate of Return (IRR) #DIV/0!Net Present Value (NPV) ($460,642.08)
ECM #3C - ENERGY SAVINGS SUMMARY
Note: ECM#3C Calculations are based upon a pumping system replacement with premium efficient motor, pumps and VFDs. The existing pumps, motors and VFDs are approximately 18 - 36 years old and have been conscientiously maintained. The analysis presumed 20% - 32% of their service life remains. Differential cost is used in this analysis to better account for the regular and necessary replacement of the equipment. This cost represents the difference in cost of a high efficiency replacement and a like kind replacement. The actual replacement cost estimate can be found in the Major Equipment List Appendix under the “Unit Installed Cost” heading.

Brick Township MUA Water Treatment Plant Energy Audit
Concord Engineering Group, Inc. 9C09064 January 19, 2010– FINAL Page 42 of 48
ECM #3D: Finished Water Pump Station
Installation Cost ($): $180,000
NJ Smart Start Equipment Incentive ($): $24,113
Net Installation Cost ($): $155,887
Maintenance Savings ($/Yr): $0
Energy Savings ($/Yr): $21,401
Total Yearly Savings ($/Yr): $21,401
Estimated ECM Lifetime (Yr): 20
Simple Payback 7.3
Simple Lifetime ROI 174.6%
Simple Lifetime Maintenance Savings $0
Simple Lifetime Savings $428,020Internal Rate of Return (IRR) 12%Net Present Value (NPV) $162,505.84
ECM #3D - ENERGY SAVINGS SUMMARY
Note: ECM#3D Calculations are based upon a pumping system replacement with premium efficient motor, pumps and VFDs. The existing pumps, motors and VFDs are approximately 36 years old and have been conscientiously maintained. The analysis presumed 10% of their service life remains. Differential cost is used in this analysis to better account for the regular and necessary replacement of the equipment. This cost represents the difference in cost of a high efficiency replacement and a like kind replacement. The actual replacement cost estimate can be found in the Major Equipment List Appendix under the “Unit Installed Cost” heading.
Brick Township MUA Water Treatment Plant Energy Audit
Concord Engineering Group, Inc. 9C09064 January 19, 2010– FINAL Page 43 of 48
VIII. RENEWABLE/DISTRIBUTED ENERGY MEASURES Globally, renewable energy has become a priority affecting international and domestic energy policy. The State of New Jersey has taken a proactive approach, and has recently adopted in its Energy Master Plan a goal of 30% renewable energy by 2020. To help reach this goal New Jersey created the Office of Clean Energy under the direction of the Board of Public Utilities and instituted a Renewable Energy Incentive Program to provide additional funding to private and public entities for installing qualified renewable technologies. A renewable energy source can greatly reduce a building’s operation expenses while producing clean environmentally friendly energy. CEG has assessed the feasibility of installing renewable energy technologies for Brick Township MUA. Solar energy produces clean energy and reduces a building’s carbon footprint. This is accomplished via photovoltaic panels which will be mounted on all south and southwestern facades of the building. Flat roof, as well as sloped areas can be utilized; flat areas will have the panels turned to an optimum solar absorbing angle. The State of NJ has instituted a program in which one Solar Renewable Energy Certificate (SREC) is given to the Owner for every 1000 kWh of generation. SREC’s can be sold anytime on the market at their current market value. The value of the credit varies upon the current need of the power companies. The average value per credit is around $350, this value was used in our financial calculations. This equates to $0.35 per kWh generated. CEG has reviewed the available area at the Brick Township MUA Water Treatment Plant and has concluded that there is not an application for solar energy at this facility due to the lack of adequate area to locate PV panels. In addition to the solar PV screening, CEG has also reviewed the applicability of wind energy. Wind energy production is another option available through the Renewable Energy Incentive Program. Wind turbines of various types can be utilized to produce clean energy on a per building basis. Cash incentives are available per kWh of electric usage. Based on CEG’s review of the applicability of wind energy for the facility, it was determined that the average wind speed is not adequate. Therefore, wind energy is not a viable option to implement.

Brick Township MUA Water Treatment Plant Energy Audit
Concord Engineering Group, Inc. 9C09064 January 19, 2010– FINAL Page 44 of 48
IX. ENERGY PURCHASING AND PROCUREMENT STRATEGY Load Profile: Load Profile analysis was performed to determine the seasonal energy usage of the facility. Irregularities in the load profile will indicate potential problems within the facility. Consequently based on the profile a recommendation will be made to remedy the irregularity in energy usage. For this report, the facility’s energy consumption data was gathered in table format and plotted in graph form to create the load profile, refer to The Electric Usage Profiles included within this report to reference the respective electricity usage load profiles. Electricity The Electric Usage Profile demonstrates a fairly consistent load. In 2008 the demand reached a minimum in November. Maximum usage occurred during the warm and typically dryer months of May-August. The maximum demand was approximately 34% more than the average and the minimum demand was approximately 37% lower than the average demand. Natural Gas The natural gas usage demonstrates a very typical heat load profile. The summer months, May through September, demonstrate very low consumption. There is an increase in consumption from January to May and again from October to December. Tariff Analysis: Electricity: The Authority receives primary power through one master meter and distributes power on a plant grid to all main campus buildings, process equipment and site lighting without the benefit of electric meters to individual end uses. The Authority contracts for supply from Con Edison Solutions of White Plains, NY. The Con Edison billing is based upon usage of kWh only. The Authority contracts for delivery from Jersey Central Power and Light (JCP&L). The JCP&L delivery rate schedule used is the General Service Primary – JC_GP_01D. The delivery rate includes supply availability charges, kvar delivery charge, societal benefits charges, and delivery service charges. The total monthly billings are divided approximately 2/3 Con Edison Solutions and 1/3 JCP&L. Recommendations: CEG recommends a global approach that will be consistent with all facilities within the BTMUA service area. The primary area for improvement is seen in the electric supply costs. The Authority has contracted with Con Edison Solutions of White Plains, NY to receive favorable supply versus supply by JCP&L. The average price per kWh (kilowatt hour) for the main

Brick Township MUA Water Treatment Plant Energy Audit
Concord Engineering Group, Inc. 9C09064 January 19, 2010– FINAL Page 45 of 48
campus based on 1-year historical average price is $0.1454/kWh whereas the comparable JCP&L cost at the pumping stations is $0.1596 kWh to a high of $0.1639 kWh. Energy commodities are among the most volatile of all commodities, however at this point and time, energy is extremely competitive. The BTMUA could see improvement in its energy costs if it were to take advantage of these current market prices quickly, before they increase. Based on annual historical consumption (February 2008 through January 2009) and current electric rates, the BTMUA could see an improvement in its electric costs of up to 10% annually. (Note: Savings were calculated using Average Annual Consumption and a variance to a Fixed Average One-Year commodity contract). CEG recommends aggregating the entire BTMUA electric load to gain the most optimal energy costs. CEG recommends advisement for alternative sourcing and supply of energy on a “managed approach”. CEG also recommends that the Authority schedule a meeting with the current utility providers to review their utility charges and current tariff structures for electricity. This meeting would provide insight regarding alternative procurement options that are currently available. Through its meeting with the Local Distribution Company (LDC), the BTMUA can learn more about the competitive supply process. BTMUA can acquire a list of additional approved Third Party Suppliers from the New Jersey Board of Public Utilities website at www.nj.gov/pbu. BTMUA should consider using a billing-auditing service to further analyze the utility invoices, manage the data and use the information for ongoing demand-side management projects. Furthermore, special attention should be given to credit mechanisms, imbalances, balancing charges and commodity charges when meeting with the utility representative. The Township should ask the utility representative about alternative billing options, such as consolidated billing when utilizing the service of a Third Party Supplier.

Brick Township MUA Water Treatment Plant Energy Audit
Concord Engineering Group, Inc. 9C09064 January 19, 2010– FINAL Page 46 of 48
X. INSTALLATION FUNDING OPTIONS CEG has reviewed various funding options for the facility owner to utilize in subsidizing the costs for installing the energy conservation measures noted within this report. Below are a few alternative funding methods:
i. Energy Savings Improvement Program (ESIP) – Public Law 2009, Chapter 4
authorizes government entities to make energy related improvements to their facilities and par for the costs using the value of energy savings that result from the improvements. The “Energy Savings Improvement Program (ESIP)” law provides a flexible approach that can allow all government agencies in New Jersey to improve and reduce energy usage with minimal expenditure of new financial resources.
ii. Municipal Bonds – Municipal bonds are a bond issued by a city or other local
government, or their agencies. Potential issuers of municipal bonds include cities, counties, redevelopment agencies, school districts, publicly owned airports and seaports, and any other governmental entity (or group of governments) below the state level. Municipal bonds may be general obligations of the issuer or secured by specified revenues. Interest income received by holders of municipal bonds is often exempt from the federal income tax and from the income tax of the state in which they are issued, although municipal bonds issued for certain purposes may not be tax exempt.
iii. Power Purchase Agreement – Public Law 2008, Chapter 3 authorizes contractor
up to fifteen (15) years for contracts commonly known as “power purchase agreements.” These are programs where the contracting unit (Owner) procures a contract for, in most cases, a third party to install, maintain, and own a renewable energy system. These renewable energy systems are typically solar panels, windmills or other systems that create renewable energy. In exchange for the third party’s work of installing, maintaining and owning the renewable energy system, the contracting unit (Owner) agrees to purchase the power generated by the renewable energy system from the third party at agreed upon energy rates.
iv. New Jersey Environmental Infrastructure Trust – The New Jersey
Environmental Infrastructure Trust (NJEIT) works in conjunction with the New Jersey Department of Environmental Protection (NJDEP) to identify “clean water” projects and to establish an annual “priority list” for the disbursement of low interest and no interest 20 year loans. The NJEIT also administers the American Recovery and Reinvestment Act of 2009 (ARRA or “Stimulus Program”). Project funded in FY 2009 are eligible for a 25% market rate loan (currently 4.0-4.5%) and a 75% 0% interest rate loan. Project receiving a high priority are also eligible for a 50% loan forgiveness up to $5 million. Competition for the 50% forgiveness is severe; however, a 75/25 loan is a very attractive means for financing a project with an effective interest rate of only

Brick Township MUA Water Treatment Plant Energy Audit
Concord Engineering Group, Inc. 9C09064 January 19, 2010– FINAL Page 47 of 48
slightly more than 1%. Also renewable energy projects are given favorable consideration and often receive funding set asides.
CEG recommends the Owner review the use of the above-listed funding options in addition to utilizing their standard method of financing for facilities upgrades in order to fund the proposed energy conservation measures.

Brick Township MUA Water Treatment Plant Energy Audit
Concord Engineering Group, Inc. 9C09064 January 19, 2010– FINAL Page 48 of 48
XI. ADDITIONAL RECOMMENDATIONS The following recommendations include no cost/low cost measures, Operation & Maintenance (O&M) items, and water conservation measures with attractive paybacks. These measures are not eligible for the Smart Start Buildings incentives from the office of Clean Energy but save energy none the less.
F. Maintain all weather stripping on windows and doors.
G. Clean all light fixtures to maximize light output.
H. Provide more frequent air filter changes to decrease overall system power usage and maintain better IAQ.
I. Several of the larger pumps at the WTP (125 hp and up) do not qualify for Smart Start® Incentives due to annual kWh savings falling below the incentives’ threshold of 25,000 kWh. Several of the pump and motor combinations have exceeded normal service lives due to the aggressive maintenance program adhered to by Authority staff. When the pumps are eventually replaced the energy savings shown on the major equipment appendix can be realized.
J. The four rapid mixers do not qualify for Smart Start® Incentives due to the small horsepower motors below the incentives’ threshold of 25 hp. Philadelphia and Lighting Mixers currently available incorporate mixing propellers that require less energy to achieve the same mixing. When the mixers are eventually replaced a small energy savings can be realized.
F. The Authority may want to study the feasibility of installing a water turbine on the waterline from the reservoir to the WTP. A flow of 10 mgd and a positional head of 65 feet indicate a potential for a 110 hp turbine. A Flowserve brand TKW type water turbine can operate within the range of BTMUA flows from the reservoir.
G. Retro-commissioning - In addition to the recommendations above, expanding Retro-
Commissioning to include all of the older larger pumps and motors would be beneficial for this facility. Retro-Commissioning is a means to verify your current equipment is operating at its designed mechanical efficiency range, hydraulic flow capacity, designed motor efficiency and overall performance. Retro-Commissioning provides valuable insight into systems or components not performing correctly or efficiently. The commissioning process defines the original system design parameters and recommends revisions to the current system operating characteristics.

APP
END
IX A
1 of
1
LIF
ET
IME
EN
ER
GY
SA
VIN
GS
LIF
ET
IME
M
AIN
TE
NA
NC
E
SAV
ING
SL
IFE
TIM
E R
OI
SIM
PLE
PA
YB
AC
KIN
TE
RN
AL
RA
TE
O
F R
ET
UR
N
(IR
R)
NE
T P
RE
SEN
T V
AL
UE
(N
PV)
MA
TE
RIA
LL
AB
OR
RE
BA
TE
S,
INC
EN
TIV
ES
NE
T
INST
AL
LA
TIO
N
CO
STE
NE
RG
YM
AIN
T. /
SR
EC
TO
TA
L(Y
earl
y Sa
ving
* E
CM
Life
time)
(Yea
rly
Mai
nt S
avin
g *
EC
M
Life
time)
(Life
time
Savi
ngs -
Net
Cos
t) /
(Net
Cos
t)(N
et c
ost /
Yea
rly
Savi
ngs)
($)
($)
($)
($)
($/Y
r)($
/Yr)
($/Y
r)(Y
r)($
)($
)(%
)(Y
r)($
)($
)
ECM
#1A
Ligh
ting
Upg
rade
$1,3
30$6
70$2
40$1
,760
$350
$0$3
5015
$5,2
50$0
198.
3%5.
018
.28%
$2,4
18.2
8
ECM
#2A
Ligh
ting
Con
trols
$380
$190
$40
$530
$125
$0$1
2515
$1,8
75$0
253.
8%4.
2$9
62.2
4$0
.00
ECM
#3A
Pum
p an
d M
otor
Sys
tem
Upg
rade
$299
,200
$299
,200
$0$5
98,4
00$1
,663
$0$1
,663
20$3
3,26
0$0
-94.
4%35
9.8
0.00
%$0
.00
Raw
Wat
er P
ump
Stat
ion
EC
M C
OST
& S
AV
ING
S B
RE
AK
DO
WN
CO
NC
OR
D E
NG
INEE
RIN
G G
RO
UP
Bri
ck T
owns
hip
Mun
icip
al U
tility
Aut
hori
ty
INST
AL
LA
TIO
N C
OST
YE
AR
LY
SA
VIN
GS
EC
M
LIF
ET
IME
DE
SCR
IPT
ION
EC
M N
O.
EC
M E
NE
RG
Y A
ND
FIN
AN
CIA
L C
OST
S A
ND
SA
VIN
GS
SUM
MA
RY
ECM
#1B
Ligh
ting
Upg
rade
$2,0
00$1
,000
$360
$2,6
40$9
40$0
$940
15$1
4,10
0$0
434.
1%2.
80.
00%
$0.0
0
ECM
#2B
Ligh
ting
Con
trols
$320
$160
$60
$420
$277
$0$2
7715
$4,1
55$0
889.
3%1.
50.
00%
$0.0
0
ECM
#1C
Ligh
ting
Upg
rade
$3,2
90$1
,640
$740
$4,1
90$5
60$3
5$5
9515
$8,9
25$5
2511
3.0%
7.0
0.00
%$0
.00
ECM
#2C
Ligh
ting
Con
trols
$1,7
10$8
50$3
20$2
,240
$626
$0$6
2615
$9,3
90$0
319.
2%3.
60.
00%
$0.0
0
ECM
#3C
Pum
p an
d M
otor
Sys
tem
Upg
rade
$260
,500
$260
,500
$0$5
21,0
00$4
,057
$0$4
,057
20$8
1,14
0$0
-84.
4%12
8.4
0.00
%$0
.00
ECM
#1D
Ligh
ting
Upg
rade
$620
$305
$270
$655
$814
$0$8
1415
$12,
210
$017
64.1
%0.
812
4.27
%$9
,062
.48
ECM
#2D
Ligh
ting
Con
trols
$380
$190
$20
$550
$247
$0$2
4715
$3,7
05$0
573.
6%2.
244
.73%
$2,3
98.6
7
ECM
#3D
Pum
p an
d M
otor
Sys
tem
Upg
rade
$90,
000
$90,
000
$24,
113
$155
,887
$21,
401
$0$2
1,40
120
$428
,020
$017
4.6%
7.3
12.4
0%$1
62,5
05.8
4
ECM
#1E
Ligh
ting
Upg
rade
$1,5
50$7
75$6
25$1
,700
$183
$105
$288
15$4
,320
$1,5
7515
4.1%
5.9
14.8
1%$1
,738
.13
Pre-
Tre
atm
ent B
uild
ing
Wat
er T
reat
men
t Pla
nt C
ontr
ol B
uild
ing
Fini
shed
Wat
er P
ump
Stat
ion
Gen
erat
or B
uild
ing
ECM
#2E
Ligh
ting
Con
trols
$700
$350
$120
$930
$104
$0$1
0415
$1,5
60$0
67.7
%8.
97.
29%
$311
.55
Not
es:
1) T
he v
aria
ble
Cn
in th
e fo
rmul
as fo
r Int
erna
l Rat
e of
Ret
urn
and
Net
Pre
sent
Val
ue st
ands
for t
he c
ash
flow
dur
ing
each
per
iod.
2) T
he v
aria
ble
DR
in th
e N
PV e
quat
ion
stan
ds fo
r Dis
coun
t Rat
e3)
For
NPV
and
IRR
cal
cula
tions
: Fro
m n
=0 to
N p
erio
ds w
here
N is
the l
ifetim
e of
EC
M a
nd C
n is
the
cash
flow
dur
ing
each
per
iod
.

Appendix B Page 1 of 2
Concord Engineering Group, Inc. 520 BURNT MILL ROAD VOORHEES, NEW JERSEY 08043 PHONE: (856) 427-0200 FAX: (856) 427-6508
SmartStart Building Incentives The NJ SmartStart Buildings Program offers financial incentives on a wide variety of building system equipment. The incentives were developed to help offset the initial cost of energy-efficient equipment. The following tables show the current available incentives as of January, 2009:
Electric Chillers Water-Cooled Chillers $12 - $170 per ton
Air-Cooled Chillers $8 - $52 per ton
Gas Cooling Gas Absorption Chillers $185 - $400 per ton
Gas Engine-Driven Chillers
Calculated through custom measure path)
Desiccant Systems
$1.00 per cfm – gas or electric
Electric Unitary HVAC Unitary AC and Split
Systems $73 - $93 per ton
Air-to-Air Heat Pumps $73 - $92 per ton Water-Source Heat Pumps $81 per ton Packaged Terminal AC &
HP $65 per ton
Central DX AC Systems $40- $72 per ton Dual Enthalpy Economizer
Controls $250
Ground Source Heat Pumps
Closed Loop & Open Loop $370 per ton
Gas Heating
Gas Fired Boilers < 300 MBH $300 per unit
Gas Fired Boilers ≥ 300 - 1500 MBH $1.75 per MBH
Gas Fired Boilers ≥1500 - ≤ 4000 MBH $1.00 per MBH
Gas Fired Boilers > 4000 MBH
(Calculated through Custom Measure Path)
Gas Furnaces $300 - $400 per unit

Appendix B Page 2 of 2
Variable Frequency Drives
Variable Air Volume $65 - $155 per hp Chilled-Water Pumps $60 per hp
Compressors $5,250 to $12,500 per drive
Natural Gas Water Heating
Gas Water Heaters ≤ 50 gallons $50 per unit
Gas-Fired Water Heaters >50 gallons $1.00 - $2.00 per MBH
Gas-Fired Booster Water Heaters $17 - $35 per MBH
Premium Motors
Three-Phase Motors $45 - $700 per motor
Prescriptive Lighting T-5 and T-8 Lamps
w/Electronic Ballast in Existing Facilities
$10 - $30 per fixture, (depending on quantity)
Hard-Wired Compact Fluorescent $25 - $30 per fixture
Metal Halide w/Pulse Start $25 per fixture LED Exit Signs $10 - $20 per fixture
T-5 and T-8 High Bay Fixtures $16 - $284 per fixture
Lighting Controls – Occupancy Sensors
Wall Mounted $20 per control Remote Mounted $35 per control Daylight Dimmers $25 per fixture
Occupancy Controlled hi-low Fluorescent Controls $25 per fixture controlled
Lighting Controls – HID or Fluorescent Hi-Bay Controls
Occupancy hi-low $75 per fixture controlled Daylight Dimming $75 per fixture controlled
Other Equipment Incentives
Performance Lighting
$1.00 per watt per SF below program incentive threshold, currently 5%
more energy efficient than ASHRAE 90.1-2004 for New Construction and Complete Renovation
Custom Electric and Gas Equipment Incentives not prescriptive

Appendix C Page 1 of 1
Portfolio Manager “Statement of Energy Performance” Not applicable at this time. A Portfolio Manager for wastewater pumping stations has not been developed at the time of this audit’s preparation.

App
endi
x D
1 of
5
Raw
Wat
er P
ump
#1 P
lant
Raw
Wat
er P
ump
Stat
ion
Gen
eral
Ele
ctric
460v
, 134
a,
3ph,
SF
1.15
5KA
F445
STB
001M
PH61
2402
212
51,
785
8217
82,
382
Rep
lace
old
er
syst
em w
ith n
ew H
E sy
stem
125
$225
,000
0.32
$72,
000
2,70
2$3
84
Raw
Wat
er P
ump
# 2
Plan
tR
aw W
ater
Pum
p St
atio
nG
ener
al E
lect
ric46
0v, 1
34a,
3p
h, S
F 1.
155K
AF4
45ST
B00
1MPH
6124
021
125
1,78
582
178
2,38
2R
epla
ce o
lder
sy
stem
with
new
HE
syst
em12
5$2
25,0
000.
32$7
2,00
02,
702
$384
Raw
Wat
er P
ump
Spar
e Pl
ant
Raw
Wat
er P
ump
Stat
ion
- on
shel
fG
ener
al E
lect
ric46
0v, 1
34a,
3p
h, S
F 1.
155K
AF4
45ST
B00
1MPH
6124
020
125
1,78
582
178
0N
o C
hang
e R
equi
red
Raw
Wat
er P
ump
# 3
Res
ervo
irR
aw W
ater
Pum
p St
atio
nU
S El
ectri
c M
otor
s41
60v,
52a
, 3p
h, S
F 1.
15Ti
tan
II60
1-02
1387
11-
1DO
R-0
2 M
rr40
01,
100
8517
840
0R
epla
ce o
lder
sy
stem
with
new
HE
syst
em40
0$7
10,0
000.
32$2
27,2
003,
153
$448
Raw
Wat
er P
ump
# 4
Res
ervo
irR
aw W
ater
Pum
p St
atio
nU
S El
ectri
c M
otor
s41
60v,
52a
, 3p
h, S
F 1.
15Ti
tan
II60
1-02
1387
11-
1DO
R-0
1 M
rr40
01,
100
8517
840
0R
epla
ce o
lder
sy
stem
with
new
HE
syst
em40
0$7
10,0
000.
32$2
27,2
003,
153
$448
Raw
Wat
er P
ump
Spar
e R
eser
voir
Raw
Wat
er P
ump
Stat
ion
- on
shel
fU
S El
ectri
c M
otor
s46
0v,2
28a,
3p
h, S
F 1.
15Ti
tan
IIR
-637
7-08
-344
R
1000
822M
200
1,77
085
178
0N
o C
hang
e R
equi
red
Two
- Var
iabl
e Fr
eque
ncy
Driv
esR
aw W
ater
Pum
p St
atio
nB
ensh
awfr
eque
ncy
125
- 400
30-6
0 H
z (9
00-1
800)
9017
800
Rep
lace
old
er
syst
em w
ith n
ew H
E sy
stem
125
- 400
Incl
uded
abo
ve
$1,8
70,0
00$5
98,4
0011
,709
$1,6
63
Mon
itorin
g an
d C
ontro
l Eq
uipm
ent f
or P
umps
and
Tr
avel
ling
Scre
ens
Raw
Wat
er P
ump
Stat
ion
No
Cha
nge
Req
uire
d
Uni
t Hea
ter 1
R
aw W
ater
Pum
p St
atio
n10
kw13
.41
No
Cha
nge
Req
uire
d
Uni
t Hea
ter 2
Scre
en R
oom
10kw
13.4
1N
o C
hang
e R
equi
red
Trav
ellin
g Sc
reen
1Sc
reen
Roo
mN
o C
hang
e R
equi
red
Trav
ellin
g Sc
reen
2Sc
reen
Roo
mN
o C
hang
e R
equi
red
Che
mic
al F
eed
Pum
ps a
nd
Equi
pmen
tR
aw W
ater
Pum
p St
atio
nN
o C
hang
e R
equi
red
Not
e: A
ll m
issi
ng in
form
atio
n w
as u
nobt
aina
ble
in th
e fie
ld.
"Will
iam
Mill
er J
r. W
ater
Tre
atm
ent P
lant
"C
onco
rd E
ngin
eeri
ng G
roup
MA
JOR
EQ
UIP
ME
NT
LIS
T
Prop
osed
Equ
ipm
ent
Savi
ngs
Rem
aini
ng L
ife/
Serv
ice
Life
Uni
t Cos
t for
E
CM
Ana
lysi
skW
h Sa
ving
sY
earl
y $
Savi
ngs
Typ
e
DE
MIN
IMIS
EQ
UIP
ME
NT
LIS
T
Lar
ge M
otor
s >25
HP
RA
W W
AT
ER
PU
MPI
NG
ST
AT
ION
Serv
ice
Loc
atio
nM
anuf
actu
rer
Mod
el N
umbe
rSe
rial
Num
ber
Rat
ed
Hor
sepo
wer
(h
p)
Spee
d (R
PM)
Perc
ent
Eff
icie
ncy
(%)
App
rox.
A
geR
emai
n.
Life
Ann
ual
Ope
ratio
n (h
rs)
Ret
ro-U
nit
Des
crip
tion
Hor
sepo
wer
Uni
t Cos
t In
stal
led
Tot
als

App
endi
x D
2 of
5
Mon
itorin
g an
d C
ontro
l Eq
uipm
ent f
or P
umps
and
Tr
avel
ling
Scre
ens
Che
mic
al F
eed
Bui
ldin
gN
o C
hang
e R
equi
red
Che
mic
al F
eed
Pum
ps a
nd
Equi
pmen
tC
hem
ical
Fee
d B
uild
ing
No
Cha
nge
Req
uire
d
Uni
t Hea
ter 1
1C
hem
ical
Fee
d B
uild
ing
Nat
ural
Gas
10
kw13
.41
No
Cha
nge
Req
uire
d
Uni
t Hea
ter 1
2C
hem
ical
Fee
d B
uild
ing
Nat
ural
Gas
10
kw13
.41
No
Cha
nge
Req
uire
d
Uni
t Hea
ter 1
3C
hem
ical
Fee
d B
uild
ing
Nat
ural
Gas
10
kw13
.41
No
Cha
nge
Req
uire
d
Uni
t Hea
ter 1
4C
hem
ical
Fee
d B
uild
ing
Nat
ural
Gas
10
kw13
.41
No
Cha
nge
Req
uire
d
Uni
t Hea
ter 9
Che
mic
al F
eed
Bui
ldin
gN
atur
al G
as
7kw
9.39
No
Cha
nge
Req
uire
d
Uni
t Hea
ter 1
0C
hem
ical
Fee
d B
uild
ing
Nat
ural
Gas
7k
w9.
39N
o C
hang
e R
equi
red
Rap
id M
ixer
1A
Che
mic
al F
eed
Bui
ldin
gPh
ilade
lphi
a/R
elia
nce
L215
TP2
1G41
710
1755
90.2
No
Cha
nge
Req
uire
d
Rap
id M
ixer
1B
Che
mic
al F
eed
Bui
ldin
gPh
ilade
lphi
a/R
elia
nce
L215
TP2
1G41
710
1755
90.2
No
Cha
nge
Req
uire
d
Dup
lex
Air
Com
pres
sor
Che
mic
al F
eed
Bui
ldin
gN
o C
hang
e R
equi
red
Floc
cula
tor 3
ASe
ttlin
g Ta
nks
No
Cha
nge
Req
uire
d
Floc
cula
tor 3
BSe
ttlin
g Ta
nks
No
Cha
nge
Req
uire
d
Floc
cula
tor 4
ASe
ttlin
g Ta
nks
No
Cha
nge
Req
uire
d
Floc
cula
tor 4
BSe
ttlin
g Ta
nks
No
Cha
nge
Req
uire
d
Long
Driv
e L-
3Se
ttlin
g Ta
nks
No
Cha
nge
Req
uire
d
Long
Driv
e C
-3Se
ttlin
g Ta
nks
No
Cha
nge
Req
uire
d
Long
Driv
e L-
4Se
ttlin
g Ta
nks
No
Cha
nge
Req
uire
d
Long
Driv
e C
-4Se
ttlin
g Ta
nks
No
Cha
nge
Req
uire
d
Not
e: A
ll m
issi
ng in
form
atio
n w
as u
nobt
aina
ble
in th
e fie
ld.
MA
JOR
EQ
UIP
ME
NT
LIS
TC
onco
rd E
ngin
eeri
ng G
roup
"Will
iam
Mill
er J
r. W
ater
Tre
atm
ent P
lant
"
none
DE
MIN
IMIS
EQ
UIP
ME
NT
LIS
T
Prop
osed
Equ
ipm
ent
Savi
ngs
Lar
ge M
otor
s >25
HP
PRE
-TR
EA
TM
EN
T B
UIL
DIN
G
Serv
ice
Loc
atio
nH
orse
pow
erM
anuf
actu
rer
Typ
eM
odel
Num
ber
Seri
al N
umbe
rR
ated
H
orse
pow
er
(hp)
Spee
d (R
PM)
Uni
t Cos
t In
stal
led
Rem
aini
ng L
ife/
Serv
ice
Life
Uni
t Cos
t for
E
CM
Ana
lysi
skW
h Sa
ving
sY
earl
y $
Savi
ngs
Perc
ent
Eff
icie
ncy
(%)
App
rox.
A
geR
emai
n.
Life
Ann
ual
Ope
ratio
n (h
rs)
Ret
ro-U
nit
Des
crip
tion

App
endi
x D
3 of
5
Bac
kwas
h Pu
mp
Low
er L
evel
Peer
less
/ GE
460v
, 149
a, 3
ph, S
F 1.
155K
6278
XH
192A
DLJ
4021
2812
511
8075
.5 to
87
to 7
936
<540
0R
epla
ce o
lder
syst
em w
ith
new
HE
syst
em12
5$3
25,0
000.
20$6
5,00
01,
648
$234
Tran
sfer
Pum
p #1
Low
er L
evel
Peer
less
/ GE
460v
, 212
a, 3
ph, S
F 1.
155K
AF4
45FP
6013
MX
F641
1028
200
780-
1800
84 to
85
to 8
4 18
74,
761
Rep
lace
old
er sy
stem
with
ne
w H
E sy
stem
200
$450
,000
0.32
$144
,000
12,3
25$1
,750
Tran
sfer
Pum
p #2
Low
er L
evel
Peer
less
/ GE
460v
, 212
a, 3
ph, S
F 1.
155K
AF4
45FP
6013
MX
F641
1029
200
780-
1800
84 to
85
to 8
4 18
74,
761
Rep
lace
old
er sy
stem
with
ne
w H
E sy
stem
200
$450
,000
0.32
$144
,000
12,3
25$1
,750
Hig
h Se
rvic
e Pu
mp
#3Lo
wer
Lev
elPe
erle
ss/ G
E46
0v, 2
74a,
3ph
, SF
1.15
5K44
5DP5
013A
NEG
0430
4125
017
8586
36<5
200
Rep
lace
old
er sy
stem
with
ne
w H
E sy
stem
250
$420
,000
0.2
$84,
000
1,13
6$1
61
Hig
h Se
rvic
e Pu
mp
#4 a
nd
Alte
rnat
e B
ackw
ash
Low
er L
evel
Peer
less
/ GE
460v
, 285
a, 3
ph, S
F 1.
155K
6286
6XH
552A
CB
J326
137
250
1175
-178
586
36<5
200
Rep
lace
old
er sy
stem
with
ne
w H
E sy
stem
250
$420
,000
0.2
$84,
000
1,13
6$1
61
3 - V
aria
ble
Freq
uenc
y D
rives
Upp
er L
evel
AB
B D
rives
freq
uenc
y9,
922
Rep
lace
old
er sy
stem
with
ne
w H
E sy
stem
$2,0
65,0
00$5
21,0
0028
,568
$4,0
57
Rap
id M
ixer
RPD
M1
Mix
er R
oom
Ligh
tnin
/Wes
tingh
ouse
145T
8102
7447
512
1725
No
Cha
nge
Req
uire
d
Rap
id M
ixer
RPD
M2
Mix
er R
oom
Ligh
tnin
/Wes
tingh
ouse
145T
8102
773B
646L
292
1725
No
Cha
nge
Req
uire
d
Off
ice
Equi
pmen
t: co
mpu
ters
, mon
itors
, prin
ters
,co
pier
s, te
leph
one
syst
emO
ffic
esN
o C
hang
e R
equi
red
SCA
DA
Con
trol C
ente
rSC
AD
A C
ontro
l R
oom
No
Cha
nge
Req
uire
d
Che
mic
al F
eed
Pum
ps a
nd
Equi
pmen
tC
ontro
l Bui
ldin
gN
o C
hang
e R
equi
red
Labo
rato
ry E
quip
men
tLa
bora
torie
sN
o C
hang
e R
equi
red
Mon
itorin
g an
d C
ontro
l Eq
uipm
ent
Con
trol B
uild
ing
No
Cha
nge
Req
uire
d
Not
e: A
ll m
issi
ng in
form
atio
n w
as u
nobt
aina
ble
in th
e fie
l
MA
JOR
EQ
UIP
ME
NT
LIS
TC
onco
rd E
ngin
eeri
ng G
roup
"Will
iam
Mill
er J
r. W
ater
Tre
atm
ent P
lant
"
WA
TE
R T
RE
AT
ME
NT
PL
AN
T C
ON
TR
OL
BU
ILD
ING
Prop
osed
Equ
ipm
ent
Savi
ngs
Mod
el N
umbe
rSe
rial
Num
ber
Rat
ed
Hor
sepo
wer
(h
p)
DE
MIN
IMIS
EQ
UIP
ME
NT
LIS
T
Lar
ge M
otor
s >25
HP
Serv
ice
Loc
atio
nM
anuf
actu
rer
Typ
eY
earl
y $
Savi
ngs
Spee
d (R
PM)
Perc
ent
Eff
icie
ncy
(%)
App
rox.
A
geR
emai
n.
Life
Ann
ual
Ope
ratio
n (h
rs)
Ret
ro-U
nit
Des
crip
tion T
otal
s
Hor
sepo
wer
Uni
t Cos
t In
stal
led
Rem
aini
ng L
ife/
Serv
ice
Life
Uni
t Cos
t for
E
CM
Ana
lysi
skW
h Sa
ving
s

App
endi
x D
4 of
5
Fini
shed
Wat
er P
ump
#1Fi
nish
ed W
ater
B
uild
ing
Peer
less
/GE
460v
, 217
a, 3
ph, S
F 1.
15SK
S445
FP60
43M
XF6
4130
2820
017
85
max
imum
7736
<536
02R
epla
ce o
lder
sy
stem
with
new
HE
syst
em20
0$4
50,0
000.
10$4
5,00
037
,678
$5,3
50
Fini
shed
Wat
er P
ump
#2Fi
nish
ed W
ater
B
uild
ing
Peer
less
/GE
460v
, 217
a, 3
ph, S
F 1.
15SK
S445
FP60
43M
XF6
4130
3020
017
85
max
imum
7736
<536
02R
epla
ce o
lder
sy
stem
with
new
HE
syst
em20
0$4
50,0
000.
10$4
5,00
037
,678
$5,3
50
Fini
shed
Wat
er P
ump
#3Fi
nish
ed W
ater
B
uild
ing
Peer
less
/GE
460v
, 217
a, 3
ph, S
F 1.
15SK
S445
FP60
43M
XF6
4130
2920
017
85
max
imum
7736
<536
02R
epla
ce o
lder
sy
stem
with
new
HE
syst
em20
0$4
50,0
000.
10$4
5,00
037
,678
$5,3
50
Fini
shed
Wat
er P
ump
#4Fi
nish
ed W
ater
B
uild
ing
Peer
less
/US
Mot
or46
0v, 2
54a,
3ph
, SF
1.15
ID C
1516
-01-
420
84-0
8272
200
1785
m
axim
um77
36<5
3602
Rep
lace
old
er
syst
em w
ith n
ew H
E sy
stem
200
$450
,000
0.10
$45,
000
37,6
78$5
,350
Four
- V
aria
ble
Freq
uenc
y D
rives
Fini
shed
Wat
er
Bui
ldin
gA
BB
50-2
0014
410
Rep
lace
old
er
syst
em w
ith n
ew H
E sy
stem
50-2
00in
clud
ed a
bove
incl
uded
abo
vein
clud
ed a
bove
$1,8
00,0
00$1
80,0
0015
0,71
2$2
1,40
1
Mon
itorin
g an
d C
ontro
l Equ
ipm
ent
for P
umps
Fi
nish
ed W
ater
B
uild
ing
No
Cha
nge
Req
uire
d
Uni
t Hea
ter
Fini
shed
Wat
er
Bui
ldin
gN
atur
al G
as 4
5kw
60.3
No
Cha
nge
Req
uire
d
Uni
t Hea
ter
Rec
ords
Sto
rage
R
oom
N
atur
al G
as 1
0kw
13.4
1N
o C
hang
e R
equi
red
Sum
p Pu
mp
#1D
ry P
itN
o C
hang
e R
equi
red
sum
p Pu
mp
#2D
ry P
itN
o C
hang
e R
equi
red
Not
e: A
ll m
issi
ng in
form
atio
n w
as u
nobt
aina
ble
in th
e fie
l
DE
MIN
IMIS
EQ
UIP
ME
NT
LIS
T
Prop
osed
Equ
ipm
ent
Savi
ngs
Lar
ge M
otor
s >25
HP
FIN
ISH
ED
WA
TE
R P
UM
PIN
G S
TA
TIO
N
MA
JOR
EQ
UIP
ME
NT
LIS
TC
onco
rd E
ngin
eeri
ng G
roup
"Will
iam
Mill
er J
r. W
ater
Tre
atm
ent P
lant
"
Serv
ice
Loc
atio
nM
anuf
actu
rer
Typ
eM
odel
Num
ber
Seri
al N
umbe
rR
ated
H
orse
pow
er
(hp)
Spee
d (R
PM)
Yea
rly
$ Sa
ving
sR
etro
-Uni
t D
escr
iptio
nH
orse
pow
erU
nit C
ost
Inst
alle
dR
emai
ning
Life
/ Se
rvic
e L
ifeU
nit C
ost f
or
EC
M A
naly
sis
kWh
Savi
ngs
Tot
als
Perc
ent
Eff
icie
ncy
(%)
App
rox.
A
geR
emai
n.
Life
Ann
ual
Ope
ratio
n (h
rs)

App
endi
x D
5 of
5
Gen
erat
or 1
Gen
erat
or B
uild
ing
Det
roit
Die
sel
1006
No
Cha
nge
Req
uire
d
Gen
erat
or 2
Gen
erat
or B
uild
ing
Det
roit
Die
sel
1006
No
Cha
nge
Req
uire
d
Gen
erat
or 3
Gen
erat
or B
uild
ing
Cat
erpi
llar
Die
sel
805
No
Cha
nge
Req
uire
d
Mon
itorin
g an
d C
ontro
l Equ
ipm
ent f
or
Gen
erat
ors
Gen
erat
or B
uild
ing
No
Cha
nge
Req
uire
d
Uni
t Hea
ter 1
G
ener
ator
Bui
ldin
g50
,000
Btu
/hr
19.6
5N
o C
hang
e R
equi
red
Uni
t Hea
ter 2
Gen
erat
or B
uild
ing
50,0
00 B
tu/h
r19
.65
No
Cha
nge
Req
uire
d
Exha
uste
rSt
ore
Roo
mN
o C
hang
e R
equi
red
Not
e: A
ll m
issi
ng in
form
atio
n w
as u
nobt
aina
ble
in th
e fie
ld.
MA
JOR
EQ
UIP
ME
NT
LIS
TC
onco
rd E
ngin
eeri
ng G
roup
"Will
iam
Mill
er J
r. W
ater
Tre
atm
ent P
lant
"
DE
MIN
IMIS
EQ
UIP
ME
NT
LIS
T
Prop
osed
Equ
ipm
ent
Savi
ngs
Lar
ge E
ngin
es a
nd M
otor
s >25
HP
Loc
atio
nM
anuf
actu
rer
Typ
eR
emai
ning
Life
/ Se
rvic
e L
ifeM
odel
Num
ber
GE
NE
RA
TO
R B
UIL
DIN
G
Serv
ice
Seri
al N
umbe
rR
ated
H
orse
pow
er
(hp)
Spee
d (R
PM)
Uni
t Cos
t for
E
CM
Ana
lysi
sPe
rcen
t E
ffic
ienc
y (%
)A
ppro
x.
Age
Rem
ain.
L
ifekW
h Sa
ving
sY
earl
y $
Savi
ngs
Ann
ual
Ope
ratio
n (h
rs)
Ret
ro-U
nit
Des
crip
tion
Hor
sepo
wer
Uni
t Cos
t In
stal
led

App
endi
x E
Page
1 o
f 5
PBM
0050
0.01
DA
TE:
12/2
4/20
09
Bric
k To
wns
hip
MU
A E
nerg
y A
udit
K
WH
CO
ST:
$0.1
42
Add
ress
: 15
51 R
out 8
8
Bric
k To
wns
hip
2,49
0
EX
IST
ING
LIG
HT
ING
PR
OPO
SED
LIG
HT
ING
SA
VIN
GS
Lin
eFi
xtur
eN
o.
No.
Fi
xtur
eY
earl
yW
atts
Tot
alkW
h/Y
rY
earl
yN
o.
Ret
ro-U
nit
Wat
tsT
otal
kWh/
Yr
Uni
t Cos
tT
otal
kWkW
h/Y
rY
earl
yY
earl
yN
o.Lo
catio
nFi
xts
Lam
psTy
peU
sage
Use
dkW
Fixt
ures
$ C
ost
Fixt
sD
escr
iptio
nU
sed
kWFi
xtur
es(I
NST
ALL
ED)
Cos
tSa
ving
sSa
ving
s$
Savi
ngs
Payb
ack
1Pu
mp
Roo
m4
115
0 W
att M
etal
Hal
ide
Hig
h B
ay87
6018
00.
7263
07.2
$895
.62
4
2 La
mp
T5H
O V
apor
Ti
ght H
igh-
Bay
by
Coo
per,
F-B
ay S
erie
s or
Equi
vale
nt
117
0.47
4099
.68
$250
.00
$1,0
00.0
00.
2522
08$3
13.4
73.
19
2Sc
reen
Roo
m4
115
0 W
att M
etal
Hal
ide
Hig
h B
ay10
0018
00.
7272
0$1
02.2
44
2 La
mp
T5H
O V
apor
Ti
ght H
igh-
Bay
by
Coo
per,
F-B
ay S
erie
s or
Equi
vale
nt
117
0.47
468
$250
.00
$1,0
00.0
00.
2525
2$3
5.78
27.9
5
3Ex
terio
r4
1Fl
ood
Ligh
t30
0015
00.
6018
00$2
55.6
04
No
Cha
nge
0.00
0$0
.00
0.00
0$0
.00
0.00
Tot
als
122.
0488
27.2
$1,2
53.4
612
0.94
4567
.68
$2,0
00.0
00.
5024
60$3
49.2
55.
73
INV
EST
ME
NT
GR
AD
E L
IGH
TIN
G A
UD
IT
CO
NC
OR
D E
NE
RG
Y S
ER
VIC
ES
CE
G J
ob #
:
EC
M #
1: L
ight
ing
Upg
rade
Bui
ldin
g SF
:
Proj
ect:
City
:
Wat
er T
reat
men
t Pla
ntR
aw W
ater
Pum
p St
atio
n
Pag
e 1

App
endi
x E
Page
2 o
f 5
PBM
0050
0.01
DA
TE
: 12
/24/
2009
Bric
k To
wns
hip
MU
A E
nerg
y A
udit
K
WH
CO
ST:
$0.1
42
Add
ress
: 15
51 R
out 8
8
Bric
k To
wns
hip
4,07
9
EX
IST
ING
LIG
HT
ING
PR
OPO
SED
LIG
HT
ING
SA
VIN
GS
Lin
eFi
xtur
eN
o.
No.
Fi
xtur
eY
earl
yW
atts
Tot
alkW
h/Y
rY
earl
yN
o.
Ret
ro-U
nit
Wat
tsT
otal
kWh/
Yr
Yea
rly
Uni
t Cos
tT
otal
kWkW
h/Y
rY
earl
yY
earl
yN
o.Lo
catio
nFi
xts
Lam
psTy
peU
sage
Use
dkW
Fixt
ures
$ C
ost
Fixt
sD
escr
iptio
nU
sed
kWFi
xtur
es$
Cos
t(I
NST
ALL
ED)
Cos
tSa
ving
sSa
ving
s$
Savi
ngs
Payb
ack
1C
hem
ical
Sto
rage
121
150
Wat
t Met
al H
alid
e H
igh
Bay
8760
180
2.16
1892
1.6
$2,6
86.8
712
2 La
mp
T5H
O V
apor
Ti
ght H
igh-
Bay
by
Coo
per,
F-B
ay S
erie
s or
Equ
ival
ent
117
1.40
1229
9$1
,746
.46
$250
.00
$3,0
00.0
00.
7666
23$9
40.4
03.
19
2El
ectri
cal R
oom
24
4' 4
-lam
p T8
500
109
0.22
109
$15.
480
No
Cha
nge
00.
000
$0.0
0$0
.00
$0.0
00.
000
$0.0
00.
003
Lim
e St
orag
e6
14'
1-la
mp
T830
0028
0.17
504
$71.
570
No
Cha
nge
00.
000
$0.0
0$0
.00
$0.0
00.
000
$0.0
00.
00T
otal
s20
2.55
1953
4.6
$2,7
73.9
112
1.40
1229
9$1
,746
.46
$3,0
00.0
00.
7666
23$9
40.4
03.
19
INV
EST
ME
NT
GR
AD
E L
IGH
TIN
G A
UD
IT
CO
NC
OR
D E
NE
RG
Y S
ER
VIC
ES
CE
G J
ob #
:W
ater
Tre
atm
ent P
lant
EC
M #
1: L
ight
ing
Upg
rade
Proj
ect:
Pre-
Tre
atm
ent B
uild
ing
City
:B
uild
ing
SF:

App
endi
x E
Pag
e 3
of 5
PBM
0050
0.01
DA
TE
: 12
/24/
2009
Bric
k To
wns
hip
MU
A E
nerg
y A
udit
K
WH
CO
ST:
$0.1
42
Add
ress
: 15
51 R
out 8
8
Bric
k To
wns
hip
12,5
82
EX
IST
ING
LIG
HT
ING
PR
OPO
SED
LIG
HT
ING
SA
VIN
GS
Lin
eFi
xtur
eN
o.
No.
Fi
xtur
eY
earl
yW
atts
Tot
alkW
h/Y
rY
earl
yN
o.
Ret
ro-U
nit
Wat
tsT
otal
kWh/
Yr
Yea
rly
Uni
t Cos
tT
otal
kWkW
h/Y
rY
earl
yY
earl
yN
o.L
ocat
ion
Fixt
sL
amps
Typ
eU
sage
Use
dkW
Fixt
ures
$ C
ost
Fixt
sD
escr
iptio
nU
sed
kWFi
xtur
es$
Cos
t(I
NST
AL
LE
D)
Cos
tSa
ving
sSa
ving
s$
Savi
ngs
Payb
ack
1R
apid
Mix
er B
lg3
24'
T8
8760
580.
1715
24.2
4$2
16.4
40
No
Cha
nge
00.
000
$0.0
0$0
.00
$0.0
00.
000
$0.0
00.
002
Rap
id M
ixer
Blg
11
4' T
887
6028
0.03
245.
28$3
4.83
0N
o C
hang
e0
0.00
0$0
.00
$0.0
0$0
.00
0.00
0$0
.00
0.00
3M
etal
s Lab
64
4' T
830
0010
90.
6519
62$2
78.6
00
No
Cha
nge
00.
000
$0.0
0$0
.00
$0.0
00.
000
$0.0
00.
00
4C
hlor
ine
Roo
m2
115
0 W
att M
etal
Hal
ide
Hig
h B
ay87
6018
00.
3631
53.6
$447
.81
22
Lam
p T5
HO
Vap
or T
ight
H
igh-
Bay
by
Coo
per,
F-B
ay
Serie
s or E
quiv
alen
t11
70.
2320
49.8
4$2
91.0
8$2
50.0
0$5
00.0
00.
1311
04$1
56.7
33.
19
5Fi
lter R
oom
low
er
leve
l11
115
0 W
att M
etal
Hal
ide
Hig
h B
ay30
0018
01.
9859
40$8
43.4
811
2 La
mp
T5H
O V
apor
Tig
ht
Hig
h-B
ay b
y C
oope
r, F-
Bay
Se
ries o
r Equ
ival
ent
117
1.29
3861
$548
.26
$250
.00
$2,7
50.0
00.
6920
79$2
95.2
29.
32
6Fi
lter R
oom
hal
lway
lo
wer
leve
l11
14'
1-la
mp
T12
3000
500.
5516
50$2
34.3
011
1'x4
' 1-L
amp
32W
T-8
Pr
ism
Len
s/El
ect B
alla
st;
Met
alux
M/N
GC
280.
3192
4$1
31.2
1$1
20.0
0$1
,320
.00
0.24
726
$103
.09
12.8
0
7St
ore
Roo
m lo
wer
le
vel
31
4' 1
-lam
p T1
250
050
0.15
75$1
0.65
31'
x4' 1
-Lam
p 32
W T
-8
Pris
m L
ens/
Elec
t Bal
last
; M
etal
ux M
/N G
C28
0.08
42$5
.96
$120
.00
$360
.00
0.07
33$4
.69
76.8
2
8Fi
lter R
oom
Upp
er
leve
l21
24'
2-la
mp
T887
6058
1.22
1066
9.7
$1,5
15.0
90
No
Cha
nge
00.
000
$0.0
0$0
.00
$0.0
00.
000
$0.0
00.
00
9Fi
lter R
oom
Upp
er
leve
l4
24'
2-la
mp
T850
058
0.23
116
$16.
470
No
Cha
nge
00.
000
$0.0
0$0
.00
$0.0
00.
000
$0.0
00.
00
10SC
AD
A4
44'
4-la
mp
T887
6010
90.
4438
19.3
6$5
42.3
50
No
Cha
nge
00.
000
$0.0
0$0
.00
$0.0
00.
000
$0.0
00.
0011
Off
ice
3C
FL30
0023
0.07
207
$29.
390
No
Cha
nge
00.
000
$0.0
0$0
.00
$0.0
00.
000
$0.0
00.
0012
Lab
Com
mon
Are
a4
44'
4-la
mp
T830
0010
90.
4413
08$1
85.7
40
No
Cha
nge
00.
000
$0.0
0$0
.00
$0.0
00.
000
$0.0
00.
0013
Old
Lab
84
4' 4
-lam
p T8
3000
109
0.87
2616
$371
.47
0N
o C
hang
e0
0.00
0$0
.00
$0.0
0$0
.00
0.00
0$0
.00
0.00
14Fi
lter R
oom
232
4' 2
-lam
p T8
8760
280.
6456
41.4
4$8
01.0
80
No
Cha
nge
00.
000
$0.0
0$0
.00
$0.0
00.
000
$0.0
00.
0015
New
Lab
162
2X2
2-la
mp
T830
0073
1.17
3504
$497
.57
0N
o C
hang
e0
0.00
0$0
.00
$0.0
0$0
.00
0.00
0$0
.00
0.00
16R
est R
oom
s4
44'
4-la
mp
T830
0010
90.
4413
08$1
85.7
40
No
Cha
nge
00.
000
$0.0
0$0
.00
$0.0
00.
000
$0.0
00.
0017
3 O
ffic
es6
44'
4-la
mp
T830
0010
90.
6519
62$2
78.6
00
No
Cha
nge
00.
000
$0.0
0$0
.00
$0.0
00.
000
$0.0
00.
00T
otal
s13
010
.06
4570
1.6
$6,4
89.6
327
1.91
6876
.84
$976
.51
$4,9
30.0
01.
1339
42$5
59.7
38.
81
INV
EST
ME
NT
GR
AD
E L
IGH
TIN
G A
UD
IT
CO
NC
OR
D E
NE
RG
Y S
ER
VIC
ES
CE
G J
ob #
:W
ater
Tre
atm
ent P
lant
EC
M #
1: L
ight
ing
Upg
rade
Proj
ect:
Wat
er T
reat
men
t Pla
nt/C
ontr
ol B
uild
ing
City
:B
uild
ing
SF:

App
endi
x E
Page
4 o
f 5
PBM
0050
0.01
DA
TE
: 12
/24/
2009
Bric
k To
wns
hip
MU
A E
nerg
y A
udit
K
WH
CO
ST:
$0.1
42
Add
ress
: 15
51 R
out 8
8
Bric
k To
wns
hip
2,49
0
EX
IST
ING
LIG
HT
ING
PR
OPO
SED
LIG
HT
ING
SA
VIN
GS
Lin
eFi
xtur
eN
o.
No.
Fi
xtur
eY
earl
yW
atts
Tot
alkW
h/Y
rY
earl
yN
o.
Ret
ro-U
nit
Wat
tsT
otal
kWh/
Yr
Yea
rly
Uni
t Cos
tT
otal
kWkW
h/Y
rY
earl
yY
earl
yN
o.Lo
catio
nFi
xts
Lam
psTy
peU
sage
Use
dkW
Fixt
ures
$ C
ost
Fixt
sD
escr
iptio
nU
sed
kWFi
xtur
es$
Cos
t(I
NST
ALL
ED)
Cos
tSa
ving
sSa
ving
s$
Savi
ngs
Payb
ack
1Pu
mp
Roo
m9
1H
igh
Pres
sure
Sod
ium
V
apor
200
87
6018
81.
6914
821.
9$2
,104
.71
9
2 La
mp
T5H
O V
apor
Ti
ght H
igh-
Bay
by
Coo
per,
F-B
ay
Serie
s or E
quiv
alen
t
117
1.05
9,22
4$1
,309
.85
$250
.00
$250
.00
0.64
5598
$794
.86
0.31
2Pu
mp
Roo
m
Bas
emen
t Lev
el9
1In
cand
esce
nt20
010
00.
9018
0$2
5.56
91
lam
p 23
w C
FL26
0.23
47$6
.65
$75.
00$6
75.0
00.
6713
3$1
8.91
35.6
9
3Ex
terio
r4
1Fl
ood
Ligh
t30
0010
00.
4012
00$1
70.4
04
No
Cha
nge
100
0.40
1,20
0$1
70.4
0$0
.00
$0.0
00.
000
$0.0
00.
00T
otal
s22
2.99
1620
1.9
$2,3
00.6
722
1.69
1047
1.1
$1,4
86.8
9$9
25.0
01.
3157
31$8
13.7
81.
14
INV
EST
ME
NT
GR
AD
E L
IGH
TIN
G A
UD
IT
CO
NC
OR
D E
NE
RG
Y S
ER
VIC
ES
CE
G J
ob #
:W
ater
Tre
atm
ent P
lant
EC
M #
1: L
ight
ing
Upg
rade
Proj
ect:
Fini
shed
Wat
er P
ump
Stat
ion
City
:B
uild
ing
SF:

App
endi
x E
Pag
e 5
of 5
PBM
0050
0.01
DA
TE
: 12
/24/
2009
Bric
k To
wns
hip
MU
A E
nerg
y A
udit
K
WH
CO
ST:
$0.1
42
Add
ress
: 15
51 R
out 8
8
Bric
k To
wns
hip
4,43
8
EX
IST
ING
LIG
HT
ING
PR
OPO
SED
LIG
HT
ING
SA
VIN
GS
Lin
eFi
xtur
eN
o.
No.
Fi
xtur
eY
earl
yW
atts
Tot
alkW
h/Y
rY
earl
yN
o.
Ret
ro-U
nit
Wat
tsT
otal
kWh/
Yr
Uni
t Cos
tT
otal
kWkW
h/Y
rY
earl
yY
earl
yN
o.L
ocat
ion
Fixt
sL
amps
Typ
eU
sage
Use
dkW
Fixt
ures
$ C
ost
Fixt
sD
escr
iptio
nU
sed
kWFi
xtur
es(I
NST
AL
LE
D)
Cos
tSa
ving
sSa
ving
s$
Savi
ngs
Payb
ack
1G
ener
ator
Bui
ldin
g1
115
0 W
att M
etal
Hal
ide
Hig
h B
ay87
6018
00.
1815
76.8
$223
.91
12
Lam
p T5
HO
Vap
or T
ight
H
igh-
Bay
by
Coo
per,
F-B
aySe
ries o
r Equ
ival
ent
117
0.12
1024
.92
$250
.00
$250
.00
0.06
552
$78.
373.
19
2G
ener
ator
Bui
ldin
g2
115
0 W
att M
etal
Hal
ide
Hig
h B
ay20
018
00.
3672
$10.
222
2 La
mp
T5H
O V
apor
Tig
ht
Hig
h-B
ay b
y C
oope
r, F-
Ba y
Serie
s or E
quiv
alen
t11
70.
2346
.8$2
50.0
0$5
00.0
00.
1325
$3.5
813
9.73
3G
ener
ator
Bui
ldin
g2
28'
2-la
mp
T12
200
126
0.25
50.4
$7.1
64
4' F
lour
esce
nt F
ixtu
res,
2-
T8 b
ulbs
550.
2244
$75.
00$3
00.0
00.
036
$0.9
133
0.11
4St
airw
ell
32
4' 2
-lam
p T1
287
6080
0.24
2102
.4$2
98.5
43
4' F
lour
esce
nt F
ixtu
res,
2-
T8 b
ulbs
550.
1714
45.4
$75.
00$2
25.0
00.
0865
7$9
3.29
2.41
5St
orag
e R
oom
42
8' 2
-lam
p T1
240
012
60.
5020
1.6
$28.
638
4' F
lour
esce
nt F
ixtu
res,
2-
T8 b
ulbs
550.
4417
6$7
5.00
$600
.00
0.06
26$3
.64
165.
05
6St
orag
e R
oom
24
4' 4
-lam
p T1
210
016
00.
3232
$4.5
42
4' F
lour
esce
nt F
ixtu
res,
3-
T8 b
ulbs
820.
1616
.4$7
5.00
$150
.00
0.16
16$2
.22
67.7
1
7G
arag
e2
28'
2-la
mp
T12
200
126
0.25
50.4
$7.1
64
4' F
lour
esce
nt F
ixtu
res,
2-
T8 b
ulbs
550.
2244
$75.
00$3
00.0
00.
036
$0.9
133
0.11
8Ex
terio
r6
Floo
d Li
ght
3000
150
0.90
2700
$383
.40
6N
o C
hang
e15
00.
9027
00$0
.00
$0.0
00.
000
$0.0
00.
00T
otal
s22
3.01
6785
.6$9
63.5
630
2.46
5497
.52
$2,3
25.0
00.
5512
88$1
82.9
112
.71
EC
M #
1: L
ight
ing
Upg
rade
Proj
ect:
City
:B
uild
ing
SF:
Gen
erat
or B
uild
ing
Wat
er T
reat
men
t Pla
nt
INV
EST
ME
NT
GR
AD
E L
IGH
TIN
G A
UD
IT
CO
NC
OR
D E
NE
RG
Y S
ER
VIC
ES
CE
G J
ob #
:

App
endi
x F
Pag
e 1
of 5
PBM
0050
0.01
DA
TE
:
Bric
k To
wns
hip
MU
A E
nerg
y A
udit
K
WH
CO
ST:
$0.1
4215
51 R
out 8
8B
rick
Tow
nshi
p 2,
490
EX
IST
ING
LIG
HT
ING
PR
OPO
SED
LIG
HT
ING
Lin
eFi
xtur
eN
o.
No.
Fi
xtur
eY
earl
yW
atts
Tot
alkW
h/Y
rY
earl
yN
o.
Ret
ro-U
nit
Wat
tsT
otal
kWh/
Yr
Red
uctio
nY
earl
yU
nit C
ost
Tot
alkW
kWh/
Yr
Yea
rly
Yea
rly
No.
Loc
atio
nFi
xts
Lam
psT
ype
Usa
geU
sed
kWFi
xtur
es$
Cos
tFi
xts
Des
crip
tion
Use
dkW
Fixt
ures
%$
Cos
t(I
nsta
lled)
Cos
tSa
ving
sSa
ving
s$
Savi
ngs
Payb
ack
1Pu
mp
Roo
m4
115
0 W
att
Met
al H
alid
e H
igh
Bay
8760
180
0.72
6,30
7$8
95.6
24
Not
App
licab
le18
00.
726,
307
10%
$806
.06
$160
.00
$160
.00
0.00
631
$89.
561.
79
2Sc
reen
Roo
m4
115
0 W
att
Met
al H
alid
e H
igh
Bay
1000
180
0.72
720
$102
.24
4D
ual t
echn
olog
y oc
cupa
ncy
sens
or
plus
tim
er18
00.
7272
010
%$9
2.02
$160
.00
$160
.00
0.00
72$1
0.22
15.6
5
3Ex
terio
r4
1Fl
ood
Ligh
t30
0015
00.
601,
800
$255
.60
4Ph
otoc
ell C
ontro
l w
ith T
imer
O
verr
ide
150
0.60
1,80
010
%$2
30.0
4$2
50.0
0$2
50.0
00.
0018
0$2
5.56
9.78
Tot
als
122.
0488
27.2
$1,2
53.4
612
2.04
8827
.2$1
,128
.12
$570
.00
0.00
883
$125
.35
4.55
DE
TA
ILE
D L
IGH
TIN
G C
ON
TR
OL
S A
UD
IT
CO
NC
OR
D E
NE
RG
Y S
ER
VIC
ES
CE
G J
ob #
:
Proj
ect:
Add
ress
:
SA
VIN
GS
12/2
4/20
09
EC
M #
2: L
ight
ing
Con
trol
s
City
:B
uild
ing
SF:
Wat
er T
reat
men
t Pla
ntR
aw W
ater
Pum
p St
atio
n
Pag
e 1

App
endi
x F
Page
2 o
f 5
PBM
0050
0.01
DA
TE
:
Bric
k To
wns
hip
MU
A E
nerg
y A
udit
K
WH
CO
ST:
$0.1
4215
51 R
out 8
8B
rick
Tow
nshi
p 4,
079
EX
IST
ING
LIG
HT
ING
PR
OPO
SED
LIG
HT
ING
SA
VIN
GS
Lin
eFi
xtur
eN
o.
No.
Fi
xtur
eY
earl
yW
atts
Tot
alkW
h/Y
rY
earl
yN
o.
Ret
ro-U
nit
Wat
tsT
otal
kWh/
Yr
Red
uctio
nY
earl
yU
nit C
ost
Tot
alkW
kWh/
Yr
Yea
rly
Yea
rly
No.
Loc
atio
nFi
xts
Lam
psT
ype
Usa
geU
sed
kWFi
xtur
es$
Cos
tFi
xts
Des
crip
tion
Use
dkW
Fixt
ures
%$
Cos
t(I
nsta
lled)
Cos
tSa
ving
sSa
ving
s$
Savi
ngs
Payb
ack
1C
hem
ical
Sto
rage
121
150
Wat
t M
etal
Hal
ide
Hig
h B
ay87
6018
02.
1618
,922
$2,6
86.8
712
Dua
l tec
hnol
ogy
on/o
ff sw
itch
plus
tim
er18
02.
1618
,922
10%
$268
.69
$160
.00
$160
.00
0.00
1,89
2$2
68.6
90.
60
2El
ectri
cal R
oom
24
4' 4
-lam
p T8
500
109
0.22
109
$15.
482
Dua
l tec
hnol
ogy
on/o
ff sw
itch
plus
tim
er10
90.
2210
910
%$1
.55
$160
.00
$160
.00
0.00
11$1
.55
103.
37
3Li
me
Stor
age
61
4' 1
-lam
p T8
3000
280.
1750
4$7
1.57
6D
ual t
echn
olog
y on
/off
switc
h pl
us
timer
280.
1750
410
%$7
.16
$160
.00
$160
.00
0.00
50$7
.16
22.3
6
Tot
als
202.
5519
534.
6$2
,773
.91
202.
5519
535
$277
.39
$480
.00
0.00
1,95
3$2
77.3
91.
73
DE
TA
ILE
D L
IGH
TIN
G C
ON
TR
OL
S A
UD
IT
CO
NC
OR
D E
NE
RG
Y S
ER
VIC
ES
12/2
4/20
09C
EG
Job
#:
Wat
er T
reat
men
t Pla
ntPr
e-T
reat
men
t Bui
ldin
g
EC
M #
2: L
ight
ing
Con
trol
s
Proj
ect:
Add
ress
: C
ity:
Bui
ldin
g SF
:

App
endi
x F
Page
3 o
f 5
PBM
0050
0.01
DA
TE
:
Bric
k To
wns
hip
MU
A E
nerg
y A
udit
K
WH
CO
ST:
$0.1
4215
51 R
out 8
8B
rick
Tow
nshi
p 12
,582
EX
IST
ING
LIG
HT
ING
PR
OPO
SED
LIG
HT
ING
SA
VIN
GS
Lin
eFi
xtur
eN
o.
No.
Fi
xtur
eY
earl
yW
atts
Tot
alkW
h/Y
rY
earl
yN
o.
Ret
ro-U
nit
Wat
tsT
otal
kWh/
Yr
Red
uctio
nY
earl
yU
nit C
ost
Tot
alkW
kWh/
Yr
Yea
rly
Yea
rly
No.
Loc
atio
nFi
xts
Lam
psT
ype
Usa
geU
sed
kWFi
xtur
es$
Cos
tFi
xts
Des
crip
tion
Use
dkW
Fixt
ures
%$
Cos
t(I
nsta
lled)
Cos
tSa
ving
sSa
ving
s$
Savi
ngs
Payb
ack
1R
apid
Mix
er B
lg3
24'
T8
8760
580.
171,
524
$216
.44
3D
ual t
echn
olog
y on
/off
sw
itch
plus
tim
er58
0.17
1524
10%
$194
.80
$160
.00
$160
.00
0.00
152
$21.
647.
39
2R
apid
Mix
er B
lg1
14'
T8
8760
280.
0324
5$3
4.83
1D
ual t
echn
olog
y on
/off
sw
itch
plus
tim
er28
0.03
245
10%
$31.
35$1
60.0
0$1
60.0
00.
0025
$3.4
845
.94
3M
etal
s Lab
64
4' T
830
0010
90.
651,
962
$278
.60
6D
ual t
echn
olog
y on
/off
sw
itch
plus
tim
er10
90.
6519
6210
%$2
50.7
4$1
60.0
0$1
60.0
00.
0019
6$2
7.86
5.74
4C
hlor
ine
Roo
m2
115
0 W
att M
etal
H
alid
e H
igh
Bay
8760
180
0.36
3,15
4$4
47.8
12
Dua
l tec
hnol
ogy
on/o
ff
switc
h pl
us ti
mer
180
0.36
3154
10%
$403
.03
$160
.00
$160
.00
0.00
315
$44.
783.
57
5Fi
lter R
oom
low
er
leve
l11
115
0 W
att M
etal
H
alid
e H
igh
Bay
3000
180
1.98
5,94
0$8
43.4
811
Dua
l tec
hnol
ogy
on/o
ff
switc
h pl
us ti
mer
180
1.98
5940
10%
$759
.13
$160
.00
$160
.00
0.00
594
$84.
351.
90
6Fi
lter R
oom
ha
llway
low
er
leve
l11
14'
1-la
mp
T12
3000
500.
551,
650
$234
.30
0N
ot A
pplic
able
00.
000
0%$0
.00
$0.0
0$0
.00
0.00
0$0
.00
0.00
7St
ore
Roo
m lo
wer
le
vel
31
4' 1
-lam
p T1
250
050
0.15
75$1
0.65
3D
ual t
echn
olog
y on
/off
sw
itch
plus
tim
er50
0.15
7510
%$9
.59
$160
.00
$160
.00
0.00
8$1
.07
150.
23
8Fi
lter R
oom
Upp
er
leve
l21
24'
2-la
mp
T887
6058
1.22
10,6
70$1
,515
.09
21D
ual t
echn
olog
y on
/off
sw
itch
plus
tim
er58
1.22
1067
010
%$1
,363
.59
$160
.00
$160
.00
0.00
1,06
7$1
51.5
11.
06
9Fi
lter R
oom
Upp
er
leve
l4
24'
2-la
mp
T850
058
0.23
116
$16.
474
Dua
l tec
hnol
ogy
on/o
ff
switc
h pl
us ti
mer
580.
2311
610
%$1
4.82
$160
.00
$160
.00
0.00
12$1
.65
97.1
3
10SC
AD
A4
44'
4-la
mp
T887
6010
90.
443,
819
$542
.35
4D
ual t
echn
olog
y on
/off
sw
itch
plus
tim
er10
90.
4438
1910
%$4
88.1
1$1
60.0
0$1
60.0
00.
0038
2$5
4.23
2.95
11O
ffic
e3
CFL
3000
230.
0720
7$2
9.39
3D
ual t
echn
olog
y on
/off
sw
itch
plus
tim
er23
0.07
207
10%
$26.
45$1
60.0
0$1
60.0
00.
0021
$2.9
454
.43
12La
b C
omm
on A
rea
44
4' 4
-lam
p T8
3000
109
0.44
1,30
8$1
85.7
44
Dua
l tec
hnol
ogy
on/o
ff
switc
h pl
us ti
mer
109
0.44
1308
10%
$167
.16
$160
.00
$160
.00
0.00
131
$18.
578.
61
13O
ld L
ab8
44'
4-la
mp
T830
0010
90.
872,
616
$371
.47
8D
ual t
echn
olog
y on
/off
sw
itch
plus
tim
er10
90.
8726
1610
%$3
34.3
2$1
60.0
0$1
60.0
00.
0026
2$3
7.15
4.31
14Fi
lter R
oom
232
4' 2
-lam
p T8
8760
280.
645,
641
$801
.08
23D
ual t
echn
olog
y on
/off
sw
itch
plus
tim
er28
0.64
5641
10%
$720
.98
$160
.00
$160
.00
0.00
564
$80.
112.
00
15N
ew L
ab16
22X
2 2-
lam
p T8
3000
731.
173,
504
$497
.57
16D
ual t
echn
olog
y on
/off
sw
itch
plus
tim
er73
1.17
3504
10%
$447
.81
$160
.00
$160
.00
0.00
350
$49.
763.
22
16R
est R
oom
s4
44'
4-la
mp
T830
0010
90.
441,
308
$185
.74
4D
ual t
echn
olog
y on
/off
sw
itch
plus
tim
er10
90.
4413
0810
%$1
67.1
6$1
60.0
0$1
60.0
00.
0013
1$1
8.57
8.61
173
Off
ices
64
4' 4
-lam
p T8
3000
109
0.65
1,96
2$2
78.6
06
Dua
l tec
hnol
ogy
on/o
ff
switc
h pl
us ti
mer
109
0.65
1962
10%
$250
.74
$160
.00
$160
.00
0.00
196
$27.
865.
74
Tot
als
130
10.0
645
,702
$6,4
89.6
311
99.
5144
051.
6$5
,629
.79
$2,5
60.0
00.
004,
405
$625
.53
4.09
DE
TA
ILE
D L
IGH
TIN
G C
ON
TR
OL
S A
UD
IT
CO
NC
OR
D E
NE
RG
Y S
ER
VIC
ES
12/2
4/20
09C
EG
Job
#:
Wat
er T
reat
men
t Pla
ntW
ater
Tre
atm
ent P
lant
/Con
trol
Bui
ldin
g
EC
M #
2: L
ight
ing
Con
trol
s
Proj
ect:
Add
ress
: C
ity:
Bui
ldin
g SF
:

App
endi
x F
Pag
e 4
of 5
PBM
0050
0.01
DA
TE
:
Bric
k To
wns
hip
MU
A E
nerg
y A
udit
K
WH
CO
ST:
$0.1
42
1551
Rou
t 88
Bric
k To
wns
hip
2,49
0
EX
IST
ING
LIG
HT
ING
PR
OPO
SED
LIG
HT
ING
Lin
eFi
xtur
eN
o.
No.
Fi
xtur
eY
earl
yW
atts
Tot
alkW
h/Y
rY
earl
yN
o.
Ret
ro-U
nit
Wat
tsT
otal
Red
uctio
nkW
h/Y
rY
earl
yU
nit C
ost
Tot
alkW
kWh/
Yr
Yea
rly
Yea
rly
No.
Loc
atio
nFi
xts
Lam
psT
ype
Usa
geU
sed
kWFi
xtur
es$
Cos
tFi
xts
Des
crip
tion
Use
dkW
%Fi
xtur
es$
Cos
t(I
nsta
lled)
Cos
tSa
ving
sSa
ving
s$
Savi
ngs
Payb
ack
1Pu
mp
Roo
m9
1H
igh
Pres
sure
So
dium
Vap
or 2
00
8760
188
1.69
14,8
22$2
,104
.71
9N
ot A
pplic
able
188
1.69
10%
14,8
22$1
,894
.24
$160
.00
$160
.00
0.0
1,48
2$2
10.4
70.
76
2Pu
mp
Roo
m
Bas
emen
t Lev
el9
1In
cand
esce
nt20
010
00.
9018
0$2
5.56
9N
ot A
pplic
able
100
0.90
10%
180
$23.
00$1
60.0
0$1
60.0
00.
018
$2.5
662
.60
3Ex
terio
r4
1Fl
ood
Ligh
t30
0010
00.
401,
200
$170
.40
4Ph
otoc
ell C
ontro
l w
ith T
imer
Ove
rrid
e10
00.
4020
%1,
200
$136
.32
$250
.00
$250
.00
0.0
240
$34.
087.
34
Tot
als
222.
9916
201.
9$2
,300
.67
222.
9916
201.
9$2
,053
.57
$570
.00
0.00
1,74
0$2
47.1
12.
31
DE
TA
ILE
D L
IGH
TIN
G C
ON
TR
OL
S A
UD
IT
CO
NC
OR
D E
NE
RG
Y S
ER
VIC
ES
CE
G J
ob #
:12
/24/
2009
Wat
er T
reat
men
t Pla
nt
SA
VIN
GS
EC
M #
2: L
ight
ing
Con
trol
s
Proj
ect:
Add
ress
:
City
:B
uild
ing
SF:
Fini
shed
Wat
er P
ump
Stat
ion

App
endi
x F
Page
5 o
f 5
PBM
0050
0.01
DA
TE
:
Bric
k To
wns
hip
MU
A E
nerg
y A
udit
K
WH
CO
ST:
$0.1
4215
51 R
out 8
8B
rick
Tow
nshi
p 4,
438
EX
IST
ING
LIG
HT
ING
PR
OPO
SED
LIG
HT
ING
Lin
eFi
xtur
eN
o.
No.
Fi
xtur
eY
earl
yW
atts
Tot
alkW
h/Y
rY
earl
yN
o.
Ret
ro-U
nit
Wat
tsT
otal
kWh/
Yr
Red
uctio
nY
earl
yU
nit C
ost
Tot
alkW
kWh/
Yr
Yea
rly
Yea
rly
No.
Loc
atio
nFi
xts
Lam
psT
ype
Usa
geU
sed
kWFi
xtur
es$
Cos
tFi
xts
Des
crip
tion
Use
dkW
Fixt
ures
%$
Cos
t(I
nsta
lled)
Cos
tSa
ving
sSa
ving
s$
Savi
ngs
Payb
ack
1G
ener
ator
Bui
ldin
g1
115
0 W
att M
etal
H
alid
e H
igh
Bay
8760
180
0.18
1,57
7$2
23.9
11
Dua
l tec
hnol
ogy
on/o
ff
switc
h pl
us ti
mer
180
0.18
1,57
710
%$2
01.5
2$1
60.0
0$1
60.0
00.
0015
8$2
2.39
17.
15
2G
ener
ator
Bui
ldin
g2
115
0 W
att M
etal
H
alid
e H
igh
200
180
0.36
72$1
0.22
2D
ual t
echn
olog
y on
/off
sw
itch
plus
tim
er18
00.
3672
10%
$9.2
0$1
60.0
0$1
60.0
00.
007
$1.0
2215
6.49
3G
ener
ator
Bui
ldin
g2
28'
2-la
mp
T12
200
126
0.25
50$7
.16
2D
ual t
echn
olog
y on
/off
sw
itch
plus
tim
er12
60.
2550
10%
$6.4
4$1
60.0
0$1
60.0
00.
005
$0.7
1622
3.56
4St
airw
ell
32
4' 2
-lam
p T1
287
6080
0.24
2,10
2$2
98.5
43
Not
App
licab
le0
0.00
00%
$0.0
0$0
.00
$0.0
00.
000
$0.0
000.
00
5St
orag
e R
oom
42
8' 2
-lam
p T1
240
012
60.
5020
2$2
8.63
4D
ual t
echn
olog
y on
/off
sw
itch
plus
tim
er12
60.
5020
210
%$2
5.76
$160
.00
$160
.00
0.00
20$2
.863
55.8
9
6St
orag
e R
oom
24
4' 4
-lam
p T1
210
016
00.
3232
$4.5
42
Dua
l tec
hnol
ogy
on/o
ff
switc
h pl
us ti
mer
160
0.32
3210
%$4
.09
$160
.00
$160
.00
0.00
3$0
.454
352.
11
7G
arag
e2
28'
2-la
mp
T12
200
126
0.25
50$7
.16
2N
ot A
pplic
able
00.
000
0%$0
.00
$0.0
0$0
.00
0.00
0$0
.000
0.00
8Ex
terio
r6
Floo
d Li
ght
3000
150
0.90
2,70
0$3
83.4
06
Phot
ocel
l Con
trol w
ith
Tim
er O
verr
ide
150
0.90
2,70
020
%$3
06.7
2$2
35.0
0$2
50.0
00.
0054
0$7
6.68
03.
26
Tot
als
223.
016,
786
$963
.56
222.
524,
633
$553
.73
$1,0
50.0
00.
0073
3$1
04.1
310
.08
DE
TA
ILE
D L
IGH
TIN
G C
ON
TR
OL
S A
UD
IT
CO
NC
OR
D E
NE
RG
Y S
ER
VIC
ES
CE
G J
ob #
:
SA
VIN
GS
12/2
4/20
09
EC
M #
2: L
ight
ing
Con
trol
s
Proj
ect:
Add
ress
:
Wat
er T
reat
men
t Pla
ntG
ener
ator
Bui
ldin
g
City
:B
uild
ing
SF: