Energy Systems and Technologies for the Coming … · [email protected] Fax +45 46774013 . Contents...
18
Energy Systems and Technologies for the Coming Century Edited by Leif Sønderberg Petersen and Hans Larsen Risø-R-1776(EN) May 2011 Proceedings Risø International Energy Conference 2011, May 10 - 12
Transcript of Energy Systems and Technologies for the Coming … · [email protected] Fax +45 46774013 . Contents...
Energy Systems and Technologies for the Coming Century
Edited by Leif Sønderberg Petersen and Hans LarsenRisø-R-1776(EN) May 2011
Proceedings
Risø International Energy Conference 2011, May 10 - 12
Editors: Leif Sønderberg Petersen and Hans Larsen Title: Energy Systems and Technologies for the coming Century Proceedings. Risø International Energy Conference 2011 Division: Systems Analysis
Risø-R-1776(EN) May 2011
Abstract (max. 2000 char.): Risø International Energy Conference 2011 took place 10 – 12 May 2011. The conference focused on:
Future global energy development options, scenarios and policy issues
Intelligent energy systems of the future, including the interaction between supply and end-use
New and emerging technologies for the extended utilisation of sustainable energy
Distributed energy production technologies such as fuel cells, hydrogen, bioenergy, wind, hydro, wave, solar and geothermal
Centralised energy production technologies such as clean coal technologies, CCS and nuclear
Renewable energy for the transport sector and its integration in the energy system
The proceedings are prepared from papers presented at the conference and received with corrections, if any, until the final deadline on 20-04-2011.
ISBN 978-87-550-3903-2
Information Service Department Risø National Laboratory for Sustainable Energy Technical University of Denmark P.O.Box 49 DK-4000 Roskilde Denmark Telephone +45 46774005 [email protected] Fax +45 46774013 www.risoe.dtu.dk
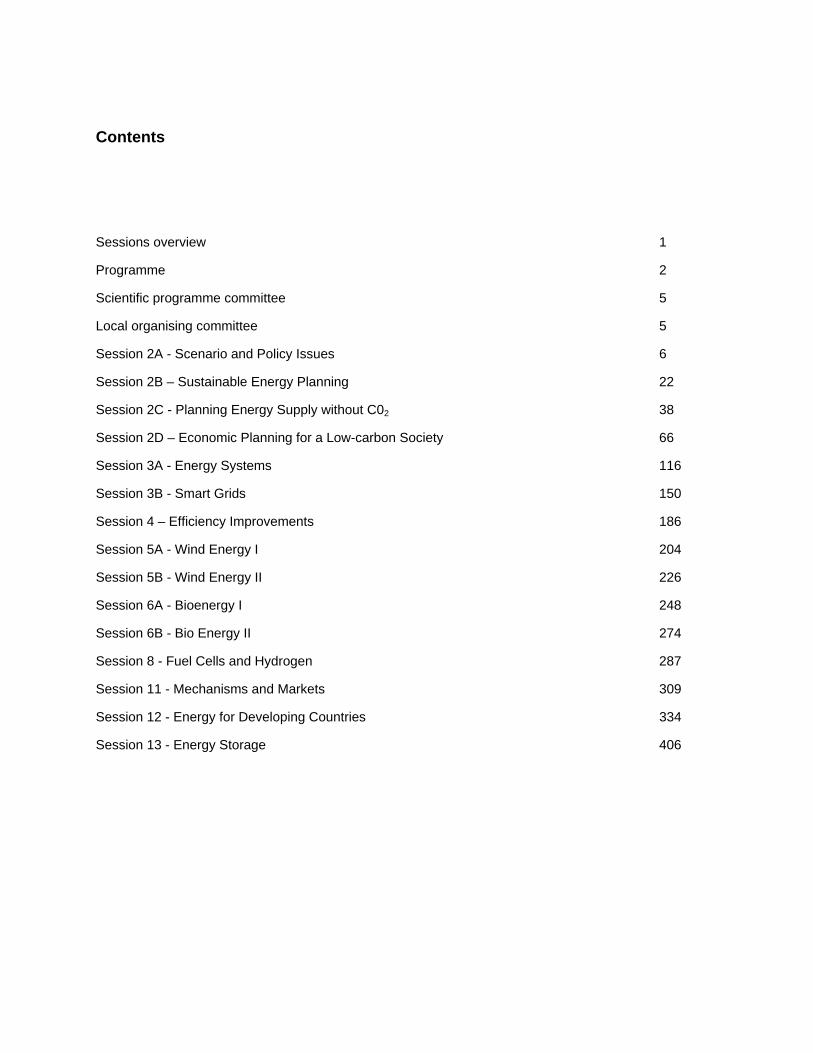
Contents
Sessions overview 1
Programme 2
Scientific programme committee 5
Local organising committee 5
Session 2A - Scenario and Policy Issues 6
Session 2B – Sustainable Energy Planning 22
Session 2C - Planning Energy Supply without C02 38
Session 2D – Economic Planning for a Low-carbon Society 66
Session 3A - Energy Systems 116
Session 3B - Smart Grids 150
Session 4 – Efficiency Improvements 186
Session 5A - Wind Energy I 204
Session 5B - Wind Energy II 226
Session 6A - Bioenergy I 248
Session 6B - Bio Energy II 274
Session 8 - Fuel Cells and Hydrogen 287
Session 11 - Mechanisms and Markets 309
Session 12 - Energy for Developing Countries 334
Session 13 - Energy Storage 406

Preface
Risø International Energy Conference 2011, 10-12 May 2011
Energy systems and technologies for the coming century
The world faces a major challenge as global CO2 emissions must be reduced dramatically, in the long term even below zero, in order to limit climate change. At the same time, however, it is necessary to provide energy services to accommodate economic growth and, in particular, to meet the growing needs of the developing countries and to ensure secure energy supplies.
Furthermore, the energy sector has to cope with the current financial crisis which is having a significant impact on almost all countries.
Therefore, significant changes to the global energy systems are necessary, which calls for long-term planning. There is a pressing need to enhance the ongoing development of new and sustainable energy technologies which can provide a key role for renewable energy resources and lead to the phase-out of fossil fuels in the long term.
New, intelligent energy systems are necessary in order to accommodate fluctuating sustainable energy resources to a much greater extent than is currently the case. In such an intelligent energy system, a close link between end-use and supply must be established to create links between low-energy housing, industry and the transport sector.
It will be necessary to utilise all sustainable energy technologies to meet future global energy needs. No single technology will be able to solve the task. The combination of energy technologies will vary from one region to another, depending on local conditions.
Fossil energy resources will, to a large extent, continue to be used in the coming decade, and for this reason it is important that more efficient and climate-friendly fossil energy applications are developed until renewables can assume a leading role in global energy supplies.
Risø International Energy Conference 2011 highlighted and discussed these topics with the aim of identifying solutions which can fulfil the urgent global need to change energy technologies in a sustainable direction and create the new intelligent energy systems that can accommodate substantial amounts of fluctuating, sustainable energy.
The conference was sponsored by:

4 5
TUesDay 10 may 2011 weDnesDay 11 may 2011 ThURsDay 12 may 2011
08:00-09:00coffee anD RegisTRaTion
Room niels bohr auditorium main hall Room niels bohr auditorium h. h. Koch auditorium Room niels bohr auditorium h. h. Koch auditorium
09:00-10:30 oPEning sEssion 09:00-10:30sEssion 5awinD eneRgy i
sEssion 2cplanning eneRgy sUpply wiThoUT c02
09:00-10:30sEssion 11mechanisms anD maRKeTs
sEssion 12eneRgy foR Developing coUnTRies
10:30-11:00 bReaK 10:30-11:00 bReaK 10:30-11:00 bReaK
11:00-12:30sEssion 2ascenaRio anD policy issUes
11:00-12:30sEssion 6abioeneRgy i
sEssion 3BsmaRT gRiDs
11:00-12:30sEssion 13eneRgy sToRage
sEssion 2deconomic planning foR a low-caRbon socieTy
12:30-14:00lUnch in h.h. Koch
auditorium
PostEr sEssion
12:30-13:30 lUnch in main hall 12:30-13:00 sUmmaRy anD closing RemaRKs
14:00-15:30sEssion 3aeneRgy sysTems
13:30-15:00sEssion 8fUel cells anD hyDRogen
sEssion 5BwinD eneRgy ii
13:00-14:00 lUnch in main hall
15:30-16:00 bReaK 15:00-15:30 bReaK
16:00-17:30sEssion 4efficiency impRovemenTs
15:30-17:00sEssion 2BsUsTainable eneRgy planning
sEssion 6Bbio eneRgy ii
17:30-18:30 RecepTion 17:00-18:00 bReaK19:00-10:00 confeRence DinneR aT nimb in Tivoli
sEssions ovErviEW
Risø International Energy Conference 2011 Proceedings Page 1
lepe
Rectangle
lepe
Rectangle

Session 11 - Mechanisms and Markets
Risø International Energy Conference 2011 Proceedings Page 309
On the effectiveness of standards vs taxes for reducing CO2 emissions in passenger car transport Europe
Amela AJANOVIC, Reinhard HAAS
Energy Economics Group, Vienna University of Technology, Austria
E-mail: [email protected]
Abstract The current problems arising from motorized individual transport lead to an urgent need for implementing efficient policy measures. To get a reliable appraisal of the effects of different types of policies it is very important to know the impact of different parameters like prices and fuel intensities. Of special relevance in this context is how consumer behaviour and the rebound affect especially technical measures like standards for fuel intensity.
The core objective of this paper is to analyse the impact of taxes and fuel intensity standards on overall energy demand for car passenger transport in fifteen EU countries.
The method of approach is based on econometric analysis of EU-15 countries over the period 1980 to 2007. We analyses energy consumption (e.g. litre of gasoline and diesel) as well as service demand (vehicle km driven). The effects of irreversible efficiency improvements are considered by means of using fuel intensities explicitly in the econometric analyses.
The major results of this investigation are: The service price elasticity is about -0.3 for the aggregate of the investigated countries. The effect of energy efficiency improvements is about 0.7. This is a very nice result indicating that: (i) price increases e.g. due to taxes (of 1%) lead to energy demand reductions of 0.3% in the sort run; (ii) pure efficiency increases (of 1%), e.g. by standards trigger savings of 0.7% (either due to standards or due to lasting price increases).
The major conclusion for energy policy makers is that the most effective set of measure is to introduce a combined system of taxes (to reduce CO2 emissions due to less driving) and technical standards (to reduce CO2 emissions due to lower fuel intensities).
1 Introduction The current problems arising from motorized individual transport lead to an urgent need for implementing efficient policy measures. To get a reliable appraisal of the effects of different types of policies it is very important to know the impact of different parameters like prices and fuel intensities. Of special relevance in this context is how consumer behaviour and the rebound affect especially technical measures like standards for fuel intensity.
One of the most heavily discussed policy issues for passenger car transport is what is more effective and more acceptable by people especially car drivers: taxes or standards.
The EU currently puts all stacks on standards, see Section 2.
In this paper we analyse the impact of taxes and fuel intensity standards on overall energy demand for car passenger transport in EU-15 and how a tax vs standard works. We pay special attention to the interactions between price and efficiency changes and investigate the crucial role of service price elasticity.
Risø International Energy Conference 2011 Proceedings Page 310
Finally, we try to identify a best practice policy for EU-15 which combines (national) taxes and (EU-wide) standards.
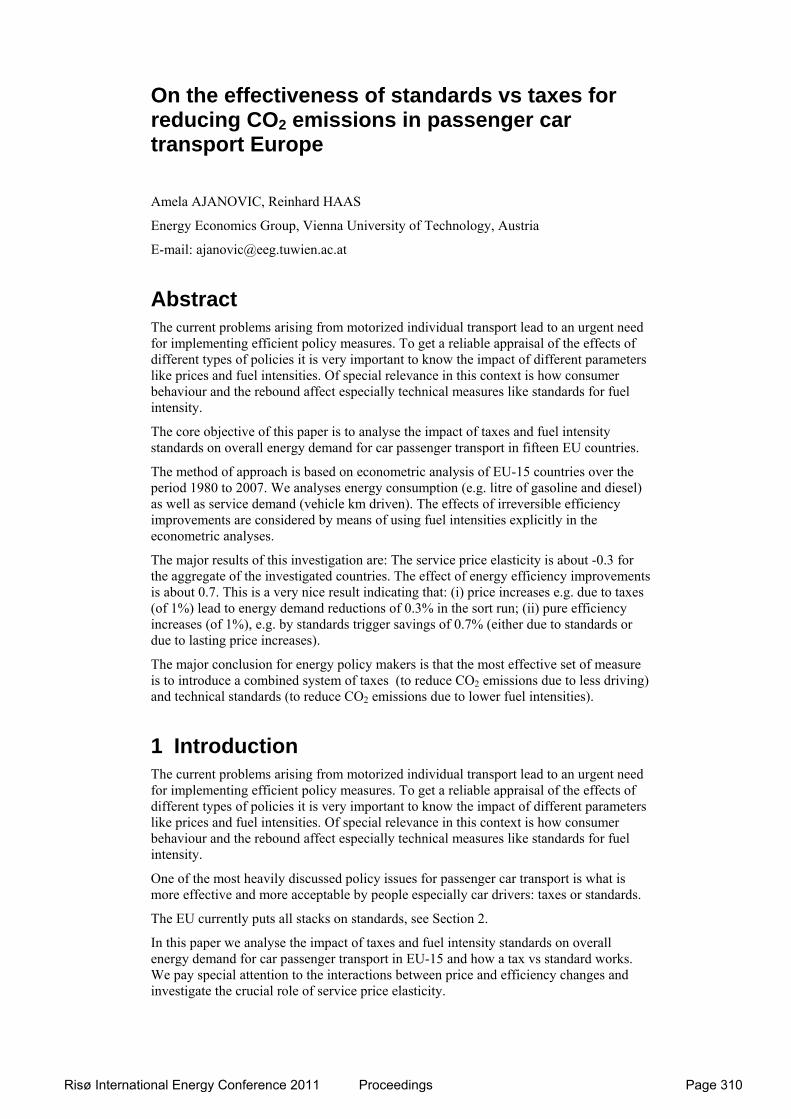
How does a tax work in comparison to a standard?
Ps
η0
η1
E
Tax
Psτ
Psη
ΔEη
ΔEE0
Figure 1. How a tax vs a standard works
Figure 1 depicts the principle of changes in efficiency, energy consumption and service price. For a tax the reduction in energy consumption ΔE results from higher service price Psτ remaining on the same curve η0. When a standard is implemented we switch from η0 to η1 leading to a reduction ΔE of energy consumption. Yet, due to a lower service price Psη this saving effect is lower than the theoretical effect which is ΔEη.
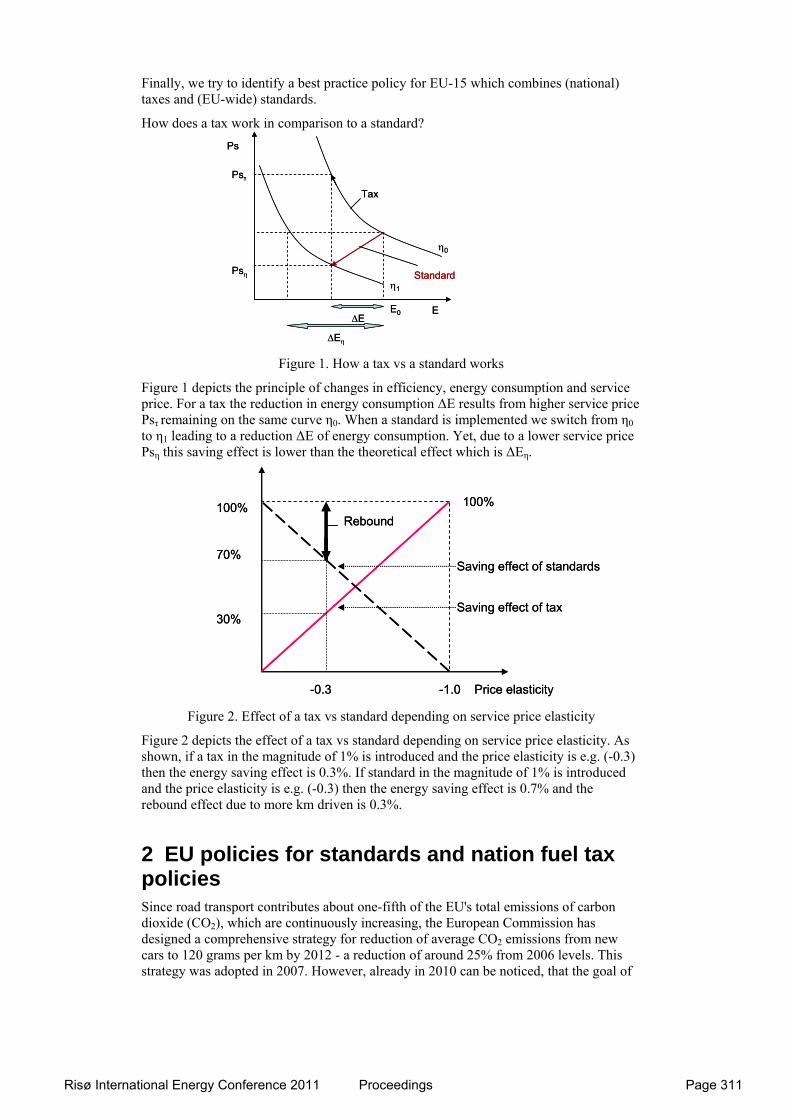
Figure 2. Effect of a tax vs standard depending on service price elasticity
Figure 2 depicts the effect of a tax vs standard depending on service price elasticity. As shown, if a tax in the magnitude of 1% is introduced and the price elasticity is e.g. (-0.3) then the energy saving effect is 0.3%. If standard in the magnitude of 1% is introduced and the price elasticity is e.g. (-0.3) then the energy saving effect is 0.7% and the rebound effect due to more km driven is 0.3%.
2 EU policies for standards and nation fuel tax policies Since road transport contributes about one-fifth of the EU's total emissions of carbon dioxide (CO2), which are continuously increasing, the European Commission has designed a comprehensive strategy for reduction of average CO2 emissions from new cars to 120 grams per km by 2012 - a reduction of around 25% from 2006 levels. This strategy was adopted in 2007. However, already in 2010 can be noticed, that the goal of
Standard
Ps
η0
η1
E
Tax
Psτ
Psη
ΔEη
ΔEE0
Standard
Price elasticity-0.3 -1.0
100%100%
30%
70%
Saving effect of tax
Saving effect of standards
Rebound
Price elasticity-0.3 -1.0
100%100%
30%
70%
Saving effect of tax
Saving effect of standards
Rebound
Risø International Energy Conference 2011 Proceedings Page 311
reducing new car emissions to 120 g CO2/km by 2012, as defined in the strategy, is not likely to be achieved.
Despite a low probability of achieving the 2012 target, the strategy, and the measures it includes, has played an important role in reducing CO2 emissions from light-duty vehicles.
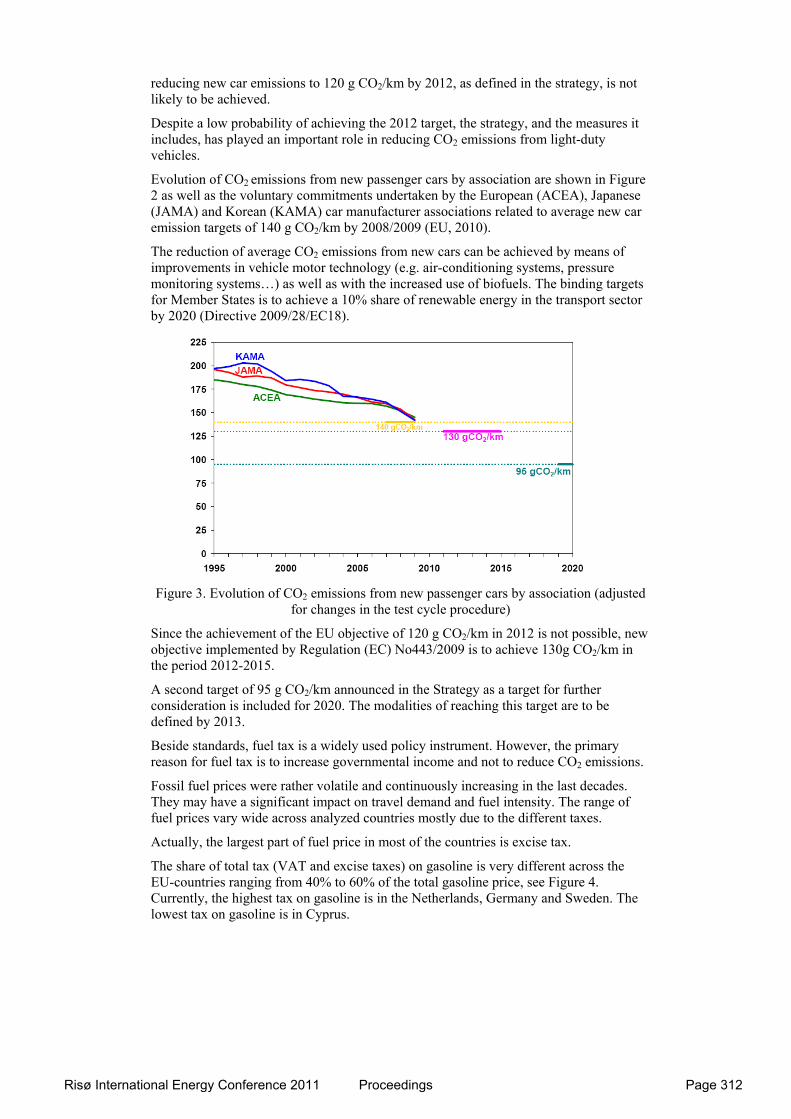
Evolution of CO2 emissions from new passenger cars by association are shown in Figure 2 as well as the voluntary commitments undertaken by the European (ACEA), Japanese (JAMA) and Korean (KAMA) car manufacturer associations related to average new car emission targets of 140 g CO2/km by 2008/2009 (EU, 2010).
The reduction of average CO2 emissions from new cars can be achieved by means of improvements in vehicle motor technology (e.g. air-conditioning systems, pressure monitoring systems…) as well as with the increased use of biofuels. The binding targets for Member States is to achieve a 10% share of renewable energy in the transport sector by 2020 (Directive 2009/28/EC18).
Figure 3. Evolution of CO2 emissions from new passenger cars by association (adjusted for changes in the test cycle procedure)
Since the achievement of the EU objective of 120 g CO2/km in 2012 is not possible, new objective implemented by Regulation (EC) No443/2009 is to achieve 130g CO2/km in the period 2012-2015.
A second target of 95 g CO2/km announced in the Strategy as a target for further consideration is included for 2020. The modalities of reaching this target are to be defined by 2013.
Beside standards, fuel tax is a widely used policy instrument. However, the primary reason for fuel tax is to increase governmental income and not to reduce CO2 emissions.
Fossil fuel prices were rather volatile and continuously increasing in the last decades. They may have a significant impact on travel demand and fuel intensity. The range of fuel prices vary wide across analyzed countries mostly due to the different taxes.
Actually, the largest part of fuel price in most of the countries is excise tax.
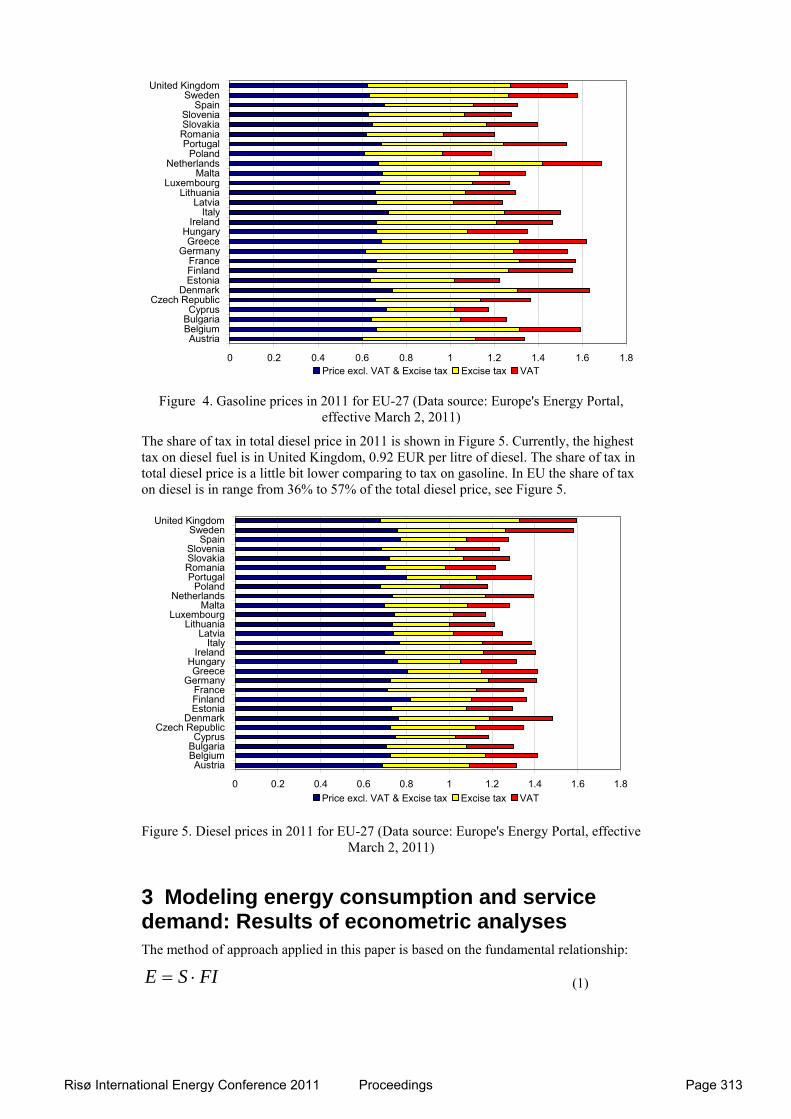
The share of total tax (VAT and excise taxes) on gasoline is very different across the EU-countries ranging from 40% to 60% of the total gasoline price, see Figure 4. Currently, the highest tax on gasoline is in the Netherlands, Germany and Sweden. The lowest tax on gasoline is in Cyprus.
Risø International Energy Conference 2011 Proceedings Page 312
0 0.2 0.4 0.6 0.8 1 1.2 1.4 1.6 1.8
Austria Belgium Bulgaria Cyprus
Czech Republic Denmark
Estonia Finland France
Germany Greece
Hungary Ireland
Italy Latvia
Lithuania Luxembourg
Malta Netherlands
Poland Portugal
Romania Slovakia Slovenia
Spain Sweden
United Kingdom
Price excl. VAT & Excise tax Excise tax VAT
Figure 4. Gasoline prices in 2011 for EU-27 (Data source: Europe's Energy Portal, effective March 2, 2011)
The share of tax in total diesel price in 2011 is shown in Figure 5. Currently, the highest tax on diesel fuel is in United Kingdom, 0.92 EUR per litre of diesel. The share of tax in total diesel price is a little bit lower comparing to tax on gasoline. In EU the share of tax on diesel is in range from 36% to 57% of the total diesel price, see Figure 5.
0 0.2 0.4 0.6 0.8 1 1.2 1.4 1.6 1.8
Austria Belgium Bulgaria Cyprus
Czech Republic Denmark
Estonia Finland France
Germany Greece
Hungary Ireland
Italy Latvia
Lithuania Luxembourg
Malta Netherlands
Poland Portugal
Romania Slovakia Slovenia
Spain Sweden
United Kingdom
Price excl. VAT & Excise tax Excise tax VAT
Figure 5. Diesel prices in 2011 for EU-27 (Data source: Europe's Energy Portal, effective March 2, 2011)
3 Modeling energy consumption and service demand: Results of econometric analyses The method of approach applied in this paper is based on the fundamental relationship:
FISE ⋅= (1)
Risø International Energy Conference 2011 Proceedings Page 313
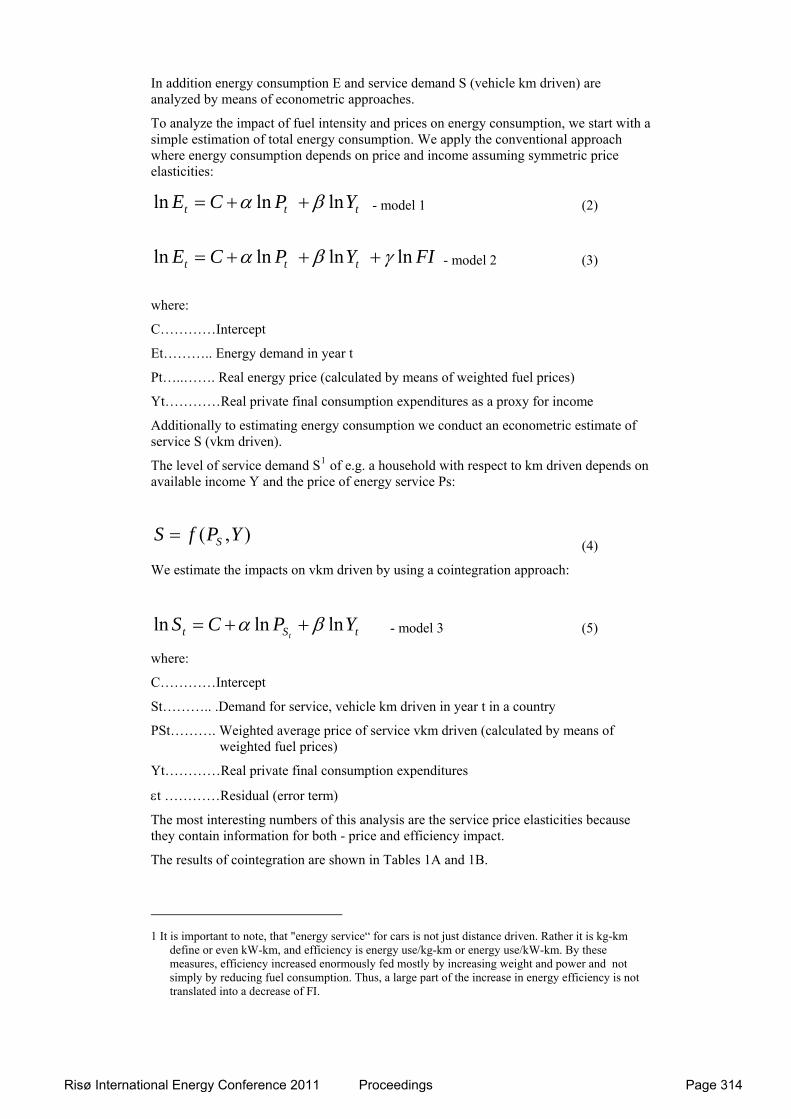
In addition energy consumption E and service demand S (vehicle km driven) are analyzed by means of econometric approaches.
To analyze the impact of fuel intensity and prices on energy consumption, we start with a simple estimation of total energy consumption. We apply the conventional approach where energy consumption depends on price and income assuming symmetric price elasticities:
ttt YPCE lnlnln βα ++= - model 1 (2)
FIYPCE ttt lnlnlnln γβα +++= - model 2 (3)
where:
C…………Intercept
Et……….. Energy demand in year t
Pt…..……. Real energy price (calculated by means of weighted fuel prices)
Yt…………Real private final consumption expenditures as a proxy for income
Additionally to estimating energy consumption we conduct an econometric estimate of service S (vkm driven).
The level of service demand S1 of e.g. a household with respect to km driven depends on available income Y and the price of energy service Ps:
),( YPfS S= (4)
We estimate the impacts on vkm driven by using a cointegration approach:
tSt YPCSt
lnlnln βα ++= - model 3 (5)
where:
C…………Intercept
St……….. .Demand for service, vehicle km driven in year t in a country
PSt………. Weighted average price of service vkm driven (calculated by means of weighted fuel prices)
Yt…………Real private final consumption expenditures
εt …………Residual (error term)
The most interesting numbers of this analysis are the service price elasticities because they contain information for both - price and efficiency impact.
The results of cointegration are shown in Tables 1A and 1B.
1 It is important to note, that "energy service“ for cars is not just distance driven. Rather it is kg-km
define or even kW-km, and efficiency is energy use/kg-km or energy use/kW-km. By these measures, efficiency increased enormously fed mostly by increasing weight and power and not simply by reducing fuel consumption. Thus, a large part of the increase in energy efficiency is not translated into a decrease of FI.
Risø International Energy Conference 2011 Proceedings Page 314
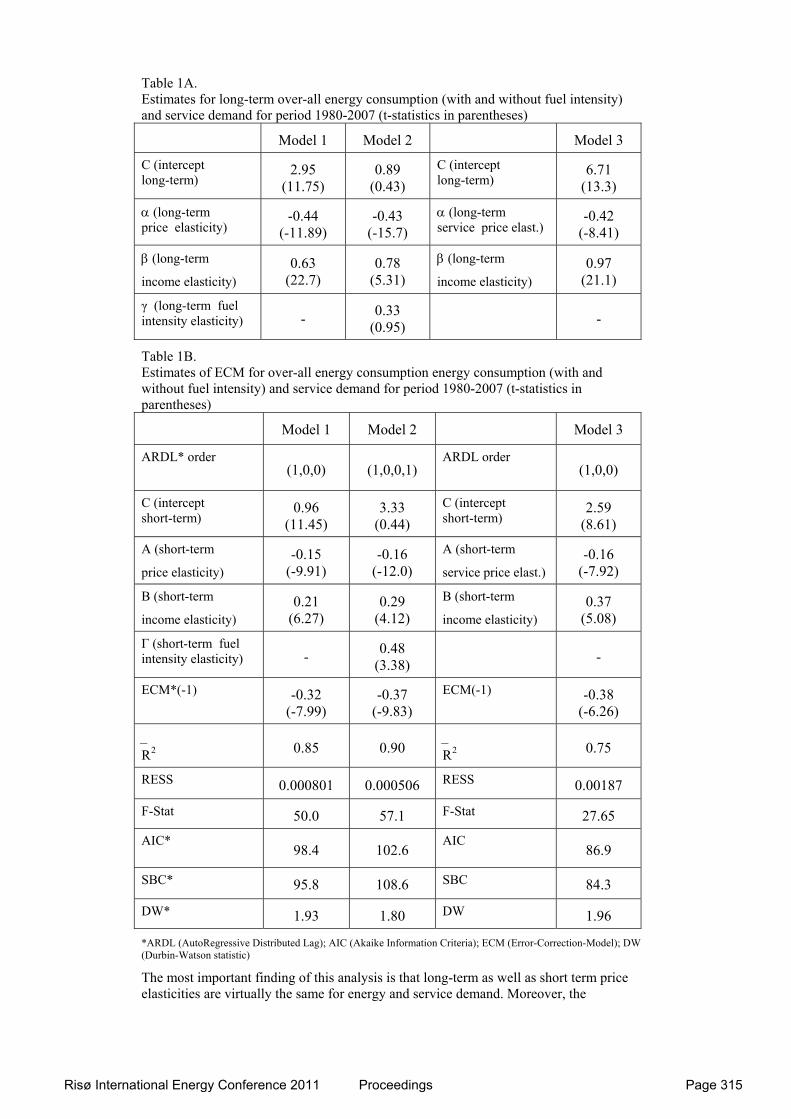
Table 1A. Estimates for long-term over-all energy consumption (with and without fuel intensity) and service demand for period 1980-2007 (t-statistics in parentheses)
Model 1 Model 2 Model 3
C (intercept long-term)
2.95 (11.75)
0.89 (0.43)
C (intercept long-term)
6.71 (13.3)
α (long-term price elasticity)
-0.44 (-11.89)
-0.43 (-15.7)
α (long-term service price elast.)
-0.42 (-8.41)
β (long-term
income elasticity) 0.63
(22.7) 0.78
(5.31) β (long-term
income elasticity) 0.97
(21.1)
γ (long-term fuel intensity elasticity) - 0.33
(0.95)
-
Table 1B. Estimates of ECM for over-all energy consumption energy consumption (with and without fuel intensity) and service demand for period 1980-2007 (t-statistics in parentheses)
Model 1 Model 2 Model 3
ARDL* order (1,0,0) (1,0,0,1)
ARDL order (1,0,0)
C (intercept short-term)
0.96 (11.45)
3.33 (0.44)
C (intercept short-term)
2.59 (8.61)
A (short-term
price elasticity) -0.15
(-9.91) -0.16
(-12.0) A (short-term
service price elast.) -0.16
(-7.92)
B (short-term
income elasticity) 0.21
(6.27) 0.29
(4.12) B (short-term
income elasticity) 0.37
(5.08)
Г (short-term fuel intensity elasticity) - 0.48
(3.38)
-
ECM*(-1) -0.32 (-7.99)
-0.37 (-9.83)
ECM(-1) -0.38 (-6.26)
R2_
0.85 0.90 R2_
0.75
RESS 0.000801 0.000506 RESS 0.00187
F-Stat 50.0 57.1 F-Stat 27.65
AIC* 98.4 102.6
AIC 86.9
SBC* 95.8 108.6 SBC 84.3
DW* 1.93 1.80 DW 1.96
*ARDL (AutoRegressive Distributed Lag); AIC (Akaike Information Criteria); ECM (Error-Correction-Model); DW (Durbin-Watson statistic)
The most important finding of this analysis is that long-term as well as short term price elasticities are virtually the same for energy and service demand. Moreover, the
Risø International Energy Conference 2011 Proceedings Page 315
coefficient γ for the impact of fuel intensity in Model 2 is not significant. These results indicate that there is no long-term – no irreversible – impact of changes in efficiency and virtually all theoretically calculated energy saving due to efficiency improvements are eaten up by a rebound e.g. due to the larger cars and more km driven.
This rebound is analysed in the next section.
4 Interaction of taxes and standards In this section we analyze the impacts of changes in fuel intensity – due to standards vs changes in fuel prices – due to taxes on energy consumption. This is important to derive conclusions with respect to the effect of the implementation of standards for fuel intensity vs the effect of the introduction of fuel taxes increasing fuel prices.
One of the most critically discussed issues with respect to the implementation of standards for fuel intensity or corresponding CO2 emissions is the rebound effect.
In the following, we conduct an estimation of the following effects: (i) the effect of changes in fuel intensity due to standards including a saving effect and a rebound effect because of increases in vehicle km driven and (ii) the price effect.
The definition of service demand S in equ. (4) can be extended to:
βαYFIPCYFIPfS )(),( ⋅=⋅= (6)
Using derivations the change in service demand (dS) can be split up into the price, the efficiency and the income effects:
dYY
fdFI
FI
fdP
P
fdS
∂∂
+∂∂
+∂∂
= (7)
In this paper we are further on interested in the change of service demand due to a change in the fuel price and the fuel intensity. We do not look at the income effect.
We proceed further using equ. (1)2 and we obtain for the change in energy consumption:
FIdSSdFIdE += (8)
The change with respect to price is:
dP
FIdS
dP
SdFI
dP
dE+=
(9)
The change in energy demand (if dFI/dP=0)3 due to the direct price effect is:
dP
FIdS
dP
dE= (10)
The change in service demand vehicle km driven caused by the price effect and using equ. (6) is:
2 See also the detailed derivation in Ajanovic/Haas (2011)
3 In the long run, lasting price changes will have an impact see e.g. Walker/Wirl (1993).
Risø International Energy Conference 2011 Proceedings Page 316
P
S
P
PFIFIP
P
f
dP
dS αα α ==∂∂
= −1)( (11)
where α is the elasticity of vehicle kilometres driven with respect to service price Ps.
Straightforward, the change in energy demand due to a change in the fuel price is:
P
SFI
dP
dSFI
dP
dE α== (12)
and the total energy change from a price change with dP=f(τ) (τ…tax) is:
P
dPSFIdPdE α=)(
(13)
Next we analyse the effect of an exogenous fuel intensity change with dFI=f(η) (η…standard):
)1()( 1 +=+=+= − αα α SSPFIPFIdFI
dFIS
dFI
dSFI
dFI
dE
(14)
and the total energy change from a change in FI is:
SdFISdFIdFISdFIdE αα +=+= )1()( (15)
Introducing the fuel intensity savings factor γ we can rewrite equ. (15) as:
SdFIdFIdE γ=)( (16)
and we obtain for the relationship between the impact of fuel intensity and price (see also Walker/Wirl (1993) and Greene (1997)):
αγ +=1 (17)
This relationship can be illustrated by the following simple example. If the short-term price elasticity is (-0.3) resulting elasticity for fuel intensity γ is (1+(-0.3))=0.7. That is to say, if fuel intensity is decreased by e.g.10% due to a standard, the energy savings are only 7% because of a rebound in service demand due to the price elasticity of -0.3!
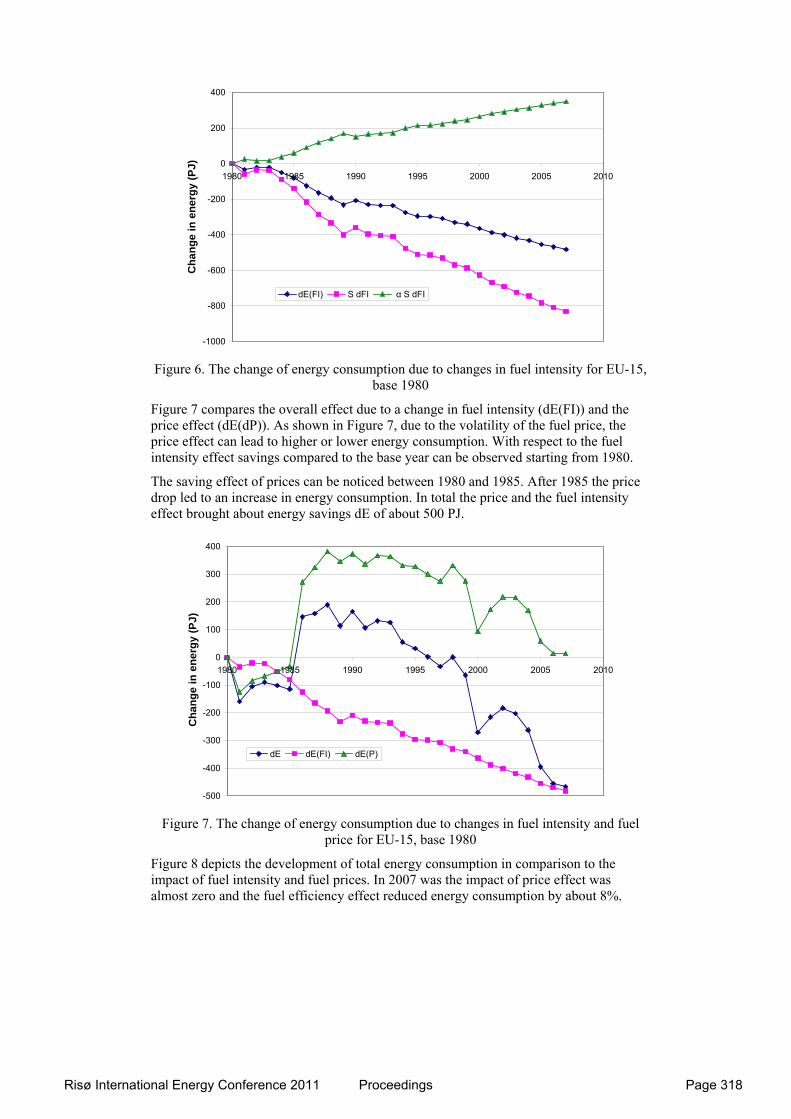
Figure 6 shows the two effects due to changes in fuel intensity from equ. (15). The first effect is change in demand from driving more fuel efficient vehicles the same number of miles (SdFI). It can be noticed that the total change in FI led to total energy savings dE(dFI) of about 500 PJ in EU-15. The second effect is the energy change from driving more kilometers, (α S dFI) called the rebound effect. The rebound effect led to an additional energy consumption of about 350 PJ.
Risø International Energy Conference 2011 Proceedings Page 317
-1000
-800
-600
-400
-200
0
200
400
1980 1985 1990 1995 2000 2005 2010
Ch
an
ge
in e
ne
rgy
(PJ
)
dE(FI) S dFI α S dFI
Figure 6. The change of energy consumption due to changes in fuel intensity for EU-15,
base 1980
Figure 7 compares the overall effect due to a change in fuel intensity (dE(FI)) and the price effect (dE(dP)). As shown in Figure 7, due to the volatility of the fuel price, the price effect can lead to higher or lower energy consumption. With respect to the fuel intensity effect savings compared to the base year can be observed starting from 1980.
The saving effect of prices can be noticed between 1980 and 1985. After 1985 the price drop led to an increase in energy consumption. In total the price and the fuel intensity effect brought about energy savings dE of about 500 PJ.
-500
-400
-300
-200
-100
0
100
200
300
400
1980 1985 1990 1995 2000 2005 2010
Ch
ang
e in
en
erg
y (P
J)
dE dE(FI) dE(P)
Figure 7. The change of energy consumption due to changes in fuel intensity and fuel
price for EU-15, base 1980
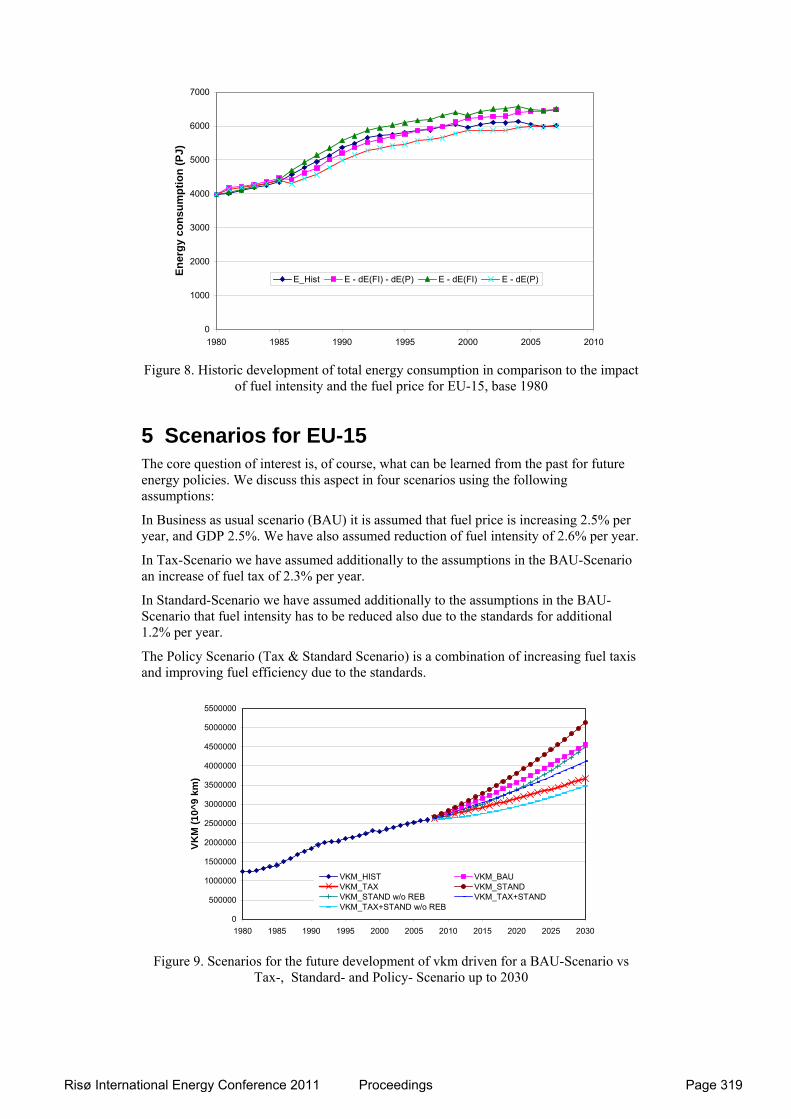
Figure 8 depicts the development of total energy consumption in comparison to the impact of fuel intensity and fuel prices. In 2007 was the impact of price effect was almost zero and the fuel efficiency effect reduced energy consumption by about 8%.
Risø International Energy Conference 2011 Proceedings Page 318
0
1000
2000
3000
4000
5000
6000
7000
1980 1985 1990 1995 2000 2005 2010
En
erg
y c
on
su
mp
tio
n (
PJ
)
E_Hist E - dE(FI) - dE(P) E - dE(FI) E - dE(P)
Figure 8. Historic development of total energy consumption in comparison to the impact
of fuel intensity and the fuel price for EU-15, base 1980
5 Scenarios for EU-15 The core question of interest is, of course, what can be learned from the past for future energy policies. We discuss this aspect in four scenarios using the following assumptions:
In Business as usual scenario (BAU) it is assumed that fuel price is increasing 2.5% per year, and GDP 2.5%. We have also assumed reduction of fuel intensity of 2.6% per year.
In Tax-Scenario we have assumed additionally to the assumptions in the BAU-Scenario an increase of fuel tax of 2.3% per year.
In Standard-Scenario we have assumed additionally to the assumptions in the BAU-Scenario that fuel intensity has to be reduced also due to the standards for additional 1.2% per year.
The Policy Scenario (Tax & Standard Scenario) is a combination of increasing fuel taxis and improving fuel efficiency due to the standards.
0
500000
1000000
1500000
2000000
2500000
3000000
3500000
4000000
4500000
5000000
5500000
1980 1985 1990 1995 2000 2005 2010 2015 2020 2025 2030
VK
M (
10^
9 km
)
VKM_HIST VKM_BAUVKM_TAX VKM_STANDVKM_STAND w/o REB VKM_TAX+STANDVKM_TAX+STAND w/o REB
Figure 9. Scenarios for the future development of vkm driven for a BAU-Scenario vs
Tax-, Standard- and Policy- Scenario up to 2030
Risø International Energy Conference 2011 Proceedings Page 319
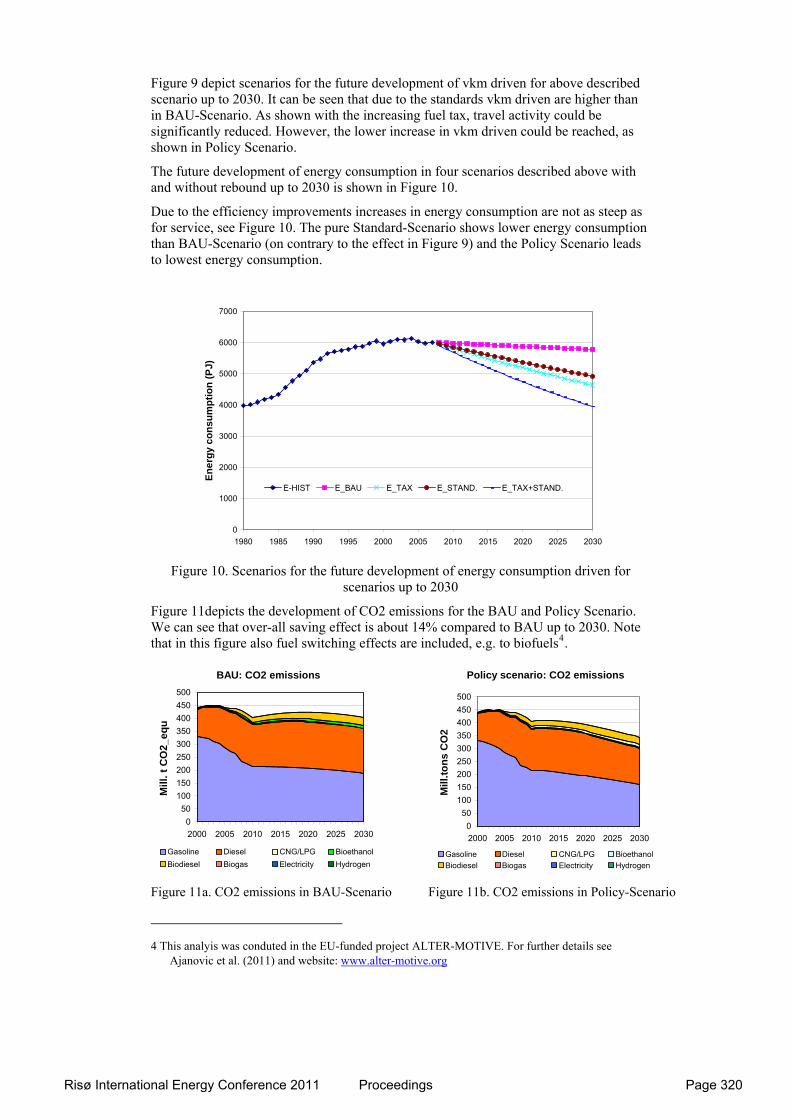
Figure 9 depict scenarios for the future development of vkm driven for above described scenario up to 2030. It can be seen that due to the standards vkm driven are higher than in BAU-Scenario. As shown with the increasing fuel tax, travel activity could be significantly reduced. However, the lower increase in vkm driven could be reached, as shown in Policy Scenario.
The future development of energy consumption in four scenarios described above with and without rebound up to 2030 is shown in Figure 10.
Due to the efficiency improvements increases in energy consumption are not as steep as for service, see Figure 10. The pure Standard-Scenario shows lower energy consumption than BAU-Scenario (on contrary to the effect in Figure 9) and the Policy Scenario leads to lowest energy consumption.
0
1000
2000
3000
4000
5000
6000
7000
1980 1985 1990 1995 2000 2005 2010 2015 2020 2025 2030
En
erg
y c
on
su
mp
tio
n (
PJ)
E-HIST E_BAU E_TAX E_STAND. E_TAX+STAND.
Figure 10. Scenarios for the future development of energy consumption driven for
scenarios up to 2030
Figure 11depicts the development of CO2 emissions for the BAU and Policy Scenario. We can see that over-all saving effect is about 14% compared to BAU up to 2030. Note that in this figure also fuel switching effects are included, e.g. to biofuels4.
BAU: CO2 emissions
050
100150200250300350400450500
2000 2005 2010 2015 2020 2025 2030
Mil
l. t
CO
2_e
qu
Gasoline Diesel CNG/LPG BioethanolBiodiesel Biogas Electricity Hydrogen
Policy scenario: CO2 emissions
050
100150200250300350400450500
2000 2005 2010 2015 2020 2025 2030
Mill
.to
ns
CO
2
Gasoline Diesel CNG/LPG BioethanolBiodiesel Biogas Electricity Hydrogen
Figure 11a. CO2 emissions in BAU-Scenario Figure 11b. CO2 emissions in Policy-Scenario
4 This analyis was conduted in the EU-funded project ALTER-MOTIVE. For further details see
Ajanovic et al. (2011) and website: www.alter-motive.org
Risø International Energy Conference 2011 Proceedings Page 320
6 Conclusions The major conclusions of this analysis are:
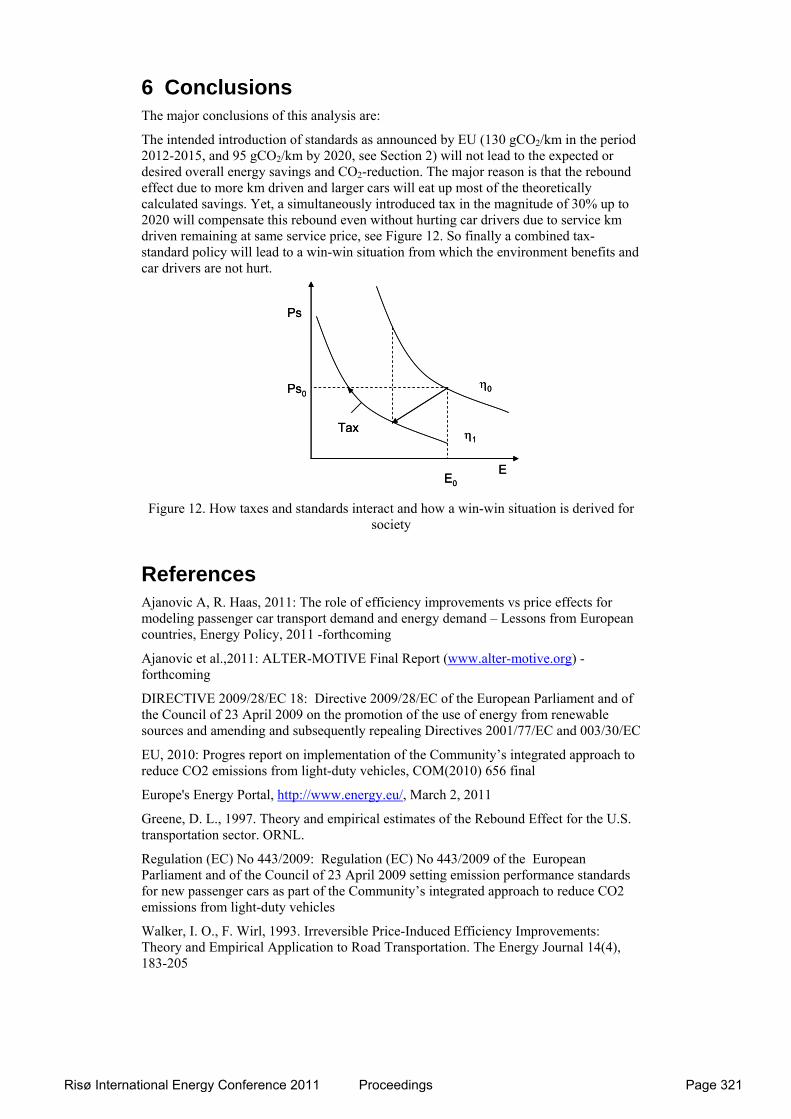
The intended introduction of standards as announced by EU (130 gCO2/km in the period 2012-2015, and 95 gCO2/km by 2020, see Section 2) will not lead to the expected or desired overall energy savings and CO2-reduction. The major reason is that the rebound effect due to more km driven and larger cars will eat up most of the theoretically calculated savings. Yet, a simultaneously introduced tax in the magnitude of 30% up to 2020 will compensate this rebound even without hurting car drivers due to service km driven remaining at same service price, see Figure 12. So finally a combined tax-standard policy will lead to a win-win situation from which the environment benefits and car drivers are not hurt.
Ps
η0
η1
E
Tax
E0
Ps0
Ps
η0
η1
E
Tax
E0
Ps0
Figure 12. How taxes and standards interact and how a win-win situation is derived for society
References Ajanovic A, R. Haas, 2011: The role of efficiency improvements vs price effects for modeling passenger car transport demand and energy demand – Lessons from European countries, Energy Policy, 2011 -forthcoming
Ajanovic et al.,2011: ALTER-MOTIVE Final Report (www.alter-motive.org) - forthcoming
DIRECTIVE 2009/28/EC 18: Directive 2009/28/EC of the European Parliament and of the Council of 23 April 2009 on the promotion of the use of energy from renewable sources and amending and subsequently repealing Directives 2001/77/EC and 003/30/EC
EU, 2010: Progres report on implementation of the Community’s integrated approach to reduce CO2 emissions from light-duty vehicles, COM(2010) 656 final
Europe's Energy Portal, http://www.energy.eu/, March 2, 2011
Greene, D. L., 1997. Theory and empirical estimates of the Rebound Effect for the U.S. transportation sector. ORNL.
Regulation (EC) No 443/2009: Regulation (EC) No 443/2009 of the European Parliament and of the Council of 23 April 2009 setting emission performance standards for new passenger cars as part of the Community’s integrated approach to reduce CO2 emissions from light-duty vehicles
Walker, I. O., F. Wirl, 1993. Irreversible Price-Induced Efficiency Improvements: Theory and Empirical Application to Road Transportation. The Energy Journal 14(4), 183-205
Risø International Energy Conference 2011 Proceedings Page 321