
Energy Supply Association of Australiaelectricvehiclecouncil.com.au/wp-content/uploads/... ·...
56
Energy Supply Association of Australia Sparking an Electric Vehicle Debate in Australia Discussion Paper November 2013
Transcript of Energy Supply Association of Australiaelectricvehiclecouncil.com.au/wp-content/uploads/... ·...

Energy Supply Association of Australia
Sparking an Electric Vehicle Debate in Australia
Discussion Paper November 2013

iii Sparking an Electric Vehicle Debate in Australia

Sparking an Electric Vehicle Debate in Australia 1
Contents
Executive Summary 2
1 Introducing the electric car 8
1.1 How they work 8
1.2 History of electric vehicles 8
1.3 Lessons from the leading markets for electric vehicles 9
1.4 Plug-in electric vehicle market development 10
1.5 The California experiment 13
1.6 The Tesla effect? 14
2 The Australian market for electric vehicles 16
2.1 The experience of hybrid petrol-electric cars in Australia 16
2.2 Electric vehicle forecasts in Australia 17
2.3 Industry expectations for the Australian electric vehicle market 21
3 The pros and cons of electric vehicles? 23
3.1 Benefits of an electric vehicle 23
3.2 Barriers facing electric vehicles 26
4 A role for government? The strategic benefits of electric cars 32
4.1 Pollution and greenhouse emissions 32
4.2 More efficient use of energy networks 32
4.3 Energy security and terms of trade 33
5 Unlocking the potential for electric vehicles 34
5.1 Changing the perceptions of electric vehicles 34
5.2 Partnerships on the road to electric vehicles 34
5.3 Who are the key target customers? 35
6 Policy enablers for electric vehicles 37
6.1 Price and cost enablers 38
6.2 Charge time and availability enablers 40
6.3 Other enablers 40
Appendix A: International electric vehicle uptake 42
Appendix B: Electric vehicle charging specifications 44
Appendix C: Mapping EV suburbs 45
2 Sparking an Electric Vehicle Debate in Australia
Executive Summary
Introduction
Cars defined the 20th century. The development, mass production
and mass consumption of the car changed human society. It shaped
the wars that were fought, the way cities developed and how people
and goods were moved around. It spawned a vast network of roads
that span continents and that still define most urban centres.
The legacy of this infrastructure is immense. It means that as we
look to alternative technologies to fuel more than a billion cars and
trucks on the world’s roads, the most efficient transport solutions
are more likely to re-power these vehicles rather than replace them.
Internal combustion engines (ICE) have been used for the past
century to power most cars and other transport vehicles. But the
era of the ICE may be approaching its twilight. The move to look
beyond petrol and diesel engine cars is being driven by a range
of factors: energy security and questions over the adequacy of
oil reserves, the cost of petroleum fuels and the international
cartels that attempt to control the price and the need to reduce
greenhouse gas and pollutant emissions from transport vehicles.
This paper explores the potential of plug-in electric vehicles (EV) to
contribute to the transformation of transport vehicles in Australia.
A second paper will consider the potential for natural gas vehicles.
In Australia these energy systems have the additional advantages
of an existing indigenous supply and established distribution
networks. Transforming the 16.6 million vehicles that comprise
Australia’s transport fleet1 will take time and require appropriate
policy settings. This paper considers the key barriers and
opportunities in delivering that transformation.
Comparing electric cars with conventional cars
Significant advances in technology have created a new generation
of electric cars that have the potential to surpass traditional petrol-
driven cars on performance, safety, design and running costs.
While the EV industry is still in its infancy, a number of high-end
models offer impressive performance, thanks to an EV’s highly
efficient and responsive drive train. EV motors transfer energy
instantly to the wheels, meaning they accelerate rapidly and don’t
need gears. However this level of performance is not as evident
among smaller EVs, which are produced with smaller engines and
batteries to reduce weight and cost. EVs can also exploit a lower
centre of gravity in the car and advanced aerodynamics, due,
in part, to the absence of the engine high up in a conventional car
(which contributes to drag).
Fuel costs are typically the greatest ongoing cost associated
with vehicle ownership. Of all engine types, battery EVs currently
produce the lowest fuel costs per kilometre, according to analysis
commissioned by the Victorian Department of Transport:
battery EVs are estimated to incur an equivalent fuel cost of
approximately $0.03 per kilometre, compared to an ICE at more
than $0.10 per kilometre. Maintenance costs for an EV are also
about 70 per cent of an ICE.
Electric cars – governments can play an important role in building critical mass
Electric car technology is becoming increasingly competitive
with conventional vehicles. Twenty-first century EVs can exploit
their technological advantages (performance, handling, safety,
and lower operating costs) to offset their disadvantages (shorter
range and higher up front cost). The more advanced EV markets,
in California, Norway, and Japan, are already demonstrating strong
demand by a growing section of the consumer market.
Passenger vehicles rely on adequate infrastructure for refuelling,
maintenance and active and transparent markets for used vehicles.
In other words, when a consumer buys a conventional car, they
know how much it will cost to run and can rely on an established
network of refuelling options around the country. Consumers
know they have a range of different repair and servicing options,
and have access to reliable information about its likely resale value.
Most of these basic user expectations are not yet afforded to
electric vehicle owners.
Electric cars have equivalent fuel costs of approximately 3 cents per kilometre, compared to 10 cents per kilometre for conventional cars.

Sparking an Electric Vehicle Debate in Australia 3
Measures to reduce this infrastructure gap for new entrant vehicles
are crucial to allow them to compete with conventional cars.
In California, the State Government has made a major commitment
to stimulate an electric vehicle market. It has introduced a suite
of measures that is helping create a critical mass of electric
vehicles. This in turn has revealed new partners and commercial
opportunities that exploit some of the key differences between
EVs and conventional cars. The creation of a critical mass of
vehicles in California is both reducing this gap and encouraging
further entrants into the EV market, both as car buyers and
support service providers.
Why governments should care about EVs – strategic advantages of electric vehicles
Any debate about the take-up of EVs is more than a discussion
about one new consumer technology displacing an old one.
Electric vehicles have the potential to deliver broader strategic
and economic benefits beyond their direct impact on consumers.
There are three main strategic benefits of electric vehicles:
environmental, increased energy security and grid stability.
Environment
One of the fundamental differences between EVs and conventional
cars is that electric cars enable consumers to eliminate greenhouse
gas emissions from their vehicle use. This will vary depending on
whether life-cycle emissions are assessed or just the emissions
associated with refuelling the vehicle.
During the lifetime of a vehicle, EVs recharged using renewable
electricity produce less greenhouse gas emissions than ICEs after
just three years, a recent Victorian Government EV trial found.2
If fuel combustion alone is considered, even when the electricity
used to charge EVs comes from a CO2
-emitting source, such as
a coal or gas-fired powered plant, the net CO2
production from
an electric car can be lower than from a comparable combustion
vehicle. An EV will emit around 22 per cent less CO2
equivalent
than new passenger vehicles. This will continue to improve
as the electricity supply continues to decarbonise over time,
and consumers are able now to purchase green power products
which enable them to source electricity from low or zero
emissions sources.
EVs also release almost no air pollutants at the place where they are
operated. This removes key air pollutants from cities, improving
air quality. EVs also create less noise than an internal combustion
engine vehicle, whether it is idling or in motion.
Utilisation of the grid
Rising electricity prices have been a hot button subject of public
debate in Australia. One of the key drivers has been the cost of
recent re-investment in electricity networks and transmission
systems. This multi-billion dollar infrastructure is built to manage
large but short run spikes in energy demand. It is mostly under-
utilised, particularly at night, when the majority of transport
vehicles are garaged and also when the availability of wind energy
is high. Utilising this spare overnight capacity is almost costless
but would improve the efficiency and operation of the electricity
network. In effect, with sensible incentives for users to charge at
off-peak times, more than 500,000 EVs could be charged without
requiring major new electricity infrastructure.3
Future generations of EVs may be capable of storing and releasing
energy back into the grid at high times of demand. While this may
be a future use of EVs, it is not possible with the existing range of
EVs likely to be in the market until the end of the decade. It should
be seen as a potential long-term benefit.
EVs release almost no air pollutants when they are driven.
4 Sparking an Electric Vehicle Debate in Australia
The benefits of removing the combustion engine in a car
The Tesla Model S is probably the most advanced all-electric
passenger car production model in the world right now. It has
been awarded a number of leading car awards in the US (including
Motor Trend Car of the Year 2013 and Automobile Magazine 2013
Automobile of the Year) because of its superior performance and
handling. Much of this relates to the ability of Tesla to maximise the
benefits of removing a combustion engine from the design of a car.
Removing the engine and fuel tank from a car and replacing
it with an electric motor and batteries has significant design
consequences. First, the higher efficiency of an electric drive
train means it can deliver power instantaneously to the wheels,
dramatically improving acceleration; the Tesla Model S four-door
saloon can accelerate to 100km/h in 4.4 seconds.
Second, handling and performance is improved by the removal
of a heavy combustion engine relatively high up in the car, batteries
low in the chassis and an electric motor between the rear axles.
This also enables more aerodynamic body styling. The Tesla Model
S has the second lowest drag coefficient of any production line car
ever manufactured.6
Finally the absence of the combustion engine also allows for safer
design, as there is more crumple room at the front of the car in the
event of a head on collision and more capacity for strengthening
the entire chassis of the car.
Energy security
Oil is a finite and depleting resource. Oil prices have tracked in
excess of $100 a barrel since 2011.4 New extraction technologies will
continue to extend the proven reserves of oil-based fuels, although
this is likely to be at higher cost. By contrast, electric vehicles are
not reliant on a specific source of energy. Any technology that can
generate electricity can be used to power an EV. This means EVs
have the ability to be fuelled by fully renewable energy sources.
The value of Australia’s imports of crude oil, automotive and diesel
fuel totalled more than $32 billion in 2011–12, even though Australia
is one of the biggest exporters of energy in the world.5 A shift to
vehicles fuelled by domestic fuel sources such as electricity or
natural gas would reduce this reliance on imported fuels and the
risks of price vulnerability due to oil supply constraints.
Electric vehicles require unconventional thinking
Conventional combustion engine cars dominated the car market
in the 20th century because they delivered fundamental benefits
to consumers: they could travel large distances with increasing
reliability at effective speeds with increasing levels of safety and
comfort. All this was provided at an increasingly affordable price.
While electric vehicles were more prevalent than ICEs early in the
20th century, their inability at the time to match many of these
consumer benefits forced them out of the market.
To become a viable alternative in the consumer passenger vehicle
market, EVs need to offer a competitive value and performance
proposition. The new generation of 21st century EVs have clear
advantages and disadvantages compared to ICEs. It is their ability
to minimise the disadvantages and maximise the advantages
that will determine the rate of uptake in this highly competitive
consumer market.
It is possible, but unlikely, that EVs’ pathway to success will be
to simply try to replicate the properties of a conventional car.
It is more likely that they will succeed where they can adapt and
maximise the unique benefits of the technology.
The Tesla Model S can accelerate to 100kmh in 4.4 seconds.

Sparking an Electric Vehicle Debate in Australia 5
Policy enablers to reduce barriers to electric vehicles
Governments around the world have sought to accelerate the
uptake of EVs through a range of measures. All US consumers have
access to a federal income tax credit of $7500 for the purchase of
an EV (for the first 200,000 EVs sold by each manufacturer). Other
measures are applied at regional levels. Almost one-third of total EV
sales in the US have been in California.7
California offers an additional rebate of $2500 for the purchase or
lease of an EV, as well as exemptions from high occupancy vehicle
lanes. Other incentives include:
• Tax credits to offset the cost of installing charging equipment
• Discounted vehicle registration fees
• Discounted or zero state sales tax
• Removing planning restrictions to enable EV charging
equipment to be installed
• Insurance discounts
The Electric Power Research Institute (EPRI) has found that the
combination of state incentives in California mean that the Nissan
LEAF is US$11,000 less expensive to run over its lifetime than a
comparable ICE vehicle.8
Addressing range anxiety
The notion of infrequent, long-range refuelling of cars has become
the norm over the last century. It reflects the refuelling properties
of fossil fuel engines. The inability of electric vehicles to replicate
this experience has resulted in the perception of “range anxiety”
by some consumers. These concerns are so acute that some
major car companies developing electric vehicles have begun
development of hybrid versions, reducing many of the innate
benefits of an electric car in order to alleviate concerns over range.
Pure EVs are likely to have different refuelling properties to
conventional cars. They will operate more like a mobile phone or
other portable electric device. In developing EV markets, retailers
are volunteering EV recharge facilities. Because of the relatively
low cost of recharging, retailers value the time of the driver in their
store more than the cost of the electricity provided to the car.
Some of the biggest barriers to EVs are driven by perceptions: most
car journeys are well within the range of even the shortest range
electric car, but anxiety about the shorter range is exacerbated
because drivers still see refuelling as a weekly or monthly
experience, rather than something done daily. Unrealistic tests are
put on cars – like the ability to drive uninterrupted between two
major cities – when most Australians fly these routes or drive
inter-city rarely.

6 Sparking an Electric Vehicle Debate in Australia
These are actions that cannot be taken in isolation. It will take a
series of coordinated policies between government and industry
in order to stimulate the EV market. The experience in the US, and
California in particular, shows that the right combination of policy
drivers can promote EVs and bring forward the potential.
Potential partners
There are a number of potential partners in the accelerated
deployment of electric vehicles on Australian roads. Beyond car
manufacturers, there is a range of key business partners who could
mutually benefit from supporting increased uptake and scale of EV
use in Australia. These include:
• Airlines (as consumers fly rather than drive longer distances).
• Hire car companies (increased use of hire cars for
specialised journeys).
• Car share companies (using EVs in car share fleets).
• Retailers and shopping centres (provide recharge facilities
while customers shop).
• Electricity companies (increased volume and improved
grid utilisation).
Policy options in Australia
The esaa is not advocating for any specific policies to be
introduced in Australia. Rather, if EVs are seen to provide benefits
for Australia, government involvement is likely to be important to
help develop a critical mass of vehicles. This report simply seeks
to encourage a discussion about how to encourage EV uptake.
Potential options include:
• Tax concessions for new electric vehicles:
EVs have a higher up-front purchase price but cheaper
operating costs. This exposes them to costs such as luxury
car tax, higher import duties and higher stamp duty, which
further increase the sticker price of electric vehicles
compared to a conventional car.
• Planning for recharge: Appropriate planning arrangements
and regulations are needed to facilitate the recharging of EVs.
Stakeholders in Victoria’s EV Trial have reported that complex
planning arrangements have made installing public recharging
facilities more difficult.9
• Infrastructure: Governments could provide upfront capital
or fixed revenue agreements to ensure infrastructure providers
have the incentive to enter the Australian market – the first
infrastructure will be fast charge inverters in households and
at retail outlets.
• Electricity tariff reform: Enabling EV users to take advantage
of Time of Use (TOU) tariffs will create incentives for them
to recharge during off-peak times and exploit significant
discounts available for electricity sold at these times. Eventually
EVs could be used to augment the grid by utilising Vehicle to
Grid (V2G) technology – delivering surplus battery-stored
electricity back into the grid at times of peak demand.
• Other: In some overseas markets EV users are granted
on-road privileges, such as access to transit lanes.
Governments at all levels can participate in establishing an
Australian EV market. At a national level, there are issues such
as import duties and luxury car taxes. State governments are
able to influence planning restrictions, vehicle stamp duty,
registration costs and potentially even preferential access
on roads (such as transit lanes, or discounted tolls). While local
councils are also able to enable charging infrastructure to be
installed through planning arrangements as well as potentially
offering dedicated EV parking spaces.
It would take a series of coordinated policies between government and industry in order to stimulate the EV market.

Sparking an Electric Vehicle Debate in Australia 7
1 ABS Survey of Motor Vehicle Use, June 2012.
2 Victorian Government, 2013, Creating a Market: Victorian Electric
Vehicle Trial Mid-term Report.
3 AECOM (2012), Impact of Electric Vehicles and Natural Gas Vehicles
on the Energy Markets.
4 EIA, What drives Crude Oil prices? Last accessed 31 July 2013.
5 Bureau of Resources and Energy Economics, 2013, Australian Petroleum
Statistics No 202.
6 Car and Driver, Tesla Model S review, January 2013.
7 Electrification Coalition, EV Market Outlook: State of the Plug-in Electric
Vehicle Market, July 2013.
8 Electric Power Research Institute, Total Cost of Ownership for Current
Plug-in Electric Vehicles, EPRI, Palo Alto, CA, 2013.
9 Victorian Government, 2013, Creating a Market: Victorian Electric
Vehicle Trial Mid-term Report.
Potential EV hotspots
A review of the Californian market for EVs identified key
demographic and geographic trends common among early
adopters of electric vehicles. These included distance from the
CBD, availability of off street parking and households with two
or more cars. Applying these metrics to Australian capital cities,
this report has explored the prevalence of these conditions in the
domestic market. Using data from the 2011 Census, the criteria
assessed were: distance from CBD; proportion of separate houses
(separate houses are used as a proxy for access to a garage or off
street parking); proportion of households with 2 or more vehicles.
Based on this, a typical sample of the most highly suited EV suburbs
in each capital city were:
City Suburbs
Sydney Baulkham Hills, Frenchs
Forest, Kellyville, Menai,
Terrey Hills
Melbourne Balwyn North, Derrimut,
Greensborough, Ivanhoe East,
Point Cook
Brisbane Bridgeman Downs, The Gap,
North Lakes, Carindale,
Upper Brookfield
Perth Canning Vale, City Beach,
Duncraig, Karrinyup, Nedlands
Adelaide Aberfoyle Park, Athelstone,
Beaumont, Crafers,
Happy Valley
Hobart Acton Park, Collinsvale,
Howden, Tolmans Hill,
Roches Beach
Canberra Greenleigh, O’Malley, Fadden,
Macarthur, Giralang

8 Sparking an Electric Vehicle Debate in Australia
Source: Victorian Department of Transport,
Differences to conventional cars 10
1.2 History of electric vehicles
Electric vehicles (EVs) emerged in parallel to conventional cars over
the last century.11 They evolved from a fleet of New York electric
taxis in the 1890s. By the end of the 19th century, EVs had outsold
traditional Internal Combustion Engine (ICE) vehicles. EVs enjoyed
continued success until the 1920s, when improving road networks
extended the potential travelling range of cars and crude oil
markets expanded, giving ICE vehicles a range advantage over EVs.
The market for EVs then narrowed to specialised, short-range
vehicles including golf carts and some delivery vehicles. Electric
engines were used extensively for large-scale transport systems like
trains, where supply could be continuously provided, thus avoiding
range and storage limitations. But for most of the 20th century EVs
were effectively absent from the growing passenger vehicle market.
It wasn’t until the late 20th century that the first mass-produced
electric car was built by General Motors. It was a concept car called
the Impact released in 1990, and GM went on to manufacture and
lease around 1000 EV1 electric cars in the US. GM was unsatisfied
with the cost and performance of the cars, and subsequently
recalled and destroyed them in 2002.
In 1995 Toyota then adapted the electric drive train in its concept
petrol-electric hybrid car the Prius for the Tokyo Motor Show
that year. It went on sale in 1997, with more than 3.6 million
Prius cars sold worldwide to date. In 2012 Toyota launched
a plug-in Prius hybrid.
Figure 1.1: Schematic diagram of an electric car compared to an internal combustion engine car
1.1 How they work
Electric vehicles are a developing technology. Consistent with most
developing markets, car designers have developed a number of
different drive trains to explore the trade-offs and benefits. Vehicle
types fall into two broad categories:
• electric cars that draw power primarily from the electricity
network and which may be augmented by other fuels, and
• conventional cars that are fuelled by fossil fuels but may
use a hybrid electric drive train to improve the efficient
use of that fuel.
Box 1.1: EVs defined
There are broadly three different energy systems powering
transport vehicles: electricity, conventional petrol or diesel,
and natural gas. The latter will be discussed in another paper.
Electric
PEV: Plug-in electric vehicle – electricity is drawn from the
grid and stored inside in-build battery packs in the vehicle,
which has no other engine or fuel tank.
PEV Swap: Plug-in electric vehicle (with battery swap) –
a PEV with the ability to swap the electric battery
as a type of refuelling.
PHEV: Plug-in hybrid vehicle – a vehicle driven
by an electric drive train and fitted with an internal
combustion engine (ICE) where the battery can
be charged either from the grid or by the ICE.
Conventional
ICE: Internal combustion engine vehicle – uses fossil fuel
combustion to power the in-build engine. Liquid petroleum
gas (LPG) vehicles are included in this category.
HV: Hybrid vehicle – combines and electric engine with an
ICE to increase fuel efficiency but is fuelled only by petrol
or diesel. This includes Series Hybrid (the engine charges
the batter and an electric motor drives the vehicle), Parallel
Hybrid (engine and motor work together to power the
drivetrain), and Power-split Hybrid (both the engine and
electric motor can work together or separately).
1 Introducing the electric car
Difference between an internal combustion engine and an electric engine
Electric MotorController
Household Plug
Rechargeable Batteries
Petrol Tank
Petrol Pump
CombustionEngine
Sparking an Electric Vehicle Debate in Australia 9
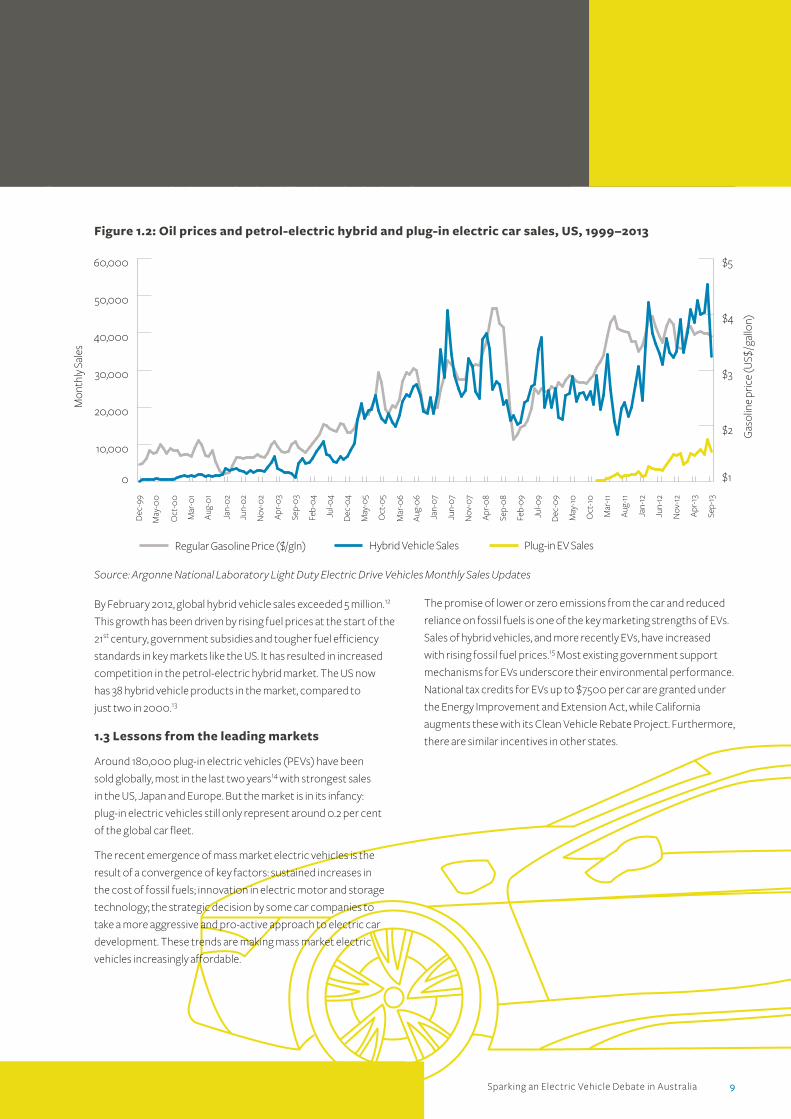
The promise of lower or zero emissions from the car and reduced
reliance on fossil fuels is one of the key marketing strengths of EVs.
Sales of hybrid vehicles, and more recently EVs, have increased
with rising fossil fuel prices.15 Most existing government support
mechanisms for EVs underscore their environmental performance.
National tax credits for EVs up to $7500 per car are granted under
the Energy Improvement and Extension Act, while California
augments these with its Clean Vehicle Rebate Project. Furthermore,
there are similar incentives in other states.
Mon
thly
Sal
es
Gas
olin
e pr
ice
(US$
/gal
lon)
0
10,000
20,000
30,000
40,000
50,000
60,000
$1
$2
$3
$4
$5
Sep-
13
Apr
-13
Nov
-12
Jun-
12
Jan-
12
Aug
-11
Mar
-11
Oct
-10
May
-10
Dec
-09
Jul-0
9
Feb-
09
Sep-
08
Apr
-08
Nov
-07
Jun-
07
Jan-
07
Aug
-06
Mar
-06
Oct
-05
May
-05
Dec
-04
Jul-0
4
Feb-
04
Sep-
03
Apr
-03
Nov
-02
Jun-
02
Jan-
02
Aug
-01
Mar
-01
Oct
-00
May
-00
Dec
-99
Hybrid Vehicle SalesRegular Gasoline Price ($/gln) Plug-in EV Sales
By February 2012, global hybrid vehicle sales exceeded 5 million.12
This growth has been driven by rising fuel prices at the start of the
21st century, government subsidies and tougher fuel efficiency
standards in key markets like the US. It has resulted in increased
competition in the petrol-electric hybrid market. The US now
has 38 hybrid vehicle products in the market, compared to
just two in 2000.13
1.3 Lessons from the leading markets
Around 180,000 plug-in electric vehicles (PEVs) have been
sold globally, most in the last two years14 with strongest sales
in the US, Japan and Europe. But the market is in its infancy:
plug-in electric vehicles still only represent around 0.2 per cent
of the global car fleet.
The recent emergence of mass market electric vehicles is the
result of a convergence of key factors: sustained increases in
the cost of fossil fuels; innovation in electric motor and storage
technology; the strategic decision by some car companies to
take a more aggressive and pro-active approach to electric car
development. These trends are making mass market electric
vehicles increasingly affordable.
Figure 1.2: Oil prices and petrol-electric hybrid and plug-in electric car sales, US, 1999–2013
Source: Argonne National Laboratory Light Duty Electric Drive Vehicles Monthly Sales Updates

10 Sparking an Electric Vehicle Debate in Australia
The leading production line plug-in hybrid (PHEV) vehicles to
date have been the F3DM produced by Chinese car company BYD
auto (2010, now discontinued), the Chevrolet Volt (2010, sold in
Australia as the Holden Volt), the Toyota Prius plug-in hybrid (2012),
the Volvo V60 plug-in hybrid (2012) and the Ford Fusion Energi
(2013). Aside from the Volt, these cars were plug-in adaptations of
existing hybrid vehicles.
As with any emerging market, there have been positive and negative
surprises. Sales of the smaller pure electric cars have been well
below initial projections, with Nissan reportedly investing a billion
dollars in the development of the LEAF, but to date has “only” sold
around 75,000 cars worldwide. Sales have been held back by the
EV’s relatively high sticker price, limited performance and limited
range. The i-MiEV initially went on sale for $48,000 in Australia,
while the Nissan LEAF was initially priced at around $51,000 (it is
similar in many respects to an electric version of its $18,000 Tiida
compact car). Both companies have subsequently discounted
these prices to help lift sales.
By contrast the Tesla Model S has entered the US car market at a
higher pricing point, starting at around $70,000, but offers greater
driving range, a larger and more upmarket vehicle and better
performance. It is now reportedly outselling leading brands like
Porsche and Volvo in California. With production now passing
around 20,000 cars a year, there is a two-to-three month waiting
list for the Model S in the US.23 Tesla’s total sales in the US are still
smaller than the Chevrolet Volt and the Nissan LEAF.24
Most major car companies now have an electric car in
development or production, with many offering both pure
and hybrid electric. Most of these cars are reported to have
small initial production runs, targeted at release in leading
US EV states like California and Oregon.
Essentially there are four entry points for new plug-in electric
vehicles: small city commuter cars; high performance/high cost
vehicles; all-electric cars; or plug-in hybrids. Plug-in hybrids improve
range and “normalise” the EV car experience, but they tend to
compromise the EV’s greatest strength, and also add production
costs from supplying two separate drive train systems. So far, pure
EV cars remain significantly more expensive in the commuter car
market, without noticeable performance benefits. Tables 1.1 and 1.2
outline the PEVs and PHEVs under development or production by
major car companies.
The US is the biggest EV market, with sales in excess of 120,000
plug-in electric cars since 2008. The Chevrolet Volt is the market
leader with more than 40,000 cars sold, followed by the Nissan
LEAF (30,000), the Toyota Prius plug-in (16,000) and the Tesla
Model S (12,000). Around 39 per cent of all plug-in electric car
sales are in California. The US EV market is also being driven by
more stringent vehicle emissions standards, the availability of
locally manufactured vehicles such as the Tesla and Chevrolet Volt,
and the growing penetration of public recharging infrastructure.
Nissan was able to reduce the price of its LEAF EV by US$6000
(AUD$6450) after transferring production from Japan to the US
with support from the US Department of Energy.16
Japan has the second largest plug-in EV market with around 45,000
cars sold.17 It is also second behind Norway in terms of share of new
passenger vehicle sales with almost 1 per cent of new car sales being
EVs. This is led by increasing sales of the Toyota Prius in the plug-in
hybrid market and sales of the Nissan LEAF in the battery
EV market. In 2012 Japanese consumers bought nearly 16,000
PEVs.18 The Japanese government provides incentives of up
to 1 million yen (AUD$10,800) for EVs and provides additional
incentives of up to 1.5 million yen (AUD$16,200) per charger
towards the cost of EV charging units.19
Norway is one of the leading European markets for plug-in EVs,
driven by high petrol prices (around AUD$2.50/L)20 and incremental
sales tax based on vehicle greenhouse gas emissions. The
Norwegian Government exempts PEVs from the 25 per cent sales
tax on vehicles and congestion charges as well as giving EVs access
to bus lanes.21 In the third quarter of 2012, EVs made up over 3 per
cent of new passenger vehicle sales in Norway. This is currently the
highest share in the world.22
1.4 Plug-in electric vehicle market development
The plug-in electric cars market is still in its infancy. A handful
of models are available in market, while most leading car
manufacturers have one or more models in production or
development. The market has split into pure electric cars and
plug-in hybrid cars, which are augmented by a combustion
engine either to power the drive train or recharge the battery.
The leading pure electric production line cars (PEV) to date have
been the Tesla Roadster (2008, now discontinued), Mitsubishi
i-MiEV (2009) and the Nissan LEAF (2010). Tesla began deliveries of
its four-door hatchback Model S in 2012, while Honda released its
all-electric version of the Fit/Jazz in the same year.

Sparking an Electric Vehicle Debate in Australia 11
Make Model Range (kms) Price (USD) Release date Notes*
BMW i3 160 42,275 Late 2013 Range extender hybrid version also
available adding two cylinder petrol engine.
Australian release in mid-2014.
Fiat 500e 140 32,500 On sale
(US only)
Unspecified test run available only in
California sold out mid-2013.
Ford Focus
Electric
120 39,200 On sale
(US only)
Based on the Ford Focus. Active liquid
cooling to manage heat.
Possible Australian release in 2014.
Honda Fit EV 132 37,415 On sale
(US only)
Based on Honda Jazz.
Chevrolet Spark EV 60 26,685 Late 2013
(US only)
Compact city car.
Kia Venga 140 TBA Late 2013 Scheduled for release in US and Europe.
Mercedes Benz SLS E-Cell 250 TBA 2013 Luxury super-car EV with all-wheel drive
expected price above $500,000.
Mercedes Benz B-class
E-cell
185 TBA 2014 Uses Tesla drive-train under contract.
Mitsubishi i-MiEV 100 29,125 On sale Available in Australia for $29,990.
Nissan LEAF 120 28,800 On sale Available in Australia for $39,990.
Nissan Esflow 240 TBA TBA Concept high performance sports car
based on Iconic Z class.
Renault Fluence ZE 185 34,000 On sale in
Europe and
Israel
First electric car with battery swapping
capacity – future uncertain with demise
of Better Place.
Renault Zoe
Expression
210 27,250 On sale in
Europe
Renault has indicated Zoe will not be sold in
Australia without government support.
Renault DeZir 160 TBA TBA Luxury two seat sports coupe aimed at
performance car market
SAAB 9-3 ePower 200 TBA 2014 Based on 9-3 wagon. Developed by
Chinese-Japanese consortium National
Electrical Vehicle Sweden, which bought
Saab Automobile from bankruptcy.
Smart ED 100 25,750 2010 Small volumes sold in Europe and the US.
Third generation released this year.
Tesla Model S 250 62,400 On sale
(US only)
Top of the range Tesla S model claims
range of 480km. Australian release in 2014.
Toyota RAV4 EV 160 49,800 On sale Second generation using licensed Tesla
drive-train. Release only in California.
Volkswagen Golf Blue
e-motion
150 TBA Expected
2013
EV version of popular Golf model under
development since 2010.
*Note: No planned Australian release unless stated.
Source: CPIEVC
Table 1.1: PEV models under development or in production by major car companies

12 Sparking an Electric Vehicle Debate in Australia
Table 1.2: PHEV models under development or in production by major car companies
Make Model Electric only
range
US price
(USD)
Release date Notes*
Audi A3 e-tron 50 52,000 2014 All-electric version also under
development.
Australian release in late 2014.
BMW i8 35 300,000 2014 Lightweight 4-seat luxury sports car.
Australian release in late 2014.
Ford Fusion
Energi
34 38,700 On sale
(US only)
Plug-in hybrid version of the Ford Mondeo.
Honda Accord
Plug-in
21 39,780 On sale
(US only)
Chevrolet Volt 60 39,145 2012 Largest selling plug-in electric car in the
US. Won 2011 North American Car of the
Year and 2012 European Car of the Year.
Available in Australia as the Holden Volt
for AUD$59,990.
Mercedes Benz B-class
E-cell PLUS
100 TBA 2014 Hybrid version of the B-class E-cell
with 3-cylinder turbo engine added to
electric drive train.
Mitsubishi PX-MiEV 50 TBA TBA Seen as a possible replacement to the
Outlander SUV.
Peugeot HX1 35 TBA TBA Highly styled six-seater concept car with
low roof for reduced drag.
Suzuki Swift PHEV 20 24,900 TBA Scheduled for US/Japan release in 2013.
Toyota Plug-in
Prius
25 32,000 On sale in US,
Europe and
Japan
Plug-in conversion of Toyota’s successful
hybrid car. Australian release in 2014
or 2015.
Volvo V60 Plug-in 50 75,000 On sale in
Europe
Plug-in diesel-electric hybrid version of
V60 station wagon.
*Note: No planned Australian release unless stated.
Source: CPIEVC

Sparking an Electric Vehicle Debate in Australia 13
Total EV sales have grown but have also under-performed some
forecasts, as consumers struggle with the higher sticker prices
but conflicted consumer benefits.
This is clearly an immature market. Volumes remain relatively
small compared to the total volumes of the car market.
There is evident uncertainty by major car companies about
which drive train and which segments of the market are likely
to be the most successful. There is growth in EV markets,
particularly where there are increased volumes, more
infrastructure support and increased competition.
While Nissan made a decisive (and expensive) investment decision
to develop its LEAF EV, most car companies appear to be taking
a more defensive approach. The dominant strategy is based on
producing small volumes of EVs derived from existing ICE models,
coupled with the development of more exotic concept cars put
on display at car shows and on websites. This maximises the brand
benefits of technical innovation and future thinking, without yet
committing to the large-scale production of these vehicles.
1.5 The California experiment
In the US, California accounts for 32 per cent of total electric vehicle
sales.25 This exceeds the state’s share of US population (12 per cent).
The California Plug-In Electric Vehicle Collaborative estimates that
more than 48,000 plug-in EVs have been sold in the state.26 The
California EV market has been accelerated by a range of factors: a
strategic approach to accelerating EV market development by the
State legislature resulting in a comprehensive suite of measures,
a large consumer market with a track record of incubating and
supporting new technologies and as the home state to the world’s
leading pure-electric vehicle car company, Tesla. Table 1.3 shows the
top 10 EV states in the US.27
Table 1.3: Highest level of EV sales in the US by state
State % of total
EV sales
EV charging
stations
California 32 1362
Florida 6.6 388
Washington 5.7 360
Texas 4.3 482
New York 3.5 228
Ohio 3.1 84
North Carolina 3.1 161
Illinois 3.1 216
Tennessee 2.9 302
Hawaii 2.9 128
Source: Edmunds.com
As a result there are signs that California has emerged as the most
competitive EV market in the world. Most major car companies are
launching their first small volume editions of PEVs in California such
as the Fiat 500 or Toyota RAV4 EV. These are known as ‘compliance
cars’; cars only available in California in order to meet the state’s
zero emissions vehicle requirements.28 There is some evidence of
increased price competition in the California EV market.29
California’s Plug-in EV Driver Survey showed that 94 per cent
of EV owners also own a conventional car and 90 per cent live
in a detached home, which suggests they are likely to be able
to recharge in their home garage.30 Demographic information
suggested these early adopters were older, higher income
consumers with higher levels of education. The survey found:
52 per cent of EV owners had a postgraduate degree; almost
three-quarters were over the age of 45 and 47 per cent had an
income of more than $150,000 (compared to 15 per cent of
conventional vehicle buyers).
California has emerged as the most competitive EV market in the world.
14 Sparking an Electric Vehicle Debate in Australia
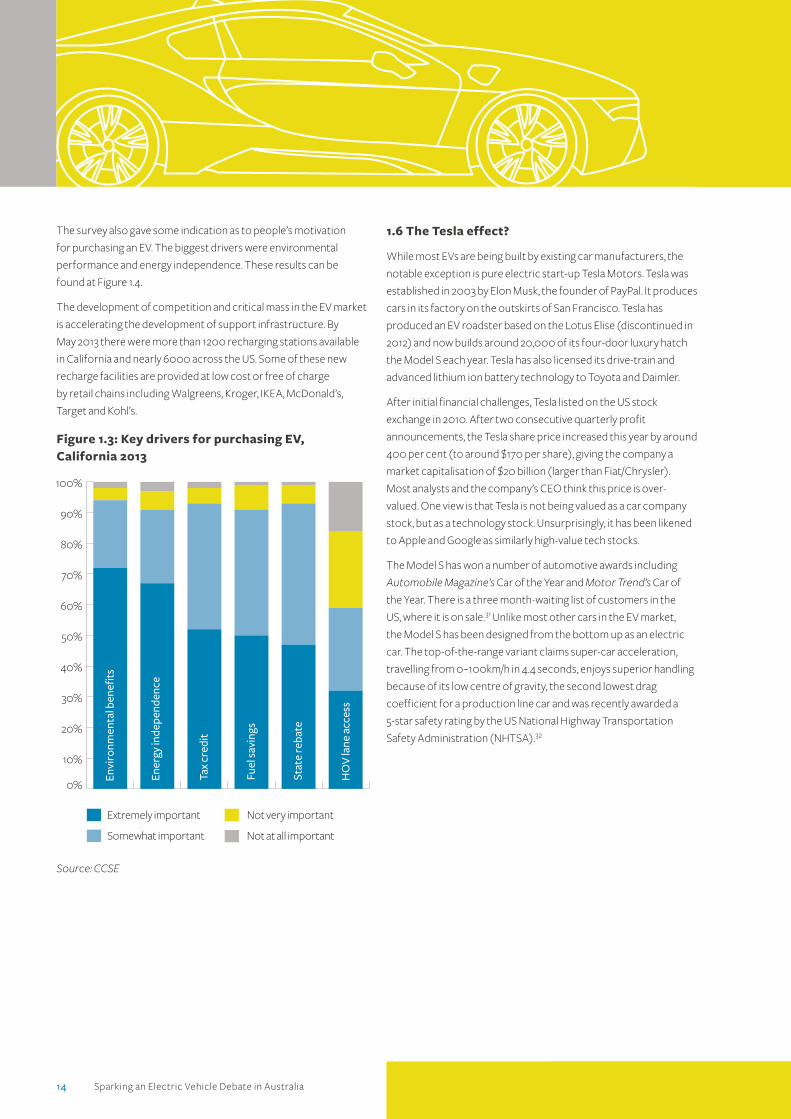
The survey also gave some indication as to people’s motivation
for purchasing an EV. The biggest drivers were environmental
performance and energy independence. These results can be
found at Figure 1.4.
The development of competition and critical mass in the EV market
is accelerating the development of support infrastructure. By
May 2013 there were more than 1200 recharging stations available
in California and nearly 6000 across the US. Some of these new
recharge facilities are provided at low cost or free of charge
by retail chains including Walgreens, Kroger, IKEA, McDonald’s,
Target and Kohl’s.
Figure 1.3: Key drivers for purchasing EV, California 2013
1.6 The Tesla effect?
While most EVs are being built by existing car manufacturers, the
notable exception is pure electric start-up Tesla Motors. Tesla was
established in 2003 by Elon Musk, the founder of PayPal. It produces
cars in its factory on the outskirts of San Francisco. Tesla has
produced an EV roadster based on the Lotus Elise (discontinued in
2012) and now builds around 20,000 of its four-door luxury hatch
the Model S each year. Tesla has also licensed its drive-train and
advanced lithium ion battery technology to Toyota and Daimler.
After initial financial challenges, Tesla listed on the US stock
exchange in 2010. After two consecutive quarterly profit
announcements, the Tesla share price increased this year by around
400 per cent (to around $170 per share), giving the company a
market capitalisation of $20 billion (larger than Fiat/Chrysler).
Most analysts and the company’s CEO think this price is over-
valued. One view is that Tesla is not being valued as a car company
stock, but as a technology stock. Unsurprisingly, it has been likened
to Apple and Google as similarly high-value tech stocks.
The Model S has won a number of automotive awards including
Automobile Magazine’s Car of the Year and Motor Trend’s Car of
the Year. There is a three month-waiting list of customers in the
US, where it is on sale.31 Unlike most other cars in the EV market,
the Model S has been designed from the bottom up as an electric
car. The top-of-the-range variant claims super-car acceleration,
travelling from 0–100km/h in 4.4 seconds, enjoys superior handling
because of its low centre of gravity, the second lowest drag
coefficient for a production line car and was recently awarded a
5-star safety rating by the US National Highway Transportation
Safety Administration (NHTSA).32
Not very important
Not at all important
Extremely important
Somewhat important
0%
10%
20%
30%
40%
50%
60%
70%
80%
90%
100%Not at all important
Not very important
Somehwat important
Extremely important
HO
V la
ne a
cces
s
Stat
e re
bate
Fuel
savi
ngs
Tax
cred
it
Ener
gy in
depe
nden
ce
Envi
ronm
enta
l ben
efits
Source: CCSE

Sparking an Electric Vehicle Debate in Australia 15
The four-fold increase in Tesla’s share price in 2013 suggests
broad public interest in the company as well as its cars. Consumer
excitement around Tesla may be a contributing factor to the
accelerated development of an EV market in California. As a
dedicated electric vehicle car/technology company, Tesla’s
commercial interest is maximised by accelerating the market
for EVs. By contrast while conventional car companies are
developing new EV models, their business is still primarily making
and selling conventional cars. It is rational for these companies
to track and participate in development of EVs, to ensure they
are well positioned to take a share of the growing EV market, and
to demonstrate to their customers that they are up to date with
leading edge technology and market trends. It’s also helpful in
meeting fleet emissions standards since EVs are treated as zero
emissions for this purpose.
As a result, a key component of the accelerated development of
EV markets may be the active presence of “iconic” EV companies
like Tesla in that market.
10 Victorian Department of Transport, Differences to conventional cars.
Last accessed 31 July 2013.
11 US Department of Energy (2013), from http://www1.eere.energy.gov/
vehiclesandfuels/avta/light_duty/fsev/fsev_history.html.
Retrieved 15 May 2013.
12 ABMARC (2012) Electric & Hybrid Vehicles Australia: An Automotive
Perspective.
13 Alternative Fuels Data Centre, Light-duty AFVs, hybrid electric vehicles
(HEVs), and diesel models offered by vehicle manufacturers.
Last accessed 1 August 2013.
14 International Energy Agency, Global EV outlook, April 2013.
15 Argonne National Laboratory, Light Duty Electric Drive Vehicles Monthly
Sales Updates. Last accessed 31 July 2013.
16 US Department of Energy, EV Sales Skyrocketing. eGallon Holds Steady.
Last accessed 1 August 2013.
17 Ibid.
18 Ibid.
19 Ibid.
20 Bureau of Resources and Energy Economics, 2013, Australian Petroleum
Statistics No 202.
21 Tesla, EV Incentives in Norway. Last accessed 1 August 2013.
22 International Energy Agency, Global EV outlook, April 2013.
23 Tesla (2013), from http://www.teslamotors.com/. Retrieved 14 May 2013.
24 US Department of Energy, Visualizing Electric Vehicle Sales.
Last accessed 9 August 2013.
25 Edmunds.com, reported at http://green.autoblog.com/2012/11/09/
california-leads-in-green-car-sales-but-there-are-surprises-on/.
Retrieved 6 August 2013.
26 California Plug-In EV Collaborative from www.evcollaborative.com.
Retrieved 12 September 2013.
27 Edmunds.com, reported at http://green.autoblog.com/2012/11/09/
california-leads-in-green-car-sales-but-there-are-surprises-on/.
Retrieved 6 August 2013.
28 Green Car Report. Retrieved 13 September 2013.
29 Edmunds.com August 27, 2013: 2013 Toyota RAV4 EV Discounts Are
Latest Move in EV Price War.
30 California Center for Sustainable Energy, California Plug-in Electric
Vehicle Owner Survey, May 2013.
31 Tesla (2013), from http://www.teslamotors.com/. Retrieved 14 May 2013.
32 Safercar.gov. Retrieved 12 September 2013.
By May 2013 there were more than 1200 recharging stations available in California and nearly 6000 across the US.

16 Sparking an Electric Vehicle Debate in Australia
of the technology, and debunk some of the myths surrounding
EVs, given the Australian market for PEVs is currently in the ‘pre-
adoption’ phase. This phase is volatile, with many short-term
successes, challenges and barriers. However, once the market
passes a ‘tipping point’, the technology becomes mainstream and
is widely adopted. DoT indicated its expectation that EVs would
follow this pattern, although it acknowledged the ‘tipping point’
for adoption may be two decades away.
2.1 The experience of hybrid petrol-electric cars in Australia
In 2012 more than one million new cars were sold with around
1.3 per cent of sales for hybrid vehicles (HV).37 HVs have been
available in Australia since 2001, with a gradual increase in the
number of models available. Toyota has led the market with almost
42,000 hybrid vehicles sold in Australia since the Prius was first
released here in 2001.38 The locally-assembled Camry hybrid has
been Toyota’s most popular hybrid vehicle in Australia with more
than 20,000 vehicles sold. Lexus hybrids have also sold well, with
more than 8500 sold in Australia. Honda’s hybrid vehicles have also
been popular with 800 sold in 2012.39 Porsche, BMW, Nissan and
Mitsubishi all have hybrid offerings available in Australia.
HV sales have steadily increased to around 60,000 cars in Australia
since first launched in 2001. Figure 2.1 shows the annual growth
in sales. This suggests a potential growth rate that for other new
technology cars over the first decade.
The Australian electric vehicle market is almost non-existent.
Fewer than 500 EVs have been sold in Australia since the release
of the Mitsubishi i-MiEV in 2011. The three leading EVs currently
available in Australia are the i-MiEV, the Nissan LEAF and the
Holden Volt (hybrid).
Other manufacturers are preparing to launch PEV or PHEV models
into Australia, such as Toyota’s plug-in Prius and BMW’s i3. Tesla
has been taking orders for its Model S in Australia, with deliveries
expected sometime in 2014.33 Renault’s Fluence ZE with battery
swapping technology has been pulled from the Australian market
following the bankruptcy of battery swap company Better Place.34
The majority of EV car sales were to corporate fleets, rather than
private motorists. All three available EVs in Australia (Mitsubishi
i-MiEV, Nissan LEAF, Holden Volt) have seen discounting off their
original sticker prices while Mitsubishi stopped imports of its
i-MiEV to Australia.35 Vehicle manufacturers expect EV market
uptake to remain low for some years.
At the same time manufacturers view EV technology as strategically
important because of expectations for increasing EV market share,
while investment in new technology enhances a reputation for
innovation. Many consumers and manufacturers see EVs as the
future of the global automotive industry.
The Victorian Department of Transport (DoT) recently concluded
a comprehensive trial in which it supplied around 60 electric
vehicles to eligible households, in order to measure attitudes
towards the technology.36 The trial sought to assess the benefits
2 The Australian market for electric vehicles
Figure 2.1 Annual petrol-electric hybrid sales in Australia 2001–12
0
2,000
4,000
6,000
8,000
10,000
12,000
14,000
16,000
201220112010200920082007200620052004200320022001
Source: ABMARC, VFACTS

Sparking an Electric Vehicle Debate in Australia 17
Overall, AECOM’s results predict that a transition from internal
combustion vehicles to hybrids will occur in the next five to ten
years. This transition will then be made to plug-in hybrid EVs over
10–20 years, and EVs over the long term, that is, more than 15 years.
Further, EV uptake will be sensitive to the year in which purchase
prices reach parity with internal combustion vehicle prices. The
availability of charging infrastructure, which is currently difficult
to predict, is expected to have a significant impact on EV sales.
In 2012, AECOM produced a report for the Australian Energy
Market Commission (AEMC) on the impact of EVs and Natural Gas
Vehicles (NGV) on the Australian energy markets. 43 This report
informed the AEMC’s advice to the Standing Council on Energy
and Resources on energy market arrangements for EVs and NGVs.
AECOM used its vehicle forecasting model to deliver an Australia-
wide forecast for EV uptake.
AECOM suggests that within 10 to 15 years, EVs could have a
‘significant presence’ in the Australian market, suggesting that
supply constraints will ease by 2015, at which time EV sales are
expected to increase dramatically. AECOM projected EVs to
represent approximately 20 per cent of total new car sales
by 2020, and 45 per cent by 2030.
2.2.2 CSIRO
The CSIRO published EV forecasts for Victoria in 2012,44 using an
EV uptake diffusion model, which projects the market shares of
battery EVs, plug-in hybrid EVs, hybrid EVs, and ICE vehicles under
three scenarios to 2030. The CSIRO’s objective in developing an
EV forecast was to estimate the impact of incentives on EV uptake,
rather than forecast uptake as per the status quo. As such, CSIRO’s
base case reflects the achievement of carbon dioxide (CO2
) targets,
rather than ‘likely’ uptake. Modelled scenarios included:
• Base case – no rebates or incentives for EV purchases. Internal
combustion and HEV market shares match an emissions target
of a 60 per cent reduction in CO2
below 2000 by 2050.
• Rebate case – $7500 rebate offered on the purchase price of
certain EVs. The $7500 rebate applies to every battery electric
and plug-in hybrid EV purchased between 2013 and 2033.
• Maximum uptake case – the case in which there are only
battery and hybrid EVs in the market by 2033, and no other
type of vehicle. It is not considered a plausible scenario for
2033, but serves as an upper bound for reference.
In the base case, the CSIRO forecasts total EVs to reach 981,518
in Victoria by 2033, while in the ‘maximum uptake’ scenario,
this figure increases to 2,932,265.45
2.2 Electric vehicle forecasts in Australia
As with other emerging technologies, governments and other
agencies were quick to forecast the potential growth of the
EV market in Australia. A series of forecasts were prepared for
different agencies. Based on current sales data, all could be
accused of being “optimistic”.
Many agencies have attempted to predict the potential growth
of the EV market in Australia, including: AECOM, CSIRO, ABMARC,
Federal Treasury and the Federal Chamber of Automotive
Industries. In all calculations, Australian EV sales forecasts have
been overstated. Contributing factors include flawed projections
of oil, underestimating EV retail prices and availability in Australia.
2.2.1 AECOM
Consulting firm AECOM forecast EV uptake in New South Wales
for the Department of Energy and Climate Change in 2009 ,40
then adopted a similar approach to assess EV uptake for the
Victorian Department of Transport in 2011.41 Both sets of
AECOM’s forecasts are projected to 2040.
AECOM took a ‘bottom-up’ approach to its forecasts, defining
scenarios, market segments, and relevant assumptions, before
combining the results to inform a ‘vehicle choice model’ which
was extrapolated across the forecast period.
In both Victorian and NSW studies, AECOM defined three distinct
scenarios in addition to the base case, running its vehicle choice
model on each. These scenarios were:42
• Base case – Only internal combustions and standard hybrid
EVs are available. No plug-in hybrids or battery EVs exist
in the market at all
• Scenario 1 – Level 1 household charging available
• Scenario 2 – Level 1 and 2 charging available. That is, consumers
have the option to switch between slow and fast charging.
Level 2 public charging is also available within the Victorian
metropolitan region
• Scenario 3 – As for Scenario 2, with the additional availability
of EV service stations that offer Level 3 quick charging and
battery swapping.
* Note: For definitions of charging see Appendix B.

18 Sparking an Electric Vehicle Debate in Australia
Figure 2.2: Total CSIRO projected EV penetration in Victoria, by scenario, 2033
0
500,000
1,000,000
1,500,000
2,000,000
2,500,000
3,000,000
Maximum uptakeRebate caseBase case
PHEV Total EVsBEV
Source: Adapted from CSIRO ( 2012 )
Pure EVs are forecast to comprise between 12 per cent and
48 per cent of the total Victorian vehicle fleet by 2033, in the base
and maximum uptake cases respectively. For plug-in hybrid EVs,
market share to 2033 is 21 per cent in the base case, and 51 per cent
of the total Victorian fleet in the maximum uptake case. This implies
that in the absence of government support for the industry,
uptake of battery EVs will be relatively slow, as the market for
plug-in hybrid vehicles is assumed to be better able to support
itself. As such, government support is particularly important in
promoting battery EVs.
The CSIRO’s analysis highlights that support for EVs – and
disincentives for ICE vehicles – has a strong impact on uptake of the
technology. The CSIRO’s report suggests that, in the case of battery
EVs, rebates and a combination of CCM and vehicle to grid charging
are, in isolation, the most effective policies in increasing uptake.
By contrast, “feebates” discouraging the purchase of ICE vehicles,
were the least effective policies, with a “feebate” of 4 per cent
introduced from 2015 to 2030 having no impact on the forecast.
These findings show that promotion of a new technology is likely to
be more successful in growing the new market than discouraging
existing substitutes.
2.2.3 ABMARC
ABMARC is an independent engineering and research consultancy,
developing technical reports and analysis for industry sectors
such as automotive, transport, fuels, energy and mining. In 2012,
ABMARC released a study of the electric and hybrid vehicles
market, both internationally and domestically.
ABMARC expects that, in the absence of a significant shift in
government support for EV technology, it is unlikely that there will
be a significant uptake of EVs by 2020. However, ABMARC expects
growth in hybrid sales to be dramatic, driven by greater model
range, positive customer experiences and a convergence in prices
with equivalent internal combustion vehicles. Hybrids are expected
to be the ‘vehicle of choice’ for Australian consumers in 2020. That
is, conventional and plug-in hybrid growth is expected to be strong,
with traditional hybrid EVs expected to command 5 per cent of the
market in 2020 and plug-in hybrids an additional 1.4 per cent. In the
absence of government intervention, battery EVs are assumed to
reach just 4500 or 0.4 per cent of the market by 2020.

Sparking an Electric Vehicle Debate in Australia 19
Treasury also considered scenarios with differing levels of global
(outside Australia) action to mitigate climate change:
• Strong Growth, Low Pollution core policy scenario – EVs
enter the light vehicle road transport sector in 2021, before the
heavy vehicle transport sector, in 2025. To 2050, EV shares of
road transport vehicles are expected to grow at 12 per cent and
10 per cent respectively.
• Clean Energy Future scenario – Electric road transport heavy
vehicles are expected to comprise 0.1 per cent of the market
in 2018, before growing to 4.9 per cent by 2050, at an annual
growth rate of 13 per cent. Light EVs’ share of road transport
usage is expected to grow from 2021 to 2025, at an annual rate
of 11 per cent.
In all scenarios, petrol engine vehicles remain the major type of light
vehicle to 2050. See Figure 2.3 below.
2.2.4 Treasury modelling for the Clean Energy Policy
The Australian Treasury conducted modelling of vehicle market
share by type, and considered carbon emissions under local and
international carbon reduction strategies. The market for EVs
was considered in the context of emission levels from the road
transport sector.46
Treasury’s ‘core policy’ scenario reflects the previous Labor
Government’s carbon tax policy. It assumes the global target
equivalent to the policy, of a world with a 550ppm stabilisation
target and an emissions target cut of 5 per cent on 2000 levels by
2020, and an 80 per cent cut by 2050. Under its core scenario, EVs
are expected to enter the light and heavy vehicle road transport
markets in 2021, growing at 16 per cent and 10 per cent respectively
each year until 2050.
Figure 2.3: Road transport fuel mix, heavy vehicles (left graph), and light vehicles (right graph), market share (%)
Diesel
Biodiesels
Petrol
LNG & CNG
LPG
Synthetic Diesels
Petrol Blends
Electricity
0
20
40
60
80
100
20502040203020202010
0
20
40
60
80
100
20502040203020202010
Source: The Commonwealth Department of the Treasury ( 2011 )

20 Sparking an Electric Vehicle Debate in Australia
2.2.5 Federal Chamber of Automotive Industries
In 2010, the Federal Chamber of Automotive Industries (FCAI)
engaged PricewaterhouseCoopers (PwC) to undertake analysis
to assist in developing motor vehicle carbon emissions standards
in Australia.47 As part of this study, PwC made some projections
about vehicle uptake, by category, of which hybrid and EVs were
a component. PwC based its forecasts to 2020 on consultations
with the FCAI and vehicle manufacturers and importers. It assumed
market shares for each segment would remain unchanged beyond
2020. As shown in Figure 2.4, hybrid EVs are forecast to increase to
3 per cent of total fleet share by 2015, and 7 per cent by 2020.
Electric vehicles are forecast to increase to 0.5 per cent and 3 per
cent of total fleet share, over this time period, respectively.
2.2.6 Comparison of electric vehicle uptake forecasts
The variability in forecasts for key demand drivers such as fuel
prices and battery costs suggests it is challenging to predict growth
rates for electric vehicles in Australia. EVs have multiple risk factors:
they are an emerging technology selling into an existing consumer
market with incumbent players and they depend on supporting
infrastructure support. It is evident that car companies have
already begun to develop EV models. Most existing car companies
will increase participation as the market evolves. Others, like Tesla
and to some extent Nissan, have taken a more pro-active approach
to encouraging the EV market.
The uptake rate for EV sales in Australia will depend on the
availability of EVs in the Australian market, consumers being given
a value proposition they find attractive at large scale and the
support of other stakeholders to help drive and support critical
mass for the EV market.
Figure 2.4: FCAI market segment projections (selected vehicles)
2015 20202008
0%
10%
20%
30%
40%
50%
60%
Electric VehicleHybridPetrol passenger
56.7%
45.3%
39.3%
0%3.0%
7.0%
0% 0.5%3.0%
Source: PwC ( 2010 )

Sparking an Electric Vehicle Debate in Australia 21
2.3 Industry expectations for the Australian electric vehicle market
The esaa commissioned Deloitte to survey key stakeholders
to gain an industry perspective on the future of the Australian
electric markets. Stakeholders consulted included the Victorian
Department of Transport (DoT), Better Place Australia, General
Motors Holden, Mitsubishi, and Toyota. Their expectations
for future growth and explanations for historical uptake are
discussed below.
Stakeholders generally expressed the view that growth in
EV sales is inevitable, but the timing of penetration is difficult
to predict and depends on a number of factors. DoT noted
that EV uptake is currently in the volatile pre-adoption phase
typical of a new technology. It compared EVs to mobile phones,
which were prohibitively expensive for many years in the absence
of supporting technology which, once introduced, made them
accessible to the mass market.
Developing industries typically follow an ‘S’ curve (see Figure
2.5), featuring a tipping point at which the technology begins to
experience mainstream adoption. A critical sales mass is required
to push the market past this point to the adoption phase, at which
time the new technology is prevalent in the market, and considered
a viable consumer choice. Sales growth tends to then increase
quickly, before slowing once the market accepts the technology
as a mainstream option. The market for EVs is yet to pass the
tipping point, however it is expected that EVs will follow this path
over the next three to four decades.
Vehicle manufacturers are less optimistic about growth in EVs.
One large vehicle manufacturer suggested that it would be
reasonable to expect PEV penetration could be less than 5 per
cent of the total fleet in 2025. It is generally expected that electricity
will eventually displace petrol and diesel. However, low government
support means that petrol and diesel will remain the dominant
fuels in the market.
Stakeholders also suggested that battery and other key
components are not yet advanced enough to enable economies
of scale to be realised, therefore manufacturers have unable to
lower the price sufficiently for consumers to consider purchasing
an EV. It was suggested by existing car manufacturers that the
future of EVs lies predominately in hybrid technology, and that
battery EVs will follow the success of hybrid vehicles.
Electric vehicle uptake has been hindered by a lack of support.
Stakeholders consistently commented that EV penetration is
primarily driven by government funding and incentives. Deloitte’s
consultations revealed there exists a classic policy conundrum
in the market: manufacturers will not enter the market unless
they know there is sufficient supporting infrastructure
(e.g. charge points) to facilitate customer uptake. Conversely,
infrastructure providers will not enter the market unless there
is a real commitment from car manufacturers. At present,
the economic value is insufficient to justify investment.
This first mover problem can be resolved with government support.
Some vehicle manufacturers suggested it is their responsibility
to make investment in Australia a viable economic decision.
Figure 2.5 New technology adoption phases: the ‘S’ curve
Source: Victorian Department of Transport
Market integrationAdoption phasePre-adoption
tipping point
Time
Vehi
cle
sale
s

22 Sparking an Electric Vehicle Debate in Australia
43 AECOM (2012), Impact of Electric Vehicles and Natural Gas Vehicles
on the Energy Markets.
44 See Diffusion modelling of EV uptake: methodology and case study
for Victoria (2011), and Spatial Modelling of Electric Vehicle Charging
Demand and Impacts on Peak Electrical Loads in Victoria (2012).
45 CSIRO (2012), Spatial Modelling of Electric Vehicle Charging Demand and
Impacts on Peak Household Electrical Load in Victoria, Australia.
46 Treasury, (2011), Strong Growth, Low Pollution: Modelling a Carbon Price,
pp.75–76.
47 PwC, (2010), Managing Vehicle Carbon Emissions: Options for
development of a standard.
33 Tesla Motors, Reserve Your Tesla. Last accessed 2 August 2013.
34 CarsGuide (2013), Better Place retreat stalls Renault Fluence EV, from
http://www.carsguide.com.au/news-and-reviews/car-news/better_
place_retreat_stalls_renault_fluence_ev. Retrieved 15 May 2013.
35 Sourced from industry consultation.
36 For more information, visit http://www.transport.vic.gov.au/projects/
ev-trial.
37 ABMARC (2012) Electric & Hybrid Vehicles Australia: An Automotive
Perspective.
38 Toyota Australia, Toyota sells 50,000 Hybrid Car in Australia,
Last accessed 1 August 2013.
39 The Australian, 28 February 2012, ‘Honda lowers hybrid price’, Philip King.
40 AECOM (2009), Economic Viability of Electric Vehicles.
41 AECOM (2011), Forecast Uptake and Economic Evaluation of Electric
Vehicle in Victoria.
42 See Appendix B for details about specific charging levels.
th

Sparking an Electric Vehicle Debate in Australia 23
Figure 3.1 Fuel costs per kilometre, by vehicle typeWhether a car is powered by petrol, diesel, steam or electricity,
it is still a car. The direction of the car market is still determined by
consumer preference. The potential for a new technology
to make inroads into an existing market will depend on its ability
to provide an effective value proposition. Widespread public
interest in innovative new technologies does not automatically
translate in their willingness to buy them.
This chapter examines some of the key factors that are likely to
influence consumer choices in whether or not to consider an
EV for their next vehicle, and consider how policy makers and
industry stakeholders might introduce measures to make
electric cars a more attractive alternative.
3.1 Benefits of an electric vehicle
3.1.1 Lower fuel costs
Fuel costs are typically the greatest ongoing cost associated with
vehicle ownership. Battery EVs currently produce the lowest fuel
costs per kilometre of all engine types, analysis conducted by
AECOM for the Department of Transport shows.48 Battery EVs
are estimated to incur an equivalent fuel cost of approximately
$0.03 per kilometre, compared to an ICE which incurs more than
$0.10 per kilometre, according to AECOM’s analysis. This is due
to the relative cost of electricity ($0.25–30c/kWh) compared
to petrol ($1.40–1.50/L).
3 The pros and cons of electric vehicles
Source: AECOM, ( 2011 ) Forecast uptake and economic evaluation
of EVs in Victoria
ABMARC conducted a similar study to AECOM, comparing total
running costs of battery electric and hybrid vehicles to ICE vehicles.
The running cost of EVs will vary depending on the price paid
for electricity. ABMARC developed a comparative range, finding
that the cost of charging a battery EV is 22 per cent of the cost of
operating an ICE at off peak times, and approximately 50 per cent
of the running cost of an ICE at peak times.49
The US Department of Energy calculates the equivalent fuel cost
for EVs through its e-Gallon tool. It gives consumers an indication
of the fuel savings available with EVs. Figure 3.2 shows how refuelling
an EV has not only been cheaper than petrol since 2001, but that
electricity prices have been far more stable than petrol prices
over the same period.
Australian petrol prices are around 50 per cent higher than in
the US.50 While electricity prices are also higher in Australia,
the equivalent ‘e-Petrol’ price in Australia would still be
commensurately less than current petrol prices.
$/km
$0.00
$0.02
$0.04
$0.06
$0.08
$0.10
$0.12
$0.14
$0.16
ICEHybridPHEVBEV
Battery EVs currently produce the lowest fuel costs per kilometre of all engine types.

24 Sparking an Electric Vehicle Debate in Australia
Figure 3.2: Comparison between petrol and electricity refuelling costs, US, 2001–13
Cost
per
gal
lon
of g
asol
ine
equi
vale
nt
$0.00
$0.50
$1.00
$1.50
$2.00
$2.50
$3.00
$3.50
$4.00
$4.50
$5.00
Jul-1
3
Apr
-13
Jan-
13
Oct
-12
Jul-1
2
Mar
-12
Jan-
12
Oct
-11
Jul-1
1
May
-11
Feb-
11
Oct
-10
Jul-1
0
Apr
-10
Jan-
10
Oct
-09
Jul-0
9
Apr
-09
Jan-
09
Oct
-08
Jul-0
8
Apr
-08
Jan-
08
Oct
-07
Jul-0
7
Feb-
07
Sep-
06
May
-06
Jan-
06
Sep-
05
Mar
-05
Nov
-04
Jun-
04
Mar
-04
Dec
-03
Feb-
03
Oct
-02
Jul-0
2
Apr
-02
Feb-
02
Oct
-01
Jun-
01
Oct
-00
Apr
-00
GasolineElectricity *
*Electricity prices are reduced by a factor of 3.4 because electric motors are approximately 3.4 times as efficient as internal combustion engines
3.1.2 Efficiency
More than 90 per cent of car trips are in urban driving conditions,
which are typified by constant stop-start motion. One of the
principle benefits of electric vehicles in these conditions is that
the engine stops operating when stationary. This improves range,
reduces noise and pollution in traffic. This feature has been utilised
in the development of petrol-electric hybrid vehicles to date.
Electric motors are highly efficient at delivering energy and
converting it into movement. They achieve this energy conversion
efficiency over the full range of speeds and power output and can
be precisely controlled. As a result they do not require gearboxes,
further reducing weight and running costs.
They can also be combined with regenerative braking systems
that have the ability to convert movement energy back into stored
electricity. This can be used to reduce the wear on brake systems
(and consequent brake pad dust) and reduce the total energy
requirement of a trip. Regenerative braking is especially effective
for start-and-stop city use.
ABMARC also conducted analysis on ‘well to wheel’ efficiency,
which is the efficiency of the refining (or recharging) process,
multiplied by the efficiency of the vehicle. It found that an ICE
converts just 18 per cent of the petrol it uses into power, as more
than 70 per cent of the energy generated is lost as heat (e.g. due to
friction or exhaust), with the remainder lost through the drivetrain.
ABMARC concluded that the total efficiency of an average ICE is
just 15 per cent.
By comparison, a battery EV is highly efficient, ABMARC found.
Approximately 76 per cent of power from the battery is converted
to power. However, it is recognised that the total efficiency of an EV
is diminished through inefficiencies in the electricity transmission
and distribution phases. As such, ABMARC concluded that a battery
EV has a total efficiency of 23 per cent.
ABMARC estimated that a battery EV is 58 per cent more efficient
than an ICE vehicle from an energy conversion perspective alone,
and an additional 8 per cent more efficient than an ICE from a total
‘well to wheel’ perspective.
Technical energy efficiency conversion levels are not especially
relevant in themselves, but they provide an underlying physical
rationale for why PEVs should be able to sustain significantly lower
fuelling costs than ICEs.
Alternative Fuels Data Centre, US Department of Energy, Clean Cities Alternative Fuel Price Report

Sparking an Electric Vehicle Debate in Australia 25
The RACQ’s Private Vehicle Running Costs Guide 2013 showed
that servicing costs showed that for EVs were lower than
equivalent ICE vehicles.52
3.1.4 Performance
The performance of passenger vehicles reflects the handling,
braking and acceleration of the car. It is clearly an important
consideration for a significant share of the consumer market.
While the development of EVs is in its infancy, it is clear from a
number of high-end models that EVs have the potential to enjoy
considerable torque, resulting from the highly efficient and
immediate transfer of energy to the wheels.
To illustrate, the top of the range Tesla Model S can accelerate
from 0–100km/h in 4.4 seconds, the company says. This type of
acceleration is not evident on smaller EVs where the engine and
battery has been reduced to reduce weight and cost.
EVs can also exploit a lower centre of gravity in the car and
advanced aerodynamics, both due to the absence of the engine
high up in a conventional car (which contributes to drag), and the
distribution of battery weight lower in the vehicle. The Tesla Model
S has a claimed drag coefficient of 0.24, among the lowest ever
recorded for production line vehicles.53
3.1.5 Safety
High safety standards have become synonymous with most new
cars. But a recent independent safety test of an all-electric car
suggests EVs may have a clear safety advantage to combustion
engine cars, primarily because of the absence of the engine block.
In August, the Tesla Model S was given a 5-star safety score by the
US National Highway Traffic Safety Administration (NHTSA). Tesla
claimed the four-door sedan topped the NHTSA safety rankings
with a score of 5.4 out of 5 (safety levels better than 5 stars are
captured in the overall Vehicle Safety Score (VSS) provided to
manufacturers). But the NHTSA has pointed out that 5 stars is the
highest possible rating.54
The absence of a large combustion engine located inside the
car enabled designers to increase crumple room and to use the
reduced weight to increase structural safety throughout the car.
This, in addition to its low centre of gravity and superior handling,
may signal that EVs enjoy a potential safety advantage over
conventional cars.
3.1.3 Maintenance costs
Electrical motors are very simple in design and simple to operate
and maintain. Electrical components such as the motor and
controllers require less maintenance, with additional savings
attributable to EVs over ICEs through reductions in the frequency
of brake pad replacements.
AECOM, in its 2011 report for the Department of Transport,
considered total maintenance costs for battery EVs as a proportion
of total maintenance costs for ICEs. This included battery
replacement costs, which AECOM assumed to be negligible, as
battery life was presumed to equal or exceed vehicle life. It noted
that over time, battery replacement costs would diminish as
economies of scale and industry efficiency gains prevail.
Overall, AECOM found that an EV incurs approximately 70
per cent of the maintenance costs per kilometre of an ICE.51
A breakdown of maintenance costs by vehicle type and size
is given in Figure 3.3 below.
Figure 3.3 Maintenance costs per kilometre, by vehicle type and size
ICEEV
Cent
s per
km
0
1
2
3
4
5
6
7ICE
EV
Passenger largePassenger mediumPassenger small
Source: AECOM ( 2011 ), Forecast uptake and economic evaluation
of EVs in Victoria

26 Sparking an Electric Vehicle Debate in Australia
3.1.8 Environmental and efficiency values
The environmental benefits of EVs, in terms of lower tailpipe
emissions and the potential for recharging with renewable
energy to lower overall emissions (discussed in section 4.1), are
key selling points for some customers. Research has suggested
that early adopters of hybrids and EVs have been impacted by
ideological reasoning, such as seeing themselves as: “making a
commitment: setting an example, being a pioneer, talking to
other people about their car.” 64
While the environmental benefit of owning an EV in Australia is
highly dependent on the recharging fuel mix, the potential for
lower overall emissions is clearly an important selling feature.
Adding to this, the fact that controlled charging of EVs could
improve the efficiency of the overall electricity supply system
could be a powerful incentive for customers who are affected by
environmental efficiency arguments.
3.2 Barriers facing electric vehicles
While electric vehicles have the ability to exploit some clear
design and performance advantages, some barriers remain
when compared to conventional vehicles. These include purchase
price premiums over conventional cars, driving range of vehicles,
the availability of charging (refuelling) infrastructure and
uncertain resale values.
In 2011, Deloitte conducted a survey of global vehicle customers,
identifying average perceptions of EV technology, some
characteristics of potential ‘first movers’ in the market to purchase
EVs and some of the issues which would make them less likely to
purchase an EV.65 The results of this global study suggest that:
• China and India lead the world with customers considering
themselves a ‘first mover’ in the purchase of EVs, with 50 per
cent and 59 per cent of survey respondents respectively.
• Only 13 per cent of Australian respondents consider
themselves first movers, whereas 41 per cent of Australians said
they were ‘not likely to consider’ purchasing an EV.
• 37 per cent of Australian respondents said they would prefer a
mid-size sedan EV, with 16 per cent preferring a small sedan, and
14 per cent preferring a large sedan.
3.1.6 Noise
EVs make no noise when stationary and low levels of noise when
operating. The collective impact is difficult to measure, although
the CityHush Project funded by the European Commission
proposed EV-only precincts in cities, estimating this would result
in a15dB(A) reduction in ambient noise levels.55
Conversely there have also been concerns raised about the impact
on pedestrians, in particular if they are visually impaired.56 Work is
underway to find methods to ensure that there is some noise from
EVs to act as a warning for pedestrians and cyclists. The European
Electric Vehicle Alert for Detection and Emergency Response
(eVADER) project is finding ways to warn people of an oncoming
EV.57 In the US, the National Highway Traffic Safety Administration
has developed standards for a minimum noise level from EVs.58
3.1.7 Image and brand
After upfront and ongoing costs, image and brand are among
the top factors that impact a vehicle purchase decision.
In fact, brand image is, on average, a more influential factor in
determining consumer decisions than both fuel consumption
and environmental performance.59
In 2007, Topline Strategy Group conducted a survey investigating
the main reasons consumers purchased a Toyota Prius. It found
that while over 70 per cent of purchasers had strong financial
motives as the primary reason for their purchase, the image of
the vehicle was another prominent reason for these respondents’
purchases. Five per cent of respondents nominated the image of
the Prius as the primary reason for their purchase.60
A similar logic can be applied to battery EVs. As an emerging
technology, there will be a subset of ‘first-movers’ who purchase
a vehicle simply to be among the first to do so, or to experience
first-hand the latest advancements in vehicle technology.61
In its 2011 study of global consumer preferences, Deloitte
found that first movers are likely to be well-educated, live in
urban areas, and represent the upper or middle classes.
They view themselves as environmentally conscious and
trendsetting, emphasising the environmental benefits
of EVs, as well as their stylish characteristics.62
Along with emphasising the technical benefits of the vehicle,
manufacturers understand the importance of designing
EVs in stylish, innovative fashions, to appeal to consumers and
reflect the cutting edge technology that the vehicles represent.
Small, mainstream EVs are compact and futuristic, whereas
premium vehicles are more associated with a sports vehicle
style and performance.63

Sparking an Electric Vehicle Debate in Australia 27
Box 3.1: Battery costs
Batteries are one of the main costs in an EV. As such,
forecasting EV prices and sales are very much contingent
upon the price of batteries over the period.
The lithium-ion (L-ion) battery is being heavily researched
and developed for EVs. Commonly found in laptop
computers, the L-ion battery yields impressive power,
energy and charge density: three factors which are critical
to the range and performance of an EV. However, much
conjecture exists about the price of batteries into the future.
Some industry experts predict battery prices, through
increased competition, research and demand for batteries
from vehicle manufacturers, will fall rapidly in coming years,
whereas others feel the outlook for batteries is somewhat
less promising.
Battery price reduction estimates are mixed, ranging from a
33 per cent to 67 per cent reduction by 2020 on 2010 levels.
The combination of higher up-front costs but lower fuel and
maintenance costs means that at EVs could at some point cost
less overall than a comparable ICE vehicle. EPRI found that at a
$10,000 premium, EVs become a lower cost option than an ICE
after around 8 years.67
There are qualifications to EPRI’s analysis. EVs will likely need a
battery replacement after around 8–10 years at a cost of around
$5000. But at around the same time, running costs for ICE vehicles
tend to rise as the maintenance schedule increases. Based on this,
at a $10,000 premium, an EV will be more or less cost competitive
with a comparable EV over the life of a vehicle (10–15 years). The
exact point at which an EV breaks even with an ICE will depend
on electricity and petrol prices, driving distances and battery
replacement costs.
3.2.1 Price
Although EV operating costs are low compared to an internal
combustion vehicle, the cost of the vehicle is considerably higher
relative to commensurate petrol engine vehicles. For example the
Nissan LEAF ($39,990) is similar to the Nissan Tiida ($17,990),
but more than double the sticker price. Price differentials on
this scale are a major barrier to consumers, particularly in the
compact car market.
High vehicle production development costs are driving the high
purchase prices of EVs. One manufacturer indicated that it is
unlikely to ever recover the total research and development costs
of its EV through sales. Another manufacturer noted that due
to the overall cost of a car in proportion to incomes, people are
unwilling or less likely to take a risk on new technologies without
a significant demonstration of additional value. However, it was
noted by a number of stakeholders that EV sales during the pre-
adoption phase were never expected to be strong.
Deloitte’s global EV survey found that most survey respondents
would not be prepared to pay any premium for an EV. In Australia,
69 per cent of respondents indicated that they would not be
prepared to pay any premium at all. Further, 75 per cent of
Australian respondents suggested they would want to purchase an
EV for $30,000 or less.66 Unfortunately this shows that work still
needs to be done to inform consumers over the long-term costs of
running ICE vehicles and EVs to show that although EV cost more
initially, running costs are lower.
All stakeholders listed high purchase price compared to ICE
substitutes as a major barrier to uptake. This is driven by the battery
cost, which can comprise up to 50 per cent of the total cost of an
EV. The ability of key components like batteries to fall in cost and
improve in efficiency will be critical to improving the cost and value
of EVs for consumers.

28 Sparking an Electric Vehicle Debate in Australia
EVs could already manage the usual needs of most drivers,
most of the time. Evidence from California indicates that
94 per cent EV drivers also own a conventional vehicle.72
This shows that some EV owners are addressing their range
anxiety by having a second vehicle available.
It seems that unrealistic tests are put on cars – like the ability
to drive uninterrupted between two major cities – when most
Australians fly these routes or drive inter-city a few times in their
lifetimes. In the Australian context, almost 80 per cent of travel
between Melbourne and Sydney is now done by air.73 In 2012 more
than 8 million passengers flew between Melbourne and Sydney.74
Improvements in range and fuel efficiency are expected to occur
over time. The main limiting factor for range is energy density, or
how much energy the battery can store per unit of mass. Although
it is expected that energy density will improve by 2020, most
vehicles to be introduced to 2014 are likely to offer similar ranges
to those already available.75
A Victorian Integrated Survey of Travel and Activity found that
79 per cent of drivers travelled 50km or less per day. The Victorian
Government’s EV Trial showed that EV drivers had different driving
patterns: 94 per cent of vehicles travelled 50km or less per day.
Figure 3.4 shows the average daily driving distance for metropolitan
Melbourne drivers and for EV trial participants.76 Preliminary
research from EPRI found that EV drivers frequently adapt to the
limited range of an EV.77
3.2.2 Range
The typical range for PEVs is from 120–300 km, depending on
vehicle type (range tends to be further in larger vehicles). Range
is extended to “conventional” combustion engine distances
if a hybrid engine is added (at additional cost and weight).68
Interestingly even the shortest range EVs appear to be sufficient
for the majority of average daily commutes in Australian cities.
In surveying typical commuter distances in Australia, AECOM found
that between 95–99 per cent of return commuter trips in Adelaide
were 100km or less, and between 85–90 per cent were 100km or
less in Sydney.69 Deloitte’s global EV survey found that in Australia,
78 per cent of respondents drove less than 80kms each day 70 and in
metropolitan Melbourne 91 per cent of drivers travel 80km or less
each day.71 Yet, according to Deloitte only 50 per cent were satisfied
with a vehicle that drove 200kms or less on a single charge, and only
73 per cent were satisfied with 300kms or less.
Concern over the range of EVs has been termed “range anxiety”.
EVs pose range challenges for the occasional longer trips. These
concerns are exacerbated by the lack of recharging infrastructure.
Behaviourally, car drivers have become accustomed to refuelling
irregularly and carrying a few hundred kilometres of fuel around
in their car. They are unaccustomed to treating a car more like a
mobile phone, and recharging it daily.
Figure 3.4: Driving patterns of average Melbourne drivers vs EV Trial drivers, 2012
Melbourne Metro
VIC EV Trial
Cum
ulat
ive
perc
enta
ge o
f veh
icle
s
0%
10%
20%
30%
40%
50%
60%
70%
80%
90%
100%
150140130120110100908070605040302010
Average daily vehicle driving distance (km)
8%
36%
65%
85%
94%98% 99% 100%
23%
42%59%
70%
79%84%
89% 91%94% 95% 96% 97% 98% 98% 98%
Source: Victorian Department of Transport

Sparking an Electric Vehicle Debate in Australia 29
But EV manufacturers are working on ways to address ‘range
anxiety’ through a variety of measures. Tesla is building a network
of ‘Supercharger’ fast chargers where Tesla owners can recharge
for free. Tesla has installed 16 stations which provide half a charge in
about 20 minutes and an 80 per cent charge in 40 minutes. Tesla’s
plan is to have the network cover 80 per cent of the US population
in 2014, and 98 per cent in 2015.78 Similarly, Nissan plans to add 500
quick charging stations in the US by mid-2014.79 Meanwhile, BMW
and Audi are providing EV owners with petrol-fuelled loan vehicles
to allow drivers to complete longer trips.80
The American Automobile Association has also developed an EV
mobile charging unit to assist drivers who have run out of charge.81
It provides them with 8 kilometres of driving range in less than 10
minutes of charging time.82 Finally, the development of phone apps
and navigation systems can provide EV drivers with information
about remaining range and the closest charging stations. This can
help drivers to plan their journey and adapt to changing conditions.
3.2.3 Charge times and availability
At present, there are very few public charge points in Australian
metropolitan areas, meaning it is difficult for consumers to
charge their EV outside of home. The use of Level 1 charging
(from a standard wall outlet) typically takes around eight hours
to recharge most electric vehicle batteries.
Figure 3.5: Electric vehicle charging station at Melbourne Museum, 2013
Public recharging company chargepoint.com.au currently offers
51 public charge points across Australia.83 By comparison, there are
6444 in total across the US.84
One of the key barriers to EV uptake identified from the trials
conducted by the Victorian Department of Transport was lack
of infrastructure. This limits the EV market to households with
a garage or equivalent off street parking where they can recharge
the vehicle.
Consumer expectations of speed of charging are far greater than
current technology permits. There are three current levels of
EV recharging:
• Level 1 (plug-in conventional power point): 5 to 10 kilometres
of range per hour of charging
• Level 2 (dedicated inverter): 15 to 25 kilometres of range
per hour of charging
• Level 3 (DC fast charging): up to 100 kilometres of range
in 20 minutes of charging
Level 2 rechargers are falling rapidly in price and are now sold
for under $1000. Level 3 rapid chargers currently cost between
USD 17,500–50,000, with energy requirements that can place
stress on the grid. Australian company Tritium has developed
a Level 3 charging technology that can give 50 kilometres range
in just 10 minutes.85
Most respondents to Deloitte’s global survey86 expected the
vehicle to recharge in two hours or less. In Japan, 73 per cent of
respondents said they would not purchase an EV whose battery
took over one hour to charge. In Australia, 23 per cent cited 30
minutes as the longest acceptable charge time. Current battery
capacities simply do not allow for this.
3.2.4 Other factors
Battery switching – Vehicle manufacturers suggested that one
way to reduce upfront costs, reduce recharge times and therefore
improve range would be to swap rather than recharge batteries.
But due to intellectual property issues, manufacturers appear to be
unwilling to take part in a battery swapping schemes. With Renault
Fluence indefinitely halting its entry into the Australian market and
Better Place going bankrupt, there appear to be significant barriers
to battery swap models at this time.
Source: esaa
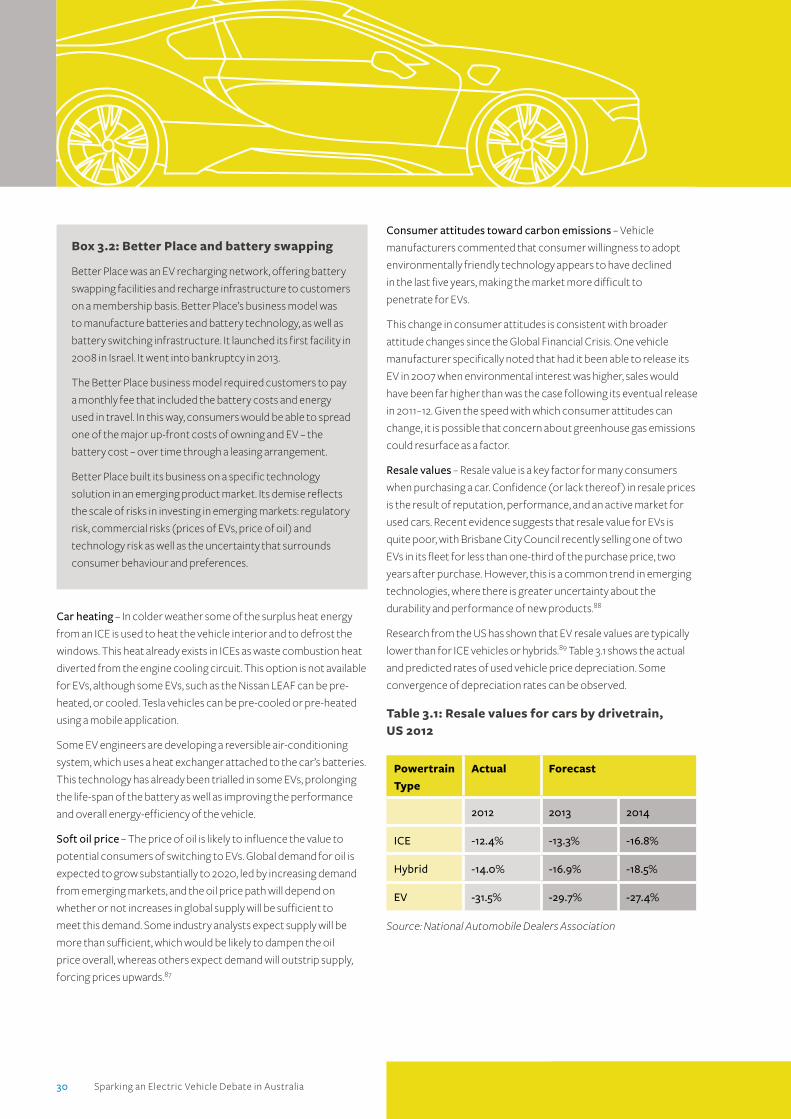
30 Sparking an Electric Vehicle Debate in Australia
Consumer attitudes toward carbon emissions – Vehicle
manufacturers commented that consumer willingness to adopt
environmentally friendly technology appears to have declined
in the last five years, making the market more difficult to
penetrate for EVs.
This change in consumer attitudes is consistent with broader
attitude changes since the Global Financial Crisis. One vehicle
manufacturer specifically noted that had it been able to release its
EV in 2007 when environmental interest was higher, sales would
have been far higher than was the case following its eventual release
in 2011–12. Given the speed with which consumer attitudes can
change, it is possible that concern about greenhouse gas emissions
could resurface as a factor.
Resale values – Resale value is a key factor for many consumers
when purchasing a car. Confidence (or lack thereof ) in resale prices
is the result of reputation, performance, and an active market for
used cars. Recent evidence suggests that resale value for EVs is
quite poor, with Brisbane City Council recently selling one of two
EVs in its fleet for less than one-third of the purchase price, two
years after purchase. However, this is a common trend in emerging
technologies, where there is greater uncertainty about the
durability and performance of new products.88
Research from the US has shown that EV resale values are typically
lower than for ICE vehicles or hybrids.89 Table 3.1 shows the actual
and predicted rates of used vehicle price depreciation. Some
convergence of depreciation rates can be observed.
Table 3.1: Resale values for cars by drivetrain, US 2012
Powertrain
Type
Actual Forecast
2012 2013 2014
ICE -12.4% -13.3% -16.8%
Hybrid -14.0% -16.9% -18.5%
EV -31.5% -29.7% -27.4%
Source: National Automobile Dealers Association
Box 3.2: Better Place and battery swapping
Better Place was an EV recharging network, offering battery
swapping facilities and recharge infrastructure to customers
on a membership basis. Better Place’s business model was
to manufacture batteries and battery technology, as well as
battery switching infrastructure. It launched its first facility in
2008 in Israel. It went into bankruptcy in 2013.
The Better Place business model required customers to pay
a monthly fee that included the battery costs and energy
used in travel. In this way, consumers would be able to spread
one of the major up-front costs of owning and EV – the
battery cost – over time through a leasing arrangement.
Better Place built its business on a specific technology
solution in an emerging product market. Its demise reflects
the scale of risks in investing in emerging markets: regulatory
risk, commercial risks (prices of EVs, price of oil) and
technology risk as well as the uncertainty that surrounds
consumer behaviour and preferences.
Car heating – In colder weather some of the surplus heat energy
from an ICE is used to heat the vehicle interior and to defrost the
windows. This heat already exists in ICEs as waste combustion heat
diverted from the engine cooling circuit. This option is not available
for EVs, although some EVs, such as the Nissan LEAF can be pre-
heated, or cooled. Tesla vehicles can be pre-cooled or pre-heated
using a mobile application.
Some EV engineers are developing a reversible air-conditioning
system, which uses a heat exchanger attached to the car’s batteries.
This technology has already been trialled in some EVs, prolonging
the life-span of the battery as well as improving the performance
and overall energy-efficiency of the vehicle.
Soft oil price – The price of oil is likely to influence the value to
potential consumers of switching to EVs. Global demand for oil is
expected to grow substantially to 2020, led by increasing demand
from emerging markets, and the oil price path will depend on
whether or not increases in global supply will be sufficient to
meet this demand. Some industry analysts expect supply will be
more than sufficient, which would be likely to dampen the oil
price overall, whereas others expect demand will outstrip supply,
forcing prices upwards.87

Sparking an Electric Vehicle Debate in Australia 31
72 California Center for Sustainable Energy, California Plug-in Electric
Vehicle Owner Survey, May 2013.
73 Department of Infrastructure, Transport, Regional Development and
Local Government, Sydney-Melbourne Corridor Strategy, 2007.
74 Bureau of Infrastructure, Transport and Regional Economics, Domestic
Aviation Activity Annual 2012.
75 Deloitte Touche Tohmatsu Limited, (2012), Global Manufacturing
Industry group analysis.
76 Victorian Government, 2013, Creating a Market: Victorian Electric
Vehicle Trial Mid-term Report.
77 Electric Power Research Institute, Total Cost of Ownership for Current
Plug-in Electric Vehicles, EPRI, Palo Alto, CA, 2013.
78 Tesla, Supercharger, from http://www.teslamotors.com/supercharger.
Retrieved 7 August 2013.
79 Nissan News, from http://nissannews.com/en-US/nissan/usa/releases/
nissan-to-triple-electric-vehicle-fast-chargers-partners-with-nrg-
energy-to-build-first-fast-charge-network-in-washington-d-c-area.
Retrieved 12 September 2013.
80 Rocky Mountain Institute, Is the End of EV Range Anxiety in Sight?
Nine Strategies To Put EV Owners At Ease, from http://blog.rmi.org /
blog_2013_06_20_is_the_end_of_ev_range_anxiety_in_sight.
Retrieved 7 August 2013.
81 AAA, AAA Presents Electric Vehicle Mobile Charging Unit to Electric
Drive Transportation Association, from http://newsroom.aaa.
com/2011/06/ev-mobile-charging-unit/. Retrieved 7 August 2013.
82 Rocky Mountain Institute, op cit.
83 www.chargepoint.com.au.
84 www.afdc.energy.gov.
85 http://reneweconomy.com.au/2013/australian-tech-breakthrough-
slashes-electric-vehicle-charge-time-26696.
86 Deloitte (2011), Unplugged: Electric vehicle realities versus consumer
expectation.
87 Reuters (2012), Analysis: Does US shale mean cheap global oil by
2020? From http://www.reuters.com/article/2012/10/31/us-oil-poll-
idUSBRE89U0LQ20121031. Retrieved 8 April 2013.
88 Carsguide.com.au (2012), Electric car resale values low, from http://www.
carsguide.com.au/news-and-reviews/car-news/electric_car_resale_
values_low. Retrieved 15 May 2013.
89 National Automobile Dealers Association, Plug-in Electric Vehicles:
Market Analysis and Used Price Forecast, Q2 2013.
48 AECOM (2011), Forecast uptake and economic evaluation of electric
vehicles in Victoria.
49 ABMARC (2012) Electric & Hybrid Vehicles Australia:
An Automotive Perspective.
50 Australian Institute of Petroleum, International Price Comparisons,
retrieved from http://www.aip.com.au/pricing /internationalprices.htm.
51 AECOM (2011), Forecast uptake and economic evaluation of electric
vehicles in Victoria.
52 RACQ, Private Vehicle Running Costs 2013.
53 Car and Driver, ‘Tesla Model S Review’, January 2013.
54 NHTSA, from www.nhtsa.gov. Retrieved 11 September 2013.
55 www.cityhush.org.
56 Physics Today, ‘Noisy Electric Vehicles but Not Too Noisy’, 13 June 2013.
57 eVADER, Electric Vehicle Alert for Detection and Emergency Response
(eVADER), from http://evader-project.eu/. Retrieved 6 August 2013.
58 National Highway Traffic Safety Administration, US Department of
Transportation Proposes New Minimum Sound Requirements for
Hybrid and Electric Vehicles, 7 January 2013.
59 Victorian Department of Transport, Potential early Adopters
of Electric Vehicles in Victoria, 2012, p. 4.
60 Topline Strategy Group (2007), Why People Really Buy Hybrids, p.5.
61 Ibid.
62 Deloitte (2011), Unplugged: Electric vehicle realities versus
consumer expectations, p.2.
63 motortrend.com (2013), themotorreport.com.au (2013),
extremetech.com (2013).
64 Victorian Department of Transport, Potential early Adopters
of Electric Vehicles in Victoria, 2012, p. 4.
65 Deloitte, (2011), Unplugged: Electric vehicle realities versus
consumer expectations.
66 Ibid.
67 Electric Power Research Institute, Total Cost of Ownership for
Current Plug-in Electric Vehicles, EPRI, Palo Alto, CA, 2013.
68 AECOM (2012), Impact of Electric Vehicles and Natural Gas
Vehicles on the Energy Markets.
69 Ibid.
70 Deloitte (2011), Unplugged: Electric vehicle realities versus
consumer expectation.
71 Victorian Government, 2013, Creating a Market: Victorian Electric
Vehicle Trial Mid-term Report.

32 Sparking an Electric Vehicle Debate in Australia
New technologies constantly evolve into consumer markets.
The role of government is mostly prudential – to ensure that the
safety of consumers is not compromised with the evolution of new
technologies. In some cases there are broader, strategic benefits
that governments may seek to capture by advancing or facilitating
new technologies. The first mobile phone network was developed
in Australia by a government owned business – Telecom Australia.
Both major parties support government co-ordinating the
provision of a national broadband network, they just disagree
on the specific method.
This section discusses what strategic benefits would be delivered
by an accelerated roll out of electric vehicles in Australia.
4.1 Pollution and greenhouse emissions
Pure EVs are viewed as ‘green’ alternatives to ICEs. An electric
motor has no waste gases or exhaust fumes. Conventional
combustion engines have continued to reduce the levels of
pollutants they release into the air. But these pollutants still
accumulate in urban airsheds creating smog, which in turn can
contribute to upper respiratory problems and lung damage.
In its EV trials, the Victorian Department of Transport tested
cumulative greenhouse gas emissions calculated over an average
vehicle lifetime for an ICE, and a comparable battery EV, operating
on both the Victorian electricity grid and renewable energy.90
The study found that a vehicle charged via Victoria’s grid electricity
is likely to produce more greenhouse emissions than an ICE, with
no likely break-even point.
This result occurs because measurements of total EV emissions
must incorporate emissions embedded in the electricity
generation process. In Victoria in particular, brown coal is the
primary fuel for electricity generation. Brown coal is among the
most greenhouse emissions intensive fuel source. As a result,
EVs charged primarily from this source will have a greater carbon
footprint than emissions from an ICE.
However, the Victorian study found that when an EV was charged
via renewable energy sources, a battery EV will produce net
lifecycle greenhouse gas emissions reductions within three years of
operation.91 That is, a battery EV charging on renewable electricity
is projected to generate lower cumulative greenhouse gas
emissions than an ICE within three years.
If fuel combustion alone is considered, even when the electricity
used to charge EVs comes from a CO2
-emitting source, such as
a coal- or gas-fired powered plant, the net CO2
production from
an electric car can be lower than from a comparable combustion
vehicle. New passenger vehicles emit 198gCO2
-e/km.92 An EV uses
about 0.18kWh of energy to travel 1 km. Based on the average
emissions intensity of Australia’s grid of 0.86tCO2
-e/MWh,
an EV will emit 154gCO2
-e/km, around 22 per cent less than
new passenger vehicles.
The advantage of EVs compared to conventional vehicles is their
ability to reduce emissions based on the source of energy used,
whereas combustion engines lock in a pre-determined rate of
greenhouse emissions (unless the driver switches to biofuels).
GreenPower or Renewable Energy Certificate purchases present
opportunities for promoting EV charging with renewable energy.
There is also scope for interaction between EV recharge periods
and wind farm generation, as the times at which EVs are likely to be
generally charged (overnight) coincides with the times at which
wind farm energy generation is higher.93
4.2 More efficient use of energy networks
One of the benefits of using electricity to power transport vehicles
is that the distribution network and infrastructure already exists,
and is widespread. The main initial additional cost is the provision
of fast charging infrastructure, and in the longer term the potential
to integrate EVs and their storage as part of a smart grid. In the
short to medium term, the modest uptake of EVs is unlikely to
pose significant impact on the network, or on its operation.
Given EV battery sizes and driving patterns in Australia, each
EV may require from 2kWh to 20kWh of electrical energy per day.94
But CSIRO modelling projected to 2033 identifies the need for
strategic planning during the development of an EV to ensure
that pricing incentives and charging technologies are used to
optimise the network.
Controlled charging, combined with Vehicle to Grid capabilities,
where the EV batteries are used to support the network at times
of peak demand, has the potential to lower peak demand on
the system, improving the utilisation or load factor of networks.
Significant uncontrolled charging of EVs could have adverse
consequences for the electricity system, in terms of peak demand,
as well as creating system instability.
4 A role for government? The strategic benefits of electric vehicles

Sparking an Electric Vehicle Debate in Australia 33
Deloitte’s analysis on Vehicle to Grid technologies (based on
analysis of AECOM’s EV forecasts for Victoria and NSW, 2009
and 2011 respectively) concluded there were substantial potential
peak demand reduction benefits available to both the NEM and
SWIS, of between $60 and $537 million.95 This value calculation was
based on ranges of assumptions on the number of EVs available
(plugged in and controllable) at peak time, capacity per vehicle
and discharge time.
Subsequent research and consultation has confirmed that
Vehicle to Grid technology faces some considerable barriers
due to the early phase of development of EV acceptance and
technologies. Several vehicle manufacturers indicated that while
they see the benefit of Vehicle to Grid for electricity suppliers,
given the low rate of consumer adoption of EVs generally in
Australia, it is unlikely to be a development priority. However,
the substantial value that Vehicle to Grid represents for the
electricity supply system presents an opportunity for electricity
utilities and vehicle manufacturers to work together to realise
the benefits of Vehicle to Grid.
There are significant costs associated with controlled EV charging,
including smart metering and other devices, and there are many
other barriers which currently prevent controlled charging.
However, arrangements to support cost reflective pricing signals
(such as TOU pricing) are being considered by the AEMC and other
energy market stakeholders as part of the broader Power of Choice
Review.96 In Victoria, the mandatory rollout of smart metering for
small customers provides an opportunity for controlled charging
technologies to develop.
4.3 Energy security and terms of trade
The value of Australia’s imports of crude oil, automotive and diesel
fuel totalled more than $32 billion in 2011–12, even though Australia
is one of the biggest energy exporters in the world.97 A shift to
vehicles fuelled by domestic fuel sources such as electricity or
natural gas would reduce this reliance on imported fuels and the
risks of price vulnerability due to oil supply constraints.
90 Victorian Department of Transport (2012), The Victorian Electric Vehicle
Trial: Environmental Impacts of Electric Vehicles in Victoria, pp.2–5.
91 Ibid.
92 NTC, Annual report 2011–12: Delivering on priority reforms, National
Transport Commission, Canberra, 2012, accessed 30 July 2013.
93 esaa internal wind generation analysis.
94 CSIRO Energy Transformed Flagship: Spatial Modelling of Electric
Vehicle Charging Demand and Impacts on Peak Household Electrical
Load in Victoria, June 2012.
95 Figures in 2012 dollars, quoting net present values over a projection
period of 2012/13–2022/23. Source: Deloitte, (2012), Analysis of Initiatives
to Lower Peak Demand – Final Report, p. 45.
96 AEMC, (2012), Final Advice – Energy Market Arrangements for Electric
and Natural Gas Vehicles.
97 Bureau of Resources and Energy Economics, 2013, Australian Petroleum
Statistics No 202.

34 Sparking an Electric Vehicle Debate in Australia
5.2.2 Car share companies
Commercial and residential car share companies have seen rapid
expansion in the past decade, in particular in high-density urban
centres. These locations have reduced opportunities for off-street
parking and recharging of EVs. There is potential synergy (short
range, frequent urban driving) between car sharing schemes and
EV usage. Dedicated parking locations provide ideal recharge
locations, although scheduling will need to accommodate time
for recharging.
5.2.3 Car hire companies
Car hire companies can provide both initial EV driving experience
for those (mainly business) customers who are renting
cars to conveniently manage travel inside short distances.
With EVs suited to more than 90 per cent of car travel needs,
there may be a growing window for car hire companies to
provide vehicles specifically suited to those infrequent longer
range or specialised journeys.
5.2.4 Airlines and trains
Increased use of EVs may encourage consumers to build more
travel around mass transport systems like trains and air travel,
and then make local car hire or other arrangements upon arrival.
The average distances between major Australian cities, safety
considerations and availability of discounted airfares already
mitigates against long distance driving trips.
5.2.5 Retailers
The development of an EV market in California has seen a number
of park-and-go retailers offer free or discounted recharging
facilities to encourage customers to visit and stay in their store.
These include Target, Ikea, McDonald’s and US based retailers
Walgreens, Kohl’s and Kroger.
Electric vehicles can play an important role in improving the
environmental performance and efficiency of Australia’s energy
networks and transport sector, while delivering consumers
a safe, reliable, efficient and enjoyable transport option.
Significant barriers still need to be overcome to deliver these
benefits and trigger this transformation.
5.1 Changing the perceptions of electric vehicles
For many daily driving journeys undertaken by Australians,
an EV could deliver the same or better performance as a traditional
ICE providing there is an adequate network of charging facilities.
Consumers are still understandably discouraged by the high
prices for EVs, concerns about range, performance and uncertainty
about resale values. The speed at which this perception changes
is fundamental to the rate at which the EV car market expands
in Australia.
5.2 Partnerships on the road to electric vehicles
Development of an EV market in Australia is likely to reflect
the unique features of electric vehicles. New partnerships and
opportunities may arise from this.
• Airlines (fly rather than drive longer distances)
• Hire car companies (hire cars for specialised journeys)
• Car share companies (using EVs in car share fleets)
• Retailers and shopping centres (provide recharge facilities
while customers shop)
• Electricity companies (increased volume and improved
grid stability)
5.2.1 Energy retailers and networks
Electric vehicles create new opportunities for electricity retailers.
The uptake of EVs is likely to encourage and depend upon tariff
reform, smart grid development and invite more dynamic billing
and charging arrangements to ensure EVs help improve and
optimise use of the energy network. Network companies will have
a clear stake in this as providers of the network to co-ordinate and
manage new customers and recharge facilities, as well as exploring
how to best utilise more advanced Vehicle to Grid technology as
it becomes available. It is feasible that the value of Vehicle to Grid
for electricity networks and retailers could eventually offset the
up-front cost of EVs.
5 Unlocking the potential for electric vehicles
For many daily driving journeys an EV could deliver the same or better performance as a traditional petrol-driven car.
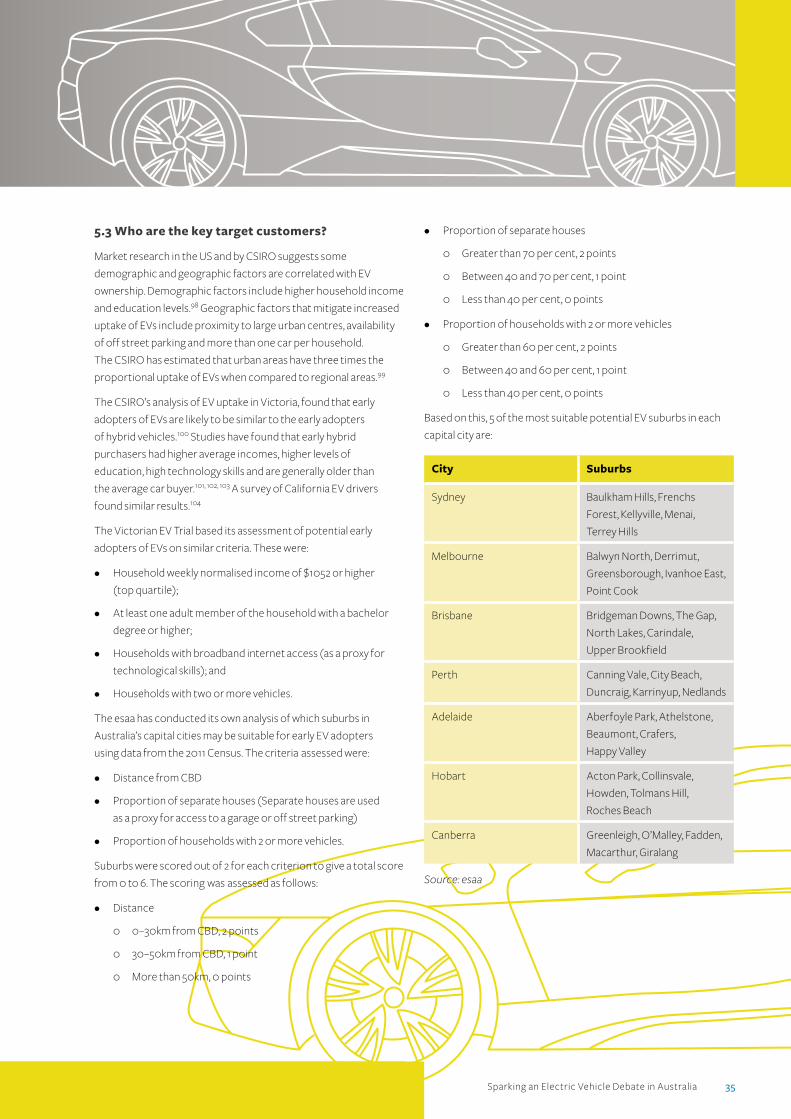
Sparking an Electric Vehicle Debate in Australia 35
• Proportion of separate houses
0 Greater than 70 per cent, 2 points
0 Between 40 and 70 per cent, 1 point
0 Less than 40 per cent, 0 points
• Proportion of households with 2 or more vehicles
0 Greater than 60 per cent, 2 points
0 Between 40 and 60 per cent, 1 point
0 Less than 40 per cent, 0 points
Based on this, 5 of the most suitable potential EV suburbs in each
capital city are:
City Suburbs
Sydney Baulkham Hills, Frenchs
Forest, Kellyville, Menai,
Terrey Hills
Melbourne Balwyn North, Derrimut,
Greensborough, Ivanhoe East,
Point Cook
Brisbane Bridgeman Downs, The Gap,
North Lakes, Carindale,
Upper Brookfield
Perth Canning Vale, City Beach,
Duncraig, Karrinyup, Nedlands
Adelaide Aberfoyle Park, Athelstone,
Beaumont, Crafers,
Happy Valley
Hobart Acton Park, Collinsvale,
Howden, Tolmans Hill,
Roches Beach
Canberra Greenleigh, O’Malley, Fadden,
Macarthur, Giralang
Source: esaa
5.3 Who are the key target customers?
Market research in the US and by CSIRO suggests some
demographic and geographic factors are correlated with EV
ownership. Demographic factors include higher household income
and education levels.98 Geographic factors that mitigate increased
uptake of EVs include proximity to large urban centres, availability
of off street parking and more than one car per household.
The CSIRO has estimated that urban areas have three times the
proportional uptake of EVs when compared to regional areas.99
The CSIRO’s analysis of EV uptake in Victoria, found that early
adopters of EVs are likely to be similar to the early adopters
of hybrid vehicles.100 Studies have found that early hybrid
purchasers had higher average incomes, higher levels of
education, high technology skills and are generally older than
the average car buyer.101, 102, 103 A survey of California EV drivers
found similar results.104
The Victorian EV Trial based its assessment of potential early
adopters of EVs on similar criteria. These were:
• Household weekly normalised income of $1052 or higher
(top quartile);
• At least one adult member of the household with a bachelor
degree or higher;
• Households with broadband internet access (as a proxy for
technological skills); and
• Households with two or more vehicles.
The esaa has conducted its own analysis of which suburbs in
Australia’s capital cities may be suitable for early EV adopters
using data from the 2011 Census. The criteria assessed were:
• Distance from CBD
• Proportion of separate houses (Separate houses are used
as a proxy for access to a garage or off street parking)
• Proportion of households with 2 or more vehicles.
Suburbs were scored out of 2 for each criterion to give a total score
from 0 to 6. The scoring was assessed as follows:
• Distance
0 0–30km from CBD, 2 points
0 30–50km from CBD, 1 point
0 More than 50km, 0 points

36 Sparking an Electric Vehicle Debate in Australia
98 CSIRO Electric Driveway Project, Social Study on Attitudes, Drivers and
Barriers to the Uptake of Electric Vehicles, 2011, p. 9.
99 CSIRO, (2012) Spatial Modelling of Electric Vehicle Charging Demand
and Impacts on Peak Electrical Loads in Victoria.
100 Stephan Gallon, Who Will Buy Tomorrow’s Electric Vehicles?
R.L. Polk & Co. September 2009.
101 Klein J., 2007, Why people really buy hybrids, Topline Strategy Group
http://www.toplinestrategy.com/Topline_Strategy_Report_Why_
People_Really_Buy_Hybrids.pdf.
102 Scarborough Research, 2007, Hybrid Vehicle Owners are Wealthy,
Active, Educated and Overwhelmingly Democratic, According to
Scarborough Research, http://www.scarborough.com/press_releases/
Hybrid%20FINAL%2012.4.07.pdf.
103 De Haan P., Peters A. and Mueller M., 2006, Comparison of buyers of
hybrid and conventional internal combustion engine automobiles:
Characteristics, preferences and previously owned vehicles,
Transportation Research Record: Journal of the Transportation
Research Board, No. 1983, Transportation Research Board of the
National Academies,Washington, D.C.
104 California Center for Sustainable Energy, California Plug-in Electric
Vehicle Owner Survey, May 2013.
Contrary to what many people would expect, ‘hip’ inner urban
suburbs like Fitzroy, New Farm or Newtown are less suited to
uptake of EVs because of the relatively small proportion of
off-street recharging capacity and houses with two or more
vehicles. These two criteria appear to be important guides to
identifying early adopters of EVs. On the other hand, such suburbs
could be promising markets for electric car share schemes, which
would enable users to get the EV “experience” without having to
purchase one. This could then facilitate take-up of EVs at a different
stage of life, when the hipsters move further out to buy a house.
Maps showing the distribution of suburbs based on their scores
are available at Appendix C.
In Sydney, the most likely area for an EV market to develop appears
to be on the north shore where most houses are free-standing and
large proportions have two or more vehicles. In contrast, suburbs
with these characteristics in Melbourne are largely on the fringe of
a 20km radius from the CBD.
Due to their higher upfront costs and potentially lower ongoing
fuel costs, EVs could also be an attractive option for retirees who
place a premium on low operating costs.

Sparking an Electric Vehicle Debate in Australia 37
development of an EV market. Industry stakeholders identified this
as one of the main reasons EVs have not reached the ‘tipping point’
into mainstream adoption in Australia.
Past and present government initiatives to support EVs are detailed
in Table 6.1.
In the US, California has more incentives for EVs than any other
state105 and the strongest uptake of EVs.
Australian governments have largely lagged behind our
international counterparts in providing policies to support the
Table 6.1: Government support for EVs in Australia
Initiative/State Discussion
Federal Government
Green Car
Innovation Fund
This Fund was expected to provide a subsidy of $1 in every $3 of investment in projects to enhance the
commercialisation of emissions-reducing vehicles. The Fund was cancelled in 2011 due to budgetary constraints.
Green Vehicle Guide A consumer choice tool, assisting consumers to purchase ‘green’ vehicles.
Clean Energy
Future
As well as the carbon tax, a number of schemes associated with the Clean Energy Policy could assist in promoting
EVs through support for research and development.
Mandatory
vehicle CO2
targets
Due to commence in mid-2013, mandatory emissions targets will be of strong benefit to electric and hybrid vehicles.
Energy White
Paper
Sets out the previous Government’s strategy for alternative transport fuels in Australia. Electric vehicles are
emphasised as one of the emerging technologies to be supported, as they generate emissions savings from
electricity. While the type of support is not made expressly clear, the development of EVs coincides with the one
of the objectives of the Paper, which is to reduce greenhouse gas emissions and use energy sustainably. The new
Coalition government is likely to develop their own Energy White Paper.
State Governments
NSW • Running small scale EV trials (including buses)
• Legislated requirement to increase the number of hybrid vehicles in the Government fleet
ACT • Recently cancelled an initiative with Better Place to install recharge points in Canberra
VIC • Department of Transport completed an EV trial to inform consumers and policymakers of the benefits of EVs
• Hybrid bus trial, completed in 2011, the trial tested two hybrid electric buses in the Victorian fleet
• Purchases of hybrid vehicles for Government fleets
• $100 annual registration discount that applies to electric and hybrid vehicles
QLD • Small scale EV trial
• 15% discount on taxi licences if a low emissions vehicle is used
TAS • Committed to support the installation of EV charge stations in the Hobart metropolitan area
• Electric vehicles are mentioned as development opportunities in Tasmania’s 2011 Renewable Energy Strategy106
WA • In 2011, the WA Department of Transport committed to participating in WA’s first large-scale EV trial,
using converted internal combustion vehicles
Source: ABMARC ( 2012 )
* Note: No Federal Government support currently exists for the installation of refuelling infrastructure.
Very limited information is currently available for EV schemes in the Northern Territory.
6 Policy enablers for electric vehicles
38 Sparking an Electric Vehicle Debate in Australia
This report does not aim to specify which policies should be
introduced. Rather, the esaa seeks to start a discussion around
whether support for EVs is justified and if so, which kinds of
policies could be considered.
6.1 Price and cost enablers
Our research has identified the following enablers that could be
used to overcome the high price premium and act as incentives
to stimulate EV uptake in Australia. We are not suggesting that
these be adopted immediately, but rather, they be used to begin
a discussion around how EVs could be supported. These policy
measures have been successful in stimulating demand for EVs
in a number of international markets:
• Purchase price subsidies for consumers, as was applied
for diesel technology when it was a developing industry
• ‘Feebates’ which involve increasing the purchase price
of conventional fuels, such as petrol excise tax increases
• Discounts and rebates on registration and other taxes
A Luxury Car Tax (LCT) applies to Australian vehicles priced above
$59,133, or $75,375 for fuel efficient vehicles (fuel consumption of
seven litres or less per 100 kilometres). As such, this tax is unlikely to
apply to small EVs whose recommended retail prices fall below this
threshold. However, the LCT applies to a premium EV. Accordingly,
exempting EVs from LCT could potentially improve the rate of
adoption of EVs in Australia.
In addition to the LCT, imported vehicles are subject to a 5 per cent
customs duty, levied against the Australian Customs’ valuation of
the vehicle. Removing or lowering this duty for EVs could take some
pressure off the purchase price and stimulate uptake.
Granting on-road privileges to EV users could also help stimulate
uptake. Such privileges might include transit lane access for EVs,
or designated EV parking spaces in metropolitan areas.
A summary of international support to lower the price of EVs
is provided in Table 6.2.

Sparking an Electric Vehicle Debate in Australia 39
Table 6.2: Examples of international price support for EVs
Country Financial incentive
USA A federal tax rebate of between US$2500–US$7500 is available for plug-in hybrid vehicle purchases, to be phased
out after 200,000 vehicles are sold.107
State credits available to purchasers include:108
1. $2500 for light-duty zero emission plug-in vehicles in California
2. State sales tax exemptions for vehicles, vehicle power sources and associated parts in Colorado
3. Income tax credit of $667, plus $111 if the vehicle has at least 5 kWh of battery capacity, and an additional
$111 for each additional kWh, to a maximum value of $2000, in South Carolina
Canada Incentives are available from federal and provincial governments. For example :109
• Quebec – Rebates of between CAN$4500–$8000 for EVs, as well as $500 for hybrid EVs
• Ontario – From 1 July 2010, purchase rebates offered of $5000–$8500, for battery capacities of
4 kWh–17 kWh, respectively
• British Columbia – $14.3 million Clean Energy Vehicle Program, including purchase rebates of $5000 per
vehicle, and $500 rebates for the installation of in-home charging infrastructure
Japan Purchase subsidies of up to 100,000 yen (approximately AU$1040) for the purchase of a standard low-emissions
vehicle, as well as automobile and sales tax reductions110
France Maintains a ‘bonus-malus’ system which rewards purchasers of EVs with a purchase bonus, and penalises purchasers
relatively high-emissions vehicles. The bonus in 2013 is €7000 (approximately AU$9000) for vehicles with between
0–20 g of CO2
/km. Conversely, a vehicle that emits more than 201 g/km is penalised €6000111
Spain €6000 (approximately AU$7600) maximum purchase rebate available under the SITVE scheme,
to November 2012112
Norway Annual registration fee of just 45 KR (approximately AU$60), preferential access to bus lanes and toll road
concessions, exemptions from car tax and VAT113
Denmark Free parking in cities, exemption from environment and 180% car tax applied to internal combustion vehicles114
Sweden Low or zero carbon emission vehicles receive a 10,000 SEK (approximately AU$1500) subsidy, after owning the
vehicle for 6 months, as well as tax exemptions for electric and hybrid vehicles. Subsidies are also available to
assist refuelling stations supplying renewable fuel115
Netherlands Deductions on vehicle registration tax, exemptions from purchase and congestion taxes116
Greece Electric vehicles are exempt from road and car registration taxes117

40 Sparking an Electric Vehicle Debate in Australia
Information campaigns aimed at overcoming generic concerns
about EVs including range, safety and performance are a relatively
low cost strategy that could be employed by governments and
industry.119 They could also be used to educate consumers about
the ‘whole of life’ cost of owning and operating an EV.
The interoperability of charging infrastructure and different vehicle
makes is important. Stakeholders suggested that standards for
new vehicle technology are best taken up by countries with greater
potential demand in the early adoption phases. Nevertheless some
progress has been made on Australian EV standards.
Opportunities for consumers to experience driving an EV before
committing to purchase would be helpful. ‘Try before you buy’
schemes have effective in other countries. These schemes allow
public fleets to enter into short term leases which can be extended
or converted into sales upon expiration. Similarly, car share
schemes or rental fleets could provide similar opportunities
for consumers. This gives customers the opportunity to
experience an EV, and overcome any potential misconceptions
about vehicle performance.
In the longer term, Vehicle to Grid technology could also be an
extremely beneficial EV market driver, which is discussed further
in sections 4.2 and 5.2.1. Vehicle to Grid technology allows an EV
to deliver surplus electricity back into the grid at times of peak
demand. Along with generating improvements in energy system
efficiency, Vehicle to Grid technology could potentially also be
used in emergencies to enable EVs to act as portable generators
to power a house, which presents another marketing angle. EV
batteries could even be marketed as a camping vehicle feature.
6.3.2 Supply side
Manufacturing and research and development grants could
stimulate the Australian automotive industry to begin developing
EVs locally. Other research and development grants might allow
vehicle manufacturers to research Vehicle to Grid technology
more extensively, generating energy and cost savings for the grid
and the user.
6.2 Charge time and availability enablers
Due to the limited number of EVs on the road in Australia, there
is at present no guaranteed income for charging infrastructure
providers. Accordingly, to support investment in charging
infrastructure, government support for upfront capital or fixed
revenue agreements are needed to ensure infrastructure providers
have the incentive to enter the Australian market.
In the US, there is support for charging infrastructure providers.
The Texas Government, for example, has partnered with local
energy providers to offer rebates to purchasers of plug-in EVs on
the cost of installing home charging infrastructure.118
AECOM suggested that increased infrastructure availability would
be likely to ‘significantly increase’ EV uptake in Australia, however,
vehicle manufacturers acknowledge the car industry must
drive the uptake of EVs, and to do this, they require government
assistance. Electric vehicles can still function with limited charge
infrastructure, whereas infrastructure providers cannot manage
without a sufficiently high number of EVs on the roads.
Government support for research and development into battery
technology could expedite improvements in vehicle range.
In addition, battery leasing business models such as Better Place
have the potential to shield consumers from range anxiety and
other battery capacity issues, though their commercial viability
is in question.
6.3 Other enablers
6.3.1 Demand side
It is essential that EV users are able to take advantage of TOU tariffs
to help stimulate demand. Customers would benefit from lower
electricity rates for charging their EVs at non-peak times. Given
that there are clear economic benefits in greater take-up of flexible
pricing increasing interest and shift towards customer choice as a
driver for smart metering and TOU tariffs in the National Electricity
Market and in Western Australia, there are clear synergies for the
EV industry.
In California, High Occupancy Vehicle Lanes (HOV lanes)
exemptions that provide access for low emissions vehicles have
been introduced. This has proved an excellent incentive for EV
uptake. Other low cost, demand side incentives include free parking
for EVs, additional council parking permits, waiving congestion
charges and parking permit fees. All of these incentives could be
tiered to a CO2
level to encourage low emissions vehicle uptake.

Sparking an Electric Vehicle Debate in Australia 41
105 AFDC, Laws and Incentive Data, Alternative Fuels Data Center.
Last accessed 31 July 2013.
106 Tasmanian Renewable Energy Industry Development Board, (2011),
Advice to the Tasmanian Government on a Tasmanian Renewable Energy
Strategy, from http://www.development.tas.gov.au/__data/assets/pdf_
file/0015/47121/DEDTA_TasRenewEnergyStrat.pdf. Retrieved 8 May 2013.
107 US Department of Energy, (2013), from http://www.afdc.energy.gov/laws/
law/US/409. Retrieved 15 May 2013.
108 US Department of Energy, (2013), from http://www.afdc.energy.gov/laws/.
Retrieved 15 May 2013.
109 Tesla Motors (2013), from http://www.teslamotors.com/en_CA/
incentives/CA. Retrieved 15 May 2013.
110 Japan Automobile Manufacturers Association (n.d.)., Japanese
Government Incentives for the Purchase of Environmentally Friendly
Vehicles, from http://jama.org /pdf/FactSheet10-2009-09-24.pdf.
Retrieved 16 April 2013.
111 Ministère de l’écologie, du développement durable et de l’énergie (2013),
Bonus-Malus., retrieved from http://www.developpement-durable.gouv.
fr/Bonus-Malus-2013.
112 Tesla Motors (2013), from http://www.teslamotors.com/incentives/ES/.
Retrieved 16 April 2013.
113 Tesla Motors (2013), from http://www.teslamotors.com/incentives/NO/.
Retrieved 16 April 2013.
114 Tesla Motors (2013), from http://www.teslamotors.com/incentives/DK/.
Retrieved 16 April 2013.
115 Clean Vehicle Europe, (2013), from http://www.cleanvehicle.eu/info-per-
country-and-eu-policy/member-states/sweden/national-level/.
Retrieved 16 April 2013.
116 Clean Vehicle Europe, (2013), from http://www.cleanvehicle.eu/info-
per-country-and-eu-policy/member-states/netherlands/national-level/.
Retrieved 16 April 2013.
117 Clean Vehicle Europe, (2013), from http://www.cleanvehicle.eu/info-per-
country-and-eu-policy/member-states/greece/national-level/.
Retrieved 16 April 2013.
118 More information can be found at
http://www.afdc.energy.gov/laws/law/TX/8625.
119 For more information about consumer perceptions of EVs,
see Deloitte, (2011), Unplugged: Electric vehicle realities versus
consumer expectations.
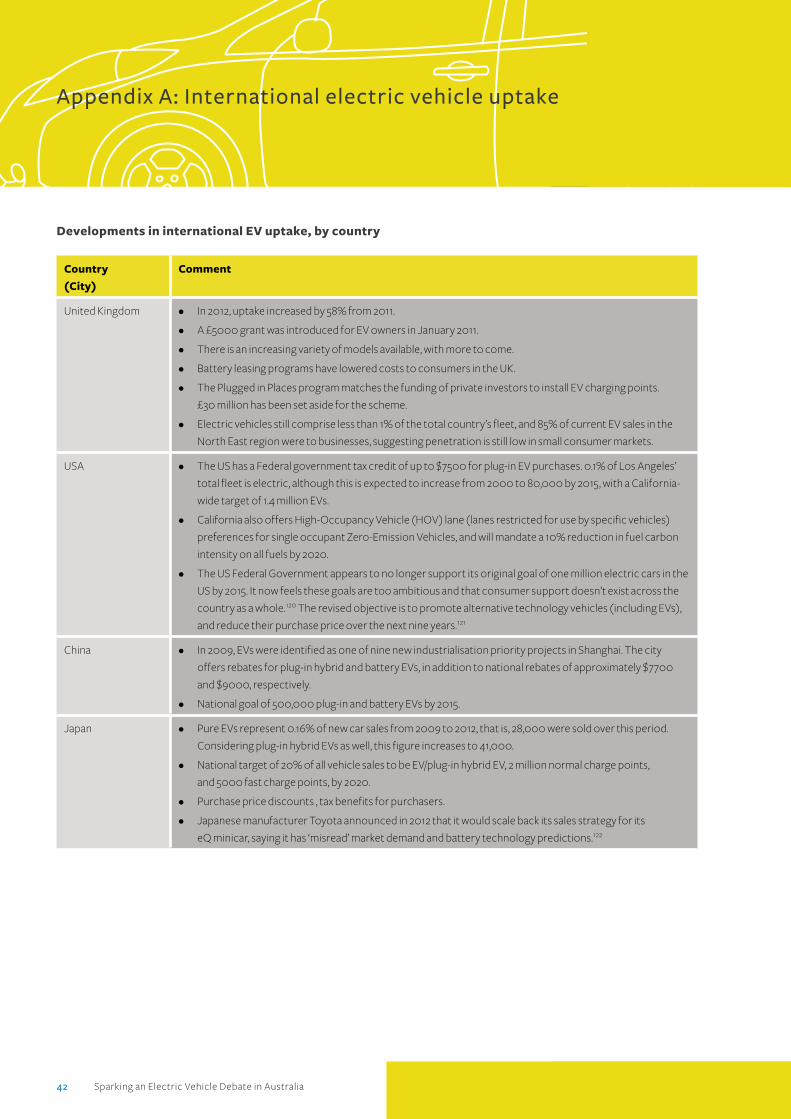
42 Sparking an Electric Vehicle Debate in Australia
Appendix A: International electric vehicle uptake
Developments in international EV uptake, by country
Country
(City)
Comment
United Kingdom • In 2012, uptake increased by 58% from 2011.
• A £5000 grant was introduced for EV owners in January 2011.
• There is an increasing variety of models available, with more to come.
• Battery leasing programs have lowered costs to consumers in the UK.
• The Plugged in Places program matches the funding of private investors to install EV charging points.
£30 million has been set aside for the scheme.
• Electric vehicles still comprise less than 1% of the total country’s fleet, and 85% of current EV sales in the
North East region were to businesses, suggesting penetration is still low in small consumer markets.
USA • The US has a Federal government tax credit of up to $7500 for plug-in EV purchases. 0.1% of Los Angeles’
total fleet is electric, although this is expected to increase from 2000 to 80,000 by 2015, with a California-
wide target of 1.4 million EVs.
• California also offers High-Occupancy Vehicle (HOV) lane (lanes restricted for use by specific vehicles)
preferences for single occupant Zero-Emission Vehicles, and will mandate a 10% reduction in fuel carbon
intensity on all fuels by 2020.
• The US Federal Government appears to no longer support its original goal of one million electric cars in the
US by 2015. It now feels these goals are too ambitious and that consumer support doesn’t exist across the
country as a whole.120 The revised objective is to promote alternative technology vehicles (including EVs),
and reduce their purchase price over the next nine years.121
China • In 2009, EVs were identified as one of nine new industrialisation priority projects in Shanghai. The city
offers rebates for plug-in hybrid and battery EVs, in addition to national rebates of approximately $7700
and $9000, respectively.
• National goal of 500,000 plug-in and battery EVs by 2015.
Japan • Pure EVs represent 0.16% of new car sales from 2009 to 2012, that is, 28,000 were sold over this period.
Considering plug-in hybrid EVs as well, this figure increases to 41,000.
• National target of 20% of all vehicle sales to be EV/plug-in hybrid EV, 2 million normal charge points,
and 5000 fast charge points, by 2020.
• Purchase price discounts , tax benefits for purchasers.
• Japanese manufacturer Toyota announced in 2012 that it would scale back its sales strategy for its
eQ minicar, saying it has ‘misread’ market demand and battery technology predictions.122

Sparking an Electric Vehicle Debate in Australia 43
Country
(City)
Comment
Netherlands
(Amsterdam)
• Market for EVs is still developing. In Amsterdam, EVs represent just 0.3% of the total fleet
Countrywide EV targets:
0 2015: 20,000
0 2020: 200,000
0 2025: 1 million
• Electric vehicles are exempt from registration taxes.
• 350 public charging stations (highest rate per inhabitant in the world), aiming for 1000 by the end of 2013.
Spain • Pure EVs represented just 0.05% of Spain’s total fleet in 2012.
• National EV/plug-in hybrid EV target for 2014: 250,000 EV/plug-in hybrid EV.
• Government aims to install 4400 slow charging stations, and 20 fast charging stations by 2014.
• Electric vehicle users pay lower electricity tax, and receive priority parking and purchase subsidies.
• 50% of the powered two wheeler fleet is expected to be electric by 2014.
Germany (Berlin) • Germany had 4541 EV/plug-in hybrid EVs in 2012, with a 2020 target of 1 million.
• To October 2012, EV sales for the year were 2956, or just 0.096% of the total car industry. However, sales to
October 2012 increased 37% from total sales for 2011.
• Currently, there are approximately 350 EVs in Berlin (0.03% of total fleet), although this number is targeted
to increase to 15,000 by 2015.
• Germany’s goal is a 640% increase in the number of public charging points in Berlin by 2015 from 2012 levels.
• 10 year car tax exemptions, transferable licence plates.
Norway • The largest electric fleet of any European country, with 8581 on the road in September 2012, projected to
be over 10,500 by early 2013. The national goal is to reach 50,000 zero emissions vehicles by 2018.23
• Substantial demand side incentives, including sales taxes discounts, VAT reductions (which is usually
25% on purchase), and bus lane usage allowances. Norway also applies substantial duties on petroleum.
Norwegian electric power provider Ishavskraft is also reportedly working with EV charge manufacturer
Delta Electronics to introduce a number of fast chargers in the country.
Source: Electric Vehicle City Casebook, ( 2012 ), A look at the global EV movement; Plugged-in Places ( 2013 ).
120 The Economist: Economist Intelligence Unit, (2013),
World fuels: Hybrid harvest, retrieved from
http://viewswire.eiu.com/index.asp?layout=ib3Article&article_
id=90142993&pubtypeid=1112462496&country_id=1510000351.
121 Reuters, (2013), US backs off goal of one million electric cars by 2015,
retrieved from http://www.reuters.com/article/2013/01/31/us-autos-
greencars-chu-idUSBRE90U1B020130131.
122 Reuters, (2012), Toyota drops plan for widespread sales of electric car,
retrieved from http://www.reuters.com/article/2012/09/24/us-toyota-
electric-idUSBRE88N0CT20120924.
123 GronnBil,(2013), Rechargeable vehicles Norway, retrieved from
http://www.gronnbil.no.

44 Sparking an Electric Vehicle Debate in Australia
Appendix B: Electric vehicle charging specifications
Charge specifications, by level
Level Requirements Circuit Rating Power
consumption
(kW)
Charge rate
(km/min)
Charge time
for 40km
(minutes)
Level 1 Requires a standard power
outlet, found in homes.
240AC
(single phase)
2.4–3.6 0.2–0.3 133–200
Level 2 Requires EV Supply
Equipment to be hard wired
into a building’s electricity
supply.
240V AC
(single phase)
32A2
7.7 1.6 63
Level 3 Requires off-board
charging to charge the
battery directly. High
energy requirements mean
it is unlikely that recharging
would be performed in
homes.
415V AC
(3-phase)
125–330A
(Output
400–700V DC,
125 to 550A)
50–250 4.2–21 2–10
Source: AECOM ( 2011 )

Sparking an Electric Vehicle Debate in Australia 45
The following maps display the suitability of suburbs in each state
and territory capital city for EV adoption. Suburbs have been
scored from 0 (least suitable) to 6 (most suitable) based
on distance to the CBD, the proportion of households with
Appendix C: Mapping EV suburbs
Greater Melbourne
2 or more vehicles and the proportion of separate houses in the
suburb. Bright red indicates that these suburbs could be well suited
to EV uptake, while grey suburbs are the last suitable.
Inner Melbourne
Least Suitable to Most Suitable
1 6

46 Sparking an Electric Vehicle Debate in Australia
Greater Sydney
Inner Sydney
Least Suitable to Most Suitable
0 6
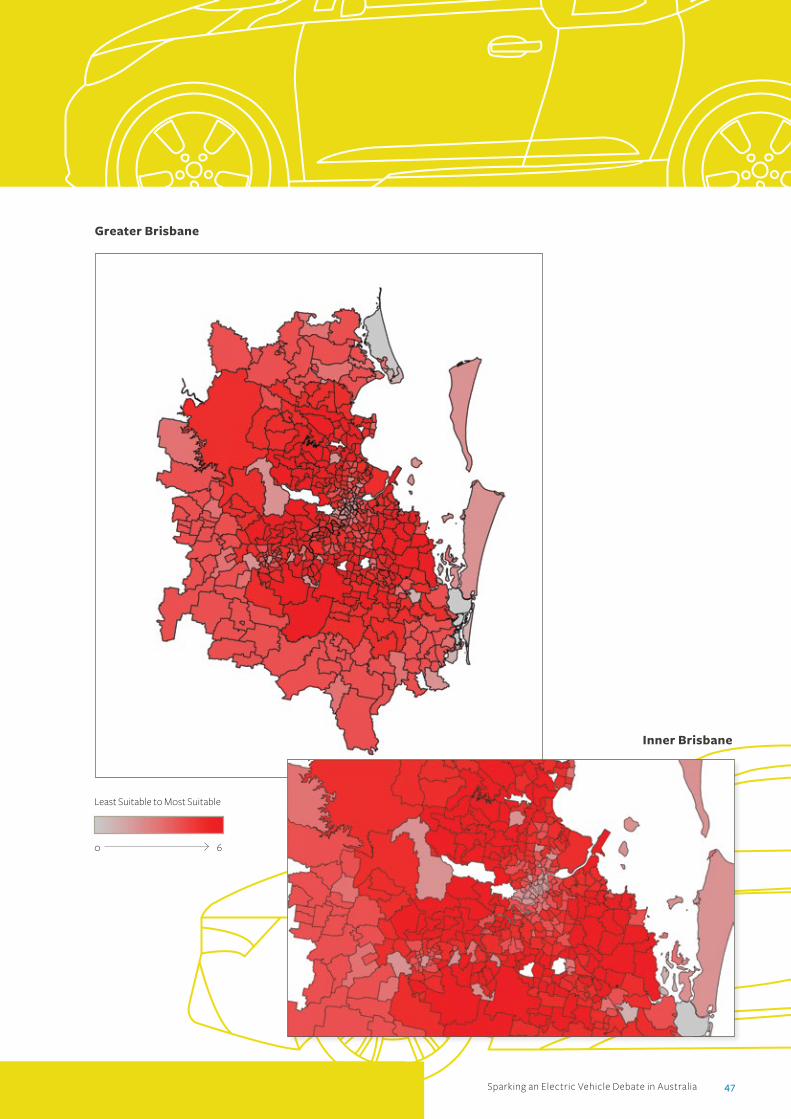
Sparking an Electric Vehicle Debate in Australia 47
Inner Sydney
Greater Brisbane
Inner Brisbane
Least Suitable to Most Suitable
0 6

48 Sparking an Electric Vehicle Debate in Australia
Greater Adelaide
Inner Adelaide
Least Suitable to Most Suitable
2 6

Sparking an Electric Vehicle Debate in Australia 49
Inner Adelaide
Greater Perth
Inner Perth
Least Suitable to Most Suitable
0 6

50 Sparking an Electric Vehicle Debate in Australia
Greater Hobart
Inner Hobart
Least Suitable to Most Suitable
1 6

Sparking an Electric Vehicle Debate in Australia 51
Inner Hobart
Canberra
Least Suitable to Most Suitable
2 6

52 Sparking an Electric Vehicle Debate in Australia
Disclaimer
Sparking an Electric Vehicle Debate in Australia is a publication
of the Energy Supply Association of Australia (esaa). Sparking an
Electric Vehicle Debate in Australia includes materials, statistics
and other information from a number of sources.
No responsibility is accepted by esaa, the editor, authors of any
materials or suppliers of any statistics or other information for
the accuracy of any information contained in Sparking an Electric
Vehicle Debate in Australia or the consequences of any person
relying upon any information. The contents of Sparking an Electric
Vehicle Debate in Australia should not be relied upon as a substitute
for professional advice.
Copyright
The contents of this document are copyright. Subject to the
provisions of the Australian Copyright Act 1968, no part of this
publication or its contents may be reproduced or copied in any
form or by any means (electronic, graphic or mechanical including
by photocopying, recording, taping, micro copying or otherwise)
or reproduced, stored or used in conjunction with any information
retrieval system or transmitted by any means, without the prior
written permission of esaa.

Sparking an Electric Vehicle Debate in Australia 53

esaa
GPO Box 1823 Melbourne VIC 3001
T +61 3 9205 3100 www.esaa.com.au