ENERGY SECURITY: INVESTIGATING NATURAL GAS FOR ENERGY ...
22
www.tjprc.org [email protected] ENERGY SECURITY: INVESTIGATING NATURAL GAS FOR ENERGY GENERATION AT AIRPORTS IN SOUTH AFRICA – A TECHNOECONOMIC ASSESSMENT JERUSHA JOSEPH & PROFESSOR FREDDIE INAMBAO Department of Mechanical Engineering, University of KwaZulu-Natal, Durban, South Africa ABSTRACT Reducing carbon-dioxide emissions that come from coal-fired power stations is a major challenge especially for developing countries. Renewable energy has reached and surpassed grid parity in many countries, however, due to the intermittent nature of solar and wind energy which are popular choices of renewable energy, energy storage becomes necessary to serve baseload energy requirements. The need for energy storage increases the cost of adopting renewable energy and in most cases makes the investment unfeasible. Furthermore, the spatial demands of renewable energy make it an unsuitable choice for many sites that have high baseload energy requirements such as airports. Emissions from natural gas-powered stations are half those of coal-fired power stations, therefore it is an attractive alternative in the quest for reducing carbon emissions in developing countries. This paper presents an investigation into natural gas as an energy source for airports in South Africa, providing a technical and financial evaluation (or technoeconomic assessment) of its adoption at airports. KEYWORDS: Techno-Economic Assessments, Alternative Energy, Feasibility of Natural Gas for Airports, Natural Gas Installations, Combined Heat and Power, Natural Gas Trigeneration for Airports, Natural Gas Turbine & Natural Gas Internal Combustion Engines Received: Jul 13, 2021; Accepted: Aug 03, 2021; Published: Sep 29, 2021; Paper Id: IJMPERDOCT202113 INTRODUCTION Natural gas is the cleanest of all fossil fuels and the main products of combustion of natural gas are carbon dioxide and water vapour. The combustion of natural gas releases small amounts of nitrogen oxides (NOx), sulphur dioxide (SO2), carbon dioxide (CO2), carbon monoxide (CO), other reactive hydrocarbons and virtually no particulate matter [1]. For this reason, natural gas is a popular choice in replacing coal as a fuel source especially where space and cost is a limitation when considering renewable energy and its energy storage requirements. Some airports in South Africa face the challenge of high baseload energy demand with limited space for renewable energy and the added cost of energy storage makes renewable energy unfeasible. Airports Company South Africa (ACSA) is South Africa’s airport authority owning and operating nine airports in South Africa namely OR Tambo International Airport (ORTIA) (in Kempton Park, Gauteng), Cape Town International Airport (CTIA) (in the Western Cape), King Shaka International Airport (KSIA) (Durban, KwaZulu-Natal), Port Elizabeth International Airport (PEIA) (in the Eastern Cape), East London Airport (EL) (in the Eastern Cape), Bram Fischer International Airport (BFIA) (in Bloemfontein, Free State), George Airport (GG) (in the Eastern Cape), Upington International Airport (UPIA) (in the Northern Cape) and Kimberley Airport (KIM) (in the Northern Cape). Renewable energy can easily be incorporated into ACSA’s six regional airports as their operational hours and Original Article International Journal of Mechanical and Production Engineering Research and Development (IJMPERD) ISSN (P): 2249–6890; ISSN (E): 2249–8001 Vol. 11, Issue 5, Oct 2021, 193–214 © TJPRC Pvt. Ltd.
Transcript of ENERGY SECURITY: INVESTIGATING NATURAL GAS FOR ENERGY ...
www.tjprc.org [email protected]
ENERGY SECURITY: INVESTIGATING NATURAL GAS FOR ENERGY
GENERATION AT AIRPORTS IN SOUTH AFRICA – A TECHNOECONOMIC
ASSESSMENT
JERUSHA JOSEPH & PROFESSOR FREDDIE INAMBAO
Department of Mechanical Engineering, University of KwaZulu-Natal, Durban, South Africa
ABSTRACT
Reducing carbon-dioxide emissions that come from coal-fired power stations is a major challenge especially for
developing countries. Renewable energy has reached and surpassed grid parity in many countries, however, due to the
intermittent nature of solar and wind energy which are popular choices of renewable energy, energy storage becomes
necessary to serve baseload energy requirements. The need for energy storage increases the cost of adopting renewable
energy and in most cases makes the investment unfeasible. Furthermore, the spatial demands of renewable energy make
it an unsuitable choice for many sites that have high baseload energy requirements such as airports. Emissions from
natural gas-powered stations are half those of coal-fired power stations, therefore it is an attractive alternative in the
quest for reducing carbon emissions in developing countries. This paper presents an investigation into natural gas as an
energy source for airports in South Africa, providing a technical and financial evaluation (or technoeconomic
assessment) of its adoption at airports.
KEYWORDS: Techno-Economic Assessments, Alternative Energy, Feasibility of Natural Gas for Airports, Natural Gas
Installations, Combined Heat and Power, Natural Gas Trigeneration for Airports, Natural Gas Turbine & Natural Gas
Internal Combustion Engines
Received: Jul 13, 2021; Accepted: Aug 03, 2021; Published: Sep 29, 2021; Paper Id: IJMPERDOCT202113
INTRODUCTION
Natural gas is the cleanest of all fossil fuels and the main products of combustion of natural gas are carbon dioxide
and water vapour. The combustion of natural gas releases small amounts of nitrogen oxides (NOx), sulphur dioxide
(SO2), carbon dioxide (CO2), carbon monoxide (CO), other reactive hydrocarbons and virtually no particulate
matter [1]. For this reason, natural gas is a popular choice in replacing coal as a fuel source especially where space
and cost is a limitation when considering renewable energy and its energy storage requirements.
Some airports in South Africa face the challenge of high baseload energy demand with limited space for
renewable energy and the added cost of energy storage makes renewable energy unfeasible. Airports Company
South Africa (ACSA) is South Africa’s airport authority owning and operating nine airports in South Africa namely
OR Tambo International Airport (ORTIA) (in Kempton Park, Gauteng), Cape Town International Airport (CTIA)
(in the Western Cape), King Shaka International Airport (KSIA) (Durban, KwaZulu-Natal), Port Elizabeth
International Airport (PEIA) (in the Eastern Cape), East London Airport (EL) (in the Eastern Cape), Bram Fischer
International Airport (BFIA) (in Bloemfontein, Free State), George Airport (GG) (in the Eastern Cape), Upington
International Airport (UPIA) (in the Northern Cape) and Kimberley Airport (KIM) (in the Northern Cape).
Renewable energy can easily be incorporated into ACSA’s six regional airports as their operational hours and
Orig
ina
l Article
International Journal of Mechanical and Production
Engineering Research and Development (IJMPERD)
ISSN (P): 2249–6890; ISSN (E): 2249–8001
Vol. 11, Issue 5, Oct 2021, 193–214
© TJPRC Pvt. Ltd.

194 Jerusha Joseph & Professor Freddie Inambao
Impact Factor (JCC): 9.6246 NAAS Rating: 3.11
energy demands are low compared to its three busiest international airports, OR Tambo International Airport (ORTIA),
(CTIA) and (KSIA).
ACSA’s quest for reducing carbon emissions resulting from their electricity consumption has led to the
installation of solar photovoltaic (PV) plants at PEIA, BFIA, GG, UPIA and KIM with a sixth solar PV plant at installation
stage for EL. The same approach could not be adopted for ORTIA, CTIA and KSIA as the operating hours and extent of
operations result in high baseload energy demand coupled with the fact that most of the available land has been reserved
for commercial development and the addition of future capacity. Renewable energy also becomes unfeasible when
considered in larger scales, especially with the energy storage required to smooth out intermittencies. Renewable energy
technologies have low capacity factors.
The availability of natural gas close to ORTIA and KSIA as well as the establishment of virtual gas networks
covering their geographical areas, including CTIA, makes natural gas an attractive alternative in the quest for reduction in
carbon emissions resulting from the airports’ grid electricity consumption. The Eskom load shedding and ageing power
generation fleet coupled with increasing electricity tariffs make the search for alternative energy a business risk and an
economic push for ACSA’s international airports. Using natural gas to produce both electricity and recovery of heat for
heating demands and to provide air conditioning (trigeneration or combined heat and power) is beneficial and energy
efficient.
This study covers technology description, identification of technology type, typical components constituting the
technology, assessment of technology maturity, cost benefit analysis that looks at the investment required, energy derived,
feasibility indicators of the investment sensitivity analysis of using natural gas as an energy source for ORTIA, CTIA and
KSIA. The study also presents the technology risk assessment, airports integration strategy and the proposed operational
philosophy covering the technical aspects, plant operation for business continuity and for cost effectiveness as well as the
operations and maintenance philosophies.
The key parameters for the natural gas-to-power technology to work successfully for airports are:
Availability of natural gas supply in the region
Effective integration of the technology into the airport environment
The key parameters for natural gas power plants to be adopted at airports owned and operated by ACSA are:
It must prove to be economically feasible for the airports
The technical and business risks of plant operations and plant related activity must be acceptable, this includes
cost impact and implications
The natural gas fuel supply must be guaranteed for the economic lifespan of the plant, and the supply capacity
must be security backed with the ability to be increased
Description of the Technology
Natural gas is formed in the earth’s crust as a result of transformation of organic matter due to heat and pressure of
overlying rock. The gas hydrocarbons can also be produced as a result of microbial decomposition of organic substances
and due to reduction of mineral salts. Some of these gases are released into the atmosphere or hydrosphere while the rest
Energy Security: Investigating Natural Gas for Energy Generation 195
at Airports in South Africa – A Technoeconomic Assessment
www.tjprc.org [email protected]
accumulates in the upper layers of the earth’s crust. The composition of natural gas varies depending on a number of
factors such as origin, location of deposit and geological structure. Natural gas mainly consists of saturated aliphatic
hydrocarbons like methane. Components such as carbon dioxide, hydrogen sulphide, nitrogen and helium constitute an
insignificant proportion of natural gas composition [1].
The natural gas extracted is available in different forms for commercial and industrial use. While liquefied natural
gas (LNG) and compressed natural gas (CNG) are similar, their delivery and storage methods are different. LNG is frozen
in order to turn it into liquid form, whereas CNG is pressurised to the point where it is very compact. LNG takes up less
storage space on a vehicle than CNG, and it also offers an energy density that can be compared to diesel fuel. This makes it
a common choice among many long-haul trucking companies. Using proper procedures, LNG can be converted to CNG.
On the other hand, CNG is easier to refuel than LNG, which requires special handling and equipment. CNG is also very
light, so if there is a leak, it will dissipate. It has an unlimited hold time, so even if it goes unused, there is no fuel loss. This
makes CNG a safer choice over LNG. CNG also has lower production costs than LNG [2].
“CNG can be transported through pipelines. Some components need to be removed from the natural gas before
CNG can be safely delivered. Also, while being processed, producers typically add an unpleasant smell (mostly
ethanethiol), thus making natural gas easily recognisable in case of leaking. Like CNG, liquefied natural gas also occupies
less space than it did in its gaseous state. Liquid gas can be 600 times denser than it was after extraction. Liquified natural
gas can be transported in barrels. The process of creating LNG is more expensive, so the price of LNG is higher than CNG,
but it is a great opportunity to transport natural gas over long distances effectively. Without pipelines, LNG is a great
alternative as a power source.” [3]
This technoeconomic assessment focuses on the use of natural gas for power generation and excludes its use for
energy storage (such as natural gas powering fuel cells, etc) and vehicle fleets (cars, light delivery vehicles, etc., running
on natural gas). Power can be generated by natural gas through its combustion in gas turbines (GT) or internal combustion
engines (ICE) to produce electricity, and heat may also be recovered.
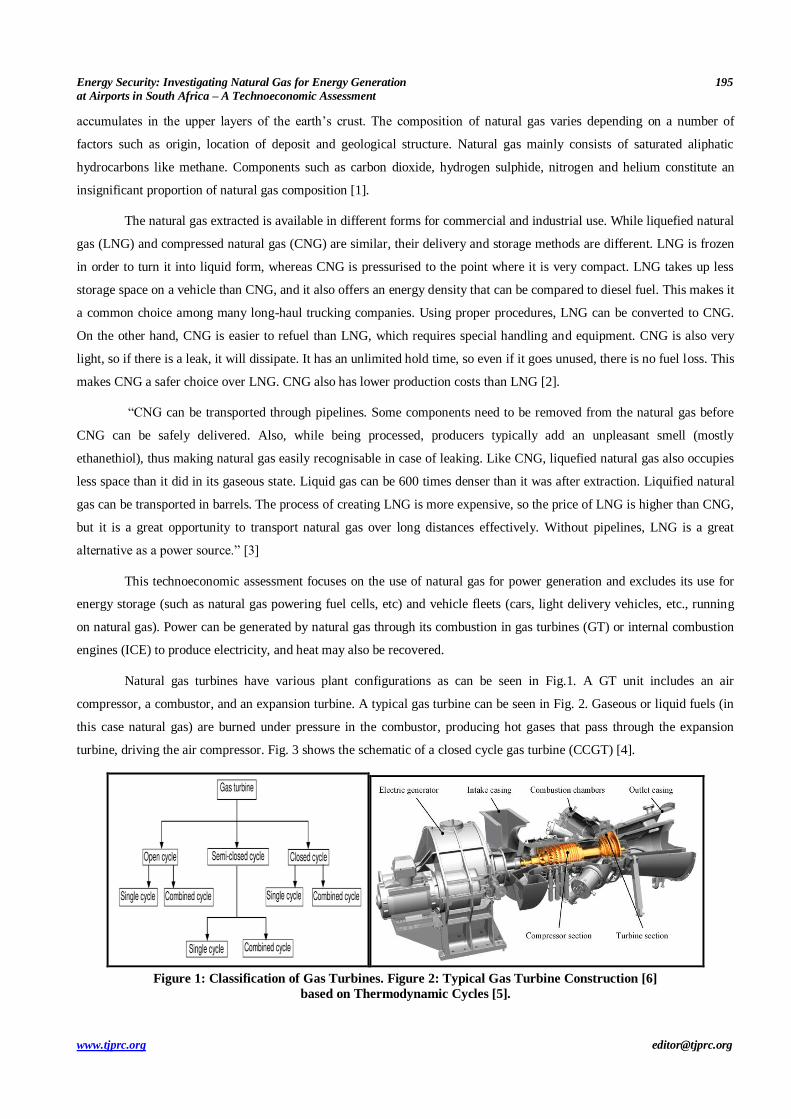
Natural gas turbines have various plant configurations as can be seen in Fig.1. A GT unit includes an air
compressor, a combustor, and an expansion turbine. A typical gas turbine can be seen in Fig. 2. Gaseous or liquid fuels (in
this case natural gas) are burned under pressure in the combustor, producing hot gases that pass through the expansion
turbine, driving the air compressor. Fig. 3 shows the schematic of a closed cycle gas turbine (CCGT) [4].
Figure 1: Classification of Gas Turbines. Figure 2: Typical Gas Turbine Construction [6]
based on Thermodynamic Cycles [5].

196 Jerusha Joseph & Professor Freddie Inambao
Impact Factor (JCC): 9.6246 NAAS Rating: 3.11
Figure 3: Simple Schematic of a Figure 4: Gas Turbines Thermodynamic Brayton Cycle
Closed Cycle Gas Turbine (CCGT) [4] for Open Cycle Gas Turbine (OCGT) [7].
The shaft of the GT is coupled to an electric generator which is driven by the mechanical energy produced by the
GT. The hot exhaust gas exits the GT at temperatures of between 538 °C and 593 °C and passes through a heat recovery
steam generator (HRSG) where it exchanges heat with water producing steam at two or three pressures and may
incorporate a reheat loop. The exhaust gas is cooled to between 80 °C and 135 °C before exiting through the HRSG stack.
Depending on the selected GT and its associated exhaust temperatures, the high-pressure steam conditions from the HRSG
range anywhere between 4.32 MPa(g) and 17.23 MPa(g) with temperatures of 482 °C to 565 °C [4].
The steam produced in the HRSG is used to drive a steam turbine generator. In larger plants, it is common to have
two or three GT/HRSG trains providing steam for a single large steam turbine. Usually about two-thirds of the total power
is produced from the GTs and one-third from the steam turbine. The steam from the steam turbine is condensed using an
air-cooled condenser or a closed-loop cooling tower, and the condensate is returned to the HRSG by condensate pumps. [4]
The thermodynamic cycle in the gas turbine is the Brayton cycle (Fig. 4 shows the Brayton Cycle for an open cycle gas
turbine) and in the steam turbine is the Rankine cycle (Fig. 5). “An OCGT is one in which the working fluid remains
gaseous throughout the thermodynamic cycle. The main advantages of open cycle GTs include flexibility in siting, low
emission levels with natural gas fuel, low capital cost, and short construction time. These advantages make them attractive
for peaking duty applications. Peaking duty open cycle site arrangements can be designed to allow for later conversion to
combined cycle through staged development.” [4]
Figure 5: Steam Turbines Thermodynamic. Figure 6: Development History of Mitsubishi Gas Engines [9]
Simple Rankine Cycle [8].
Energy Security: Investigating Natural Gas for Energy Generation 197
at Airports in South Africa – A Technoeconomic Assessment
www.tjprc.org [email protected]
There are various types and categories of GTs available in the market today. These include the earlier designed E-
or lower-class turbine models, the state-of-the-art heavy-duty F-, G- and H-class turbine models, and the aeroderivative
GTs that are generally used in power, combined heat and power (CHP), and industrial applications. These GTs are
available in given sizes or ratings. Their efficiencies are strongly influenced by several factors such as inlet mass flow,
compression ratio, and expansion turbine inlet temperature. The earlier design of heavy-duty GTs had maximum turbine
inlet temperatures ranging anywhere between 815 °C and 1093 °C. More recent state-of-the-art heavy-duty GT designs
have turbine inlet temperatures that reach 1315 °C to 1371 °C. These turbines are designed with innovative hot gas path
materials and coatings, advanced secondary air cooling systems, and enhanced sealing techniques that enable higher
compression ratios and turbine inlet temperatures. The advancements made in the newer GTs by the manufacturers are
generally adopted into the earlier models for efficiency and power output improvements. Fig. 6 shows the development
history of Mitsubishi gas engines. Combined cycle plants can operate with both conventional and advanced GTs. With GTs
running at higher turbine inlet temperatures that result in higher exhaust temperatures, it is possible to include a reheat
stage in the steam turbine. This further increases the efficiency in the bottoming cycle [4].
Natural gas power plants can also produce electricity through an internal combustion engine (ICE) which is
popular with smaller power plants serving specific commercial businesses or small industrial sites. They are usually used
in a combined heat and power (CHP) plant that primarily produces electricity with the heat of the ICE being recovered to
be used either for plant heating or site heating processes. For commercial sites, natural gas trigeneration plants are popular
in that the natural gas powered ICE engine is adopted to produce electricity, the heat is recovered to produce hot water or
steam that powers an absorption chiller which provides space air conditioning (heating and cooling), and remaining heat is
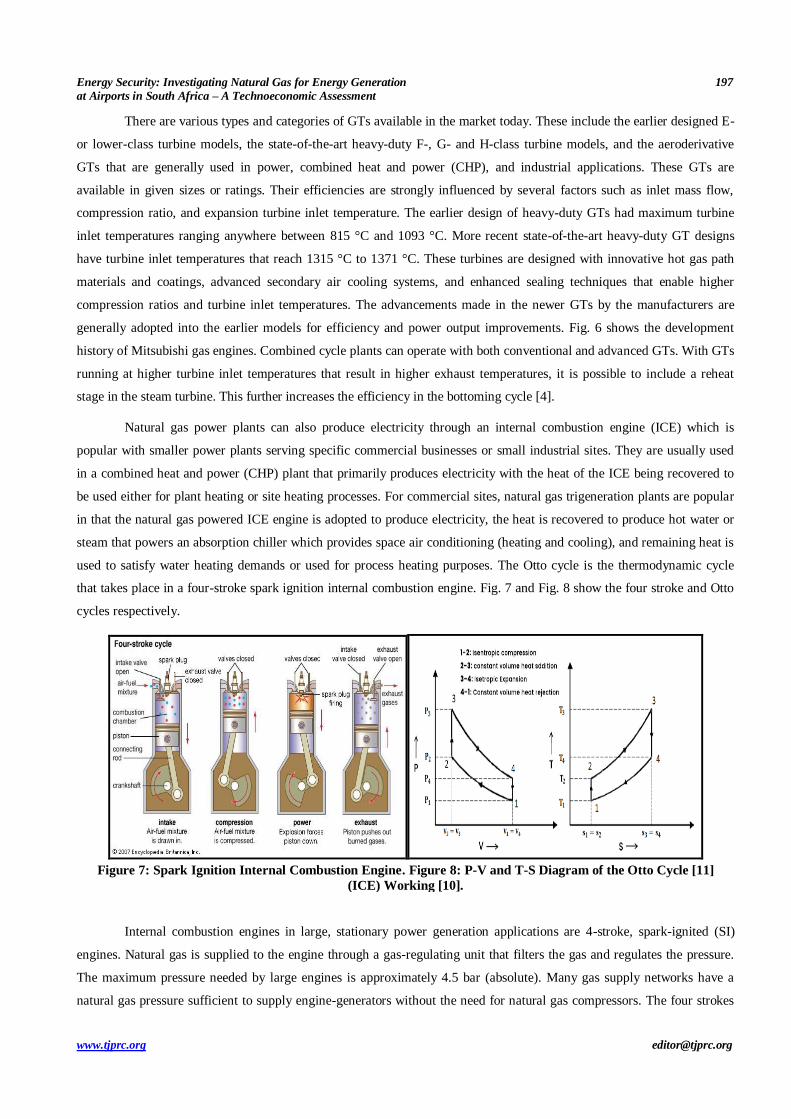
used to satisfy water heating demands or used for process heating purposes. The Otto cycle is the thermodynamic cycle
that takes place in a four-stroke spark ignition internal combustion engine. Fig. 7 and Fig. 8 show the four stroke and Otto
cycles respectively.
Figure 7: Spark Ignition Internal Combustion Engine. Figure 8: P-V and T-S Diagram of the Otto Cycle [11]
(ICE) Working [10].
Internal combustion engines in large, stationary power generation applications are 4-stroke, spark-ignited (SI)
engines. Natural gas is supplied to the engine through a gas-regulating unit that filters the gas and regulates the pressure.
The maximum pressure needed by large engines is approximately 4.5 bar (absolute). Many gas supply networks have a
natural gas pressure sufficient to supply engine-generators without the need for natural gas compressors. The four strokes
198 Jerusha Joseph & Professor Freddie Inambao
Impact Factor (JCC): 9.6246 NAAS Rating: 3.11
in a power cycle are intake, compression, expansion, and exhaust stroke. Small natural gas engines typically use natural
aspiration for their air-intake. Large natural gas engines have a turbocharger to boost air flow. The turbocharger utilises
exhaust gas energy in the expansion turbine to drive the air compressor. With more air flow comes more fuel, resulting in
higher output. Compression ratios in the large bore engine class are in the range of 11:1 to 12:1. The compression ratio is
limited since a higher compression ratio could lead to auto-ignition of the fuel which can damage the engine (knock) [4].
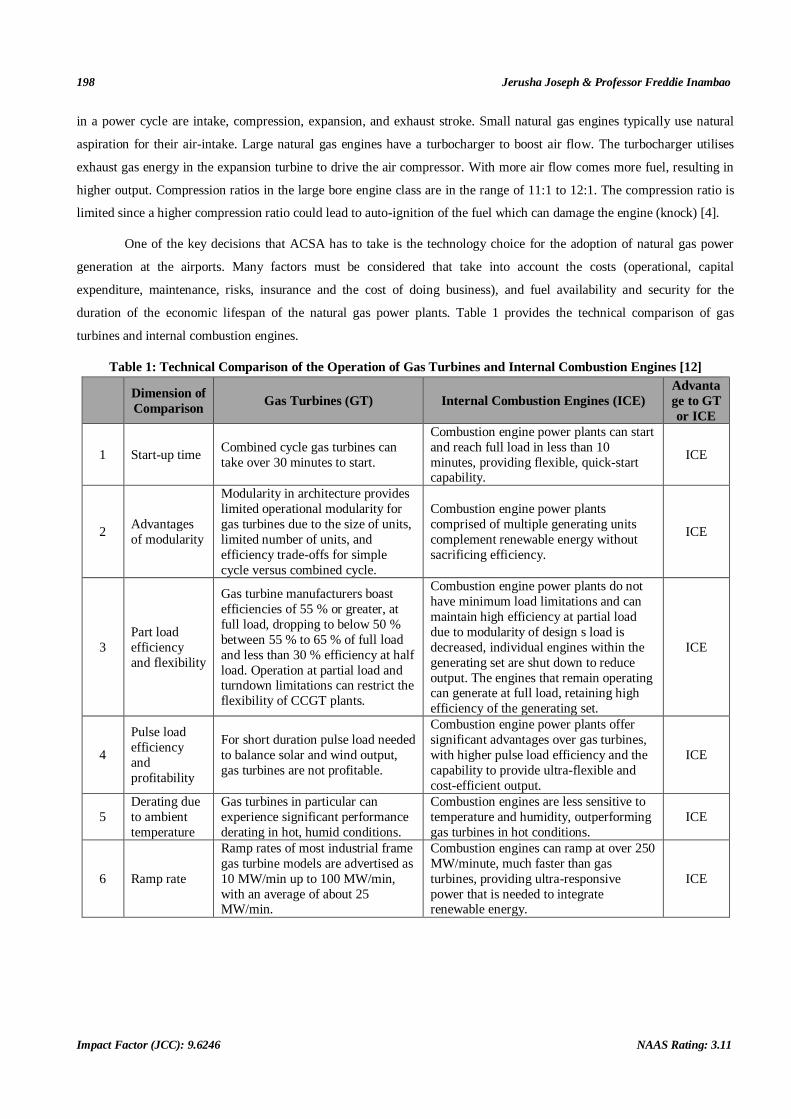
One of the key decisions that ACSA has to take is the technology choice for the adoption of natural gas power
generation at the airports. Many factors must be considered that take into account the costs (operational, capital
expenditure, maintenance, risks, insurance and the cost of doing business), and fuel availability and security for the
duration of the economic lifespan of the natural gas power plants. Table 1 provides the technical comparison of gas
turbines and internal combustion engines.
Table 1: Technical Comparison of the Operation of Gas Turbines and Internal Combustion Engines [12]
Dimension of
Comparison Gas Turbines (GT) Internal Combustion Engines (ICE)
Advanta
ge to GT
or ICE
1 Start-up time Combined cycle gas turbines can
take over 30 minutes to start.
Combustion engine power plants can start
and reach full load in less than 10
minutes, providing flexible, quick-start capability.
ICE
2 Advantages
of modularity
Modularity in architecture provides
limited operational modularity for
gas turbines due to the size of units,
limited number of units, and
efficiency trade-offs for simple
cycle versus combined cycle.
Combustion engine power plants
comprised of multiple generating units
complement renewable energy without
sacrificing efficiency.
ICE
3
Part load
efficiency
and flexibility
Gas turbine manufacturers boast
efficiencies of 55 % or greater, at
full load, dropping to below 50 %
between 55 % to 65 % of full load
and less than 30 % efficiency at half
load. Operation at partial load and turndown limitations can restrict the
flexibility of CCGT plants.
Combustion engine power plants do not
have minimum load limitations and can
maintain high efficiency at partial load
due to modularity of design s load is
decreased, individual engines within the
generating set are shut down to reduce
output. The engines that remain operating can generate at full load, retaining high
efficiency of the generating set.
ICE
4
Pulse load
efficiency
and
profitability
For short duration pulse load needed
to balance solar and wind output,
gas turbines are not profitable.
Combustion engine power plants offer
significant advantages over gas turbines,
with higher pulse load efficiency and the
capability to provide ultra-flexible and
cost-efficient output.
ICE
5
Derating due
to ambient
temperature
Gas turbines in particular can
experience significant performance
derating in hot, humid conditions.
Combustion engines are less sensitive to
temperature and humidity, outperforming
gas turbines in hot conditions.
ICE
6 Ramp rate
Ramp rates of most industrial frame
gas turbine models are advertised as
10 MW/min up to 100 MW/min,
with an average of about 25 MW/min.
Combustion engines can ramp at over 250
MW/minute, much faster than gas
turbines, providing ultra-responsive
power that is needed to integrate renewable energy.
ICE

Energy Security: Investigating Natural Gas for Energy Generation 199
at Airports in South Africa – A Technoeconomic Assessment
www.tjprc.org [email protected]
7 Fuel
flexibility
While gas turbines are often
advertised as having fuel flexibility,
about 90 % of gas turbines
worldwide operate on natural gas or
liquefied natural gas (LNG) because
of its purity and ease of combustion. Gas turbines require about 10
minutes to switchover from
baseload gas to fuel oil.
Combustion engine maintenance is not
affected by fuel type as the engines are
not sensitive to metals or salts in fuel oils.
They are able to switch from natural gas
to fuel oil instantaneously. They are also
able to operate in fuel sharing mode burning varying percentages of gaseous
and liquid fuels simultaneously.
ICE
8 Water
consumption
A combined cycle gas turbine
power plant (CCGT) with a
recirculating system will consume
approximately 780 litres/MWh.
Combustion engine power plant operating
in simple cycle on natural gas will
consume a mere 3 litres/MWh. This is
due to the high efficiency and low cooling
needs.
ICE
The technology to be adopted will be decided upon in the next stage of the project cycle, i.e., the feasibility and
front-end engineering design (FEED) study (FEL 3), considering the technical dimension given in Table 1.
Assessment of Technology Maturity
“John Barber was granted the world’s first gas turbine patent, in 1791 in England, for his design that used the
thermodynamic cycle of the modern gas turbine but obviously not the similar components. In 1903, Norwegian engineer
Aegidius Elling successfully designed and built the first simple cycle gas turbine with a net power output of 8.1 kW and
turbine inlet temperature of 400 °C. During the same time when Elling’s work was in progress, Franz Stolze, a German
engineer who got patent in 1899 for his gas turbine that was designed in 1873, was installing world’s first complete axial
design GT at Berlin-Weissensee Power Station in Germany and tested it in 1905. Another gas turbine of historical
importance, developed by Charles Lamale and Rene Armengaud and designed by French engineer August Rateau in 1905-
1906. In 1920s and 1930s considerable amount of efforts were made at BBC (later ABB and now Alstom Power) in
developing efficient axial compressors. The world’s first successful electric power generating gas turbine consisting of a
single shaft design with a 23 stage axial compressor, one single can combustor and a seven stage axial turbine, developed
by BBC went into commercial operation in Neuchatel, Switzerland in 1939.” [13]
The use of natural gas for electricity generation is not a new concept, but a tried and tested, mature technology in
use around the world. There are more than 130 major natural gas to power plants installed in the world ranging from 55
MW in Australia (Barcaldine Power Station) to 5.6 GW in Russia (Surgat-2 Power Station) [14].
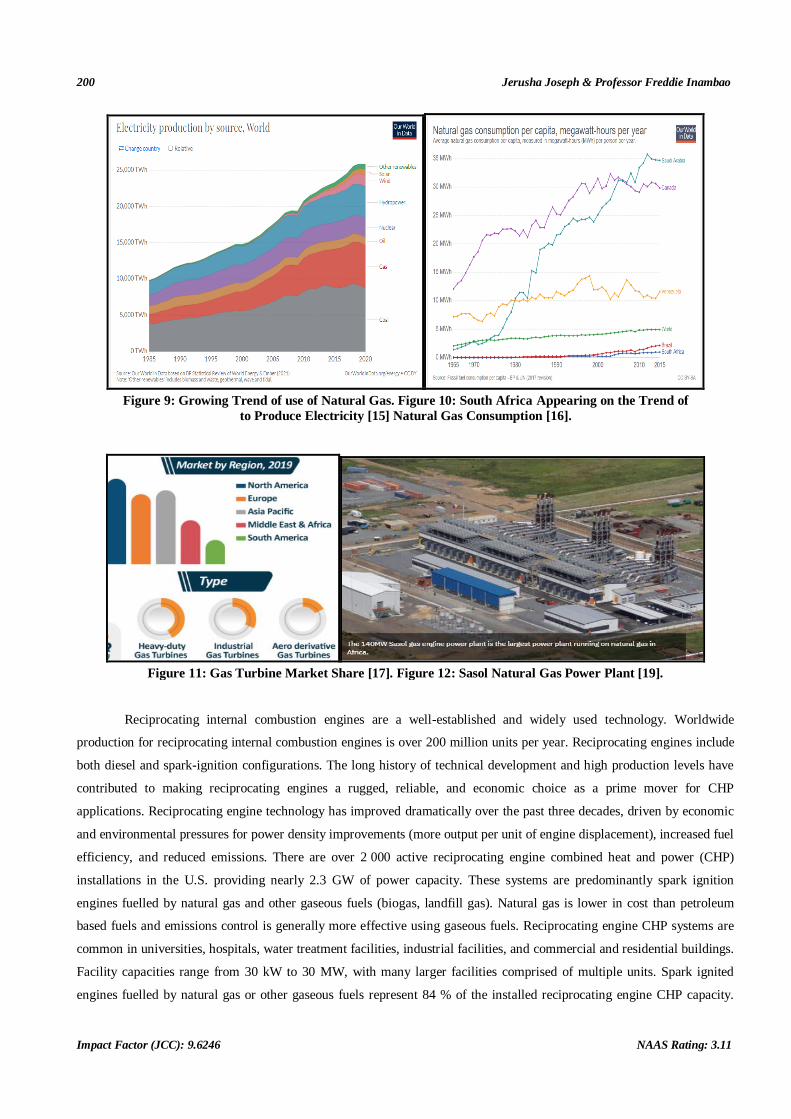
Natural gas has gained popularity over the last two and a half decades as a choice for electricity production with
oil and coal sources being somewhat at a lower growth rate in terms of use for electricity. This could be owing to price
fluctuations of oil and the carbon footprint associated with coal. In the light of climate change natural gas is the preferred
fuel for efficiency and reduction in carbon dioxide emissions associated with electricity generation (figure 9). South Africa
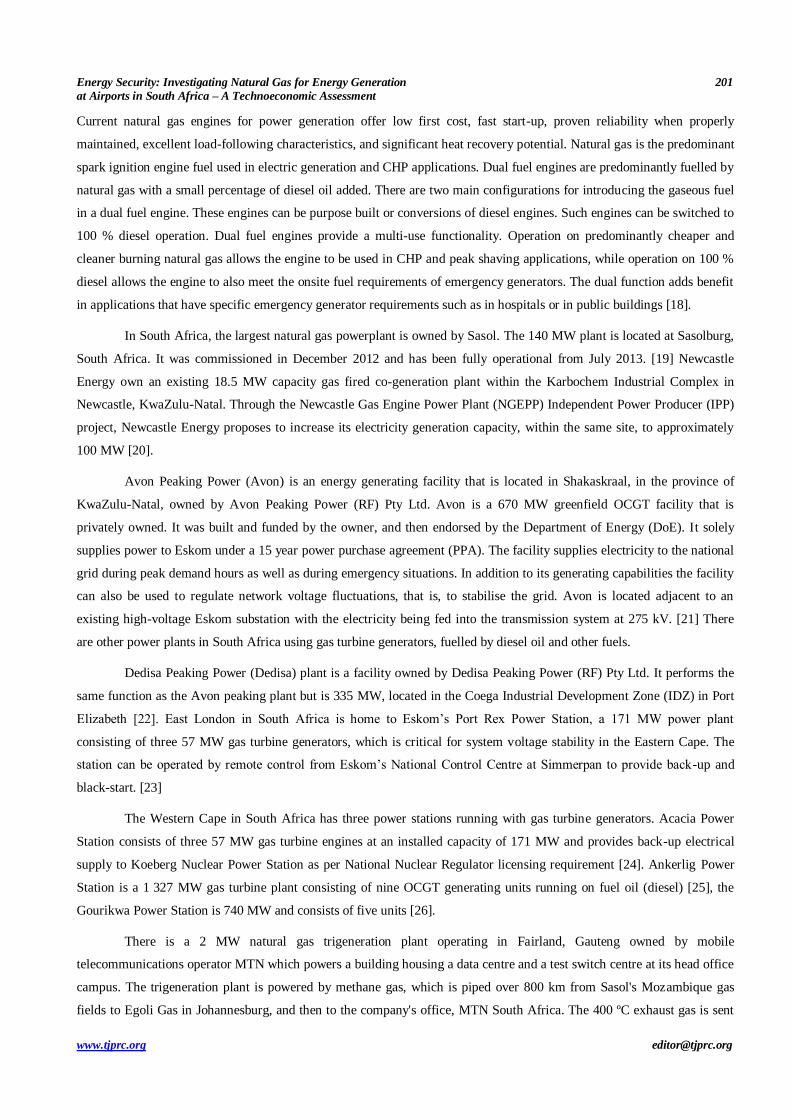
has been growing their uptake of natural gas over the last decade and a half (figure 10). The gas turbine market is
dominated by North America and the Asia Pacific (figure 11).
200 Jerusha Joseph & Professor Freddie Inambao
Impact Factor (JCC): 9.6246 NAAS Rating: 3.11
Figure 9: Growing Trend of use of Natural Gas. Figure 10: South Africa Appearing on the Trend of
to Produce Electricity [15] Natural Gas Consumption [16].
Figure 11: Gas Turbine Market Share [17]. Figure 12: Sasol Natural Gas Power Plant [19].
Reciprocating internal combustion engines are a well-established and widely used technology. Worldwide
production for reciprocating internal combustion engines is over 200 million units per year. Reciprocating engines include
both diesel and spark-ignition configurations. The long history of technical development and high production levels have
contributed to making reciprocating engines a rugged, reliable, and economic choice as a prime mover for CHP
applications. Reciprocating engine technology has improved dramatically over the past three decades, driven by economic
and environmental pressures for power density improvements (more output per unit of engine displacement), increased fuel
efficiency, and reduced emissions. There are over 2 000 active reciprocating engine combined heat and power (CHP)
installations in the U.S. providing nearly 2.3 GW of power capacity. These systems are predominantly spark ignition
engines fuelled by natural gas and other gaseous fuels (biogas, landfill gas). Natural gas is lower in cost than petroleum
based fuels and emissions control is generally more effective using gaseous fuels. Reciprocating engine CHP systems are
common in universities, hospitals, water treatment facilities, industrial facilities, and commercial and residential buildings.
Facility capacities range from 30 kW to 30 MW, with many larger facilities comprised of multiple units. Spark ignited
engines fuelled by natural gas or other gaseous fuels represent 84 % of the installed reciprocating engine CHP capacity.
Energy Security: Investigating Natural Gas for Energy Generation 201
at Airports in South Africa – A Technoeconomic Assessment
www.tjprc.org [email protected]
Current natural gas engines for power generation offer low first cost, fast start-up, proven reliability when properly
maintained, excellent load-following characteristics, and significant heat recovery potential. Natural gas is the predominant
spark ignition engine fuel used in electric generation and CHP applications. Dual fuel engines are predominantly fuelled by
natural gas with a small percentage of diesel oil added. There are two main configurations for introducing the gaseous fuel
in a dual fuel engine. These engines can be purpose built or conversions of diesel engines. Such engines can be switched to
100 % diesel operation. Dual fuel engines provide a multi-use functionality. Operation on predominantly cheaper and
cleaner burning natural gas allows the engine to be used in CHP and peak shaving applications, while operation on 100 %
diesel allows the engine to also meet the onsite fuel requirements of emergency generators. The dual function adds benefit
in applications that have specific emergency generator requirements such as in hospitals or in public buildings [18].
In South Africa, the largest natural gas powerplant is owned by Sasol. The 140 MW plant is located at Sasolburg,
South Africa. It was commissioned in December 2012 and has been fully operational from July 2013. [19] Newcastle
Energy own an existing 18.5 MW capacity gas fired co-generation plant within the Karbochem Industrial Complex in
Newcastle, KwaZulu-Natal. Through the Newcastle Gas Engine Power Plant (NGEPP) Independent Power Producer (IPP)
project, Newcastle Energy proposes to increase its electricity generation capacity, within the same site, to approximately
100 MW [20].
Avon Peaking Power (Avon) is an energy generating facility that is located in Shakaskraal, in the province of
KwaZulu-Natal, owned by Avon Peaking Power (RF) Pty Ltd. Avon is a 670 MW greenfield OCGT facility that is
privately owned. It was built and funded by the owner, and then endorsed by the Department of Energy (DoE). It solely
supplies power to Eskom under a 15 year power purchase agreement (PPA). The facility supplies electricity to the national
grid during peak demand hours as well as during emergency situations. In addition to its generating capabilities the facility
can also be used to regulate network voltage fluctuations, that is, to stabilise the grid. Avon is located adjacent to an
existing high-voltage Eskom substation with the electricity being fed into the transmission system at 275 kV. [21] There
are other power plants in South Africa using gas turbine generators, fuelled by diesel oil and other fuels.
Dedisa Peaking Power (Dedisa) plant is a facility owned by Dedisa Peaking Power (RF) Pty Ltd. It performs the
same function as the Avon peaking plant but is 335 MW, located in the Coega Industrial Development Zone (IDZ) in Port
Elizabeth [22]. East London in South Africa is home to Eskom’s Port Rex Power Station, a 171 MW power plant
consisting of three 57 MW gas turbine generators, which is critical for system voltage stability in the Eastern Cape. The
station can be operated by remote control from Eskom’s National Control Centre at Simmerpan to provide back-up and
black-start. [23]
The Western Cape in South Africa has three power stations running with gas turbine generators. Acacia Power
Station consists of three 57 MW gas turbine engines at an installed capacity of 171 MW and provides back-up electrical
supply to Koeberg Nuclear Power Station as per National Nuclear Regulator licensing requirement [24]. Ankerlig Power
Station is a 1 327 MW gas turbine plant consisting of nine OCGT generating units running on fuel oil (diesel) [25], the
Gourikwa Power Station is 740 MW and consists of five units [26].
There is a 2 MW natural gas trigeneration plant operating in Fairland, Gauteng owned by mobile
telecommunications operator MTN which powers a building housing a data centre and a test switch centre at its head office
campus. The trigeneration plant is powered by methane gas, which is piped over 800 km from Sasol's Mozambique gas
fields to Egoli Gas in Johannesburg, and then to the company's office, MTN South Africa. The 400 ºC exhaust gas is sent
202 Jerusha Joseph & Professor Freddie Inambao
Impact Factor (JCC): 9.6246 NAAS Rating: 3.11
through lithium bromide absorption chillers to cool water, which MTN uses for the cooling needs in the building. The plant
consisted of two 1 MW General Electric Jenbacher gas engines, and the absorption chillers were supplied by Carrier [27].
The MTN trigeneration plant was visited by the ACSA technical team in an effort to understand how the plant
operates and serves the energy needs of the buildings at the MTN head office in Fairways. This plant setup, fuel supply and
energy distribution (electricity, chilled water and heat) is what ACSA is considering in the investigation of the adoption of
natural gas as a fuel supply for the three airports, ORTIA, CTIA and KSIA.
Cost Benefit Analysis
Due to this technoeconomic assessment being a desktop exercise meant to provide an indication of the economics of the
adoption of natural gas fuel trigeneration plants for airports at pre-feasibility (FEL 2 or Front-End Loading Stage 2),
factors such as the cost of fuel gas supply logistics, the savings and benefits of using air conditioning and heat are
excluded. The capital cost of the plant was based on the MTN trigeneration plant cost.
(a) Rationale for the Scale of Natural Gas to Power
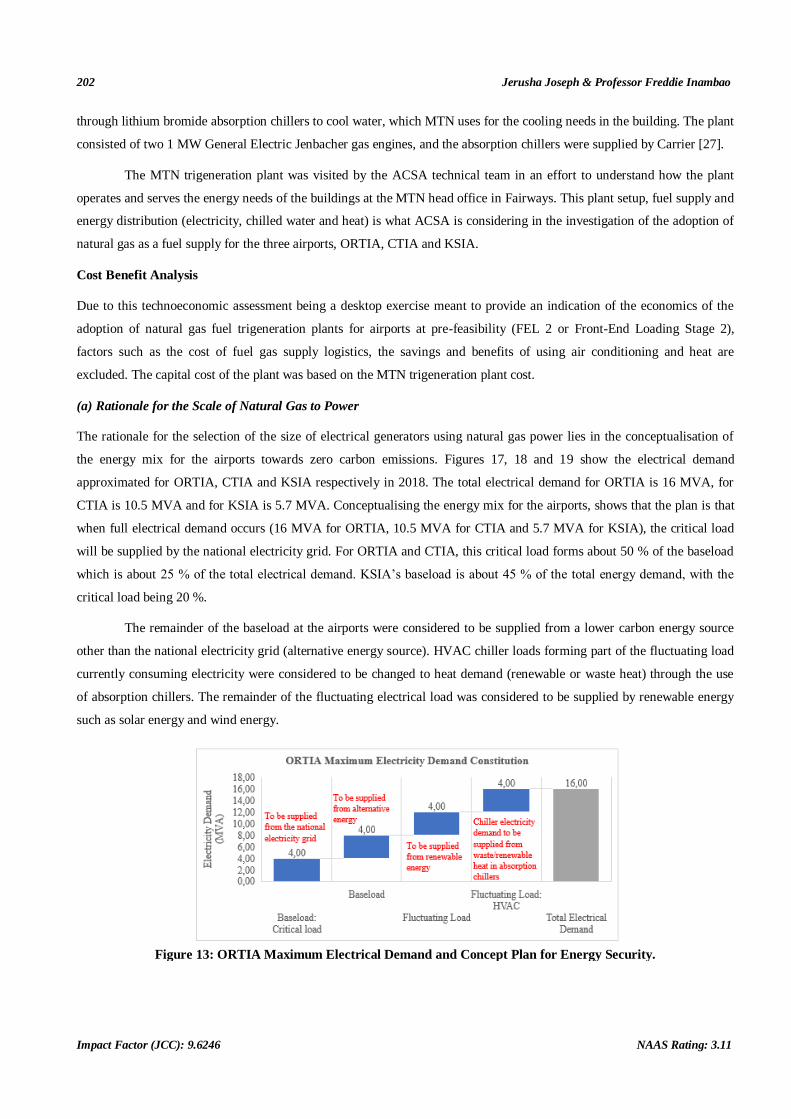
The rationale for the selection of the size of electrical generators using natural gas power lies in the conceptualisation of
the energy mix for the airports towards zero carbon emissions. Figures 17, 18 and 19 show the electrical demand
approximated for ORTIA, CTIA and KSIA respectively in 2018. The total electrical demand for ORTIA is 16 MVA, for
CTIA is 10.5 MVA and for KSIA is 5.7 MVA. Conceptualising the energy mix for the airports, shows that the plan is that
when full electrical demand occurs (16 MVA for ORTIA, 10.5 MVA for CTIA and 5.7 MVA for KSIA), the critical load
will be supplied by the national electricity grid. For ORTIA and CTIA, this critical load forms about 50 % of the baseload
which is about 25 % of the total electrical demand. KSIA’s baseload is about 45 % of the total energy demand, with the
critical load being 20 %.
The remainder of the baseload at the airports were considered to be supplied from a lower carbon energy source
other than the national electricity grid (alternative energy source). HVAC chiller loads forming part of the fluctuating load
currently consuming electricity were considered to be changed to heat demand (renewable or waste heat) through the use
of absorption chillers. The remainder of the fluctuating electrical load was considered to be supplied by renewable energy
such as solar energy and wind energy.
Figure 13: ORTIA Maximum Electrical Demand and Concept Plan for Energy Security.

Energy Security: Investigating Natural Gas for Energy Generation 203
at Airports in South Africa – A Technoeconomic Assessment
www.tjprc.org [email protected]
Figure 14: CTIA Maximum Electrical Demand and Concept Plan for Energy Security.
Figure 15: KSIA Maximum Electrical Demand and Concept Plan for Energy Security.
The focus in this paper is using natural gas as an alternative energy source to power the airports’ baseload energy
supply. For the fluctuating load, the renewable energy considered for the airports were solar photovoltaic (PV) plants.
Solar PV was considered for investigation as the renewable energy option due to its ease of incorporation, familiarity to
ACSA airports’ operating environment and the availability of sufficient solar irradiation at all three locations. Natural gas
was selected due to its availability in the three geographical regions, its maturity in the market and its high capacity factor.
Following the conceptual energy mix summarised in Fig. 13, 14 and 15, a FEL 2 (prefeasibility study) was
performed on the energy sources proposed. Space availability for the solar PV plants was taken into consideration due to
the land limitations that ORTIA, CTIA and KSIA face as growing airports where land is reserved for commercial and
operational development. The capacity of solar PV plants needed to satisfy the fluctuating load was quite demanding in
terms of spatial constraints. When compared to the option of increasing the capacity of the natural gas generator to rather
serve the fluctuating load, such an investment seems like a better option. Refer to Tables 2, 3 and 4 for ORTIA, CTIA and
KSIA respectively.
204 Jerusha Joseph & Professor Freddie Inambao
Impact Factor (JCC): 9.6246 NAAS Rating: 3.11
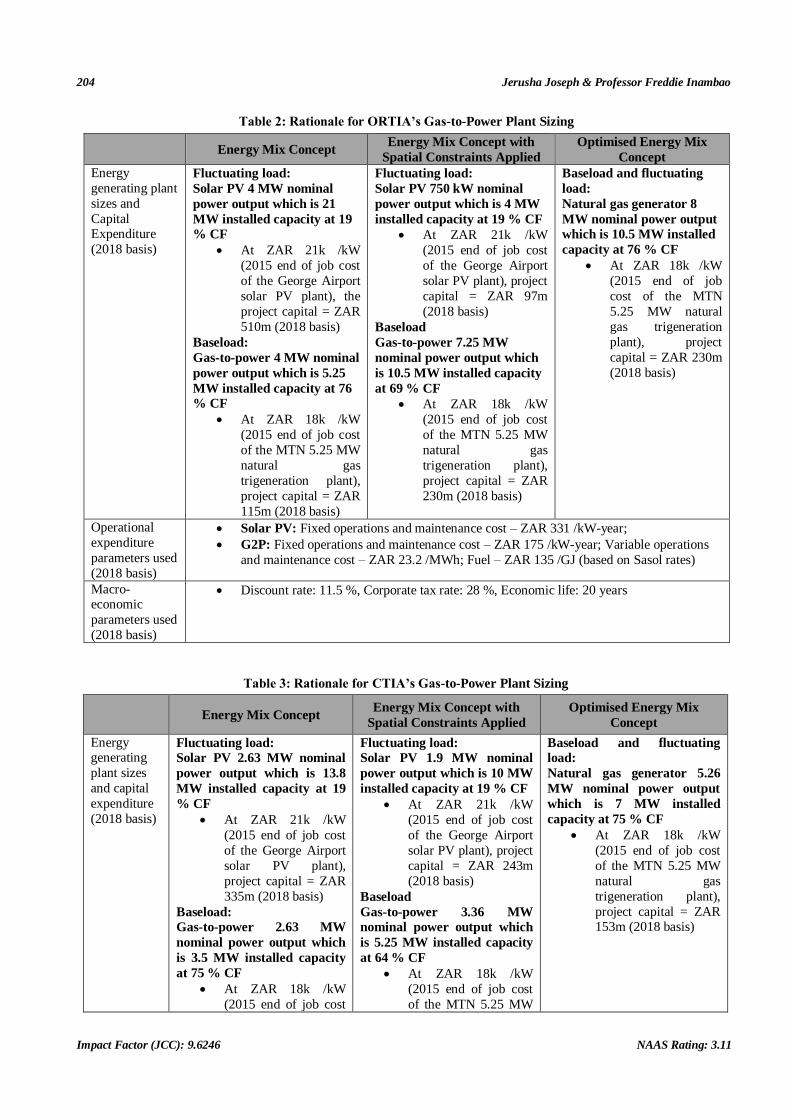
Table 2: Rationale for ORTIA’s Gas-to-Power Plant Sizing
Energy Mix Concept
Energy Mix Concept with
Spatial Constraints Applied
Optimised Energy Mix
Concept
Energy
generating plant
sizes and
Capital Expenditure
(2018 basis)
Fluctuating load:
Solar PV 4 MW nominal
power output which is 21
MW installed capacity at 19
% CF
At ZAR 21k /kW
(2015 end of job cost
of the George Airport
solar PV plant), the
project capital = ZAR
510m (2018 basis)
Baseload:
Gas-to-power 4 MW nominal
power output which is 5.25
MW installed capacity at 76
% CF
At ZAR 18k /kW
(2015 end of job cost
of the MTN 5.25 MW
natural gas
trigeneration plant),
project capital = ZAR
115m (2018 basis)
Fluctuating load:
Solar PV 750 kW nominal
power output which is 4 MW
installed capacity at 19 % CF
At ZAR 21k /kW
(2015 end of job cost
of the George Airport
solar PV plant), project
capital = ZAR 97m
(2018 basis)
Baseload
Gas-to-power 7.25 MW
nominal power output which
is 10.5 MW installed capacity
at 69 % CF
At ZAR 18k /kW
(2015 end of job cost
of the MTN 5.25 MW
natural gas
trigeneration plant),
project capital = ZAR
230m (2018 basis)
Baseload and fluctuating
load:
Natural gas generator 8
MW nominal power output
which is 10.5 MW installed
capacity at 76 % CF
At ZAR 18k /kW
(2015 end of job
cost of the MTN
5.25 MW natural
gas trigeneration
plant), project
capital = ZAR 230m
(2018 basis)
Operational
expenditure
parameters used
(2018 basis)
Solar PV: Fixed operations and maintenance cost – ZAR 331 /kW-year;
G2P: Fixed operations and maintenance cost – ZAR 175 /kW-year; Variable operations
and maintenance cost – ZAR 23.2 /MWh; Fuel – ZAR 135 /GJ (based on Sasol rates)
Macro-economic
parameters used
(2018 basis)
Discount rate: 11.5 %, Corporate tax rate: 28 %, Economic life: 20 years
Table 3: Rationale for CTIA’s Gas-to-Power Plant Sizing
Energy Mix Concept
Energy Mix Concept with
Spatial Constraints Applied
Optimised Energy Mix
Concept
Energy generating
plant sizes
and capital
expenditure
(2018 basis)
Fluctuating load:
Solar PV 2.63 MW nominal
power output which is 13.8
MW installed capacity at 19
% CF
At ZAR 21k /kW
(2015 end of job cost
of the George Airport
solar PV plant),
project capital = ZAR
335m (2018 basis)
Baseload:
Gas-to-power 2.63 MW
nominal power output which
is 3.5 MW installed capacity
at 75 % CF
At ZAR 18k /kW
(2015 end of job cost
Fluctuating load:
Solar PV 1.9 MW nominal
power output which is 10 MW
installed capacity at 19 % CF
At ZAR 21k /kW
(2015 end of job cost
of the George Airport
solar PV plant), project
capital = ZAR 243m
(2018 basis)
Baseload
Gas-to-power 3.36 MW
nominal power output which
is 5.25 MW installed capacity
at 64 % CF
At ZAR 18k /kW
(2015 end of job cost
of the MTN 5.25 MW
Baseload and fluctuating
load:
Natural gas generator 5.26
MW nominal power output
which is 7 MW installed
capacity at 75 % CF
At ZAR 18k /kW
(2015 end of job cost
of the MTN 5.25 MW
natural gas
trigeneration plant),
project capital = ZAR 153m (2018 basis)

Energy Security: Investigating Natural Gas for Energy Generation 205
at Airports in South Africa – A Technoeconomic Assessment
www.tjprc.org [email protected]
of the MTN 5.25 MW
natural gas
trigeneration plant),
project capital = ZAR
77m (2018 basis)
natural gas
trigeneration plant),
project capital = ZAR
115m (2018 basis)
Operational
expenditure parameters
used (2018
basis)
Solar PV: Fixed operations and maintenance cost – ZAR 331 /kW-year;
G2P: Fixed operations and maintenance cost – ZAR 175 /kW-year; Variable operations and maintenance cost – ZAR 23.2 /MWh; Fuel – ZAR 135 /GJ (based on Sasol rates)
Macro-
economic
parameters
used (2018
basis)
Discount rate: 11.5 %, Corporate tax rate: 28 %, Economic life: 20 years
Table 4: Rationale for KSIA’s Gas-to-Power Plant Sizing
Energy Mix Concept
Energy Mix Concept with
Spatial Constraints Applied
Optimised Energy Mix
Concept
Energy
generating plant
sizes and
Capital
Expenditure
(2018 basis)
Fluctuating load:
Solar PV 1.43 MW nominal
power output which is 7.25
MW installed capacity at 19
% CF
At ZAR 21k /kW
(2015 end of job cost
of the George Airport
solar PV plant), project
capital = ZAR 182m
(2018 basis)
Baseload:
Gas to Power 2.28 MW
nominal power output which
is 3.5 MW installed capacity at
65 % CF
At ZAR 18k /kW
(2015 end of job cost
of the MTN 5.25 MW
natural gas
trigeneration plant),
project capital = ZAR
77m (2018 basis)
Fluctuating load:
Solar PV 1.9 MW nominal
power output which is 10 MW
installed capacity at 19 % CF
At ZAR 21k /kW
(2015 end of job cost
of the George Airport
solar PV plant), project
capital = ZAR 243m
(2018 basis)
Baseload:
Gas to Power 1.81 MW
nominal power output which
is 3.5 MW installed capacity
at 52 % CF
At ZAR 18k /kW (2015 end of job cost
of the MTN 5.25 MW
natural gas
trigeneration plant),
project capital = ZAR
77m (2018 basis)
Baseload and fluctuating
load:
Natural gas generator 3.71
MW nominal power output
which is 5.25 MW installed
capacity at 71 % CF
At ZAR 18k /kW
(2015 end of job
cost of the MTN
5.25 MW natural gas
trigeneration plant),
project capital =
ZAR 115m (2018
basis)
Operational
expenditure
parameters used
(2018 basis)
Solar PV: Fixed operations and maintenance cost – ZAR 331 /kW-year;
G2P: Fixed operations and maintenance cost – ZAR 175 /kW-year; Variable operations
and maintenance cost – ZAR 23.2 /MWh; Fuel – ZAR 135 /GJ (based on Sasol rates)
Macro-
economic parameters used
(2018 basis)
Discount rate: 11.5 %, Corporate tax rate: 28 %, Economic life: 20 years
The nominal capacities of the natural gas-to-power technologies thus take on the fluctuating demand at smaller
engine sizes for each of the international airports. The resulting installation capacity for each installation investigated for
feasibility is 10.5 MW, 7 MW and 5.25 MW for ORIA, CTIA and KSIA respectively. Full details are provided below.

206 Jerusha Joseph & Professor Freddie Inambao
Impact Factor (JCC): 9.6246 NAAS Rating: 3.11
(b) Feasibility Study Results
Airports Company South Africa has an economic modelling department that creates economic models in excel
spreadsheets. The economic model yields the net present value (NPV), internal rate of return (IRR), the nominal payback
period and the profitability index. The IRR is compared to ACSA’s 11.5% weighted average cost of capital (WACC) rate
(2018) to determine economic feasibility. When the NPV is zero or positive it is an investment that pays itself off during its
economic lifespan. The net present value (NPV) equation used in the economic model is given below, Equation (1), where
the internal rate of return (IRR) is the return (i in below equation) when the NPV is zero. When the IRR is greater than the
discount rate (or the WACC rate), then the investment is feasible for the business. The payback period is the amount of
time required for cash inflows generated by a project to offset its initial cash outflow. The payback should be reasonably
within the economic lifespan of the investment. The profitability index (PI) provided in Equation (2) shows the financial
attractiveness of the proposed project and is the ratio of the sum of the present value of the future expected cash flows to
the initial investment amount. A PI greater than 1.0 is deemed to be a good investment, with higher values corresponding
to more attractive projects.
Equation (1)
Where: net cash inflows – outflows during a single period t
i = discount rate or return that could be earned
t = number of time periods
Equation (2)
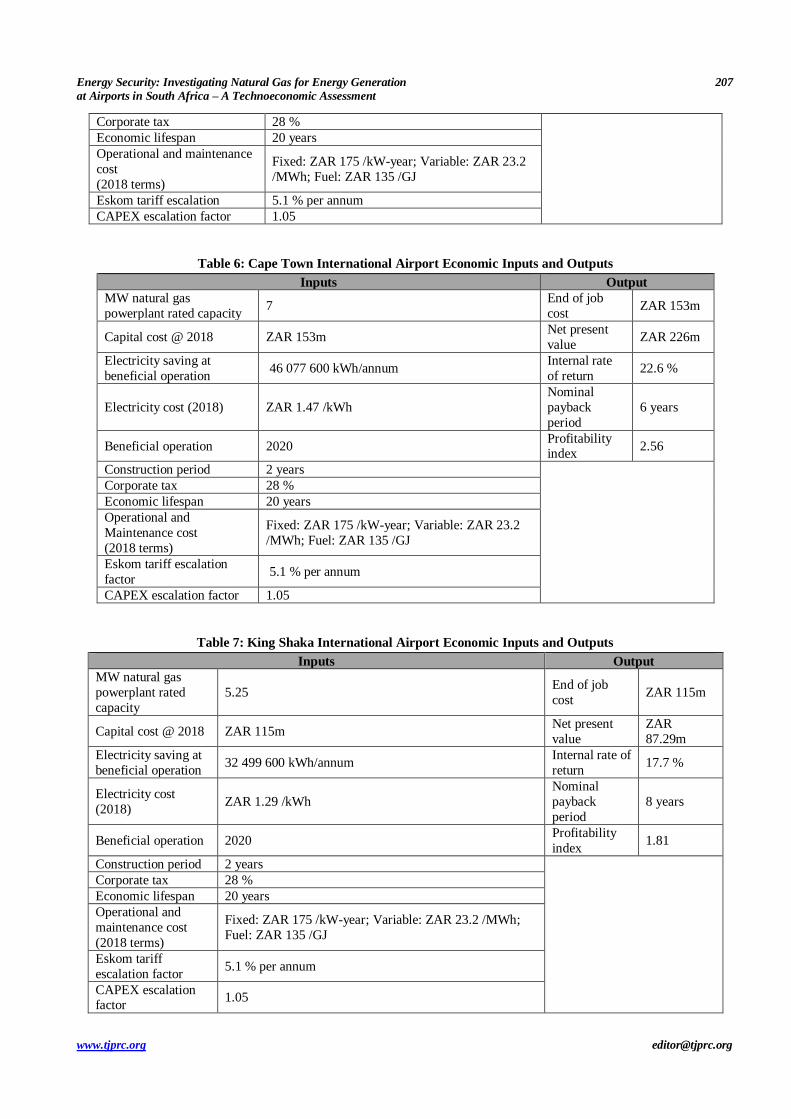
Tables 5, 6 and 7 show the economic model inputs and outputs. In summary:
OR Tambo International Airport – For a 10.5 MW natural gas-powered plant, the NPV is ZAR 347.75m (positive)
and IRR of 22.8 % (exceeding the ACSA WACC rate of 11.5 %) which shows that the installation is feasible.
Cape Town International Airport – For a 7 MW natural gas-powered plant, the NPV is ZAR 226m (positive) and
IRR of 22.6 % (exceeding the ACSA WACC rate of 11.5 %) which shows that the installation is feasible.
King Shaka International Airport – For a 5.25 MW natural gas-powered plant, the NPV)is ZAR 87.29m (positive)
and IRR of 17.7 % (exceeding the ACSA WACC rate of 11.5 %) which shows that the installation is feasible.
Table 5: O R Tambo International Airport Economic Inputs and Outputs
Inputs Output
MW natural gas powerplant rated capacity
10.5 End of job cost ZAR 230m
Capital cost (2018 basis) ZAR 230m Net present value ZAR
347.75m
Electricity saving at
beneficial operation 70 080 000 kWh/annum
Internal rate of
return 22.8 %
Electricity cost (2018) ZAR 1.47 /kWh Nominal payback
period 6 years
Beneficial operation 2020 Profitability
index 2.6
Construction period 2 years
Energy Security: Investigating Natural Gas for Energy Generation 207
at Airports in South Africa – A Technoeconomic Assessment
www.tjprc.org [email protected]
Corporate tax 28 %
Economic lifespan 20 years
Operational and maintenance
cost
(2018 terms)
Fixed: ZAR 175 /kW-year; Variable: ZAR 23.2
/MWh; Fuel: ZAR 135 /GJ
Eskom tariff escalation 5.1 % per annum
CAPEX escalation factor 1.05
Table 6: Cape Town International Airport Economic Inputs and Outputs
Inputs Output
MW natural gas
powerplant rated capacity 7
End of job
cost ZAR 153m
Capital cost @ 2018 ZAR 153m Net present
value ZAR 226m
Electricity saving at
beneficial operation 46 077 600 kWh/annum
Internal rate
of return 22.6 %
Electricity cost (2018) ZAR 1.47 /kWh
Nominal
payback
period
6 years
Beneficial operation 2020 Profitability index
2.56
Construction period 2 years
Corporate tax 28 %
Economic lifespan 20 years
Operational and
Maintenance cost
(2018 terms)
Fixed: ZAR 175 /kW-year; Variable: ZAR 23.2
/MWh; Fuel: ZAR 135 /GJ
Eskom tariff escalation
factor 5.1 % per annum
CAPEX escalation factor 1.05
Table 7: King Shaka International Airport Economic Inputs and Outputs
Inputs Output
MW natural gas
powerplant rated
capacity
5.25 End of job
cost ZAR 115m
Capital cost @ 2018 ZAR 115m Net present
value
ZAR
87.29m
Electricity saving at
beneficial operation 32 499 600 kWh/annum
Internal rate of
return 17.7 %
Electricity cost
(2018) ZAR 1.29 /kWh
Nominal
payback
period
8 years
Beneficial operation 2020 Profitability
index 1.81
Construction period 2 years
Corporate tax 28 %
Economic lifespan 20 years
Operational and
maintenance cost
(2018 terms)
Fixed: ZAR 175 /kW-year; Variable: ZAR 23.2 /MWh;
Fuel: ZAR 135 /GJ
Eskom tariff
escalation factor 5.1 % per annum
CAPEX escalation factor
1.05
208 Jerusha Joseph & Professor Freddie Inambao
Impact Factor (JCC): 9.6246 NAAS Rating: 3.11
This prefeasibility study (FEL 2) conducted for the three selected airports show that all three natural gas
trigeneration plant installations are feasible, i.e., ORTIA, CTIA and KSIA. To determine the factors that the prefeasibility
would be most susceptible to, a sensitivity analysis was done.
(c) Sensitivity Analysis
For the sensitivity analysis, the four factors that play a role in the determination of the profitability of the investment were
varied equally to see the significance of the impact that each parameter had on the profitability relative to each other. The
base cases used are described in table 5, Table 6 and table 7 for ORTIA, CTIA and KSIA respectively.
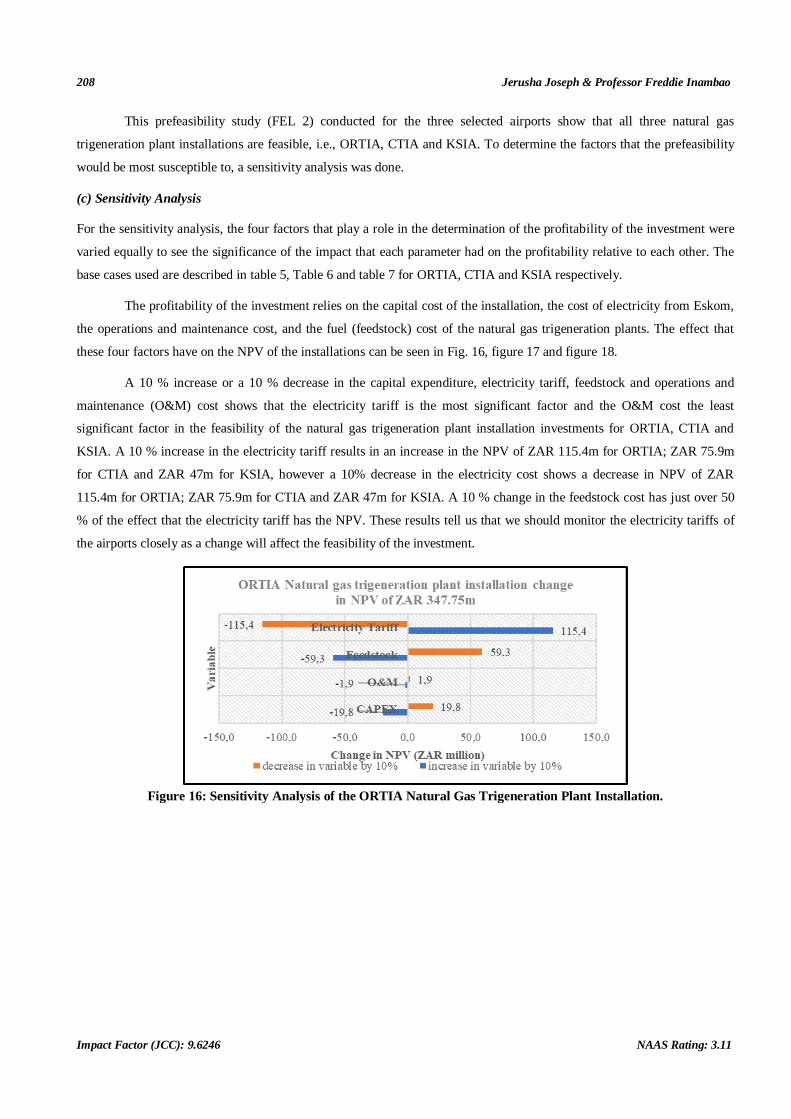
The profitability of the investment relies on the capital cost of the installation, the cost of electricity from Eskom,
the operations and maintenance cost, and the fuel (feedstock) cost of the natural gas trigeneration plants. The effect that
these four factors have on the NPV of the installations can be seen in Fig. 16, figure 17 and figure 18.
A 10 % increase or a 10 % decrease in the capital expenditure, electricity tariff, feedstock and operations and
maintenance (O&M) cost shows that the electricity tariff is the most significant factor and the O&M cost the least
significant factor in the feasibility of the natural gas trigeneration plant installation investments for ORTIA, CTIA and
KSIA. A 10 % increase in the electricity tariff results in an increase in the NPV of ZAR 115.4m for ORTIA; ZAR 75.9m
for CTIA and ZAR 47m for KSIA, however a 10% decrease in the electricity cost shows a decrease in NPV of ZAR
115.4m for ORTIA; ZAR 75.9m for CTIA and ZAR 47m for KSIA. A 10 % change in the feedstock cost has just over 50
% of the effect that the electricity tariff has the NPV. These results tell us that we should monitor the electricity tariffs of
the airports closely as a change will affect the feasibility of the investment.
Figure 16: Sensitivity Analysis of the ORTIA Natural Gas Trigeneration Plant Installation.

Energy Security: Investigating Natural Gas for Energy Generation 209
at Airports in South Africa – A Technoeconomic Assessment
www.tjprc.org [email protected]
Figure 17: Sensitivity Analysis of the CTIA Natural Gas Trigeneration Plant Installation.
Figure 18: Sensitivity Analysis of the KSIA Natural Gas Trigeneration Plant Installation.
The results also show that the feasibility is sound in that even a 10 % change in the electricity, capital expenditure
required, or operational expenditure required will not make the investment into natural gas trigeneration powerplants for
ORTIA, CTIA and KSIA unfeasible.
Technology Risk Assessment
The natural gas powerplant technology being used as a baseload SOURCE of energy for ORTIA, CTIA and KSIA must be
always available. The fluctuating load portion that the natural gas powerplant is meant to serve requires that the plant be
able to respond to the varying energy demands efficiently and effectively. Table 8 performs a technology risk assessment
and provides the possible mitigations.
210 Jerusha Joseph & Professor Freddie Inambao
Impact Factor (JCC): 9.6246 NAAS Rating: 3.11
Table 8: Technology Risk Assessment for the Natural Gas Power Plant for ORTIA, CTIA, KSIA
Risk Description Possible Mitigation
Feedstock
supply
Natural gas supply is primarily from
Sasol. Should their contract with
Mozambique be terminated in 2028,
alternative suppliers of natural gas
will need to be acquired.
Alternative suppliers of natural gas should be
identified.
Adopt combustion engines that can use more than one
type of feedstock.
Single
point of
failure
This is failure at a single point
which, without, the entire plant will
not generate electricity or heat for
air conditioning or hot water. The
failure of the natural gas engine is the single point of failure.
Modularity must be introduced such that should a
failure occur in one engine, the rest of the engines will
be able to supply the energy demand.
Control systems must be employed to ensure that this
transition is smooth and there is no impact on airport operations.
Agility
This is the ability of the plant’s
operational output to respond to
varying demand timeously without
causing operational impacts or
damage to infrastructure.
Adopt natural gas engines that have a high ramp rate
and are able to respond to varying energy demand
effectively.
Ensure that controls are tested during commissioning to
guarantee the system’s ability to respond to varying
demand without causing damage to infrastructure or
negatively impacting airport operations.
Turn-
down
ratio
This is the ability of the plant design
capacity to be increased and
decreased to suit operational
demand and work effectively for the purposes of maintenance towards
cost effectiveness.
Understand the demand profile of the airport’s
electricity, air conditioning and water heating
requirements and apply the appropriate scale for the
airport based on plant utilisation of the electricity and
hot water generated.
Consider economies of scale for total plant design
capacity and modular operations for the various
demand requirements at every hour in the 24-hour day
5. Airports Integration Strategy
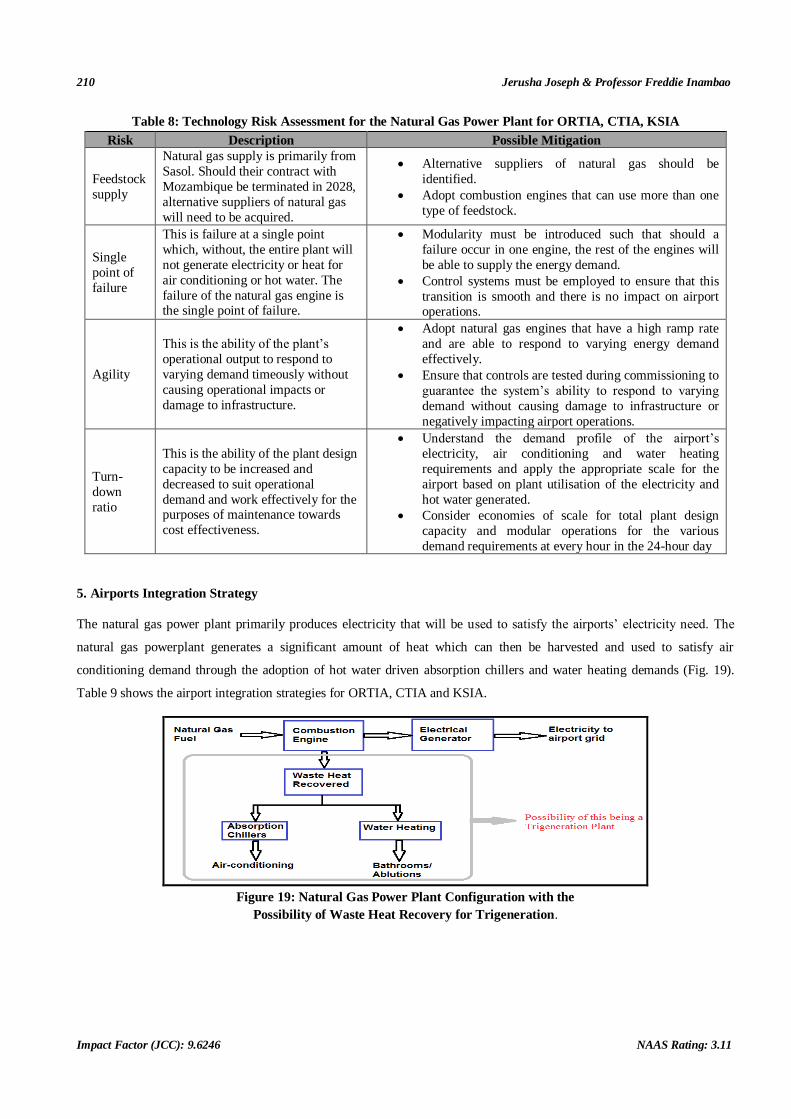
The natural gas power plant primarily produces electricity that will be used to satisfy the airports’ electricity need. The
natural gas powerplant generates a significant amount of heat which can then be harvested and used to satisfy air
conditioning demand through the adoption of hot water driven absorption chillers and water heating demands (Fig. 19).
Table 9 shows the airport integration strategies for ORTIA, CTIA and KSIA.
Figure 19: Natural Gas Power Plant Configuration with the
Possibility of Waste Heat Recovery for Trigeneration.

Energy Security: Investigating Natural Gas for Energy Generation 211
at Airports in South Africa – A Technoeconomic Assessment
www.tjprc.org [email protected]
Table 9: Suggested Integration Strategy of Natural gas Trigeneration for ORTIA, CTIA, KSIA
Generation
Component of
the Natural Gas
Trigeneration
Plant
Suggested Integration Strategy Required Investigation
Electricity
Provide electricity to the airport’s electrical reticulation
system as a primary supply with Eskom supply as back up
for the rest of the airport’s electrical requirement. A smart
grid to be employed to coordinate power supply such that
the airport receives smooth output of electricity while maximising the cost.
Investigate electricity consumption
profile of the airport at various times
of the day and during various
seasons to secure new notified
maximum demand (NMD) from Eskom.
Air
conditioning
Absorption chillers to be employed that utilise waste heat
from the natural gas engines to produced chilled water for
distribution to the air handling units. Prior to distribution of
chilled water to air handling units, there should be a buffer
chilled water storage tank. Chilled water should be utilised
from the absorption chillers primarily. The chillers in the
original HVAC plantrooms should be used and cycled as
per their cost effectiveness to produce chilled water to
make up for any shortfall in production of chilled water. In
terms of heating, this should be provided by the absorption
chillers primarily. Heaters in air handling units at ORTIA
should be disconnected.
Investigate air conditioning demand
and how much of this can be
satisfied through the absorption
chillers; investigate and ascertain
piping and instrumentation required
for chiller integration.
Hot Water
Hot water to be stored in a hot water tank/s and distributed to the various areas for rest room showers and basins.
Should pipe runs result in significant heat loss, this heat
loss should be “made up” as per the design with reheat
(using, for example, spot heaters for basins and geysers for
showers).
Investigate the hot water requirements of the airport and that
which can be satisfied from the
plant; investigate and ascertain
piping and instrumentation required
for hot water integration.
Proposed Operational Philosophy
(a) Technical
When the natural gas power plant is running and providing electricity to the airport, the production of chilled water and hot
water will be possible. Electricity will be provided as per demand of the airport and running of the generators will be such
that it is at optimum capacity for the production of electricity, chilled water and hot water requirements with make-up of
electricity requirements being provided by Eskom, with existing chillers and hot water making up shortfalls for air
conditioning and water heating requirements.
(b) Plant Operation for Business Continuity and Cost Effectiveness
Plant operation should be designed to run in modular fashion considering the maintenance downtime required. In case of
total plant failure either due to technical issues or lack of fuel supply, this should be addressed by business continuity plans
that must be put into place before beneficial operation of the plant. This will include memoranda of understanding with
various suppliers for alternative fuel supply and capacity required from Eskom in the event of total failure. Guarantees
from the plant operators and insurance should also be in place to protect the cost effectiveness of providing electricity to
the airport via the natural gas power plants.
(c) Operations and Maintenance
It is proposed that the plant be constructed by ACSA, however, the operations and maintenance should be contracted out as

212 Jerusha Joseph & Professor Freddie Inambao
Impact Factor (JCC): 9.6246 NAAS Rating: 3.11
this is not ACSA’s core function nor does the company have the internal skills to operate and maintain this type of plant.
With time, the operations and maintenance skills should be transferred to the inhouse team.
CONCLUSIONS
Using natural gas powerplants to serve the baseload and fluctuating energy demands of ORTIA, CTIA and KSIA are
feasible. The waste heat harvested from the natural gas engines can be used to serve the airport’s space conditioning needs
as well as provide for their water heating needs. Natural gas engine technology is a mature technology world-wide,
however, not as common in South Africa. Natural gas as a source of fuel has about 50 % of the carbon footprint of the
traditional coal-fired power stations. The natural gas power plants will be instrumental in transitioning the three
international airports toward a lower carbon footprint, enabling strides toward the airports’ agenda of its green star rating
through the Green Building Council South Africa (GBCSA) and the Airports Council International (ACI) carbon
accreditation. The impact that the natural gas power plants potentially have on the reduction of the carbon footprint of the
airports are around 30 % for the ACSA airports. Individually, ORTIA’s carbon footprint in electricity consumption will be
reduced by about 30 %, CTIA by about 34 % and KSIA by about 48 % by implementing and using natural gas
powerplants. To adopt these natural gas powerplants, a final feasibility study (FEL 3) drawn from individual preliminary
designs (Front End Engineering Designs or FEED studies) for the airports, together with a detailed risk analysis and
legislative requirements including the cost of all requirements must be evaluated against the benefits, so that a financial
investment decision can be made.
REFERENCES
1. F. Y. Liang, M. Ryvak, S. Sayeed, N. Zhao, “The role of natural gas as a primary fuel in the near future, including
comparisons of acquisition, transmission and waste handling costs of as with competitive alternatives”, Chemistry Central
Journal 2012, 6(Suppl 1):S4, http://journal.chemistrycentral.com/content/6/S1/S4.
2. Universal Technical Institute, “CNG vs. LPG vs. LNG fuel: Understanding the differences”, 30 January 2020,
https://www.uti.edu/blog/diesel/cng-lpg-lng-
fuel#:~:text=While%20liquefied%20natural%20gas%20and,where%20it%20is%20very%20compact.&text=CNG%20also%2
0has%20lower%20production%20costs%20than%20LNG., accessed 25/05/2021
3. The MET group, “CNG vs LNG: what are the differences?”, 20 November 2020, https://group.met.com/energy-insight/cng-vs-
lng/15, accessed 25/05/2021
4. Lyon, C., “power generation technology data for integrated resource plan of South Africa”, Technical Update by Electric
Power Research Institute (EPRI) prepared for Department of Energy South Africa, April 2017.
5. Okoroigwe, E. C., “Solar gas turbine systems”, Encyclopedia of Sustainable Technologies, 2017, 377–388.
6. Mevissen, F., Meo, M., “A review of NDT/Structural health monitoring techniques for hot gas components in gas turbines”,
Sensors 2019, 19, 711; doi:10.3390/s19030711
7. Langston, L.S., “Turbines, Gas”, Encyclopedia of Energy, 2004, ISBN 978-0-12-176480-7,
https://www.sciencedirect.com/topics/engineering/gas-brayton-cycle, accessed 25/05/2021
8. Khalil, E., “Steam power plants”, WIT Transactions on State of the Art in Science and Engineering, Vol 42,
http://www.witpress.com/
9. https://www.ee.co.za/article/development-high-efficiency-flexible-gas-turbine.html, accessed 25/05/2021

Energy Security: Investigating Natural Gas for Energy Generation 213
at Airports in South Africa – A Technoeconomic Assessment
www.tjprc.org [email protected]
10. https://www.britannica.com/technology/four-stroke-cycle, accessed 25/05/2021
11. https://theunboxfactory.com/otto-cycle/, accessed 25/05/2021
12. https://www.wartsila.com/energy/learn-more/technical-comparisons/gas-turbine-for-power-generation-introduction, accessed
31/05/2021
13. Bhargava, R., Bianchi, M., De Pascale, A., Montenegro, A., Peretto, A., “Gas turbine-based power cycles – a state-of-the-art
review”, International Conference on Power Engineering-2007, October 23-27, 2007, Hangzhou, China
14. List of natural gas power generation stations, https://en.wikipedia.org/wiki/List_of_natural_gas_power_stations, accessed
06/03/2021
15. Our World in Data, https://ourworldindata.org/grapher/electricity-prod-source-stacked, accessed 06/06/2021.
16. Our World in Data, https://ourworldindata.org/grapher/gas-consumption-per-capita, accessed 06/06/2021.
17. https://www.transparencymarketresearch.com/gas-turbines-market.html, accessed 25/05/2021.
18. U.S. Environmental Protection Agency Combined Heat and Power Partnership, “Catalog of CHP technologies”, March 2015.
19. Power Technology, “Sasol gas engine power plant”. Retrieved from https://www.power-technology.com/projects/sasol-gas-engine-
power-plant/, accessed 09/06/2021.
20. https://docs.srk.co.za/en/za-newcastle-gas-engine-power-plant-100-mw-ipp-project-scoping-eia, accessed 09/06/2021.
21. https://www.peakers.com/avon.html, accessed 10/06/2021
22. https://www.peakers.com/dedisa.html, accessed 11/06/2021
23. https://www.eskom.co.za/Whatweredoing/ElectricityGeneration/PowerStations/Peaking/Pages/Port_Rex_Power_Station.aspx, accessed
11/06/2021
24. https://www.eskom.co.za/Whatweredoing/ElectricityGeneration/PowerStations/Peaking/Pages/Acacia_Power_Station.aspx, accessed
11/06/2021
25. https://www.eskom.co.za/Whatweredoing/ElectricityGeneration/PowerStations/Peaking/Pages/Ankerlig.aspx, accessed 11/06/2021
26. https://www.eskom.co.za/Whatweredoing/ElectricityGeneration/PowerStations/Pages/Gourikwa.aspx, accessed 11/06/2021
27. https://www.engineeringnews.co.za/article/mtn-unveils-r22m-trigeneration-power-plant-2010-08-02, accessed 12/06/2021
28. Okyere, Stephen, Jiaqi Yang, and Monde Aminatou. "Influence of Multimodal Transport System Dynamics on Logistics Responsiveness:
An Ordinal Logistic Regression Approach." International Journal of Civil Engineering (IJCE) 6.6 (2017): 9-24.
29. Emeara, Mohamed S., Ahmed Farouk Abdelgawad, and Ahmed H. EL Abagy. "A Case Study of Cairo International Airport “Cia”:
Proposed Installation of Photovolatic “PV” For High Energy-Production." International Journal of Mechanical and Production
Engineering Research and Development (IJMPERD) 10.5, Oct 2020, 399–410
30. Okokpujie, I. P., et al. "Optimal Design and Stress/Strain Analysis of Wind Turbine Blade for Optimum Performance in Energy
Generation Via Simulation Approach." International Journal of Mechanical and Production Engineering Research and
Development 10.1 (2020): 95-104.
31. Sharma, Gangaraju Srinivasa, MVS Murali Krishna, and D. N. Reddy. "CFD analysis for adaptability of producer gas for power
generation in gas turbines." International Journal of Mechanical and Production Engineering Research and Development (IJMPERD)
5.2 (2015): 21 32 (2015).