
Energy Saving Technology Analysis for Commercial ... · Energy Saving Technology Analysis for...
8
International Journal of Applied Engineering Research ISSN 0973-4562 Volume 12, Number 22 (2017) pp. 11933-11940 © Research India Publications. http://www.ripublication.com 11933 Energy Saving Technology Analysis for Commercial, Industrial, Social, and Public Sectors to Support Regional Energy Policy: Case Study in Daerah Istimewa Yogyakarta Tony K. Hariadi 1,4 , P.Jutta Prahara 2,4 , Surya B. Lesmana 3,4 and Raouf Saidi 5 1 Departement of Electrical Engineering, Universitas Muhammadiyah Yogyakarta, jl. Lingkar Barat Tamantirta Yogyakarta, 55162, Indonesia. 2 Departement of Electrical Engineering, University of Nebraska - Lincoln, 209N Scott Engineering Center, Lincoln, Nebraska, 68588-0511, USA. 3 Departement of Civil Engineering, Universitas MuhammadiyahYogyakarta, jl. Lingkar Barat Tamantirta Yogyakarta, 55162, Indonesia. 4 Center for Regional Energi Management, Universitas Muhammadiyah Yogyakarta, jl. Lingkar Barat Tamantirta Yogyakarta, 55162, Indonesia. 5 Energy Research Center of the Netherlands, Westerduinweg 3, 1755 LE Petten, Netherlands 1,2,3 Orcid: 0000-0001-6581-5903, 0000-0002-3526-7456, 0000-0001-8817-7051 Abstract Energy efficiency has been an issue in Yogyakarta since the province did not establish policy and regulation for the region. Household sector dominated the energy usage, however non- household sector also contributed significantly for energy consumption. Non-household sectors SME, Hotels (stars and non stars), and public (hospital and government building), also gave significant contribution for energy efficiency measure program. Random survey was conducted to collect key data, further analysis using Net Present Value, indicated feasible investment scenario for the proposed energy efficiency implementation. The result then simulated using several key data and assumptions collected from local institution were done to compare financial energy policy. Significant energy saving and finance saving can be made with low cost investment and financial support from government. Keyword: Energy efficiency technology, energy policy, regional energy modeling, energy policy Yogyakarta INTRODUCTION Daerah Istimewa Yogyakarta (DIY) is a small province without big industry, as a city in a developing country, energy supply depends on non-renewable energy sources such as oil, natural gas and coal [1]. As a small region, Yogyakarta was interconnected with JAMALI (Jawa Madura Bali) system to fulfill its electrical energy needs, therefore Yogyakarta did not have its own electrical generator system. Energy consumption in Yogyakarta was dominated by household sector with around 54.94% user, followed by commercial/business with 33.38% and social/government with 11.68% [2]. Industries were reluctant to make medium to high cost energy efficiency investment, however energy efficiency and conservation program could increase their competitiveness [3][4]. As of the survey, air conditioner, television and desktop PC were the main energy consumer in household sector, while in non- household sectors, air conditioner and motors were the main energy consumers [5]. Average energy demand growth in Indonesia is 7%, and has to be faced by strategic measures. Daerah Istimewa Yogyakarta (DIY) faces the same problem with more burdens since DIY depends on energy supply from other region. Energy policy in Yogyakarta was adopted from National Energy Policy due to the lack of energy policy master plan in the province. Government of Indonesia has developed energy policy framework as recommended from IEA in 2008 [6]. Identification of strategic energy policy and measures is very important to assist all sectors to conserve energy. Energy conservation program would be feasible with energy labeling, tax reduction or even increasing energy price. Financial assistance plan and community education should also be considered as an energy conservation campaign program. The objective of this project was to simulate the energy efficiency action plan, and analyze the impact of the simulation for non households sectors, and furthermore to: Utilize the energy efficiently and rationally, Using the energy as needed optimally, so that will reduce the cost incurred. Setting up the policy of technology selection on the energy source, and therefore will maintain the sustainability of natural resources.
Transcript of Energy Saving Technology Analysis for Commercial ... · Energy Saving Technology Analysis for...
International Journal of Applied Engineering Research ISSN 0973-4562 Volume 12, Number 22 (2017) pp. 11933-11940
© Research India Publications. http://www.ripublication.com
11933
Energy Saving Technology Analysis for Commercial, Industrial, Social, and
Public Sectors to Support Regional Energy Policy: Case Study in Daerah
Istimewa Yogyakarta
Tony K. Hariadi1,4, P.Jutta Prahara2,4, Surya B. Lesmana3,4 and Raouf Saidi5
1 Departement of Electrical Engineering, Universitas Muhammadiyah Yogyakarta, jl. Lingkar Barat Tamantirta Yogyakarta, 55162, Indonesia.
2 Departement of Electrical Engineering, University of Nebraska - Lincoln, 209N Scott Engineering Center, Lincoln, Nebraska, 68588-0511, USA.
3Departement of Civil Engineering, Universitas MuhammadiyahYogyakarta, jl. Lingkar Barat Tamantirta Yogyakarta, 55162, Indonesia.
4Center for Regional Energi Management, Universitas Muhammadiyah Yogyakarta, jl. Lingkar Barat Tamantirta Yogyakarta, 55162, Indonesia.
5Energy Research Center of the Netherlands, Westerduinweg 3, 1755 LE Petten, Netherlands
1,2,3Orcid: 0000-0001-6581-5903, 0000-0002-3526-7456, 0000-0001-8817-7051
Abstract
Energy efficiency has been an issue in Yogyakarta since the
province did not establish policy and regulation for the region.
Household sector dominated the energy usage, however non-
household sector also contributed significantly for energy
consumption. Non-household sectors SME, Hotels (stars and
non stars), and public (hospital and government building),
also gave significant contribution for energy efficiency
measure program. Random survey was conducted to collect
key data, further analysis using Net Present Value, indicated
feasible investment scenario for the proposed energy
efficiency implementation. The result then simulated using
several key data and assumptions collected from local
institution were done to compare financial energy policy.
Significant energy saving and finance saving can be made
with low cost investment and financial support from
government.
Keyword: Energy efficiency technology, energy policy,
regional energy modeling, energy policy Yogyakarta
INTRODUCTION
Daerah Istimewa Yogyakarta (DIY) is a small province
without big industry, as a city in a developing country, energy
supply depends on non-renewable energy sources such as oil,
natural gas and coal [1]. As a small region, Yogyakarta was
interconnected with JAMALI (Jawa Madura Bali) system to
fulfill its electrical energy needs, therefore Yogyakarta did not
have its own electrical generator system. Energy consumption
in Yogyakarta was dominated by household sector with
around 54.94% user, followed by commercial/business with
33.38% and social/government with 11.68% [2]. Industries
were reluctant to make medium to high cost energy efficiency
investment, however energy efficiency and conservation
program could increase their competitiveness [3][4]. As of the
survey, air conditioner, television and desktop PC were the
main energy consumer in household sector, while in non-
household sectors, air conditioner and motors were the main
energy consumers [5].
Average energy demand growth in Indonesia is 7%, and has to
be faced by strategic measures. Daerah Istimewa Yogyakarta
(DIY) faces the same problem with more burdens since DIY
depends on energy supply from other region. Energy policy in
Yogyakarta was adopted from National Energy Policy due to
the lack of energy policy master plan in the province.
Government of Indonesia has developed energy policy
framework as recommended from IEA in 2008 [6].
Identification of strategic energy policy and measures is very
important to assist all sectors to conserve energy. Energy
conservation program would be feasible with energy labeling,
tax reduction or even increasing energy price. Financial
assistance plan and community education should also be
considered as an energy conservation campaign program.
The objective of this project was to simulate the energy
efficiency action plan, and analyze the impact of the
simulation for non households sectors, and furthermore to:
Utilize the energy efficiently and rationally,
Using the energy as needed optimally, so that will
reduce the cost incurred.
Setting up the policy of technology selection on the
energy source, and therefore will maintain the
sustainability of natural resources.
International Journal of Applied Engineering Research ISSN 0973-4562 Volume 12, Number 22 (2017) pp. 11933-11940
© Research India Publications. http://www.ripublication.com
11934
Some countries have failed in increasing energy access due to
the lack of robust national energy strategy and implementation
program [7]. Technology has to be selected with some
consideration; availability, low cost, and willingness of the
energy user, so that the proposed policy will be feasible and
meaningful. Several technologies that are available:
Variable Speed Drive (VSD), an electronic device
that control speed and torque that is necessary for the
work being done (Aditya, 2013). VSD can reduce as
much as 50% of energy with only 20% performance
reduction [8].
Hydrocarbon Retrofit, selecting hydrocarbon
refrigerant to match the operating condition and
increase efficiency, this process can reduce power
consumption by 20% [9].
Unbalance Voltage, a condition where loads in three
phase system are not balance between phases. An
expert or consultant is needed to audit load
distribution and to make a solution.
METHODOLOGY
Energy usage in industries, business, and social sector in
Yogyakarta, was dominated by AC and motors. Therefore,
this electrical equipment was the main energy efficiency
target. Energy policy, such as price increase, taxation, and
regulation can encourage energy efficiency in a region.
Different policies will contribute to energy and climate
policies [10]. To obtain the data on the usage of electrical
devices, a random survey was conducted and the data
collected clustered into key data as follows:
The most common used of electrical devices
Investment cost
Energy consumption
Electricity rating
Due to the lack of regulations and policies on energy
conservation/energy efficiency in DIY, it is assumed to refer
to the national regulations. The use of key data includes:
the value of equipment investment cost,
the energy consumption of equipment,
the amount of electrical energy can be saved by more
efficient electrical equipment, or through the changes in
behavior in using the equipment,
the price of electrical energy, and
how long the investment cost can be returned if the use of
the equipment is more efficient.
Data retrieval method used on this research project was
random sampled survey on commercial (non-star motel/hotel),
micro and small industry, social and public sectors.
Assumption was also done using external factors, local
assumption and other key data. Key data included the value of
equipment investment costs, energy consumption of
equipment, the amount of electrical energy can be saved by
more efficient electrical equipment or through changes in
behavior in using the equipment, the price of electric energy,
and how long the investment cost can be returned if the use of
equipment more efficient. Calculation of Net Present Value
(NPV) was used to determine the energy saving projection.
Although NPV calculation was less efficient, it still effective
to make quantitative calculation for decision making. NPV
could create meaningful potential investment by calculating
cost and saving and also be able to take price increase and
cost of investment into account [11][12].
National Energy conservation program was put as external
factor:
1. Building public awareness on energy conservation,
2. Education and training,
3. opens a center for information about energy conservation
activities,
4. Building a joint program of energy conservation,
competency certification program manager energy for
buildings and industrial sectors, and
5. Labeling program of efficiency level of electric equipment.
Key data assumption for the NPV calculation is presented in
Table 1 below, based on survey finding from stakeholders.
Table 1: General Assumption
Data about hotels/lodging was obtained from PLN (National
Electric Company), Badan Pusat Statistic (Statistics
Indonesia), and government, are presented in table 2, 3, 4 and
5 as follows:
7
3.3.1. General Assumptions
Discount rates 12 % per year Implementing Variable Speed Drive
1,000,000 IDR/kWh equipments Occurs on motors, split AC’s and central AC’s
Retrofitting Refrigerant 280,000 IDR per unit AC’s Occurs on commercial, social, and public with split AC’s
Price of Electrical energy Increase maximum 20 % Political situation difficulties to establish regulation
Allowance of Subsidy Scenario Limit to 50 % Equipment Technical lifetime 5 years In line with ministry standard
analysis
3.3.2. Household Sector
Electricity Price Using Basic Electricity Tariff (TDL) 2010
Consist of 2 groups of customers: R-1/TR 450 - 900 VA price is 495 IDR/kWh R-1/TR 1,300 – 2,200 VA price is 790 IDR/kWh
Household with power connected above 3,500 VA only applied for behavior approach and exclude in analysis because they already implement energy efficiency equipment obtained from survey Survey Data Total respondent is 320
(urban 200, suburban 120) Own refrigerator: 66% Own CRT TV: 55 % Own AC: 29 %
3.3.3. Commercial Sector Analysis are performed on hotels and lodging. Data about hotels and lodging were obtained from PLN, government, and BPS, in detail:
Electricity Price Using Basic Electricity Tariff (TDL) 2010
Consist of 2 groups of customers: B-1/TR 2,200 – 5,500 VA B-2/TR 6,600 VA – 200 kVA Price is 900 IDR/kWh
Split AC’s Average 12 pieces per hotel Applied by non star hotels Most of star hotels use central AC’s in systems Hotel amount Star hotels: 38
non star hotels: 1030
3.3.4. Industrial Sector
Electricity Price Using Basic Electricity Tariff (TDL) 2010
I-3/TM above 200 kVA price is 750 IDR/kWh
Analysis performed Leather, limestone, food and wood industries
Leather: 20 industries Limestone: 49 industries Food: 36 industries Wood: 30 industries
Improvement of Unbalance Voltage
25,000,000 IDR Used to hire consultant Energy savings 15,500 kWh/year
3.3.5. Social Sector
Electricity Price Using Basic Electricity Tariff (TDL) 2010
S-2/TR 3,500 VA - 200 kVA price is 755 IDR/kWh
Analysis performed Type C hospitals and above Total is 63 hospitals
3.3.6. Public Sector
Electricity Price Using Basic Electricity Tariff (TDL) 2010
2 groups of customers: P-1/TR 2,200 – 5,500 VA P-2/TR 6,600 VA – 200 kVA Price is 900 IDR/kWh
Analysis performed Government building P-1/TR 270 buildings P-2/TR 146 buildings
International Journal of Applied Engineering Research ISSN 0973-4562 Volume 12, Number 22 (2017) pp. 11933-11940
© Research India Publications. http://www.ripublication.com
11935
Table 2: Commercial Sector Data
Electricity
Price
Using Basic
Electricity
Tariff (TDL)
2010
Consist of 2 groups of
customers: B-1/TR 2,200 –
5,500 VAB-2/TR 6,600
VA – 200 kVA Price is
900 IDR/kWh
Split AC’s Average 12
pieces per
hotel
Applied by non star hotels
Commercial
Sector Type
Star hotels: 38
non star
hotels: 1030
Most of star hotels use
central AC’s in systems
Table 3.: Industrial Sector Data
Electricity
Price
Using Basic
Electricity Tariff
(TDL) 2010
Price IDR 750/kWh
for I-3/TM above
200kVA
Industry type Small and micro
industry
Leather: 20 industries
Limestone: 49
industries
Wood: 30 industries
Energy
Saving
Program
Improvement of
imbalance voltage
Hiring energy
consultant (IDR
25,000,000.-)
Projected energy
saving 15,500
kWh/year
Table 4: Social Sector Data
Electricity Price
Using Basic
Electricity Tariff
(TDL) 2010
IDR 750/kWh for
S-2/TR 3500VA –
200 kVA
Social Sector Type Hospital Type C
and above
Total 63 hospitals
Table 5: Public Sector Data
Electricity
Price
Using Basic
Electricity Tariff
(TDL) 2010
Customers groups:
P-1/TR 2,200 – 5,500 VA
P-2/TR 6,600 VA – 200
kVA
Price: IDR 900/kWh
Public
Sector Type
Government
building
P-1/TR 270 buildings P-
2/TR 146 buildings
Industrial, commercial, social and public sector mostly used
air conditioner, to regulate climate in tropical country such as
Indonesia. Motor was also commonly used in industrial
sector. This research was focused on energy saving scenario
for AC and motor with the following implementation:
1. Implementation of Variable Speed Drive (VSD)
2. Refrigerant retrofit
3. Improvement of imbalance voltage
NPV Analysis was done to calculate the implementation
measure, barrier and policy analysis was also done.
RESULT
A. Implementation of Variable Speed Drive
Several data gathered during the project indicated that:
1. AC operation average was 8 hours/day
2. Motors operation 24 hours/day
3. Variable speed drive cost IDR 1,000,000.-/kW equipment
4. Cost of electricity IDR 1,300.- (normal time), IDR 1,500.-
(peak time)
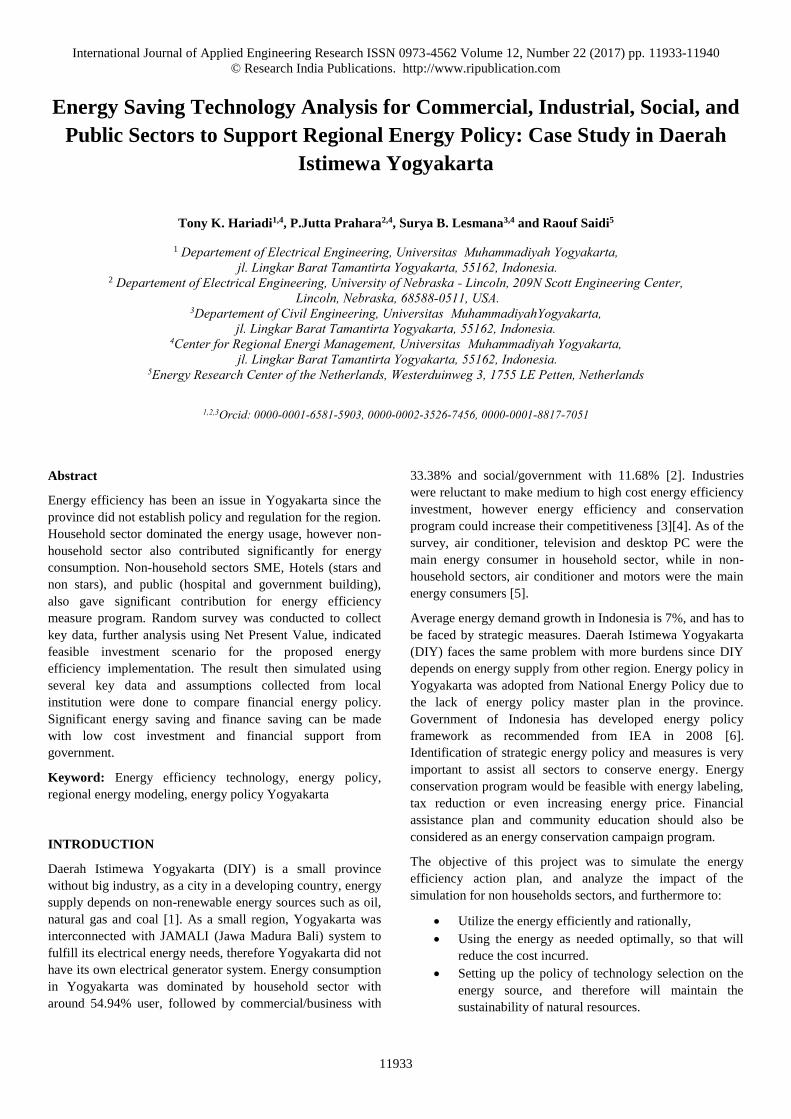
NPV analysis for implementation of VSD in all sectors
indicated in fig 1 below
Figure. 1.: NPV Difference for Implementing VSD in
Commercial, Industrial, and Social Sector
Fig 1 indicated that there are savings for implementing VSD
at all sectors that being analyzed. The most interactive return
of investment was in commercial sector. The return of
investment was IDR 187,144 after 25 month for centralized
AC’s and of IDR 20,142 after 29 month for split AC. All
sectors implementation scenario for VSD were feasible
because payback period were less than 36 months [13] Large
healthcare facilities were not analyzed due to its complexity,
for air conditioning and other system in such facilities an
energy manager was needed to set the efficiency measures
[14].
18
Figure 4.14. NPV Difference for Implementing VSD in Commercial, Industrial, and Social Sector
From figure above, it can be seen that there are savings for implementing VSD at all four sectors that being analyzed. The most interactive return investment is at commercial sector that use centralized AC’s and also split AC’s. They will return their investment of IDR 187,144 after 25 month for centralized AC’s and of IDR 20,142 after 29 month. At all four sectors, scenario of implementing VSD are feasible because payback period is less than 36 month.
Figure 4.15. KWh Difference of Implementing VSD for Commercial, Industrial, and Social Sectors
This shown that the largest total technical potential is for commercial sector with a centralized AC’s, and the second potential is for industrial sector. This potential are common because in the two sectors using motor with large power capacity for their loads. For the social sector should also be seen its KWh
International Journal of Applied Engineering Research ISSN 0973-4562 Volume 12, Number 22 (2017) pp. 11933-11940
© Research India Publications. http://www.ripublication.com
11936
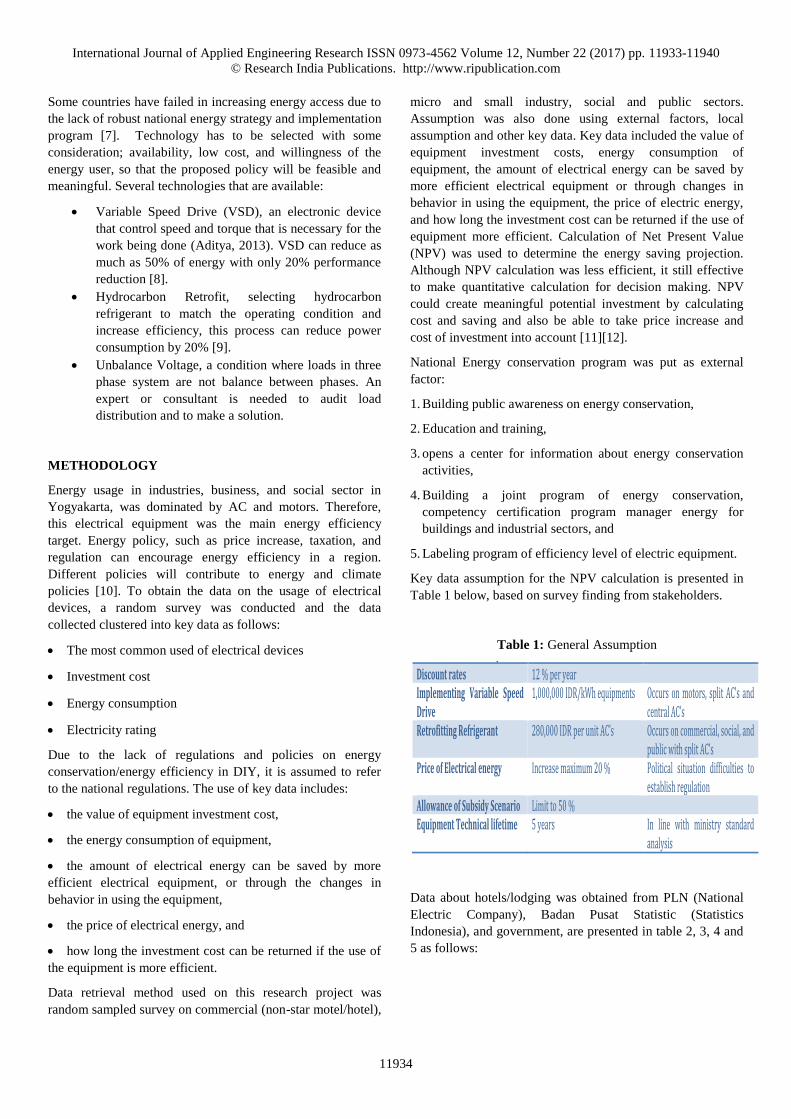
Figure 2: KWh Difference of Implementing VSD for
Commercial, Industrial, and Social Sectors
KWh calculation indicated largest total technical potential in
commercial sector with a centralized AC, and the second
potential is for industrial sector as shown in fig 2. This
potential caused by the use of motor with large power
capacity for their loads. Social sector and commercial sector
indicated a similar KWh difference since both sector used
split AC. Total energy savings potential was approximately
8.52 GWh in one year or 2.4% from total energy
consumption, with assumption growth 6.75% per year. A
research by Segreto concluded that combination of energy
technology scenario can be used to increase energy efficiency
as well as environment sustainability in industrial sector [15].
B. Refrigerant retrofit
Refrigerant retrofitting became necessary for economic and
technical reasons, assuming that the refrigerant had as many
similarities with the original as possible. The ban of some
refrigerant had led the refrigerant retrofitting to become
famous since 2010 [16]. This research project used
hydrocarbon refrigerant as based calculation as it has had
many advantages compared to other type of refrigerant. Data
that we used for refrigerant retrofitting analysis was:
1. Split Air Conditioner operation average: 8 hours/day
2. Investment Cost IDR 280,000.-/hp
3. Cost of electricity IDR 1,300.- (normal time), IDR 1,500.-
(peak time)
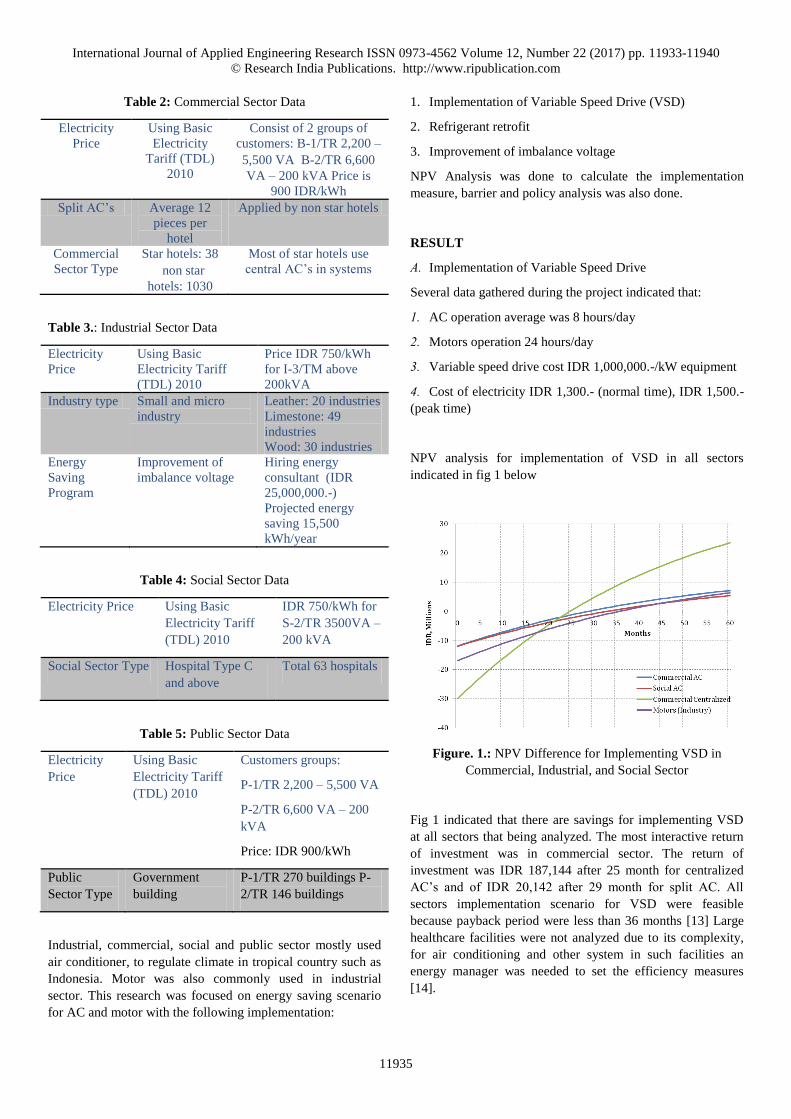
Figure. 3: NPV Difference for Refrigerant retrofit in
Commercial, Social, and Public Sector
There was saving indicated from the NPV analysis in fig. 3.,
and this scenario was considered feasible, as the payback
period was less than 30 months. Saving from this scenario was
not high, however technical effort was also low. Therefor this
scenario was worth considering to improve energy saving
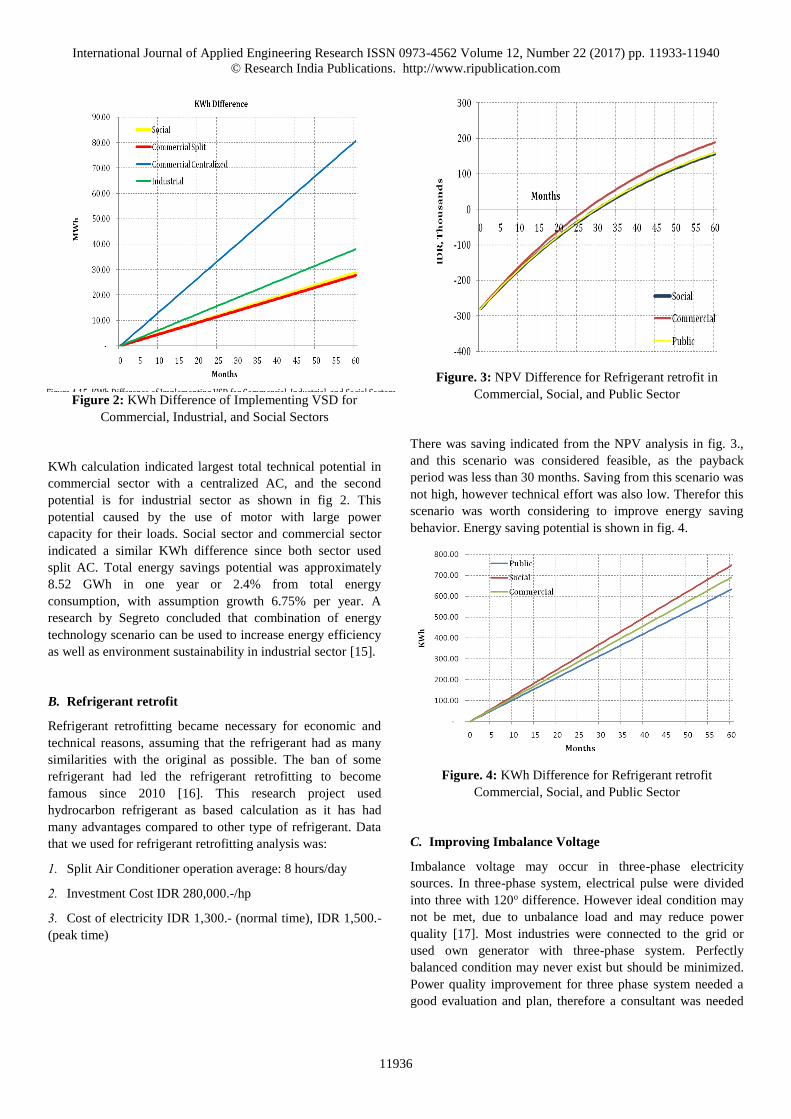
behavior. Energy saving potential is shown in fig. 4.
Figure. 4: KWh Difference for Refrigerant retrofit
Commercial, Social, and Public Sector
C. Improving Imbalance Voltage
Imbalance voltage may occur in three-phase electricity
sources. In three-phase system, electrical pulse were divided
into three with 120o difference. However ideal condition may
not be met, due to unbalance load and may reduce power
quality [17]. Most industries were connected to the grid or
used own generator with three-phase system. Perfectly
balanced condition may never exist but should be minimized.
Power quality improvement for three phase system needed a
good evaluation and plan, therefore a consultant was needed
18
Figure 4.14. NPV Difference for Implementing VSD in Commercial, Industrial, and Social Sector
From figure above, it can be seen that there are savings for implementing VSD at all four sectors that being analyzed. The most interactive return investment is at commercial sector that use centralized AC’s and also split AC’s. They will return their investment of IDR 187,144 after 25 month for centralized AC’s and of IDR 20,142 after 29 month. At all four sectors, scenario of implementing VSD are feasible because payback period is less than 36 month.
Figure 4.15. KWh Difference of Implementing VSD for Commercial, Industrial, and Social Sectors
This shown that the largest total technical potential is for commercial sector with a centralized AC’s, and the second potential is for industrial sector. This potential are common because in the two sectors using motor with large power capacity for their loads. For the social sector should also be seen its KWh
International Journal of Applied Engineering Research ISSN 0973-4562 Volume 12, Number 22 (2017) pp. 11933-11940
© Research India Publications. http://www.ripublication.com
11937
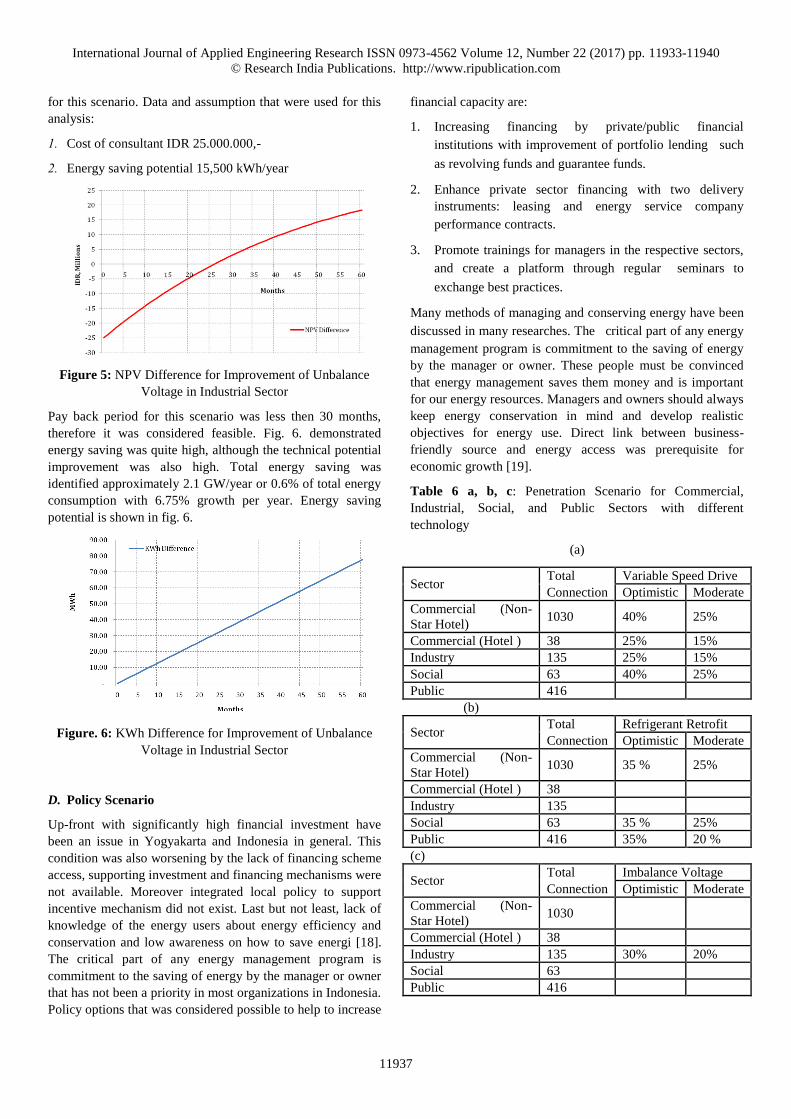
for this scenario. Data and assumption that were used for this
analysis:
1. Cost of consultant IDR 25.000.000,-
2. Energy saving potential 15,500 kWh/year
Figure 5: NPV Difference for Improvement of Unbalance
Voltage in Industrial Sector
Pay back period for this scenario was less then 30 months,
therefore it was considered feasible. Fig. 6. demonstrated
energy saving was quite high, although the technical potential
improvement was also high. Total energy saving was
identified approximately 2.1 GW/year or 0.6% of total energy
consumption with 6.75% growth per year. Energy saving
potential is shown in fig. 6.
Figure. 6: KWh Difference for Improvement of Unbalance
Voltage in Industrial Sector
D. Policy Scenario
Up-front with significantly high financial investment have
been an issue in Yogyakarta and Indonesia in general. This
condition was also worsening by the lack of financing scheme
access, supporting investment and financing mechanisms were
not available. Moreover integrated local policy to support
incentive mechanism did not exist. Last but not least, lack of
knowledge of the energy users about energy efficiency and
conservation and low awareness on how to save energi [18].
The critical part of any energy management program is
commitment to the saving of energy by the manager or owner
that has not been a priority in most organizations in Indonesia.
Policy options that was considered possible to help to increase
financial capacity are:
1. Increasing financing by private/public financial
institutions with improvement of portfolio lending such
as revolving funds and guarantee funds.
2. Enhance private sector financing with two delivery
instruments: leasing and energy service company
performance contracts.
3. Promote trainings for managers in the respective sectors,
and create a platform through regular seminars to
exchange best practices.
Many methods of managing and conserving energy have been
discussed in many researches. The critical part of any energy
management program is commitment to the saving of energy
by the manager or owner. These people must be convinced
that energy management saves them money and is important
for our energy resources. Managers and owners should always
keep energy conservation in mind and develop realistic
objectives for energy use. Direct link between business-
friendly source and energy access was prerequisite for
economic growth [19].
Table 6 a, b, c: Penetration Scenario for Commercial,
Industrial, Social, and Public Sectors with different
technology
(a)
Sector Total Variable Speed Drive
Connection Optimistic Moderate
Commercial (Non-
Star Hotel) 1030 40% 25%
Commercial (Hotel ) 38 25% 15%
Industry 135 25% 15%
Social 63 40% 25%
Public 416
(b)
Sector Total Refrigerant Retrofit
Connection Optimistic Moderate
Commercial (Non-
Star Hotel) 1030 35 % 25%
Commercial (Hotel ) 38
Industry 135
Social 63 35 % 25%
Public 416 35% 20 %
(c)
Sector
Total Imbalance Voltage
Connection Optimistic Moderate
Commercial (Non-
Star Hotel) 1030
Commercial (Hotel ) 38
Industry 135 30% 20%
Social 63
Public 416
International Journal of Applied Engineering Research ISSN 0973-4562 Volume 12, Number 22 (2017) pp. 11933-11940
© Research India Publications. http://www.ripublication.com
11938
Survey to access the willingness of all sector to apply the
technology was presented in table 6, penetrating factor was
assumed for optimistic and moderate based on the survey
result. Further analysis was simulating the energy efficiency
scenario with the penetrating factors. Table 6 indicated that
non-star hotel was more optimistic to apply VSD technology
than (Star) Hotel. Most star hotels used centralized AC that
made high investment for VSD technology, while non-star
hotels used split AC, with lower cost for VSD investment.
The same condition was found for application of VSD in
industry. VSD device must be installed in each motor in the
industry, that increased investment cost. Hiring consultant to
audit and recommend how to fix unbalance load was more
interesting, that made higher penetrating factor. Social and
public sectors had similar condition with non-star hotel.
Public sector indicated that there was no interest in applying
VSD due to the high investment cost.
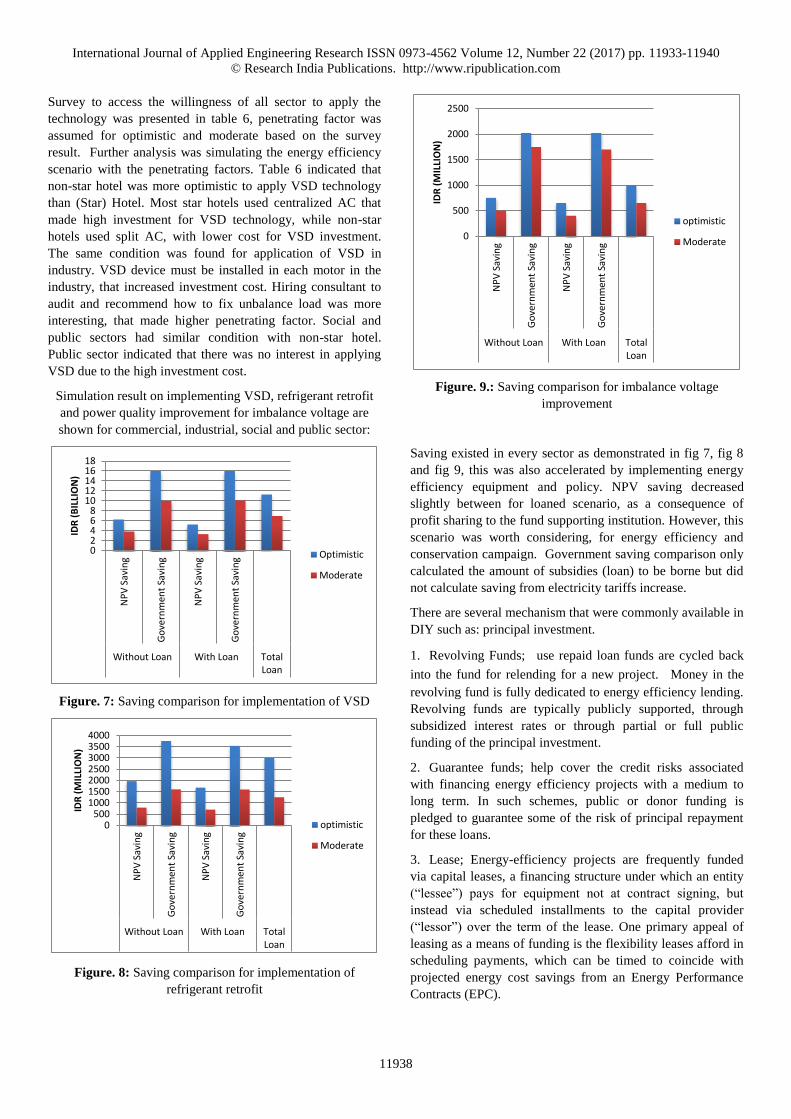
Simulation result on implementing VSD, refrigerant retrofit
and power quality improvement for imbalance voltage are
shown for commercial, industrial, social and public sector:
Figure. 7: Saving comparison for implementation of VSD
Figure. 8: Saving comparison for implementation of
refrigerant retrofit
Figure. 9.: Saving comparison for imbalance voltage
improvement
Saving existed in every sector as demonstrated in fig 7, fig 8
and fig 9, this was also accelerated by implementing energy
efficiency equipment and policy. NPV saving decreased
slightly between for loaned scenario, as a consequence of
profit sharing to the fund supporting institution. However, this
scenario was worth considering, for energy efficiency and
conservation campaign. Government saving comparison only
calculated the amount of subsidies (loan) to be borne but did
not calculate saving from electricity tariffs increase.
There are several mechanism that were commonly available in
DIY such as: principal investment.
1. Revolving Funds; use repaid loan funds are cycled back
into the fund for relending for a new project. Money in the
revolving fund is fully dedicated to energy efficiency lending.
Revolving funds are typically publicly supported, through
subsidized interest rates or through partial or full public
funding of the principal investment.
2. Guarantee funds; help cover the credit risks associated
with financing energy efficiency projects with a medium to
long term. In such schemes, public or donor funding is
pledged to guarantee some of the risk of principal repayment
for these loans.
3. Lease; Energy-efficiency projects are frequently funded
via capital leases, a financing structure under which an entity
(“lessee”) pays for equipment not at contract signing, but
instead via scheduled installments to the capital provider
(“lessor”) over the term of the lease. One primary appeal of
leasing as a means of funding is the flexibility leases afford in
scheduling payments, which can be timed to coincide with
projected energy cost savings from an Energy Performance
Contracts (EPC).
02468
1012141618
NP
V S
avin
g
Go
vern
men
t Sa
vin
g
NP
V S
avin
g
Go
vern
men
t Sa
vin
g
Without Loan With Loan TotalLoan
IDR
(B
ILLI
ON
)
Optimistic
Moderate
0500
1000150020002500300035004000
NP
V S
avin
g
Go
vern
men
t Sa
vin
g
NP
V S
avin
g
Go
vern
men
t Sa
vin
g
Without Loan With Loan TotalLoan
IDR
(M
ILLI
ON
)
optimistic
Moderate
0
500
1000
1500
2000
2500
NP
V S
avin
g
Go
vern
men
t Sa
vin
g
NP
V S
avin
g
Go
vern
men
t Sa
vin
g
Without Loan With Loan TotalLoan
IDR
(M
ILLI
ON
)
optimistic
Moderate
International Journal of Applied Engineering Research ISSN 0973-4562 Volume 12, Number 22 (2017) pp. 11933-11940
© Research India Publications. http://www.ripublication.com
11939
4. Energy Service Company (ESCO) Performance Contracts;
In a case of performance contracting, the ESCO will perform
an energy efficiency audit and develop recommendations and
designs based on the audit. The ESCO will then secure
financing for the project (upon agreement with the customer
concerning recommendations). That financing typically will
be based on the stream of energy cost savings that are
expected as an outcome of implementing the recommended
changes.
CONCLUDING ANALYSIS
Analysis indicated that energy efficiency and policy measures
proposed in the project gave significant result. Two scenarios
involving loan and without loan finance system also indicated
an increase in energy saving, although financial saving
decreased due to profit sharing. High risk transaction were
common barrier for finance scenario from commercial
banking system, moreover high equipment cost also played
significant role in financing access to product and services.
Following policy option were recommended to increase
financial accessibility:
1. Government, related industry and organization must be
involved to establish fund guarantee system.
2. Increase government intervention; establishing new
financial institutions operating on preferential market
terms, and introduce mechanisms to reduce the interest
rate for commercial loan.
3. The main solutions to solving the problem of gaining the
financial capital needed for implementation are to
combine state guidance investment with social multi-
channel investment.
ACKNOWLEDGEMENT
This research was done as part of Capacity Development and
Strengthening for Energy Policy Formulation and
Implementation of Sustainable Energy Projects in Indonesia
(CASINDO) funded by SenterNovem. The author would like
to express sincere appreciation to Technische Universiteit
Eindhoven and Universitas Muhammadiyah Yogyakarta for
the support during the finalization of this paper.
REFERENCE
[1] M.H. Hasana, T. M. (2012,). A review on energi
scenario and sustainable energy in Indonesia.
Renewable and Sustainable Energy Reviews, 16(4),
2316–2328
[2] Direktorat Jenderal Listrik dan Pemanfaatan Energi
Departemen Energi dan Sumber Daya Mineral. (2009).
Statistik ketenagalistrikan dan energi tahun 2009.
Direktorat Jenderal Listrik dan Pemanfaatan Energi
Departemen Energi dan Sumber Daya Mineral,.
[3] APEC Energy Working Group. (2012). Peer Review on
Energy Efficiency in Indonesia. Asia Pacific Economic
Cooperation.
[4] Fabio Correa Leite, D. C. (2013,). Energy-Efficiency
Economics as a Resource for Energy Planning. Open
Journal of Energy Efficiency, 2, 22-28.
[5] Tony Khristanto Hariadi, P. P. (2016). Energy
Efficiency and Policy Analysis for Household in DI
Yogyakarta (Yogyakarta special Region) Indonesia.
International Journal on Advanced Science,
Engineering, Information and Technology (IJASEIT),
6(3), 329-333.
[6] International Energy Agency. (2015). Indonesia 2015.
International Energy Agency.
[7] International Energy Agency . (2011). World Energy
Outlook 2011.
[8] Aditya, T. ( 2013). Research to study Variable
Frequency Drive and its Energy Savings. International
Journal of Science and Research (IJSR), 2(6), 253-256.
[9] Carbon Trust. (2007). Variable speed drives
Introducing energy saving opportunities for business.
London, UK: Carbon Trust.
[10] Widyastuti, A. B. (2014). Improved Energy Saving for
R22 Building Air Conditioning Retrofitted with
Hydrocarbon Refrigerant, Study Case: Civil
Engineering Department of ITS. Applied Mechanics
and Materials, 493, hal. 281-286.
[11] Abdulkadir Bulus,̧ N. T. (2011). Energy Efficiency and
Rebound Effect: Does Energy Efficiency Save Energy?
. Energy and Power Engineering , 3, 355-360 .
[12] Rashford, B. (2010). How to determine if that
Renewable eneRgy project makes economic sense.
Summer 2010.
[13] Sauter, R. V. (2013). REVIEW OF COSTS AND
BENEFITS OF ENERGY SAVINGS A report by the
Institute for European Environmental Policy (IEEP) for
the Coalition of Energy Savings. Task 1 Report.
Brussels.
[14] Khalil, E. E. (2012,. Energy Efficient Hospitals Air
Conditioning Systems. Open Journal of Energy
Efficiency, 1, 1-7 .
[15] Maria-Anna Segreto, M. A. (2013). Energy Efficiency
in Industrial Areas: Application of Best Practices for
Energy Efficiency In Mediterranean Industrial Areas.
European Journal of Sustainable Development, 2(4),
61-72 .

International Journal of Applied Engineering Research ISSN 0973-4562 Volume 12, Number 22 (2017) pp. 11933-11940
© Research India Publications. http://www.ripublication.com
11940
[16] National Refrigerant Inc. (2010). Refrigerant Reference
Guide. National Refrigerant Inc.
[17] Dr. Johan Driesen, D. T. (2002). Voltage Disturbances
Introduction to Unbalance (Vol. 5.1.3). Copper
Development Association.
[18] Muhammad Ery Wijaya, T. T. (2013). Policy-Making
for Households Appliances-Related Electricity
Consumption in Indonesia— A Multicultural Country .
Open Journal of Energy Efficiency, 2, 53-64.
[19] Aslanishvili, D. (2016,). Market Foundation for
Sustainable Economy Growth and Energy Policy
(Georgian Case). Modern Economy, 7, 314-319.