
Energy Research Division PROJECT REPORT University Ave, Building D Los Gatos, California 95032 Todd...
140
Energy Research and Development Division FINAL PROJECT REPORT BIRD AND BAT MOVEMENT PATTERNS AND MORTALITY AT THE MONTEZUMA HILLS WIND RESOURCE AREA JUNE 2013 CEC ‐ 500 ‐ 2013 ‐ 015 Prepared for: California Energy Commission Prepared by: H. T. Harvey & Associates
Transcript of Energy Research Division PROJECT REPORT University Ave, Building D Los Gatos, California 95032 Todd...

Energy Research and Development Div is ion FINAL PROJECT REPORT
BIRD AND BAT MOVEMENT PATTERNS AND MORTALITY AT THE MONTEZUMA HILLS WIND RESOURCE AREA
JUNE 2013CEC ‐500 ‐2013 ‐015
Prepared for: California Energy Commission Prepared by: H. T. Harvey & Associates

Prepared by: Primary Author(s): Dave S. Johnston Judd A. Howell Scott B. Terrill Nellie Thorngate Jim Castle Jeff P. Smith H. T. Harvey & Associates 983 University Ave, Building D Los Gatos, California 95032 http://www.harveyecology.com Todd J. Mabee Jonathan H. Plissner Nathan A. Schwab Peter M. Sanzenbacher Corey M. Grinnell ABR, Inc. P.O. Box 249 Forest Grove, Oregon 97116 http://www.abrinc.com Contract Number: PIR-08-027 Prepared for: California Energy Commission John Mathias, Joseph O’Hagan Contract Manager Laurie ten Hope Deputy Director RESEARCH AND DEVELOPMENT DIVISION Robert P. Oglesby Executive Director
DISCLAIMER This report was prepared as the result of work sponsored by the California Energy Commission. It does not necessarily represent the views of the Energy Commission, its employees or the State of California. The Energy Commission, the State of California, its employees, contractors and subcontractors make no warranty, express or implied, and assume no legal liability for the information in this report; nor does any party represent that the uses of this information will not infringe upon privately owned rights. This report has not been approved or disapproved by the California Energy Commission nor has the California Energy Commission passed upon the accuracy or adequacy of the information in this report.

i
ACKNOWLEDGEMENTS
The authors thank the California Energy Commission for funding this study; PIER staff for making the process easy, especially John Mathias and Linda Spiegel; and Joanie Stewart, Renee Culver and Tom Kelley at NextEra Energy, Andy Linehan (dearly missed), Stewart Webster, Jerry Roppe, and Keith Warner at Iberdrola Renewables, and John Opris at enXco for all aspects of their assistance. The H. T. Harvey authors also thank its tireless field crew for the endless walking over difficult terrain, especially Rob Shields, who was injured in the line of duty; Samantha Moturi for database support and management; and Mark Lagarde for GIS support. The ABR authors also thank Delee Spiesschaert and Susan Cooper for logistical support; Mike Davis, Melinda Malek, and Cris Hein for help with field work; Bill Hepburn for help with engineering the acoustic monitoring system; Pam Odom for report preparation; and Rich Blaha for figure preparation and GIS support. The authors also thank Dr. Shannon Bros from San Jose State University and David Zajanc from H. T. Harvey for statistical guidance and direction. Finally, the authors expressly thank their Professional Advisory Committee, including Dick Anderson, Renee Culver, Jim Estep, Bronwyn Hogan, and William Rainey for their thoughtful comments and oversight during the study.

ii
PREFACE
The California Energy Commission Energy Research and Development Division supports public interest energy research and development that will help improve the quality of life in California by bringing environmentally safe, affordable, and reliable energy services and products to the marketplace.
The Energy Research and Development Division conducts public interest research, development, and demonstration (RD&D) projects to benefit California.
The Energy Research and Development Division strives to conduct the most promising public interest energy research by partnering with RD&D entities, including individuals, businesses, utilities, and public or private research institutions.
Energy Research and Development Division funding efforts are focused on the following RD&D program areas:
• Buildings End‐Use Energy Efficiency
• Energy Innovations Small Grants
• Energy‐Related Environmental Research
• Energy Systems Integration
• Environmentally Preferred Advanced Generation
• Industrial/Agricultural/Water End‐Use Energy Efficiency
• Renewable Energy Technologies
• Transportation
Bird and Bat Movement Patterns and Mortality at the Montezuma Hills Wind Resource Area is the final report for the Evaluating the Effectiveness of Avian Interaction Mitigating Measures and Processes Project, Agreement Number PIR‐08‐026 conducted by H. T. Harvey & Associates. The information from this project contributes to PIER’s Energy‐Related Environmental Research Program.
For more information about the Energy Research and Development Division, please visit the Energy Commission’s website at www.energy.ca.gov/research/ or contact the Energy Commission at 916‐327‐1551.

iii
ABSTRACT
Birds and bats have become important factors in the siting and permitting of wind‐energy facilities. Identifying methods to avoid, minimize, and mitigate bird and bat fatalities should help streamline wind energy permitting and reduce potential impacts to bird and bat resources. In this study, the authors conducted nighttime surveys to investigate the effectiveness of using horizontal/vertical radar, full‐spectrum acoustic monitoring and night vision to determine nocturnal flight directions, passage rates, and flight altitudes of birds and bats at the Montezuma Hills Wind Resource Area in Northern California. Following nighttime surveys, daily carcass searches were conducted to assess fatality rates as a function of movement patterns in the wind resource area. In addition, the study explored relationships between bird and bat fatalities, relevant activity indices, and the meteorological, landscape, and vegetation features of the study area.
Although average nocturnal passage rates ranged from 326—454 targets per kilometer per hour, a high rate in the western United States, only 2–6 percent of the total passed through at altitudes less than the 125 meters above ground level, the height where birds and bats are at risk of collision with wind turbines. Six nocturnal‐migrant bird and 53 bat fatalities were observed during the two 40‐day surveys. Carcass‐detection ratios ranged from 0.20–0.50. Carcass‐removal rate analysis indicated that 45 percent of small bird and 39 percent of bat carcasses disappeared within 24 hours, suggesting that a majority of small bird and bat fatalities would be missed by the weekly surveys that are commonly conducted. The total number of nocturnal migrant bird fatalities was quite low relative to the passage rate, indicating that this wind resource area is relatively benign with respect to migrating birds.
Overall, the three detection methods (radar, night‐vision, and acoustic) helped to provide a comprehensive and detailed view of the species inhabiting the night skies over the study area. In particular, this study identified that using altitude‐specific radar in the high‐risk zone can be a useful tool for monitoring fatality risk for birds in this wind resource area.
Keywords: Wind energy wildlife impacts, Montezuma Hills, hoary bats, Mexican free‐tailed bats, migrant passage rates, migrant passage altitudes, bat fatalities, bird fatalities, carcass removal trials, spatial relationships of wind turbine fatalities
Please use the following citation for this report:
Johnston, Dave S., Judd A. Howell, Scott B. Terrill, Nellie Thorngate, Jim Castle, Jeff P. Smith (H. T. Harvey & Associates), Todd J. Mabee, Jonathan H. Plissner, Nathan A. Schwab, Peter M. Sanzenbacher, and Corey M. Grinnell (ABR, Inc.). 2013. Bird and Bat Movement Patterns and Mortality at the Montezuma Hills Wind Resource Area. California Energy Commission. Publication Number: CEC‐500‐2013‐015.

iv
TABLE OF CONTENTS
Acknowledgements ................................................................................................................................... i
PREFACE ................................................................................................................................................... ii
ABSTRACT .............................................................................................................................................. iii
TABLE OF CONTENTS ......................................................................................................................... iv
LIST OF TABLES .................................................................................................................................... vi
LIST OF TABLES .................................................................................................................................. viii
EXECUTIVE SUMMARY ........................................................................................................................ 1
Introduction ............................................................................................................................................ 1
Purpose .................................................................................................................................................... 1
Objectives ................................................................................................................................................ 2
Conclusions and Recommendations ................................................................................................... 2
Benefits to California ............................................................................................................................. 4
CHAPTER 1: Introduction ....................................................................................................................... 6
1.1 Project Objectives ..................................................................................................................... 10
1.2 Quantitative and Measurable Goals ...................................................................................... 10
CHAPTER 2: Methods ............................................................................................................................ 12
2.1 Study Area and Site Characterization ................................................................................... 12
2.2 Assessing the Presence of Bats and Birds ............................................................................. 15
2.2.1 Radar Monitoring ............................................................................................................. 16
2.2.2 Night‐Vision Observations ............................................................................................. 20
2.2.3 Acoustic Monitoring ........................................................................................................ 21
2.2.4 Carcass Searches ............................................................................................................... 21
2.2.5 Detectability Bias Assessments ...................................................................................... 22
2.2.6 Data Processing and Analyses ....................................................................................... 23
CHAPTER 3: Results .............................................................................................................................. 30
3.1 Detection of Nocturnal Birds and Bats .................................................................................. 30
3.1.1 Radar .................................................................................................................................. 30

v
3.1.2 Night Vision Observations ............................................................................................. 42
3.1.3 Turbine Passage Rate Index ............................................................................................ 49
3.1.4 Acoustic Monitoring ........................................................................................................ 51
3.1.5 Comparison of Detections and Passage Rates Between Sampling Techniques ...... 53
3.2 Documenting Fatalities ........................................................................................................... 53
3.2.1 Estimating Fatality Rates ................................................................................................. 54
3.3 Relationships Among Fatality Estimates, Passage Rate Indices, and Environmental Variables ................................................................................................................................................ 56
3.4 Spatial Analyses ....................................................................................................................... 65
3.4.1 Dispersion of Fatalities Among Towers ........................................................................ 65
3.4.2 Hot Spot Analyses ............................................................................................................ 65
3.4.3 Influence of Habitat Features ......................................................................................... 75
CHAPTER 4: Discussion ........................................................................................................................ 77
4.1 Comparative Value of Different Nocturnal Monitoring Techniques ............................... 78
4.2 Passage Patterns Revealed by Radar Monitoring ................................................................ 78
4.2.1 Migration Timing ............................................................................................................. 78
4.2.2 Migration Passage Rates ................................................................................................. 79
4.2.3 Flight Altitude .................................................................................................................. 80
4.2.4 Flight direction ................................................................................................................. 81
4.3 Modeling Migration Passage Rates and Flight Altitudes in Relation to Weather Variables ................................................................................................................................................ 81
4.3.1 Passage Rates .................................................................................................................... 81
4.3.2 Flight Altitudes ................................................................................................................. 82
4.4 Identification of Migratory Birds and Bats Using Night‐Vision Monitoring .................. 83
4.5 Passage Activity and Behaviors within the High‐Risk Zone ............................................. 83
4.6 Bat and Bird Vocalizations Detected by Acoustic Monitoring .......................................... 84
4.7 Detecting Fatalities ................................................................................................................... 85
4.8 Bird and Bat Fatalities in Relation to Passage Patterns and Weather Variables ............. 86
4.8.1 Birds ................................................................................................................................... 86

vi
4.8.2 Bats ..................................................................................................................................... 86
4.9 Spatial Patterns of Bird and Bat Fatalities ............................................................................ 87
4.9.1 Birds ................................................................................................................................... 87
4.9.2 Bats ..................................................................................................................................... 88
CHAPTER 5: Management Implications ............................................................................................ 90
CHAPTER 6: Value to the Public ......................................................................................................... 91
REFERENCES .......................................................................................................................................... 92
APPENDIX A: ........................................................................................................................................ A‐1
APPENDIX B: ......................................................................................................................................... B‐1
APPENDIX C: ........................................................................................................................................ C‐1
APPENDIX D: ....................................................................................................................................... D‐1
APPENDIX E: ......................................................................................................................................... E‐1
APPENDIX F: ......................................................................................................................................... F‐1
APPENDIX G: ....................................................................................................................................... G‐1
APPENDIX H: ....................................................................................................................................... H‐1
APPENDIX I: ........................................................................................................................................... I‐1
APPENDIX J: ........................................................................................................................................... J‐1
APPENDIX K: ........................................................................................................................................ K‐1
APPENDIX L: ......................................................................................................................................... L‐1
LIST OF TABLES
Figure 1. Location of the Shiloh 1 and High Winds wind energy projects in Solano County in central California. ..................................................................................................................................... 14
Figure 2. Study areas within the Montezuma Hills Wind Resource Area. ...................................... 15
Figure 3. Approximate airspace sampled by Furuno FR–1510 marine radar. ................................ 18
Figure 4. Synoptic weather codes used to depict the position of study sites in the Montezuma Hills Wind Resource Area relative to a high‐pressure system. ......................................................... 26
Figure 5. Flight directions of radar targets (birds and bats). ............................................................. 31
Figure 6. Nightly flight altitudes (mean ± SE in meters agl) of radar targets (birds and bats). .... 32

vii
Figure 7. Mean flight altitudes (±SE) of radar targets (birds and bats). ........................................... 34
Figure 8. Mean (± SE) nightly passage rates of radar targets (birds and bats). ............................... 37
Figure 9. Mean (± SE) nightly passage rates below 125 meters agl. .................................................. 38
Figure 10. Percent of total nightly passage rates (±SE) of radar targets (birds and bats)............... 39
Figure 11. Flight directions of birds detected during night‐vision observations. ........................... 43
Figure 12. Flight directions of bats detected during night‐vision observations. ............................. 44
Figure 13. Mean hourly detection rates for birds during night‐vision observations. .................... 46
Figure 14. Mean hourly detection rates for bats during night‐vision observations. ...................... 47
Figure 15. Mean (± SE) detection rates by hour after sunset for birds and bats during night‐vision observations. ................................................................................................................................. 48
Figure 16. Distribution of bat and bird call sequences recorded at acoustic monitoring stations. .................................................................................................................................................................... 52
Figure 17. Temporal distribution of bat call sequences recorded by acoustic monitoring stations. .................................................................................................................................................................... 52
Figure 18: Number of bird and/or bat carcasses placed and detected during searcher efficiency trias. ............................................................................................................................................................ 55
Figure 19. Persistence times for bird (n = 20; kinglet to dove size) and bat (n = 51) carcasses. ..... 56
Figure 20. Unadjusted bird fatalities per survey in the Montezuma Hills, California. .................. 58
Figure 21. Histograms displaying predominant flight directions (in degrees, zero = north) for all bird and bat radar targets. ...................................................................................................................... 59
Figure 22. Unadjusted bat fatalities per survey in the Montezuma Hills, California. .................... 60
Figure 23. Unadjusted Mexican free‐tailed bat fatalities per survey in the Montezuma Hills, California. .................................................................................................................................................. 62
Figure 24. Relationship (Pearson r = 0.23) between total bird and bat counts. ............................... 63
Figure 25. Unadjusted tree‐roosting bat fatalities per survey in the Montezuma Hills, California. .................................................................................................................................................................... 64
Figure 26. Spatial distribution of bird and bat fatalities. .................................................................... 67
Figure 27. Spatial distribution of all bird and bat fatalities. ............................................................... 68
Figure 28. Spatial distribution of all bird fatalities. ............................................................................. 69
Figure 29. Spatial distribution of all bat fatalities. ............................................................................... 70
Figure 30. Spatial distribution of all bat fatalities. ............................................................................... 71

viii
Figure 31. Spatial distribution of tree‐roosting bat fatalities. ............................................................ 72
Figure 32. Spatial distribution of tree‐roosting bat fatalities. ............................................................ 73
Figure 33. Spatial distribution of Mexican free‐tailed bat fatalities. ................................................. 74
Figure 34. Distribution of nocturnal‐migrant bird fatalities. ............................................................. 75
Figure 36. Distribution of Mexican free‐tailed bat fatalities............................................................... 76
Figure 37. Distribution of tree‐roosting bat fatalities. ......................................................................... 76
Figure G‐1. Unadjusted bird fatalities predicted based on final fitted Poisson GLM (Table G‐1), with 95% confidence intervals. Plots are based on inserting average values in predictive equations for all variables other than that on the x‐axis (Julian date: High Winds 262, Shiloh I 266). .......................................................................................................................................................... G‐2
Figure G‐2. Unadjusted bat fatalities predicted based on final fitted Poisson GLM (Table G‐1), with 95% confidence intervals. Plots are based on inserting average values in predictive equations for all variables other than that on the x‐axis. .................................................................. G‐3
Figure G‐3. Unadjusted Mexican free‐tailed bat fatalities predicted based on final fitted Poisson quasi‐GLM (Table G‐1), with 95% confidence intervals. Plots are based on inserting average values in predictive equations for all variables other than that on the x‐axis ............................... G‐4
Figure G‐4. Unadjusted tree‐roosting bat fatalities predicted based on final fitted logistic regression model (Table G‐3), with 95% confidence intervals. Plots are based on inserting average values in predictive equations for all variables other than that on the x‐axis. ............... G‐7
LIST OF TABLES
Table 1. Inconsistencies among studies hamper comparisons of bat fatality rates at wind‐energy facilities in central California. ................................................................................................................... 9
Table 2. Nocturnal flight altitudes of radar targets (percent of all targets). .................................... 33
Table 3. Linear mixed model estimates from competitive models (ΔAICc ≤2) explaining the influence of weather variables on passage rates (surveillance radar) and flight altitudes (vertical radar) of radar targets. ............................................................................................................................ 40
Table 4. Model‐averaged parameter estimates from competitive models (ΔAICc ≤2) explaining the influence of of weather variables on passage rates (surveillance radar) and flight altitudes (vertical radar) of radar targets. ............................................................................................................. 41
Table 5. Numbers of birds and bats detected during night‐vision observations. ........................... 45
Table 6. Behavioral reactions of birds and bats to turbines observed during night‐vision observations. ............................................................................................................................................. 50
ix
Table 7. Bird and bat fatalities detected during standard surveys. .................................................. 53
Table 8. Carcass detection ratios on sample plots with different substrates. .................................. 54
Table 9. Distribution among wind turbines (n = 24 at both sites) of bat and nocturnal‐migrant bird fatalities. ............................................................................................................................................ 66
Table G‐1. Final Poisson GLMs including significant (P ≤ 0.05) and marginally significant (0.05 < P ≤ 0.10) variables for explaining unadjusted numbers of all‐bird, all‐bat, and Mexican free‐tailed bat (quasi‐GLM approach) fatalities per survey, and used to develop predictive surface plots in Figures 17b, 17c, 19b, 19c, 20b, 20c, G‐1, G‐2, and G‐3. Types of explanatory variables considered included spatial and temporal variables, nightly average weather metrics, and nightly activity indices derived from radar and night‐vision monitoring. Coefficients for the intercept and spatial/temporal variables derive from final models fit in step 3 (see text for details; no substantive differences between deviance and significance values for the latter variables compared to models fit in steps 1 and 2 for the all‐bird and all‐bat models, whereas P‐value for barometric pressure was 0.006 in weather‐only model for Mexican free‐tailed bats prior to inclusion of radar‐target altitude). Degrees of freedom (df), deviance (Dev.), and P correspond to analysis of deviance tests comparing models with and without the explanatory variable. ................................................................................................................................................... G‐1
Table G‐2. Negative‐binomial GLM including significant (P ≤ 0.05) and marginally significant (0.05 < P ≤ 0.10) variables for explaining numbers of all‐bird, all‐bat, and Mexican free‐tailed bat (MFB) fatalities per survey, adjusted for variation in carcass detectability among survey periods. Types of explanatory variables considered included spatial and temporal variables, nightly average weather metrics, and nightly activity indices derived from radar and night‐vision monitoring. Coefficients for spatial/temporal variables are based on models fit in step 1 and for weather variables are based on models fit in Step 2 (see text for details). Degrees of freedom (df), log‐likelihood ratio statistics (LL ratio), and P correspond to log‐likelihood ratio tests comparing models with and without the explanatory variable. ..................................................... G‐5
Table G‐3. Final binomial logistic regression model including significant (P ≤ 0.05) and marginally significant (0.05 < P ≤ 0.10) variables for explaining the presence / absence of fatalities of tree‐roosting bats (primarily hoary bats) and used to develop predictive surface plot in Figure 22b. Types of explanatory variables considered included spatial and temporal variables, nightly average weather metrics, and nightly activity indices derived from radar and night‐vision monitoring. Coefficients for the intercept, temporal, and weather variables derive from final models fit in step 3 (see text for details; significance levels for temporal variables = 0.005–0.006 in final Step 1 model, and for temperature = 0.078 in final Step 2 model). ............... G‐6

1
EXECUTIVE SUMMARY
Introduction Increased energy costs, reliance on foreign oil, and the contribution of fossil fuels to global climate change have accelerated the development of renewable energy resources such as wind. Although wind power is environmentally benign relative to the extraction and use of fossil fuels, wind‐energy structures can result in ecological issues such as bird and bat fatalities. Bird and bat fatalities remain a potentially serious environmental impact and a significant regulatory issue for wind‐energy development in California and worldwide. Identifying methods to avoid, minimize, and mitigate bird and bat fatalities should help streamline permitting and reduce potential impacts to bird and bat resources. Several techniques can provide estimates of nocturnal (active at night) migratory bird and bat activity at wind‐energy facilities, including visual surveys with night‐vision equipment and monitoring with radar and acoustic recording devices. Although these techniques have been employed with varying degrees of success in recent wind‐power research, the effectiveness of these methods has not been evaluated for estimating bird and bat movement through project areas or for deriving correlations between nocturnal‐migrant bird and bat “traffic” rates and observed fatality rates. Such correlations provide a potential standardized measure of fatality rates to movement rates, which allow for potential comparisons of relative risk between sites. In addition, such information has the potential to help develop risk assessments for future wind project siting evaluations.
The study area was located within the Montezuma Hills Wind Resource Area on the low rolling hills adjacent to the Sacramento‐San Joaquin Delta, west of Rio Vista, California (Solano County), about 50 miles east of the California coast. The study area contained primarily active agricultural lands used for growing wheat and safflower and for grazing sheep, goats, and cattle. A few small isolated pockets of remnant riparian forest with Fremont cottonwood (Populus fremontii) and willow (Salix spp.), largely limited to patches with fewer than 10 trees and shrubs, occurred throughout the study area, along with scattered groves of river gum (Eucalyptus camaldulensis) and blue gum (E. globulus). The marshes of the Grizzly Island Wildlife Area lie southwest and adjacent to the study area. Much of the agricultural land in the Montezuma Hills area is being used for wind‐energy production, primarily through leases taken by Iberdrola Renewables, NextEra Energy, and enXco.
Purpose In this study, the researchers were interested in determining if there is a correlation between bird and bat fatalities and the numbers and passage rates of migrant birds and bats at the Montezuma Hills Wind Resource Area in Northern California. Specifically, the researcher’s primary study objectives were to:
• Evaluate and compare results from three techniques (radar, night‐vision, and acoustic monitoring) used to document nocturnal bird and bat activity during two autumn migration seasons.
• Investigate relationships between activity indices derived from these surveys and bird and bat fatality estimates derived from intensive carcass surveys.

2
• Assess fatality rates as a function of movement patterns in the wind resource area. A secondary objective was to explore relationships between bird and bat fatalities, relevant activity indices, and the meteorological, landscape, and vegetation features of the study area.
This study comprised daily carcass searches at 48 turbines, 24 at the High Winds facility and 24 at the Shiloh 1 facility. Surveys were conducted during fall, approximately mid‐August through mid‐October 2009 and 2010 with marine radar, full‐spectrum acoustic monitoring, and night‐vision techniques. Concurrent data were collected on the nocturnal flight directions, passage rates, and flight altitudes of birds and bats (radar “targets”). The researchers used statistical (correlation, regression, and general linear models), and spatial analyses to determine possible relationships between fatality rates, activity indices, and spatial, habitat and weather variables (for example, wind speed and direction, temperature, and barometric pressure).
Objectives The authors’ specific measurable objectives were:
1. Use radar, acoustic, and night‐vision techniques to evaluate the best methods for determining the species composition, relative abundances, and migration passage rates of nocturnally active birds and bats.
2. Use radar and night‐vision monitoring techniques to collect baseline information on flight directions, passage rates, and flight altitudes of nocturnally active birds and bats during fall 2009 and fall 2010.
3. Use radar and night‐vision monitoring techniques to quantify among‐night and within‐night variation in passage rates and flight altitudes of nocturnally active birds and bats.
4. Use night‐vision and acoustic monitoring techniques to estimate the relative proportions and movement rates of nocturnally active birds and bats.
5. Evaluate the influence of weather on migration passage rates and flight altitudes.
6. Visually document bird and bat avoidance behavior near wind turbines.
7. Use radar, night‐vision, and acoustic monitoring techniques to estimate abundance indices for birds and bats that fly at altitudes within the rotor‐swept areas of turbines.
8. Quantify bird and bat fatality rates at new‐generation wind turbines and assess relationships to traffic rates during autumn migration seasons, while also accounting for influences of landscape and weather variables.
9. Investigate spatial relationships between bird and bat fatality rates at wind turbines and habitat variables.
Conclusions and Recommendations Average nocturnal passage rates for migrating bats and birds (“radar targets”) in the Montezuma Hills Wind Resource Area ranged from 326 − 454 targets/kilometer/hour across sites for both of the two survey years, a higher rate than at most other sites reported elsewhere in the United States and especially among the western states. Of the total nocturnal birds and bats recorded by radar, only 2 percent at the High Winds location and 6 percent at the Shiloh 1

3
location passed through areas at altitudes below 125 meters (turbine height where birds and bats are at risk of collision with wind turbines). The fall turbine passage‐rate indices of 0.5—10.5 migrants/turbine/night are lower rates than documented at other California sites. Migrating bats and birds flew in specific directions; primarily in the direction of the wind, at altitudes greater than 125 meters above ground level (agl), but showed no predominate flight directions below 125 meters agl.
Relatively few acoustic data were collected, but some data suggest bats and birds focused on a depression in the landscape where insects likely concentrated. Acoustic monitoring failed to capture calls of night‐migrating birds.
Six nocturnal migrant bird fatalities were observed during the two 40‐day surveys. This is a very low fatality rate for nocturnal migrant birds compared to the large number of migrant birds passing through the area, especially considering the daily search efforts associated with this study. The relatively high rate of bird and bat passage over the site and the low fatality rate suggest that the Montezuma Hills Wind Resource Area is a relatively benign location for wind projects with respect to risk among migrant birds. Standardized measures of traffic rate relative to fatality rate potentially allow for relative comparisons of risk between wind resource sites. Such information might also be valuable in evaluating potential risk for proposed new wind resource projects.
Twenty‐two hoary bat (Lasiurus cinereus), one western red bat (L. blossevillii) and 30 Mexican free‐tailed bat (Tadarida brasiliensis mexicanus) fatalities were observed during the two 40‐day surveys. Among California facilities, this is a high fatality rate for bats, but comparisons with other facilities are difficult because of the wide variation in search time intervals, which influences carcass detection rates. Trial‐specific, carcass‐detection ratios ranged from 0.20–0.50, with observed variation mostly due to effects of substrate type. Carcass‐removal trials indicated that a high proportion of small bird (45 percent) and bat (39 percent) carcasses disappeared within 24 hours, and about 75 percent of each disappeared within five days. Before this study, carcass search intervals used in the Montezuma Hills Wind Resource Area were limited to a week or more, suggesting that a majority of small bird and bat fatalities were missed. The probability of finding a bat fatality increased during mid‐season, on warmer nights, and with higher barometric pressure. As found at other North American wind energy areas, hoary bat fatalities at the Montezuma Hills Wind Resource Area were related to lower wind speeds. However, data from this study indicated that the opposite was true for the Mexican free‐tailed bat fatalities; that is, higher numbers of Mexican free‐tailed bat fatalities were related to higher wind speeds. Few if any other wind energy fatality studies have been conducted within the primary range of the Mexican free‐tailed bat, and therefore, this relationship for a North American bat has previously not been shown. Likewise, wind turbine collisions for the European bat (Nyctalus noctual), with a similar foraging behavior as the Mexican free‐tailed bat, were correlated to higher wind speeds. Bat fatalities were clustered around particular turbines with species‐specific hot spots for hoary bats and Mexican free‐tailed bats and were more numerous at turbines located southeast (that is, generally downwind) of the nearest eucalyptus grove. Bird fatalities also showed some clustering at specific turbines and were more numerous at turbines located southeast of the nearest riparian area. Few studies of bat mortality at wind

4
turbines have been conducted in California, and none before this study included daily carcass searches to accurately evaluate fatality rates and relationships to environmental conditions and the dynamics of bat movements.
At present, some wind turbines are delayed from starting up at low wind speeds (<5 meters/sec) when higher numbers of bat fatalities occur, hence curtailing the production of electricity but effectively reducing the hoary bat fatality rate. Based on this study’s data, such curtailment will not reduce the Mexican free‐tailed bat fatality rate. If additional parameters such as changes in barometric pressure, wind direction, and time of day can more precisely define bat movements, then perhaps better mitigation measures can be developed and implemented. This would lead to reduced fatalities while giving wind turbine plant operators more time to produce electricity.
Sitting of wind turbines to avoid or minimize impacts to wildlife is one of the many factors that influence the location and design of a wind‐energy facility. This study indicated that local habitat factors might influence the risk of collision fatality for both birds and bats. The authors recommend additional research on the relationships between habitats and fatalities to guide the future placement of individual wind turbines.
Benefits to California Wind energy is playing an important role in California achieving its greenhouse gas and renewable energy goals. Wind energy is the major source of low‐cost, clean energy within the state and represents over 21 percent of California’s in‐state renewable energy generation. Over 900 MW of new wind generation was added in 2011 within the state. Permitting of such projects, however, is often delayed due to concerns over wind turbine induced bird and bat mortality.
This study improves our understanding of the numbers of migrant birds and bats in the airspace of a wind facility, and helps correlate fatalities with various factors such as wind speed, direction, or proximity to habitat elements. This project provides information needed to improve wind turbine siting and permitting in California.


6
CHAPTER 1: Introduction H. T. Harvey &Associates assembled a research team to address the California Energy Commission’s Public Interest Energy Research (PIER) PON‐08‐003 (Energy and Environmental Research in the fields of Air Quality, Aquatic Resources, Terrestrial Resources, and Community Scale Energy Research), released 8 December 2008. We contacted ABR, Inc. to provide assistance with Research Topic 3: Terrestrial Research. In the California Energy Commission publication A Roadmap for PIER Research on Methods to Assess and Mitigate Impacts of Wind Energy Development on Birds and Bats in California (Sanders and Spiegel 2008), Chapter 4 (Research Needs) outlines those research priorities that need resolution to improve methods to assess and mitigate impacts to birds and bats from wind‐energy development in California.
Increased energy costs, reliance on foreign oil, and the contribution of fossil fuels to global climate change have catalyzed a national effort to accelerate the development of alternative energy sources, including renewable resources such as wind (U. S. Department of Energy 2008). Although wind power is environmentally benign relative to fossil fuel consumption, wind‐energy structures can result in ecological issues such as bird and bat fatalities. Erickson et al. (2001) state “…even if wind‐plants were quite numerous (for example, 1 million turbines), they would likely cause no more than a few percent of all collision deaths related to human structures.” However, disproportionate population‐level effects could occur for individual species with small population sizes, or for specific taxa (for example, golden eagles Aquila chrysaetos and hoary bats Lasiurus cinereus). Additionally, the Migratory Bird Treaty Act (16 U.S.C. § 703) prohibits killing, possessing, or trading of migratory birds, and California Department of Fish and Game Codes protect native birds, bats, and other non‐game mammals from all forms of take (California Department of Fish and Game Code §§ 3503, 3513, 3800, and 4150). Two overarching objectives encompass these needs: (1) establishing a link between pre‐permitting data on bird and bat use and site characteristics with bird and bat fatalities during turbine operation; and (2) identifying methods to avoid, minimize, and mitigate bird and bat fatalities. Thus, bird and bat fatalities remain a potentially serious environmental impact and a significant regulatory issue for wind‐energy development in California and worldwide.
Understanding bird and bat activity patterns at wind facilities and determining correlates of risk are important topics for the worldwide wind industry. North America has produced wind
energy commercially for nearly four decades and is one of the fastest growing forms of renewable energy (General Accounting Office 2005, Arnett et al. 2007). In recent years, the United States has led the world in wind‐energy production, growing by approximately 10,000 MW in 2009 (American Wind Energy Association Annual Market Report 2009). Based on third‐quarter 2010 figures, the total installed utility‐scale wind power capacity in the United States was 36,698 MW, with an additional 6,273 MW under construction (American Wind Energy Association Third Quarter Market Report 2010). At that time, California’s 2,739 MW of installed capacity ranked third highest in the country and the state had one of the most aggressive Renewable Energy Portfolio Standards, mandating that 33% of state energy consumption come

7
from renewable energy by 2020 (Department of Energy 2009: California Executive Order S‐14‐08).
Although wind‐generated energy reduces carbon and other greenhouse gas emissions associated with global warming, it is not environmentally neutral because facilities can directly and/or indirectly affect associated wildlife and their habitats (Arnett et al. 2007). Avian studies examining the impacts of wind facilities on birds in the United States and Europe suggest that fatalities and behavioral modifications (for example, avoidance of wind facilities) occur in some, but not all, locations (Winkelman 1995, Anderson et al. 1999, Erickson et al. 2001). In the United States at regional scales, both resident and migratory birds collide with wind turbines at similar rates (2.3–3.5 avian fatalities/installed MW/year; Erickson 2004, National Research Council 2007, National Wind Coordinating Collaborative 2010).
Factors underlying bird and bat collisions are complex and still poorly understood. As Kunz et al. (2007) described it, various hypotheses have been proposed to explain different variables influencing bat and bird fatalities, but our knowledge of causative reasons and appropriate mitigation is limited. A considerable limitation for developing integrated state‐of‐the‐science assessments has been the plethora of methods used to estimate fatality and animal activity across diverse study sites, which encompass a wide array of geographic, landscape, and vegetation features.
Species composition varies regionally; overall, however, to date passerines, or songbirds, have comprised 69–86% of the known bird collisions at wind facilities throughout the United States. (Erickson et al. 2008). Neotropical migratory species such as thrushes (Turdidae), vireos (Vireonidae), and warblers (Parulidae) have a long history of colliding with aboveground structures (Kerlinger 2000, Longcore et al. 2005) and appear to be the most vulnerable to collisions during their nocturnal migrations (Manville 2005). This pattern also holds true at wind facilities: 30–50% of all fatalities have involved night‐migrating passerines (Erickson et al. 2001) and a geographic gradient exists in North America whereby fatalities increase from west to east (Kerlinger et al. 2010). Higher collision rates among night‐migrating passerines make sense because of both poorer visibility at night and the fact that passerines tend to migrate at lower altitudes than other groups of birds (for example, shorebirds and waterfowl; Alerstam 1990, Kerlinger 1995).
The paucity of general information on nocturnal bird migration in most areas has generated interest in conducting pre‐construction studies of nocturnal migration at the growing number of proposed wind facilities throughout the country (California Energy Commission and California Department of Fish and Game 2007, Kunz et al. 2007). Consideration of potential wind‐power impacts on nocturnal bird migration is particularly important because more birds migrate at night than during daytime (Gauthreaux 1975, Kerlinger 1995), and frequently large proportions (up to 80%) of the fatalities at specific wind facilities are nocturnal migrants (Erickson et al. 2001).
Substantial uncertainty remains with regard to quantifying the comparative effects of new‐generation wind turbines on nocturnal bat and bird fatality rates, and understanding relationships between nocturnal bird and bat activity patterns and the number of fatalities that

8
occur at wind facilities. Small birds, including most nocturnal migrants, are very difficult to detect during carcass surveys and may be scavenged quickly, which can lead to underestimating fatality rates for this large group of birds. Before 2001, carcass monitoring under wind turbines in the United States focused on birds and reported few bat fatalities (Anderson et al. 1999, Johnson 2005). Impacts to bats have only recently been recognized as a serious issue (Kunz et al. 2007). In addition, biases related to search intervals, searcher efficiency, carcass removal by scavengers, and associated analytical methods continue to hamper fatality estimation for both birds and bats (Kunz et al. 2007, Arnett 2008, Cryan 2009, Huso 2010).
Smallwood and Thelander (2004, 2005) and Smallwood (2006) identified the importance of re‐powering the Altamont Pass Wind Resource Area in central California to reduce the number of turbines and thus ultimately reduce the number of bird (particularly raptor) fatalities caused by those turbines. The Altamont Pass Avian Monitoring Team (2008) also suggested re‐powering based on their 2005 to 2007 surveys. Repowering is already underway in the nearby Montezuma Hills Wind Resource Area (MHWRA) in Solano County, California (Sanders and Spiegel 2008). Barclay et al. (2007) predicted, however, that taller new‐generation turbines would kill higher numbers (relative to existing turbines) of migratory bats (for example, hoary bats and eastern red bats Lasiurus borealis).
Bat fatalities at wind facilities have been documented since the early 1970s (Hall and Richards 1972). Previous studies documented high fatality rates along forested ridges in the eastern United States (for example, at Mountaineer, West Virginia [Kerns et al. 2005] and Buffalo Mountain, Tennessee [Fiedler 2004, Fiedler et al. 2007]). Recent data suggest, however, that high fatality events occur across a variety of landscapes throughout North America, including agricultural fields, grassland prairies, and deciduous or coniferous forests (Barclay et al. 2007, Kunz et al. 2007, Arnett et al. 2008). Kerlinger et al. (2006) conducted fatality monitoring for 2 years at the High Winds facility in the MHWRA and determined that most bat (and bird) fatalities occurred in fallow agriculture habitats. They estimated fatalities at 2.02 bats/MW/yr (3.63 bats/turbine/yr) with hoary bats and Mexican free‐tailed bats (Tadarida brasiliensis mexicanus) comprising roughly 95% of all bat fatalities. The bulk of these fatalities occurred from August to October during the fall migration period, following a similar trend for wind facilities across the country.
Most bat fatalities documented at wind facilities involve migratory tree‐roosting species (that is, hoary bats, Eastern red bats, big brown bats Eptesicus fuscus, and silver‐haired bats Lasionycteris noctivagans) during seasonal migration periods in late summer and fall (Arnett et al. 2008, Cryan and Barclay 2009); however, other studies have reported high percentages of Brazilian (or Mexican) free‐tailed bats among fatalities during spring migration and summer residency (Kerlinger et al. 2006, Piorkowsky 2006). Several hypotheses have been offered to help explain bat/turbine interactions (that is, roost, landscape, acoustic, and visual‐attraction mechanisms), but none have been tested adequately (Arnett et al. 2005, Barclay et al. 2007, Cryan and Brown 2007, Kunz et al. 2007). Recent evidence suggests that bat/turbine interactions likely are non‐random events. Using thermal infrared imaging, Horn et al. (2008) documented bats investigating turbine structures and foraging in and around the rotor swept area. Clearly,

9
understanding bat behaviors around operational wind turbines is essential for understanding collision risk.
Inconsistencies among studies hamper our ability to estimate bat fatality rates (Table 1). In a 2‐year study of 1.8‐MW turbines at the High Winds project in the MHWRA, Kerlinger et al. (2006) recovered 116 bats and estimated for the 90 turbines that more than 600 bats (331 hoary bats, 256 Mexican free‐tailed bats, 21 western red bats, and 11 silver‐haired bats) were killed at the facility during their study. The estimate did not separate migratory from resident bats, and estimates were based on total fatalities detected per 12 months, not by a specific season or sample of months. Kerlinger et al. (2008, 2009) reported a wide range of bat fatality rates at 1.5‐MW turbines at another facility within the MHWRA, Shiloh I. From the Kerlinger et al. studies, bat fatality rates ranged from 1.9–3.8 fatalities/MW/year (3.4–7.9 fatalities/turbine/year), which include the highest fatality rates reported to date for bats in California. However, inconsistencies in search efficiency and fatality search intervals, and non‐randomized study designs restrict our ability to make accurate inferences and comparisons even among studies at the same sites (Table 1).
Table 1. Inconsistencies among studies hamper comparisons of bat fatality rates at wind-energy facilities in central California.
Number of bat fatalities Study conditions 1 Source
7 APWRA, 24-month study, ~2500 turbines of variable design (40-250 kW),
average search interval 44 days
Altamont Pass Avian Monitoring Team 2008 Draft Report 2
4 APWRA, 3-year study, 1536 turbines of variable design, average search interval
53 days
Smallwood and Thelander 2005
3 APWRA, 4-month3 study, 244 turbines of variable design, 48-hour search interval
ICF Jones & Stokes 2009
116 MHWRA, 2-year study, 90 1.8-MW turbines, search interval 14 days
Kerlinger et al. 2006
1 MHWRA, 13-month study, 59 KVS-56—100 kW and 17 KVS-33 362 kW turbines,
search interval twice/week
Howell 1997
0 MHWRA, 2-year study, 237 KVS 56 -- 100 kW turbines, search interval 7 days
Howell and Noone 1992
1 APWRA is the Altamont Pass Wind Resource Area in Alameda and Contra Costa counties and MHWRA is the Montezuma Hills Wind Resource Area in Solano County.
2 The Final Report excluded all references to bats, so for purposes of this table, the Draft report was referenced because it includes bat fatalities.
3 The 48‐hour search interval study spanned two separate 2‐month periods (September/October 2007 and March/April 2008) that were pooled for analysis.
Several techniques can provide estimates of nocturnal bird and bat activity at wind‐energy facilities, including visual surveys with night‐vision equipment and monitoring with radar and acoustic recording devices (National Wind Coordinating Committee 2004, Arnett et al. 2007).

10
These techniques have been employed with varying degrees of success in recent wind‐power research (for example, Nicholson et al. 2005, Jacques Whitford Limited 2005, Redell et al. 2006, Arnett et al. 2006, Mabee et al. 2006c, Kunz et al. 2007). However, the efficacy of these methods has not been evaluated for estimating bird and bat movement through project areas, or for deriving correlations between nocturnal‐migrant bird and bat traffic rates and observed fatality rates (Arnett et al. 2007).
In this study, the authors investigated relationships between nocturnal bird and bat activity patterns and documented fatality rates at two wind facilities in the MHWRA to advance understanding of the risks to nocturnally migrating birds and bats posed by wind turbines, and to address some of the key uncertainties associated with the current state‐of‐the‐science for wind‐energy/wildlife interactions. This report presents the results of their two‐year study.
1.1 Project Objectives The California Energy Commission PIER grant proposal request identified several issues to be addressed by their research program. In this study, the authors focused on the following areas.
• Nocturnal survey techniques and correlates of risk for bats and birds:
• Assess nocturnal and diurnal survey techniques for estimating bird and bat movements and activity in and near wind farms. These techniques would provide “background” movement rates for birds and bats and allow fatality rates to be standardized by movement rates for comparative purposes.
• Effects of turbine design and site characteristics:
Specifically, the authors’ primary study objectives were to:
1. Evaluate results from the three techniques (radar, night‐vision, and acoustic monitoring) used to document nocturnal bird and bat activity during two autumn migration seasons.
2. Investigate relationships between activity indices derived from these surveys and bird and bat fatality estimates derived from intensive carcass surveys.
3. Assess fatality rates as a function of movement patterns in the wind resource area. A secondary objective was to explore relationships between bird and bat fatalities, relevant activity indices, and the meteorological, landscape, and vegetation features of the study area.
1.2 Quantitative and Measurable Goals A. Use radar, acoustic, and night‐vision techniques to evaluate the best methods for
determining the species composition, relative abundances, and migration passage rates of nocturnally active birds and bats:
B. Use radar and night‐vision monitoring techniques to collect baseline information on flight directions, passage rates, and flight altitudes of nocturnally active birds and bats during fall 2009 and fall 2010.

11
C. Use radar and night‐vision monitoring techniques to quantify among‐night and within‐night variation in passage rates and flight altitudes of nocturnally active birds and bats.
D. Use night‐vision and acoustic monitoring techniques to estimate the relative proportions and movement rates of nocturnally active birds and bats.
E. Evaluate the influence of weather on migration passage rates and flight altitudes.
F. Visually document bird and bat avoidance behavior near wind turbines.
G. Use radar, night‐vision, and acoustic monitoring techniques to estimate abundance indices for birds and bats that fly at altitudes within the rotor‐swept areas of turbines.
H. Quantify bird and bat fatality rates at new‐generation wind turbines and assess relationships to traffic rates during autumn migration seasons, while also accounting for influences of landscape and weather variables.
I. Investigate spatial relationships between bird and bat fatality rates at turbines and habitat variables.

12
CHAPTER 2: Methods 2.1 Study Area and Site Characterization The MHWRA is located on the low (<90 meters elevation) rolling hills adjacent to the Sacramento‐San Joaquin Delta west of Rio Vista, California (Figure 1) on the edge of the California Coast Range section of the Pacific Border physiographic province (U.S. Geological Survey 2003). The area is bordered by the Sacramento Valley to the north, the Sacramento River to the south, and the San Joaquin Valley to the southeast. The Sacramento River flows westerly past the Grizzly Island State Wildlife Area en route to San Pablo Bay and the larger San Francisco Bay. The marshes of the Grizzly Island Wildlife Area lie adjacent to and southwest of the MHWRA; however, the study area itself contained primarily active agricultural lands used for growing wheat and safflower, and for grazing sheep, goats, and cattle. A few small isolated pockets of remnant riparian forest with Fremont cottonwood (Populus fremontii) and willow (Salix spp), largely limited to patches with fewer than 10 trees and shrubs, occurred throughout the study area, along with scattered groves of river gum (Eucalyptus camaldulensis) and blue gum (E. globulus). Scattered farmhouses and homes and narrow county roads comprised the extent of residential development in the area. By the time of this study, much of the agricultural land in the Montezuma Hills area was also being used for wind‐energy production, primarily through leases taken by Iberdrola Renewables, NextEra Energy, and enXco.
The authors’ study sites consisted of plots within two areas of the MHWRA: Iberdrolaʹs Shiloh I Wind Power Project and Next Eraʹs High Winds Wind Energy Center (Figure 2). The Shiloh I project, in operation since 2006, encompassed 6,800 acres (2,752 ha) and consisted of 100 GE 1.5 MW wind turbines, with a nameplate capacity of 150 MW. Seventy‐six of the turbines were on 80‐meter towers with a maximum turbine blade height of 118.5 meters agl. The other 24 turbines had a hub height of 65 meters and a maximum blade height of 103.5 meters.
The High Winds project, in operation since 2003, contained 90 Vestas V‐80 1.8 MW turbines on 6,480 acres (2,622 ha) east and southeast of the Shiloh I project area, with total nameplate capacity of 162 MW. With a hub height of 60 meters agl and blade length of 40 meters, each turbine had a maximum blade height of 100 meters agl. The specific sites used in this study included two radar coverage sample plots, each 3.0 kilometer in diameter and chosen based on their suitability for deployment of the radar monitoring system described below. The first plot encompassed 24 1.8‐MW turbines on the High Winds site and the second plot encompassed 24 1.5‐MW turbines (14 with 80‐meter hub heights and 10 with 65‐meter hub heights) on the Shiloh I site (Figure 2).
Twenty species of birds having a special status designation in California (including state endangered or threatened species, fully protected species, species of special concern, and California Department of Fish and Game watch list species; see http://www.dfg.ca.gov/wildlife/nongame/list.html) have either been observed or reported as fatalities within the Montezuma Hills Wind Resource Area (MHWRA) (Ecology & Environment

13
2007, Kerlinger et al. 2006, 2009, 2010). These include American white pelican (Pelecanus erythrorhynchos), golden eagle, Cooperʹs hawk (Accipiter cooperii), ferruginous hawk (Buteo regalis), Swainsonʹs hawk (B. swainsoni), peregrine falcon (Falco peregrinus), merlin (F. columbarius), prairie falcon (F. mexicanus), northern harrier (Circus cyaneus), white‐tailed kite (Elanus leucurus), California black rail (Laterallus jamaicensis coturniculous), short‐eared owl (Asio flammeus), burrowing owl (Athene cunicularia), black swift (Cypseloides niger), loggerhead shrike (Lanius ludovicianus), California horned lark (Eromophila alpestris actia), yellow warbler (Setophaga petechia), yellow‐breasted chat (Icteria virens), grasshopper sparrow (Ammodramus savannarum), and tricolored blackbird (Agelaius tricolor). Prior to this study, post‐construction studies conducted between 2003 and 2010 at three neighboring facilities in the MHWRA revealed that at least 69 bird and 4 bat species were killed in the vicinity of turbines (Kerlinger et al. 2006, 2009, 2010). These included 11 of the special‐status bird species listed above: golden eagle, ferruginous hawk, peregrine falcon, merlin, northern harrier, white‐tailed kite, tricolored blackbird, black rail, yellow warbler, yellow‐breasted chat, and horned lark.
One special‐status species of bat, the western red bat, has been reported within the MHWRA (Kerlinger et al. 2006, 2008; and this study) and is designated a California Species of Special Concern. Two other bat species that are California Species of Special Concern, the pallid bat (Antrozous pallidus) and the Townsend’s big‐eared bat (Corynorhinus townsendii), also are known to occur in the region (California Department of Fish and Game 2011) and could potentially occur in the project area. No federal or state threatened or endangered bat species occur in the project area or surrounding counties; however, hoary and Mexican free‐tailed bats are of increasing concern because of fatalities documented at wind facilities in the United States (Arnett et al. 2008) and in the MHWRA (Kerlinger et al. 2006, 2008; this study).

14
Figure 1. Location of the Shiloh 1 and High Winds wind energy projects in Solano County in central California.

15
Figure 2. Study areas within the Montezuma Hills Wind Resource Area.
Shows 3.0-kilometer-diameter radar coverage plots on the Shiloh I and High Winds wind-energy facilities.
2.2 Assessing the Presence of Bats and Birds Field crews surveyed bat and bird movements and mortality between 15 August and 15 October 2009 and between 30 August and 28 October 2010. The authors chose these sampling periods to encompass most of the autumn migrations of birds and bats in central California (Constantine 1966, Cryan 2003, Kerlinger et al. 2009). Surveys began later in 2010 due to access problems resulting from unharvested crops. Field crews conducted 40 nights of surveys each autumn to document nocturnal bird and bat passage activity using a horizontal/vertical radar system, night‐vision equipment, and full‐spectrum acoustic monitoring stations. They then followed each nightly survey the following day by conducting fatality surveys at all relevant turbine locations. Activity and fatality surveys occurred in 5‐day blocks and alternated between the Shiloh I and High Winds study plots, with four 5‐day surveys occurring at each study plot each autumn. During each 5‐day survey period, field staff conducted daily fatality surveys at all 24 turbine locations within the study area.

16
2.2.1 Radar Monitoring 2.2.1.1 Radar Equipment The authors deployed a mobile radar laboratory consisting of a marine radar unit mounted on the roof of a van that functioned as both a surveillance and vertical radar. When the antenna was in the horizontal position (that is, in surveillance mode), the radar scanned the area surrounding the lab (Figure 3a) and technicians manually recorded information on flight direction, flight behavior, passage rates, and ground speeds of targets. When the antenna was in the vertical position (that is, in vertical mode), the radar scanned the area in an arc across the top of the lab (Figure 3b) and technicians manually measured flight altitudes of targets with an index line on the monitor. Technicians recorded all data manually on a laptop computer. Gauthreaux (1985a, 1985b) and Cooper et al. (1991) described similar radar laboratories and Harmata et al. (1999) and Mabee et al. (2006c) described similar vertical radar configurations.
The radar (Furuno Model FR‐1510 MKIII; Furuno Electric Company, Nishinomiya, Japan) was a standard marine radar that transmitted at 9.410 GHz (X‐band) through a 2‐meter‐long slotted waveguide (antenna) with a peak power output of 12 kW. The antenna had a beam width of 1.23° (horizontal) × 25° (vertical) and a sidelobe of ±10–20°. Range accuracy was 1% of the maximum range of the scale in use or 30 meters (whichever was greater), and bearing accuracy was ±1°.
The radar could be operated at a variety of ranges (0.5–133 kilometer) and pulse lengths (0.07–1.0 μsec). In this study, technicians used a pulse length of 0.07 μsec while operating at the 1.5‐kilometer range. At shorter pulse lengths, echo resolution is improved (giving more accurate information on target identification, location, and distance), whereas at longer pulse lengths, echo detection is improved (increasing the probability of detecting a target). An echo is a picture of a target on the radar monitor; a target is one or more birds or bats that are flying so closely together that the radar displays them as one echo on the display monitor. The deployed radar had a digital color display with several scientifically useful features, including True North correction for the display screen (to determine flight directions), color‐coded echoes (to differentiate the strength of return signals), and on‐screen plotting of a sequence of echoes (to depict flight paths). Because targets plotted on every sweep of the antenna (that is, every 2.5 seconds) and groundspeed was directly proportional to the distance between consecutive echoes, technicians were able to measure ground speeds of plotted targets to the nearest 5 kilometers/hour with a hand‐held scale.
Energy reflected from the ground, surrounding vegetation, and other solid objects that surrounded the radar unit caused a ground‐clutter echo to appear on the display screen. Because ground‐clutter echoes can obscure targets, technicians minimized their occurrence by elevating the forward edge of the antenna by approximately 15° and by parking the mobile radar laboratory in locations where low hills acted as a “radar fence,” shielding the radar beam from low‐lying objects farther away from the lab and resulting in a reduced amount of ground clutter on the display screen. At both radar stations, the nearby rolling hills served as “fences,” blocking ground clutter in the area. For further discussion of radar fences, see Eastwood (1967), Williams et al. (1972), Skolnik (1980), and Cooper et al. (1991). Maximum target detection distances for surveillance radar depend on radar settings (for example, gain and pulse length),

17
target body size, flock size, flight profile, proximity of targets in flocks, atmospheric conditions, and, to some extent, the amount and location of ground clutter. Larger birds (such as waterfowl, wading birds, cranes, and hawks) usually are detected at distances >2 kilometers, whereas single, small passerines routinely are detected out to 1–1.5 kilometers (Cooper et al. 1991).
2.2.1.2 Radar Data Collection Target Identification.—The term “target,” rather than “flock” or “individual,” is used to describe animals detected by radar, because usually the species composition and size of a flock of birds or bats observed on the radar cannot be determined. Based on the study period and location, as well as visual observations of low‐altitude fliers, it is likely that many of the radar targets observed during this study were individual songbirds, which generally do not migrate in tight flocks (Lowery 1951, Kerlinger 1995, Larkin and Szafoni 2008). It also is likely that a smaller number of targets observed throughout the study period were individual migratory bats. In addition, some larger targets, observed most often during the final month of the study (October), likely represented flocks of migratory waterfowl and other waterbirds.
Differentiating among various targets (for example, birds, bats, and larger insects) is central to any radar study, especially with X‐band radars that can detect small flying animals. The flight speeds of bats and passerines are similar at >6 meters/second (Tuttle 1988, Larkin 1991, Bruderer and Boldt 2001, Kunz and Fenton 2003; Cooper and Day, ABR Inc., unpublished data). Therefore, technicians were unable to distinguish bird and bat targets based solely on flight speeds; however, they were able to distinguish and, where appropriate, exclude foraging bats from the dataset based on their erratic flight patterns.

18
Figure 3. Approximate airspace sampled by Furuno FR–1510 marine radar.
Operating in (a) surveillance mode (antenna in the horizontal orientation) and (b) vertical mode (antenna in the vertical orientation), as determined by field trials with Rock Pigeons (Columba livia).Note that the distribution of the radar beam within 250 meters of the origin (darkened area) was not determined.

19
Eliminating insect targets from the dataset was of primary importance. Technicians reduced insect contamination by (1) omitting small targets (for example, the size of radar gain speckles or approximately 1 millimeter) that only appeared within approximately 500 meters of the radar and targets with poor reflectivity (for example, targets that plotted erratically or inconsistently in locations having good radar coverage), and (2) editing data prior to analyses by omitting surveillance and vertical radar targets with corrected airspeeds <6 meters/second (following Diehl et al. 2003). Analysts based the airspeed threshold on radar studies that determined most insects fly at airspeeds <6 meters/second, whereas birds and bats usually fly at speeds ≥6 meters/second (Tuttle 1988, Larkin 1991, Bruderer and Boldt 2001, Kunz and Fenton 2003).
Sampling Design.—Each radar sampling night consisted of six consecutive 60‐minute sampling sessions, beginning on the quarter hour nearest to 45 minutes after sunset. Each radar sampling session consisted of five consecutive segments:
1. A 10‐minute session to collect weather data and adjust the radar to surveillance mode.
2. A 10‐minute session with the radar in surveillance mode (1.5‐kilometer range) for collection of information on migration passage rates.
3. A 15‐minute session with the radar in surveillance mode (1.5‐kilometer range) for collection of information on groundspeed, flight direction, tangential range (minimal perpendicular distance to the radar laboratory), transect crossed (the four cardinal directions: north, south, east, and west), and the number of individuals (if known).
4. A 10‐minute session to collect weather data and adjust the radar to vertical mode.
5. A 15‐minute session with the radar in vertical mode (1.5‐kilometer range) to collect information on flight altitudes and flight behavior.
To maximize the observed flight speeds of targets, during each vertical radar session the technician oriented the antenna parallel to the main axis of migration based on the modal flight direction observed during the previous surveillance radar session. Analysts could determine true flight speeds of targets only for those targets flying parallel to the antennaʹs orientation, because slower speeds pertain when targets fly at an angle to this plane of orientation. Therefore, observed speeds were minimum estimates of true flight speeds and allowed for conservative selection of bird and bat targets (excluding insects) during analyses of the altitude data (see below). Technicians also examined the flight behavior of vertical radar targets by recording whether targets were ascending from or descending to the ground, ascending or descending at a steep angle above ground (that is, the extrapolated flight path would have intersected the ground on the monitor), or flying at a level altitude.
Twice each hour (at the beginning of each vertical and surveillance session), technicians recorded the following weather data: wind speed, barometric pressure, and air temperature measured with a Kestrel 2500 (KestrelMeters, Sylvan Lake, Michigan) pocket weather meter at approximately 5 meters agl); wind direction measured with a compass; cloud cover estimated to the nearest 5%; ceiling height (1–50, 51–100, 100–150, 151–500, 501–1,000, 1,001–2,500, 2,501–5,000, or >5,000 meters agl); minimum horizontal visibility (0–50, 51–100, 101–500, 501–1,000,

20
1,001–2,500, 2,501–5,000, or >5,000 meters); and precipitation (none, fog, drizzle, light rain, heavy rain, snow flurries, light snowfall, heavy snowfall, sleet, hail). Analysts also obtained 10‐min average wind speeds and directions from sensors situated at approximately 60m agl on meteorological towers located 1.0–3.5 kilometers from each station.
2.2.2 Night-Vision Observations Field crews conducted visual observations with Generation‐3 night‐vision goggles with a 1X eyepiece (Model ATN‐PVS7; American Technologies Network Corporation, San Francisco, CA) concurrently with the 6 hours of nightly radar sampling at each site to assess relative numbers and proportions of birds and bats flying at altitudes ≤150 meters agl (that is, the approximate maximum distance at which passerines and bats could be discerned). During these observations, technicians also documented bird and bat avoidance behaviors near wind turbines.
The research team established the night‐vision observation stations approximately 125 meters from the base of specific turbines enabling the observer to see the entire rotor sweep area in one view. In most cases, observations occurred directly upwind of the turbine so the line‐of‐sight was perpendicular to the plane of the rotor‐swept area, thereby maximizing the viewable rotor‐swept surface area. In 2009, observations occurred at the B14 turbine on the Shiloh I study plot (approximately 400 meters from the radar station) and at the C19 (approximately 180 meters from the radar) and C20 (approximately 260 meters from radar) turbines on the High Winds study plot. In 2010, observations occurred at turbines equipped with acoustic monitoring devices: B8 turbine at Shiloh I (approximately 530 meters from the radar station) and C22 turbine at High Winds (approximately 600 meters from the radar station). Night‐vision sampling consisted of 50‐minute sessions each hour of the 6‐hour nightly survey period. Technicians used digital voice recorders to record information in the field and then later transcribed the results to computer databases on a daily basis.
Technicians used two 10 million‐Cp spotlights with infrared lens filters to illuminate targets flying overhead while eliminating the attractiveness of the light to insects, birds, and bats. The set‐up included one fixed spotlight placed next to the observer with the beam oriented toward the center of the turbine hub, while the observer used a second handheld light to track and identify potential targets flying through the spotlight beams. During each session, the observer recorded information on rotor activity, estimated vertical visibility limits, and estimated the abundance of large insects. For each bird or bat detected visually, they recorded the taxon to species whenever possible, the number of animals in groups, flight direction to the nearest ordinal or cardinal direction, flight altitude estimated in meters, flight behavior (for example, straight‐line, erratic, circling, zigzag [bats only], or non‐linear [birds only]), and reactions of individuals to turbines. To qualify as a reaction, the target had to pass within the immediate area of the turbine (an imaginary cylinder of airspace 100 meters in diameter and up to 125 meters agl surrounding the turbine and rotor‐swept area). Once an observer detected a target within this area, they recorded whether the target (1) did not react (that is passed over, under, or through the turbine blades, but did not alter its overall flight direction), (2) reacted (that is, avoided a collision by altering its overall flight path), or (3) collided with the tower or turbine blades. Whenever possible, observers classified bats as small or large in an attempt to

21
discriminate larger bats (for example, hoary, western red, big brown, and silver‐haired) from smaller species (for example, Myotis spp.), and they typically classified birds based upon size, shape, and wing beat patterns.
2.2.3 Acoustic Monitoring To assess bird and bat movements through the sample plots using acoustical data, the research team established eight randomly located acoustic monitoring stations within the site plots, four at Shiloh I and four at High Winds. At each site, three monitoring stations were installed on wind turbines, and one was installed on the nearest meteorological station within the sampling radius. They equipped each station with a low‐frequency‐sensitive Electret condenser K6P‐C / ME62 Sennheiser microphone for birds and a high‐frequency‐sensitive Electret ultrasound Sennheiser P48 microphone for bats. Because low frequency microphones are sensitive to noise generated by wind, the investigators fitted microphones with an MZW 64‐ PRO foam wind screen. All microphones attached at a northerly bearing on each tower and at a nearly horizontal position in an upside down “Y” ABS waste pipe sealed at the top for protection against inclement weather. Each housing was secured to the tower with a 3/8 inch nylon rope tied around the circumference of the tower. The investigators located bird microphones at approximately 3 meters agl and bat microphones at approximately 30 meters agl (Kunz et al. 2007). An E‐MU Tracker Pre Bus‐powered Audio Interface using Avisoft‐SASLab Pro, Version 4.52, (Avisoft Bioacoustics, Berlin, Germany) software recorded the sounds received through the microphones using the multi‐channel triggering hard‐disk recording system that included an Aspire One D250‐1326 Acer laptop computer. Each station operated every night from 2000 to 0800 H throughout the two autumn study periods, with the data automatically downloaded and stored to a 320‐GB external drive. In 2010, grazing cattle damaged one of the four acoustic monitoring stations at the Shiloh I plot, which the research team then replaced with a single SD1 ANABAT (Titley Electronics, Australia) unit with an Anabat standard microphone secured at a height of 5 meters. Analysts used Avisoft‐SASLab Pro (and AnalookW for the SD1 bat detector) sound analysis and synthesis software to identify recorded bird and bat calls to species whenever possible.
2.2.4 Carcass Searches Field crews conducted carcass surveys at each turbine within the selected sample plot within 24 hours after each nocturnal survey night. Carcass searches occurred on 38 days in fall 2009 and on 40 days in fall 2010.
The first survey day of each 5‐day survey period was considered a “clearance” survey. In 2009, surveyors marked all carcasses found during clearance surveys and left them in place for the duration of the survey season, whereas in 2010 they removed all such carcasses so that the only carcasses found during subsequent survey days were those killed during the survey period. On each of the subsequent four survey days, surveyors recorded all new carcasses and all resighted carcasses, and always left all carcasses found during non‐clearance survey days in place for the duration of the survey period in which they were discovered to provide a means of tracking carcass removal rates. Survey periods were separated by intervals ranging from nine to 16 days.

22
Surveys began at sunrise and continued until all turbines within the sample plot were surveyed. Each morning the crew randomly selected a turbine to serve as the starting location and then proceeded systematically through the rest of the sample plot. Search areas encompassed a 60‐meter‐radius area around each turbine, delineated using a pre‐measured cable, and marked around the perimeter and along each cardinal direction out from the turbine base with wooden stakes and surveyor chalk or paint. Surveys then consisted of walking parallel linear transects spaced every 6 meters and extending from one edge to the other of the circular plot, resulting in 20 transects per turbine and 100% coverage of each sample plot.
Survey crews consisted of two teams of three observers each, each of which covered a randomized sequence of 12 turbines per survey day. Survey teams generally remained consistent within years, although occasional substitutions did occur, and team leaders remained consistent between years. For each turbine surveyed, two individuals performed carcass searches while the third person recorded data, took GPS locations, photographed any carcasses found, and assisted in keeping the carcass surveyors on their transects. Crews rotated duties within teams on a regular basis throughout each survey day. Observers searched for carcasses at a steady pace of 2 mph (approximately 1 meters/s). For each new carcass found, observers assigned a unique incident number and recorded time, turbine ID number, taxon (bat or bird), species code, age and sex when possible, file numbers of any photos taken, UTM coordinates using handheld GPS devices accurate to ±3–4 meters, carcass condition, and any relevant notes. In 2010, for each survey observers also classified and recorded the substrate under each turbine. After recording data, observers tagged each newly discovered carcass with black electrical tape inscribed with the incident number in silver permanent ink to facilitate proper recording of resighting data during subsequent surveys.
2.2.5 Detectability Bias Assessments We conducted multiple detectability bias assessments at each sample plot during both survey years to derive correction factors necessary to adjust fatality estimates to account for carcasses missed by observers. Bias trials occurred at least once during each of the four sampling periods each year, with each trial encompassing one randomly selected turbine per survey team. Five such assessments occurred in 2009 and four in 2010, which resulted in detectability estimates specific to each sampling period. Each trial involved random placement of 2–4 carcasses per turbine and recording the number of carcasses recovered by each survey team. With state and federal salvage permits, we used a variety of moribund passerines and bats recovered from local bird observatories and other sources, most of which were small and cryptic against plowed fields, to provide a conservative measurement of observer bias. Assessment teams recorded GPS coordinates and bearings and distances from turbine bases for each randomly placed carcass to facilitate relocation of undetected carcasses after each bias trial. All test carcasses were removed directly after each bias trial. Analysts used detectability estimates for each sampling period to adjust the fatality estimates derived from the raw carcass counts (Morrison 2002).

23
2.2.6 Data Processing and Analyses 2.2.6.1 Radar Data Technicians manually entered all radar data into MS Access databases and saved a digital recording of the radar screen for each night. They checked data files visually for errors after each night and then checked them again electronically for irregularities at the end of each field season prior to data analyses. Analysts conducted all radar analyses using SPSS Version 18.0 (SPSS, Inc., Chicago, IL) and the authors considered statistical results significant if P ≤ 0.05 and report all resulting data as means ± standard error (SE).
Analysts did not correct radar data for differences in detectability with distance from the radar unit. Correcting for differences in target detectability is confounded by several factors, including but not limited to the following: (1) variation in target size (reflecting different species or species groups) across the study period; (2) an assumption that there is an equal distribution of targets throughout the sampling area (which would be violated if migrants responded to microsite features on the landscape); (3) variation in the shape and size of the effective radar‐sampling beam (see preliminary assessment of the shape of the radar beam under one set of conditions in Figure 3). Thus, readers should regard passage‐rate estimates (and other estimates derived from passage rates) as indices of the actual number of birds and bats passing through the area, which are useful for comparisons with previous studies only if those researchers used similar equipment and methods.
Analysts computed airspeeds (that is, groundspeed corrected for wind speed and relative wind direction) of surveillance‐radar targets using the formula:
)cos(222 θwgwga VVVVV −+=
where Va = airspeed, Vg = target groundspeed (as determined from the radar flight track), Vw = wind velocity at 60 meters agl, and θ is the difference between the observed flight direction and the direction of the wind vector (Mabee et al. 2006). Analysts deleted from all analyses radar targets that had corrected airspeeds <6 meters/s, corresponding to insects (21% of targets at both sites in 2009; 28% and 33% of targets at Shiloh I and High Winds, respectively, in 2010).
Analyses of flight‐direction data followed procedures for circular statistics (Zar 1999) using Oriana v. 2.0 (Kovach Computing Services, Anglesey, Wales, United Kingdom). In addition to presenting seasonal mean and median directions, the authors report the dispersion of radar‐target flight directions in terms of both the circular standard deviation (CSD) and the mean vector length (r), which varies from a value of 0 (maximum dispersion) to 1 (maximum concentration).
The authors report migration passage rates as means ± SE in units reflecting the number of targets passing along 1 kilometer of migratory front per hour. Analysts derived estimates of passage rates of targets flying at ≤125 meters agl for each hourly period by multiplying passage rates recorded from surveillance radar by the percentage of targets on vertical radar having flight altitudes of ≤125 meters agl, while correcting for the hypothetical maximum height of the surveillance radar beam (861 meters agl). The authors present all flight‐altitude data in meters agl relative to a horizontal plane passing through the radar‐sampling site. Actual mean altitudes

24
may have been higher than those reported because an unknown number of birds and bats may have flown above the 1.5‐kilometer range limit of the radar system (Mabee and Cooper 2004).
For calculations of daily patterns in migration passage rates and flight altitudes, and to avoid splitting sampling nights by date, analysts assumed that a sample day began at 0700 H on one day and ended at 0659 H the next day. To compare passage rates and flight altitudes among hours of the night for nights with data collected during all six hourly sessions, analysts used SPSS Version 18.0 (SPSS, Inc., Chicago, IL) to conduct a repeated‐measures ANOVA with the Greenhouse‐Geisser epsilon adjustment for degrees of freedom as necessary for non‐orthogonal data. Factors that decreased the sample size of various summaries and analyses included insect and precipitation data. Sample sizes, therefore, sometimes varied among the different summaries and analyses.
Effects of Weather on Target Passage Rates and Flight Altitudes.—For this purpose, the authors selected an analytical approach that involved use of linear mixed models and treatment of nights as subjects and hourly sessions within a night as repeated measures. This treatment of the data allowed the full use of hourly sessions while properly modeling the appropriate covariance structure for this variable. Because the hourly sessions within a night were correlated temporally, analysts used a first‐order autoregressive structure with heterogeneous variances for the covariance structure for both the passage‐rate and flight‐altitude models.
Prior to model specification, analysts examined the data for redundant explanatory variables (Spearman’s rank correlations >0.70) and retained seven parameters for inclusion in the passage rate model set and six parameters in the altitude model set. For both years, analysts considered 22 potential models for explaining variation in passage rates and 13 models for flight altitudes (Appendix A). These included global models containing all potential explanatory variables and subset models representing potential influences of the following variables:
1. Wind direction, wind speed, and a relevant interaction term.
2. A synoptic weather variable reflecting the position of pressure systems relative to the study site, classified based on Gauthreaux (1980) and Williams et al. (2001), but modified to reflect pressure system movements along the Pacific Coast. The classification reflected the position of the study site relative to high‐pressure systems: (1) situated east or southeast of a high pressure system, (2) no well‐developed pressure system nearby, and (3) situated west of a high‐pressure system (Figure 4).
3. Number of days since the last tail wind (that is, favorable migration conditions; used only in passage rate models).
4. Percent of the moon illuminated and visible on a given night, reflecting the interaction of percent moon illumination and cloud cover.
5. Julian date.
Cloud ceiling height was another variable of potential interest; however, during both study seasons this metric varied little and was consistently high (>501 meters agl), so analysts excluded this variable from the analyses.

25
Analysts modeled the hourly influence of weather and date separately on the two dependent variables. Based on data from the meteorological towers located in the project areas and excluding periods of calm winds (0–2.1 meters/s), the overall average wind speed during the study was ≥2.2 meters/second (≥5 mph) and wind directions could be categorized as: tail winds WNW–ENE (293–068°), head winds ESE to SSW (113–248°), eastern crosswinds (069–112°), western crosswinds (249–292°), and calm.
Analysts examined plots of the original radar data and residuals to ensure that variables met assumptions of analyses (that is, linearity, normality, collinearity) and did not contain presumed outliers (>3 SE). They used a square‐root transformation to normalize both the passage‐rate and flight‐altitude data from 2009 and the passage rate data from 2010, but used a natural‐log transformation to normalize the 2010 flight‐altitude data.
Because in both years the number of sampling sessions across both stations was small (n = 240 in 2009; n = 241–242 in 2010) relative to the number of parameters (K) in many models (that is, n/K < 40), analysts used Akaike’s Information Criterion corrected for small sample size (AICc) to guide model selection (Burnham and Anderson 2002). They ranked all candidate models according to their AICc values, considered the best‐approximating or most‐parsimonious model to be that model having the smallest AICc, and drew primary inference from all models for which ΔAICc was <2 (also acknowledging, however, that models with ΔAICc values between 4 and 7 also may have some empirical support; Burnham and Anderson 2002). Analysts also calculated Akaike weights (wi) to determine the weight of evidence in favor of each model (Burnham and Anderson 2002).
2.2.6.2 Night Vision Data Analysts checked all night‐vision datasets electronically for irregularities at the end of each field season and prior to analyses. Adopted standards included excluding all sessions with estimated visibility <100 meters; however, this was never the case during the study. Analysts estimated movement rates of birds and bats as individuals observed per hour. Analyses of flight direction excluded birds and bats exhibiting non‐linear flight behaviors to eliminate individuals displaying local movements and foraging activities rather than migratory movements. Because flight directions were recorded categorically (as ordinal or cardinal directions), the authors report only median (rather than mean) directions based on these data.
2.2.6.3 Turbine Passage Rate Index To describe migration passage rates within the potential turbine area, the authors developed a turbine passage rate index (an estimate of the number of nocturnal migrants flying within the turbine area per night of the study period). Analysts calculated this index from several component parameters, including: (1) passage rates of targets ≤ 125 meters agl; (2) mean flock sizes (birds/target; estimated from night‐vision observations); (3) turbine area that migrants would encounter when approaching turbines from the side (parallel to the plane of rotation) or from the front (perpendicular to the plane of rotation); and (4) number of hours of migration/night (estimated as the mean number of hours of darkness for the season).

26
Figure 4. Synoptic weather codes used to depict the position of study sites in the Montezuma Hills Wind Resource Area relative to a high-pressure system.
Code 1 = study site situated to the east or southeast of a high-pressure system. Code 2 = no well-developed pressure system near the study site (not visually depicted). Code 3 = study site situated to the west of a high-pressure system.
Analysts combined these factors as described in Appendix B to produce the turbine passage‐rate index.
The authors consider these estimates to be indices because they are based on several simplifying assumptions that may vary among projects. The assumptions for this study include: (1) the lower boundary of the estimate assumes that all migrants approached turbines parallel to the plane of rotation of the blades (that is, all encounter the side profile), whereas the upper boundary assumes that all flight directions are perpendicular to the plane of rotation (that is, all encounter the front profile), (2) a worst‐case scenario of the rotor blades turning constantly (that is, we used the entire rotor‐swept area, not just the area of the blades themselves), and (3) an average of 10 nocturnal h/d of migration during the fall migration period.

27
2.2.6.4 Relationships Among Fatality Estimates, Passage Rate Indices, and Environmental Variables
The authors used initial Pearson correlation analyses followed by application of general linear model (GLM) analyses to evaluate whether numbers of bird and bat fatalities were related to (1) spatial and temporal variables, (2) weather variables, (3) radar data, and (4) night‐vision data. Spatial and temporal variables included Site (High Winds or Shiloh I), Sampling Year, and Julian Date (evaluated using up to fourth‐order polynomials in GLM analyses).
Weather variables included three metrics derived from hourly readings recorded at meteorological towers located on the High Winds and Shiloh I sites, with nightly averages calculated for the period from ½ hour after sunset to ½ hour before sunrise. These included average wind speed (kilometers per hour), average direction from which the wind was blowing calculated using methods for circular statistics and Oriana software, and average temperature (°C). Analysts also considered several synoptic variables derived from hourly weather data recorded roughly 16 kilometers away at Travis Air Force Base in Fairfield (available through the National Climatic Data Center, http://www.ncdc.noaa.gov/oa/climate/climatedata.html#surface). These included average cloud ceiling height (kilometers), visibility (kilometers), and barometric pressure (hPa; sea level equivalent) calculated for each night. To compile a full barometric pressure dataset, analysts combined 2009 data from Travis AFB with 2010 data from the Nut Tree Airport station near Vacaville (approximately 24 kilometers from the project area), then calculated two trend indices reflecting 3‐day and 7‐day net changes in the average pressure readings.
Radar variables included the total number of targets recorded each night, the average altitude of all targets, the average flight direction of all targets calculated using methods for circular statistics, and the average passage rate of targets at altitudes below 125 meters agl. Due to incomplete radar data for four nights (1 case in 2009 and 2 cases in 2010 at Shiloh I, and 1 case in 2010 at High Winds), all analyses that included consideration of these variables included four fewer nightly survey records than all other analyses.
Night‐vision variables included the number of birds and bats recorded each night, the number of birds recorded each night, the number of bats recorded each night, the average flight direction of all birds and bats, and the average flight altitude of all birds and bats classified into four categories: <50 meters, 50–100 meters, 100–150 meters, and 150–200 meters agl.
To guard against model overfit and spurious results given modest sample sizes, analysts employed a hierarchical approach to developing and testing GLMs. The approach allowed for first identifying and controlling for environmental factors that affect fatality rates, before seeking to evaluate relationships between fatality rates and the activity indices derived from nocturnal‐radar and night‐vision monitoring. Analysts adhered to the following five‐step process:
1. Develop a statistical model to evaluate relationships between the number of fatalities and relevant spatial (Site) and temporal (Year and Julian date) variables.
2. Develop a statistical model to evaluate relationships between fatalities and weather variables, while retaining significant spatial and temporal variables identified in Step 1.

28
3. Develop a statistical model to evaluate relationships between fatalities and activity indices from radar observations, while retaining significant spatial, temporal, and weather variables identified in Steps 1 and 2.
4. Develop a statistical model to evaluate relationships between fatalities and activity indices from night‐vision observations, while retaining significant spatial, temporal, and weather variables identified in Steps 1 and 2.
5. Selectively evaluate the effect on model fit of including important radar and night‐vision variables in the same model, along with important spatial, temporal, and weather variables.
At each step, analysts used a backwards stepwise approach for evaluating individual explanatory variables, and retained in the final models all variables for which relevant tests confirmed significance at P ≤ 0.10.
Analysts developed statistical models for eight dependent variables:
1. Unadjusted number of all bird fatalities.
2. Number of all bird fatalities adjusted for variation in observer detectability among survey periods.
3. Presence/absence of night‐migrant bird fatalities.
4. Unadjusted number of all bat fatalities.
5. Number of all bat fatalities adjusted for variation in observer detectability among survey periods.
6. Unadjusted number of fatalities of Mexican free‐tailed bats.
7. Number of fatalities of Mexican free‐tailed bats adjusted for variation in observer detectability among survey periods.
8. Presence/absence of fatalities of tree‐roosting bats (mostly hoary bats).
Analysts modeled fatalities representing night‐migrating birds and tree‐roosting bats using logistic regression (Systat 11.0, Systat Software, Inc., Chicago, IL) and presence/absence binomial response variables (3) and (8), because there were few surveys during which more than one carcass of these species was found. For all remaining dependent variables, analysts began by fitting Poisson GLMs (R v 2.12.2, R Foundation for Statistical Computing, Vienna, Austria) in Step 1 above, derived best‐fit models, and then tested each for overdispersion (McCullagh and Nelder 1989, Zuur et al. 2009). For dependent variables (1) and (4)—unadjusted all‐bird and all‐bat fatalities—overdispersion was low (φ = 1.04 and 1.2, respectively) and close enough to 1 to conclude that a Poisson response model was appropriate. For dependent variable (6)—unadjusted Mexican free‐tailed bat fatalities—overdispersion was moderate (φ = 1.6), which warranted application of a quasi‐GLM approach, which corrects the standard errors and renders the variance equal to the product of the overdispersion parameter and the mean. For dependent variables (2), (5), and (7)—adjusted all‐bird, all‐bat, and Mexican free‐tailed bat fatalities—overdispersion was high enough (φ = 2.8, 3.7, and 5.0, respectively) to warrant use of a negative‐binomial GLM.

29
After fitting appropriate models based on the above procedures, analysts further evaluated the fit of final models using analysis of deviance tests to assess significance of individual variables in Poisson GLMs and Poisson quasi‐GLMs, and log‐likelihood ratio tests to assess significance of individual variables in negative binomial GLMs (Zuur et al. 2009). If a test indicated that a variable was not significant (P > 0.10), analysts dropped that variable from the model. Analysts used Hosmer‐Lemshow goodness of fit tests to assess the fit of logistic regression models (Hosmer and Lemeshow 1989).
2.2.6.5 Spatial Analyses Besides considering Site as a factor in the GLM analyses presented above, the authors assessed the spatial distribution of fatalities in three ways.
First, they compared the distribution of fatalities among turbines in both study areas by calculating coefficients of dispersion (CD = variance / mean) based on the number of fatalities observed at each turbine, where CD = 1 equates to a Poisson random distribution, CD < 1 reflects an under‐dispersed or more uniform distribution (with 0 indicating no variation—a perfectly uniform distribution), and CD > 1 reflects an over‐dispersed or clumped distribution (for example, see Perry and Meade [1979] for analogues for assessing spatial variation in plant distributions). Common practice suggests that values deviating ≥50% from 1 are indicative of a noteworthy deviance from a Poisson random distribution for modeling purposes. The authors also used Kolmogorov‐Smirnoff one‐sample nonparametric tests to evaluate statistically whether the observed fatality distributions differed from a Poisson random distribution, with means equal to that of the actual data (Systat 11, Systat Software, Inc., Chicago, Illinois). Although the turbines generally were evenly spaced within strings, this analysis assumed that each fatality was associated with a single turbine and ignored the actual distance between turbines and fatalities.
Second, they used the Hot Spot analysis routine in ArcGIS 9.3 (ESRI, Inc., Redlands, CA) to quantify the degree to which fatalities were spatially clustered among turbines. This analysis calculated a Getis‐Ord Gi* statistic (a z‐score, which equates to the number of standard deviations away from the mean that a specific value lies) and P‐value for each turbine in the dataset based on the number of fatalities recorded at each turbine and a nearest‐neighbor type evaluation of distances to other turbines with documented fatalities. In presenting the results of this analysis, the authors describe locations with statistically significant positive z‐scores as fatality “hot spots” and the larger the z‐score the more substantial the spatial clustering of fatalities in the area of the given turbine. Conversely, they describe locations with statistically significant negative z‐scores as fatality “cold spots” and the more negative the z‐score the more isolated the given turbine and associated fatalities. Further, they distinguish “moderate” hot or cold spots where 0.01 < P ≤ 0.05 and “strong” hot or cold spots where P ≤ 0.01.
Third, they analyzed relationships between fatalities and habitat features using data from both years combined, as well as supplemental fatality data from studies conducted at the same locations by Kerlinger et al. (2006, 2009). They used Oriana software to calculate Rayleigh tests for circular uniformity (Z) and Rao’s spacing (U) values to assess relationships between fatality locations and the distances and directions to the nearest eucalyptus groves and riparian patches.

30
CHAPTER 3: Results 3.1 Detection of Nocturnal Birds and Bats 3.1.1 Radar The authors obtained useable radar data on 41 nights (21 at Shiloh I and 20 at High Winds) during both the 2009 and 2010 autumn study periods.
3.1.1.1 Flight Directions The predominant flight direction of radar targets was easterly in both years at both sites (Figure 5). Flight directions were slightly more variable at Shiloh I and during the second year of the study. In 2009, the average flight direction of radar targets was 83° at Shiloh I (median = 78°, CSD = 56°, r = 0.62) and 104° at High Winds (median = 103°, CSD = 34°, r = 0.84). In 2010, the averages were 113° at Shiloh I (median = 108°, CSD = 66°, r = 0.52) and 104° at High Winds (median = 105°, CSD = 44°, r = 0.74).
3.1.1.2 Flight Altitudes During the 2009 survey season, the mean flight altitude of radar targets was lower at Shiloh I (409 ± 5 meters agl, n = 19 nights) than at High Winds (467 ± 4 meters agl; n = 21 nights, t = ‐2.07, P = 0.046), with a similar pattern for median values (379 vs. 415 meters agl, respectively). In all cases, however, the means and median values were well above the rotor swept area of turbines. Mean flight altitudes also varied among survey nights (Figure 6) and portions of the season (Appendix C), with nightly means ranging from 261–596 meters agl at Shiloh I and 318–567 meters agl at High Winds. At both sites, more than half (53–56%) of the targets passed at altitudes of 200–500 meters agl (Table 2). The proportion of targets that flew below 200 meters agl was twice as high at Shiloh I (18%) than at High Winds (9%); however, only 5% of targets observed at Shiloh I and 2% of targets observed at High Winds flew at altitudes ≤125 meters agl (that is, within or below the approximate rotor swept area of the turbines at both locations; Appendix D). Average flight altitudes did not differ among hours within nights at Shiloh I (F2.7, 41.0 = 0.14, P = 0.92, n = 16 nights) or at High Winds (n = 18 nights, F3.1, 51.9 = 0.42, P = 0.74; Figure 7). At Shiloh I, 84% of all targets exhibited level flight, 5% ascending flight, and 11% descending flights. A similar pattern was evident at High Winds: 85% level, <1% ascending, and 15% descending.

31
Figure 5. Flight directions of radar targets (birds and bats).
At the Shiloh I and High Winds study sites during autumn in 2009 and 2010 in the Montezuma Hills Wind Resource Area, Solano County, California.

32
Figure 6. Nightly flight altitudes (mean ± SE in meters agl) of radar targets (birds and bats).
During autumn migration in 2009 and 2010 at the Shiloh I and High Winds study sites in the Montezuma Hills Wind Resource Area, Solano County, California. Note that only dates sampled are shown.

33
Table 2. Nocturnal flight altitudes of radar targets (percent of all targets).
Fall 2009 Fall 2010 Flight
Altitude Shiloh I
(n =2,353 targets) High Winds
(n = 4,308 targets) Shiloh I
(n = 4,128 targets) High Winds
(n = 2,222 targets) (meters
agl) Per
Category Cumulativ
e Per
CategoryCumulativ
e Per
CategoryCumulativ
e Per
Category Cumulativ
e 1–100 2 2 1 1 3 3 2 2
101–200 16 18 8 9 12 15 13 16 201–300 18 36 19 28 14 29 19 34 301–400 18 54 20 47 15 44 16 50 401–500 17 71 17 65 14 58 12 62 501–600 12 83 12 77 13 72 9 71 601–700 8 91 8 84 11 82 8 79 701–800 4 94 6 90 6 88 5 84 801–900 2 97 4 93 4 92 5 89
901–1,000 2 98 3 96 3 95 3 92 1,001–1,100
1 99 2 97 2 96 3 95
1,101–1,200
1 100 1 99 2 98 3 98
1,201–1,300
0 100 1 99 1 99 1 99
1,301–1,400
0 100 1 100 1 100 1 100
1,401–1,500
0 100 0 100 0 100 0 100
Detected at the 1.5-kilometer range during autumn migration seasons in 2009 and 2010 at the Shiloh I and High Winds study sites in the Montezuma Hills Wind Resource Area, Solano County, California.

34
Figure 7. Mean flight altitudes (±SE) of radar targets (birds and bats).
During consecutive night-time hours sampled during autumn migration in 2009 and 2010 at the Shiloh I and High Winds study sites in the Montezuma Hills Wind Resource Area, Solano County, California.

35
During the 2010 survey season, the mean flight altitudes of radar targets recorded at the two sites matched (479 ± 4 meters agl at Shiloh I and 479 ± 6 meters agl at High Winds); however, the median value was higher at Shiloh I (440 vs. 401 meters agl). As in 2009, flight altitudes in 2010 varied among survey nights (Figure 6) and portions of the season (Appendix C), with nightly means ranging from 309–704 meters agl at Shiloh I and from 205–764 meters agl at High Winds. Flight altitudes of targets observed in 2010 were more variable than in 2009. Although slightly lower proportions than in 2009, still more than 40% of recorded flight altitudes (43% at Shiloh I and 47% at High Winds) were between 200–500 meters agl in 2010 (Table 2). Unlike in 2009, at both sites similar proportions of targets flew below 200 meters agl (approximately 15%) and below 125 meters agl (approximately 5%) in 2010 (Appendix D). Similar to 2009, mean flight altitudes in 2010 did not differ among hours within nights at Shiloh I (n = 20 nights, F2.9, 54.9 = 1.18, P = 0.32) or at High Winds (n = 18 nights, F2.1, 35.5 = 0.64, P = 0.54; Figure 7). In 2010 at both sites, >95% of all targets exhibited level flight, with most remaining targets observed descending in altitude.
3.1.1.3 Passage Rates In 2009, mean nocturnal passage rates as determined by surveillance radar were lower at Shiloh I (326 ± 21 targets/kilometer/hour, n = 21 nights) than at High Winds (448 ± 22 targets/kilometer/hour, n = 20 nights; t39 = 3.93, P < 0.001). For targets flying at ≤125 meters agl, however, estimated mean passage rates were 16 ± 5 targets/kilometer/hour at Shiloh I and 10 ± 2 targets/kilometer/hour at High Winds. Mean overall nightly passage rates (Figure 8) and passage rates at ≤125 meters agl (Figure 9) fluctuated extensively across the survey season (Appendix C). Mean hourly passage rates greater than 1 SD above the mean occurred on 4 nights (19% of nights sampled) at Shiloh I and on 5 nights (25%) at High Winds. The highest mean nightly passage rates occurred on 26 September at Shiloh I (506 targets/kilometer/hour) and on 6 October at High Winds (639 targets/kilometer/hour). Passage rates did not differ among hours of the night at Shiloh I (n = 19, F3.0, 54.5 = 2.14, P = 0.11); however, variation among sampling hours was significant at High Winds (n = 19, F3.8, 68.4 = 7.25, P < 0.001), with the highest passage rates occurring 2 hours after sunset and decreasing during the final two sampling hours of the night (Figure 10).
In contrast to 2009, in 2010 the average passage rate at Shiloh I (454 ± 47 targets/kilometer/hour, n = 21 nights) was higher than at High Winds (371 ± 32 targets/kilometer/hour, n = 20 nights), but the difference was not statistically significant (t39 = ‐1.46, P = 0.15). Similar to 2009, in 2010 the estimated passage rate for targets flying at ≤125 meters agl was more than 50% higher at Shiloh I (27 ± 5 targets/kilometer/hour) than at High Winds (14 ± 3 targets/kilometer/hour). Also similar to 2009, mean nightly passage rates varied extensively among nights (Figures 8, 9) and sampling periods during 2010 (Appendix C). In 2010, mean hourly passage rates greater than 1 SD above the mean occurred on 5 nights (25% of nights sampled) at Shiloh I and on 1 night (5%) at High Winds. The highest mean nightly rates were recorded on 26 October (947 targets/kilometer/hour) at Shiloh I and on 1 September (753 targets/kilometer/hour) at High Winds. Passage rates did not differ among hours of the night during fall 2010 at either site (Shiloh I: n = 20, F3.1, 58.0 = 2.48, P = 0.07; High Winds: n = 20, F3.2, 61.6 = 2.03, P = 0.11; Figure 10).

36
To provide additional perspective, the authors scaled estimates of radar‐target passage rates to a per turbine per night basis. Recall that estimated passage rates at ≤125 meters agl were higher at both sites in 2010 and in both years were higher at Shiloh I than at High Winds. Given the turbine dimensions for the sites and depending upon the orientation of rotors relative to flight directions, the authors estimated that nightly averages of 0.9–6.3 radar targets passed through the rotor swept area of each turbine on the Shiloh I study site during 2009, with the estimate rising to 1.5–10.5 targets/turbine/night in 2010. The comparative values for the High Winds study area were 0.5–4.1 targets in 2009 and 0.7–5.6 targets in 2010.
3.1.1.4 Effects of Weather on Target Passage Rates and Flight Altitudes Fall 2009 Passage Rates.—The best model contained date and the interaction of lunar illumination and cloud cover (Table 3). This model contained a significant positive association with date (Table 4), indicating that passage rates were higher later in the 2009 season. The second‐best model was the global model containing variables for date, the interaction of lunar illumination and cloud cover, wind direction, and wind speed. The weight of evidence in favor of the “best” model (wbest/wsecond best) was >1.3 times that of the second‐best model (Burnham and Anderson 2002). The complete passage‐rate model set and associated statistical metrics can be found in Appendix E.
Fall 2009 Flight Altitudes.—The best‐approximating model contained wind direction and the interaction of lunar illumination and cloud cover (Table 3). The second‐best model contained only wind direction. The best model contained a negative association with western crosswinds (Table 4), indicating that flight altitudes decreased during western crosswinds. The weight of evidence in favor of the “best” model was again 1.3 times that of the second‐best model.
Fall 2010 Passage Rates.—The best‐approximating model contained variables representing the interaction between wind direction and wind speed and the interaction between lunar illumination and cloud cover (Table 3). The second‐best model contained variables for favorable migration, the interaction between lunar illumination and cloud cover, and the interaction between wind direction and wind speed. The best model contained a negative association with the interaction of western crosswinds and wind speed, indicating that passage rates decreased as westerly winds diminished, and a positive association with the interaction of lunar illumination and cloud cover, indicating that passage rates increased during periods of increased lunar illumination and decreased cloud cover (Table 4). The weight of evidence in favor of the “best” model was 2.9 times that of the second‐best model.
Fall 2010 Flight Altitudes.—The best‐approximating model contained wind direction and date and the second‐best model contained only wind direction (Table 3); however, no significant associations were indicated (Table 3).

37
Figure 8. Mean (± SE) nightly passage rates of radar targets (birds and bats).
During fall 2009 and 2010 at the Shiloh I and High Winds study sites in the Montezuma Hills Wind Resource Area, Solano County, California. Only dates sampled are shown.

38
Figure 9. Mean (± SE) nightly passage rates below 125 meters agl.
During fall 2009 and 2010 at the Shiloh I and High Winds study sites in the Montezuma Hills Wind Resource Area, Solano County, California. Only dates sampled are shown. Asterisks (*) denote nights not sampled because of rain.

39
Figure 10. Percent of total nightly passage rates (±SE) of radar targets (birds and bats).
Relative to sampling hour during fall 2009 and 2010 at the Shiloh I and High Winds study sites in the Montezuma Hills Wind Resource Area, Solano County, California.

40
Table 3. Linear mixed model estimates from competitive models (ΔAICc ≤2) explaining the influence of weather variables on passage rates (surveillance radar) and flight altitudes (vertical
radar) of radar targets.
Analysis/Model -2 Log Likelihood 1 K 2 AICc 3 ΔAICc 4 wi 5
Fall 2009
Rates (n = 240 sessions) Lunar illumination*cloud cover + date 1237.27 12 1262.64 0 0.32
Wind direction*wind speed + lunar illumination*cloud cover + date
1226.50 17 1263.26 0.62 0.24
Global: wind direction + wind direction*wind speed + favorable migration(d) + lunar
illumination*cloud cover + synoptic + date 1219.54 20 1263.37 0.73 0.22
Flight altitudes (n = 240 sessions) Wind direction + lunar illumination*cloud cover 882.34 13 909.95 0 0.36
Wind direction 889.54 10 910.51 0.56 0.27
Fall 2010
Rates (n = 242 sessions) Wind direction*wind speed + lunar
illumination*cloud cover 1313.31 16 1347.73 0 0.53
Flight altitudes (n = 241 sessions) Wind direction + date -147.78 11 -124.63 0 0.41
Wind direction -144.15 10 -123.20 1.44 0.201 Calculated with the Maximum Likelihood method. 2 Number of estimable parameters in approximating model (see methods for explanation). 3 Akaike’s Information Criterion corrected for small sample size. 4 Difference in value between AICc of the current model versus the best approximating model with the minimal AICc value. 5 Akaike weight—probability that the current model (i) is the best approximating model among those being considered. During fall 2009 and fall 2010 at the Shiloh I and High Winds study sites in the Montezuma Hills Wind Resource Area, Solano County, California. Model weights (wi) were based on Akaike’s Information Criterion (AIC).

41
Table 4. Model-averaged parameter estimates from competitive models (ΔAICc ≤2) explaining the influence of of weather variables on passage rates (surveillance radar) and flight altitudes (vertical
radar) of radar targets.
Analysis/parameter β SE 1 Fall 2009 2
Passage Rates Intercept 20.009 3.284*
Wind direction = western crosswind*wind speed 0.304 0.303 Wind direction = western crosswind -2.096 2.441
Wind direction = tailwind or calm *wind speed 0.657 0.397 Wind direction = tailwind or calm -4.992 2.656
Wind speed -0.591 0.304 Synoptic Weather = (S to E of a high pressure system) -1.377 0.728
Synoptic Weather = (no nearby pressure system) 1.404 1.084 Lunar illumination*cloud cover -0.008 0.033
Lunar illumination 0.802 0.827 Favorable migration (d) 0.004 0.035
Date 0.100 0.036* Cloud cover -0.042 0.014*
Flight Altitudes Intercept 21.236 0.965*
Wind direction = western crosswind*wind speed -0.021 0.165 Wind direction = western crosswind -1.248 0.583*
Wind direction = tailwind or calm *wind speed -0.015 0.211 Wind direction = tailwind or calm -0.037 0.752 Lunar illumination*cloud cover 0.021 0.017
Lunar illumination 0.354 0.468 Cloud cover -0.017 0.007*
Fall 2010 3 Passage Rates
Intercept 21.493 1.827* Wind direction = tailwind 3.927 2.134
Wind direction = tailwind*wind speed -0.117 0.375 Wind direction = western crosswind 4.450 1.919*
Wind direction = western crosswind*wind speed -0.537 0.234* Wind speed -0.173 0.202
Lunar illumination -1.335 0.984 Lunar illumination*cloud cover 0.051 0.026*
Cloud cover -0.081 0.016* Flight Altitudes
Intercept 5.956 0.068* Wind direction = tailwind 0.041 0.073
Wind direction = western crosswind 0.063 0.036 Date 0.004 0.003
1 Asterisks (*) indicate 95% confidence intervals that do not overlap zero. 2 Coefficients (β) of the categorical variables wind direction and synoptic weather were calculated relative to headwinds and the site being situated to the west of a nearby pressure system, respectively. 3 Coefficients (β) of the categorical variables wind direction and date were calculated relative to a headwind and the quadratic form, respectively. During fall 2009 and fall 2010 at the Shiloh I and High Winds study sites in the Montezuma Hills Wind Resource Area, Solano County, California.
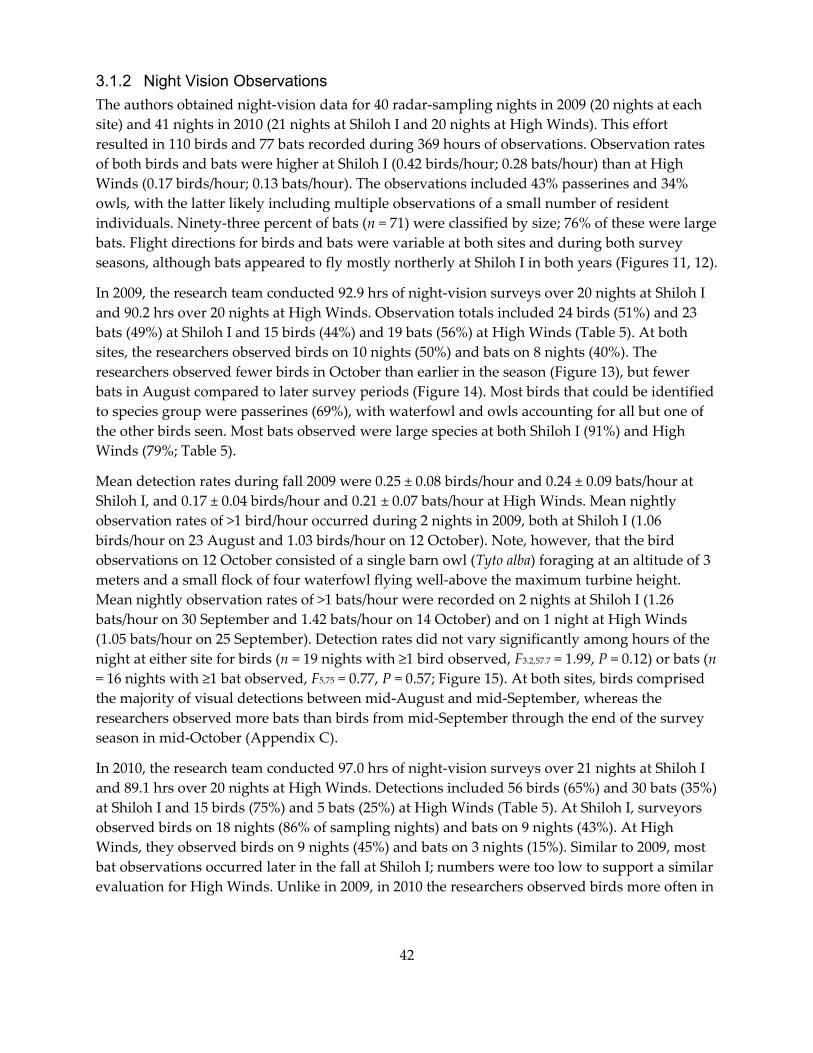
42
3.1.2 Night Vision Observations The authors obtained night‐vision data for 40 radar‐sampling nights in 2009 (20 nights at each site) and 41 nights in 2010 (21 nights at Shiloh I and 20 nights at High Winds). This effort resulted in 110 birds and 77 bats recorded during 369 hours of observations. Observation rates of both birds and bats were higher at Shiloh I (0.42 birds/hour; 0.28 bats/hour) than at High Winds (0.17 birds/hour; 0.13 bats/hour). The observations included 43% passerines and 34% owls, with the latter likely including multiple observations of a small number of resident individuals. Ninety‐three percent of bats (n = 71) were classified by size; 76% of these were large bats. Flight directions for birds and bats were variable at both sites and during both survey seasons, although bats appeared to fly mostly northerly at Shiloh I in both years (Figures 11, 12).
In 2009, the research team conducted 92.9 hrs of night‐vision surveys over 20 nights at Shiloh I and 90.2 hrs over 20 nights at High Winds. Observation totals included 24 birds (51%) and 23 bats (49%) at Shiloh I and 15 birds (44%) and 19 bats (56%) at High Winds (Table 5). At both sites, the researchers observed birds on 10 nights (50%) and bats on 8 nights (40%). The researchers observed fewer birds in October than earlier in the season (Figure 13), but fewer bats in August compared to later survey periods (Figure 14). Most birds that could be identified to species group were passerines (69%), with waterfowl and owls accounting for all but one of the other birds seen. Most bats observed were large species at both Shiloh I (91%) and High Winds (79%; Table 5).
Mean detection rates during fall 2009 were 0.25 ± 0.08 birds/hour and 0.24 ± 0.09 bats/hour at Shiloh I, and 0.17 ± 0.04 birds/hour and 0.21 ± 0.07 bats/hour at High Winds. Mean nightly observation rates of >1 bird/hour occurred during 2 nights in 2009, both at Shiloh I (1.06 birds/hour on 23 August and 1.03 birds/hour on 12 October). Note, however, that the bird observations on 12 October consisted of a single barn owl (Tyto alba) foraging at an altitude of 3 meters and a small flock of four waterfowl flying well‐above the maximum turbine height. Mean nightly observation rates of >1 bats/hour were recorded on 2 nights at Shiloh I (1.26 bats/hour on 30 September and 1.42 bats/hour on 14 October) and on 1 night at High Winds (1.05 bats/hour on 25 September). Detection rates did not vary significantly among hours of the night at either site for birds (n = 19 nights with ≥1 bird observed, F3.2,57.7 = 1.99, P = 0.12) or bats (n = 16 nights with ≥1 bat observed, F5,75 = 0.77, P = 0.57; Figure 15). At both sites, birds comprised the majority of visual detections between mid‐August and mid‐September, whereas the researchers observed more bats than birds from mid‐September through the end of the survey season in mid‐October (Appendix C).
In 2010, the research team conducted 97.0 hrs of night‐vision surveys over 21 nights at Shiloh I and 89.1 hrs over 20 nights at High Winds. Detections included 56 birds (65%) and 30 bats (35%) at Shiloh I and 15 birds (75%) and 5 bats (25%) at High Winds (Table 5). At Shiloh I, surveyors observed birds on 18 nights (86% of sampling nights) and bats on 9 nights (43%). At High Winds, they observed birds on 9 nights (45%) and bats on 3 nights (15%). Similar to 2009, most bat observations occurred later in the fall at Shiloh I; numbers were too low to support a similar evaluation for High Winds. Unlike in 2009, in 2010 the researchers observed birds more often in

43
Figure 11. Flight directions of birds detected during night-vision observations.
During fall 2009 and 2010 at the Shiloh I and High Winds study sites in the Montezuma Hills Wind Resource Area, Solano County, California.

44
Figure 12. Flight directions of bats detected during night-vision observations.
During fall 2009 and 2010 at the Shiloh I and High Winds study sites in the Montezuma Hills Wind Resource Area, Solano County, California.

45
Table 5. Numbers of birds and bats detected during night-vision observations.
Fall 2009 Fall 2010 Shiloh I High Winds Shiloh I High Winds n % n % n % n %
Birds Passerines 14 29.8 11 32.4 18 20.9 3 15.0
Wading birds 1 2.1 0 0.0 0 0.0 0 0.0 Waterfowl 4 8.5 1 2.9 8 9.3 5 25.0
Owls 3 6.4 2 5.9 28 32.6 4 20.0 Unidentified non passerines 0 0.0 0 0.0 2 2.3 2 10.0
Unidentified birds 2 4.3 1 2.9 0 0.0 1 5.0 Total 24 51.1 15 44.1 56 65.1 15 75.0 Bats
Small bats 2 4.3 4 11.8 10 11.6 1 5.0 Large bats 21 44.7 15 44.1 15 17.4 3 15.0
Unidentified bats 0 0.0 0 0.0 5 5.8 1 5.0 Total 23 48.9 19 55.9 30 34.9 5 25.0
Total birds and bats 47 100.0 34 100.0 86 100.0 20 100.0 In fall 2009 and 2010 at the Shiloh I and High Winds study sites in the Montezuma Hills Wind Resource Area, Solano County, California. Percentages are relative to the total number of animals identifiable as birds or bats.

46
Figure 13. Mean hourly detection rates for birds during night-vision observations.
In fall 2009 and 2010 at the Shiloh I and High Winds study sites in the Montezuma Hills Wind Resource Area, Solano County, California. Only dates sampled are shown; blanks indicate nights when no bats were observed.

47
Figure 14. Mean hourly detection rates for bats during night-vision observations.
In fall 2009 and 2010 at the Shiloh I and High Winds study sites in the Montezuma Hills Wind Resource Area, Solano County, California. Only dates sampled are shown; blanks indicate nights when no bats were observed.

48
Figure 15. Mean (± SE) detection rates by hour after sunset for birds and bats during night-vision observations.
In fall 2009 and 2010 in the Montezuma Hills Wind Resource Area, Solano County, California (data for Shiloh I and High Winds study sites combined).

49
October than earlier in the season, particularly at Shiloh I (Figures 13, 14). Passerines comprised 30% of the birds identified in 2010, owls 46%, and waterfowl 19% (Table 5). Most bats observed at both sites were large species (Table 5).
Detection rates during 2010 averaged 0.58 ± 0.11 birds/hour and 0.31 ± 0.11 bats/hour at Shiloh I and 0.16 ± 0.07 birds/hour and 0.05 ± 0.03 bats/hour at High Winds. Detection rates of >1 bird/hour occurred on 4 nights in 2010: 12 October (1.07 birds/hour), 25 October (2.30 birds/hour), and 27 October (1.08 birds/hour) at Shiloh I, and 19 October (1.27 birds/hour) at High Winds. Contributing to the higher rates were a small flock of 5 ducks flying above maximum turbine height on 19 October and a flock of 7 geese flying within the rotor‐swept zone on 25 October. In addition, observations on 25 and 27 October included multiple detections of barn owls, which may have all been the same individual. Detection rates of >1 bats/hour were recorded on 4 nights (1.28 bats/hour on 11 and 12 October, 1.27 bats/hour on 13 October, and 1.38 bats/hour on 25 October) at Shiloh I. Detection rates did not vary significantly among hours of the night at either site for birds (n = 25 nights with ≥1 bird observed, F2.3,54.8 = 1.01, P = 0.38) or bats (n = 12 nights with ≥ 1 bat observed, F5,55 = 1.06, P = 0.39; Figure 15). At both sites, observations of bats outnumbered those of birds during the first half of October (Appendix C).
The researchers never observed a bird or bat collide with a turbine and recorded few apparent behavioral reactions to the turbines (Table 6). They recorded 46 birds and 50 bats flying below 125 meters agl and within 50 meters of turbines, with 78% of the birds and 90% of the bats recorded at altitudes corresponding to the rotor‐swept zone of turbines. Five bats and 2 birds (1 passerine and 1 unknown bird) flew through the actual rotor‐swept zone of operating turbines. One bat and 3 birds (1 Canada goose and 2 passerines) flew through the rotor swept zone of inactive turbines. An additional 4 bats and 3 birds (2 owls and 1 passerine) altered their flight paths to avoid passage through the rotor‐swept zone of operating turbines. All 4 bats altered their flight directions within 5 meters of the turbine, whereas the 3 birds changed course at distances of 20, 30, and 50 meters from the turbine.
3.1.3 Turbine Passage Rate Index Estimated numbers of birds and bats passing through the area occupied by one turbine each night differed between sites and years of the study (Appendix B). In both years, estimated turbine passage rates were higher at Shiloh I than at High Winds and, reflecting higher passage rates of targets flying below 125 meters agl in both years, turbine passage rates were higher in 2010 at both sites. Given the turbine dimensions for the sites and depending upon the orientation of rotors relative to flight directions, we calculated mean estimates of 0.91–6.25 migrants at Shiloh I and 0.48–4.12 migrants at High Winds that would have passed within the area occupied by one turbine during each night of the fall 2009 migration period. The comparative estimates for fall 2010 were 1.52–10.50 migrants per night at Shiloh I and 0.66–5.62 migrants per night at High Winds.
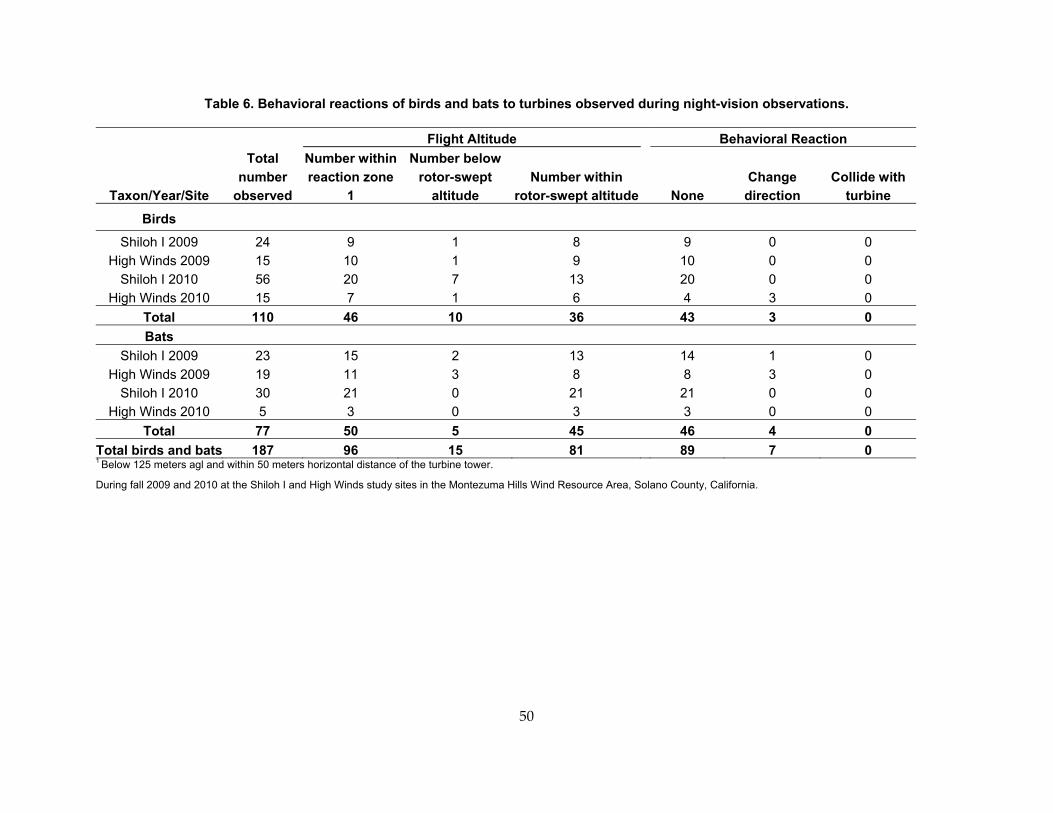
50
Table 6. Behavioral reactions of birds and bats to turbines observed during night-vision observations.
Flight Altitude Behavioral Reaction
Taxon/Year/Site
Total number
observed
Number within reaction zone
1
Number below rotor-swept
altitude Number within
rotor-swept altitude
None Change direction
Collide with turbine
Birds
Shiloh I 2009 24 9 1 8 9 0 0 High Winds 2009 15 10 1 9 10 0 0
Shiloh I 2010 56 20 7 13 20 0 0 High Winds 2010 15 7 1 6 4 3 0
Total 110 46 10 36 43 3 0 Bats
Shiloh I 2009 23 15 2 13 14 1 0 High Winds 2009 19 11 3 8 8 3 0
Shiloh I 2010 30 21 0 21 21 0 0 High Winds 2010 5 3 0 3 3 0 0
Total 77 50 5 45 46 4 0 Total birds and bats 187 96 15 81 89 7 0 1 Below 125 meters agl and within 50 meters horizontal distance of the turbine tower.
During fall 2009 and 2010 at the Shiloh I and High Winds study sites in the Montezuma Hills Wind Resource Area, Solano County, California.

51
3.1.4 Acoustic Monitoring The acoustic monitoring stations recorded 142,541 sound events over the course of the study. In 2009, the 8 high frequency (bat) microphones recorded 32,533 sound events and the 8 low frequency (bird) microphones recorded 91,629 events. After the 2009 season, the authors’ modifications of the equipment set‐up (that is, they extended the bird‐microphone tube housings and used additional software filters) greatly reduced the number of erroneous files. In 2010, the high‐frequency microphones recorded 1,932 events and the low‐frequency microphones recorded 16,046 events. Nevertheless, most of the recorded sounds were associated with the turbines themselves. A few bird and bat calls also were recorded, but unfortunately many of these calls were recorded during breaks between radar and fatality sampling periods. Moreover, the acoustic stations failed an average of 38.9 % of the time or a mean of about 34 nights per acoustic station out of the total 80 nights of data collecting. Power failure was the most common problem, followed by mice chewing through computer connector cables inside the housing units and livestock chewing through the acoustic cables outside the housing units. In addition, the acoustic station located at the MET 5 tower on the Shiloh I site failed to perform during most of the 2010 survey period because a diesel generator used to power the meteorological equipment produced both low and high frequency sounds that precluded recording subtler bird and bat calls. Ultimately, this monitoring technique did not produce enough data to provide useful information about movements of bats and nocturnally active birds through the study area or to compare acoustic surveying techniques with the other sampling methodologies assessed in this study.
Analysts reviewed the first 30,000 of the 91,629 sound events recorded by the low‐frequency microphones during 2009, which spanned the period from 18 August through 11 September. These recordings revealed that the flight calls typical of nocturnal‐migrant birds either were not being captured or were being buried within signals produced by the turbines themselves; therefore, the authors did not analyze the remaining low‐frequency recordings. The analyzed records yielded only 53 bird calls, all of resident birds, including 32 house finches (Carpodacus mexicanus), 8 western meadowlarks (Sturnella neglecta), 4 house sparrows (Passer domesticus), 4 California towhees (Melozone crissalis), 1 bushtit (Psaltriparus minimus), 1 mourning dove (Zenaida macroura), 1 chestnut‐backed chickadee (Poecile rufescens), and 1 black phoebe (Sayornis nigricans). All of these calls were recorded on only 4 nights (18 and 19 August; 10 and 11 September), with 74% (39) recorded on a single night (19 August) at a single turbine (B16R at Shiloh I; Figure 16). The latter included 31 house finch, 3 house sparrow, 4 California towhee, and 1 black phoebe calls. Nineteen of these calls occurred separated by periods of <1 minute and presumably were made by one to a few individuals recorded repeatedly; for example, 4 California towhee recordings occurred within <1 minute and likely represented only one or two individuals.
The 32,533 sound events recorded by the high‐frequency microphones in 2009 included only 3 bat call sequences: 2 Mexican free‐tailed bat and 1 hoary bat. In contrast, the 1,932 recordings from 2010 included 61 Mexican free‐tailed bat calls and 1 50‐kHz call, most likely a California myotis (Myotis californicus). Most of the Mexican free‐tailed bat calls (54, 89%) were recorded

52
on two nights (25 and 26 October; Figure 17) and all recordings from 25–27 October occurred at the Shiloh I turbine B16R (Figure 16). Although only 1 hoary bat call was confirmed, several of the reported Mexican free‐tailed bat calls may have been hoary bats. These species’ call frequencies and call structures overlap, so separating them with a high degree of certainty is problematic. Overall, bats were recorded on only 10 of 102 nights when the equipment was recording sounds. Twelve calls occurred within <1 minute of each other, 25 calls within <10 minutes of each other, and 16 calls within a span of 100 minutes, suggesting multiple recordings of a limited number of individual bats.
Figure 16. Distribution of bat and bird call sequences recorded at acoustic monitoring stations.
During fall 2009 and fall 2010 at the High Winds (HW) and Shiloh I (SH) study sites in the Montezuma Hills Wind Resource Area, Solano County, California.
Figure 17. Temporal distribution of bat call sequences recorded by acoustic monitoring stations.
During fall 2009 and fall 2010 at the High Winds and Shiloh I study sites in the Montezuma Hills Wind Resource Area, Solano County, California. The last three days of recordings occurred only at a single turbine location: B16R at Shiloh I.
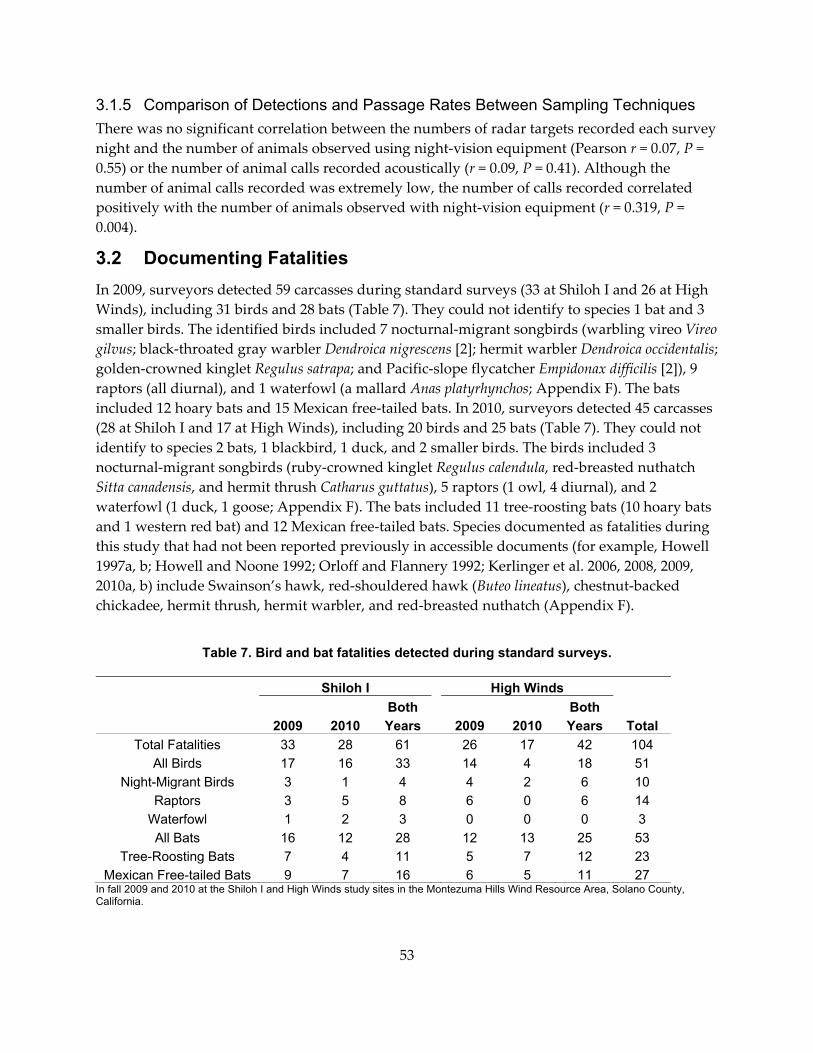
53
3.1.5 Comparison of Detections and Passage Rates Between Sampling Techniques There was no significant correlation between the numbers of radar targets recorded each survey night and the number of animals observed using night‐vision equipment (Pearson r = 0.07, P = 0.55) or the number of animal calls recorded acoustically (r = 0.09, P = 0.41). Although the number of animal calls recorded was extremely low, the number of calls recorded correlated positively with the number of animals observed with night‐vision equipment (r = 0.319, P = 0.004).
3.2 Documenting Fatalities In 2009, surveyors detected 59 carcasses during standard surveys (33 at Shiloh I and 26 at High Winds), including 31 birds and 28 bats (Table 7). They could not identify to species 1 bat and 3 smaller birds. The identified birds included 7 nocturnal‐migrant songbirds (warbling vireo Vireo gilvus; black‐throated gray warbler Dendroica nigrescens [2]; hermit warbler Dendroica occidentalis; golden‐crowned kinglet Regulus satrapa; and Pacific‐slope flycatcher Empidonax difficilis [2]), 9 raptors (all diurnal), and 1 waterfowl (a mallard Anas platyrhynchos; Appendix F). The bats included 12 hoary bats and 15 Mexican free‐tailed bats. In 2010, surveyors detected 45 carcasses (28 at Shiloh I and 17 at High Winds), including 20 birds and 25 bats (Table 7). They could not identify to species 2 bats, 1 blackbird, 1 duck, and 2 smaller birds. The birds included 3 nocturnal‐migrant songbirds (ruby‐crowned kinglet Regulus calendula, red‐breasted nuthatch Sitta canadensis, and hermit thrush Catharus guttatus), 5 raptors (1 owl, 4 diurnal), and 2 waterfowl (1 duck, 1 goose; Appendix F). The bats included 11 tree‐roosting bats (10 hoary bats and 1 western red bat) and 12 Mexican free‐tailed bats. Species documented as fatalities during this study that had not been reported previously in accessible documents (for example, Howell 1997a, b; Howell and Noone 1992; Orloff and Flannery 1992; Kerlinger et al. 2006, 2008, 2009, 2010a, b) include Swainson’s hawk, red‐shouldered hawk (Buteo lineatus), chestnut‐backed chickadee, hermit thrush, hermit warbler, and red‐breasted nuthatch (Appendix F).
Table 7. Bird and bat fatalities detected during standard surveys.
Shiloh I High Winds
2009 2010 Both Years 2009 2010
Both Years Total
Total Fatalities 33 28 61 26 17 42 104 All Birds 17 16 33 14 4 18 51
Night-Migrant Birds 3 1 4 4 2 6 10 Raptors 3 5 8 6 0 6 14
Waterfowl 1 2 3 0 0 0 3 All Bats 16 12 28 12 13 25 53
Tree-Roosting Bats 7 4 11 5 7 12 23 Mexican Free-tailed Bats 9 7 16 6 5 11 27
In fall 2009 and 2010 at the Shiloh I and High Winds study sites in the Montezuma Hills Wind Resource Area, Solano County, California.

54
3.2.1 Estimating Fatality Rates 3.2.1.1 Searcher Efficiency Trials In 2009, the authors tested the two survey teams’ ability to detect carcasses five times, in each case using 2–3 different bird carcasses per team. Two assessments occurred during the first sampling period and one each during the three subsequent sampling periods. In 2010, the authors tested the two survey teams once during each of the four survey periods using 2–4 bird and bat carcasses per assessment.
Overall, the observers detected 19 of 59 (32%) bird and bat carcasses randomly placed in the field. Trial‐specific detection ratios ranged from 0.20 to 0.50 (Figure 18), with substrate appearing to have a substantial influence on the probability of detection (Table 8). In each year, searcher effectiveness tended to decrease later in the season, possibly due to observer fatigue, changes in ambient light, or changes in substrate over the course of the season (Figure 18). Detection ratios calculated from these trails are conservative, because searchers were given only one chance to detect carcasses in the trials, while they had multiple chances to detect carcasses within the survey plots if those carcasses were not removed by scavengers or environmental conditions.
Table 8. Carcass detection ratios on sample plots with different substrates.
Substrate Carcasses Placed Carcasses Detected Detection RatioPlowed, Clumps 8 1 0.13
Plowed or Burned, No Clumps 6 4 0.67 Unplowed, High Vegetation 11 2 0.18
Unplowed, Medium Vegetation 14 4 0.29 Unplowed, Low Vegetation 20 8 0.40
In fall 2009 and 2010 at the Shiloh I and High Winds study sites in the Montezuma Hills Wind Resource Area, Solano County, California.

55
Figure 18: Number of bird and/or bat carcasses placed and detected during searcher efficiency trias.
Conducted in fall 2009 (assessments 1–5) and fall 2010 (assessments 6–10) at the Shiloh I and High Winds study sites in the Montezuma Hills Wind Resource Area, Solano County, California.
Carcass Removal Rates
Surveyors left in place for the duration of the relevant survey period all carcasses they found during non‐clearance survey days, and in 2009 also left in place for the duration of the survey season all carcasses found during clearance surveys. Therefore, although the study design did not include a rigorous methodology for determining carcass removal rates, the authors were able to assess general trends in carcass removal using data from both years, but did not factor these data into calculations of adjusted fatality rates. These trends were derived largely using 2009 data; as carcasses were not removed from the survey plots during clearance surveys in 2009, there were opportunities for the surveyors to re‐find these carcasses during subsequent surveys, leading to persistence estimates that exceeded the duration of any one survey period.
The mean persistence time for 20 bird carcasses found during fatality surveys (all those that ranged from kinglet to mourning dove in size, so as to most closely approximate persistence times characteristic of nocturnal migrants) was 9.3 ± SD of 11.7 days (range 1–37 days) and for 51 bats was 6.0 ± 7.6 days (range 1–32 days); however, median persistence times were only 3 days for birds and 2 days for bats. Forty‐five percent of the bird carcasses were removed within 1 day and 75% were removed within 5 days. Similarly, 39% of the bat carcasses were removed within 1 day and 73% within 5 days (Figure 19).

56
Figure 19. Persistence times for bird (n = 20; kinglet to dove size) and bat (n = 51) carcasses.
During fall 2009 and 2010 in the Montezuma Hills Wind Resource Area, Solano County, California.
3.3 Relationships Among Fatality Estimates, Passage Rate Indices, and Environmental Variables
This project documented 51 bird fatalities, with multiple fatalities (2–4) occurring on 11 nights. Initial investigations revealed significant (two‐tailed P ≤ 0.05) Pearson correlations between unadjusted all‐bird fatality counts and Julian date (r = ‐0.34) and the average altitude of radar targets (birds and bats; r = ‐0.31). Similar results applied with adjusted counts as the dependent variable, except that an additional marginally significant (P ≤ 0.10) correlation was indicated for radar‐target passage rates below 125 meters agl (r = 0.22). Poisson GLM modeling with unadjusted all‐bird fatality counts as the dependent variable revealed significant relationships with Site, Julian date (first‐order only), and passage rates of radar targets below 125 meters agl (see Appendix G: Table G‐1 for detailed model statistics). Negative‐binomial GLM modeling with adjusted counts as the dependent variable revealed similar relationships for Site and Julian date, but no others (Appendix G: Table G‐2). Together these results suggest consistent effects of site (more fatalities at Shiloh I than at High Winds) and date (more fatalities earlier in the season), as well as a relationship between fatalities and overall activity levels within the rotor swept zone as determined by radar monitoring, whether revealed as fatalities increasing as target altitudes declined or as passage rates increased below 125 meters agl (Figure 20; and see Appendix G: Figure G‐1 for plots of predicted relationships with 95% confidence intervals).
This project documented 53 bat fatalities, with multiple fatalities (2–5) occurring on 12 nights. Initial investigations revealed significant correlations between unadjusted all‐bat fatality counts and average temperature (r = 0.40) and the average flight direction of birds and bats detected during night‐vision monitoring (r = ‐0.22). The relationship with flight direction suggested that fatalities increased as the average flight direction of night‐vision detections shifted more southeasterly and easterly within the range of observed flight directions (a broad range, with

57
highest concentration east‐northeast and secondary concentrations south‐southeast and west‐northwest; Figure 21). Similar results applied with adjusted counts as the dependent variable. Poisson GLM modeling with unadjusted all‐bat fatality counts as the dependent variable revealed significant relationships with Julian date (second‐order, hill‐shaped relationship), average temperature (positive association), and the average altitude (negative association) and flight direction of radar targets (Appendix G: Table G‐1). For flight direction, a positive relationship suggested that fatalities increased as the average flight direction of radar targets shifted more southward within the typical range of directions (roughly east‐northeast to south‐southeast; Figure 21).
Negative‐binomial GLM modeling with adjusted all‐bat fatality counts as the dependent variable revealed similar significant relationships with Julian date and temperature, but no relationships with radar or night‐vision metrics (Appendix G: Table G‐2). There was, however, some indication of a possible weak positive relationship with average visibility as measured at nearby Travis Air Force Base. No fatalities occurred on the few nights when visibility was well‐below average at Travis, which tended to be nights when activity levels within the rotor‐swept zone also were low. Together these results indicate that the probability of encountering a bat fatality increased during midseason and on warmer nights (Figure 22a, b). Beyond that the indicators were weaker and mixed, but suggested that fatalities tended to increase when the average altitude of radar targets decreased and the flight direction of migrants shifted more southeasterly (Figure 22c).

58
Figure 20. Unadjusted bird fatalities per survey in the Montezuma Hills, California.
During autumn in 2009 and 2010 illustrating greater frequency at Shiloh I compared to High Winds, earlier in the season. As nightly passage rates of radar targets (targets recorded per 1 kilometer of passage front per hour) increased at altitudes <125 meters above ground level (that is, within the approximate rotor-swept zone of wind turbines): (a) raw data; (b) and (c) as predicted by final Poisson general linear model.

59
Figure 21. Histograms displaying predominant flight directions (in degrees, zero = north) for all bird and bat radar targets.
(Left panel; flight altitudes up to approximately 800 meters above ground level) and night-vision observations (right panel; flight altitudes up to approximately 125 meters above ground level) recorded during autumn 2009 and 2010 in the Montezuma Hills, California.
Mexican free‐tailed bats comprised 57% (n = 30) of the bat fatalities discovered during this study, with multiple fatalities (2–4) discovered on five nights. Initial investigation of Pearson correlations revealed only a significant positive correlation (r = 0.28) between numbers of fatalities and the average altitude of radar targets. Poisson quasi‐GLM modeling of unadjusted Mexican free‐tailed bat fatality counts and negative‐binomial GLM modeling of adjusted Mexican free‐tailed bat fatality counts revealed similar positive relationships with wind speed and barometric pressure, and the unadjusted fatalities model also included a significant positive relationship with radar‐target altitude (Appendix G: Tables G‐1 and G‐2). Together these results suggest that the probability of encountering Mexican free‐tailed bat fatality counts increased during periods of high pressure, stronger winds, and to a lesser degree when the average flight altitude of radar targets increased (Figure 23).
The authors documented only 10 fatalities of night‐migrant birds, with only one night including two such fatalities. Analyses showed no significant relationships with any of the spatial/temporal, weather, radar, or night‐vision explanatory variables. The strongest Pearson correlation between nightly fatality counts and an explanatory variable was only 0.09, and individual t‐tests for explanatory variables and log‐likelihood ratio tests of model fits indicated that no explanatory variables were even marginally significant (P > 0.10) based on the logistic regression analyses of presence/absence data. Here it is important to note that low numbers of fatalities likely contributed to low statistical power for detecting relationships.

60
Figure 22. Unadjusted bat fatalities per survey in the Montezuma Hills, California.

61
During autumn in 2009 and 2010, illustrating greater frequency during mid-season, on warmer nights, as the average altitude of radar targets declined, and when the predominant flight direction of radar targets shifted more southward within the typical range from roughly east-northeast to south-southeast: (a) raw data; (b) and (c) as predicted by final Poisson general linear model with average values inserted in predictive equations for variables not represented in each graph.

62
Figure 23. Unadjusted Mexican free-tailed bat fatalities per survey in the Montezuma Hills, California.
During autumn in 2009 and 2010, illustrating greater frequency during periods of higher barometric pressure and stronger winds, and when the average altitude of radar targets increased:(a) raw data; (b) and (c) as predicted by final Poisson quasi-GLM general linear model with average values inserted in predictive equations for variables not represented in each graph.

63
The authors documented 23 tree‐roosting bat fatalities, with multiple fatalities (2–3) occurring on two nights. Analyses showed evidence of relationships with Julian date, average temperature, the passage rate of radar targets below 125 meters agl, and total counts of birds and bats detected during night‐vision observations. Initial investigations revealed a significant positive correlation (r = 0.29) between the number of fatalities and passage rates of radar targets below 125 meters agl. However, an opposite, marginally significant correlation (r = ‐0.19) was indicated for fatalities versus total counts of birds and bats detected during night‐vision monitoring. Note, however, that no significant correlation was evident between fatalities and the number of bats confirmed during night‐vision monitoring (r = 0.09, P >0.10). The contrast in results for radar passage rates and total night‐vision observations appeared counterintuitive given that these two explanatory variables theoretically should reflect the same basic patterns. The two explanatory variables were significantly and positively correlated; however, the relationship did not appear to hold well for high values of either variable (Figure 24). This discrepancy may indicate spatial clustering in the passage patterns of birds and bats through the project area. The effects of such a pattern may be reflected in the night‐vision monitoring having sampled only limited airspaces around one turbine at each site, whereas radar monitoring spanned a much broader area and included a larger array of turbines at each site. The only other explanatory variable with which fatality counts were significantly and independently correlated was average temperature (r = 0.37).
Figure 24. Relationship (Pearson r = 0.23) between total bird and bat counts.
Derived from night-vision monitoring and the average passage rate of radar targets (birds and bats detected per 1 kilometer of passage front per hour) at altitudes below 125 meters agl in the Montezuma Hills, California during autumn in 2009 and 2010.

64
The final logistic regression model for presence/absence of tree‐roosting bats included a second‐order relationship with Julian date, a positive relationship with average temperatures, and a negative relationship with total counts of birds and bats detected during night‐vision monitoring (Appendix G: Table G‐3). In contrast, the radar‐target passage rate variable did not add significantly to the model with the second‐order function for Julian date and temperature included (P = 0.24). In summary, the results for presence/absence of night‐migrant, tree‐roosting bats indicate, just as for all bats combined, that the probability of encountering at least one fatality increased during midseason and on warmer nights (Figure 25). Beyond that, the results appeared inconclusive concerning possible relationships to activity levels within the rotor‐swept zone as documented by radar and night‐vision monitoring.
Figure 25. Unadjusted tree-roosting bat fatalities per survey in the Montezuma Hills, California.
During autumn in 2009 and 2010, illustrating greater frequency during mid-season and on warmer nights: (a) raw data, and (b) as predicted by final logistic regression model with an average value inserted in the predictive equation for total night-vision observations.
In summary, for birds the data likely were insufficient to uncover potential relationships for night‐migrants only, but with data for all bird fatalities combined, the results indicated higher fatality counts at Shiloh I compared to High Winds, earlier in the season, and when radar data indicated greater activity within the rotor swept zone, whether revealed in relation to declining flight altitudes or increasing passage rates at <125 meters agl. In contrast, the overall probability of encountering bat fatalities increased during midseason, but this applied primarily to tree‐roosting bats and not Mexican free‐tailed bats. In addition, the probability of encountering a tree‐roosting bat fatality increased on warmer nights and the probability of encountering a Mexican free‐tailed bat fatality increased during periods of high pressure and stronger winds. Based on results for all bats combined, fatalities also tended to increase when the average altitude of radar targets decreased and the flight direction of radar and night‐vision targets shifted to predominantly southeasterly. Results for tree‐roosting bats alone were, however,

65
inconclusive in showing mixed results for activity indicators within the rotor‐swept zone (radar passage rates at <125 meters agl and night‐vision counts). Furthermore, there was some evidence for Mexican free‐tailed bats alone of an opposite relationship with radar‐target altitude; that is, that fatalities increased as the average altitude of radar targets increased.
3.4 Spatial Analyses 3.4.1 Dispersion of Fatalities Among Towers Coefficients of dispersion and Kolmogorov‐Smirnoff tests revealed no evidence of significant variation from a Poisson random distribution for all bird fatalities combined and for night‐migrant birds only at either site (Table 9). Except for all bird fatalities combined at Shiloh I, the coefficients of dispersion indicated slight tendencies toward a more uniform distribution rather than any tendency toward clustering. Small fatality sample sizes undoubtedly limited the statistical power of these comparisons.
Similar results applied to bats. The coefficients of dispersion for all bat fatalities combined, for Mexican free‐tailed bats, and for tree‐roosting bats all were within 21% of 1, and Kolmogorov‐Smirnoff tests again confirmed no statistically significant deviations (P > 0.99) from an expected Poisson random distribution (Table 9). In most cases, the distributions were slightly over‐dispersed, suggesting slight tendencies towards clumping.
3.4.2 Hot Spot Analyses The average distance between turbines was 164 meters (range 129–232 meters) at High Winds and 232 meters (range 131–518 meters) at Shiloh I. With all bird and bat fatalities combined, the High Winds analysis indicated two moderate hot spots at turbines C18 and C28 (4 fatalities each; 1.95 < Gi* ≤ 2.58, 0.01 < P ≤ 0.05), but no strong hot spots (Gi* > 2.58, P > 0.01; Figure 30). The Shiloh I all‐fatalities analysis indicated a strong hot spot at turbine D2 (8 fatalities; Gi* = 3.11), with three fatalities documented at both neighboring turbines D3 and D4 (Figure 26). Limited to bird fatalities, no significant clustering occurred for all birds combined at High Winds; however, two moderate hot spots occurred at Shiloh I centered on turbines B13 and D2 (Figure 27). For nocturnal‐migrant birds only, the authors documented no more than one fatality per turbine across both sites and the analysis identified some of these locations as moderate hot spots at Shiloh I (4 locations); however, the data clearly were insufficient to support a robust analysis. For all bats combined at High Winds, two moderate hot spots centered on turbines C18 and C21 (3 fatalities each), with one fatality each at the two intervening turbines (C19 and C20; Figure 28). For all bats combined at Shiloh I, a strong hot spot centered on turbine B18 (5 fatalities), with a total of three other fatalities at the two neighboring turbines (Figure 29). For tree‐roosting bats at High Winds, a strong hot spot centered on turbine C18, the only turbine with multiple fatalities (3) and where another single fatality occurred at neighboring turbine C19 (Figure 30). Similarly, for tree‐roosting bats at Shiloh I, a strong hot spot centered on turbine B18, again the only turbine with multiple fatalities (3; Figure 31). The same was true at High Winds for Mexican free‐tailed bats, with a hot spot centered on turbine C21, again the only turbine with multiple fatalities (3; Figure 32). Lastly, no hot spots occurred for Mexican free‐tailed bats at Shiloh I.
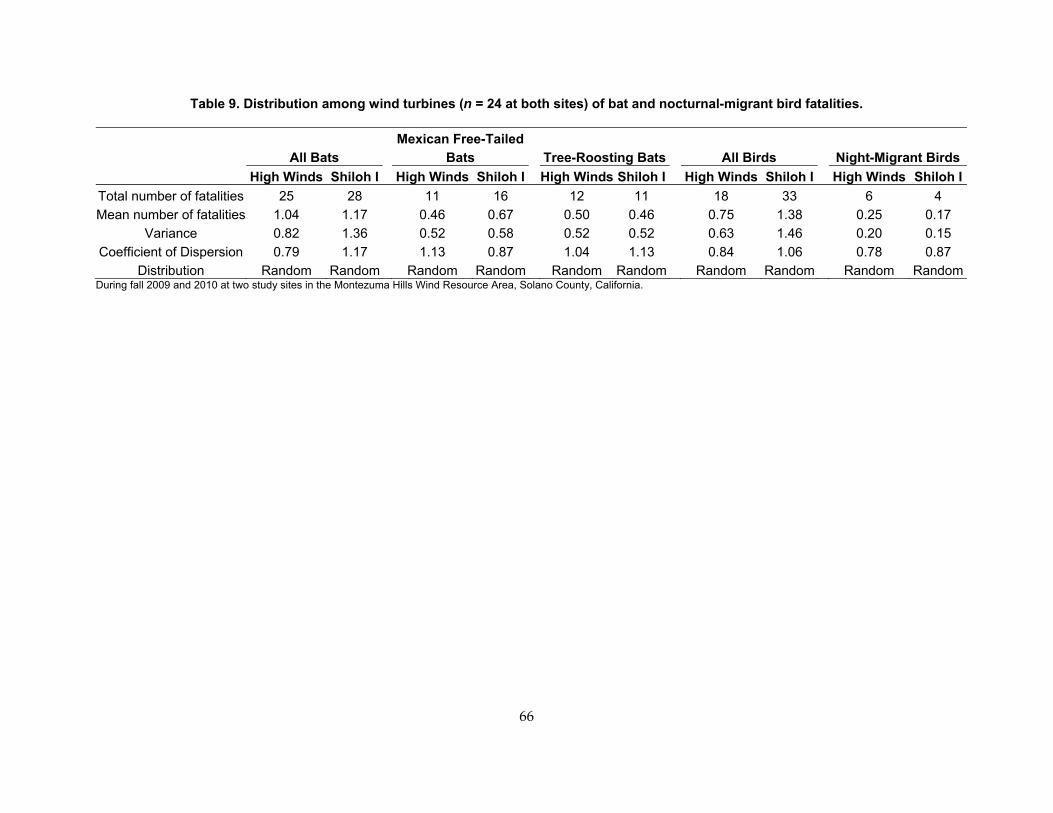
66
Table 9. Distribution among wind turbines (n = 24 at both sites) of bat and nocturnal-migrant bird fatalities.
All Bats Mexican Free-Tailed
Bats Tree-Roosting Bats All Birds Night-Migrant Birds High Winds Shiloh I High Winds Shiloh I High Winds Shiloh I High Winds Shiloh I High Winds Shiloh I
Total number of fatalities 25 28 11 16 12 11 18 33 6 4 Mean number of fatalities 1.04 1.17 0.46 0.67 0.50 0.46 0.75 1.38 0.25 0.17
Variance 0.82 1.36 0.52 0.58 0.52 0.52 0.63 1.46 0.20 0.15 Coefficient of Dispersion 0.79 1.17 1.13 0.87 1.04 1.13 0.84 1.06 0.78 0.87
Distribution Random Random Random Random Random Random Random Random Random RandomDuring fall 2009 and 2010 at two study sites in the Montezuma Hills Wind Resource Area, Solano County, California.

67
Figure 26. Spatial distribution of bird and bat fatalities.
During fall 2009 and fall 2010 at the High Winds study site in the Montezuma Hills Wind Resource Area, Solano County, California, illustrating results of a Hot Spot analysis (ArcGIS 9.3, ESRI, Inc., Redlands, CA).

68
Figure 27. Spatial distribution of all bird and bat fatalities.
During fall 2009 and fall 2010 at the Shiloh I study site in the Montezuma Hills Wind Resource Area, Solano County, California, illustrating results of a Hot Spot analysis (ArcGIS 9.3, ESRI, Inc., Redlands, CA).

69
Figure 28. Spatial distribution of all bird fatalities.
During fall 2009 and fall 2010 at the Shiloh I study site in the Montezuma Hills Wind Resource Area, Solano County, California, illustrating results of a Hot Spot analysis (ArcGIS 9.3, ESRI, Inc., Redlands, CA).

70
Figure 29. Spatial distribution of all bat fatalities.
During fall 2009 and fall 2010 at the High Winds study site in the Montezuma Hills Wind Resource Area, Solano County, California, illustrating results of a Hot Spot analysis (ArcGIS 9.3, ESRI, Inc., Redlands, CA).

71
Figure 30. Spatial distribution of all bat fatalities.
During fall 2009 and fall 2010 at the Shiloh I study site in the Montezuma Hills Wind Resource Area, Solano County, California, illustrating results of a Hot Spot analysis (ArcGIS 9.3, ESRI, Inc., Redlands, CA).

72
Figure 31. Spatial distribution of tree-roosting bat fatalities.
During fall 2009 and fall 2010 at the High Winds study site in the Montezuma Hills Wind Resource Area, Solano County, California, illustrating results of a Hot Spot analysis (ArcGIS 9.3, ESRI, Inc., Redlands, CA).

73
Figure 32. Spatial distribution of tree-roosting bat fatalities.
During fall 2009 and fall 2010 at the Shiloh I study site in the Montezuma Hills Wind Resource Area, Solano County, California, illustrating results of a Hot Spot analysis (ArcGIS 9.3, ESRI, Inc., Redlands, CA).

74
Figure 33. Spatial distribution of Mexican free-tailed bat fatalities.
During fall 2009 and fall 2010 at the High Winds study site in the Montezuma Hills Wind Resource Area, Solano County, California, illustrating results of a Hot Spot analysis (ArcGIS 9.3, ESRI, Inc., Redlands, CA).

75
3.4.3 Influence of Habitat Features Night‐migrant bird fatalities were clustered near riparian vegetation, but showed no association with direction to the nearest eucalyptus grove (Figure 34). Locations of bat fatalities were not significantly clustered near riparian vegetation, but were strongly clumped near eucalyptus groves (Figure 35, with similar relationships shown for both Mexican free‐tailed bats (Figure 36 and tree‐roosting bats (Figure 37).
Figure 34. Distribution of nocturnal-migrant bird fatalities.
During fall 2009 and fall 2010 at the High Winds and Shiloh I study sites in the Montezuma Hills Wind Resource Area, Solano County, California, in relation to direction to the nearest (a) riparian patch (non-random clustered pattern: Rayleigh test for uniformity, z = 5.3, P = 0.004), and (b) eucalyptus grove (no association, z = 1.4, P = 0.20).
Figure 35. Distribution of bat fatalities.
During fall 2009 and fall 2010 at the High Winds and Shiloh I study sites in the Montezuma Hills Wind Resource Area, Solano County, California, in relation to direction to the nearest (a) riparian patch (no association: Rayleigh test for uniformity, z = 2.3, P = 0.10), and (b) eucalyptus grove (non-random clustered pattern, z = 7.5, P < 0.001).

76
Figure 36. Distribution of Mexican free-tailed bat fatalities.
During fall 2009 and fall 2010 at the High Winds and Shiloh I study sites in the Montezuma Hills Wind Resource Area, Solano County, California, in relation to direction to the nearest (a) riparian patch (no association: Rayleigh test for uniformity, z = 1.2, P = 0.31), and (b) eucalyptus grove (non-random clustered pattern, z = 3.4, P = 0.034).
Figure 37. Distribution of tree-roosting bat fatalities.
During fall 2009 and fall 2010 at the High Winds and Shiloh I study sites in the Montezuma Hills Wind Resource Area, Solano County, California, in relation to direction to the nearest (a) riparian patch (no association: Rayleigh test for uniformity, z = 1.5, P = 0.22), and (b) eucalyptus grove (non-random clustered pattern, z = 4.2, P = 0.015).

77
CHAPTER 4: Discussion Wind energy is a promising source of renewable energy and one of the fastest growing sectors of energy production in the United States (Energy Information Administration 2009). The California Energy Commission (2011) Integrated Energy Policy Report calls for California to derive 33% of its energy from renewable sources by 2020. The strong demand for an increasing percentage of renewable energy will continue in the near and far future because of the increasingly tangible negative effects of global warming (Solomon et al. 2007). Although birds and bats clearly are at the highest risk of collision at wind‐energy facilities (Kunz et al. 2007), the reasons for differences in mortality among facilities still are largely unknown (Cryan and Barclay 2009). This study was driven by the need to better understand the patterns and reasons for bird and bat fatalities at wind energy fatalities.
The authors investigated relationships between nocturnal bird and bat activity patterns and documented fatality rates at two wind‐energy facilities in the MHWRA to advance understanding of the risks to nocturnally migrating birds and bats posed by wind turbines, and to address some of the key uncertainties associated with the current state‐of‐the‐science for wind‐energy/wildlife interactions. The authors also investigated how to integrate data from radar, night‐vision observations, and acoustic monitoring to better identify what species were present in the airspace of the study areas and the spatio‐temporal dynamics of their movements through the area during the fall‐migration season relative to wind turbines.
Because of the historical documentation of high numbers of bird fatalities at the Altamont Pass Wind Resource Area and bat fatalities at other wind‐energy facilities in North America, the state of California published a set of voluntary guidelines for reducing impacts to birds and bats from wind‐energy development (California Energy Commission and California Department of Fish and Game 2007). Within these guidelines, nocturnal radar studies are identified as a useful method for counting nocturnal migrants passing through a proposed project area and for identifying the height and location of flight paths. Night‐vision techniques also are noted as being useful for identification of taxa at flight altitudes within the turbine zone, as well as for behavioral observations at operational facilities. Use of acoustic monitoring devices is a long‐standing, effective practice for monitoring the activity patterns of bats (Fenton 1970, Kunz et al. 2007) and also can be used to monitor passage of songbirds migrating at night (Farnsworth 2005). Predictions of the effects of wind‐power development on migratory birds and bats are hampered by a lack of basic information on their relative abundance at low altitudes, their flight altitudes relative to the rotor‐swept areas of wind turbines, their flight behaviors around turbines (that is, their ability to detect and avoid structures), and the causal relationships between their abundance and fatalities at wind turbines (Arnett et al. 2007). The research presented herein provides data to help address some of these issues at operational wind facilities in Solano County, California.

78
4.1 Comparative Value of Different Nocturnal Monitoring Techniques Overall, the three detection methods (radar, night‐vision, and acoustic) helped to provide a comprehensive and detailed view of the species inhabiting the night skies over the MHWRA. The primary exception was that acoustic monitoring using full‐spectrum devices mounted on the turbines themselves largely failed to capture calls of migratory passerines, either because they generally flew too high or because background turbine noise masked their calls. In contrast, although the radar data did not allow for fine discrimination of species, it did provide valuable data on the spatial and temporal dynamics of collective bird and bat movements through the study‐area airspace and provided sufficient power to assess the influence of weather variables on bird and bat movements. Although comparatively limited in spatial scope, the night‐vision data then complimented the low‐altitude radar data by enabling discrimination of birds and bats and observations of behavioral responses to the presence of turbines. Further, both the radar and night‐vision data allowed for integrative modeling of relationships between bird and bat fatality patterns at turbines, bird and bat passage activity through study area, and landscape and weather variables of interest.
4.2 Passage Patterns Revealed by Radar Monitoring A primary objective of this study was to measure passage rates of bats and nocturnal migrant birds and to investigate the empirical relationship between nocturnal passage rates and fatality rates using a robust and intensive survey regime. It is very difficult to compare wind‐energy sites with respect to avian and bat fatalities without a standardized measure of comparison. Measuring passage and fatality rates using standardized methodology allows for both between‐site comparisons as well as within‐site comparisons across seasons and years. For example, if similar overall passage rates are recorded at two wind‐energy facilities, but the fatality rate is twice as high at one site compared to the other, it suggests that certain attributes of the former site (for example, project siting, turbine configuration, topography, habitat, etc.) contribute to the higher observed fatality rate. Such a standardized approach, applied with follow‐up investigations of potential causal attributes, should better inform stakeholders about elevated risk factors and avoiding or minimizing risk. In addition, such information would be potentially valuable in evaluating risk when investigating potential new sites for wind resource development.
4.2.1 Migration Timing Understanding the timing of bird and bat movements at multiple temporal scales (for example, within nights, within and across seasons, and among years) allows the determination of patterns of peak movements that may be useful information for both facilitating pre‐construction siting decisions and identifying operational strategies to reduce fatalities. The MHWRA is located in an area with a diverse community of resident and migratory bird species that have been documented across several pre‐ and post‐construction studies of wind facilities in the area (Ecology and Environment 2007). Numbers and movement patterns of different avian species groups present in the region vary seasonally. Based on the fact that songbirds and bats comprise the majority of known collisions with wind turbines (Erickson et al. 2001, 2002,

79
2008; Manville 2005; Kunz et al. 2007), the authors selected their study periods to overlap with peak fall migrations of songbirds and bats through the region.
Several radar studies have found a pattern in which the intensity of nocturnal migration begins to increase approximately 30–60 min after sunset, peaks around midnight, and then either levels off (Mabee et al. 2005a, 2006c; Plissner et al. 2006a, 2006b, 2006c) or declines steadily thereafter until dawn (Lowery 1951; Gauthreaux 1971; Kerlinger 1995; Farnsworth et al. 2004; Mabee et al. 2006a, 2006b). This study, however, did not reveal any consistent patterns of passage rate differences across hours of the night nor hourly differences in flight altitudes. This suggests that the MHWRA and outlying areas do not comprise important source areas or daytime stopover habitats for nocturnally migrating birds and bats. Instead, the collected data indicate that the majority of radar targets detected at the site are passing through the region moving steadily along an elevated “highway” with relevant source populations and stopover destinations well removed from the local area.
Within a season, migration generally occurs in pulses and the intensity of migration may differ greatly from one night to the next (Alerstam 1990, Mabee and Cooper 2004, Mabee et al. 2006c). The results of this study clearly showed this to be true during fall migration in the MHWRA (Figure 8). The pulsed nature of migration is cause for consideration of adequate sampling effort required to assess accurately seasonal migration passage patterns and rates. Unlike most studies of this duration, the authors did not observe any general patterns in radar‐target passage rates within seasons; however, this may simply reflect limited temporal sampling that did not adequately encompass the early and late stages of the overall bird and bat migration seasons. In addition, the patterns observed in the overall radar‐target passage data may primarily represent migrating birds, such that any seasonal passage patterns for migrating bats may have been masked by the much larger numbers of nocturnal‐migrant birds.
4.2.2 Migration Passage Rates Passage rates of radar targets provide an index of the numbers of birds and bats flying past a location and are widely used as metrics in studies of migration at proposed wind facilities (Mabee et al. 2006c). Documenting radar‐target passage rates therefore allows for comparisons of relative bird and bat use among different sites and regions, and provides a measure of activity to assess correlates with fatality rates at operational facilities. In this study, the authors derived two measures of passage rates: (1) the passage rate of all birds and bats passing over the study sites, and (2) the passage rate of migrants at altitudes below 125 meters agl (by adjusting the overall rate with the proportion of targets observed below 125 meters agl). Although both metrics are useful for characterizing bird and bat activity at proposed and existing wind facilities, the second metric is especially well suited for comparisons because it describes migration activity within the approximate vertical range of new‐generation wind turbines in the United States and as installed in the study area.
Overall fall passage rates in this study were higher than most reported elsewhere in the United States, especially among the limited number of comparable studies in western states (Appendix H). Mean nocturnal passage rates in the MHWRA ranged from 326–454 targets/kilometer/hour

80
across sites and years. For comparison at a continental scale, fall passage rates ranged from 19–290 targets/kilometer/hour at eight other sites in the western United States and from 64–661 targets/kilometer/hour at 21 sites in the eastern United States (Appendix H). Fall passage rates of targets flying below 125 meters agl, however, were lower in the MHWRA than at two other California sites and were well within the range of values for comparable studies throughout the United States (Appendix H).
4.2.3 Flight Altitude Flight altitudes are critical for understanding the vertical distribution of nocturnal migrants in the airspace and for modeling and understanding risk of exposure to wind turbine blades. Based on radar studies, most nocturnal migration occurs below approximately 1–1.5 kilometers agl (Mabee and Cooper 2004, Mabee et al. 2006c, Larkin 2006, Clemson Lab of Ornithology 2007). In general, passerines migrate at lower flight altitudes than do other major groups of over‐land migrants such as shorebirds and waterfowl (Kerlinger 1995). Large numbers of birds found dead at tall, manmade structures (generally lighted and guyed communications towers; Avery et al. 1980) and the predominance of nocturnal migrant passerines among such fatalities (Manville 2000; Longcore et al. 2005) indicates that large numbers of these birds fly below 500 meters agl on at least some nights. Studies of nocturnal passerine collision fatalities at wind facilities, however, indicate that large‐scale fatality events (>1 fatality/turbine/night) are extremely rare at wind facilities (Kerlinger et al. 2010). The results from the vertical distribution of radar targets in this study and those from other published studies indicate that the majority of nocturnal migrants fly below 600 meters agl (Bellrose 1971; Gauthreaux 1972, 1978, 1991; Bruderer and Steidinger 1972; Cooper and Ritchie 1995, Kerlinger 1995).
Similar to other migration studies (Cooper et al. 1995a, 1995b; Cooper and Mabee 2000; Mabee and Cooper 2004; Mabee et al. 2006c), the MHWRA study recorded substantial among‐night variation in mean flight altitudes of radar targets during migration (Figure 6). Daily variation in mean flight altitudes may reflect changes in species composition, vertical structure of the atmosphere, and/or weather conditions. Variation among nights in the flight altitudes of migrants at other locations has been associated primarily with changes in the vertical structure of the atmosphere. For example, birds crossing the Gulf of Mexico appear to fly at altitudes where favorable winds minimize the energetic cost of migration (Gauthreaux 1991). Kerlinger and Moore (1989), Bruderer et al. (1995), and Liechti et al. (2000) have concluded that atmospheric structure is the primary selective force determining the height at which migrating birds fly.
Mean fall flight altitudes in this study were within the range of values reported at other wind facilities in the United States (Appendix H). Percentages of radar targets at flight altitudes below 125 meters agl (2–5%), however, were lower than those observed at most other sites during fall studies in the western (3–11% at 6 sites) and eastern United States (3–13% at 16 sites; Appendix H). In particular, the percentages of targets flying below 125 meters agl at the MHWRA were lower than those recorded at two other California sites: 8% at Hatchet Ridge in Shasta County (Mabee and Sanzenbacher 2008) and 11% at Bear River Ridge in Humboldt County (Sanzenbacher et al. 2008). These percentages were standardized for approximate

81
dimensions of new‐generation turbines now commonly used at wind facilities in the United States, where the maximum rotor‐swept height is approximately 125 meters agl).
4.2.4 Flight direction The air mass in which birds migrate is continually changing in speed and direction and birds utilize and adjust for wind direction, wind speed, and altitudinal stratification (Newton 2008). In terms of wind utilization, migrating birds typically set off with following winds, and flying downwind in the appropriate direction for migration has obvious energetic benefits. In situations in which wind deviates from the appropriate direction for migration, the birds can compensate by heading at an angle to the wind. The point at which a bird is no longer able to compensate for lateral drift is a function of wind speed and direction (Newton 2008). If the winds are sufficiently strong, or the deviation is not too far off the intended course, birds will drift downwind. With respect to the MHWRA, the predominant passage direction of radar targets was easterly, which reflected the prevalence of strong westerly winds at this location. Because the general direction of fall migration for birds in California is southeast, a temporary easterly drift is not necessarily disadvantageous. Birds migrating southeast that encounter the west winds in the Delta region can drift eastwards. Due to the strong tailwinds in this direction, this strategy should be energetically favorable as it would move the birds a significant distance across the easterly component of the migratory vector with little energetic expenditure. Migrants can then turn in a more southerly direction as they encounter more favorable winds outside of the Delta region where a strong on‐shore flow from the Pacific Ocean typically prevails. Migrating bats may follow a similar strategy.
4.3 Modeling Migration Passage Rates and Flight Altitudes in Relation to Weather Variables
4.3.1 Passage Rates It is well established that general weather patterns and their associated temperatures and winds affect migration (Richardson 1978, 1990; Gauthreaux et al. 2005). Thus, it may be possible to formulate risk predictions for wind‐energy facilities based on weather forecasts. In the Northern Hemisphere, air moves counterclockwise around low‐pressure systems and clockwise around high‐pressure systems. Thus, winds are warm and southerly when an area is affected by a low to the west or a high to the east and are cool and northerly in the reverse situation. Clouds, precipitation, and strong, variable winds are typical in the centers of lows and near fronts between weather systems, whereas weather usually is fair with weak or moderate winds in high‐pressure areas. Numerous studies in the Northern Hemisphere have shown that, in fall, most bird migration tends to occur in the western parts of lows, the eastern or central parts of highs, or in intervening transitional areas. In contrast, warm fronts, which are accompanied by southerly (unfavorable) winds and warmer temperatures, tend to slow fall migration (Lowery 1951; Gauthreaux 1971; Able 1973, 1974; Blokpoel and Gauthier 1974; Richardson 1990; Gauthreaux et al. 2005). Conversely, more intense spring migration tends to occur in the eastern parts of lows, the western or central parts of highs, or in intervening transitional areas.

82
The authors examined the influence of various weather variables and seasonal timing on the passage rates and flight altitudes of radar targets. In general, their modeling results showed weak associations with weather variables and radar‐target passage rates. During the 2009 sampling period, passage rates increased as the season progressed, suggesting that sampling encompassed only the first half of migration passage, but no weather variables appeared to influence passage patterns appreciably. In contrast, during the 2010 sampling period a greater number of variables appeared to influence passage rates. In particular, passage rates decreased slightly with decreasing western crosswinds and wind speeds, and increased slightly during periods of increased lunar illumination and decreased cloud cover.
4.3.2 Flight Altitudes Radar studies have shown that wind is a key factor in migratory flight altitudes (Alerstam 1990). Birds fly mainly at heights at which head winds are minimized and tail winds are maximized (Bruderer et al. 1995). Because wind strength generally increases with altitude, bird migration generally takes place at lower altitudes in head winds and at higher altitudes in tail winds (Alerstam 1990). Most studies (all of those cited above except Bellrose 1971) have found that clouds influence flight altitude, but the results are inconsistent among studies. For example, some studies (Bellrose and Graber 1963, Hassler et al. 1963, Blokpoel and Burton 1975) found that birds flew both below and above cloud layers, whereas others (Nisbet 1963, Able 1970) found that birds tended to fly below clouds.
In general, the authors’ modeling results showed only weak associations between weather variables and the flight altitudes of radar targets, with no definitive patterns evident. Previous studies suggested that flight altitudes tended to increase under tailwind conditions (Alerstam 1990). Close examination of the data in this study indicated that the winds were consistently out of the west in 2009 (93% of sampling sessions), but that 2010 featured more variation (56% of sampling sessions with westerly crosswinds and 33% with southerly headwinds). In addition, during the MHWRA study, ceiling height (including fog) was consistently high (>501 meters) and therefore likely did not exert any appreciable influence on flight altitudes. Regardless, the need to understand how nocturnal migrants respond to fog and low ceiling height conditions is warranted. The largest single‐night kill for nocturnal avian migrants at a wind facility in the United States occurred on a foggy night during spring migration, when 27 passerines fatally collided with a turbine near a lit substation at the Mountaineer Wind Energy Center in West Virginia (Kerlinger 2003). Fatality events of this magnitude are rare at wind facilities (Kerlinger et al. 2010); however, large kills of migratory birds have sporadically occurred at other taller structures (for example, guyed and lighted towers >130 meters high) in many places across the country during periods of heavy migration, especially on foggy, overcast nights in fall (Weir 1976, Avery et al. 1980, Evans 1998, Trapp 1988, Erickson et al. 2001) and have occurred under similar conditions at an offshore platform in Germany (Huppop et al. 2006).

83
4.4 Identification of Migratory Birds and Bats Using Night-Vision Monitoring
Observations at wind facilities and other tall structures indicate that certain species groups, particularly migratory songbirds and bats (Manville 2005), are at increased risk of collision with structures. Determination of taxon‐specific risks to nocturnal migrants requires the identification of individuals migrating through the area of interest. Night‐vision goggles, coupled with infrared‐filtered spotlights, enable detection of small birds and bats at distances of >125 meters and therefore can be used to discern taxa of nocturnal animals flying at and below the rotor‐swept height of wind turbines. In this study, mean observation rates using night‐vision equipment were low for both birds and bats (<1 bird or bat/hour at both sites in both years) compared to observation rates during pre‐construction studies at other United States wind facilities (Appendix J). In 2009, the authors observed approximately equal numbers of birds and bats at both sites; however, in 2010 the ratios of birds:bats observed were 65:35 at Shiloh I site and 75:25 at High Winds. The proportions during both years were higher than have been recorded during pre‐construction studies at most other wind facilities in the United States (range: 61–91% birds; Appendix K).
4.5 Passage Activity and Behaviors within the High-Risk Zone The authors calculated fall turbine passage‐rate indices of 0.5–10.5 migrants/turbine/night, which are lower rates than documented at other sites in California (Mabee and Sanzenbacher 2008, Sanzenbacher et al. 2008) and are among the lowest values calculated for other sites throughout the United States (Appendix L). Note, however, that because the turbine passage‐rate indices at the other 14 sites were based on passage rates and flight altitudes measured prior to turbine construction, it is possible that the MHWRA rates, particularly for migrants flying below 125 meters agl, were depressed due to the presence of turbines.
Estimating turbine passage‐rate indices may be considered a starting point for developing a complete avian and bat risk assessment. Currently, however, little data are available to determine whether passage activity within the high‐risk zone and fatality rates are correlated at wind facilities and to what extent other factors (for example, weather) may be better or interacting predictors of fatality rates. Studies of concurrent bird and bat use, weather, and fatality data at operational wind facilities are necessary to determine whether bird and bat activity and/or weather conditions can be used to predict the likelihood of fatalities at such developments. As discussed further below, the current study helped provide new insight toward answering such questions.
Relatively few data are available on behavioral factors that may influence fatality rates at turbines, such as those influencing collision avoidance. Fatality rates are heavily influenced by the rate at which birds or bats avoid wind turbines (Chamberlain et al. 2006). The proportion of nocturnal migrants that detect and avoid turbines in the United States is not well quantified (but see Winkleman [1995] and Desholm and Kahlert [2005] for studies in Europe). Although currently no empirical data are available to predict a species’ ability to pass safely through the rotor‐swept area of a turbine, several methods for addressing this question have been proposed

84
(Tucker 1996, Desholm et al. 2006, Whitfield and Madders 2006, and Band et al. 2007). Considering the low avian fatality rates reported at existing wind facilities in the United States (Erickson et al. 2002, Strickland and Johnson 2006; Kerlinger et al. 2010), it appears likely that most birds are able to detect and/or avoid turbines. The authors’ behavioral data support this conclusion, in that night‐vision observations confirmed a few cases of flight change in apparent avoidance of turbines by bats, several owls, and a passerine, but no collisions with turbines during 369 hours of observations. That said, field personnel did observe two bats that flew between moving rotors and appeared to tumble in the air, presumably due to wind turbulence, before continuing to fly away. These bats were not recovered as fatalities, but they may have suffered from a degree of barotrauma (Baerwald et al. 2008).
4.6 Bat and Bird Vocalizations Detected by Acoustic Monitoring Despite having distributed eight acoustic monitoring stations among the 48 turbine towers, the authors recorded only 65 bat echolocation calls and no calls from nocturnal‐migrant birds during the fall months of 2009 and 2010. Although some acoustic stations failed intermittently, mostly due to power issues, the high number (142,541) of recordings suggested that equipment failure was not the primary cause for the paucity of bat and bird calls. Although not well documented in the literature, partly because many wind‐energy companies prefer to keep such data confidential, similar results with few bat and bird recordings have been recorded at other wind‐energy facilities in southern California (C. Johansson, Fresno City College, California, personal communication) and (J. Williams, Nevada Department of Wildlife, personal communication).
In this study, the acoustic station at Shiloh I turbine B16R recorded nearly all of the detected bat and bird calls. One possible reason for this pattern concerns the unique topographic situation of this turbine. The base of this tower was situated >10 meters below the surrounding topography, allowing for a lull in the wind where insects could potentially find refuge. Hence, this location may have provided a localized area where insects collected, which in turn may have attracted foraging bats and birds and accounted for the concentration of calls recorded there. Alternatively, the “bowl” formed around this turbine may have created a resonating effect that allowed for a disproportionate number of calls to be recorded, unlike might have been the case in more open situations. The calls at Tower B16R were made in a relatively short period, suggesting that the calls actually represented only a small number of individuals calling repeatedly. Although B16R recorded a relatively high number of calls, only one fatality, a Pacific slope flycatcher, was associated with this turbine. Foraging animals were presumably near the bottom of the turbine area below the rotor sweep area and within the bottom 10 meters of the turbine. In general, the radar data indicated that only a small percentage (8% for Shiloh I and 4% for High Winds) of migrants occurred below the rotor‐swept area of the turbines where bat or bird calls could be detected.
Bats may not need to echolocate while migrating (Crawford and Baker 1981, Kunz et al. 2007, Cryan and Barclay 2009) and instead may use vision for long‐distance orientation (Mueller 1968, Williams and Williams 1970, Johnson et al. 2003). Cryan and Barclay (2009) predicted that if

85
migrating bats were less likely to echolocate, call sequences would tend not to be detected at nacelle height, more bats would be present than echolocation passes detected, and that atypical echolocation calls (for example, startle calls) would be observed. In this study, the authors did not position bat detector microphones at full nacelle height, but at 30 meters agl the microphones recorded only two echolocation call sequences from hoary bats. The night‐vision data suggested that in fact there were many more bats present than were detected based on echolocation recordings. Although the authors detected no startle calls, bats may see the tower structure upon approach but may not benefit from a typical echo from the surface of the moving blade when bats approach from a lateral aspect (Long et al. 2009). The dearth of acoustic data supports the hypothesis that at some sites migrating bats do not routinely echolocate.
The acoustic monitoring devices recorded no nocturnal‐migrant birds; however, it may be difficult to capture calls from these migrants mostly because they typically produce faint calls (Evans 2011) and the intensity of calls varies considerably (Farnsworth et al. 2004). Additionally, although the K6P‐C Sennheiser microphones that the authors used are very sensitive, they positioned them at only 2 meters agl, whereas the radar revealed that nearly all migrants flew well above 125 meters agl. Recording anything but the resident birds at post‐construction wind energy facilities proved challenging and likely should be approached differently in the future. For example, future researchers may need to consider situating the bird microphones at higher altitudes and away from the turbines for them to prove effective.
4.7 Detecting Fatalities Although the authors measured carcass removal and detectability rates, the purpose of this study was not to estimate overall fatality rates but to attempt to draw correlations between fatality rates and observed numbers and movements of bats and birds on a daily basis. Carcass longevity was quite short in many cases, especially for small birds and bats, with sizeable majorities of such fatalities disappearing quicker than the weekly or greater intervals between successive searches adopted by all previous fatality‐monitoring efforts conducted in the MHWRA and most such efforts conducted in the nearby Altamont Pass Wind Resource Area. For this reason, the authors recommend that, whenever fatalities of small birds and bats are an issue of potential concern, sampling protocols should incorporate periods of daily fatality searches to refine estimates of carcass removal rates and ensure accurate estimates of species composition and fatality rates for these categories of animals.
Observer bias as measured in this study was biased against the observer because trials allowed the observers only one opportunity to find each carcass, and involved primarily small and cryptically colored birds and bats. Such specimens routinely “disappeared” behind dirt clods and within crop stubble. This approach provided an extremely conservative estimate of the observers’ abilities to detect carcasses. The authors think that the observers performed better discovering fresh fatalities, as evidenced from the number of bats and birds discovered during this study. As others have recommended previously, to develop robust protocols for conducting bias assessments when accurate estimation of overall fatality rates is a core objective, researchers should focus intently on the factors that influence carcass detectability and employ

86
sampling regimes and experimental designs that rigorously account for key variables such as terrain, vegetative cover, and the types of species involved in the expected fatalities.
4.8 Bird and Bat Fatalities in Relation to Passage Patterns and Weather Variables
4.8.1 Birds The fatality data were too limited to uncover potential relationships when limited to night‐migrant birds only, but with data for all bird fatalities combined, the results indicated higher fatality counts at Shiloh I compared to High Winds, earlier in the season, and when radar data indicated greater activity within the rotor‐swept zone, whether revealed in relation to declining flight altitudes or increasing passage rates at <125 meters agl. The higher probability of avian fatalities at Shiloh I compared to High Winds, the generally higher probability of fatalities when passage rates increased within the high‐risk zone (<125 agl), and evidence that passage rates at <125 meters agl tended to average higher at Shiloh I than at High Winds all combine to suggest that the Shiloh I site poses a greater risk to birds than the High Winds site. These results match the previous results of Kerlinger et al. (2006, 2009) illustrating 2–3 times higher fatality rates for birds at Shiloh I compared to High Winds. Reasons for this difference are uncertain but may in part reflect the relative proximity of the Shiloh I facility to more diverse wildlife habitats, such as the adjacent Montezuma Slough and Grizzly Island State Wildlife Area wetlands complex to the west.
Results from the current study also clearly indicate that, although there did not appear to be a detectable relationship between overall radar‐target passage rates and fatality rates in the study area, there was a detectable positive correlation between fatality rates and passage activity in the high‐risk zone, suggesting that altitude‐specific radar monitoring can be a useful tool for monitoring fatality risk for birds in this wind resource area.
4.8.2 Bats The overall probability of encountering bat fatalities increased during midseason, but this applied primarily to migratory tree‐roosting bats (hoary bats) and not the resident/migratory Mexican free‐tailed bats. The probability of encountering a tree‐roosting bat fatality also increased on warmer nights, whereas the probability of encountering a Mexican free‐tailed bat fatality increased during periods of high pressure and stronger winds. Based on results for all bats combined, fatalities also tended to increase when the average altitude of radar targets decreased and the flight direction of radar and night‐vision targets shifted to predominantly southeasterly. However, the group‐specific results were less conclusive with regard to results for activity indicators within the rotor‐swept zone.
The indications of higher bat fatalities during fair weather (warmer nights and higher barometric pressure) suggest a correlation with higher bat activity during periods of increased insect activity, which was also suggested in previous studies at wind facilities at Meyersdale, Pennsylvania, and Mountaineer, West Virginia (Kerns et al. 2005). Large hatches of insects associated with favorable weather and flight conditions may temporarily increase local bat

87
activity (Erickson and West 2002) and therefore contribute to this correlation. In contrast, the indication of higher fatality rates among Mexican free‐tailed bats during stronger winds contrasts with most other bat mortality data from North America (Arnett et al. 2008), which mostly has involved studies conducted outside the range of the Mexican free‐tailed bat where tree‐roosting bats comprise most fatalities. In Europe, however, the strongest flier (Nyctalus noctual) of four species of at‐risk, aerially foraging bats typically is killed during higher average wind speeds (Seiche 2008 in Rydell et al. 2011). Accordingly, as more wind‐energy studies are conducted within the range of the Mexican free‐tailed bat, perhaps this novel result from the current study will prove more common.
4.9 Spatial Patterns of Bird and Bat Fatalities Relationships between spatial variables and turbine‐related fatalities remain understudied and poorly understood at the level of regional landscapes (Cryan and Barclay 2009) and at the habitat level (Brinkmann 2006 in Arnett et al. 2007, Rydell et al. 2011). For example, Orloff and Flannery (1992), Anderson et al. (2004), and Kerns et al. (2005) suggested that towers at the end of turbine strings may pose a greater risk to wildlife than towers located in the middle of strings; however, Brinkmann (2006) detected no evidence of a non‐random distribution of kills among towers at several facilities in southern Germany; Fieldler (2004) detected no differences in the probability of fatalities occurring at three large turbines at Buffalo Mountain, Tennessee; and Kerlinger et al. (2008) previously detected no pattern of variation among turbines in the MHWRA. That said, a subsequent analysis based on a larger temporal sample revealed that the fatality rate in fact did increase from north to south at the Buffalo Mountain site (Arnett et al. 2008). In addition, by analyzing 4 years of pooled data from the MHWRA, the authors of the current study were able to detect significant relationships between the probability of fatalities and the proximity of turbines to specific habitat features. Therefore, it is becoming increasingly apparent that, at least in some cases, multiple years of intensive fatality monitoring may be necessary to reveal significant spatial relationships between turbine‐specific fatality rates and specific landscape features. Partly because of the broad range of ways the spatial distribution of fatalities has been studied and reported, in some cases with only limited data, the authors applied several analyses to study this question and recommend this approach for other similar investigations.
4.9.1 Birds Coefficients of dispersion and Kolmogorov‐Smirnoff tests revealed no evidence of significant variation from a Poisson random distribution for all bird fatalities combined and for night‐migrant birds only at either site. Except for all bird fatalities combined at Shiloh I, the coefficients of dispersion indicated slight tendencies toward a more uniform distribution rather than a tendency toward clustering. The Hot Spot analysis also indicated no definitive clustering of all bird fatalities at High Winds or of night‐migrant fatalities at either site. This suggests that the activity patterns of low‐altitude night migrants at both study sites and of all birds in the High Winds area, and therefore the probability of a fatality occurring, was equitably distributed across turbines and that no one turbine was particularly likely to result in a bird fatality. With so few nocturnal‐migrant bird fatalities, drawing definitive conclusions from these data would

88
be unwise. However, the Hot Spot analysis indicated two moderate hot spots, turbines D2 and B13 at Shiloh I, for all bird fatalities combined, which is consistent with the coefficient of dispersion indicating at least a slight tendency toward clumping. This suggests either that the all‐bird passage patterns through that site were less uniform, some individual turbines presented a greater risk of fatality than others did, and/or the detectability of avian fatalities was unevenly distributed. Turbine D2 cover comprised flat dry grass during most of the fatality surveys making the detection of fatalities comparatively easy, which likely contributed to its moderate Hot Spot category. Turbine B13 is located at the top of a ridge where raptors may be at a higher risk because they take advantage of declivity currents (Hoover 2002), which are created when wind is deflected upwards because of the underlying substrate, in this case, a hillside. However, the bird fatalities at B13 comprised 2 mourning doves, 1 red‐winged blackbird, and 1 American kestrel suggesting there may not be a single factor contributing to this moderate Hot Spot. The habitat analyses further suggested that night‐migrant bird fatalities were associated with a specific direction to the nearest riparian habitat, but showed no association with direction to the nearest eucalyptus grove. That said, these possible patterns derive from limited fatality sample sizes and should not be considered evidence to support possible mitigation by the removal or curtailment of specific turbines.
4.9.2 Bats As for birds, coefficients of dispersion and Kolmogorov‐Smirnoff tests revealed no evidence of significant variation from a Poisson random distribution for all bat fatalities combined or for Mexican free‐tailed and tree‐roosting bats alone at either site. However, the Hot Spot analyses identified fatality clusters at Shiloh I for all bats combined and for tree‐roosting bats, and at High Winds for Mexican free‐tailed bats. Further investigation of the landscape features around these hot‐spot sites revealed that distinct physical objects occurred near each location. For example, a large hay stack was located immediately east of Shiloh I turbine B18 where 5 bat fatalities occurred; watering troughs and flood lights from the NextEra Field Office were located southeast of High Winds turbine C18, where 3 hoary bat fatalities occurred; and flood lights from the NextEra Field Office occurred just north of High Winds turbine C21, where 3 Mexican free‐tailed bat fatalities occurred. Each of these features may have increased the densities of insects in localized areas, which, in turn, may have attracted bats.
Insectivorous bats are attracted to strong lights (Acharya and Fenton 1999), water resources (Rabe and Rosenstock 2005), and features that provide shelter from the wind (Lewis and Stevenson 1966) because of the prey base associated with these features. As a possible explanation for why three hoary bats collided with High Winds turbines C18 and three Mexican free‐tailed bats collided with turbine C21, yet no bat fatalities were observed in any of the other nearby turbines, migrating hoary bats may have left their roost at the largest of the eucalyptus groves to the northeast of C18, became attracted to the flood lights located approximately downwind from the eucalyptus grove, and collided at C18 occurring within the path between the grove and the light. In addition, at turbine C21, non‐migratory Mexican free‐tailed bats may have commuted north from roosts in dilapidated buildings and barns to the south, through the small protected canyon to the point where the floodlights were visible from the canyon, and

89
ultimately collided with turbine C21 between the north end of the canyon and the floodlights. Although several studies suggest that lights attract insects, which in turn attract foraging bats (Fenton 1997), there is no evidence to date suggesting that aviation lights on nacelles contribute to bat mortality (Kunz et al. 2007) and for MHWRA (Kerlinger et al. 2006). However, more observations are needed to determine if bats are attracted to incandescent and halogen lights positioned in the lee of structures that potentially attract flying insects.
The difference in roosting ecology of tree‐roosting bats and Mexican free‐tailed bats may also have influenced the greater number of Mexican free‐tailed bat turbine collisions during stronger winds. Hoary bats and western red bats roost in tree foliage, a readily available resource in most landscapes. In contrast, Mexican free‐tailed bats likely travel farther for an appropriate roosting habitat, often comprising manmade structures such as bridges or buildings with a specific temperature regime (Scales and Wilkins 2005). The nearest known Tadarida brasiliensis roost comprising more than 1,000 individuals is located approximately 16 kilometers north of the study area, although much smaller populations likely occur in the Montezuma Hills area. Mexican free‐tailed bats may tend to continue foraging in the lee of eucalyptus trees where insects congregate during higher winds, whereas hoary bats would likely simply roost in the foliage. Either species may leave a particular eucalyptus grove and begin migrating in the direction of the prevailing wind, as suggested by correlations between bat fatalities and the direction to the nearest eucalyptus grove.

90
CHAPTER 5: Management Implications Curtailment of individual wind turbines has been used as a technique to reduce bat fatalities at selected wind‐energy sites (Horn et al. 2008, Baerwald et al. 2009). At present, some wind turbines are delayed from starting up at low wind speeds (<5 meters/sec), hence curtailing the production of electricity but effectively reducing the fatality rate. This strategy would not likely affect the number of Mexican free‐tailed bat fatalities. However, if additional parameters such as changes in barometric pressure, wind direction, and time of day can more precisely define bat movements, then perhaps more refined prescriptions for curtailment can be developed and implemented. This would lead to reduced fatalities while giving wind plant operators more time to produce electricity.
Siting of wind turbines relative to avoiding or minimizing impacts to wildlife is one of the many factors that influence the decision to develop a wind‐energy facility. This study indicated that local habitat factors might influence the risk of collision fatality for both birds and bats. The authors recommend additional research on the relationships between habitats and fatalities to guide the future placement of individual wind turbines.

91
CHAPTER 6: Value to the Public California receives much of its energy from outside the state. It has natural gas delivered via pipelines from Canada and Texas. It imports much of its oil from Alaska, where production costs are high, resulting in some of the highest gasoline prices in the nation. Energy costs in California are not going to go down, yet Californians and the nation are captive to OPEC pricing and pressure. Because of greenhouse gas emissions, climate change is also changing the landscape of California, with species moving up in altitude as areas become warmer and dryer. Wind energy is only one element in a broad based portfolio of alternative sources of energy, such as solar, hydro, and wave, which can provide cleaner energy sources and reduce dependence on imported oil and gas.
Birds and bats have become important factors in the consideration of wind‐energy facility development, in large part because of bird fatalities observed in the Altamont Pass near Livermore, California, and bat fatalities at Bear River Ridge, West Virginia. The authors designed this study to help our understanding of the numbers of migrant birds and bats in the airspace of a wind facility, and to help correlate fatalities with various factors such as wind speed, direction, or proximity to habitat elements. As society comes to understand more about this process and these interactions, the authors think better decisions can be made regarding siting of wind turbines and facilities in California. More wind facilities along with other local energy sources will provide California with a measure of energy independence, contribute to greenhouse gas reduction, and promote a healthy economy by creating local, long‐term jobs in an industry that cannot be outsourced.

92
REFERENCES
Able, K. P. 1973. The role of weather variables and flight direction in determining the magnitude of nocturnal migration. Ecology 54: 1031–1041.
Able, K. P. 1974. Environmental influences on the orientation of free‐flying nocturnal bird migrants. Animal Behaviour 22: 224–238.
Acharya, L., and M. B. Fenton. 1999. Bat attacks and moth defensive behaviour around street lights. Canadian Journal of Zoology 77:27–33.
Alerstam, T. 1990. Bird migration. Cambridge University Press, Cambridge, United Kingdom.
Altamont Pass Avian Monitoring Team. 2008. Bird fatality study at Altamont Pass Wind Resource Area October 2005 to September 2007. Prepared for the Alameda County Community Development Agency, Hayward, California.
Anderson, R., N. Neumann., J. Tom, W.P. Erickson, M. D. Strickland, M. Bourassa, K. J. Bay, and K. J. Sernka. 2004. Avian monitoring and risk assessment at the Tehachapi Pass Wind Resource Area. NREL/SR‐500‐36416. National Renewable Energy Laboratory, Golden, Colorado.
Anderson, R., M. Morrison, K. Sinclair, and D. Strickland. 1999. Studying wind energy/bird interactions: a guidance document. Metrics and methods for determine or monitoring potential impacts on birds at existing and proposed wind energy sites. National Wind Coordinating Committee, Washington, DC.
Arnett, E. B. [technical editor]. 2005. Relationships between bats and wind turbines in Pennsylvania and West Virginia: an assessment of fatality search protocols, patterns of fatality, and behavioral interactions with wind turbines. Final report prepared for the Bats and Wind Energy Cooperative. Bat Conservation International, Austin, TX.
Arnett, E. B., W. K. Brown, W. P. Erickson, J. K. Fiedler, B. L. Hamilton, T. H. Henry, A. Jain, G. D. Johnson, J. Kerns, R. R. Koford, C. P. Nicholson, T. J. O’Connell, M. D. Piorkowski, and R. D. Tankersley, Jr. 2008. Patterns of bat fatalities at wind energy facilities in North America. Journal of Wildlife Management 72: 61–78.
Arnett, E. B., J. P. Hayes, and M. M. P. Huso. 2006. An evaluation of the use of acoustic monitoring to predict bat fatality at a proposed wind facility in southcentral Pennsylvania. Annual report submitted to the Bats and Wind Energy Cooperative. Bat Conservation International, Austin, Texas.
Arnett, E. B., D. B. Inkley, D. H. Johnson, R. P. Larkin, S. Manes, A. M. Manville, J. R. Mason, M. L. Morrison, M. D. Strickland, and R. Thresher. 2007. Impacts of wind energy facilities on wildlife and wildlife habitat. Wildlife Society Technical Review 07‐2. The Wildlife Society, Bethesda, Maryland

93
Avery, M. L., P. F. Springer, and N. S. Dailey. 1980. Avian mortality at manmade structures: an annotated bibliography (revised). Report No. FWS/OBS–80/54. U.S. Fish and Wildlife Service, Biological Services Program, Washington, DC.
Band, W., M. Madders, and D. P. Whitfield. 2007. Developing field and analytical methods to assess avian collision risk at wind farms. Pages 259–275 in M. de Lucas, G. F. E. Janss, and M. Ferrer (Editors), Birds and wind farms. Quercus, Madrid, Spain.
Barclay, M. R., E. F. Baerwald, and J. C. Gruver. 2007. Variation in bat and bird fatalities at wind energy facilities: assessing the effects of rotor size and tower height. Canadian Journal of Zoology. 85:381–387.
Baerwald, E. F. 2008. Variation in the activity and fatality of migratory bats at wind energy facilities in southern Alberta: causes and consequences. M.S. thesis, University of Calgary, Alberta, Canada.
Baerwald, E.F., J. Edworthy, M. Holder, and R.M.R. Barclay. 2009. A large‐scale mitigation experiment to reduce bat fatalities at wind energy facilities. Journal of Wildlife Management 73: 1077‐1081.
Bellrose, F. C. 1971. The distribution of nocturnal migration in the air space. Auk 88:397–424.
Bellrose, F. C., and R. R. Graber. 1963. A radar study of flight directions of nocturnal migrants. Pages 362–389 in C. G. Sibley (Editor), Proceedings of the XIII International Ornithological Congress, Ithaca, New York, 17‐24 June 1962. American Ornithologistsʹ Union and Museum of Zoology, Louisiana State University, Baton Rouge, Louisiana.
Blokpoel, H., and J. Burton. 1975. Weather and the height of nocturnal migration in east‐central Alberta: a radar study. Bird‐Banding 46: 311–328.
Blokpoel, H., and M. C. Gauthier. 1974. Migration of lesser snow and blue geese in spring across southern Manitoba, Part 2: influence of weather and prediction of major flights. Canadian Wildlife Service Report Series 32:1–28.
Brinkmann, R. 2006. Survey of possible operational impacts on bats by wind facilities in southern Germany. Report to the Administrative District of Ecological Consutancy, Gundefingen, Germany.
Bruderer, B., and A. Boldt. 2001. Flight characteristics of birds I. Radar measurements of speeds. Ibis 143:178–204.
Bruderer, B., and P. Steidinger. 1972. Methods of quantitative and qualitative analysis of bird migration with a tracking radar. Pages 151–168 in S. R. Galler, K. Schmidt‐Koenig, G. S. Jacobs, and R. E. Belleville (Editors), Animal orientation and navigation: a symposium. NASA SP262. U.S. Government Printing Office, Washington, DC.
Bruderer, B., T. Steuri, and M. Baumgartner. 1995. Short‐range high‐precision surveillance of nocturnal migration and tracking of single targets. Israeli Journal of Zoology 41:207–220.

94
Burnham, K. P., and D. R. Anderson. 2002. Model selection and multimodal inference: a practical information‐theoretic approach. Second edition. Springer‐Verlag, New York, New York.
California Energy Commission and California Department of Fish and Game. 2007. California guidelines for reducing impacts to birds and bats from wind energy development. Committee final draft report. CEC‐700‐2007‐008‐CMF. Renewables Committee and Energy Facilities Siting Division, California Energy Commission, and Resources Management and Policy Division, California Department of Fish and Game, Sacramento, California.
California Energy Commission. 2011. Integrated energy policy report. California Energy Commission, Sacramento, California.
California Department of Fish and Game. 2011. Biogeographic information and observation system. California Depart of Fish and Game, Sacramento, California. http://bios.dfg.ca.gov/ (last accessed September 2011).
Chamberlain, D. E., M. R. Rehfisch, A. D. Fox, M. Desholm, and S. J. Anthony. 2006. The effect of avoidance rates on bird mortality predictions made by wind turbine collision risk models. Ibis 148:198–202.
Clemson Lab of Ornithology. 2007. Migrating birds: typical distribution of migrants with altitude. http://virtual.clemson. edu/groups/birdrad/COM4A.HTM (last accessed September 2011).
Constantine, D.G. 1966. Ecological observations on lasurine bats in Iowa. Journal of Mammalogy 47:34–41.
Cooper, B. A., R. J. Blaha, T. J. Mabee, and J. H. Plissner. 2004a. A radar study of nocturnal bird migration at the proposed Cotterel Mountain wind‐energy facility, Idaho, fall 2003. Report prepared by ABR, Inc., Forest Grove, Oregon, for Windland, Inc., Boise, Idaho.
Cooper, B. A., R. H. Day, R. J. Ritchie, and C. L. Cranor. 1991. An improved marine radar system for studies of bird migration. Journal of Field Ornithology 62:367–377.
Cooper, B. A., R. H. Day, R. J. Ritchie, and C. L. Cranor. 1991. An improved marine radar system for studies of bird migration. Journal of Field Ornithology 62:367–377.
Cooper, B. A., C. B. Johnson, and E. F. Neuhauser. 1995a. The impact of wind turbines in upstate New York. Pages 607–611 in Proceedings of Windpower ’95 Annual Conference and Exhibition of the American Wind Energy Association, 26–30 March 1995. American Wind Energy Association, Washington, DC.
Cooper, B. A., C. B. Johnson, and R. J. Ritchie. 1995b. Bird migration near existing and proposed wind turbine sites in the eastern Lake Ontario region. Report prepared by ABR, Inc., Forest Grove, Oregon, for Niagara–Mohawk Power Corporation, Syracuse, New York.

95
Cooper, B. A., and T. J. Mabee. 2000. Bird migration near proposed wind turbine sites at Wethersfield and Harrisburg, New York. Report prepared by ABR, Inc., Forest Grove, Oregon, for Niagara‐Mohawk Power Corporation, Syracuse, New York.
Cooper, B. A., and R. J. Ritchie. 1995. The altitude of bird migration in east‐central Alaska: a radar and visual study. Journal of Field Ornithology 66:590–608.
Cooper, B. A., A. A. Stickney, and T. J. Mabee. 2004b. A radar study of nocturnal bird migration at the proposed Chautauqua wind energy facility, New York, fall 2003. Report prepared by ABR, Inc., Forest Grove, Oregon, for Chautauqua Windpower LLC, Lancaster, New York.
Crawford, R. L., and W. Baker. 1981. Bats killed at a north Florida television tower: a 25‐year record. Journal of Mammalogy 62: 651–652.
Cryan, P. M. 2003. Seasonal distribution of migratory tree bats (Lasiurus and Lasionycteris) in North America. Journal of Mammalogy, 84:579–593.
Cryan, P. M., and A. C. Brown. 2007. Migration of bats past a remote island offers clues toward the problem of bat fatalities at wind turbines. Biological Conservation 139:1–11.
Cryan, P. M., and R. M. R. Barclay. 2009. Causes of bat fatalities at wind turbines: hypotheses and predictions. Journal of Mammalogy 90:1330–1340.
Dawson, D., T. Jones, S. Mabey, and D. Mizrahi. 2007. Bird and bat migration over Appalachian Ridges, progress report, September 2007. USGS Patuxent Wildlife Research Center, Laurel, Maryland.
Desholm, M., A. D. Fox, P. D. L. Beasley, and J. Kahlert. 2006. Remote techniques for counting and estimating the number of bird‐wind turbine collisions at sea: a review. Ibis 148:76–89.
Desholm, M., and J. Kahlert. 2005. Avian collision risk at an offshore windfarm. Biology Letters 1:296–298.
Diehl, R. H., R. P. Larkin, and J. E. Black. 2003. Radar observations of bird migration over the Great Lakes. Auk 120:278–290.
Eastwood, E. 1967. Radar ornithology. Methuen and Co., Ltd., London, United Kingdom.
Jacques Whitford Limited. 2005. An investigation of a new monitoring technology for birds and bats. Jacques Whitford Project No. ONT50563. Report prepared by Jacques Whitford Limited, Markham, Ontario, for Suncor Energy Products, Inc., Vision Quest Windelectric‐TransAltaʹs Wind Business, Canadian Hydro Developerʹs, Inc, and Enbridge, Inc.
Ecology and Environment. 2007. Final Environmental Impact Report: Montezuma Wind Plant Project. Report prepared for Solano County Department of Resource Management, Fairfield, California.

96
Energy Information Administration. 2009. Renewable energy annual 2007. U.S. Department of Energy, Energy Information Administration, Office of Coal, Nuclear, Electric, and Alternate Fuels, Washington, DC.
Erickson, W. P., D. Strickland, D. Young, G. Johnson. 2008. A summary of avian and bat fatalities at wind facilities in the U.S. Presentation at the National Wind Coordinating Collaborative Research Meeting VII, Milwaukee, Wisconsin, November 2008.
Erickson, W. P., G. D. Johnson, D. P. Young, Jr., M. D. Strickland, R. E. Good, M. Bourassa, K. Bay, and K. Sernka. 2002. Synthesis and comparison of baseline avian and bat use, raptor nesting, and mortality information from proposed and existing wind developments. Report prepared by WEST, Inc., Cheyenne, Wyoming, for the Bonneville Power Administration, Portland, Oregon.
Erickson, W. P., G. D. Johnson, M. D. Strickland, D. P. Young, Jr., K. J. Sernka, and R. E. Good. 2001. Avian collisions with wind turbines: a summary of existing studies and comparisons to other sources of avian collision mortality in the United States. National Wind Coordinating Committee, Washington, DC.
Erickson, J. L., and S. D. West. 2002. The influence of regional climate and nightly weather conditions on activity patterns of insectivorous bats. Acta Chiropterologica 4:17–24.
Evans, W. E. 1998. Deadly towers. Living Bird 17:5.
Evans, W. R. 2011. Monitoring avian night flight calls—the new century ahead. Old Bird, Inc., Ithaca, New York, U.S.A. http://oldbird.org/NewCenturyAhead.pdf (last accessed September 2011).
Farnsworth, A. 2005. Flight calls and their value for future ornithological studies and conservation research. Auk 122:733–746.
Farnsworth, A., S. A. Gauthreaux, Jr., and D. van Blaricon. 2004. A comparison of nocturnal call counts of migrating birds and reflectivity measurements on Doppler radar. Journal of Avian Biology 35:365–369.
Fenton, M. B. 1970. A technique for monitoring bat activity with results obtained from different environments in southern Ontario. Canadian Journal of Zoology 48:847–851.
Fenton, M. B. 1997. Science and the conservation of bats. Journal of Mammalogy 78:1–14.
Fiedler, J. K. 2004. Assessment of bat mortality and activity at Buffalo Mountain wind facility, eastern Tennessee. M.S. Thesis. University of Tennessee, Knoxville, Tennessee.
Fiedler, J. K., T. H. Henry, C. P. Nicholson, and R. D. Tankersley. 2007. Results of bat and bird mortality monitoring at the expanded Buffalo Mountain Windfarm, 2005. Tennessee Valley Authority, Knoxville, Tennessee.
Gauthreaux, S. A., Jr. 1971. A radar and direct visual study of passerine spring migration in southern Louisiana. Auk 88:343–365.

97
Gauthreaux, S. A., Jr. 1972. Behavioral responses of migrating birds to daylight and darkness: a radar and direct visual study. Wilson Bulletin 84:136–148.
Gauthreaux, S. A., Jr. 1975. Radar ornithology: bird echoes on weather and airport surveillance radars. Clemson University Press, Clemson, South Carolina.
Gauthreaux, S. A., Jr. 1978. Migratory behavior and flight patterns. Pages 12–26 in M. Avery (Editor), Impacts of transmission lines on birds in flight. Report No. FWS/OBS–78/48. U.S. Fish and Wildlife Service, Office of Biological Services, Washington, DC.
Gauthreaux, S. A., Jr. 1980. Direct visual and radar methods for the detection, quantification, and prediction of bird migration. Special Publication No. 2. Department of Zoology, Clemson University, Clemson, South Carolina.
Gauthreaux, S. A., Jr. 1985a. Radar, electro‐optical, and visual methods of studying bird flight near transmission lines. Final report prepared for Electric Power Research Institute, Palo Alto, California.
Gauthreaux, S. A., Jr. 1985b. An avian mobile research laboratory: hawk migration studies. Pages 339–346 in M. Harwood (Editor), Proceedings of Hawk Migration Conference IV, Rochester, New York, 24–27 March 1983. Hawk Migration Association of North America.
Gauthreaux, S. A., Jr. 1991. The flight behavior of migrating birds in changing wind fields: radar and visual analyses. American Zoologist 31:187–204.
Gauthreaux, S. A., Jr., J. E. Michi, and C. G. Belser. 2005. The temporal and spatial structure of the atmosphere and its influence on bird migration strategies. Pages 182–193 in R. Greenberg and P. P. Marra (Editors), Birds of two worlds: the ecology and evolution of migration. John Hopkins University Press, Baltimore, Maryland.
Hall, L. S., and G. C. Richards. 1972. Notes on Tadarida australis (Chiroptera: Molossidae). Australian Mammalogy 1:46.
Horn, J. W., E. B. Arnett, and T. H. Kunz. 2008. Behavioral responses of bats to operating wind turbines. Journal of Wildlife Management 72:123–132.
Hosmer, D. W., and S. Lemeshow. 1989. Applied logistic regression. John Wiley & Sons, Inc., New York, New York.
Hoover, S. 2002. Red‐tailed hawk and golden eagle response to topography, weather and prey abundance at APWRA 1999‐2000_National Renewable Energy Laboratories. June 2002 NREL/SR-500-30868
Howell, J. A. 1997. Avian use and monitoring at the Sacramento Municipal Utility District wind energy site, Montezuma Hills, Solano County, California. Final report prepared for the Sacramento Municipal Utility District, Sacramento, California.

98
Howell, J. A., and J. Noone. 1992. Examination of avian use and mortality at a U.S. Windpower wind energy development site, Solano County, California. Final report prepared for the Solano County Department of Environmental Management, Fairfield, California.
Huppop, O., J. Dierschke, K, M. Exo, E. Fredrich, and R. Hill. 2006. Bird migration studies and potential collision risk with offshore wind turbines. Ibis 148: 90–109.
ICF Jones & Stokes. 2009. Altamont Pass Wind Resource Area 48‐hour search interval bird fatality study (kestrel/burrowing owl report). ICF J&S 00904‐08. Prepared by ICF Jones & Stokes, Sacramento, California, for the Alameda County Community Development Agency, Hayward, California.
Johnson, G. D., W. P. Erickson, M. D. Strickland, M. F. Shepherd, D. A. Shepherd, and S. A. Sarrapo. 2003. Mortality of bats at a large‐scale wind power development at Buffalo Ridge, Minnesota. West, Inc., Cheyenne, Wyoming.
Jacques Whitford Limited. 2005. An investigation of a new monitoring technology for birds and bats. Jacques Whitford Project No. ONT50563. Report prepared by Jacques Whitford Limited, Markham, Ontario, for Suncor Energy Products, Inc., Vision Quest Windelectric‐TransAltaʹs Wind Business, Canadian Hydro Developerʹs, Inc, and Enbridge, Inc.
Kerlinger, P. 1995. How birds migrate. Stackpole Books, Mechanicsburg, Pennsylvania.
Kerlinger, P. 2003. FAA lighting of wind turbines and bird collisions. Presentation at the NWCC Wildlife Working Group Meeting, 18 November 2003, Washington, DC.
Kerlinger, P., R. Curry, L. Culp, B. Fischer, A. Hasch, and C. Wilkerson. 2008. Post‐construction meteorological tower fatality study at the Shiloh I Wind Project site, Solano County, California. Final Report. Prepared by Curry & Kerlinger, LLC, McLean, Virginia, for enXco, San Diego, California.
Kerlinger, P., R. Curry, L. Culp, A. Hasch, A. Jain. 2009. Post‐construction avian monitoring study for the Shiloh I Wind Power Project, Solano County, California. Final report (revised). Prepared by Curry & Kerlinger, LLC, McLean, Virginia, for Iberdrola Renewables, Portland, Oregon.
Kerlinger, P., R. Curry, L. Culp, A. Hasch, and A. Jain. 2010. Post‐Construction Avian Monitoring Study for the Shiloh II Wind Power Project, Solano County, California: Year One Report. Prepared by Curry & Kerlinger, LLC, McLean, Virginia, for enXco Development Inc, San Diego, California.
Kerlinger, P., R. Curry, L. Culp, A. Jain, C. Wilkerson, B. Fischer, A. Hasch, and A. Jain. 2006. Post‐construction avian and bat fatality monitoring study for the High Winds Wind Power Project, Solano County, California: two‐year report. Prepared by Curry & Kerlinger, LLC, McLean, Virginia, for High Winds, LLC, and FPL Energy.

99
Kerlinger, P., R. Curry, C. Wilkerson, L. Culp, A. Hasch, and A. Jain. 2010. Avian monitoring study and risk assessment for the Shiloh III Wind Power Project, Solano County, California. Revised February 2010. Prepared by Curry & Kerlinger, LLC, McLean, Virginia, for enXco, San Diego, California.
Kerlinger, P., and F. R. Moore. 1989. Atmospheric structure and avian migration. Current Ornithology 6: 109–141.
Kerns, J, W. P. Erickson, and E. B. Arnett. 2005. Bat and bird fatality at wind energy facilities in Pennsylvania and West Virginia. Pages 24–95 in E. B. Arnett (Editor), Relationships between bats and wind turbines in Pennsylvania and West Virginia: an assessment of bat fatality search protocols, patterns of fatality, and behavioral interactions with wind turbines. A final report submitted to the Bats and Wind Energy Cooperative. Bat Conservation International, Austin, Texas.
Kunz, T. H., E. B. Arnett, W. P. Erickson, A. R. Hoar, G. D. Johnson, R. P. Larkin, M. D. Strickland, R. W. Thresher, and M. D. Tuttle. 2007. Ecological impacts of wind energy development on bats: questions, research needs, and hypotheses. Frontiers of Ecology and Environment, 5:315–324.
Larkin 2006 Larkin, R. P. 2006. Migrating bats interacting with wind turbines: what birds can tell us? Bat Research News 47:23–32.
Liechti, F., M. Klaassen, and B. Bruderer. 2000. Predicting migratory flight altitudes by physiological migration models. Auk 117:205–214.
Lewis, T., and J. W. Stephenson. 1966. The permeability of artificial windbreaks and the distribution of flying insects in the leeward sheltered zone. Annals of Applied Biology 58: 355–363.
Longcore, T. L., C. Rich, and S. A. Gauthreaux, Jr. 2005. Scientific basis to establish policy regulating communication towers to protect migratory birds: response to Avatar Environmental, LLC, report regarding migratory bird collisions with communications towers, WT Docket No. 03–187, Federal Communications Commission Notice of Inquiry. Report prepared by Land Protection Partners and Clemson University, Clemson, South Carolina, for the American Bird Conservancy, Defenders of Wildlife, Forest Conservation Council, and The Humane Society of the United States.
Long, C. V., J. A. Flint, P. A. Lepper, and S. A. Dible. 2009. Wind turbines and bat mortality: Interactions of bat echolocation pulses with moving turbine rotor blades. Proceedings of the Institute of Acoustics 31: 185‐192.
Lowery, G. H., Jr. 1951. A quantitative study of the nocturnal migration of birds. University of Kansas Museum of Natural History 3:361–472.
Mabee, T. J., and B. A. Cooper. 2000. Nocturnal bird migration at the Nine Canyon wind energy project, fall 2000. Report prepared by ABR, Inc., Forest Grove, Oregon, for Western

100
Ecosystems Technology Inc., Cheyenne, Wyoming, and Energy Northwest, Richland, Washington.
Mabee, T. J., and B. A. Cooper. 2004. Nocturnal bird migration in northeastern Oregon and southeastern Washington. Northwestern Naturalist 85:39–47.
Mabee, T. J., J. H. Plissner, J. B. Barna, and B. A. Cooper. 2007. A radar and visual study of nocturnal bird and bat migration at the proposed Centerville and Wethersfield windparks, New York, Fall 2006. Report prepared by ABR, Inc., Forest Grove, Oregon, for Ecology and Environment, Inc., Lancaster, New York and Noble Environmental Power LLC., Essex, Connecticut.
Mabee, T. J., J. H. Plissner, and B. A. Cooper. 2005a. A radar and visual study of nocturnal bird and bat migration at the proposed Prattsburgh‐Italy wind power project, New York, spring 2005. Report prepared by ABR, Inc., Forest Grove, Oregon, for Ecogen LLC, West Seneca, New York.
Mabee, T. J., J. H. Plissner, and B. A. Cooper. 2005b. A radar and visual study of nocturnal bird and bat migration at the proposed Flat Rock wind power project, New York, fall 2004. Report prepared by ABR, Inc., Forest Grove, Oregon, for Atlantic Renewable Energy Corporation, Dickerson, Maryland.
Mabee, T. J., J. H. Plissner, and B. A. Cooper. 2006a. A radar and visual study of nocturnal bird and bat migration at the proposed Centerville and Wethersfield windparks, New York, spring 2006. Report prepared by ABR, Inc., Forest Grove, Oregon, for Ecology and Environment, Inc., Lancaster, New York and Noble Environmental Power LLC., Essex, Connecticut.
Mabee, T. J., J. H. Plissner, B. A. Cooper, and D. P. Young. 2006c. Nocturnal bird migration over an Appalachian Ridge at a proposed wind power project. Wildlife Society Bulletin 34:682–690.
Mabee, T. J., J. H. Plissner, B. A. Cooper, and D. P. Young. 2010. A radar and visual study of nocturnal bird and bat migration at the proposed Coyote Crest wind power project, Washington, fall 2008. Report prepared by ABR, Inc., Forest Grove, Oregon, for Tetra Tech EC, Inc., Portland, Oregon and Everpower Renewables, Portland, Oregon.
Mabee, T. J., J. H. Plissner, B. A. Cooper, and J. B. Barna. 2006b. A radar and visual study of nocturnal bird and bat migration at the proposed Clinton County windparks, New York, spring and fall 2005. Report prepared by ABR, Inc., Forest Grove, Oregon, for Ecology and Environment, Inc., Lancaster, New York, and Noble Environmental Power LLC., Essex, Connecticut.
Mabee, T. J., and P. M. Sanzenbacher. 2008. A radar study of nocturnal bird and bat migration at the proposed Hatchet Ridge Wind Project, California, 2007. Report prepared by ABR, Inc., Forest Grove, Oregon, for Hatchett Ridge Wind, LLC, Portland, Oregon, and Western EcoSystems Technology, Inc., Cheyenne, Wyoming.

101
Manville, A. M. 2000. The ABCs of avoiding bird collisions at communication towers: the next steps. Pages 85–103 in R. L. Carlton (Editor), Avian interactions with utility structures. Proceedings of the Avian Interactions Workshop, 2 December 1999, Charleston, South Carolina. Technical Report No. 1000736. Electric Power Research Institute, Concord, California.
Manville, A. M. 2005. Bird strikes and electrocutions at power lines, communication towers, and wind turbines: state of the art and state of the science – next steps toward mitigation. Pages 1051–1064 in C. J. Ralph and T. D. Rich (Editors), Bird conservation implementation in the Americas: proceedings 3rd International Partners in Flight Conference 2002. General Technical Report PSW‐GTR‐191. USDA Forest Service, Pacific Southwest Research Station, Albany, California.
McCullagh, P., and J. A. Nelder. 1989. Generalized linear models. Second edition. Chapman and Hall, London, England, and New York, New York.
National Research Council. 2007. Environmental impacts of wind‐energy projects. The National Academies Press, Washington, DC.
National Wind Coordinating Collaborative. 2010. Wind turbine interactions with birds, bats, and their habitat: a summary of research results and priority questions. Fact sheet: spring 2010. National Wind Coordinating Committee. Washington, DC.
National Wind Coordinating Committee. 2004. Wind turbine interactions with birds and bats: a summary of research results and remaining questions. Fact Sheet: Second Edition. National Wind Coordinating Committee, Washington, DC.
Mueller, H. C. 1968. The role of vision in vespertilionid bats. American Midland Naturalist 79:524–525.
Newton, I. 2008. The migration ecology of birds. Academic Press, London, United Kingdom.
Nicholson, C. P., R. D. Tankersley, J. K. Fiedler, and N. S. Nicholas. 2005. Assessment and prediction of bird and bat mortality at wind energy facilities in the southeastern United States. Prepared for the Tennessee Valley Authority.
Nisbet, I. C. T. 1963. Measurements with radar of the height of nocturnal migration over Cape Cod, Massachusetts. Bird‐Banding 34:57–67.
Orloff, S., and A. Flannery. 1992. Wind turbine effects on avian activity, habitat use, and mortality in Altamont Pass and Solano County wind resource areas. CEC‐300‐1992‐001. Report prepared by Biosystems Analysis, Tiburon, California, for the California Energy Commission, Sacramento, California.
Perry, J. N., and R. Mead. 1979. On the power of the index of dispersion test to detect spatial pattern. Biometrics 35:613–622.

102
Piorkowski, M. D. 2006. Breeding bird habitat use and turbine collisions of birds and bats located at a wind farm in Oklahoma mixed‐grass prairie. M.S. Thesis. Oklahoma State University, Stillwater, Oklahoma.
Plissner, J. H., T. J. Mabee, and B. A. Cooper. 2005. A radar and visual study of nocturnal bird and bat migration at the proposed Casselman and Martindale Wind Power Projects, Pennsylvania, fall 2004. Report prepared by ABR, Inc., Forest Grove, Oregon, for Atlantic Renewable Energy Corporation, Dickerson, Maryland and Curry & Kerlinger, LLC, McLean, Virginia.
Plissner, J. H., T. J. Mabee, and B. A. Cooper. 2006a. A radar and visual study of nocturnal bird and bat migration at the proposed Highland New Wind Development, Virginia, fall 2005. Report prepared by ABR, Inc., Forest Grove, Oregon, for Highland New Wind Development, LLC, Harrisonburg, Virginia.
Plissner, J. H., T. J. Mabee, and B. A. Cooper. 2006b. A radar and visual study of nocturnal bird and bat migration at the proposed Preston County, West Virginia, and Fayette County, Pennsylvania, Wind Power Projects, spring and fall 2005. Report prepared by ABR, Inc., Forest Grove, Oregon, for PPM Atlantic Renewable, Washington, DC.
Plissner, J. H., T. J. Mabee, and B. A. Cooper. 2006c. A radar and visual study of nocturnal bird and bat migration at the proposed Swallow Farm Wind Power Project, Pennsylvania, fall 2005. Report prepared by ABR, Inc., Forest Grove, Oregon, for St. Francis University, Loretto, Pennsylvania.
Plissner, J. H., T. J. Mabee, and B. A. Cooper. 2007. A radar and visual study of nocturnal bird and bat migration at the proposed Somerset County and Bedford County Wind Power Projects, Pennsylvania, spring and fall 2006. Report prepared by ABR, Inc., Forest Grove, Oregon, for Shaffer Mountain Wind LLC, Philadelphia, PA, and PPM Atlantic Renewable, Washington, DC.
Rabe, M. J., and S. S. Rosenstock. 2005. Influence of water size and type on bat captures in the lower Sonoran Desert. Western North American Naturalist 65:87–90.
Redell, D., E. B. Arnett, and J. P Hayes. 2006. Patterns of pre‐construction bat activity determined using acoustic monitoring at a proposed wind facility in south‐central Wisconsin. Prepared by Bat Conservation International, Austin, Texas, for the Bats and Wind Energy Cooperative.
Richardson, W. J. 1978. Timing and amount of bird migration in relation to weather: a review. Oikos 30:224–272.
Richardson, W. J. 1990. Timing of bird migration in relation to weather: updated review. Pages 79–100 in E. Gwinner (Editor), Bird migration. Springer–Verlag, Berlin, Germany.

103
Rydell, J., L. Bach, L., M. J. Dubourg‐Savage, M. Green, L. Rodrigues, and A. Hedenström. 2011. Bat mortality at wind turbines in northwestern Europe. Acta Chiropterologica 12:261–274.
Sanders, S., and L. Spiegel. 2008. A roadmap for PIER research on methods to assess and mitigate impacts of wind energy development on birds and bats in California. CEC 500‐ 2008‐076. California Energy Commission, Sacramento, California.
Sanzenbacher, P. M., B. A. Cooper, and T. J. Mabee. 2008. A radar and visual study of nocturnal bird and bat migration at the proposed Bear River Windpark, California, fall 2006. Report prepared by ABR, INC, Forest Grove, Oregon, for Shell Wind Energy Inc., Houston, Texas.
Scales, J. A., and K. T. Wilkins. 2005. Seasonality and fidelity in roost use of the Mexican free‐tailed bat, Tadarida brasiliensis, in an urban setting. Western North American Naturalist 67:402–408.
Seiche, K. 2008. Fledermäuse und Windenergienlagen in Sachesen 2006. Report to Freistaat Sachsen. Landesamt fur Umwelt und Geologie. http://www.smul.sachsen.de/lfug.
Skolnik, M. I. 1980. Introduction to radar systems. McGraw‐Hill, New York, New York.
Smallwood, K. S., and C. Thelander. 2004. Developing methods to reduce bird mortality in the Altamont Pass Wind Resource Area. Final Report. Contract No. 500‐01‐019. California Energy Commission, Public Interest Energy Research – Environmental Area, Sacramento, California.
Smallwood, K. S., and C. Thelander. 2005. Bird mortality at the Altamont Pass Wind Resource Area, March 1998 – September 2001. Final Report NREL/SR‐500‐36973. National Renewable Energy Laboratory, Golden, Colorado.
Smallwood, K. S. 2006. Biological effects of repowering a portion of the Altamont Pass Wind Resource Area, California: the Diablo Winds Energy Project. http://www.altamontsrc.org/alt_doc/r34_biological_effects_diablo_winds_smallwood_07_2006.pdf (last accessed August 2011).
Solomon S., D. Qin, M. Manning, Z. Chen, M. Marquis M., K. Averyt, M. M. B. Tignor, H. L. Miller, Jr. (Editors.). 2007. Climate Change 2007: The Physical Science Basis. Contribution of Working Group 1 to the Fourth Assessment Report of the Intergovernmental Panel on Climate Change. Cambridge University Press, Cambridge, United Kingdom, and New York, New York.
Strickland, D., and D. Johnson. 2006. Overview of what we know about avian/wind interaction. Presentation at the National Wind Coordinating Committee, Wildlife Working Group Meeting VI, San Antonio, Texas.

104
Trapp, J. L. 1998. Bird kills at towers and other human‐made structures: an annotated partial bibliography (1960–1998). U.S. Fish and Wildlife Service, Office of Migratory Bird Management, Arlington, Virginia.
Tucker, V. A. 1996. A mathematical model of bird collisions with wind turbine rotors. ASME Journal of Solar Energy Engineering 118:253–262.
Tuttle, M. D. 1988. America’s neighborhood bats. University of Texas Press, Austin, Texas.
U. S. Department of Energy. 2008. 20% wind energy by 2030: increasing wind energy’s contribution to U.S. electricity supply. DOE/GO‐102008‐2567. U. S. Department of Energy, Oakridge, Tennessee.
U.S. Department of Energy. 2009. Information resources: states with renewable portfolio standards. http://apps1.eere.energy.gov/states/maps/renewable _portfolio_states.cfm (last accessed August 2011).
U.S. Geological Survey. 2003. Physiographic regions of the United States. http://tapestry.usgs.gov/physiogr/physio.html (last accessed August 2011).
U.S. Government Accountability Office. 2005. Impacts on wildlife and government responsibilities for regulating development and protecting wildlife. Report to Congressional Requesters. Report No. GAO‐05‐906. U.S. Government Accountability Office, Washington, DC.
Weir, R. D. 1976. Annotated bibliography of bird kills at man‐made obstacles: a review of the state of the art and solutions. Canadian Wildlife Service, Ottawa, Ontario, Canada.
Whitfield, D. P. and M. Madders. 2006. Deriving collision avoidance rates for red kites Milvus milvus. Natural Research Information Note 3. Natural Research Ltd, Banchory, United Kingdom.
Wiggelinkhuizen, E. J., S. A. M. Barhorst, L. W. M. M. Rademakers, H. J. den Boon, and S. Dirksen. 2007. Bird collision monitoring system for multi‐megawatt wind turbines Wt‐Bird®. Report No. ECN‐E‐06‐027. Energy Research Centre of The Netherlands, Petten, The Netherlands.
Williams, T. C. and J. M. Williams. 1970. Radio tracking of homing and feeding flights of a neotropical bat. Animal Behavior 18:302–309.
Williams, T. C., J. M. Williams, P. G. Williams, and P. Stokstad. 2001. Bird migration through a mountain pass studied with high‐resolution radar, ceilometers, and census. Auk 118:389–403.
Williams, T. C., J. Settel, P. O’Mahoney, and J. M. Williams. 1972. An ornithological radar. American Birds 26:555–557.

105
Winkelman, J. E. 1995. Bird/wind turbine investigations in Europe. Pages 43–47 and 110–140 in LGL, Ltd. (Editor), Proceedings of National Avian–Wind Power Planning Meeting I, Lakewood, Colorado.
Woodlot Alternatives. 2005a. A fall 2004 radar, visual, and acoustic survey of bird and bat migration at the proposed WindFarm Prattsburgh Project in Prattsburgh, New York. Report prepared by Woodlot Alternatives, Inc., Topsham, Maine, for Windfarm Prattsburgh, LLC. Prattsburgh, New York.
Woodlot Alternatives. 2005b. A fall 2005 radar, visual, and acoustic survey of bird and bat migration at the proposed Howard Wind Project in Howard, New York. Report prepared by Woodlot Alternatives, Inc., Topsham, Maine, for EverPower Global, New York, New York.
Yonker, T. L., and L. Landon. 2005. Nocturnal radar study of bird migration at the proposed Noble Environmental Power, LLC, wind generating project, Bliss, New York. Report prepared by Marine Services Diversified, LLC, Youngstown, New York, for Noble Environmental Power LLC., Essex, Connecticut, and Ecology and Environment, Inc., Lancaster, New York.
Young, D. P., Jr., C. S. Nations, V. K. Poulton, and J. Kerns. 2006. Avian and bat studies for the proposed Dairy Hills wind project, Wyoming County, New York, Final report, April – October 2005. Report prepared by Western EcoSystems Technology Inc., Cheyenne, Wyoming, for Horizon Wind Energy, Albany, New York.
Zar, J. H. 1999. Biostatistical analysis. Third edition. Prentice‐Hall, Inc., Englewood Cliffs, New Jersey.
Zuur, A. F., E. N. Ieno, N. J. Walker, A. A. Saveliev, and G. M. Smith. 2009. Mixed effects models and extensions in ecology. R. Springer Science+Business Media, LLC, New York, New York.

A‐1
APPENDIX A: Full model set from analyses employing Akaike’s Information Criterion (AIC) to investigate the influence of environmental factors on passage rates of radar targets during fall 2009 and fall 2010 at the Shiloh I and High Winds sites in the Montezuma Hills Wind Resource Area, Solano County, California. The full model set examining flight altitudes was similar but notable differences include 1) use of the quadratic form of date for fall 2009 analyses, and 2) variable for favorable migration was excluded.
MODEL
Global: wind direction + wind direction*wind speed + favorable migration(d) + lunar illumination*cloud cover + synoptic + date 1
Global: wind direction + wind direction*wind speed + lunar illumination*cloud cover + synoptic + date 2
Wind direction Wind direction + favorable migration(d) 1 Wind direction + lunar illumination*cloud cover Wind direction + date Wind direction*wind speed + favorable migration(d) + date 1 Wind direction*wind speed + lunar illumination*cloud cover + date Wind direction*wind speed + favorable migration(d) 1 Wind direction*wind speed + favorable migration(d) + lunar illumination*cloud cover 1 Wind direction*wind speed + favorable migration(d) + lunar illumination*cloud cover + date 1 Wind direction*wind speed Wind direction*wind speed + favorable migration(d) 1 Wind direction*wind speed + lunar illumination*cloud cover Wind direction*wind speed + date Favorable migration(d) 1 Favorable migration(d) + lunar illumination*cloud cover 1 Favorable migration(d) + date 1 Lunar illumination*cloud cover Lunar illumination*cloud cover + date Synoptic Synoptic + date Date
1 Indicates model not included in flight altitude analyses.
2 Indicates model not included in passage rate analyses.

B‐1
APPENDIX B: Calculation of turbine passage rate indices (estimated number of targets passing within the area occupied by each proposed turbine) during nocturnal periods during fall 2009 and fall 2010 at the Shiloh I and High Winds sites in the Montezuma Hills Wind Resource Area, Solano County, California.
Fall 2009 Fall 2010 Calculation parameter Shiloh I 1 High Winds Shiloh I 1 High Winds
WIND-TURBINE CHARACTERISTICS (A) Total turbine height (meters) 118.5 100 118.5 100 (B) Blade radius (meters) 38.5 40 38.5 40 (C) Height below blade (meters) 41.5 20 41.5 20 (D) Approximate front-to-back width (meters)
6 6 6 6
(E) Minimal (side profile) area (m2) = A × D 711 600 711 600 (F) Maximal (front profile) area (m2) = (C × D) + (_ × B2)
4,905.6 5,146.6 4,905.6 5,146.6
PASSAGE RATE (G) Mean rate below 125 meters agl (targets/kilometer/hour)
15.94 10.01 26.75 13.66
(H) Area sampled below 125 meters agl = 125 x 1,000 (m2)
125,000 125,000 125,000 125,000
(I) Mean passage rate per unit area (targets/m2/hour) = G/H
0.0001275 0.0000800 0.0002140 0.0001092
TURBINE PASSAGE RATE INDEX (J) Mean number of hours of darkness (hours/night)
10 10 10 10
(K) Minimum number of targets/kilometer/hour in zone of risk = E x I
0.090643 0.048025 0.152181 0.065547
(L) Maximum number of targets/kilometer/hour in zone of risk = F x I
0.625402 0.411939 1.049995 0.562235
(M) Minimum number of targets in zone/d = J x K
0.91 0.48 1.52 0.66
(N) Maximum number of targets in zone/d =J x L
6.25 4.12 10.50 5.62
1 Shiloh I turbines include only turbines with hub height of 80 meters.

C‐1
APPENDIX C: Mean (± SE) passage rates, altitude‐specific passage rates (<125 meters agl), and flight altitudes of nocturnal radar targets observed at the 1.5‐kilometer range, and mean proportions of bats observed at ≤150 meters agl with night‐vision goggles during half‐month periods during fall 2009 and fall 2010 at the Shiloh I and High Winds sites in the Montezuma Hills Wind Resource Area, Solano County, California
Dates
Station/metric 14–31 Aug 1–15 Sep 16–30 Sep 1–15 Oct 16–31 Oct Total Fall 2009
Shiloh I Number nights sampled 6 5 5 5 - 21 Passage rate (targets/kilometer/hour) 266 ± 32 325 ± 38 393 ± 60 333 ± 29 - 326 ± 21 Passage rate at <125 meters agl (targets/kilometer/hour)
8 ± 4 13 ± 6 26 ± 20 19 ± 6 - 16 ± 5
Flight altitude (meters agl) 370 ± 10 390 ± 10 495 ± 9 364 ± 6 - 409 ± 5 Mean proportion of bats at <150 meters agl 8% 33% 69% 69% - 49%
High Winds Number nights sampled 6 4 5 5 - 20 Passage rate (targets/kilometer/hour) 380 ± 27 407 ± 42 490 ± 30 520 ± 55 - 448 ± 22 Passage rate at <125 meters agl (targets/kilometer/hour)
11 ± 5 8 ± 3 7 ± 2 13 ± 4 - 10 ± 2
Flight altitude (meters agl) 395 ± 6 419 ± 6 522 ± 8 494 ± 8 - 467 ± 4 Mean proportion of bats at <150 meters agl 20% 50% 67% 100% - 56%
Fall 2010 Shiloh I
Number nights sampled - 5 5 5 6 21 Passage rate (targets/kilometer/hour) - 332 ± 52 416 ± 41 632 ± 56 440 ± 134 454 ± 47 Passage rate at <125 meters agl (targets/kilometer/hour) - 18 ± 7 21 ± 7 52 ± 11 16 ± 4 27 ± 5
Flight altitude (meters agl) - 428 ± 8 498 ± 9 502 ± 9 488 ± 8 479 ± 4 Mean proportion of bats at <150 meters agl - 27% 11% 54% 21% 35%
High Winds Number nights sampled 2 6 2 5 5 20 Passage rate (targets/kilometer/hour) 400 ± 60 430 ± 76 273 ± 42 388 ± 47 311 ± 68 371 ± 32 Passage rate at <125 meters agl (targets/kilometer/hour)
17 ± 5 22 ± 9 1 ± 1 12 ± 3 11 ± 3 14 ± 3
Flight altitude (meters agl) 592 ± 21 440 ± 12 418 ± 23 469 ± 11 491 ± 12 479 ± 6 Mean proportion of bats at <150 meters agl 1 25% 0% 67% 0% 25%
1 No birds or bats observed

D‐1
APPENDIX D: Nocturnal flight altitudes of radar targets (% of total targets) detected at the 1.5‐kilometer range during fall 2009 and fall 2010 at the Shiloh I and High Winds sites in the Montezuma Hills Wind Resource Area, Solano County, California.
Fall 2009 Fall 2010 Flight Shiloh I High Winds Shiloh I High Winds
Altitude (n = 2,353 targets) (n = 4,308 targets) (n = 4,128 targets) (n = 2,222 targets) (meters agl) Per Category Cumulative Per Category Cumulative Per Category Cumulative Per Category Cumulative
1–25 0.0 0.0 0.0 0.0 0.0 0.0 0.0 0.0 26–50 0.1 0.1 0.1 0.1 0.5 0.5 0.5 0.5 51–75 0.5 0.6 0.3 0.4 1.0 1.5 1.0 1.5 76–100 1.4 2.0 0.6 1.0 1.2 2.7 1.2 2.7
101–125 2.5 4.5 1.0 2.0 1.9 4.6 1.9 4.6 126–150 4.2 8.7 1.2 3.2 2.9 7.4 2.9 7.4 151–175 4.1 12.8 2.2 5.4 3.9 11.4 3.9 11.4 176–200 4.8 17.6 3.4 8.8 3.6 15.0 3.6 15.0 201–225 4.5 22.1 3.9 12.7 3.5 18.4 3.5 18.4 226–250 5.4 27.5 4.8 17.5 4.0 22.4 4.0 22.4
251–1,500 72.5 100.0 82.5 100.0 77.6 100.0 77.6 100.0

E‐1
APPENDIX E: Complete linear mixed model sets with weights (wi) >0 explaining the influence of weather variables on passage rates (surveillance radar) and flight altitudes (vertical radar) of radar targets during fall 2009 and fall 2010 at the Shiloh I and High Winds study sites in the Montezuma Hills Wind Resource Area, Solano County, California. Model weights (wi) were based on Akaike’s Information Criterion (AICc).
Analysis/Model -2 Log Likelihood 1 K 2 AICc 3 ΔAICc 4 wi 5
Fall 2009
Rates (n = 240 sampling sessions)
Lunar illumination*cloud cover + date 1237.3 12 1262.6 0 0.32 Wind direction*wind speed + lunar illumination*cloud cover + date 1226.5 17 1263.3 0.62 0.24 Global: wind direction + wind direction*wind speed + favorable migration(d) + lunar illumination*cloud cover + synoptic + date 1219.5 20 1263.4 0.73 0.22
Wind direction*wind speed + favorable migration(d) + lunar illumination*cloud cover + date 1226.2 18 1265.3 2.61 0.09 Synoptic + date 1244.3 11 1267.5 4.81 0.03 Wind direction*wind speed + lunar illumination*cloud cover 1234.5 16 1268.9 6.28 0.01 Date 1250.2 9 1268.9 6.29 0.01 Synoptic 1248.1 10 1269.1 6.41 0.01 Wind direction*wind speed + date 1239.4 14 1269.2 6.59 0.01 Wind direction*wind speed 1242.8 13 1270.4 7.74 0.01 Wind direction*wind speed + favorable migration(d) + lunar illumination*cloud cover 1233.7 17 1270.4 7.79 0.01 Lunar illumination*cloud cover 1247.5 11 1270.7 8.03 0.01
Flight altitudes (n = 240 sampling sessions) Wind direction + lunar illumination*cloud cover 882.3 13 909.9 0 0.36 Wind direction 889.5 10 910.5 0.56 0.27 Wind direction + date 889.2 11 912.4 2.42 0.11 Date (quadratic) 892.0 10 913.0 3.06 0.08 Lunar illumination*cloud cover + date 888.5 12 913.8 3.88 0.05 Lunar illumination*cloud cover 891.9 11 915.1 5.16 0.03 Synoptic 894.3 10 915.3 5.33 0.03 Wind direction*wind speed + lunar illumination*cloud cover + date 878.9 17 915.6 5.70 0.02 Wind direction*wind speed + lunar illumination*cloud cover 881.9 16 916.3 6.38 0.01 Synoptic + date 893.2 11 916.3 6.40 0.01 Wind direction*wind speed 889.1 13 916.7 6.72 0.01 Global: wind direction + wind direction*wind speed + lunar illumination*cloud cover + synoptic + date 874.6 20 918.5 8.53 0.01

E‐2
Analysis/Model -2 Log Likelihood 1 K 2 AICc 3 ΔAICc 4 wi 5
Fall 2010
Rates (n = 242 sampling sessions) Wind direction*wind speed + lunar illumination*cloud cover 1313.3 16 1347.7 0 0.53 Wind direction*wind speed + favorable migration(d) + lunar illumination*cloud cover 1313.1 17 1349.8 2.10 0.18 Wind direction*wind speed + lunar illumination*cloud cover + date 1313.3 17 1350.0 2.31 0.17 Wind direction*wind speed + favorable migration(d) + lunar illumination*cloud cover + date 1313.1 18 1352.2 4.43 0.06 Global: wind direction + wind direction*wind speed + favorable migration(d) + lunar illumination*cloud cover + synoptic + date 1312.2 19 1353.7 5.93 0.03
Wind direction + lunar illumination*cloud cover 1327.6 13 1355.2 7.46 0.01 Lunar illumination*cloud cover 1333.9 11 1357.0 9.27 0.01 Lunar illumination*cloud cover + date 1329.5 12 1354.9 7.13 0.01
Fight altitudes (n = 241 sampling sessions) Wind direction + date -147.8 11 -124.6 0 0.41 Wind direction -144.2 10 -123.2 1.44 0.2 Synoptic + date -142.7 10 -121.7 2.92 0.09 Date (quadratic) -142.4 10 -121.5 3.16 0.08 Wind direction*wind speed + date -150.4 14 -120.5 4.10 0.05 Wind direction*wind speed -148.1 13 -120.5 4.12 0.05 Synoptic -139.3 9 -120.5 4.14 0.05 Lunar illumination*cloud cover + date -144.5 12 -119.1 5.50 0.03 Wind direction + lunar illumination*cloud cover -145.4 13 -117.8 6.81 0.01 Lunar illumination*cloud cover -139.5 11 -116.4 8.28 0.01 1 Calculated with the Maximum Likelihood method. 2 Number of estimable parameters in approximating model (see methods for explanation). 3 Akaike’s Information Criterion corrected for small sample size. 4 Difference in value between AICc of the current model versus the best approximating model with the minimal AICc value. 5 Akaike weight—probability that the current model (i) is the best approximating model among those being considered.

F‐1
APPENDIX F: Comprehensive list of bird and bat fatalities documented during fatality surveys conducted in fall 2009 and fall 2010 at the Montezuma Hills Wind Resource Area, Solano County, California.
Site Turbine ID UTM Easting1
UTM Northing Date Species Sex Age2 Carcass
Condition3 Notes
High Winds C23 604753 4221627 21-Aug-09 American Kestrel M A F Found behind turbine High Winds C18 604118 4222167 31-Aug-09 American Kestrel F A F High Winds C23 604771 4221632 03-Sep-09 American Kestrel M A F Shiloh I B13 598329 4223575 28-Sep-09 American Kestrel F A S Shiloh I D01 600510 4223443 07-Sep-10 American Kestrel M A S Wings only Shiloh I B16 599513 4223454 18-Sep-10 American Kestrel M A I
Shiloh I B20 598778 4223763 28-Oct-10 American Kestrel F U I
Right forearm and wrist broken. Probable juvenile but data equivocal; carcass scavenged and largely gone by 11/1/10
High Winds C20 604362 4221965 17-Aug-09 American Pipit U J S Shiloh I D04 599907 4222781 08-Sep-10 Barn Owl U U S Old carcass High Winds E37 605826 4222718 21-Sep-09 Black-throated Gray Warbler F J I High Winds C27 604872 4220941 05-Oct-09 Black-throated Gray Warbler F J I
Shiloh I B03 599147 4223989 13-Oct-10 Canada Goose U U I Broken neck; blood from mouth and nares
High Winds C17 603968 4222286 01-Sep-09 Chestnut-backed Chickadee U U S Shiloh I A33 598713 4224573 11-Oct-09 Golden-crowned Kinglet M A S Shiloh I B14 598898 4223346 12-Oct-10 Hermit Thrush U U S Cut in half; only 1 leg High Winds C28 604996 4220790 19-Aug-09 Hermit Warbler M A I High Winds D29 604549 4223003 06-Oct-09 Horned Lark U U S Shiloh I B11 600090 4223869 22-Aug-09 Mallard U A S Shiloh I B13 598876 4223556 26-Aug-09 Mourning Dove U A F Shiloh I B03 599130 4223959 05-Sep-09 Mourning Dove U U F Shiloh I B05 599924 4224057 07-Sep-09 Mourning Dove U A S Shiloh I B13 598866 4223592 26-Sep-09 Mourning Dove U A S Old carcass Shiloh I B12R 598328 4223434 05-Sep-09 Pacific Slope Flycatcher U A S Shiloh I B16R 599823 4223486 09-Sep-09 Pacific Slope Flycatcher U J I 60 meters behind turbine

F‐2
Site Turbine ID UTM Easting1
UTM Northing Date Species Sex Age2 Carcass
Condition3 Notes
High Winds E36 605689 4222868 13-Sep-10 Red-breasted Nuthatch U A S Head missing, thorax scavenged
Shiloh I B20 598808 4223723 23-Aug-09 Red-shouldered Hawk U A S Head and body w/ feathers; old carcass
High Winds C25 604847 4221256 17-Aug-09 Red-tailed Hawk U A F High Winds C27 604836 4221274 21-Aug-09 Red-tailed Hawk U A F Shiloh I D03 600194 4222834 23-Aug-09 Red-winged Blackbird F A F Shiloh I D03 600243 4222755 09-Sep-09 Red-winged Blackbird M A F Shiloh I E3R 598350 4222110 04-Sep-10 Red-winged Blackbird M A S Shiloh I B13 598869 4223538 06-Sep-10 Red-winged Blackbird M A S One wing only High Winds C22 604651 4221867 13-Sep-10 Red-winged Blackbird F A S Shiloh I E2R 598304 4222215 12-Oct-09 Ring-necked Pheasant M A S A few feathers at 60 meters High Winds E39 605820 4222320 18-Oct-10 Ruby-crowned Kinglet M U S Probable adult Shiloh I B03 599162 4223950 22-Aug-09 Swainson's Hawk U A S Shiloh I D02 599866 4222845 04-Sep-10 Swainson's Hawk U U S Shiloh I B10 600031 4223970 18-Sep-10 Tree Swallow F A S Wing only High Winds D33 604811 4222415 19-Aug-09 Turkey Vulture U U S 3 primaries w/ flesh High Winds C25 604837 4221278 21-Sep-09 Warbling Vireo U A I
Shiloh I A32 598631 4224775 22-Aug-09 Western Meadowlark U A F Spread over 1 meters x 1/2 meters
High Winds C28 604943 4220786 01-Sep-10 Western Meadowlark U U S On parking pad Shiloh I D02 599851 4222860 04-Sep-10 Western Meadowlark U U S Wing only Shiloh I D02 599848 4222863 20-Sep-10 Western Meadowlark U U S Shiloh I D02 599902 4222892 18-Sep-10 Unknown blackbird U U S Shiloh I B16 599534 4223462 04-Sep-10 Unknown duck U U S Shiloh I D03 600245 4222754 09-Sep-09 Unknown bird U U F 1 meters from RWBL carcass
High Winds D29 604515 4222997 23-Sep-09 Unknown bird U U F 260°, 16m to second feather spot believed to be part of same bird
Shiloh I D04 599854 4222765 30-Sep-09 Unknown bird U U F Shiloh I B11 600098 4223878 19-Sep-10 Unknown bird U U S Shiloh I B10 600031 4223952 09-Oct-10 Unknown bird U U F High Winds E36 605692 4222897 21-Aug-09 Hoary Bat U A I Found behind turbine
High Winds C18 604174 4222175 03-Sep-09 Hoary Bat M A I Broken bones; no blood around mouth; behind turbine
High Winds E38 605847 4222426 03-Sep-09 Hoary Bat M A I No blood on mouth; wound on rump

F‐3
Site Turbine ID UTM Easting1
UTM Northing Date Species Sex Age2 Carcass
Condition3 Notes
Shiloh I B18 598312 4223215 09-Sep-09 Hoary Bat M U I High Winds C25 604824 4221325 21-Sep-09 Hoary Bat M A I High Winds C28 604832 4221133 23-Sep-09 Hoary Bat M A I Shiloh I B18 598363 4223192 26-Sep-09 Hoary Bat M A I Chest trauma; no rigor mortis Shiloh I B03 599167 4223974 26-Sep-09 Hoary Bat M A I Light rigor mortis Shiloh I D02 599907 4222758 26-Sep-09 Hoary Bat M A I Chest trauma under right wing Shiloh I E2R 598287 4222304 27-Sep-09 Hoary Bat M A I Desiccated
Shiloh I B11 600121 4223902 29-Sep-09 Hoary Bat U U S In one piece, but eaten from inside by insects, etc.; genitals missing
Shiloh I B18 598327 4223213 10-Oct-09 Hoary Bat U U S Desiccated; hollowed out High Winds D31 604697 4222736 31-Aug-10 Hoary Bat M A S Trauma to back and head High Winds C19 604207 4222002 01-Sep-10 Hoary Bat M U I Dorsal trauma Shiloh I D04 599921 4222796 04-Sep-10 Hoary Bat M A I Dorsal trauma High Winds C18 604186 4222154 14-Sep-10 Hoary Bat U A S 64 meters from turbine High Winds C23 604768 4221606 16-Sep-10 Hoary Bat U J S One wing only High Winds D32 604870 4222586 17-Sep-10 Hoary Bat U A S Wings only Shiloh I B05 599943 4224140 18-Sep-10 Hoary Bat U A S Stomach contents scavenged Shiloh I B14 598988 4223281 19-Sep-10 Hoary Bat U A S Innards scavenged
High Winds C18 604155 4222147 07-Oct-10 Hoary Bat U J S Desiccated; no stomach contents remaining
Shiloh I B09 598762 4223966 11-Oct-10 Hoary Bat M A I
High Winds C21 604558 4221851 21-Sep-05 Mexican Free-tailed Bat M A I 65 meters from turbine; bloody nose
High Winds E35 605579 4223016 03-Sep-09 Mexican Free-tailed Bat M U I
High Winds D32 604173 4222172 03-Sep-09 Mexican Free-tailed Bat M A I No blood around mouth; blood on side
High Winds E38 605804 4222468 21-Sep-09 Mexican Free-tailed Bat U A S Head only; ID tentative High Winds E39 605816 4222318 21-Sep-09 Mexican Free-tailed Bat M A I High Winds C26 604836 4221132 21-Sep-09 Mexican Free-tailed Bat F A I Shiloh I B18 598331 4223227 27-Sep-09 Mexican Free-tailed Bat M A I Shiloh I B10 600004 4224010 27-Sep-09 Mexican Free-tailed Bat M A I No impact evidence Shiloh I E2R 598290 4222309 27-Sep-09 Mexican Free-tailed Bat U A S Abdomen eaten by inverts Shiloh I B12R 598304 4223446 27-Sep-09 Mexican Free-tailed Bat M A I Trauma on back Shiloh I B18 598323 4223160 28-Sep-09 Mexican Free-tailed Bat U A S Head, tail, wing, skin on road Shiloh I B02 598505 4224104 29-Sep-09 Mexican Free-tailed Bat U A I Coleoptera feeding on carcass Shiloh I B02 598499 4224062 30-Sep-09 Mexican Free-tailed Bat M U I

F‐4
Site Turbine ID UTM Easting1
UTM Northing Date Species Sex Age2 Carcass
Condition3 Notes
Shiloh I D04 599878 4222772 30-Sep-09 Mexican Free-tailed Bat M A I Dorsal trauma Shiloh I E3R 598346 4222130 12-Oct-09 Mexican Free-tailed Bat U A S High Winds C21 604511 4221857 02-Sep-10 Mexican Free-tailed Bat M A I Shiloh I B7R 598270 4223641 08-Sep-10 Mexican Free-tailed Bat U A S Run over on road High Winds D34 604983 4222264 15-Sep-10 Mexican Free-tailed Bat U J I Desiccated Shiloh I B13 598917 4223506 18-Sep-10 Mexican Free-tailed Bat U J S Shiloh I D02 599905 4222886 18-Sep-10 Mexican Free-tailed Bat U A I Innards liquefied Shiloh I B04 599395 4223663 19-Sep-10 Mexican Free-tailed Bat U A I Shiloh I A32 598617 4224776 21-Sep-10 Mexican Free-tailed Bat M A I Some maggots High Winds D31 604704 4222677 05-Oct-10 Mexican Free-tailed Bat M A I Fresh; no visible trauma High Winds C21 604519 4221913 06-Oct-10 Mexican Free-tailed Bat M A I High Winds C28 604952 4220781 08-Oct-10 Mexican Free-tailed Bat M A I Shiloh I B13 598905 4223556 11-Oct-10 Mexican Free-tailed Bat U J I Shiloh I B12R 598312 4223403 13-Oct-10 Mexican Free-tailed Bat M A I At base of turbine High Winds D30 604621 4222900 15-Sep-10 Western Red Bat M A S Desiccated High Winds C16 603826 4222391 23-Sep-09 Unknown bat U U S Only 3 pieces of wings High Winds C20 604354 4222042 16-Sep-10 Unknown bat U A S Shiloh I D02 599886 4222916 18-Sep-10 Unknown bat U U S 1 UTM zone 10 S; datum NAD83. 2 A = adult, J = juvenile, U = unknown. 3 F = feather spot, I = intact, S = scavenged.

G‐1
APPENDIX G: Detailed statistics for general linear models developed to describe relationships between bird and fatality counts and spatial/temporal, weather, and radar and night‐vision activity variables during autumn in 2009 and 2010 in the Montezuma Hills Wind Resource Area, Solano County, California, including bivariate graphical displays of predicted relationships with 95% confidence intervals.
Table G-1. Final Poisson GLMs including significant (P ≤ 0.05) and marginally significant (0.05 < P ≤ 0.10) variables for explaining unadjusted numbers of all-bird, all-bat, and Mexican free-tailed bat
(quasi-GLM approach) fatalities per survey, and used to develop predictive surface plots in Figures 17b, 17c, 19b, 19c, 20b, 20c, G-1, G-2, and G-3. Types of explanatory variables considered
included spatial and temporal variables, nightly average weather metrics, and nightly activity indices derived from radar and night-vision monitoring. Coefficients for the intercept and
spatial/temporal variables derive from final models fit in step 3 (see text for details; no substantive differences between deviance and significance values for the latter variables compared to models
fit in steps 1 and 2 for the all-bird and all-bat models, whereas P-value for barometric pressure was 0.006 in weather-only model for Mexican free-tailed bats prior to inclusion of radar-target
altitude). Degrees of freedom (df), deviance (Dev.), and P correspond to analysis of deviance tests comparing models with and without the explanatory variable.
Dependent variable
Type of explanatory
variable Explanatory
variable Coefficient SE 95% CI df Dev F P 1
Number of all-bird fatalities
Intercept Intercept 6.697 2.073 2.633 10.761 1 10.7 – 0.001Spatial Site 2 0.769 0.314 0.153 1.384 1 6.3 – 0.012
Temporal Julian date -0.030 0.008 -0.047 -0.014 1 14.9 – <0.001Radar Passage rate at
<125 meters agl 30.015 0.007 0.001 0.029 1 3.7 – 0.054
Number of all-bat fatalities
Intercept Intercept -241.600 54.080 -347.597 -135.603 1 29.3 – <0.001Temporal Julian date 1.826 0.412 1.018 2.634 2 4 28.5 – <0.001
Julian date2 -0.003 0.001 -0.005 -0.002 1 28.5 – <0.001Weather Temperature (°C) 0.081 0.039 0.005 0.157 1 4.0 – 0.045Radar Average target
altitude (meters)-0.003 0.002 -0.006 0.000 1 4.1 – 0.043
Average target flight direction
(radians)
0.012 0.006 0.000 0.024 1 3.7 – 0.055
Number of Mexican Free-tailed Bat fatalities
Intercept Intercept -136.400 67.550 -268.798 -4.002 1 5.1 4.2 0.044Weather Wind speed 0.259 0.096 0.071 0.447 1 9.4 7.8 0.007
Barometric pressure
0.130 0.066 -0.001 0.260 1 4.7 3.9 0.052
Radar Average target altitude (meters)
0.004 0.002 0.000 0.007 1 5.5 4.5 0.037
1 P value based on Chi‐square test for number of all‐bird fatalities and all‐bat fatalities (χ2 = deviance); and based on F test for
number of Mexican free‐tailed bat fatalities (F = deviance/φ ). 2 Reference category High Winds; test category Shiloh I. 3 Number of targets recorded per 1 kilometer of passage front per hour. 4 Two degrees of freedom for test comparing model with and without both first‐ and second‐order terms for Julian date.

G‐2
Figure G-1. Unadjusted bird fatalities predicted based on final fitted Poisson GLM (Table G-1), with 95% confidence intervals. Plots are based on inserting average values in predictive equations for
all variables other than that on the x-axis (Julian date: High Winds 262, Shiloh I 266).

G‐3
Figure G-2. Unadjusted bat fatalities predicted based on final fitted Poisson GLM (Table G-1), with 95% confidence intervals. Plots are based on inserting average values in
predictive equations for all variables other than that on the x-axis.

G‐4
Figure G-3. Unadjusted Mexican free-tailed bat fatalities predicted based on final fitted Poisson quasi-GLM (Table G-1), with 95% confidence intervals. Plots are based on
inserting average values in predictive equations for all variables other than that on the x-axis.

G‐5
Table G-2. Negative-binomial GLM including significant (P ≤ 0.05) and marginally significant (0.05 < P ≤ 0.10) variables for explaining numbers of all-bird, all-bat, and Mexican free-tailed bat (MFB) fatalities per survey, adjusted for variation in carcass detectability among survey periods. Types
of explanatory variables considered included spatial and temporal variables, nightly average weather metrics, and nightly activity indices derived from radar and night-vision monitoring. Coefficients for spatial/temporal variables are based on models fit in step 1 and for weather
variables are based on models fit in Step 2 (see text for details). Degrees of freedom (df), log-likelihood ratio statistics (LL ratio), and P correspond to log-likelihood ratio tests comparing
models with and without the explanatory variable.
Dependent variable
Type of explanatory
variable Explanatory
variable Coefficient SE 95% CI df LL ratio P Number of all-bird fatalities
Spatial Site1 0.888 0.375 0.153 1.624 1 5.2 0.023
Temporal Julian date -0.017 0.009 -0.036 0.001 1 3.3 0.070
Number of all-bat fatalities
Temporal Julian date 2.102 0.462 1.197 3.007 2 2 22.0 <0.001 Julian date2 -0.004 0.001 -0.006 -0.002 1 21.5 <0.001
Weather Temperature
(°C) 0.131 0.056 0.021 0.241 1 5.5 0.019
log[average
visibility] (kilometer)
35.130 30.050 -23.768 94.028 1 2.8 0.094
Number of MFB fatalities
Weather Wind speed
(kph) 0.291 0.127 0.043 0.540 1 4.7 0.030
Barometric pressure
(hPa) 0.169 0.086 0.000 0.337 1 3.8 0.053
1 Reference category High Winds; test category Shiloh I.
2 Two degrees of freedom for test comparing model with and without both first‐ and second‐order terms for Julian date.

G‐6
Table G-3. Final binomial logistic regression model including significant (P ≤ 0.05) and marginally significant (0.05 < P ≤ 0.10) variables for explaining the presence / absence of fatalities of tree-roosting bats (primarily hoary bats) and used to develop predictive surface plot in Figure 22b.
Types of explanatory variables considered included spatial and temporal variables, nightly average weather metrics, and nightly activity indices derived from radar and night-vision
monitoring. Coefficients for the intercept, temporal, and weather variables derive from final models fit in step 3 (see text for details; significance levels for temporal variables = 0.005–0.006 in
final Step 1 model, and for temperature = 0.078 in final Step 2 model).
Dependent Variable
Type of explanatory
variable Explanatory
variable Coefficient SE Odds ratio
(95% bounds) t P Number of tree-roosting bats 1
Intercept Intercept -204.487 93.177 n/a -2.20 0.028Temporal Julian date 1.520 0.712 4.57
(1.13–18.46) 2.14 0.033
Julian date2 -0.003 0.001 0.997 (0.994–1.000)
-2.13 0.033
Weather Temperature (°C)
0.250 0.109 1.28 (1.04–1.59)
-2.29 0.022
Night-vision Number of birds and bats
-0.328 0.165 0.72 (0.52–1.00)
-1.99 0.046
1. Hosmer‐Lemshow goodness of fit test for model: C = 2.75, df = 8, P = 0.949. Likelihood ratio test: χ2 = 21.8, df = 4, P < 0.001. McFadden’s Rho2 = 0.241.

G‐7
Figure G-4. Unadjusted tree-roosting bat fatalities predicted based on final fitted logistic regression model (Table G-3), with 95% confidence intervals. Plots are based on inserting average
values in predictive equations for all variables other than that on the x-axis.

H‐1
APPENDIX H: Results of fall migration studies conducted at proposed (pre‐construction) wind‐energy facilities in the United States using X‐band mobile radar systems. Current project is in boldface type. See Appendix I for a list of citations.
Project Study period Nights sampled
Passage rate ± SE (targets/kilometer/h
our) Methods 1 Flight altitude ± SE
(meters agl) % Targets
<125 meters agl
Passage rate ± SE <125 meters agl
(targets/kilometer/hour)
Methods 1
Eastern United States Bliss, NY 9/09–10/31/05 8 444 3 411 13 na 3 Centerville, NY 8/16–10/14/06 57 259 ± 27 1 350 ± 2 12 38 ± 6 1 Chautauqua, NY 9/02–10/10/03 29 238 ± 48 2 532 ± 3 4 na 2 Clinton County, NY 8/15–10/13/05 57 197 ± 31 1 333 ± 1 12 28 ± 2 1 Copenhagen, NY 9/02–10/09/94 29 371 ± 85 2 na na na 3 Dairy Hills, NY 8/15–10/15/05 57 64 ± 3 2 466 ± 2 10 na 2 Harrisburg, NY 9/02–10/01/98 13 135 ± 42 2 na na na 3 Howard, NY 9/01–10/15/98 39 481 ± 52 2 491 ± 14 2% <91m na 2 Maple Ridge, NY 8/05–10/03/06 57 158 ± 21 1 415 ± 2 8 11 ± 1 1 Martinsburg, NY 9/02–10/09/94 6 661 ± 353 2 na na na 3 Prattsburgh, NY 8/26–11/03/04 30 193 ± 21 2 516 ± 17 3 na 2 Prattsburgh–Italy, NY 8/15–9/30/04 41 200 ± 12 1 365 ± 3 9 20 ± 4 1 Wethersfield, NY 9/02–10/01/98 19 175 ± 42 2 na na na 3 Wethersfield Windparks, NY 8/16–10/14/06 56 256 ± 20 1 344 ± 1 11 36 ± 5 1
Bedford County, PA 8/16–10/14/06 2 29 438 ± 67 1 379 ± 3 10 47 ± 10 1 Casselman, PA 8/15–10/15/04 2 30 174 ± 31 1 436 ± 3 7 16 ± 4 1 Fayette County, PA 8/15–10/13/05 2 26 297 ± 61 1 426 ± 3 5 27 ± 9 1 Somerset County, PA 8/16–10/14/06 2 29 316 ± 60 1 374 ± 3 8 27 ± 5 1 Swallow Farm, PA 8/16–10/14/05 58 166 ± 17 1 402 ± 2 5 10 ± 2 1 Mt. Storm, WV 9/03–10/17/03 40 241 ± 33 1 410 ± 24 13 na 1 Preston County, WV 8/15–10/13/05 2 26 379 ± 91 1 20 ± 4 10 47 ± 12 1 Highland New Wind, VA 8/16–10/14/05 58 385 ± 55 1 442 ± 3 12 na 1

H‐2
Project Study period Nights sampled
Passage rate ± SE (targets/kilometer/h
our) Methods 1 Flight altitude ± SE
(meters agl) % Targets
<125 meters agl
Passage rate ± SE <125 meters agl
(targets/kilometer/hour)
Methods 1
Western United States Coyote Crest, WA 8/15–10/14/08 61 196 ± 18 1 454 ± 3 10 27 ± 4 1 Nine Canyon, WA 9/04–10/09/00 10 31 ± 5 3 na na na na Stateline, WA 8/24–10/17/00 29 21 ± 2 2 na na na na Stateline, WA 9/04–10/17/01 23 22 ± 3 2 647 ± 7 3 na 2 Vansycle, OR 8/24–10/17/00 29 19 ± 2 2 na na na na Vansycle, OR 9/04–10/17/01 30 26 ± 3 2 606 ± 8 9 na 2 Cotterel Mountain, ID 8/31–10/14/03 29 32 ± 9 2 565 ± 6 3 na 2 Bear River, CA 8/16–10/14/06 60 269 ± 11 1 329 ± 2 11 35 ± 3 1 Hatchet Ridge, CA 9/07–10/15/07 36 290 ± 26 1 468 ± 3 8 28 ± 4 1 Shiloh I, CA 8/14–10/14/09 21 326 ± 21 1 409 ± 5 5 16 ± 5 1 Shiloh I, CA 8/14–10/31/10 19 454 ± 47 1 479 ± 4 5 27 ± 5 1 High Winds, CA 8/14–10/14/09 20 448 ± 22 1 467 ± 4 2 10 ± 2 1 High Winds, CA 8/14–10/31/10 20 371 ± 32 1 479 ± 6 4 14 ± 3 1 1 1 = equipment and methods similar to current study (comparable), 2 = differences in radar settings, method of data collection, or data analysis (unknown comparability), 3 = major differences in equipment or methods (not comparable). Overall comparability of studies must also consider study period and duration.
2 Alternate night sampling

I‐1
APPENDIX I: Citations for wind power projects listed in Appendices F, H, I, and J.
Project Citation Bliss, NY Yonker and Landon 2005
Centerville, NY Mabee et al. 2007 Chautauqua, NY Cooper et al. 2004b
Clinton County, NY Mabee et al. 2006b Harrisburg, NY Cooper & Mabee 2000
Howard, NY Woodlot 2005b Prattsburgh–Italy, NY Mabee et al. 2005a
Roaring Brook, NY Mabee et al. 2008 Wethersfield, NY Cooper and Mabee 2000
Wethersfield Windparks, NY Mabee et al. 2007 Bedford County, PA Plissner et al. 2007
Casselman, PA Plissner et al. 2005 Fayette County, PA Plissner et al. 2006b
Somerset County, PA Plissner et al. 2007
Swallow Farm, PA Plissner et al. 2006c Mt. Storm, WV Mabee et al. 2006c
Preston County, WV Plissner et al. 2006b Highland New Wind, VA Plissner et al. 2006a
Coyote Crest, WA Mabee et al. 2010 Nine Canyon, WA Mabee and Cooper 2000
Stateline, WA Mabee and Cooper 2004 Vansycle, OR Mabee and Cooper 2004
Cotterel Mt., ID Cooper et al. 2004a
Bear River, CA Sanzenbacher et al. 2008a Hatchet Ridge, CA Mabee and Sanzenbacher 2008

J‐1
APPENDIX J: Seasonal mean passage rates of birds and bats flying at night below approximately 150 meters agl observed using night‐vision goggles and infrared spotlights at wind‐energy facilities in the United States. N equals number of nights sampled per season. Current project is in boldface type. See Appendix I for a list of citations.
Sampling effort Birds / hour Bats / hour Total birds Project Dates Nights (n) Hours Minutes/hour 1 Mean SE Mean SE and bats
Eastern United States Centerville, NY 8/16 – 10/14/06 43 205.8 2 5.0 1.1 0.7 0.1 948 Clinton County, NY 8/15 – 10/13/05 53 242.7 2 2.9 0.4 0.6 0.1 829 Maple Ridge, NY 2 8/5 – 10/3/04 50 195.9 2 3 5.9 0.8 0.9 0.1 1,562 Roaring Brook, NY 7/22 – 10/15/07 83 354.7 2 2.0 0.7 0.6 0.1 1,015 Wethersfield, NY 8/16 – 10/14/06 56 235.8 2 3.5 0.5 0.4 0.1 845 Bedford County, PA 8/16 – 10/14/06 4 29 107.0 2 8.6 2.7 1.4 0.2 1,105 Casselman, PA 8/15 – 10/15/04 4 29 79.8 3 3 9.5 2.2 3.2 0.9 1,187 Fayette County, PA 8/15 – 10/13/05 4 29 88.2 3 16.5 6.4 2.5 0.7 1,866 Somerset County, PA 8/16 – 10/14/06 4 29 110.2 2 3.2 0.7 2.2 0.5 533 Swallow Farm, PA 8/16 – 10/14/05 43 154.6 3 5.6 1.0 0.6 0.1 1,062 Preston County, WV 8/15 – 10/13/05 4 22 65.5 3 15.5 5.1 1.9 0.5 961 Highland New Wind, VA 8/16 – 10/14/05 49 159.4 3 8.2 2.0 1.4 0.2 1,541
Western United States Coyote Crest, WA 8/15 – 10/14/08 61 154.4 2 2.2 0.5 0.5 0.2 479 Bear River, CA 8/16 – 10/14/06 52 149.7 2 0.9 0.3 0.2 0.0 155 Shiloh, CA 8/14 – 10/14/09 21 92.9 2 0.3 0.1 0.2 0.1 47Shiloh, CA 8/14 – 10/31/10 21 97.0 2 0.6 0.1 0.3 0.1 86High Winds, CA 8/14 – 10/14/09 20 90.2 2 0.2 <0.1 0.2 0.1 34High Winds, CA 8/14 – 10/31/10 20 89.1 2 0.2 0.1 0.1 <0.1 20
1 1 = 5 minutes/hour; 2 = 40–50 minutes/hour; 3 = 40–50 minutes/hour until 1 Oct, then 5 minutes/hour until end of study.
2 Formerly known as Flat Rock.
3 Used a spotlight with a red lens.
4 Alternate night sampling.

K‐1
APPENDIX K: Results of nocturnal surveys (using Generation‐3 night‐vision goggles and spotlights with infrared filters) conducted by ABR, Inc., at proposed (pre‐construction) wind power development areas in the United States. Current study is in boldface type. See Appendix I for a list of citations.
Sampling Effort Birds (%) Bats (%) Total Birds
Project Dates Nights Hours Min/hr1 PasserinesNon-
passerines Other Total Small Large Other Total and Bats
Eastern United States Centerville, NY 8/16–10/14/06 43 205.8 2 77.0 2.6 6.5 86.2 6.5 6.3 0.9 13.8 948
Clinton County, NY 8/15–10/13/05 53 242.7 2 75.2 3.4 3.2 81.8 11.3 5.7 1.2 18.2 829 Maple Ridge, NY 2 8/05–10/3/04 50 195.9 2 3 77.5 8.8 2.2 88.5 9.9 1.3 0.3 11.5 1,562 Roaring Brook, NY 7/22–10/15/07 83 354.7 2 69.7 1.0 9.2 79.9 8.1 9.4 2.7 20.1 1,015
Wethersfield Windparks, NY
8/16–10/14/06 56 235.8 2 70.5 2.5 16.7 89.7 6.6 2.2 1.4 10.3 845
Bedford County, PA
8/16–10/14/06 4 26 107.0 2 55.0 0.2 34.2 89.4 7.1 2.3 1.3 10.6 1,105
Casselman, PA 8/15–10/15/04 4 29 79.8 3 3 59.1 1.3 9.9 70.3 4.0 1.0 24.8 29.7 1,187 Fayette County,
PA 8/15–10/13/05 4 29 88.2 3 74.0 1.9 9.0 84.8 4.8 4.8 5.6 15.2 1,866
Somerset County, PA
8/16–10/14/06 4 28 110.2 2 31.0 3.2 26.8 61.0 24.4 9.9 4.7 39.0 533
Swallow Farm, PA 8/16–10/14/05 43 154.6 3 89.2 1.1 0.8 91.1 2.8 2.7 3.3 8.9 1,062 Preston County,
WV 8/15–10/13/05 4 22 65.5 3 74.1 0.5 8.9 83.7 5.5 5.0 5.8 16.3 961
Highland New Wind, VA
8/16–10/14/05 49 159.4 3 79.1 1.4 5.8 87.1 4.2 1.4 7.3 12.9 1,541

K‐2
Sampling Effort Birds (%) Bats (%) Total Birds
Project Dates Nights Hours Min/hr1 PasserinesNon-
passerines Other Total Small Large Other Total and Bats
Western United States
Coyote Crest, WA 8/15–10/14/08 61 154.4 2 55.0 26.8 7.0 88.7 5.2 2.7 3.4 11.3 444
Bear River, CA 8/16–10/14/06 52 149.7 2 23.9 32.3 27.1 83.2 10.3 6.5 0 16.8 155
Shiloh I, CA 8/14–10/14/09 21 92.9 2 29.8 17.0 4.3 51.1 4.3 44.7 0 48.9 47
Shiloh I, CA 8/14–10/31/10 21 97.0 2 20.9 44.2 0 65.1 11.6 17.4 5.8 34.9 86
High Winds, CA 8/14–10/14/09 20 90.2 2 32.4 8.8 2.9 44.1 11.8 44.1 0 55.9 34
High Winds, CA 8/14–10/31/10 20 89.1 2 15.0 55.0 5.0 75.0 5.0 15.0 5.0 25.0 20 1 1 = 5 minutes/hour; 2 = 40–50 minutes/hour; and 3 = 40–50 minutes/hour until 1 Oct, then 5 minutes/hour until end of study. 2 Formerly known as Flat Rock. 3 Used a spotlight with a red lens. 4 Alternate night sampling.

L‐1
APPENDIX L: Fall turbine passage rate indices (numbers of birds and bats passing within the approximate rotor‐swept area of individual turbines each night) at wind‐energy facilities in the United States based on studies using X‐band mobile radar systems. Current project is in boldface type. See Appendix I for a list of citations.
Individuals/turbine/day
Project Study period Nights sampled Minimum (side profile)
Maximum (front profile)
Eastern United States Centerville, NY 8/16–10/14/06 57 2 16
Clinton County, NY 8/15–10/13/05 57 2 11 Maple Ridge, NY 8/05–10/03/06 57 1 5
Prattsburgh–Italy, NY 8/15–9/30/04 41 1 8 Wethersfield Windparks, NY 8/16–10/14/06 56 2 14
Bedford County, PA 8/16–10/14/06 1 29 3 23 Casselman, PA 8/15–10/15/04 1 30 1 7
Fayette County, PA 8/15–10/13/05 1 26 1 7 Somerset County, PA 8/16–10/14/06 1 29 2 13
Swallow Farm, PA 8/16–10/14/05 58 1 4 Preston County, WV 8/15–10/13/05 1 26 4 29
Highland New Wind, VA 8/16–10/14/05 58 3 25 Western United States
Coyote Crest, WA 8/15–10/14/08 61 2 16 Bear River, CA 8/16–10/14/06 60 2 17
Hatchet Ridge, CA 9/07–10/15/07 36 2 16 Shiloh, CA 8/14–10/14/09 21 1 6 Shiloh, CA 8/30–10/31/10 19 1 10 High Winds, CA 8/14–10/14/09 20 <1 4 High Winds, CA 8/30–10/31/10 20 1 6
1 Alternate night sampling.