Energy Reform and Social Protection in Kazakhstan
141
Regional Review of Social Safety Net Approaches In Support of Energy-Sector Reform Appendix 5: Energy Reform and Social Protection in Kazakhstan Mark Velody October 2003 Research Team Mark Velody, Lead Researcher/Energy Tariffs Specialist Michael J.G. Cain, Ph.D., Social Safety Net Specialist Michael Philips, Energy Efficiency Specialist Daniyar Nurmaganbetov, Researcher for Kazakhstan This report was prepared for U.S. Agency for International Development (USAID), Europe & Eurasia/Economic Growth/Energy and Infrastructure Division (E&E/EG/EI) by Aguirre International and the International Science and Technology Institute, Inc. (ISTI), under Global Evaluation and Monitoring (GEM) Indefinite Quantity Contract FAO-I-99-00-00010-00; Delivery Order 3. The findings, conclusions, and recommendations are those of its authors and do not necessarily reflect USAID’s views and/or policies.
Transcript of Energy Reform and Social Protection in Kazakhstan

Regional Review of Social Safety Net Approaches
In Support of Energy-Sector Reform
Appendix 5:
Energy Reform and Social Protection in Kazakhstan
Mark Velody
October 2003
Research Team Mark Velody, Lead Researcher/Energy Tariffs Specialist Michael J.G. Cain, Ph.D., Social Safety Net Specialist
Michael Philips, Energy Efficiency Specialist Daniyar Nurmaganbetov, Researcher for Kazakhstan
This report was prepared for U.S. Agency for International Development (USAID), Europe & Eurasia/Economic Growth/Energy and Infrastructure Division (E&E/EG/EI) by Aguirre International and the International Science and Technology Institute, Inc. (ISTI), under Global Evaluation and Monitoring (GEM) Indefinite Quantity Contract FAO-I-99-00-00010-00; Delivery Order 3. The findings, conclusions, and recommendations are those of its authors and do not necessarily reflect USAID’s views and/or policies.


i
Table of Contents ACRONYMS ...................................................................................................................V
PREFACE .....................................................................................................................VII
CHAPTER 1 - INTRODUCTION AND EXECUTIVE SUMMARY.................................... 1 A. INTRODUCTION ...................................................................................................................1 B. EXECUTIVE SUMMARY.........................................................................................................1
1. Background..................................................................................................... 1 2. Utilities and Utility Privatization ....................................................................... 2 3. Poverty ............................................................................................................ 3 4. Subsidies and Assistance Payments .............................................................. 4 5. Energy Efficiency ............................................................................................ 5 6. Tariffs .............................................................................................................. 6 7. Overall Conclusion .......................................................................................... 6 8. Recommendations .......................................................................................... 7
CHAPTER 2 - POVERTY AND SOCIAL ASSISTANCE IN KAZAKHSTAN .................. 9 A. POVERTY IN KAZAKHSTAN ...................................................................................................9
1. Expenditure on the Social Safety Net and Sources of Financing .................... 9 2. The Influence of Petroleum Export Revenue on Social Policy ...................... 10 3. Key Poverty Statistics and Definitions for 2001 (UNDP) ............................... 11 5. The Definition of Poverty ............................................................................... 13 6. The Extent of Poverty in Kazakhstan ............................................................ 14 7. The Character of Poverty .............................................................................. 15
B. SOCIAL ASSISTANCE AND POVERTY ISSUE INITIATIVES ........................................ 15 1. Extent and Type Social Assistance ............................................................... 15 2. The Program for Poverty and Unemployment Reduction, 2000 - 2002......... 16 3. State Program for Poverty Reduction (SPFPR) in 2003 - 2005..................... 16 4. Household Budget Survey, 2001................................................................... 17 5. The Law on State Targeted Social Assistance, January 2002. ..................... 17 6. Low Benefits, Non-payment and Late Payment of Benefits .......................... 17 7. Pensions ....................................................................................................... 18 8. Unemployment .............................................................................................. 18 9. Savings ......................................................................................................... 19 10. Poverty Reduction Program and Living Standards Measurement
Survey........................................................................................................... 19 11. Plans for Renewable Energy to Reduce Poverty in Remote Areas .............. 19
C. IMPACT OF ENERGY COSTS ON LOW-INCOME HOUSEHOLDS...............................................20 1. Share of Utilities in the Household Budget .................................................... 20 2. Pensioners and Low-Income Households are Better Payers than the
Rich............................................................................................................... 20 CHAPTER 3 - ENERGY SUBSIDIES AND ASSISTANCE PAYMENTS...................... 21
A. GENERAL APPROACH TO FUEL POVERTY AND ENERGY SUBSIDIES .....................................21 B. ELECTRICITY SUBSIDIES....................................................................................................21
1. Direct Subsidies ............................................................................................ 21

ii
2. Assistance Payments.................................................................................... 21 3. Indirect and Cross Subsidies......................................................................... 24
C. OTHER ENERGY SECTOR SUBSIDIES .................................................................................26 1. Toleration of Non-payment a Form of Subsidy.............................................. 26 2. An Innovative Approach to Enforcing District-Heating Payment
Discipline....................................................................................................... 27 3. Non-payment Consequences........................................................................ 27
D. THE IMPACT OF SUBSIDIES AND ASSISTANCE PAYMENTS....................................................27 Impact of Subsidies on Reducing Poverty Levels ......................................... 27
CHAPTER 4 - ENERGY EFFICIENCY ......................................................................... 29 A. POTENTIAL FOR ENERGY EFFICIENCY IMPROVEMENT IN KAZAKHSTAN ................................29 B. APPROACH OF LOW-INCOME HOUSEHOLDS TO ENERGY EFFICIENCY ..................................29 C. ENERGY EFFICIENCY OF HOUSEHOLD APPLIANCES ............................................................30 D. WEATHERIZATION .............................................................................................................30 E. METERING AND CONTROL .................................................................................................30
1. The Significance of Metering and Control ..................................................... 30 2. Electricity Metering........................................................................................ 30 3. Heat Metering and Control ............................................................................ 30 4. A USAID-Funded Project Demonstrated the Impact of Metering
Apartment Buildings ...................................................................................... 31 5. Heat Metering of Public Buildings is Cost-Effective for the Consumer .......... 32 6. Heat Metering and Control for Apartments.................................................... 32 7. A Pilot Project Demonstrated that TRVs without HCAs are Not
Effective ........................................................................................................ 32 8. Hot and Cold Water Metering and Control .................................................... 33 9. Gas Metering and Control ............................................................................. 35
F. ENERGY-EFFICIENCY POLICIES, PROGRAMS, PROJECTS, LAWS AND ORGANIZATIONS.........35 1. Energy-Efficiency Policies ............................................................................. 35 2. Energy-Efficiency Programs.......................................................................... 36 3. Energy-Efficiency Projects ............................................................................ 37 4. Energy Efficiency Laws: The Law on Energy Saving, 1997 .......................... 41 5. Energy-Efficiency Organizations ................................................................... 41 6. Associations .................................................................................................. 43
G. IMPACT OF ENERGY EFFICIENCY........................................................................................45 1. Impact of Energy Efficiency on Reducing Poverty Levels ............................. 45 2. Impact of Energy Efficiency on Removing Barriers to Utility
Privatization................................................................................................... 45 CHAPTER 5 - ENERGY PRICES AND TARIFFS......................................................... 47
A. INTRODUCTION .................................................................................................................47 1. Tariff Reform: Kazakhstan Electricity Association and USAID ...................... 47 2. Taxation of Household Energy ...................................................................... 49
B. ELECTRICITY PRICES AND TARIFFS ....................................................................................49 1. Composition of Final (Retail) Electricity Tariffs.............................................. 49 2. Generation Prices ......................................................................................... 50 3. The Transmission Tariff................................................................................. 50 4. The Access Tariff (Local Transmission and Distribution) .............................. 50

iii
5. Different Tariffs in Each REC ........................................................................ 51 6. Household Tariffs Differ Widely from REC to REC........................................ 51 7. Deficiencies in the Kazakh Approach to Household Electricity Pricing.......... 52 8. Impact of the Policy of Setting Artificially Low Household Tariffs .................. 52 9. Final Household Electricity Prices ................................................................. 52 10. Typical Monthly Household Electricity Bill for 2002 ...................................... 54 11. How Household Tariffs are Set is Influenced by Local Politics ..................... 54 12. The EBRD’s Proposed Revised Tariff Order for Power and Heat
Pricing ........................................................................................................... 54 13. An Annex to the EBRD Tariff Order Considers the Social Impact of
Tariff Reform ................................................................................................. 55 14. Possible Impact of the Proposed New Tariff Mechanism ............................. 56 15. There are No Plans to Introduce a Lifeline Tariff for Electricity..................... 56 16. Time-of-Day Electricity Tariffs....................................................................... 56 17. Special Tariffs for Budget Entities................................................................. 56 18. Privileged Electricity Tariffs for ‘Deserving Groups’ ...................................... 57
C. OTHER ENERGY PRICES AND TARIFFS ...............................................................................57 1. District Heating Prices and Tariffs ................................................................. 57 2. Heat Prices Rose When Expressed in KZT, but Declined in USD from
1996 - 2001 ................................................................................................... 59 3. Prices for Hot Water (Washing Water) Vary Widely from City to City............ 59 4. Natural Gas Tariffs ........................................................................................ 60 5. Status of the Reform of Natural Gas Pricing ................................................. 60 6. Other Energy Prices...................................................................................... 60
D. IMPACT OF PRICING AND TARIFF SETTING ..........................................................................60 1. Impact of Pricing and Tariff Setting on Reducing Poverty Levels.................. 60 2. Impact of Pricing and Tariff Setting on Removing Barriers to Utility
Privatization................................................................................................... 61 CHAPTER 6 - FINANCING THE ENERGY SOCIAL SAFETY NET............................. 63
A. FINANCING ENERGY EFFICIENCY AND METERING SOLUTIONS .............................................63 B. FINANCING THE USE OF TARIFF MECHANISMS TO ADDRESS LOW-INCOME ISSUES...............63
CHAPTER 7 - ANALYSIS AND RECOMMENDATIONS FOR KAZAKHSTAN ........... 65 A. IMPACT OF ENERGY SOCIAL SAFETY NET APPROACHES.....................................................65 B. RECOMMENDATIONS FOR KAZAKHSTAN .............................................................................65
1. General and Hybrid Recommendations ........................................................ 65 2. Energy Efficiency .......................................................................................... 66 3. Tariff Mechanisms......................................................................................... 67
BIBLIOGRAPHY........................................................................................................... 71
MONTHLY AND ANNUAL AVERAGE EXCHANGE RATES, KZT/USD, 1994-2002 .. 73
APPENDICES............................................................................................................... 75 APPENDIX 1.1: CONVERSION OF HEAT ENERGY UNITS (GCAL, GJ, MW HEAT)..........................75 APPENDIX 2.1: THE STATE OF ENERGY SECTOR REFORM AND PRIVATIZATION IN KAZAKHSTAN.76 APPENDIX 2.2: NUMBER OF HOUSEHOLDS IN KAZAKHSTAN.......................................................85

iv
APPENDIX 2.3: NUMBER AND SIZE OF DWELLINGS, URBAN AND RURAL, 1997, 1999, 2000 .......86 APPENDIX 2.4: NUMBER AND SIZE OF DWELLINGS, URBAN AREAS ONLY, 1997, 1999, 2000 .....88 APPENDIX 2.6: NUMBER OF NATURAL GAS CONNECTIONS AND LPG CUSTOMERS ....................90 APPENDIX 3.1: KEY POVERTY INDICATORS FOR 2001...............................................................91 APPENDIX 3.2: NUMBER OF SOCIAL ASSISTANCE RECIPIENTS AND BASIS OF NEED 2000-2001.92 APPENDIX 3.3: NUMBER OF SOCIAL ASSISTANCE RECIPIENTS COMPARED WITH TOTAL POPULATION.... .................................................................................................................93 APPENDIX 3.4: MONTHLY SOCIAL ASSISTANCE PAYMENT BY GROUP AND REGION, 2001-2002 (KZT) .......................................... .....................................................................................94 APPENDIX 3.5: MONTHLY SOCIAL ASSISTANCE PAYMENT BY GROUP AND REGION, 2001-2002 (USD) ..............................................................................................................................95 APPENDIX 3.6: COMPARISON OF INCOME LEVELS AND SUBSISTENCE MINIMUM (%)...................96 APPENDIX 3.7: MINIMUM SUBSISTENCE LEVEL AND AVERAGE PENSION (KZT) ..........................97 APPENDIX 3.8: MINIMUM SUBSISTENCE LEVEL AND AVERAGE PENSION (USD) .........................98 APPENDIX 3.9: COMPARISON OF PEAK UNEMPLOYMENT LEVELS 1999 AND 2001 .....................99 APPENDIX 4.1: URBAN HEATING, GAS AND HOT WATER CONNECTIONS, 1997, 1999 (%)........100 APPENDIX 4.2: RURAL HEATING, GAS AND HOT WATER CONNECTIONS, 1997 AND 1999 (%) ..101 APPENDIX 5.1: ESTIMATED TECHNICAL AND COMMERCIAL LOSSES - POWER DISTRIBUTION ....102 APPENDIX 5.2: POWER TRANSMISSION TARIFFS 1997 - 2002 (KZT).......................................103 APPENDIX 5.3: POWER TRANSMISSION TARIFFS 1997 - 2002 (USD) ......................................104 APPENDIX 5.4: ELECTRICITY PRICES - INDUSTRIAL, AVERAGE, HOUSEHOLD, BY REC 1997 - 1999 ............................ .......................................................................................105 APPENDIX 5.5: AVERAGE ANNUAL HOUSEHOLD AND INDUSTRIAL ELECTRICITY PRICES (IEA) ..115 APPENDIX 5.6: MONTHLY AVERAGE ELECTRICITY PRICES, 1996 - 2001 (KZT/KWH) ...............116 APPENDIX 5.7: MONTHLY AVERAGE ELECTRICITY PRICES, 1996 - 2001 (US CENTS/KWH) ......117 APPENDIX 5.8: HOUSEHOLD ELECTRICITY PRICES BY OBLAST/CITY 1995-2000, USC/KWH ....118 APPENDIX 5.9: MONTHLY AVERAGE DISTRICT HEATING PRICES, 1996 - 2001 (KZT/GCAL) .....120 APPENDIX 5.10: MONTHLY AVERAGE DISTRICT HEATING PRICES, 1996 - 2001 (USD/GCAL) ..121 APPENDIX 5.11: HOT WATER (WASHING WATER) PRICES - BY CITY - 1997-2000....................122 APPENDIX 5.12 HOUSEHOLD ANNUAL AVERAGE NATURAL GAS PRICES, 1995 - 2000....................................................................................................................124 APPENDIX 5.13: NATURAL GAS PRICES BY OBLAST/CITY, 1997-2000, (USD/1,000M3)...........125 APPENDIX 5.14: NATURAL GAS PRICES, HOUSEHOLD AND INDUSTRY, 1996-2000 (IEA) .........126 APPENDIX 5.15: LPG PRICES 1993-2000..............................................................................128

v
Acronyms
ADB Asian Development Bank AES The AES Corporation / AES Silk Road APC Almaty Power Consolidated BISNIS Business Information Service for the Newly Independent States CEE Central and Eastern Europe CFL Compact fluorescent lamp CHP Combined heat and power CIS Commonwealth of Independent States EBRD European Bank for Reconstruction and Development ECS Energy Charter Secretariat EIA Energy Information Administration (U.S. Department of Energy) ERRA Energy Regulators’ Regional Association FE Frontier Economics GAO General Accounting Office GCV Gross calorific value HAB Housing Allowance Benefit HCA Heat cost allocator IBRD International Bank for Reconstruction and Development IEA International Energy Agency IMF International Monetary Fund IP International Power (National Power) KEA Kazakhstan Electricity Association KEGOC Kazakhstan Electricity Grid Operating Company KEGOC Kazakhstan Electricity Grid Operating KHC Karaganda Holding Company KIPE Small district company in Almaty KPC Karaganda Power Company KSKs Co-operatives of apartment owners / condominium associations kWh Kilowatt hour KZT Kazakh Tenge LPG Liquid petroleum gas MEER Ministry of Energy and Energy Resources Mtoe Metric ton of oil equivalent NARUC National Association of Regulatory Utility Commissioners NP National Power (see International Power) NRMP Central Asia Natural Resource Management Project OECD Organization for Economic Cooperation and Development PA PA Consulting Group PICS Privatization Investment Coupons Pokoleniye Associations of Pensioners PPP Purchasing power parity PSRMAL Public Sector Resource Management Adjustment Loan REC Regional Electricity Company SAP Social Assistance Payment

vi
SMEs Small and Medium Enterprises SPFPR State Program for Poverty Reduction Toe Ton of oil equivalent TRVs Thermostatic Radiator Valves UA Utilities allowance USAID United States Agency for International Development USD United States Dollar USEA United States Energy Association Zheks Housing Maintenance Organizations
vii
Preface
This report is one of five country reports and a synthesis report produced under the United States Agency for International Development (USAID)-sponsored project, Regional Review of Social Safety Net Approaches in Support of Energy-Sector Reform, as described in the abstract below. Research consisted of a one-week mission to Kazakhstan by Mark Velody and Michael Cain in June 2002, covering Almaty, Astana and Karaganda. Daniyar Nurmaganbetov conducted follow-up research in Kazakhstan during the summer and autumn 2002. The report was written in 2002 and it was reviewed and edited in 2003.
The author gratefully acknowledges the input of the United States Agency for International Development (USAID), the other team members, and the many individuals and institutions, in Kazakhstan and the USA, who contributed data, time and expertise. The author is responsible for any omissions or errors.
Abstract The energy sector reform process is occurring throughout the transition countries of Central and Eastern Europe (CEE) and Eurasia. The United States Agency for International Development (USAID) has supported this process in numerous countries. The electricity sector reform process involves establishing a modern legal and regulatory framework, unbundling the monopoly electric utility into separate generation, transmission and distribution companies, and creating a competitive electricity market and privatization. This process is leading to the introduction of transparent commercial operations, modern technology, and investment that is needed to provide reliable and economic service for the long run. The transition to this end goal includes increasing tariffs and the collection enforcement for the supplied electricity.
During the transition there will be some impact on vulnerable populations. To identify approaches that will ease the impact on these populations, a multi-country study was conducted to identify social safety net approaches in support of energy-sector reform. This report documents this activity’s results. The study identifies and documents lessons learned and best practices to ease the transition impact of power sector reform.
The three approaches to helping low-income households afford energy are contrasted and compared. The approaches are: 1) subsidies and assistance payments; 2) energy-efficiency mechanisms; and 3) tariffs. Each mechanism’s impact is analyzed using a matrix that compares a range of quantifiable evaluation criteria.
The country reports (appendices) review the mechanisms that Armenia, Bulgaria, Hungary, Kazakhstan and Romania have used.
The results are available for government policymakers, international financial institutions, donors, and others interested in power sector reform and addressing the needs of vulnerable populations.

viii
The work was sponsored by USAID and conducted by contractors Aguirre International and the International Science and Technology Institute (ISTI).
1
Chapter 1 Introduction and Executive Summary
A. Introduction
This report documents energy social safety net approaches used in Kazakhstan, specifically subsidies/assistance payments, energy-efficiency and tariff mechanisms, in the wider context of energy sector reform and privatization. It is one of five country appendices to a more general “Synthesis Report” that compares approaches to the energy social safety net in Central and Eastern Europe (CEE) and Eurasia. The recommendations are based on a comparison of approaches used in Kazakhstan with best practice in the region.
B. Executive Summary
1. Background
Kazakhstan is a vast, thinly populated country larger than the combined size of Alaska, Texas and California, but with a population of only 15 million. It is extremely resource-rich, with the 12th highest oil reserves in the world, (not including the Caspian shelf reserves, which have not been adequately evaluated, but expected to be huge); the 15th largest reserves of gas and gas liquids; and 3 percent of the world’s coal reserves.
Despite the above, Kazakhstan was not a rich country until recently. The political regime that collapsed with the fall of the Soviet Union prevented petroleum revenues from making a substantial economic impact before Kazakhstan declared its independence in December 1991. The difficulties of being a land-locked country that is remote from major energy markets, combined with the 1997 economic shock that depressed the economies of the entire region and a drought in 1998 that more than halved the livestock population, continued to hold development back throughout the 1990s. However, Kazakhstan is now successfully delivering oil and gas to the market, with annual petroleum export revenues representing some $270 per person in 2002. It has developed credible plans to substantially increase petroleum export revenues to around $800 per person in the future; has stabilized its currency; and, with GDP growth of 9.8 percent in 2000 and 13.2 percent in 2001, appears to be on a path to not only sustained economic growth, but also substantial wealth. As a result, the influence of the petroleum sector now pervades all aspects of government policy, including social policy.
There is an uneven distribution of petroleum revenues in the society, both geographically and socially. At one end of the spectrum, the city of Astana, Kazakhstan’s new capital, has been constructed in only five years, bringing substantial employment and wealth to the area. Also the former capital, Almaty, remains the de-facto center of commerce and is a thriving modern city. Poverty levels can be very high, particularly in the south and east of the country. These areas are geographically remote from the ‘boom towns’ of the north and west, where petroleum revenues have created new wealth.
Introduction and Executive Summary Chapter 1
2
2. Utilities and Utility Privatization
Access to utility services is low—only 44 percent of households have all utilities and 25 percent of the population do not even have running water. The lack of utility service is a strong indicator of poverty.
The power generation sector has been privatized, although the privatization process was quite opaque. The state-owned KEGOC transmits electricity; this agency ‘polices’ the market, disconnecting large consumers—including distribution companies—if they do not pay. Privatization of power distribution has been unsuccessful; a handful of major international players withdrew from Kazakhstan as a result of artificially low, regulated tariffs. Low-income households can generally afford the electricity bill as prices are low, but as a result, the power sector is unable to find the capital to modernize, so power cuts are still commonplace in some areas. Although the Anti-monopoly Agency that regulates the power sector understands what needs to be done, it clearly lacks real authority to raise prices to market levels.
District heating networks serve 70 percent of the urban population and are owned by local governments. With some exceptions, mainly in richer areas, systems are in a state of crisis and disrepair. Some buildings are metered, but apartment metering and control technologies are absent.1 As households cannot influence their own basic heating costs, raising heat prices to market levels would make heat unaffordable to low-income households.
Natural gas is used in some 1.66 million of Kazakhstan’s 4.15 million households. Privatization of transmission was unsuccessful—a major international player withdrew after only three years—and gas distribution companies have not been privatized.
In summary, Kazakhstan’s experience of utility privatization has demonstrated two important messages, one positive and one negative.
The positive message is that privatization of utilities to qualified investors, i.e., experienced international companies, clearly works well. Major successes can be seen, such as improving collection rates from 30 percent to more than 90 percent, and making a city near Siberia the warmest city in Kazakhstan.
The negative message is that utility privatization that is not well planned and takes place in a weak regulatory environment can prove to be unsatisfactory for governments, investors and consumers alike. The international companies that produced the successes described all withdrew from Kazakhstan as a result of the inadequate regulatory regime.
1 These technologies are key indicators of successful district heating reform. For example, in Bulgaria, like Kazakhstan, buildings were completely un-metered 10 years ago, but every building now has a heat meter and every household must fit metering and controls by law.
Chapter 1 Introduction and Executive Summary
3
3. Poverty
The degree and rate of poverty in Kazakhstan have risen sharply since its independence from the Soviet Union. Poor economic performance, decreasing wages, high unemployment levels and decreases in social transfers and social protection all contributed to the increase in poverty.
The ‘poverty line’—the income level at which social assistance becomes payable, was only 1,707.5 KZT per month ($11.64) in 2001.2 This figure represented 38 percent of ‘subsistence minimum’, defined as the cost of a minimum consumers’ basket of 4,587 KZT per month ($31.23). The poverty line was raised to 40 percent of subsistence minimum in 2002, and is expected to continue to creep upwards from year to year. Around 1.6 million people, representing a little more than 10 percent of the population, lived below the poverty line on January 1, 2002, and hence qualified for social assistance. Although estimates vary this translates to a poverty rate of approximately one-third of the population or five million people.3
Given the large extent of poverty in Kazakhstan, public transfer programs alone cannot make a considerable impact on poverty elimination. There has been a strong focus on using sustained economic growth to overcome poverty, together with a focus on making existing social programs more effective by reducing leakage and improving targeting.
The poor are not well targeted in Kazakhstan, with the percentage of social assistance recipients in rich cities/oblasts being higher than in poor oblasts, reflecting the limited ability of poor oblasts to afford social assistance.
The poorest households are in the south of the country and, to a lesser extent, the east and in the 57 single-company towns where the companies have failed. The most vulnerable groups are unemployed youth, women, and households with a large number of children.
Pensioners are poor, but not chronically poor, as pensions are large enough to keep them out of the bottom quintile, except when living in, and supporting, an extended low-income household. With international assistance, Kazakhstan has developed a well-designed and sustainable system to fund pensions. According to the Electricity Association, a typical pension in 2002 was 5,000 KZT/month ($32.68) of which around 3,000 KZT ($19.61) was for services (electricity, heat, water etc) and 2,000 ($13.07) was for food.
A typical household electricity bill in 2002 was in the range of $1.96 - $2.61 per month, representing up to 8 percent of a typical pension. A typical winter heat bill for a district-heated household was $9.80 to $13.07, representing 20 to 30 percent of a typical pension.
2 This very low figure excludes informal earnings, private transfers, and own production of food. 3 Many of the statistics presented in the following chapters conflict, particularly where governmental agencies and the various international organizations reported using different methodologies or prepared estimates based on different assumptions. Conflicting data are usually presented together and are fully referenced.
Introduction and Executive Summary Chapter 1
4
According to the Vice Prime Minister,4 government policy to address the problem of low-income consumers who have difficulty paying for energy will be to raise minimum income to a level where all households can afford to pay.
The government’s first official poverty reduction program began in 2000, and various ministries prepared the 2002 report State Program for Poverty Reduction (SPFPR) in the Republic of Kazakhstan in 2003 – 2005, in collaboration with international organizations. This report illustrates that the government’s commitment to reduce poverty is growing.
4. Subsidies and Assistance Payments
The Law on Social Assistance, which came into force in January 2002, abolished many special social transfers and focuses social assistance on households living below the official poverty line.
Social Assistance Payments (SAPs) are financed from the national budget but administered locally, and are designed to bring household income up to the poverty line. The poverty line was set 1,050 KZT/person/month ($13.86) in 2002, representing 40 percent of subsistence minimum. Hence, SAP payments were for whatever sum was required to bring monthly household income up $13.86 per person.
SAP was introduced in January 2002, replacing Housing Allowance Benefit (HAB), a means-tested social payment intended to help low-income households afford utility and other housing-related bills such as the charge levied by the housing maintenance organizations (zheks). Almaty, Astana and three of the oblasts continue to run a form of HAB in parallel with SAP.
HAB was first introduced in 1996; it worked on the basis that, if fixed household payments exceeded 30 percent of household income, HAB paid the difference. A criticism of HAB is that it created a disincentive to save energy because for qualifying households, incremental consumption of power, gas, heat or water consumption resulted in larger payments. HAB also had an urban bias, as household expenditure on non-network energy sources (bottled gas, coal and wood) were not taken into account.
Low benefits, late payment, and non-payment of benefits are major issues in Kazakhstan, with the poorest oblasts being generally least able to pay.
Non-payment and late payment of utility bills is a major problem for the utilities, although according to several commentators, pensioners and low-income households are better payers than richer households.
According to the Kazakhstan Electricity Association, only 55 percent of the authorized tariff revenue of $312 million per year is actually collected, with 18 percent ($57 million) being offset or subject to barter arrangements; 8 percent ($25 million) representing non-payment as a result of bad or un-collectable debt; and 18 percent ($57 million) excessive technical and commercial losses, including theft and bad meters. Two of the 4 Interview by author, June 2002.
Chapter 1 Introduction and Executive Summary
5
western companies that bought power distribution companies in Kazakhstan successfully addressed the non-payment problem, but these companies have since withdrawn from Kazakhstan.
The non-collection level for district heating varies widely from oblast to oblast, but in general around 70 percent of the money due is collected. Some systems have collapsed as a result of non-payment, so some households are now burning coal in apartments.
According to the State Program for Poverty Reduction for 2003 - 2005, paid services such as housing and utilities represent 46.7 percent of the household budget, which is cushioned ‘a little’ by housing allowances for low-income households.
5. Energy Efficiency
Despite apparent governmental interest in energy efficiency, the State Program of Energy Saving of 1996, the Law on Energy Savings of 1997, and energy-efficiency action plans in 1998 and 2000, little appears to have been done. The research team did not find any information on the concrete implementation or results of such programs at the household level. There have been a large number of internationally funded programs and projects to demonstrate the impact of energy efficiency, many of which are described in this report, but replication has been low.
The potential for energy conservation in Kazakhstan has been estimated to be 50-60 mtoe, representing the difference between current energy intensity and the average energy intensity of OECD countries. However, the team did not find a single weatherization project of any kind in Kazakhstan. Energy is artificially cheap, so it is generally more cost-effective for households to consume more than to invest in energy conservation. Energy-efficient household goods such as low-energy lamps and refrigerators are not in common use.
The use of day-night meters for households is low in Astana and Almaty, and absent in some of the oblasts. Incidence of metering for heat at the building varies widely from oblast to oblast. Heating metering and control at the household level is completely absent in Kazakhstan; there are no equipment suppliers.
Household water meters are very popular in Kazakhstan, as consumers discovered that installation of this relatively low-cost technology could substantially lower the water bill. Almaty city installs ‘free’ water meters in low-income households, which has had a noticeable impact on lowering the municipal budget for HAB and is one of the very few examples of low-income energy-efficiency measures observed in the five countries studied for this report.
There is no national energy-efficiency agency in Kazakhstan. A department of the Ministry of Energy and Energy Resources (MEER) nominally looks after energy-efficiency issues, but is supply-side oriented rather than demand-side. There is no national body with specific responsibility for low-income energy issues or ‘fuel poverty’ issues. There are no energy-efficiency NGOs, although a pensioners’ NGO and a

Introduction and Executive Summary Chapter 1
6
micro-credit NGO sometimes get involved in energy-efficiency issues. The relationship between government and the NGOs ranges from patchy at best, to hostile at worst.
6. Tariffs
The low level of tariffs and the low level of independence of the Anti-monopoly Agency, as described above, have so far prevented utilities from modernizing investing in energy saving. Bureaucratic, time-consuming and costly tariff negotiations that are conducted every three months rarely result in tariff rises, and when they do, they may be reversed three months later.
It is hard to generalize about Kazakh electricity tariffs, which vary extremely widely from oblast to oblast, and when expressed in real terms, fluctuate up and down, erratically. The national average tariff partially illustrates this; 4.2 US cents/kWh (1994), 3.2 cents (1995 and 1996), 4.6 cents (1997), 4.8 cents (1998), 3.2 cents (1999), and 2.7 cents (2000).
Regional electricity companies are generally operating at a loss and are unable to finance urgently needed investment in their systems. Retail electricity tariffs are excessively low, lower than the distribution component of tariffs in other countries, and technical, commercial and non-payment losses are excessive. In summary, Kazakhstan is trying to operate a $312 million electricity industry on only $172 million of cash receipts or 55 percent of authorized revenue.
Prices for district heating and hot water similarly vary from oblast to oblast and city to city. To illustrate this, drawing a hot bath in Aktau in 1998 cost 32 US cents, falling to 18 US cents in 2000; drawing a hot bath in Kyzlorda cost only 2.5 US cents in 2000.
Although low tariffs make energy is affordable to low-income consumers, the downside is that the utilities do not earn enough revenue to modernize their systems. The resulting power outages and voltage problems can be expected to continue or worsen as long as this situation continues.
Low regulated tariffs are also the principle reason for the recent exodus of the international investors from Kazakhstan and the continuing non-availability of investment funds to modernize the power system.
Other disadvantages of the tariff system include an international competitive disadvantage for Kazakh industries that are required to pay household energy costs through implicit subsidies; the environmental impact associated with highly inefficient use of energy; and the prospect of the situation deteriorating rather than improving as the cumulative effect of under-investment in energy systems continues to build up.
7. Overall Conclusion
Kazakhstan has made so little progress in the area of raising energy prices to market levels that it has not yet had to fully face up to the task of dealing with low-income households that cannot afford to meet the full cost of energy.

Chapter 1 Introduction and Executive Summary
7
8. Recommendations
The final chapter of this report suggests ways in which Kazakhstan could consider improving its energy social safety net. Several recommendations are steps towards creating conditions under which reduced energy consumption through energy conservation and energy efficiency could become attractive and possible for low-income households. Creation of such conditions would remove the affordability barrier that is currently preventing the introduction of tariffs that could support rehabilitation and expansion of the power, heat and gas systems.
The recommendations are to:
• Strengthen the Anti-monopoly Agency’s independence; • Improve regulatory certainty; • Improve the dialogue between governmental, non-governmental, and private
sectors; • Take steps to stimulate the private sector housing market; • Re-design and re-launch the HAB; • Establish an Energy Conservation Agency; • Design and implement a low-income energy-efficiency program; • Improve the collection an dissemination of energy-efficiency data; • Create a legal right for households with meters to pay according to the reading; • Take steps to strengthen and empower KSKs; • Introduce district heating metering and control; • Replace universal tariff subsidies with targeted low-income tariff subsidies; • Consider reforming billing and collection; • Review the regime for disconnection for non payment; • Reduce technical and commercial losses; and, • Index energy prices to hard currency and gradually raise them.

9
Chapter 2 Poverty and Social Assistance in Kazakhstan
A. Poverty in Kazakhstan
The degree and rate of poverty in Kazakhstan have risen sharply since its independence from the Soviet Union. Poor economic performance, decreasing wages, high unemployment, and decreases in social transfers and social protection all contributed to the increase in poverty. Real wages fell significantly by an estimated 50 to 75 percent between 1990 and 1997. 5 Income per capita (PPP) fell from $6,547 in 1989 to $4,372 in 1999.6 Wage and pension arrears have been a constant source of public unease and contributed to payment problems for state services such as utilities. At the end of 1996, wage and pension arrears totaled 6 percent of GDP.7 At the end of 2001, the poverty rate stood at 28 percent.
The donor community was overly optimistic8 in the expectation that transition from a planned to a market economy could be accomplished in a short time at a low social cost in Kazakhstan and the other countries of the former Soviet Union. The strategy did not focus forcefully enough on institutions, protection of the poor, and gender issues. Despite the efforts of the government and other international organizations, Kazakhstan’s per capita GDP has dropped 40 percent since independence in 1991, poverty has grown significantly, major social indicators have worsened, and pubic financial accountability remains poor.
1. Expenditure on the Social Safety Net and Sources of Financing
According to the World Bank, when Kazakhstan first joined the International Bank for Reconstruction and Development (IBRD) in 1992, the pattern of social service provision was incompatible with market reform. For example, state-owned enterprises ran their own social facilities such as hospitals, polyclinics, kindergartens and other utilities; social protection was available universally rather than being targeted towards the poor; and allowances and similar benefits were frequently available through several different channels.
Until 1998, social protection included old-age pensions, price discounts for the elderly, pensions and subsidies for veterans and the disabled, unemployment benefits, child and housing allowances, and benefits in-kind and in cash. As of December 1998, there were 47 kinds of categorical beneficiaries who received 202 different types of price discounts.
5 This ranks Kazakhstan as the fifth worst among the former Soviet countries in terms of real wage decreases. See Klugman and Scott in Falkingham et al., 1997, for a discussion of problems in official wage and employment data. 6 Central Asia Country Unit, ECA, World Bank, Kazakhstan: Development Priorities and Proposed World Bank Activities (Washington, D.C., September 16, 2001) 5. 7 M. Murthi, M. Pradhan and K. Scott, “Poverty and Economic Transition in Kazakhstan, in Transition in Asia,” edited by Aiguo Lu and Manuel Montes, UNU/WIDER project, (1998). 8 World Bank, Republic of Kazakhstan, Country Assistance Evaluation, (Washington, D.C., February 2001).
Poverty and Social Assistance in Kazakhstan Chapter 2
10
After 1999, the social protection structure became more clearly divided between national and local governments. Associated with budgetary changes were deep reforms in social programs. Social and old age pensions were paid exclusively from the republican budget. The old-age pension system was reformed and gradually replaced by a new fully funded accumulation system. Categorical benefits were replaced by a special state allowance with only 14 categories of beneficiaries. Unemployment benefits were abolished and all remaining social assistance programs were transferred to the local government.
The main elements of the social assistance programs at the local level include means-tested social assistance for the poor and a new housing benefit program. Public works and retraining programs have replaced unemployment benefits.
Social sector spending as a share of GDP has fluctuated considerably without showing a definite trend. At the beginning of the transition period (1991-94), there was a substantial decrease in social transfers for the poor. Combined pensions and social assistance spending dropped from 11.2 percent of GDP in 1991 to 4.6 percent in 1994. After this initial period, social spending increased to 6.6 percent and peaked at 9.6 percent in 1998. Since then spending on pensions and social protection has again declined, reaching 5.8 percent of GDP in 2001. These changes in social spending are correlated with budgetary crises and suggest that social transfers are a residual budget category.
Almost all taxation is pooled at national level and re-distributed to the oblasts according to need, taking into account (among other things) the number of people receiving social assistance and household assistance needs. There are a very few local taxes that are collected and spent locally, e.g. alcohol tax. Hence the entire social support budget, although the oblasts administer it, is set at a national level.
As of July 2000, targeting assistance to the poor had not been a priority for national government, which had focused social assistance efforts first on unemployment payments and then on active labor market programs. Responsibility for social assistance was devolved to the local governments, which are better able to define local needs but worse able to finance such needs. The IBRD responded by securing an assurance in December 2000 that local budgets for poverty issues would be protected and controlled at a national level to improve inter-regional equity.
2. The Influence of Petroleum Export Revenue on Social Policy
Kazakhstan’s approach to poverty alleviation is strongly influenced by the fact that this once relatively poor country has become substantially rich in recent years and has every prospect of becoming very much richer in the future. Having successfully overcome some of the export limitations of being a land-locked oil producer, annual petroleum export revenues by value stood at around $4.5 billion in 2001, and, according

Chapter 2 Poverty and Social Assistance in Kazakhstan
11
to the International Monetary Fund (IMF), are expected to double (by volume) and triple (by value) by 2005.9
The Development Strategy of Kazakhstan to 203010 calls for a “rapid increase of production and export of oil and gas in order to receive revenues that would contribute to sustained economic growth and an improvement of the standard of living of the people.” The strategy involves integrating Kazakhstan into world markets, developing a network of export pipelines, and attracting major foreign companies to do business in Kazakhstan as a fuel supplier of global significance.
The IMF emphasizes that the non-oil fiscal balance should be taken into account when assessing the financial sustainability and fiscal vulnerability of a natural resource-rich country such as Kazakhstan. A 1998/99 economic shock resulting from a fall in principal export commodity prices, the Russian crisis of mid-August 1998, and a drought-induced record low grain harvest illustrate the extent of such vulnerability. However, the recovery of world oil prices in 1999-2000 pulled the economy out of a recession. The recent establishment of a National Fund, modeled after then Norwegian Stabilization Fund, to save oil revenues for the future and stabilize oil windfalls should help insulate Kazakhstan from some of the instability that can result from an over-reliance on petroleum revenue. The World Bank also noted sustainable development for Kazakhstan hinges on avoiding the “Dutch disease.”11
In summary, with a population of 16.7 million,12 Kazakhstan’s annual petroleum export revenues already represents some $270 per person and are expected to rise to more than $800 per person. In 2000, the energy sector’s share of GDP13 was 37 percent, so the energy sector’s influence in general and petroleum revenue in particular quite understandably pervade all aspects of government policy, including social policy.
3. Key Poverty Statistics and Definitions for 2001 (UNDP)
The UNDP publication, “Poverty Maps - Kazakhstan 2001,” comprehensively defines and reports poverty data. Key definitions and summary data are provided below, and a chart describing key poverty indicators for 2001 is in appendix 3.1.
• The poverty level is defined as the population living below the poverty line.
9 IMF, Republic of Kazakhstan: Selected Issues and Statistical Appendix (Washington, D.C., April 2002). 10 “The Development Strategy of Kazakhstan to 2030” is reviewed in the Energy Charter Secretariat’s Kazakhstan: Investment climate and market structure in the energy sector (Brussels, July 2002). 11 Following the discovery of large gas deposits in the Dutch North Sea in the late 1950s and early 1960s, the Netherlands became over-reliant on petroleum revenue. Their currency became over-valued, leading to non-traded goods such as housing, health care and transport becoming more expensive and creating inflationary pressure. The same phenomenon, now known as the “Dutch disease,” occurred in the 1970s in other oil-rich economies such as Mexico, Nigeria and Venezuela. 12 Population estimates vary quite widely, with the CIA estimating it as 16.7 million in July 2001 (www.cia.org), the World Bank estimating 15 million for 2000 (www.worldbank.org), the Asian Development Bank (ADB) estimating 15.6 million (www.adb.org) or 15.07 million (on its “Key Indicators”) for 1998 and 14.83 million for 2001. 13 Energy Charter, Kazakhstan: Investment climate.
Poverty and Social Assistance in Kazakhstan Chapter 2
12
• The poverty line is defined as the income required to satisfy minimum human needs, which was 1,707.5 KZT per month ($11.64) in 2001. (See below for a caveat).
• The “subsistence minimum” is the income level per person that equates to the cost of the minimum consumers’ basket, that ensures the satisfaction of minimum human needs at the level established by a society at a given stage of development. The subsistence minimum in Kazakhstan in 2001 was set at 4,587 KZT per month ($31.23).
• The “minimum consumers basket” represents the cost of standard basic food items and non-food products and services. In Kazakhstan’s official statistics, food products are some 70 percent of this indicator,14 with non-food products and services accounting for the other 30 percent.
• The headcount ratio is the percentage of the population who consume less than the subsistence minimum. It was 31.8 percent of the population in 2000 and fell to 28.4 percent in 2001.
• The assets coefficient is the proportional relationship between the incomes of the richest 10 percent of the population and the poorest 10 percent; it was 11.3 in 2002.
• The unemployment rate, the share of unemployed among the total economically active population, was 10.4 percent in 2001.
4. Caveat
Despite the clarity of the UNDP definitions, “poverty line” is actually used in to mean different things by different groups, sometimes to indicate the point at which social assistance becomes payable (40% of subsistence minimum), and sometimes to mean the subsistence minimum itself.
Before 1999, there was no official definition of the poverty line in Kazakhstan.15 According to the World Bank, one reason was that there is a tendency for the public to think of the poverty line as a threshold below which households become eligible for social assistance and other benefits.
The government recognizes the terminology problem, as one of its strategies to improve poverty indicators detailed in the 2002 State Program for Reduction of Poverty in 2003 – 2005 is:
For the purpose of matching poverty terminology with international standards changes into the legislation on social protection are envisaged to be introduced for making the ‘poverty line’ notion equal to the ‘minimum subsistence level’ and using them as synonyms. The ‘poverty line’ term as
14 The State Program for Poverty Reduction, 2002 indicates that this benchmark is not particularly applicable as the food to non-food expenditure ratio was 52:48 in Kazakhstan in 2001, and the consumer basket does not fully reflect expenditure on utilities and transport that are a considerable share in low-income household budgets. 15 World Bank, Kazakhstan - Living Standards during the Transition. World Bank Report No. 17520-KZ (Washington, D.C., March 23, 1998).

Chapter 2 Poverty and Social Assistance in Kazakhstan
13
a criterion for targeted social protection must be excluded from the current legislation and giving an independent meaning.
Kazakhstan’s official poverty line, set in 1999 (see below), defines the poverty line as the point at which social assistance becomes payable.
5. The Definition of Poverty
Kazakhstan set an official poverty line according to the Law On Subsistence Level (1999), which drew the poverty line as a criterion for targeted social assistance based on a minimum subsistence level (prozhitochnyi minimum), similar to the methodology used in Bulgaria. The minimum subsistence level for a person is determined as the cost a basket of goods.16 The 2001 minimum subsistence level was 4,487 KZT/month (approx. $30.50), which translates to a poverty rate of 28.4 percent. Based on average per capita income levels, it is estimated that approximately 4.7 million people are living in poverty.
In 2002, the official poverty line17 was set at 40 percent of minimum subsistence, increasing from 38 percent in 2001; 1.577 million people (approximately 10% of the population) lived below the poverty line on January 1, 2002.
A household or individual with income that is lower than subsistence minimum does not necessarily qualify for social assistance payments. In 2002, the official poverty line was only 1,050 KZT/person/month ($13.86), representing 40 percent of subsistence minimum. This represented an increase from the previous year, when the poverty line was 1,707.5 KZT ($11.64) or 38 percent of subsistence minimum. There were 1.577 million people, representing approximately 10 percent of the population, who were recorded as living below the (2001) poverty line on January 1, 2002.18
The percentage of the poverty line against subsistence minimum will continue to be revised from year to year.
According to the EBRD,19 Kazakhstan is one of the Commonwealth of Independent States (CIS) countries with the lowest poverty level. In 1996, only 6 percent of the population lived on incomes below $2.15 per day (in 1996 PPP). A 1999 household survey found that only 4.7 percent of the population fell below a $1.45 per day (PPP) poverty line, rising to 30.9 percent of the population using a $4.30 per day (PPP) poverty line.
16 The basket is updated monthly. 17 Government of Kazakhstan, State Program for Poverty Reduction in the Republic of Kazakhstan in 2003-2005 (Almaty, 2002). 18 Ibid. 19 EBRD, Strategy for Kazakhstan (London, October 2002).

Poverty and Social Assistance in Kazakhstan Chapter 2
14
6. The Extent of Poverty in Kazakhstan
While official poverty statistics are not a definitive authority on the extent of poverty and poverty trends, the government’s figures are generally consistent with other sources, as reviewed below.
According to the World Bank, 35 percent of the Kazakh population lives below the poverty line.20 According to the UNDP, the income of 28 percent of the population is less than subsistence minimum, and in Kzylorda Oblast, the income of 40 percent of the population is below this level.
Another World Bank poverty study21 found that in 1996, more than one-third of the Kazakh population lived below ‘subsistence minimum’, which was considerably lower than previous estimates of poverty that were based on flawed Family Budget Survey income distribution data.22 Given the large extent of poverty in Kazakhstan, it was considered unrealistic to expect public transfer programs to make a considerable impact on poverty elimination, and the Bank thus considered a focus on strong and sustained economic growth should factor strongly in poverty alleviation policies. In addition, it was considered unrealistic to expect a substantial short-term increase in state funding for social protection, so a focus should be placed on making existing social programs more effective by reducing leakage and improving targeting. The above study also noted that private transfers, including assistance from immediate and extended family, other households, charities, cultural and religious organizations and NGOs were more than twice as large as the sum of all other public transfers (excluding pensions) in 1996.
According to the ADB,23 the percent of the population living below the poverty line increased from 25 percent in 1992 to 43 percent in 1997, then decreased24 to 31.8 percent in 2000, breaking down to 30.0 percent of the urban population and 34.2 of rural.25 Average statistics mask severe regional differences and poverty is acute in rural areas, particularly parts of southern Kazakhstan.
20 World Bank, Kazakhstan at a Glance, 2001 (Washington, D.C., 2001), contains the most recent estimates of the latest year available. 21 World Bank, Kazakhstan - Living Standards during the Transition relies on the Kazakhstan Living Standards Survey, which is nationally representative, using a probability sample of 1,996 households and 7,223 individuals in contrast to the annual Family Budget Survey, which samples on a quota basis. The survey instrument covers sources of consumption in detail, including consumption derived from self production and gifts, both of which are large components of the some household’s consumption; it is an integrated, multi-purpose survey that can be used to study inter-linkages among a range of topics. Unfortunately, the survey specifically excluded the HAB (see chapter 4) that was introduced in 1996 and was considered too new to be incorporated effectively. 22 The flaws were related to the measurement of income. 23 ADB, Country Assistance Plan 2000-2002 (Manila, December 1999). 24 ADB, Key Indicators of Developing Asian and Pacific Countries, 2002 (Manila). 25 Other ADB poverty statistics, from the same publication, are for 1996, which may be considered too old to give an indication of the position now, given the economic shock of the late 1990s and the economic boom in the early 2000s. The percentage of the population living on $1/day in 1996 was 1.5%; the income ratio of the highest 20% to the lowest 20% was 6.3; and the Gini coefficient was 0.35, with a value of zero implying perfect equality and a value of 1 implying perfect inequality.
Chapter 2 Poverty and Social Assistance in Kazakhstan
15
7. The Character of Poverty
The poorest households are in the south of the country and, to a lesser extent, the east. Poverty is highest in rural areas and in the 57 single industry towns, where the enterprise has failed. The most vulnerable groups are unemployed youth, women, and households with a large number of children. Pensioners are also poor, but not chronically poor, as pensions are large enough to keep them out of the bottom quintile, except when living in, and supporting, an extended low-income household.
The World Bank26 found that the probability of a person living in southern Kazakhstan being poor was almost three times as high as the country average, and that almost one-third of the rural population was living below the subsistence level in 2001.
Access to household utilities is very low, with only 44 percent of households having all utilities and only 75 percent of the population being connected to water supply networks. 50 percent of the population use potable water that does not meet quality standards.27
Rural electrification is identified in the State Program for Poverty Reduction 2003 – 2005 as a component of the government strategy to reduce poverty levels, but details about the number of households without access to power are not provided.
B. Social Assistance and Poverty Reduction Initiatives
1. Extent and Type Social Assistance
The extent of social assistance has undergone substantial reform since the political changes of the early 1990s. The government inherited social protection measures that were inconsistent with a market economy, so it took several steps to make the social safety net less generous and to better target social assistance. Examples of fundamental reform included the removal of the guarantee of employment and the creation of employment services such as cash benefits, training and work placements.
General social support targets families with children, single parents, people with disabilities, and people affected by nuclear fallout. There are separate budgets for unemployment benefits and for pensions. See appendix 3.2 for more information.
According to the Center for Gender Studies,28 1.8 million people received targeted social assistance from local budgets in 2000. The average monthly benefit was 3,339 KZT ($23.50), and in 2001, resources allocated in local budgets for social assistance totaled 8.8 billion KZT ($62 million).
According to national statistics,29 some 787,300 individuals received social assistance in 2000, representing 18.9 percent of the population of 14.8 million. Regional variation was
26 The World Bank findings are summarized in the above-mentioned EBRD report. 27 Kazakhstan, State Program for Poverty Reduction. 28 S. Shakirova and M. Seitova, Center for Gender Studies, National Report for Kazakhstan, 2002, which cites the Ministry of Labor and Social Protection. 29 Regional Statistical Yearbook (Almaty: 2001).
Poverty and Social Assistance in Kazakhstan Chapter 2
16
high, from 26.5 percent of Almaty city, the richest area, to only 14.7 percent of Kzylorda, the poorest area. These statistics are extremely significant, as they demonstrate that social assistance is not reaching the poor. (See appendix 3.3. for more information.)
For Kazakhstan as a whole, the average size of monthly payments dropped slightly from 2001 to 2002. Payments based on age remained constant at 2,175 KZT, hence falling in dollar terms from $15.31 to $14.80 as a result of a reduction in the currency’s value. Average monthly payments for a handicap fell from 3,431 KZT to 3,362 KZT (from 21.48 - to 20.34), and payments based on the loss of a breadwinner fell from 4,170 KZT in 2000 to 4,144 KZT in 2001 (from $21.14 - $20.34). However, some regions increased payments while others reduced them, for example, with the size of payments for a handicap falling from 3,129 KZT in 2000 to 2,932 KZT in 2001 in Aktobe Oblast, and payments for the loss of breadwinner rising from 3,759 KZT in 2001 to 3,858 in 2002 in Kostanai Oblast. (See appendices 3.4, 3.5, and 3.6 for more information.)
2. The Program for Poverty and Unemployment Reduction, 2000 - 2002
The Program for Poverty and Unemployment Reduction, approved by decree #833 of June 3rd 2000, was the government’s first official poverty reduction program. Successes30 included reducing the share of the population with per capita income below minimum subsistence from 31.8 percent at the beginning of the program to 28.1 percent in 2001, and reducing unemployment levels from 10.4 percent of the economically active population in 2000 to 10.4 percent in 2001.
3. State Program for Poverty Reduction (SPFPR) in 2003 - 2005
The 2002 SPRPR report, which the Ministry of Economy and Trade, Ministry of Labor and Social Protection, Ministry of Finance and other state bodies prepared with contributions from ADB and UNDP projects, represents the best available overview of poverty issues with the most up-to-date statistics.
The SPFPR is based on decree #305 of February 28th 2001, On Establishing an Inter-Agency Commission for Poverty Reduction.
The SPFPR’s objective is to reduce poverty by: creating conditions for economic growth, productive employment and increase in incomes of the population; improving access to healthcare and educational services for the poor; improved targeting of social protection; and achieving higher efficiency of state management with involvement of social institutions in decision-making.
The SPFPR’s aims include reducing the scale of poverty in Kazakhstan in 2005 by one-third, as compared with 2002. Improved targeting through the creation of a single identification system and creation of a social payment recipients’ register are components of the overall poverty reduction strategy.
30 The successes of the Program for Poverty and Unemployment Reduction for 2000-2002 are summarized in the State Program for Poverty Reduction in the Republic of Kazakhstan in 2003 - 2005.

Chapter 2 Poverty and Social Assistance in Kazakhstan
17
The SPFPR financing sources are described as national and local budgets and international organizations. The specific amounts “will be determined jointly with the ministries and agencies concerned in the nearest time.”
4. Household Budget Survey, 2001
The National Statistics Agency conducted an extensive household budget survey in 2001, which is summarized in “Republic of Kazakhstan - Population Living Standards” issued by the RNE “Kazstat Inform” (the national statistics agency) in 2002, and which is the source of several of the tables appended to this report.
5. The Law on State Targeted Social Assistance, January 2002.
The recent law was passed in recognition of the fact that Kazakhstan’s social assistance does are relatively poor job of targeting the most needy households as compared to some other countries. At the time of the research mission to Kazakhstan for this project, regulations and programs required to implement the law were still at the design stage.
6. Low Benefits, Non-payment and Late Payment of Benefits
Although the social safety net continues to be reformed in Kazakhstan, the level of provision of social protection to poor families is low, with poorer oblasts provide lower and more intermittent coverage than richer oblasts.
A recent World Bank report31 states that,
…social assistance has tended to become a residual category in the spending pattern of local oblasts. Consequently, important components within the rubric of social assistance may not be executed…. As a measure to counteract any potential accumulation of arrears in social assistance, the rules governing social assistance gives oblast administrations the freedom to adjust the level of benefits commensurate with their revenue raising capacities. While such flexibility tends to help arrest the accumulation of arrears at oblast levels, it also tends to push social assistance down to the bottom of oblasts’ expenditure priorities…
According to the Center for Gender Studies32, payment of salaries and other budgetary items were several months in arrears and child allowances payments were two years in arrears in 1999. Non-payment has been a long-standing problem in Kazakhstan, with the World Bank noting33 that in 1996, many of the unemployed stopped bothering to register because unemployment benefits was not paid, and other forms of social assistance went unpaid, particularly in the most impoverished rural areas in the south and east of the country, where local authorities did not have the funds to pay.
31 World Bank, Kazakhstan Public Expenditure Review, Volumes 1-3 (Washington, D.C., June 27, 2000)115. 32 Svetlana Shakirova and Y. Zaitsev, Center for Gender Studies, “Democracy is Retreating,” in the National Report for Kazakhstan (1999). 33 World Bank, Kazakhstan - Living Standards.
Poverty and Social Assistance in Kazakhstan Chapter 2
18
7. Pensions
Individuals with pensions are considered to be relatively well off in Kazakhstan, but many pensioners live in extended families, and part of their pensions go towards supporting other family members.
In January 1998, a funded, accumulative pension system, based on mandatory contributions, was introduced to replace the old solidarity pension system, based on employment history. Recent retirees receive a pension that is based partially on both systems, and in time the new system will fully replace the old system, which is on a natural decline. Two recent studies undertaken on the behalf of the Ministry of Finance and the Ministry of Labor and Social Protection, that the IMF reviewed,34 conclude that the pension system appears to be financially sustainable and will maintain pension levels at least constant in real terms for nearly all retirees.
Also in 1998, the government passed a resolution to provide a minimum pension based on minimum living standards indicated in a “Living Standard Assessment” that had been conducted that year. According to the World Bank,35 the pension level of 2,600 KZT/month (approximately $32 in 1998) represented around 70 percent of the $40 subsistence minimum. By February 2001, the pension level had grown, when expressed in KZT, to 3,500 KZT/month, but this represented a reduction to $25/month, when expressed in US currency. The Bank reported widespread dissatisfaction among the population with the minimum pension.
A comparison of monthly average pensions and minimum subsistence levels for the years 1997 - 2000 shows that, although pensions dropped below the minimum subsistence in some months (by as much as 7% in March 1997), pensions normally exceeded minimum subsistence by as much as 25 percent in the first three months of 1999. (For more information, see appendices 3.7 and 3.8).
8. Unemployment
Although estimates and statistics vary, there is consensus that the unemployment rate is declining.
According to Kazakh national statistics,36 the number of unemployed declined from 967,800, representing 13 percent of the economically active population in 1997, to 757,700, representing only 10 percent of the same population in 2001.
According to the ADB,37 unemployment levels peaked at around 950,000 in 1999, representing 13.5 percent of the labor force or 6.4 percent of the population. Unemployment levels fell to 770,000 in 2001, representing 10.5 percent of the labor force or 5.2 percent of the population (see appendix 3.9 for more information).
34 The IMF Review of January 7, 2002 included a detailed review of the pension system. 35 World Bank, Kazakhstan, Country Assistance Evaluation. 36 IMF, National Statistics Agency, and the Ministry of Labor. 37 ADB, Key Indicators of Developing Asian and Pacific Countries.
Chapter 2 Poverty and Social Assistance in Kazakhstan
19
According to the US. Department of Energy,38 the unemployment rate was only 3.3 percent in 2001.
An Unemployment Fund was established in 1995 and pilot Employment Offices set up, both with the World Bank’s support and with the objective of mitigating some of the social impact of the closure and downsizing of enterprises. However, fund arrears quickly accumulated, so it was abolished and the Employment Offices closed, with responsibility for supporting the unemployed devolved to the local government. The government’s focus turned to supporting active labor market programs.
Although the local governments are better positioned to target low-income households, they had an unequal ability to afford unemployment benefits and other social transfers, with poorer regions with higher unemployment levels and greater poverty being least able to pay, so inter-regional inequality increased. The World Bank subsequently secured an agreement with the government in December 2000 that local budgets will be protected from a role in poverty issues and the benefits will be controlled at the national level to ensure greater inter-regional equity.
9. Savings
Low-income households that may wish to save money during the summer to cover some of the winter heating costs may be put off by the decline in the value of household savings held in KZT against the US dollar. Savings were sharply depleted by the fall in value from 84 KZT/USD in January 1999 to 132 KZT/USD in December 1999, following flotation of the currency from April 1999. As a result, households increasingly prefer to hold savings in US dollars; the share of household savings in dollar accounts rose from 46.6 percent at the end of 1999 to 73.6 percent by the end of September 2001, according to the IMF. The KZT has been relatively stable in the period since 1999, but continues to depreciate slowly. Monthly KZT/USD exchange rates since are provided in appendix 1.2.
10. Poverty Reduction Program and Living Standards Measurement Survey
The UNDP has been helping to prepare a Poverty Reduction Program, working with the Ministry of Economy and Trade and a high-level inter-ministerial commission led by Deputy Prime Minister Pavlov.
(The World Bank conducted a Living Standards Measurement Survey in 2001-2003, but the results were not yet available when the research for this report took place.)
11. Plans for Renewable Energy to Reduce Poverty in Remote Areas
According to the ADB’s Country Assistance Plan39: “the Government is considering ways to develop renewable energy for reducing poverty in the remote regions and to yield long-term cost savings.”
38 Energy Information Administration (EIA), “Kazakhstan Country Analysis Brief ” (Washington, D.C., July 2002). 39 The ADB Country Assistance Plan for 2001-2003, published in December 2000, is the most recent country assistance plan available at www.adb.org.
Poverty and Social Assistance in Kazakhstan Chapter 2
20
C. Impact of Energy Costs on Low-Income Households
1. Share of Utilities in the Household Budget
According to the Electricity Association, a typical pension in 2002 was 5,000 KZT/month ($32.68), of which about 3,000 KZT ($19.61) was used for services (electricity, heat, water, etc.) and 2,000 ($13.07) for food. This was further broken downs as follows:
• A typical household electricity bill is 80 - 100 kWh/month at around 4 KZT/kWh (2.6 US cents/kWh), so 320 - 400 KZT/month ($1.96 - $2.61/month), represents up to 8 percent of a typical pension.
• A typical winter heating bill for a district-heated household is 1,500 KZT - 2,000 KZT, ($9.80 - $13.07), representing 20 - 30 percent of a typical pension.
According to the Ministry of Social Protection, the problem of how low-income households pay for utilities is getting worse over time, not better.
Energy sector reform could have a strong impact on poverty rates. Kazakh winters are long and cold, with average temperatures in January ranging between minus 4 and minus 19 centigrade. This is significant to the design of the energy social safety net, as the economic potential for using energy efficiency and weatherization to reduce household expenditures on energy is correspondingly higher than in warmer climates with milder winters.
2. Pensioners and Low-Income Households are Better Payers than the Rich
According to several commentators, pensioners and low-income consumers are better payers (for all utilities) than richer consumers. A number of hypotheses were suggested for this ranging from a need to control the household budget better, to higher moral standards by the older generation, to a lower ability to cope with the possible consequences of non-payment, such as disconnection or litigation. No one really appears to know for certain why this phenomenon occurs, but it clearly does. (The research team encountered this phenomenon in other countries too.)

21
Chapter 3 Energy Subsidies and Assistance Payments
A. General Approach to Fuel Poverty and Energy Subsidies
According to the Vice Prime Minister,40 to address the problem of low-income consumers who have difficulty paying for energy, the government policy will be to raise minimum incomes to a level where all households can afford to pay. While this assertion would be treated with some skepticism had it been made by a representative of almost any other country in the region, Kazakhstan’s relatively small population and large petroleum earnings makes this approach feasible.
According to the Vice Minister for Energy, there are no plans to provide energy subsidies to households. Household electricity prices are low, typically 400 or 500 KZT per month ($2.61 - $3.27). 41 Households who do not or cannot pay this small amount are disconnected.
According to the EBRD, the government appears to want to subsidize investment so they can keep tariffs low for all, which represents a subsidy that benefits the rich more than the poor.
B. Electricity Subsidies
1. Direct Subsidies
There are no direct subsidies for power in Kazakhstan. Economic liberalization and the creation of markets for bulk power have created conditions in which bulk prices are extremely low. The regulator keeps household end-user tariffs much lower than the long-run marginal supply cost, so utilities are unable to invest in modernization.
2. Assistance Payments
a. Social Assistance Law and Social Assistance Payments (SAP)
According to the EBRD,42 the Law on Social Assistance that came into force January 2002, abolished many special social transfers and focuses social assistance on those households living below the official poverty line. The EBRD identified a possible weakness in the law; it passes responsibility for social transfers to local budgets, so the poorest areas with the smallest local budgets are least able to support such transfers.
According to the UNDP,43 the targeting criteria under the new system has attracted a lot of criticism, e.g. low-income households with a cow or a garden cannot qualify for payments, so the cow is sold or low-income households that have taken out a micro-
40 Interview by author, June 2002. 41 Estimates of ‘typical’ power bills varied widely in Kazakhstan, reflecting wide regional tariff variations and the variable extent to which alternatives to electric heating were available locally. 42 EBRD, Strategy for Kazakhstan. 43 Interview by author, June 2002.

Energy Subsidies and Assistance Payments Chapter 3
22
credit are disqualified on the basis that they are ‘entrepreneurs’. The UNDP also expressed concerns that the Ministry of Labor and Social Protection had not conducted a proper costing exercise to measure the new system’s budgetary implications.
b. Almaty Akimat’s Experience with SAP in 2002
According to Almaty Akimat’s Department of Labor and Social Protection,44 SAP is financed from the national budget (but administered locally), and is designed to bring household income up to the poverty line. The poverty line was set 1,050 KZT/person/month ($13.86) in 2002, representing 40 percent of subsistence minimum. Hence, SAP payments were for whatever sum was required to bring monthly household income up $13.86 per person.
Almaty made SAP payments totaling some 189 million KZT ($1.2 million) to 18,806 recipients in 2002. The mean monthly payment was 1,032 KZT ($6.70), but the range of payments was very high, from only 52 KZT ($0.34) for households where incomes that fell only a little short of the poverty line, to 9,000 KZT ($123.38) for the largest low-income household in Almaty. Almaty’s SAP budget for 2003 is 208.7 million KZT (approximately $1.3 million).45
c. The Housing Assistance Benefit (HAB)
Before SAP was introduced in January 2002, HAB, which included a utility benefit, was in place. HAB was a means-tested social payment intended to help low-income households to afford their utility and other housing-related bills such as the charge levied by the housing maintenance organizations.
Although SAP nominally replaces HAB, Almaty, Astnana, Kostanai and Akmola are continuing to operate both schemes in parallel. Taldikorangan is also continuing to run a HAB scheme, but only during the winter months.
The municipalities manage HAB and the municipal social protection budgets provide the funds. In common with most municipal budgetary items, the HAB budget was fed from the central (national) budget, with the amount being negotiated annually with the central government. Once agreed, social protection funds were transferred to the municipal government account as non-sequesterable local budgetary items.
HAB was first introduced on May 1, 1996, following a one-and-a-half year pilot program in Semi Palatinsk. According to a 1998 World Bank report,46 the scheme started off small but “is expected to expand substantially in the near future.” The report describes the aim of the housing allowance scheme to be “... compensating households for utilities and maintenance expenditure above a certain proportion of household income for a pr-determined maximum floor space.”
44 Interviews by author with the Social Assistance Payment Department and the Utility Assistance Payment Department, 2003. 45 Converted using 2002 exchange rates. 46 World Bank, Kazakhstan - Living Standards.

Chapter 3 Energy Subsidies and Assistance Payments
23
The exact size of the HAB component of the social assistance budgets is determined based on a municipal analysis of the historical utility bills of low-income consumers and current tariffs. If tariffs are raised during the financial year, this creates a budgetary shortfall. In this context, municipal politics and the decisions of the local branch of the energy regulatory authority are closely linked. (See appendices 4.1 and 4.2 for more details.)
d. How HAB works
HAB works as follows:
If fixed household payments exceed 30 percent of household income, the difference is paid. For example, if a monthly income is 20,000 KZT (100 percent), and utility payments are 10,000 KZT (50 percent), the assistance payment is 4,000 KZT (i.e. 20 percent of income, the difference between 30 percent of income and 50 percent of income).
To qualify for the HAB, household must demonstrate income and expenditure (salary documents, utility bills). There is also a limitation on the size (floor space) of households that may benefit from HAB. There are Housing Allowance Centers in each Akimat, or several in larger cities, where households can come for detailed information and practical assistance.
e. How HAB Money Flows
The way in which the HAB money flows changed since the scheme was introduced; first, the payments were made to the utilities and later in cash.
According to the World Bank47 in 1998, the scheme consisted of a discount from the amount that a household paid to the utility company or zhek, rather than cash payment to the household. It noted that utilities and zheks were “supposed to be reimbursed in full for these discounts by the oblast authorities.”
In 2002, payments were made in cash, in arrears. Households must provide receipts to demonstrate that they have actually paid all the utility bills before HAB is payable.
f. HAB’s Strengths and Weaknesses
Its main strength is that it is payable in arrears upon production of paid-up utility bills. This strongly encourages utility payment discipline by households. However, a weakness is that it creates a disincentive to save energy, as for qualifying households, incremental consumption of power, gas, heat or water consumption results in a larger payment. Another weakness is its urban bias, which is inappropriate for social assistance as rural households tend to be poorer than urban households in Kazakhstan. Rural households are also less likely to be reliant on electricity or district heating and more likely to use forms of heating that are not eligible for HAB payments, such as
47 Ibid.
Energy Subsidies and Assistance Payments Chapter 3
24
bottled gas (lpg), coal and wood. In addition, rural households tend to be single occupancy buildings that do their own maintenance rather than rely on zheks.
g. Number of HAB Beneficiaries and Size of Payments
By 1998, HAB had emerged into a substantial benefit that over 150,000 households received, representing 3.7 percent of the 4.1 million households.48
In Astana, which is one of the cities that are continuing a HAB program in parallel with SAP, about 3,500 of 80,000 households (4.4 percent) received HAB in 2002.49 In Almaty, the other city that continued to run the HAB scheme in 2002, 10,680 beneficiaries received a total of 206,769 million KZT ($1.34 million), with an average of $6.50 per beneficiary household. Eligibility rules are that over 30% of the total household income should be spent on utility/housing bills; the household must have no debts to the utilities; households may have a living area of no more than 40 m2 for two people; and the maximum monthly electricity consumption supported is 45 kWh/person/month.
During the 2001/2002 and 2002/2003 winters, the number of HAB beneficiaries in Almaty fell and the size of payments rose. In January 2003, 4,864 beneficiaries received a total of 5,306,909 KZT ($34,239), which averages to $7.04 per beneficiary. For January 2002, 7,071 beneficiaries received a total of 6,902,211 KZT ($45,955), which averages to $6.50/beneficiary.50 According to Almaty Akimat’s Department of Labor and Social Protection, the installation of hot and cold water meters lowered the total number of households requiring HAB by 2003.
3. Indirect and Cross Subsidies
h. Cross-Subsidies between Households and Other Sectors
In OECD countries where energy prices generally reflect the supply cost, household prices are typically around double industrial prices, sometimes more. This is not the case Kazakhstan, so it is clear that a cross-subsidy exists between industrial consumers and households.
i. Toleration of Non-payment as a Form of Subsidy
(1) Extent of Non-payment
Estimates of the extent of non-payment for electricity and for heat vary widely, partially as the extent of the non-payment varies widely in different regions of Kazakhstan.
According to the UNDP,51 rich/well connected electricity consumers simply do not pay for power. This is a corruption issue.
48 Ibid. 49 Interview by author with Erkebulat Kabeldin, Astana Akimat, June 13, 2002. 50 Interview by author with Gulnara Mukhametova, 2003. 51 Interview by author in Almaty, June 2002.

Chapter 3 Energy Subsidies and Assistance Payments
25
According to the EIA,52 non-payment of electricity bills, an inadequate collection system, and the lack of market-based transportation tariffs have been obstacles to further large-scale investments in Kazakhstan’s transmission and distribution sector.
According to the World Bank,53 nonpayment of bills in 1997 stood at around 50 percent and was as high as 70 percent54 in 1996 in some regions.
According to the Energy Charter Secretariat,55 there was still a considerable amount of non-payment in 2002, for final consumption, transmission and distribution. Non-payment is causing low market liquidity because of the predominance of barter transactions with electricity and prevailing low discipline of payments among economic operators.
According to the Kazakhstan Electricity Association, only 55 percent of the authorized tariff revenue of $312 million per year is actually collected, with 18 percent ($57 million) being offset or subject to barter arrangements; 8 percent ($25 million) representing non-payment as a result of bad or un-collectable debt; and 18 percent ($57 million) representing excessive technical and commercial losses, including theft and bad meters (see appendix 6.1).
Non-payment for electricity is something that is tolerated when it is industrial, commercial and tertiary consumers and well connected households who are in default, but ordinary households, including low-income households, must pay or face disconnection. The problem of non-payment is less acute in Almaty where, by the end of 1999, the privatized Almaty Power Company had already reduced non-payment to less than 10 per cent.56
(2) Successes in Dealing with Non-payment
Two of the western companies that bought power distribution companies in Kazakhstan demonstrated the potential for overcoming the non-payment problem. According to the World Bank,57 both the U.S. company AES and Belgian company Tractebel made very substantial improvements in improving collections from both residential and non-residential consumers of both power and district heating, demonstrating clearly the value of privatizing the power sector to qualified investors, i.e., experienced international energy companies.
AES achieved its successes by consistently refusing to provide power to electricity consumers that would not pay and by overcoming the ‘Mafia-like owners of heat networks’ through a strict disconnection policy. It also filed cases against defaulting 52 EIA, “Kazakhstan Country Analysis Brief.” 53 Martin Siner and Jon Stern, “Reform of Electricity Markets in Transition Economies - How to Avoid Traps of Deregulation,” The World Bank’s Transition Newsletter (Washington, D.C., January 2001). 54 World Bank, Privatization of the Power and Natural Gas Industries in Hungary and Kazakhstan, World Bank Report WTP451 (Washington, D.C., December 1999). 55 Energy Charter Secretariat, Kazakhstan: Investment Climate, 111. 56 World Bank, Privatization of the Power and Natural Gas Industries. 57 World Bank, Non-payment in the Electricity Sector in EE and the FSU (Washington, D.C.: June 1999).

Energy Subsidies and Assistance Payments Chapter 3
26
Energos for bankruptcy and, in some cases, acquired defaulting heat networks. Not only did the AES-run companies benefit from improved collections, but also there were substantial benefits to the consumers, with a city near Siberia becoming the warmest in all of Kazakhstan. (See also the sections below.)
Similarly, Tracebel implemented a strict disconnection policy, including disconnecting household power for non-payment of district heating. This policy was extremely successful, raising payment levels from only 30 percent overall to 90 percent for power and 85 percent for district heating.
The above examples highlight the loss to Kazakhstan of the withdrawal of experienced companies like AES and Tracebel as a result of inappropriate tariff policies.
C. Other Energy Sector Subsidies
1. Toleration of Non-payment a Form of Subsidy
a. Non-payment for District Heating
Non-collection levels for district heating vary widely from oblast to oblast, but in general about 70 percent of money is collected. The situation is best in Astana, which enjoys around 95 percent collection rate, with the other 5 percent of customers falling into arrears during the winter but generally catching up the following summer.
According to Honeywell, a U.S. energy technology company with a strong presence in Kazakhstan, up to 50 percent of households do not pay for heat in some oblasts.
According to KIPE, a small district heating company in Almaty, 14 percent of its customers do not pay. For their competitor APC, which has 80 percent of the heat market in Almaty and also provides power, the collection rate is much higher; only around 8 percent of its customers do not pay. There reason for the discrepancy is that APC pools electricity and heat bills, so defaulting customers may have the electricity disconnected as a sanction for non-payment of heat (see below).
In Almaty, the Akimat rules are that if 40 percent of households in a building do not pay for heat, the utility has the right to disconnect the entire building. The rules vary from Akimat to Akimat. Typically, if a building is disconnected for 10 days the Akimat will exert pressure on the district heat company to reconnect.
b. Disconnection of Power for Non-payment of District Heating
The practice of disconnecting the electricity supply to households as a sanction for non-payment of district heating, as APC implemented under Tractebel ownership, represents an innovative approach that the research team did not observe in any of the other countries studied. It is not an approach that can be replicated widely, as it can only work in the unusual circumstance of electricity and heat being supplied to the final customer by the same utility.
Chapter 3 Energy Subsidies and Assistance Payments
27
2. An Innovative Approach to Enforcing District-Heating Payment Discipline
Capitalizing on the possibility to enforce payment discipline by district heating consumers by using the threat of disconnecting the power supply, the U.S. company AES identified housing blocks that had large numbers of nonpaying district heating consumers; gave households that were paying for district heat free electric resistance heaters; agreed to pay the incremental costs of electric heating over district heating; and then disconnected the nonpaying building from the heat network.58 Customers who had not paid for district heating were offered shelter at a local community hall that was heated ‘free’ by the utility, as a humanitarian gesture. This measure was effective in persuading defaulting customers to pay up rapidly.
3. Non-payment Consequences
As the non-payment level for district heating in Oskemen and Kokshetau is high, the heat companies do not run at all during the summer, so households have no hot water.
According to the UNDP, some of the district heating companies have collapsed completely, and people are burning coal in their apartments. A building with its own natural gas-fired boiler did not pay for natural gas and was disconnected during the winter. As a result, the water pipes inside the building froze and burst, so the system could not be re-started when the gas bill had been paid.
D. The Impact of Subsidies and Assistance Payments
Impact of Subsidies on Reducing Poverty Levels
According to the State Program for Poverty Reduction for 2003 - 2005, paid services such as housing and utilities represent 46.7 percent of the household budget, which is cushioned ‘a little’ by housing allowances for low-income households. Total customer debt to the utilities, including 2002 household debt, was 16 billion KZT (more than $100 million), representing 61 percent of receivables. This is described as the main reason for power cuts in some regions.
Low tariffs and the resulting lack of investment funds are preventing the electricity network from being extended to rural areas. Although some impact was made via the HAB on making household utility bills more affordable, it has now been withdrawn. Experience from other countries reviewed for this study suggests that withdrawing HAB may be a step backwards for Kazakhstan. Nominal utility benefits that are ‘bundled in’ with general social assistance (as is the case with SAP), tend to be inadequate and can promote non-payment of utilities by households.
58 World Bank, Non-payment in the electricity sector.

Energy Subsidies and Assistance Payments Chapter 3
28
29
Chapter 4 Energy Efficiency
A. Potential for Energy Efficiency Improvement in Kazakhstan
According to the International Energy Association (IEA),59 the potential for energy conservation in Kazakhstan has been estimated to be 50-60 mtoe, representing more than 60 percent of total primary energy consumption. This is calculated on the basis of the difference between the OECD average primary energy intensity (0.39 toe/$1,000) and that of Kazakhstan (1.25 toe/$1,000).
B. Approach of Low-Income Households to Energy Efficiency
The team did not find a single weatherization project of any kind in Kazakhstan. Energy is so cheap that it is generally more cost-effective for households to consume more than to invest in energy conservation.
More than 90 percent of Kazakhs own their own homes,60 which is significant for two reasons. Firstly, there is the potential to stimulate households to invest in the thermal performance of the building, which implies that if other barriers to energy efficiency were removed (low prices; lack of metering), households would be motivated to conduct energy-efficiency measures. Secondly, the potential for the government, municipalities or international donors to conduct mass weatherization of state-owned housing is low, as most apartments are privately owned.
Around seven million Kazakhs, representing 70 percent of the urban population, live in district-heated households, which are all supplied using combined heat and power systems. These are not modern high-efficiency CHP units, but open-loop systems that are primarily designed to produce heat with power as a by-product.
According to Honeywell,61 some regulations applicable to district heating systems are inappropriate and should be revised. For example, the district heating companies are required to generate the same heat output whether the outside temperature is +20c or -10c and must start and stop the system according to the official heating season dates rather than taking the weather into account. Honeywell considered that proven techniques to improve energy efficiency, such as performance contracting, are not workable in the current regulatory environment of Kazakhstan.
Fluctuations in energy prices, which the energy regulator resets every three months, provide an additional disincentive to investment in energy efficiency. For example, Honeywell received an order for 20,000 thermostatic radiator valves for a project in Ustkamenogorsk, but the local branch of the Anti-monopoly Agency disallowed an
59 IEA/Danish Energy Agency/Energy Charter Secretariat/OECD, Energy Efficiency Initiative: Volume 2, Country Profiles and Case Studies (1997). 60 National Statistics Agency, 1996. 61 Interview by author, June 10, 2002.

Energy Efficiency Chapter 4
30
expected tariff rise that was to have funded a credit for the valves, so the order was cancelled.
C. Energy Efficiency of Household Appliances
The team made an effort to look for energy-efficient products in shops and in-situ when in Almaty and Astana. Compact fluorescent lamps (CFLs) did not appear to be in common use. There was one shop in Almaty where among the many refrigerators on display were two with EU energy-efficiency labels, but the sales staff did not know what the labels were for and said that they were already attached when the units arrived.
D. Weatherization
According to Bechtel,62 “locally manufactured insulating products for piping and building applications are of poor quality and are in short supply.”
E. Metering and Control
1. The Significance of Metering and Control
It is frequently taken for granted in the U.S. and elsewhere that higher energy consumption leads to higher bills and lower energy consumption to lower bills. This is not always the case in Kazakhstan, as one of the communist era’s legacies is that energy systems were designed without metering. Incentives to encourage households to invest time and effort in improving the home energy efficiency are undermined, as there is no way of accrediting the financial rewards of energy savings to the households that make such savings.
Retrofitting metering to systems that were designed to be un-metered, when conducted on a national scale for all communally heated buildings, represents a major challenge for post-communist countries. However, it is a challenge that must be met as a precondition to any serious attempt to improve household energy efficiency.
2. Electricity Metering
The SPFPR in 2003 - 2005 mentions implementing electric power metering as one of the strategic measures to improve the provision of housing and utilities as a component of the government strategy to reduce poverty levels. However, statistics on the extent of metering (or the number of households with/without electricity connections) are not provided.
3. Heat Metering and Control
Article 7 of the Law On Natural Monopolies provided for mandatory installation of basement heat meters throughout Kazakhstan by April 1999. It was not enforced. When
62 USAID-Bechtel, “Feasibility assessment: supporting increased energy efficiency in Kazakhstan” (Washington, D.C., September 1999).

Chapter 4 Energy Efficiency
31
the research team asked the Ministry of Energy why the law was not enforced, the response was that it “is an old law.”
The Anti-Monopoly Agency issued a regulatory order for the mandatory installation of basement heat meters on April 1, 1999, specifying that the meters should be financed using internal or borrowed financial resources of the natural monopolies and that the return on invested capital will be through depreciation of installed meters, with the depreciation rate being set in consultation with the local regulatory committees.
There are some heat meters in place, but estimates of their incidence vary widely. The Ministry of Energy estimated that 70 percent of all district heated buildings are metered and that all new buildings are metered, but it is not clear that the former estimate is accurate nor the latter requirement respected. According to the district heating company KIPE, only around 5 percent of district heated buildings in Almaty and around 15 percent in Astana have basement heat meters installed. According to the Anti-monopoly Agency, there are some 1.8 million district heated apartments in Kazakhstan, of which some 0.2 million are in buildings that are metered. (See appendix 2.5 for more information.)
Several commentators questioned whether district heating companies respect the readings of heat meters. Households do not normally have access to their apartment building basement and hence cannot independently verify the meter readings. This issue may be connected with the larger issue of corruption in some of the KSKs (residents associations), as detailed in chapter 5.
A high charge levied on apartment buildings by some district heating companies for “servicing heat meters” was also an issue, as exactly what this charge relates to was not known. This is part of a wider issue of poor customer information and opaque tariffs, as detailed in chapter 6.
4. A USAID-Funded Project Demonstrated the Impact of Metering Apartment Buildings
The Pensioners’ NGO Pokoleniye demonstrated63 that norms that are used to calculate the heat consumption of district-heated buildings could result in households being billed for up to twice the amount of heat that they receive.
A $5,000 USAID grant through the Counterpart Consortium under a War on Poverty project funded installation of basement heat meters in two apartment buildings.
Calculation of heating bills involved theoretical norms: the size of the apartment for heating water and the number of occupants for washing water. The norms, were based on formulae from the Heating Network Act 1986, and were approved by the regulator of Almaty. The project concluded application of the norms overestimated hot water consumption by 1.5 to 2 times.
63 The lobby group Pokoleniye provided information for this section in handwritten form. It is understood that independent energy specialists may not have verified the results of this poverty alleviation action.
Energy Efficiency Chapter 4
32
5. Heat Metering of Public Buildings is Cost-Effective for the Consumer
According to the dean of the Almaty Energy Institute, there have been a number of successful experiences in Almaty with heat meter installation in public buildings. For example, the installation of the basement heat meter in the Energy Institute resulted in saving up to 33 percent on their heating bills, which recovered the cost of installing the meter in only two-and-a-half months of the heating season.
6. Heat Metering and Control for Apartments
A September 1999 energy efficiency feasibility assessment by Bechtel64 for USAID noted that “a major constraint for most customers is the lack of adequate and accurate information regarding their own energy consumption. Residential consumers... lack individual metering of heating and hot water supply.”
The research team looked at market penetration of heat cost allocators (HCAs) and thermostatic radiator valves (TRVs). When fitted together in a building that has a basement heat meter, a HCA/TRV bundle empowers households to save energy and money by buying less heat. This encourages households to turn off radiators when a room is unoccupied and to reduce temperature levels by regulating the valve rather than by opening the window to let excess heat escape.
There is no market penetration of HCAs in Kazakhstan; there are no companies in Kazakhstan that supply these technologies. This contrasts very sharply with the research team’s experience in Bulgaria, for example, where HCAs are mandatory for all district-heated households.
Astana Akimat expressed keen interested in finding out more about the above technologies to avert a pressing need for a new heat generation plant. It was suggested that if the capital adopts a technology, the rest of the country is likely to follow.
Georgy Papafanasopoulo, chief specialist of the Institute KazNIPIEnergiprom CJSC, noted that Soviet ‘single pipe’ heating systems will not work with the HCA/TRVs unless the internal network of pipes inside the blocks is modified. This is correct. The simplest form of modification consists of a bypass pipe fitted alongside each radiator, which in other countries is normally done at the same time as the HCA/TRVs bundle is fitted. Another alternative is to replace the single pipe system with a dual-pipe network, but this is usually prohibitively expensive.
7. A Pilot Project Demonstrated that TRVs without HCAs are Not Effective
A USAID-funded pilot project that PA Consulting Group (PA) conducted rebuilt the internal network of a district-heated building in Atirau oblast and equipped each apartment with TRVs. This provided each household with autonomous control of the heat output from each radiator. HCAs were not installed.
64 USAID/Bechtel, “Feasibility assessment.”

Chapter 4 Energy Efficiency
33
During the first winter (2001/2002), heat demand did not fall. It was initially suggested that the households, mainly pensioners, were afraid to touch the new and unfamiliar radiator valves, so that they were continuing to regulate temperature as they had always done by opening the windows, even though they had been told on several occasions how the new technologies worked. However, this project may prove to demonstrate that even well informed consumers will not use TRVs, even if fitted for free, if the household does not internalize the economic benefits of using them. PA is continuing to monitor the building during the 2002/2003 heating season.
TRVs without HCAs cannot be expected to make a substantial impact, as primarily individual economic and comfort interests, not communal interests, drive the households’ behavior. A direct analogy can be drawn with water metering, where individual controls in the form of faucets (taps) are always available, but nevertheless households do not bother to conserve water unless billed according to metered household consumption. Only then do individuals reduce consumption, plug leaks, fix dripping taps, repair constantly running WCs, install low-flow showerheads, etc. Hence for the heat sector, it should not be expected that individual control (TRVs) without individual metering (HCAs) would provide an incentive to save energy.
8. Hot and Cold Water Metering and Control
a. Building-Level Metering Does Not Reduce Consumption
Monitoring of hot water (washing water) use in an Almaty building by the NGO Pokoleniye65 (Building 76 B) determined that consumption was far higher than registered norms of 120 liters per person per day, two times higher on weekdays and three times higher on weekends. Checks were made to verify that the high consumption levels were not the result of leakage, illegal connections or defective metering equipment. The conclusion was reached that households overuse the hot water. It was further found that alerting the residents to the fact that they were over-using hot water had no impact.
This project demonstrates an important point. Installing meters at the building level does not provide an incentive for apartments within the building to save, whether it be natural gas, cold water, hot water or heating. The costs/benefits of additional consumption/savings are amalgamated between households. An aggressive saver in a metered, 50-apartment building who reduces household consumption by 50 percent only reduces the bill by one percent, so why bother? Only when combined with the installation of individual household-level metering and control does building-level metering make a noticeable impact on consumer behavior, as in this case, a 50 percent reduction in consumption can result in a 50 percent saving on the bill.
65 Under the USAID-funded War on Poverty project, through the Counterpart Consortium. Interview by author with Pokoleniye, June 2002.

Energy Efficiency Chapter 4
34
b. Household-Level Metering Reduces Consumption
In 1997/98, Pokoleniye installed volumetric water meters in 100 apartments66 and demonstrated that consumption dropped to between one-third and one-half of the estimated consumption on which bills were previously based.
Utilities estimated bills on the basis of monthly average consumption per person of 10m3 of cold water per month (10,000 liters or 2,642 gallons) and 2.6m3 hot water (2,600 liters or 687 gallons). The meters recorded that households actually used 2m3 of cold water per month (2,000 liters or 528 gallons) and 0.5-1.0m3 hot water (500 - 1,000 liters or 132 - 264 gallons).
To put the hot water use data into perspective, the utility estimated enough hot water to fill a typical bath to its maximum capacity 16 times per person per month. The meters recorded that they actually used enough hot water to fill the bath to its maximum capacity between 3 and 6 times per person per month.
c. Almaty Akimat Installs Hot and Cold Water Meters ‘Free’ for Disadvantaged Groups
Almaty Akimat has conducted two programs to install hot and cold water meters in the homes of pensioners and handicapped people.
In 2001, 1,586 meters were installed at a cost of 6 million KZT ($42,250). The average cost per meter, including installation, was $26.64.
The program was not financed in 2001, but resumed in 2002 when a further 11,419 water meters were installed at a total cost of 44 million KZT. ($285,714). The average cost per meter fell to $24.02.
According to Almaty Akimat’s Department of Labor and Social Protection, installation of hot and cold water meters is the main reason that the number of total number of Housing Assistance beneficiaries fell from 7,071 to 4,864 between the winters of 2000/2001 and 2001/2002. (See chapter 4 for more details).
d. Extent of Water Metering
According to KIPE, a small, Almaty-based district heating and hot water company, around 25 percent of all district-heated households in Almaty have volumetric hot water meters installed (for washing).67
According to Astana Akimat, water meters are very popular. When the city first became the capital in 1998, there were only 5,000 water meters installed in the city, but this figure rose to 33,000 by 2002. It is well known that meters typically reduce water bills by 50 percent, and so households install them, financing them with their own money. The research team was informed that “there is resistance from the water monopolies,” which 66 Funded through a grant ref: KAW 99-12 “Social protection to widows, elderly women, mothers with many children and single mothers.” 67 Interview by author with KIPE, June 2002.

Chapter 4 Energy Efficiency
35
confirmed the findings from other countries that utilities prefer to continue to calculate water use because this allows them to attribute more of their network losses to the customer.
A World Bank pilot project in the water sector demonstrated that households are willing to pay for better services. Improving water supplies and installing metering raised collection levels, which were low, to more than 100 percent (i.e., old debts were collected too).
9. Gas Metering and Control
In 1999, Pokoleniye installed natural gas meters in 75 apartments, in various parts of Almaty, funded by a $5,000 Soros Foundation grant. The meters demonstrated that all 75 households were being over-charged for gas, typically using one third of the consumption levels estimated using norms.
Household installation of gas meters does not necessarily mean that the meter reading will be respected. According to the Department of Labor and Social Protection,68 some buildings have a building meter, which is read by the utility, and individual meters in some of the apartments. The KSK appoints a collector who apportions cost according to a formula, effectively ignoring the household meter. As households with meters usually record lower consumption than the average when divided equally between all households, some KSKs are choosing to interpret this as an indication that the utility’s meter is giving a higher reader than it should. It is more likely, however, that the households with gas meters are responding to the price signal by reducing their consumption, while households without gas meters are not.
Of Kazakhstan’s 1,660,737 gas customers, 1,289,093 live in urban apartments that are metered at the building level rather than the apartment level.
F. Energy-Efficiency Policies, Programs, Projects, Laws and Organizations
1. Energy-Efficiency Policies
According to BISNIS,69 energy efficiency represented one of the Government of Kazakhstan’s short-term program goals for the energy sector in 2000.
According to the ADB’s Country Assistance Plan,70 the government’s energy sector strategy stresses the importance of improving energy efficiency and the environment.
Despite the above, there did not appear be concrete governmental programs or budgets in place to improve demand-side energy efficiency in Kazakhstan.
68 Interview by author, June 2002. 69 BISNIS, “Kazakhstan: Profile of Electrical Power Sector” (Washington, D.C., July 2000). BISNIS is the U.S. government’s primary market information center for U.S. companies exploring business opportunities in the New Independent States. 70 ADB Country Assistance Plan for 2001-2003.

Energy Efficiency Chapter 4
36
2. Energy-Efficiency Programs
a. Governmental Energy-Efficiency Programs
According to the IEA,71 the Plan of Action for 1998 and up to 2000 contains practical measures for the realization of a State Program of Energy Savings, which was elaborated and adopted by a special Resolution of the Government No. 474 of 19th April 1996 and the Law On Energy Savings of December 1997. However, the research team found no information on the concrete implementation or results of such programs at the household level.
b. Donor Programs
(1) Asian Development Bank
The ADB’s Country Assistance Plan states that the “ADB may be involved in (i) promoting renewable energy development; to provide electricity and heating, particularly to the poor, in off grid areas; and (ii) improving energy efficiency to reduce sector-associated environmental damage.”
The EIA72 reported that in July 2001, the ADB approved a $150,000 technical assistance grant to Kazakhstan to prepare an energy strategy that would focus on increasing investment and expanding power supply to poor and remote areas. The ADB had also agreed to administer a $95,000 grant from the Government of Finland to support the study. The study’s total cost was to have been $363,000, of which the $118,000 from the Government of Kazakhstan. However, according to the local ADB office, the government’s contribution was not forthcoming and there was a general lack of enthusiasm for the project within the Ministry of Energy, so the project was cancelled.
(2) UNECE - Energy Efficiency 21
The Energy Efficiency 21 Project (EE 21) is assisting the United Nations’ Economic Commission of Europe member states to implement greenhouse gas mitigation strategies and to develop related energy-efficiency investment projects. EE 21 is a three-year project that started in June 2000 at the conclusion of the third phase of the Energy Efficiency 2000 Project. The project supports the efforts of the CEE and CIS countries to enhance their energy efficiency and security to ease the energy supply constraints of economic transition.
The project appears to identify potentially bankable energy-efficiency projects and documents projected savings. For example, the project “energy saving and increasing the efficiency of heat supply in Atyrau” forecasts impressive financial savings, 6.6 million yielding an annual saving of $2.6 million. This is further broken down as follows:
• Heat insulation repairs: $2.4 million; savings $1.4 million/year
71 IEA, Energy Efficiency Initiative. 72 EIA, “Country Analysis Brief .”

Chapter 4 Energy Efficiency
37
• Heat meters for 4- or 5-story tenements: $1,6 million; annual saving $1.0 million
• Controls at 42 plants: $2.65 million; annual saving 0.25 million.
There are several such examples on the EE-21 website, but it is assumed that none of these projects have found commercial financing.
(3) USAID
USAID energy and poverty-related assistance to Kazakhstan is conducted in the context of a wider mission to stimulate economic and democratic reform, the budget for which was $150 million between 1992 and 1998 alone.
The USAID Regional Mission for Central Asia has provided some $300 million in assistance to Kazakhstan since 1992, working in the areas of small and medium enterprise (SME) development, democracy, environment, primary healthcare, fiscal policy and local government accountability.
Energy-related programs have included the: National Program for Energy Savings (1994-95); Energy Efficiency and Market Reform Project; Environmental Policies and Institutions for Central Asia; Central Asian American Enterprise Fund; and Ecolinks (the first two of these projects are included in the reviewed below). In addition, the Anti-monopoly Agency is involved in USAID-funded activities involving the United States Energy Association (USEA); National Association of Utility Regulatory Commissioners (NARUC); and the Energy Regulators Regional Association (ERRA).
Burns and Roe73 managed the $32 million Energy Efficiency and Market Reform Project, which involved 17 companies that conducted 30 projects in several countries. The National Energy Savings project for Kazakhstan (described below) was a component of this larger project.
3. Energy-Efficiency Projects
c. EC TACIS Energy Centre (1994 - 1996)
This project supported local enterprises in implementing energy saving policies, following a model that had been successful in several CEE countries, leading to sustainable organizations that continued after the EU withdrew. However, the Centre failed to achieve either commercial sustainability or governmental financing, and hence closed when the EU withdrew its support in 1996.
EC TACIS also supported an energy efficiency demonstration project in an Almaty hospital (The ‘Bistro’ Project).
73 Burns and Roe Enterprises Inc., “Energy Efficiency and Market Reform Project - Final Report,” USAID (Washington, D.C., October 1998).

Energy Efficiency Chapter 4
38
d. UNDP: Removing Barriers to Increased Energy Efficiency of Hot Water and Heat Supply and Use
The Agency on Strategic Planning and Reforms and the Ministry of Natural Resources and Environmental Protection conducted this project74 in 1999 under the umbrella of the UNDP Small Grants Programme. Its objectives were to overcome barriers to the implementation and realization of improved energy efficiency of hot water and heat supply and use in Kazakhstan, and to identify and reduce key barriers to energy efficiency and allow dissemination of this experience to other cities in Kazakhstan. Key barriers were expected to be in the (i) lack of information on the available technologies and measures to improve the energy efficiency of heat and hot water supply, and predominant uncertainties about their technical, economic and financial feasibility; (ii) lack of capacity to conduct economic and financial analyses and to implement the most promising energy efficiency measures; (iii) misplaced or missing incentives for apartment owners, building co-operatives, and district heating companies to improve the energy efficiency; and (iv) lack of information and experience with the public and private sector financing of the projects. This was a relatively small project with a budget of $25,000.
A larger follow-up project, scheduled to end in 2003, has a much wider scope.75 Targets achieved in 2002 included an analysis of the current heating sector situation; an estimation of energy-efficiency measures conducted and the most suitable ones for Kazakhstan selected; a final report on heat and hot water supply status and energy-efficiency measures for improving of the status prepared; bankable project proposals prepared and agreed with UNDP/ Global Environmental Facility (GEF). End-of-project targets include the submission of a project brief to the GEF for approval; development of a project document for a full-scale project; resource mobilization; and implementation of energy-efficiency demonstration projects in Almaty and Kokshetau.
e. UNDP Rehabilitation of District Heating Systems in Almaty and Kokshetau
The consulting firm Ramboll conducted this project, which was completed in December 2001 and focuses with three district-heating companies in two cities.76
Suggested measures to improve the creditworthiness of district heating companies in Kazakhstan included the establishment of social subsidy schemes to help low-income families to pay the (full cost) heating bills, collected by the KSKs. Related recommendations include the establishment of independent district heating companies with their own accounting systems and budget; establishing a cost-recovery-based cash-flow process; making sure that consumers, budgetary institutions and the housing sector pays their bills; providing the KSKs with legal responsibility for the building envelope and internal heating installations, including payment of the district heating bills; creating a mechanism to stimulate the private apartment market so households 74 Project information is available at: www.econet.unesco.kz/e_undp_ob.htm. 75 UNDP, available at: www.undp.kz. 76 UNDP – Ramboll, “Rehabilitation of District Heating Systems in Almaty and Kokshetau, Kazakhstan. Final Report” (New York, December 2001).

Chapter 4 Energy Efficiency
39
can choose to move to cheaper-to-heat, smaller apartments; establishing efficient legal procedure for collection of debt, including seizure of certain types of (luxury) private property; and developing a national energy strategy and a national heat supply law.
It is noteworthy that although the report goes into considerable technical detail about the three systems under study, the generic conclusions are about the need for policy-related, legal, social, ownership and institutional reform.
Ramboll’s specific recommendations include:
• Establishing a social security system, to identify the real needs of low-income families and pensioners and compensate them through a state/municipal subsidy.
• Installing hot water meters, radiator valves and indicators, which allow the apartment users to reduce the variable costs of heating (fixed floor area fee has to be paid, but the user can decide to reduce the number of heated rooms and thus save).
• Developing an efficient court system for collection of debts from those who can afford to pay.
f. USAID Projects
(1) Heating System Retrofit of Facilities (Atyrau)
This demonstration project that the consulting firm PA conducted involved determining the optimal depth for underground placement of district heating pipes, upgrading selected equipment and instrumentation for the Atyrau District Heating System, and designing an automated temperature control system for a school.
The consultant noted that “It is impossible to provide customer satisfaction, stable comfortable living space temperatures or to optimize (minimize) energy use when one substation controls an average of 40 buildings, adjustments are made only three times daily, and building residents have no way to control or monitor exactly how much they are actually consuming.”
The original scope of work included a 70-unit apartment building retrofit at the level of individual radiators, but this work was replaced by a much cheaper, quicker and easier to install and maintain77 action to control temperature and save energy at the building level, for one public building and one private building. The Anti-Monopoly Agency supported the proposal to change the scope of work on the grounds that it could encourage other building owners and tenants to purchase and install similar equipment.
USAID Kazakhstan provided a February 28, 2002 summary report on the status of heating system demonstrations.
77 USAID - PA Consortium Group - PA Government Services, “Summary report of the status of heating systems demonstrations” (Washington, D.C., February 28, 2002) 3.
Energy Efficiency Chapter 4
40
(2) Feasibility Assessment: Supporting Increased Energy Efficiency
Bechtel National Inc. conducted out this assessment and produced the September 1999 “Feasibility Assessment: Supporting Increased Energy Efficiency in Kazakhstan” report. The study objective was to assess the feasibility of an energy-efficiency and conservation activity that would complement ongoing energy-efficiency and environmental initiatives. The main identified energy-efficiency constraints were market conditions, limited managerial capacity, limited deployment of energy conservation technologies, and low levels of awareness of opportunities for energy efficiency.
(3) Support for Developing a National Program for Energy Savings
Burns and Roe Enterprises Inc. conducted this project in 1994-95. The identified barriers to energy efficiency were low subsidized energy prices; weak institutional structure and legislative framework; weak energy conservation ‘ethic’, owing to low prices and the historical perception of energy as a free good; inefficient practices, equipment and technology; and inadequate access to capital.
Seven recommendations were made:
1. Accelerate economic reform.
2. Increase end-user energy pricing.
3. Put in place incentives to install equipment that measures energy consumption.
4. Establish the Energy Conservation Department within the Ministry of Economy as the coordinator of the government’s energy savings policies and establish an independent Energy Conservation Agency to implement the programs associated with these policies; involve a diversity of organizations, especially in the private sector, in the pursuit of energy efficiency.
5. Assess various financing options and focus in the short term on demonstration zones, an energy savings fund, and multilateral bank-funded projects.
6. Focus initially on energy savings in the industrial sector and on those energy savings investments whose costs are recoverable in less than one year once the investments are operational. Ensure that industrial facilities scheduled for energy conservation investments can survive in their market sector and are economically viable in the long term.
7. Focus initially on policies and programs achievable in a timely and effective manner during the next three years as the country progresses to a market-based economy, and then consider policies and programs that will yield energy savings in the longer term.
The 280-page Burns and Roe study represents a thorough road map towards energy efficiency, setting out energy pricing principles and guidelines, identifying financing options, recommending institutional reforms, and providing specific recommendations

Chapter 4 Energy Efficiency
41
for the power, district heating, fertilizer and nonferrous metals sectors. Relevant examples from other countries illustrate how Kazakhstan could move towards an energy-efficient future and identifies specific energy-efficiency opportunities for Kazakhstan.
In the seven years since the study was finalized, there has been substantial progress towards the general macroeconomic recommendations such as an acceleration of economic reform and privatization of the industrial sector. However, adoption of the energy-efficiency-related recommendations has been slight, and in particular, energy prices remain too low to stimulate widespread interest in energy saving.
4. Energy Efficiency Laws: The Law on Energy Saving, 1997
This law,78 which came into force in December 1997, authorizes public information and awareness on energy saving with the aim of creating economic and organizational conditions for effective use of energy resources and environmental protection. The law establishes the system of energy saving and the terms of reference of the: government in the sphere of energy saving, of the body empowered by the government in the sphere of energy saving, and of the local representative and executive organs in the sphere of energy saving. Issues of registration, establishment of consumption standards, standardization and certification n the sphere of energy savings and energy saving are legally defined. Ways of conducting education, information support and scientific research in the sphere of energy saving are authorized. The Ministry of Energy is the competent authority for implementation of the law.
Nexant summarized the law in a single word as ‘declarative’.79
5. Energy-Efficiency Organizations
g. The Agency for Regulation of Natural Monopolies et al.
The Agency for the Regulation of Natural Monopolies, Protection of Competition and Support for Small Businesses (the Anti-Monopoly Agency or Agency) regulates activities of all natural monopolies, setting or capping prices and tariffs. Transmission and distribution of electricity and heat as well as transportation of oil and gas through pipelines fall under the agency’s jurisdiction.
The Anti-Monopoly Agency has a low level of independence from political intervention in its day-to-day affairs and suffers from high staff turnover. The Agency has 19 local offices that set electricity and heat tariffs for the local oblast or city, which results in local politics playing a large role in the tariff setting process.
The time horizon for price revisions is only three months, rather than the three to five years that are typical for countries with stable regulatory regimes, so utilities are unable to accurately predict their future cash flow. The bureaucratic, regular, time-consuming
78 Information provided in this paragraph is a digest of a review of the law in the IEA Energy Efficiency Initiative: Volume 2. 79 USAID - Bechtel, “Feasibility assessment.”
Energy Efficiency Chapter 4
42
and costly negotiations and the high level of regulatory uncertainty prevent the utilities from modernizing and investing in energy saving.
The government considers that a strategic measure to improve housing and services in the context national poverty reduction strategy is “to improve the monitoring system for natural monopoly activities providing for the transparency and substantiation of prices and tariffs established by them for their services.”
In summary, the pricing regime that the Anti-Monopoly Agency created is unpredictable and fails to provide incentives for utilities to predict future cash flow, make rational investments or promote energy efficiency. The government is clearly aware of the problem, but there is no political will to substantially improve the agency’s powers and independence.
h. No National Energy-Efficiency Agency
There is no national energy efficiency agency in Kazakhstan. MEER is the central executive body for implementation energy policy.
The research team formed a clear impression that MEER is energy supply-oriented, as would be expected in an oil-rich country such as Kazakhstan. There appeared to be little interest in, nor budget for, demand-side energy-efficiency issues. As this was only an impression, by digging a little deeper, the research team found that this appears to have been the case for some time. In its 1999 feasibility assessment, Bechtel described the Ministry as “strongly orientated towards improving efficiency in the supply of power and heat, reflecting its roots and comfort in energy supply planning and production.” Bechtel further noted that the ministry officials “... are not well grounded in market dynamics and have made little outreach to major energy consumers.”
i. No Energy Efficiency NGOs
As far as the mission team was able to determine, there are no energy-efficiency-oriented NGOs operating in Kazakhstan, which is surprising for a county of 15 million, and may reflect the fact that the price of energy is so low that the incentive to save energy is correspondingly low.
The EBRD Country Strategy of October 2002 notes that Kazakhstan has a developed NGO network. However, it is clear that Kazakh NGOs are not very well integrated into the consultation process by the government, which may be viewed as a remnant of the centrally planned economy. International organizations tend to sideline NGOs too, with a World Bank client survey80 noting that the Bank is perceived as weak at involving non-governmental entities. This appears to be the case in all sectors. For example, the State Program for Poverty Reduction in the Republic of Kazakhstan in 2003 – 2005 notes that “... there is still no concept of interaction between state bodies and NGOs,” but contains a section on strategic measures required to improve their activities with respect to poverty reduction.
80 World Bank, Country Assistance Evaluation.
Chapter 4 Energy Efficiency
43
During the 1990s, there were times when the government treated NGOs with suspicion or, in some cases, outright hostility, as the line between legitimate lobbying activities and anti-governmental activities was not readily apparent. For example, the executive director for the pensioners’ NGO, Pokoleniye (reviewed below), was jailed for a week in May 199781 for staging an unauthorized demonstration protesting utility price rises, was repeatedly denied an exit visa to participate in a U.S. government-funded exchange mission (although permission was eventually granted), and received an administrative warning from a court in April 1999 for participating in an unsanctioned protest about non-payment of pensions.
The situation for NGOs and lobbying groups appeared to be improving in the past few years, but the EBRD Country Strategy notes that “events since the beginning of this year give rise to concerns over backsliding on freedom of the independent media and free functioning of political opposition.”
The international donor community is generally seeking to stimulate NGO development in Kazakhstan. For example, USAID provided training, technical assistance, legislative drafting and legal support to NGOs and has conducted a range of other initiatives to develop civil society.82
In summary, providing that the political environment for NGOs and lobbying groups does not continue to deteriorate, energy-efficiency-related NGOs may develop in the future as they have in other transition economies, and that governmental and NGO dialogue and partnerships may strengthen.
6. Associations
j. Pokoleniye - Association of Pensioners
The Pokoleniye NGO lobbies for better pensions and better conditions for pensioners. Although it is not an energy-efficiency NGO, it has been active in demonstrating the impact of metering and control for water, heat and natural gas, conducting demonstration projects, and concluding in every case that utilities charge households for more water, heat and natural gas than they actually consume.
Pokoleniye also illustrates how some Kazakh NGOs could benefit from international assistance in modernizing activities. Its metering projects are arguably the best household energy demonstration projects to have been done in Kazakhstan, as the NGO both installed the equipment and did detailed monitoring. However, documentation consisted of unbound, multi-author, handwritten pages of data and analysis, which are of little use for effective dissemination of otherwise impressive results.
81 “International Helsinki Federation for Human Rights Annual Report 1998”; Christian Science Monitor (January 29, 1999), available at: www.csmonitor.com; and Human Rights Watch, available at: www.htw.org. 82 General Accounting Office (GAO), US Economic and Democratic Assistance to Central Asian Republics as cited in World Bank Report no. 21862.

Energy Efficiency Chapter 4
44
k. KSKs (Co-operatives of Apartment Owners/Condominium Associations)
The KSKs are responsible for paying utility services and repairs on the behalf of the residents who they represent. In some other countries, this type of organization can be instrumental in weatherizing buildings and finding least-cost communal heating solutions and other energy efficiency-related areas. When well organized and effective, this kind of organization can also serve as a conduit between low-income households and social services.
According to several sources, there is a practical problem with some KSKs. When they were first set up, households were persuaded to sign a document to vote for the new administration and now they can’t get rid of the KSK, even if they are dissatisfied with the way it is operating.
There is anecdotal evidence of corruption in some KSKs, which collect more money than they pay the utilities and deny households access to the accounts and use their legal rights, established by the signature several years ago, to defend this position, treating the KSK as their personal fiefdom. This issue affects both low-income and other households, but there is uncertainty about its extent and impact. KSKs that do not operate transparently may or may not be acting corruptly. It should be added that corruption is a serious issue in Kazakhstan, which scored only 2.3 on a scale from 1 (highly corrupt) to 10 (highly clean) in the Corruption Perception Index 2002 of Transparency International.83
According to a UNDP report that Ramboll84 wrote in December 2001, “It will be a long time before these organizations (KSKs) are fully operational on a democratic basis.”
l. Kazakhstan Electricity Association
The Electricity Association is a professional organization that represents the supply-side interests of the power and heat sectors: generators, the transmission company, and distributors. A handful of equipment suppliers are associate members (non-voting). According to its introductory brochure, the association’s mission “shall be to coordinate the activities and create conditions for fair functioning, represent and protect common interests of the electric power industry of the Republic of Kazakhstan.”
m. No District Heating NGO
A Ramboll report for UNDP85 notes that no professional association for the district heating sector has emerged in Kazakhstan. This type of NGO exists in all the Northern European countries and many of the CEE countries, and can raise awareness of energy-efficient technologies and techniques.
83 Information is available at: www.transparency.org. 84 UNDP – Ramboll, “Rehabilitation of District Heating Systems.” 85 Ibid.
Chapter 4 Energy Efficiency
45
n. The Microcredit NGO
Microcredit is a Kazakh NGO established in 1998 to implement the governmental Micro-crediting Program.86 It granted 20,000 micro-credits totaling 630 million KZT during the first two-and-a-half years, of which two-thirds were granted to rural female entrepreneurs.
Microcredit is the implementing partner in Kazakhstan for “UP-micro-loans,”87 a program that the German NGO “Help for Selfhelp” (Hilfe zur Selbsthilfe) manages, that provides small credits for families and single parents in a number of countries. UP, which stands for Unlimiting People, aims to foster financial discipline through requirements of disclosure, advice, and reporting by the implementing NGOs. The five-year UP project is based in Akmola Oblast, has a US$24,000 budget, and began in February 2000. This is the first micro-credit program in Akmola. Typical clients borrow US$400 for agricultural projects, small handicrafts, small retail shops, etc. The UP project represents a potential financing source for household-level energy-efficiency initiatives.
According to the SPFPR 2003 - 2005, the intention had been to extend the micro-crediting Program through Kazakhstan, but “that intention was not implemented in full due to the lack of clearly designed mechanisms for loan repayment and stable sources of financing.” Other issues highlighted in the report include the absence of a clear regulatory basis for micro-credit organizations, operable mechanisms of loan repayment, lack of the poor’s practice for productive utilization of micro-loans granted. Adoption of a Law On Micro-Crediting Organizations is a component of the government strategy to reduce poverty levels.
G. Impact of Energy Efficiency
1. Impact of Energy Efficiency on Reducing Poverty Levels
Almaty’s practice of installing ‘free’ hot and cold water meters for low-income households is the only example a low-income household energy-efficiency measure that the research team observed in Kazakhstan. Although the municipality attributed a fall in the number of HAB applicants to the metering initiative, no study was conducted to determine the extent to which other factors may have been involved.
2. Impact of Energy Efficiency on Removing Barriers to Utility Privatization
Low energy prices represent a serious barrier to (a successful and effective) utility privatization in Kazakhstan. Low energy efficiency a symptom that persists as a result of low prices, as the economic incentive for households to save energy too weak.
Low energy prices, low thermal efficiency of the housing stock, low penetration of energy-efficiency-related products and services, and low awareness of energy-efficiency issues were not unique to Kazakhstan in 1993. These were common
86 Shakirova National Report for Kazakhstan, 2002. 87 This information is available at: www.up-micro-loans.org.

Energy Efficiency Chapter 4
46
problems that affected all post-communist countries. However, unlike many other countries, Kazakhstan has not used the past decade to send the signal to households that energy is expensive and hence has not created energy-efficiency awareness as an alternative to incremental consumption. Instead, Kazakhstan continues to promote over-consumption through low energy prices for all households and, in the case of low-income households, discourages energy efficiency as an alternative to more energy consumption through the design of the Housing Allowance.
The withdrawal of AES Silk Road, Tractebel, International Power and others from Kazakhstan, demonstrate that serious international investors that could bring experience in running modern power systems, will not tolerate the continuing practice of keeping tariffs artificially low. The investors that have taken over from these companies will likewise be unable to invest in modernizing the power system if they are unable to raise investment funds through tariffs and are unlikely to be particularly interested investing in the network’s long-term future if they are not making money. It is clear that tariffs must rise.
However, higher energy tariffs would exponentially raise the costs of running the few remaining HAB schemes according to the current model, as the ratio of the part of household energy bills above 30 percent of household income would rise much faster than rate of any energy tariff increases, while the number of households qualifying for the benefit would also increase
In summary, successful privatization depends on the ability to raise tariffs, which, in turn, depends on the household’s ability to pay. The least-cost solution for Kazakhstan is to enable households, not only low-income households, to reduce their energy consumption to an amount for which they can afford to pay market prices through energy efficiency.
47
Chapter 5 Energy Prices and Tariffs
A. Introduction
Compared to some other countries in the region, Kazakhstan liberalized prices and tariffs relatively quickly after the dissolution of the Soviet Union. Prices for most goods were liberalized during the early 1990s, prices for food followed in 1995, and prices for monopolistic parts of the economies, including energy, followed from 1997.
Energy prices rose substantially between 1992 and October 1994, when a Government Decision, Price regulation of the products of natural monopolies, restricted price revisions to no more than once per quarter, as utilities were perceived to be making excess profits. At this point, competitive parts of the energy industries were separated and forced to compete, driving prices down and subsidization of utilities was discontinued.
Burns and Roe wrote that “Between 1992 and 1994, many of Kazakhstan’s nominal energy prices increased by a factor of ten or more. Despite these substantial energy price increases, many domestic energy prices remain at only a fraction of world equivalent levels, and severe sectoral distortions continue to exist.”88 However, the energy pricing reform stymied in 1995, and prices have generally remained at around 1995 levels ever since.89
In 1997, the government intervened to prevent perceived profiteering by the natural monopolies. Three main laws now form the basis of energy price regulation: The Law on Natural Monopolies, The Law on the Development of Competition and Restriction of Monopolist Activities, and The Power Industry Law. From this point, the Anti-monopoly Agency set prices. In theory, this meant that subsidies were prohibited, and tariffs that the agency established may be no lower than the costs of the provision of services, including the costs of investing in the system. The tariffs should also allow for profit.
Despite the legislative changes, there are large cross-subsidies in place that keep electricity prices for households at an artificially low level.
According to BISNIS, stability of power tariffs was one of the government’s short-term program goals for the energy sector in 2000. However, substantial progress in this area was not apparent when the research team visited Kazakhstan in the summer 2002.
1. Tariff Reform: Kazakhstan Electricity Association and USAID
The Kazakhstan Electricity Association (KEA) prepared a 365-page Electric Tariff Reform Study, which was subsequently translated into English, reviewed in detail and
88 Burns and Roe Enterprises Inc. “Kazakhstan National Program for Energy Savings - Final Report” USAID (Washington, D.C., July 1995). 89 In general, Kazakh energy prices vary widely from oblast to oblast and, when expressed in real terms, fluctuate up and down erratically. The appendices to chapter 6 illustrate this point.

Energy Prices and Tariffs Chapter 5
48
distributed by USAID through contractors PA90 as part of the Central Asia Natural Resource Management Project (NRMP). An essential component was to ensure that the social implications of tariff reform are effectively acknowledged in the February 2002 final report. NRMP also conducted a preliminary review of regional electric distribution companies after consultation with USAID and KEA.
A central finding of the KEA tariffs study was that the regional electricity companies were incurring significant financial losses over the 1998-99 study period and that although selected companies had subsequently achieved success in turning around their operations, many companies continued to experience severe financial conditions. The study concluded that the tariff’s capital-related components (depreciation and return) are inadequate to meet the urgent requirements for system rehabilitation and the method that the Anti-monopoly Agency used to determine total revenue requirements was believed to be exacerbating this problem.
The study noted that the retail (final) electricity tariffs in Kazakhstan are lower than the distribution component of tariffs in other countries and found excessive technical, commercial and non-payment losses. Based on limited data and extrapolation, the study concluded that Kazakhstan is trying to operate a $312 million electricity industry on only $172 million of cash receipts, which represents only 55 percent of authorized revenues. (See appendix 6.1 for more information.)
The NRMP study recommended that “The country must undertake a national campaign to dramatically reduce excess technical losses, theft of energy service and nonpayment of energy bills as a primary method to reduce costs and increase revenues - and to reduce the pressure for tariff increases that are due to such losses.”
The NRMP suggested the introduction of a two-part tariff structure (a fixed charge plus energy charge), noting the fixed charge should be introduced at a very low level as it may be highly contentious to the population, and that a consumer awareness campaign should be conducted well in advance of the introduction of a new tariff structure. NRMP notes two-part tariff structures are almost universally applied for residential electricity services in the U.S. to help track how the utilities actually incur costs and provide the utility with a more uniform revenue base (and charges) throughout the year.
The NRMP does not recommend the implementation of lifeline tariffs until improvements are made to the metering and billing systems and detailed economic consumer usage studies are completed. The project notes that premature implementation of lifeline tariffs can actually lead to less utility revenue and greater system losses and therefore an increased tariff burden for all consumers in subsequent years.91
90 USAID - PA Consortium Group - PA Government Services, “Kazakhstan Electricity Association Tariff Reform Assistance - Subtask 21 - Translate, Review and Distribute the Kazakhstan Electricity Association Electric Tariff Reform Study” (Washington, D.C., February 28, 2002). 91 The main summary report to this report for Kazakhstan describes a number of considerations that should be taken into account when designing a lifeline tariff.
Chapter 5 Energy Prices and Tariffs
49
NRMP notes that the KEA study includes proposals for a calculation method to determine subsidies to preferred industries, based on the industries’ commercial output, tax contributions to the budget, and development prospects. NRMP questions the value of providing industrial tariff subsidies at all and notes that consumer tariff subsidies should be critically evaluated to ensure that the most vulnerable households are truly receiving the intended benefits.
Regarding the main substance of the KEA study, which proposes a methodology based on setting price ceilings, NRMP suggests that the fundamentals of effective tariff design should have been further articulated, noting that the regulatory bodies must have reasonable autonomy from excessive industry and political pressure.
The KEA study does not separately address the social impact of tariff reform.
The NRMP study identifies four possible financial sources for providing assistance to the most vulnerable consumer households that face rising energy tariffs as a result of the reform process: 1) state and municipal budgets; 2) the energy enterprises; 3) cross-subsidization through tariff mechanisms; and 4) a combination of these sources. State or municipal funding is recommended as the best source. The report highlights that as excess technical and commercial losses and the leakage of tax collections inhibit all these possibilities, a countrywide campaign to reduce such losses and leakage should be considered a priority in Kazakhstan.
2. Taxation of Household Energy
A Value Added Tax (VAT) at the 20 percent rate was introduced on January 1, 1993, and is applied to all household energy prices. Industrial enterprises pay only the difference between VAT calculated on their output and VAT paid on their inputs.92
In addition to VAT, household electricity prices include a small excise tax of 0.03 KZT/kWh that was introduced in 1998.
B. Electricity Prices and Tariffs
1. Composition of Final (Retail) Electricity Tariffs
Retail tariffs contain three components: the generation price; a transmission price payable to KEGOC (if its network is required); and an access tariff that represents a service fee for local power transmission and power distribution through regional networks. Each of the three components is summarized below.93
92 IEA Energy Prices and Taxes. 93 Retail tariffs are described in greater detail in the Energy Charter Secretariat’s Kazakhstan: Investment Climate and Market Structure report cited above. This report provided much of the power sector information and data in this section.
Energy Prices and Tariffs Chapter 5
50
2. Generation Prices
As has been observed in many other countries, the introduction of competition in generation, which occurred in Kazakhstan in 1998, has been extremely successful in lowering generation prices. Prices were previously set through contracts at rates that effectively represented the maximum level that the generators could get away with charging. Following the introduction of competition, generation prices fell by roughly 50 percent with the wholesale electricity market price decreasing to 1.5 KZT/kWh (1.92 US cents) in 1998, further falling to 0.77 - 1.3 KZT/kWH (0.6 - 1.1 US cents) in 1999.94
3. The Transmission Tariff
From October 1997 to March 2000, the transmission tariff comprised a flat fee of 0.00251 KZT/kWh (0.00332 US cents/kWh when introduced, falling to 0.00178 US cents/kWh when withdrawn), plus a distance fee of 0.00051 KZT/kWh/km (0.00067US cents/kWh/km when introduced, falling to 0.00036 US cents when withdrawn). The mean charge was 0.00419 KZT/kWh (0.0055 US cents/kWh when the tariff was introduced, falling to 0.0030 US cents when it was withdrawn), but the range of charges was substantial as Kazakhstan is a very large and sparsely populated country, so sometimes there was a great distance between generator and consumer. As is apparent, the dollar the value of the transmission tariff almost halved during this period as a result of the fall in value of the tenge.
A special working group that the prime minister established in December 1999 designed a new three-part tariff that was implemented as of April 1, 2000. The tariff includes a traffic control fee of 0.031 KZT/kWh (0.022 US cents); a flat fee of 0.22 KZT/kWh (0.15 US cents); and a distance fee of 0.00051 KZT/kWh (0.0004 US cents) that is capped at 0.306 KZT/kWh (0.2152 US cents), representing the fee that is payable for 600 km, so transmission beyond the first 600 km is effectively carried free. The new tariff led to a substantial decrease in power imports, as buying lower-cost power from generators in remote parts of Kazakhstan became possible and generally lowered tariffs
The basic three-part structure of the transmission tariff has remained unchanged, although the charges have changed. On December 13, 2000, the traffic control fee was lowered to 0.029 KZT/kWh (0.0201 US cents). On July 1, 2001 all tariffs were adjusted again, with the traffic control fee remaining at 0.029/KZT/kWh (0.0201 US cents), the flat fee being raised to 0.238 KZT/kWh (0.1621 US cents), and the distance fee being raised to 0.00077 KZT/kWh (0.3147 US cents), with a cap of 0.462 KZT/kWh (0.3147 US cents). (See appendices 6.2 and 6.3 for more information.)
4. The Access Tariff (Local Transmission and Distribution)
Regional energy companies (RECs) supply electricity to small wholesale and retail consumers in the regional market. As natural monopolies, their prices and tariffs are regulated in accordance with the power industry law.
94 Using the National Bank annual exchange rates of $1: KZT 78.3 for 1998 and KZT 119.5 for 1999.

Chapter 5 Energy Prices and Tariffs
51
Joint Order nos. 178 and 127 of 30th September 1997 of the Minister of Economy and the Minister of Energy and Energy Resources established the procedure for calculating the access tariff. The access tariff does not take line voltage into account.
According to the Energy Charter Secretariat (ECS), the tariff is not suited to efficient operation of wholesale and retail electricity markets and makes less attractive the use of network facilities for operations related to electricity transfer in the regions. It is understood that the agency is aware of the deficiencies and needs to develop mechanisms that include seasonal tariffs, time-of-day tariffs, and payments for reactive power.
This over-simplified method of setting the access tariff is one way in which the cross-subsidy from industrial (high voltage) customers to household (low voltage) customers is incorporated into the tariff regime.
5. Different Tariffs in Each REC
The Electricity Association noted95 that as each regional electricity distribution company is treated independently, no one regularly publishes detailed statistics on tariffs operated by each of the RECs (although it is assumed that the head office of the Anti-monopoly Agency must hold such statistics). The Electricity Association itself was unable to provided comparative data on tariffs by REC.
The most recent source of good comparative data is a report96 that the Almaty Institute of Power and Communication published in August 2000, which provides detailed comparative data for three years to July 1999. (See appendix 6.4 for more information).
6. Household Tariffs Differ Widely from REC to REC
The range between the lowest and the highest household tariff in July 1999 was extremely large. The lowest tariff in July 1999 was only 1.8 US cents/kWh, including VAT, for Zheskasgan REC in Karaganda Oblast. This small amount is very clearly a long way below cost recovery for any power company. The extremely low rate reflects two factors: a price reduction from 3.0 KZT/kWh to 2.4 KZT/kWh of July 1998, and a sharp fall in the value of the KZT against USD, with the dollar value of 2.4 KZT falling from 3.1 cents in July 1998 to 1.8 cents by July 1999.
The highest household tariff in July 1999 was 3.8 US cents/ kWh, including VAT, for Kzylorda REC. This would is also a very low household power rate by international standards. This REC had also been affected by the fall in the value of the currency, as its tariff of 4.22 KZT/kWh, which has been unchanged for a year, had fallen from a dollar value of 6.6 US cents/kWh when it was introduced.
95 Interview by author with Danial Duisengaliev of the Electricity Association, June 10, 2002. 96 Ministry of Education and Science of the Republic of Kazakhstan, Almaty Institute of Power and Communication, Tariff Policy Development in Regional Electric Network Companies in Regard to the Priorities in the Economy of the Oblasts of the Republic of Kazakhstan (Almaty, August 18, 2000).

Energy Prices and Tariffs Chapter 5
52
7. Deficiencies in the Kazakh Approach to Household Electricity Pricing
The approach to household electricity tariffs so far has been to keep prices universally low, substantially below cost recovery levels. Five problems with this approach—legal, ethical, financial, environmental and practical—are examined below:
1) Legal: Keeping household prices artificially low represents a cross-subsidy between the household sector and other sectors. Subsidies are (nominally) illegal according to Kazakh law, but the cross-subsidy is not recognized as a subsidy in this respect.
2) Ethical: The tariff is an example of a subsidy with very high (universal) coverage, but extremely poor targeting, so it benefits the rich very much more than the poor. Richer households tend to have more electrical appliances and consume more, so the subsidy benefits the rich many times more than it benefits the poor.
3) Financial: Kazakhstan has a practical need for substantial investment in the power distribution sector, but the artificially low tariff has demonstrably prevented such investment from taking place. A higher tariff would also reduce electricity demand, thus reducing or deferring the need for a portion of new investment in new generation.
4) Environmental: The failure to send the proper price signal to households discourages the development of a market for energy-efficient household electrical appliances, such as CFLs and low-energy white goods, and encourages the use of electric heating as an alternative to weatherization, resulting in higher CO2 and other energy sector-related emissions to the atmosphere.
5) Practical: Kazakhstan requires know-how in how to run a modern distribution utility, but the major international players that initially invested have now withdrawn as a result of the unstable regulatory regime and artificially low tariffs.
In summary, the area of household electricity tariffs is in need of substantial reform.
8. Impact of the Policy of Setting Artificially Low Household Tariffs
The World Bank97 notes that by one estimate, in 1999 the average margin charged by 10 of the power distribution companies was 22 percent below their estimated costs. It also notes that household prices for power were still lower than industrial prices, whereas in other countries household prices are more than 150 percent higher than industrial prices.
9. Final Household Electricity Prices
Data from a number of sources is provided to build a picture of the evolution of household electricity tariffs in Kazakhstan. The picture is far from straightforward. A combination of each REC having its own tariff policies, each regional branch of the Anti- 97 World Bank, Privatization of the Power and Natural Gas Industries.

Chapter 5 Energy Prices and Tariffs
53
monopoly Agency behaving differently, as regards allowing or disallowing requests to adjust tariffs, and variations in the KZT/USD exchange rate have combined to create a tariff history that fluctuates wildly.
An Almaty Institute of Power and Communication98 report provides detailed statistics for 1997 - July 1999, comparing average prices for all industry and household consumers. (See appendix 6.4 for more information).
The World Bank99 confirmed that the retail tariff varies widely among the various distribution companies in Kazakhstan, with the average tariff being estimated at about 4.4 US cents/kWh in June 1998 and with household tariffs being 10 - 15 percent lower than industrial tariffs.
According to the IEA, tax-inclusive household electricity prices per kWh were 1.5 KZT (4.2 US cents) in 1994; 1.97 KZT (3.2 US cents) in 1995; 2.025 KZT (3.0 US cents) in 1996; 2.9 KZT (3.8 US cents) in 1997; 3.66 KZT (4.7 US cents) in 1998; 3.75 KZT (3.1 US cents) in 1999; and 3.82 KZT (2.7 US cents) in the first quarter of 2000. (See appendix 6.5 for more information.)
According to BISNIS,100 July 2000 electricity prices were 4.69 KZT/kWh (3.3 US cents/kWh) for industrial consumers and 4.00 KZT/kWh (2.8 US cents/kWh) for residential consumers.
According to the National Statistics Agency and IMF estimates, annual average electricity prices for all of Kazakhstan (for all customer categories, not households only) declined from a peak of 3.8 US cents/kWh in 1997 to 1.8 US cents/kWh in the first half of 2001. (See appendices 6.6 and 6.7 for more information.)
According to the National Statistics Agency, average household electricity prices for Kazakhstan for the years 1993 - 2000 were as follows:
1993
1994
1995
1996
1997
1998
1999
2000
KZT/kWh 4 150 197 215 349 374 377 362 US cents/kWh
n.a. 4.2 3.2 3.2 4.6 4.8 3.2 2.7
Variation in prices between oblasts was very slight in 1995, with all oblasts charging 3.3 cents/kWh, except for Kzylorda Oblast (the poorest oblast), which had a lower rate of 2.5 US cents/kWh. However, from 1996, prices began to diverge, and by 1997, the range was extremely high, as low as 2.8 cents/kWh in Ust-Kamenogorsk Oblast and as high as 8.0 cents/kWh in Taldikorgan Oblast. By 2000, both tariffs and regional
98 Ministry of Education and Science, Tariff Policy Development. 99 World Bank, Non-payment in the electricity sector. 100 BISNIS, July 2000.

Energy Prices and Tariffs Chapter 5
54
variations had shrunk, with the lowest-priced oblast charging 1.9 cents/kWh and the highest charging 3.3 cents/kWh. (See appendix 6.8 for more details.)
Despite the wide variations, the general picture is that household electricity prices are unrealistically low - and clearly too low to support the long range marginal cost of supply. In this context, the current pricing regime can be described as unsustainable.
The EBRD101 summarized the tariffs situation succinctly, noting that the lack of a proper retail tariff methodology and the ability of the local regulators to manipulate the existing cost-based methodology has led to very low retail tariffs.
10. Typical Monthly Household Electricity Bill for 2002
As prices vary so widely from oblast to oblast, it is difficult to define ‘typical’ in the context of the whole of Kazakhstan. However, as an indication, a typical household electricity bill in the spring of 2002 in Almaty was 80 - 100 kWh/month at around 4 KZT/kWh (2.6 US cents/kWh), so 320 - 400 KZT ($2.09 - $2.61/household/month).
11. How Household Tariffs are Set is Influenced by Local Politics
The major weakness is that tariffs are not only too low, but there is no certainty about the future. RECs can, and normally do, apply the local office of the Anti-monopoly agency every three months, requesting a raise in tariffs. The raise is often refused, and there is always a risk that the Agency will choose to lower the tariffs.
According to the Electricity Association102, the response of the regional offices of the Agency is determined by local politics - with the regional Governor effectively telling the Agency what to do. The Electricity Association also noted that its members were all unhappy with the current tariff-setting methodologies.
12. The EBRD’s Proposed Revised Tariff Order for Power and Heat Pricing
The EBRD commissioned a report by Frontier Economics103 (FE) that proposes a new long-term electricity and heat tariff methodology for Kazakhstan. The report describes the current pricing regime for electricity and heat which is effectively a ‘cost plus’ system, featuring quarterly price reviews by the Anti-monopoly Agency; reliance on actual expenditures; definition of profit as a margin on costs; disallowance of certain categories of expenditure; and use of a set of norms to determine some of the costs. The impact of this regime has been short-term pricing that provides neither certainty to investors or consumers about the future price path nor incentives for entities to cut costs and benefit both themselves and customers.
The EBRD asked FE to draft a tariff order that would move towards longer-term price paths, providing investors with certainty about future price levels and incentives to
101 EBRD, Strategy for Kazakhstan. 102 Interview by author with Danial Duisengaliev of the Electricity Association, June 10, 2002. 103 EBRD - Frontier Economics, Kazakhstan - Tariff Order for the Regulation of the Electricity and Heat Sectors (London, July 2001).

Chapter 5 Energy Prices and Tariffs
55
reduce costs. The result is a highly detailed recommendation for a tariff order that sets allowed revenues for regulated entities for a number of years (three years for the first price review period, and every five years thereafter), limiting regulatory discretion between price reviews in order to enhance regulatory certainty. FE also conducted stakeholder analyses and provided training in how the new methodology would work.
The results of the FE project were presented to the Government early in 2001, but were not implemented. The Government instead asked the EBRD for a follow-up study to measure the social impact of the proposed tariff methodology. The EBRD agreed in principle but on the condition that the Government first starts to implement the new tariff methodology.
According to the EBRD’s Strategy for Kazakhstan, which was approved in October 2002, the new tariff methodology has now been accepted by the Government and is expected to be implemented by the Anti-Monopoly Agency in early 2003. EBRD considers that implementation of a long-term and transparent methodology is vital for attracting private investment to the sector, and notes that to some extent the lack of tariff reform has already slowed down progress in the power sector.
13. An Annex to the EBRD Tariff Order Considers the Social Impact of Tariff Reform
The FE Report of July 2002 already included an annex on ‘Social Impact of Reform’, which is summarized herewith.
They areas of concern are defined as affordability, cash-flow issues and transition issued.
Affordability concerns center around the fact that recent EBRD analysis in Karaganda (Kazakhstan’s second largest city) indicates that households spend some 9 percent of total household expenditure on electricity, heat and hot water. This is in-line with the general rule of thumb that households should spend no more than 5 - 10 percent of expenditure on energy needs. However, the inequalities of income distribution (a Gini coefficient of 0.354 from 1996 is quoted) suggests that the poorest population groups may have difficulty in affording tariffs that may be affordable to other groups in Kazakhstan.
Cash-flow issues highlight the importance of the structure of energy bills, noting that if a tariff includes a large fixed charge this may benefit high-consumption (and generally richer) households at the expense of low-consumption (generally low-income) households. The ability of households to borrow against future income, the level of non-payment and the mechanisms available for repaying outstanding debt are also highlighted as areas for study.
Transitional issues concern matching the relative pace of price increases and income increases Kazakhstan continues with market reform.
The annex points out that in some countries, energy regulators have a significant role in ensuring the protection of vulnerable consumers and that methods such as increasing incomes through general social security systems, providing subsidies to consumers and
Energy Prices and Tariffs Chapter 5
56
the use of alternative payment systems can all be used to minimize the adverse social impact of tariff reform. A table provides an overview of the relative merits of these three approaches.
14. Possible Impact of the Proposed New Tariff Mechanism
It is possible that the proposed new tariff mechanism may achieve its objectives of stimulating investment and encouraging utilities to reduce costs. However, observations made by the US company AES suggest that a new tariff order alone may not be sufficient to change the uncertainty/instability of tariffs, as the Anti-monopoly Agency and its regional branches are still not independent of ministerial/governmental intervention. FE responded that improving the independence of regulation was not within its scope of work. AES also noted that implementation of the new tariff order may be more effective if legal drafting is carried out by an EBRD-funded commission and if initial calculations undertaken by an independent entity such as an international accounting firm. These areas were also outside the scope of the FE project.
15. There are No Plans to Introduce a Lifeline Tariff for Electricity
According to the Anti-monopoly Agency104, it cannot consider introducing inverted block tariffs for electricity as there would be a danger that the electricity companies may not break even.
This position makes complete sense in the context of the present tariff regime, where electricity tariffs are artificially low for all household consumers, regardless of income levels.
16. Time-of-Day Electricity Tariffs
Some of the RECs - particularly in Astana and Almaty - have day-night tariffs for electricity, but fewer than 10 percent of the population (in Almaty) have time-of-day meters. The meters cost around $30, and the power company levies a small installation charge.
The use of time-of-day tariffs in Kazakhstan is not widespread. The Kazakhstan Electricity Association’s Tariff Study105 recommends introduction of time-of-use based and season-based tariffs for the farming sector, but does not discuss this issue in the context of the household sector.
17. Special Tariffs for Budget Entities
Three of the RECs charge customer that are supported by the state or municipal budget using tariffs that are slightly lower than equivalent (non-industrial, non-household) power consumers. In July 1999, these rates were as follows: Altaienergo REC (charged 2.25 KZT/kWH rather than 2.625); Semipalatinsk (charged 2.78 KZT/kWh rather than 2.72); and Kostanai (charged 3.69 KZT/kWh rather than 3.90).
104 Interview by author on June 12, 2002. 105 USAID - PA Consortium Group, “Kazakhstan Electricity Association Tariff Reform.”

Chapter 5 Energy Prices and Tariffs
57
18. Privileged Electricity Tariffs for ‘Deserving Groups’
A PA106 report recommends that any remaining preferential consumer tariffs should be examined to determine if they are optimally targeting the truly most vulnerable customers.
A World Bank107 report from 1998 mentions that despite the major reforms to the social protection system of the mid-1990s, ‘subsidies to special groups (‘privileges’) were retained. Beneficiaries include from invalids of war and their ‘equivalent’, war veterans and their ‘equivalent’, war widows, invalids, children with disabilities, special pensioners, ‘hero’ mothers, low-income pensioners and civilian war workers. Goods and services that are provided at a discount (subsidy) of up to 50 percent include housing and communal services, electricity, communications, gasoline and other goods and services. The Bank notes that although the benefits may not be large, they are complicated to keep track of and potentially complex to administer, and that reduction in preferential tariffs for selected population groups featured as a medium-term goal on the government’s social protection reform agenda.
The report further notes that although the utilities allowance (reviewed in Chapter 5) was introduced to protect low-income households from utility prices increases, the government continues to maintain the privileged tariffs to groups that are considered vulnerable or deserving under the Soviet system, but that there would appear to be little reason to retain these privileges once a well-functioning housing allowance scheme is in place. It notes that the government had agreed to the need for a closer examination of the issue, and had committed to preparing proposals for revision of the existing system under the World Bank’s PSRMAL.
According to another World Bank report108, Tracebel ‘devised creative solutions to the problem of privileged consumers’ in Kazakhstan, but no details are known109.
C. Other Energy Prices and Tariffs
1. District Heating Prices and Tariffs
According to the Electricity Association, each district heating company has its own tariff policies, but all are based on the size of apartment rather than apartment-level metering.
The ownership structure and management of district heating systems vary from city to city. Some companies own the entire system, including the internal pipes and radiators in apartment blocks - others supply up to the basement with the households owning the internal systems.
106 Ibid. 107 World Bank, Kazakhstan - Living Standards. 108 World Bank, Non-payment in the Electricity Sector . 109 Tractebel has now withdrawn from Kazakhstan.

Energy Prices and Tariffs Chapter 5
58
Billing practices also vary from town to town and company to company. Most companies bill individual households for heat, but some bill the building. Some companies have a 12-month payment systems, which help low-income consumers to budget, and others bill only during the winter months.
According to KIPE, in 2002, a typical monthly heat bill for a district heated household during the winter of 2001/2002 was 1,500 KZT - 2,000 KZT ($9.80 - $13.07). However, as heat tariffs vary both from city to city and from company to company, and as no-one publishes detailed information on how tariffs are calculated from town to town, this represents only a broad indication of heating costs.
For Almaty, where an average apartment has an area of 50 m2 and contains 3.5 residents, heat and hot water prices for the winter of 2001/2002 were as follows:
Company: APC - with around 80 percent of the market
22 KZT/m2/month x typically 50 m2 = 1,100 KZT/household/month
(approx. 14 US cents/m2/month... approx. $7.20/month)
Company: Almaty Heat Utility Company - with around 16 percent of the market
25 KZT/m2/month x typically 50 m2 = 1,250 KZT/month
(approx. 16 US cents/m2/month... approx. $8.17/month)
Company: KIPE - with around 4 percent of the market.
28 KZT/m2/month x typically 50 m2 =1,400 KZT/household/month
(approx. 18 US cents/m2/month... approx. $9.15/month.
For hot water (washing water), it is assumed that each person in each household consumes 120 liters per day, and the three companies charge 350, 400 and 450 KZT/person/month respectively ($2.29; $2.61; $2.94).
Hence, for typical Almaty households, monthly hot water bills in 2002 were:
350 KZT x 3.5 residents = 1,225 KZT (approx. $8.00/household/month)
400 KZT x 3.5 residents = 1,400 KZT (approx. $9.15/household/month)
450 KZT x 3.5 residents = 1,575 KZT (approx. $10.30/household/month)

Chapter 5 Energy Prices and Tariffs
59
2. Heat Prices Rose When Expressed in KZT, but Declined in USD from 1996 - 2001
According to the National Statistical Agency and IMF staff estimates, annual average heat prices rose gradually from 850 KZT/Gcal in 1996 to 1,424 KZT/Gcal in 2001.110 However, when expressed in USD, these same data represent a decline from $12.63/Gcal in 1996 to $9.68 in 2001.
District heating prices vary from system to system, with the average price generally declining in recent years, from $12.63/Gcal in 1996; $15.04/Gcal in 1997; $14.62/Gcal in 1998; $9.62/Gcal in 1999; $8.76/Gcal in 1999; and $9.68/Gcal in 2000 (2000 data is based on January - September only). The largest decline in tariffs came in 1999 when the tenge lost around half of its value against the dollar. (See appendices 1.3, 6.9, and 6.10 for more information on conversion rates and monthly average district heating prices for Kazakhstan, 1996 – 2000.)
3. Prices for Hot Water (Washing Water) Vary Widely from City to City
Most cities report hot water prices per cubic meter, but Astana, Atirau, Palovlodar, Taraz and Shymkent111 report per Gcal., which reflects that the incidence of metering and billing methodologies vary from city to city.
Prices varied widely from city to city. For the cities that report per cubic meter, the highest price in 2000 was 155 KZT/m3 ($1.09/ m3) in the city of Aktau, and the lowest was 22 KZT/ M3 (0.15 USD/m3) in the city of Kyzlorda. The single highest price between 1997 and 2000, when expressed in dollars, was for the city of Aktau in 1998 when hot water peaked at $1.92/m3.
To give an indication of what this range of prices means for households, drawing a hot bath112 in Aktau in 1998 cost 32 US cents, falling to 18 US cents in 2000. Drawing a hot bath in Kyzlorda cost only two-and-a-half US cents in 2000.
As with other forms of energy, prices for hot water generally rose when expressed in tenge over the period 1997-2000, but declined when expressed in dollars. For the cities that charge per cubic meter of hot water, the average price rose slightly from 71 KZT/m3 in 1997 to 88 KZT/m3 in 2000, representing a decline when expressed in dollars from $0.95/m3 in 1997 to $0.62/m3 in 2000.
Similarly, for the cities that report prices in Gcal, average hot water prices rose slightly between 1997 and 2000 when expressed in tenge, from 1,265 to 1,347 KZT/Gcal between 1997 and 2000; this represents a substantial decline when expressed in dollars, $16.77 in 1997 to $9.48/Gcal in 2000. (See appendix 6.11 for more information.)
110 The 2001 data is based on the first nine months only. 111 Hot water prices for Shymkent are in fact reported per m3 for 1997, per Gcal for 1998 and 1999, and per M3 again in 2000. 112 Assuming a bath of 1.1m length x 0.5m width filled to 0.3m depth = 0.165 m3 of hot water = 165 liters = 43.6 gallons.
Energy Prices and Tariffs Chapter 5
60
4. Natural Gas Tariffs
According the ECS,113 natural gas prices are subsidized and the subsidy’s source was described to the Anti-monopoly Agency by ZAO Intergas Central Asia as being the profits of unregulated activities that are not included in the sphere of natural monopoly. Non-regulated sectors include cross-border gas sales and gas transit; Kazakhstan carries some 40 billion cubic meters of Turkmen and Uzbek gas destined for Russia and Asia.
From June 15, 2001, natural gas tariffs were set at:
• Non-households: 420 KZT/thousand M3 excl. VAT (504 KZT/th.M3 incl. VAT) USD equivalent: $2.86/thousand M3 excl. VAT ($3.44/th.M3 incl. VAT)
• Households: 171 KZT/thousand M3 excl. VAT (205.2 KZT/th.M3 incl. VAT) USD equivalent: $1.17/thousand M3 excl. VAT ($1.40/th.M3 incl. VAT)
5. Status of the Reform of Natural Gas Pricing
Although statistics vary slightly between sources, typical household natural gas prices were around $50/000m3 during the late 1990s. As with the price of other fuels, there was considerable local variation, with the average annual price for 1999 being as low as $17.41/000m3 in Aktau and $80.00/000m3 in Almaty. Gas price tables are provided in Appendix 6.12 and Appendix 6.13.
The IEA provides data which describes both industrial and household prices between 1996 and the first quarter of 2000. The data demonstrates that despite a decline in dollar terms over that period, in 1996 households were charged less for gas than industrial consumers (although they actually paid 8 percent more than industrial consumers, which are not required to pay VAT). By the first quarter of 2000, households paid substantially more than industrial consumers (54% higher, when VAT is included). This is a positive step, as it indicates that cross-subsidies between industry and households are starting to be removed. In well-developed gas markets, it is not uncommon for household prices to exceed industrial prices by 100 percent - more in some cases - reflecting the higher costs of household supply. The IEA household and industrial gas prices are reproduced as Appendix 6.14.
6. Other Energy Prices
Tables with prices series for LPG and household coal are provided in Appendix 6.15 and Appendix 6.16.
D. Impact of Pricing and Tariff Setting
1. Impact of Pricing and Tariff Setting on Reducing Poverty Levels
Although energy is affordable to low-income consumers in Kazakhstan as a result of artificially low tariffs, the downside is that the utilities do not earn enough revenue to
113 Energy Charter Secretariat, Kazakhstan: Investment climate.

Chapter 5 Energy Prices and Tariffs
61
modernize their systems and provide an acceptable level of quality of service. The resulting power outages and voltage problems can be expected to continue or worsen as long as this situation continues.
2. Impact of Pricing and Tariff Setting on Removing Barriers to Utility Privatization
Low regulated tariffs are the principle reason for the recent exodus of the international investors from Kazakhstan and the continuing non-availability of investment funds to modernize the power system.
Energy Prices and Tariffs Chapter 5
62

63
Chapter 6 Financing the Energy Social Safety Net
A. Financing Energy Efficiency and Metering Solutions
There were no large-scale state or municipal financing for household level energy-efficiency programs identified in Kazakhstan, although the Almaty City’s initiative to provide ‘free’ hot and cold water meters to low-income households is a small, but worthwhile, example of best-practices in this area.
An Anti-Monopoly Agency Regulation of April 1, 1999, specifies utilities should use internal or borrowed financing to install heat meters, and the return of invested capital depreciated using rates set in consultation with the local regulatory committees.
B. Financing the Use of Tariff Mechanisms to Address Low-Income Issues
Although utilities maintain artificially low tariffs for all household consumers, no governmental or social financing is available to support these tariffs. Applications to raise tariffs to market levels are consistently refused by the Anti-monopoly Agency’s local branches. The result is that financing is not available to modernize the power and district heating systems. As a result of the cumulative effect of years of under-investment, it can reasonably be expected that quality of service, which is already low, will continue to decline rather than improve.

Financing the Energy Social Safety Net Chapter 6
64
65
Chapter 7 Analysis and Recommendations for Kazakhstan
A. Impact of Energy Social Safety Net Approaches
Universally low energy prices are effective in helping to poor to afford energy. The disadvantages of this approach include extremely poor quality of service (e.g. power cuts) for the population; an international competitive disadvantage for Kazakh industries that are required to pay household energy costs through implicit subsidies; the environmental impact associated with highly inefficient energy use; and the prospect of the situation deteriorating rather than improving as the cumulative effect of under-investment in energy systems continues to build up.
B. Recommendations for Kazakhstan
1. General and Hybrid Recommendations
a. Strengthen the Independence of the Anti-monopoly Agency
The energy regulator has an inadequate level of independence from political intervention. A truly independent energy regulator cannot have its decisions changed by any body except the courts; senior regulators cannot be removed except in the case of serious illness or criminal activity; agencies have budgets that are guaranteed, raised independently through license fees or otherwise cannot be influenced by the government of the day; and key staff are paid more than low civil service rates to recruit and, more importantly, retain114 highly competent specialists.
b. Improve Regulatory Certainty
Bring international expertise in the operation and management of customer-oriented energy utilities by conducting future energy sector privatization according to international best practices115 in a way that will also maximize privatization returns for the government. Key steps are to:
• Establish clearly the industry structure and regulation method;
• Sell 100 percent of companies through competitive auctions that are open to all investors, domestic and foreign, on equal terms;
• Provide comprehensive information about the company to all prospective bidders;
114 International experience suggests that regulatory authorities are frequently considered to be prestigious starting points for ambitious professionals to gain experience; as a result, recruiting good staff can be relatively easy. However, regulators have difficulty retaining such staff, who move on to better-paid jobs in the private sector relatively quickly. As energy regulation is a complex discipline with a long learning curve, this staffing cycle is a barrier to best practice. 115 The World Bank describes its preferred method for energy privatization in some detail in the Privatization of the Power and Natural Gas Industries, cited above.

Analysis and Recommendations for Kazakhstan Chapter 7
66
• Place as few conditions as possible on how the new owner may operate the company; and
• Sell the company strictly to the highest (qualified) bidder.
c. Improve Dialogue between Governmental, Non-governmental and Private Sectors
In 1999, as cited above, Bechtel recommended that Kazakhstan establish information exchange mechanisms (e.g. business and professional associations, national energy-efficiency advisory groups, workshops, etc.) to increase the level of awareness and understanding of EEC technologies, and of economic and environmental benefits. This is a good recommendation and should be acted on. Although the establishment of NGOs is, by definition, not a government activity, the culture of involving NGOs in the policy formulation process is weak and not visible in Kazakhstan.
d. Take Steps to Stimulate the Private Sector Housing Market
The Ramboll UNDP-funded study suggests that there is a need to stimulate the market for private apartments in Kazakhstan to enable households to choose to move to smaller, cheaper-to-heat apartments if they so desire.
e. Subsidies and Assistance Payments: Re-design and Re-launch the HAB
The HAB, which paid the balance of housing/utility costs that exceeded 30 percent of household income, had two weaknesses. It removed the incentive to save energy if the HAB was going to pay the balance of the bill, and it would have been extremely costly to run in the environment of market pricing for energy. The main report and other country reports that accompany this report provide insight into ways of designing a utility benefit that can be useful for low-income energy consumers, affordable for the government, and harmonize with fundamental reform of energy pricing policy.
2. Energy Efficiency
f. Establish an Energy Conservation Agency
In 1995, as cited above, Burns and Roe recommended the establishment of an independent Energy Conservation Agency (separate from the Ministry) to implement energy-efficiency programs, and to involve a diversity of organizations, especially in the private sector, in the pursuit of energy efficiency. This did not happen, but the recommendation remains robust.
g. Design and Implement a Low-Income Energy-Efficiency Program
Kazakhstan could design a low-income energy-efficiency program, perhaps within the context of a national energy-efficiency strategy, a national energy-efficiency program, and a national energy-efficiency fund. A fund could perhaps be capitalized from the National Fund.
Chapter 7 Analysis and Recommendations for Kazakhstan
67
h. Improve Energy-Efficiency Data Collection and Dissemination
Several commentators noted that the availability of energy efficiency-related data is low in Kazakhstan, as compared to other countries. It is suggested that this is an area that may be best improved by local stakeholders with the assistance of the international community, to transfer know-how and best practices from other countries.
i. Create a Legal Right for Households with Meters to Pay According to the Meter Reading
Some KSKs are not taking the readings of household meters into account when determining the share of the bill between households in a building. This represents a substantial disincentive for households to invest in energy efficiency as an alternative to incremental consumption.
International experience suggests that legislation giving households with meters the right to pay according to their consumption is the only way to solve this problem. There are two reasons for this. First, the KSKs are unlikely to respect meter readings voluntarily, as reading meters represents unwelcome additional work. Second, households that do not have individual meters will lobby for the ‘old system’ of sharing the bill equally to continue as it defines a ‘fair share’ as an equal share, even though an unmetered household typically consumes far more than a metered household.116
j. Strengthen and Empower KSKs
In some other countries, KSKs take responsibility weatherization and finding optimal communal heating solutions.117 Substantial fundamental reform of the KSK system would be required to make this possible in Kazakhstan.
k. Introduce District Heating Metering and Control
The Ramboll UNDP-funded study recommends the installation of hot water meters, TRVs and HCAs, which would allow apartment users to reduce variable heating costs.
3. Tariff Mechanisms
l. Replace Universal Tariff Subsidies with Targeted Low-Income Tariff Subsidies
The policy of setting artificially low tariffs for all households, rich and poor alike, is fundamentally flawed. There are legal, ethical, financial, environmental, and practical reasons why the universal subsidy that keeps household prices low should be removed
116 There is an urban myth that in buildings where some households have meters and others do not, those without meters pay more. It is not true. The households without meters indeed pay a larger share of a smaller pie, but in absolute terms the bill remains the same as it would have been if the pie had not become smaller as a result of efforts to save energy by neighbors with meters. See the main report for this project for an analysis of this issue. 117 Strengthening KSKs would be a large task, requiring a change in the legal framework, training, awareness building and much more. There is considerable international experience in this area.

Analysis and Recommendations for Kazakhstan Chapter 7
68
and replaced with a social subsidy that targets low-income households which would otherwise be unable to afford the new, higher electricity prices.
m. Consider Reforming Billing and Collection
According to the World Bank report cited above, the functional separation of billing and collection entities from the distribution companies has diluted incentives for efficient and accurate collections, as there is no incentive for the billing and collection agency to accurately read the meter. One solution that the Bank suggested could be to bring the billing and collection companies into the distribution companies, but there are a number of incentive-driven models that could be applied to improve/maximize collection rates.
n. Review the Regime for Disconnection for Non-payment
Although disconnection for non-payment is legally possible, local governments have excessive powers to restrict the utility’s power to disconnect. A fundamental review of the powers of local governments to prevent disconnection should be conducted, based on international best practices.
o. Reduce Technical and Commercial Losses
Another USAID-funded study that PA conducted recommended that Kazakhstan “must undertake a national campaign to dramatically reduce excess technical losses, theft of energy service and nonpayment of energy bills as a primary method to reduce costs and increase revenues - and to reduce the pressure for tariff increases that are due to such losses.” A UNDP-funded study118 also highlighted the need for an efficient court system for debt collection from those who can afford to pay. The government should act on these recommendations.
p. Index Energy Prices to Hard Currency and Raise Prices Gradually
The effect of the value of KZT falling against hard currencies can undermine attempts to gradually raise tariffs to market levels, with an apparent price rise doing little more than catching-up with the tariff’s former value. Indeed, the sharp fall in the value of the KZT against the USD in early 1999 resulted in the household electricity price falling substantially. Zheskasgan REC, which charged households 3.2 US cents/kWh in July 1998, saw this figure fall to only 1.8 US cents/kWh a year later, despite the unchanged tariff of 2.4 KZT/kWh.
Romania combated this “one-step forward, two-steps backwards” effect by adjusting electricity tariffs automatically when the value of the local currency to the dollar slips by 5 percent. Romania found that lobbying groups that would normally seek to prevent price rises are relatively accepting of this, as they understand that a price adjustment of this type is not a price increase.
The IEA noted in its World Energy Outlook 1999, in a review of energy prices and subsidies in Kazakhstan, that the gradual removal of subsidies may minimize social
118 UNDP, “Rehabilitation of District Heating Systems.”

Chapter 7 Analysis and Recommendations for Kazakhstan
69
turbulence that may occur as a result of the need to raise household energy prices by as much as 90 percent (in real terms) to meet cost recovery levels. This is an important point, as unless the principle of gradualism is adopted, price rises can overtake wage rises at a pace that makes energy unaffordable, which can exacerbate the non-payment problem.

Analysis and Recommendations for Kazakhstan Chapter 7
70

71
Bibliography
Asian Development Bank. Country Assistance Plan 2000-2002. Manila, December 1999.
–––––––. Country Assistance Plan, 2001 - 2003. Manila, December 2000.
BISNIS. “Kazakhstan: Profile of Electrical Power Sector.” Washington, D.C., July 2000.
Burns and Roe Enterprises Inc. “Energy Efficiency and Market Reform Project - Final Report.” USAID, Washington, D.C., October 1998.
–––––––. “Kazakhstan National Program for Energy Savings - Final Report.” USAID, Washington, D.C., July 1995.
EBRD. Strategy for Kazakhstan. London, October 2002.
EBRD - Frontier Economics. Kazakhstan - Tariff Order for the Regulation of the Electricity and Heat Sectors. London, July 2001.
Energy Charter Secretariat. Kazakhstan: Investment climate and market structure in the energy sector. Brussels, July 2002.
Energy Information Administration, U.S. Department of Energy. “Kazakhstan Country Analysis Brief.” Washington, D.C., July 2002.
Government of Kazakhstan. 2002. State Program for Poverty Reduction in the Republic of Kazakhstan in 2003 - 2005. Almaty.
–––––––. Ministry of Education and Science of the Republic of Kazakhstan, Almaty Institute of Power and Communication. August 18, 2000. Tariff Policy Development in Regional Electric Network Companies in Regard to the Priorities in the Economy of the Oblasts of the Republic of Kazakhstan. Almaty.
IEA. World Energy Outlook 1999 - Looking at Energy Subsidies: Getting the Prices Right. Chapter 12 - Kazakhstan. Washington, D.C., 1999.
IEA - Danish Energy Agency - Energy Charter Secretariat – OECD. Energy Efficiency Initiative: Volume 2, Country Profiles and Case Studies. 1997.
IMF. Republic of Kazakhstan: Selected Issues and Statistical Appendix, IMF Country Report No. 02/64. Washington, D.C., April 2002.
International Power. “Annual Report 2001.”
Kazakhstan Electricity Association. Brochure.
Klugman, J. and K. Scott. 1995. “Measuring Labor Market Activities in Kazakhstan.”
“Low-income families - social guarantees.” Paper presented at an ERRA conference, December 2000.

Bibliography
72
Murthi, M., Menno Pradhan and Kinnon Scott. 1998. “Poverty and Economic Transition in Kazakhstan, in Transition in Asia.” Edited by Aiguo Lu and Manuel Montes, UNU/WIDER project.
Shakirova, Svetlana and Yuri Zaitsev. “Democracy is Retreating,” National Report for Kazakhstan. Center for Gender Studies, 1999.
Shakirova, S. and Mara Seitova. National Report for Kazakhstan, 2002. Center for Gender Studies, 2002.
Siner, Martin and Jon Stern. “Reform of Electricity Markets in Transition Economies - How to Avoid Traps of Deregulation.” The World Bank’s Transition Newsletter. Washington, D.C., January 2001.
UNDP. “Thematic Poverty Maps - Kazakhstan 2001.” New York, 2002.
UNDP – Ramboll. “Rehabilitation of District Heating Systems in Almaty and Kokshetau, Kazakhstan. Final Report.” New York, December 2001.
USAID – Bechtel. “Feasibility assessment supporting increased energy efficiency in Kazakhstan - Final Report.” Energy IQC Task Order OUT-LAG-I-806-98-00006-00. Washington, D.C., September 1999.
USAID -PA Consortium Group - PA Government Services. “Heating system retrofit of facilities - summary report on the status of heating system demonstrations.” Washington, D.C., February 28, 2002.
–––––––. February 28, 2002. “Kazakhstan Electricity Association Tariff Reform Assistance - Subtask 21 - Translate, Review and Distribute the Kazakhstan Electricity Association Electric Tariff Reform Study.” Washington, D.C., February 28, 2002.
World Bank. Kazakhstan - Living Standards during the Transition. World Bank Report No. 17520-KZ. Washington, D.C., March 23, 1998.
–––––––. Kazakhstan - Public Expenditure Review Volumes 1-3. Washington, D.C., June 27, 2000.
–––––––. Non-payment in the electricity sector in Eastern Europe and the Former Soviet Union. World Bank Technical Paper no. 425. Washington, D.C., June 1999.
–––––––. Privatization of the Power and Natural Gas Industries in Hungary and Kazakhstan. World Bank Report WTP451. Washington, D.C., December 1999.
–––––––. Republic of Kazakhstan, Country Assistance Evaluation. World Bank Report no. 21862. Washington, D.C., February 20, 2001.

73
Monthly and Annual Average Exchange Rates, KZT/USD, 1994-2002
1994 1995 1996 1997 1998 1999 2000 2001 2002 2003
Jan 7.9 55.4 64.3 74.5 76.0 84.3 139.0
145.4
151.9
Feb 11.4 58.7 65.2 75.6 76.4 85.2 139.8
145.3
152.1
Mar 16.7 60.5 65.2 75.5 76.4 86.8 141.3
145.5
152.4
Apr 23.6 62.1 65.5 75.2 76.5 110.3
142.2
145.5
154.0
May 35.6 63.1 66.4 75.5 76.6 118.7
142.3
146.1
153.2
Jun 41.7 63.5 66.8 75.5 76.7 130.4
142.5
146.6
153.3
Jul 44.7 62.6 67.0 75.5 77.2 132.2
142.7
146.8
154.3
Aug 45.7 56.6 67.3 75.6 77.8 132.0
142.7
147.2
154.5
Sep 47.0 59.8 68.1 75.6 79.3 135.2
142.7
147.7
154.7
Oct 48.7 61.5 69.2 75.6 80.9 140.8
142.6
148.1
154.5
Nov 51.0 63.3 69.9 75.6 82.2 139.6
143.5
149.0
154.9
Dec 53.5 64.0 72.5 75.6 83.3 138.2
144.3
150.9
An Ave.
35.6 60.9 67.3 75.4 78.3 119.5
142.1
147.0
153.5
Source: National Bank of Kazakhstan.
1994 1995 1996 1997 1998 1999 2000 2001 End of year 54.3 64.0 73.3 75.6 83.8 138.
2144.
5150.
2 Average for
year 35.5 61.0 67.3 75.4 78.3 119.
5142.
1146.
7 Source: ADB, Key Indicators of Developing Asian and Pacific Countries, 2002.
Monthly and Annual Average Exchange Rates
74

75
Appendices
Appendix 1.1:
Conversion of Heat Energy Units (Gcal, GJ, MW Heat)
Gcal GJ MW heat Gcal 1 4.19 1.16
GJ 0.239 1 0.278 MW heat 7 29.3 1

Appendices
76
Appendix 2.1:
The State of Energy Sector Reform and Privatization in Kazakhstan
Overview of the privatization process, 1991-2002: Kazakhstan has been more aggressive than some other countries in the region in shaking off the collective mentality of the past and embracing market principles throughout the economy. Following the declaration of independence from the Soviet Union of December 1991, Kazakhstan closed loss-making enterprises rapidly rather than allow them to be propped up by subsidies, as continues to be the case elsewhere.
Privatization played a central role in market transformation. Between 1991 and 2000, the Government Property and Privatization Committee and its local branches privatized over 34,500 objects of government property, including 6,200 in 1991-1992 for Coupons and Russian Rubles, and the other 28,300 for cash following the introduction of the Kazakh Tenge (KZT) as the national currency in 1993. Privatization was done in four distinct phases, each with its own goals and objectives.
Phase 1 (1991-1992), featured large-scale reforms of government property to provide the necessary conditions for transition from centralized to market economy. Ownership of the enterprises was transferred to the employees.
Phase 2 (1993-1995) was done under the “National Program of privatization in the Republic of Kazakhstan for 1993-1995,” which aimed to create conditions for the transition to a market economy. The program included small-scale privatization through auctions and competitions of small traders and small utility services; large-scale privatization of medium-sized enterprises with 200 to 5,000 employees as well as the sale of Privatization Investment Coupons; and privatization based on individual projects for the sale of large and single production complexes with more than 5,000 employees.
Phase 3 (1996-1998) was done in accordance with the “Privatization program and restructuring of Government property of Kazakhstan, 1996-1998,” which aimed to strengthen the domination of the private sector by completing the privatization process. Privatization of state assets during this Phase 3 was conducted strictly on the basis of cash transfers. All types of assets were sold, including enterprises as going concerns, non-viable enterprises that were sold for their asset value only; and government shares in enterprises that had already been partially privatized. Utility assets, including the power, oil and gas sector companies were all included in the privatization program.
Phase 4 (1999 - ) aimed to improve privatization legislation and addressed issues such as government property management and provision of competition and transparency during the privatization of the government property. In accordance the Phase 4 program, the rights of ownership and use of government shares were granted to the production sector ministries; 10 leading enterprises were identified as assets in which the government would keep shared participation; government property was divided into two categories – national and local (communal) to expand local budgets; and local investment policies were developed based on the most urgent goals of the region.
Appendices
77
The EBRD summarized the state of privatization in 2002,1 defining three distinct groups of enterprises. The first has a strategic foreign sponsor and usually feature strong parent support, including financing, a clear market strategy and operate according to international best practice. The second group consists of large corporations that were privatized to ‘insiders or to foreign investors with uncertain reputation’, leading to concerns over corporate governance and integrity that has limited the availability of external finance and kept portfolio investors away. The third group, which is growing rapidly, consists of private SMEs, who have limited access to finance as they fear harassment by the tax administration and local government officials.
According to the World Bank2, although the private sector has developed during the transition period so far, private sector-led growth remains constrained by major impediments that include endemic corruption, excessive government intervention, arbitrary tax enforcement, a small banking sector, weak regulatory frameworks and a poorly functioning judiciary.
Characteristics of the power system
Generation: Kazakhstan has 71 power plants totaling 17.3 GW, of which 70 percent are coal-fired, 15 percent are gas-fired and 15 percent (five plants) are hydroelectric. The thermal plants are almost all combined heat and power plants, but generally outdated, inefficient open-loop technologies, not modern, closed-loop, energy-efficient CHP systems.
Transmission: State-owned KEGOC was established in 1997 as a successor to Kazakhstanenergo, the former vertically-integrated power company. KEGOC now owns and operates the inter-regional transmission network.
Distribution: Regional electricity companies (RECs) carry out local power transmission and distribution, distribution companies. They are, de jure, owned by KEGOC, but de facto managed separately at the local level. The RECs—some oblasts have as many as three—have widely diverging characteristics, management and policies. Since 1998, control of several RECs was ceded to international companies (a form of privatization), but the experience of privatization has been generally bad in Kazakhstan, with regulated tariffs being set too low for companies to cover costs, much less make a profit. The international companies have now mainly withdrawn, selling on to local companies, as described below.
Kazakhstan has suffered electricity shortages since 1992, and continues to suffer power cuts today; several regions were without power during the winters of 1998/1999 and 1999/2000.3 There are several reasons for the cuts. It would be reasonable to expect that in a market environment, the power industry would adapt to meet the needs of the market, but artificially low tariffs have dissuaded market participants from investing in
1 EBRD, Strategy for Kazakhstan. 2 World Bank, Republic of Kazakhstan, Country Assistance Evaluation. 3 BISNIS, “Kazakhstan: Profile of the Electrical Power Sector”.

Appendices
78
the system. According to the UNDP,4 the system is frequently overloaded in some areas, resulting in brownouts and damaging electrical appliances. In addition, the transmission company, Kazakhstan Electricity Grid Operating Company (KEGOC), polices the market for bulk power, disconnecting (or shedding load) if large consumers, including power distribution companies, don’t pay for power.5
There are large areas of Kazakhstan that are not connected to power networks at all. The ADB is focusing some of its assistance on meeting energy needs of remote communities, recognizing that they are unlikely to be connected to the power grid in the near term, and noting6 that without power supply these communities will be unable to obtain proper heating during the harsh winters, with the poor likely to suffer the most.
Power sector privatization: The World Bank’s comparison of power sector privatization in Kazakhstan and Hungary of 19997 describes the Hungarian approach as “well planned, well managed, orderly, competitive, transparent and generally regarded to be free of corruption” and the Kazakh approach as “unplanned, rushed, opaque with little competition, and thus subject to allegations of corruption.” Several of the shortcomings that the Bank identified are reflected in the poor state of the power sector today.
The power generation sector has been almost completely privatized over the last five years, as a result of the Government Programme on Privatization and Restructuring in the Power Sector (Decision 663 of May 1996), which aimed to separate competitive parts of the power system from natural monopolies (transmission and distribution). All power stations except for Ekibastuz Hydro Electric Plant 2 are now in private hands.
The market: State control to ‘single buyer’ to bilateral contracts to power pool: Following privatization of power generation, Kazakhstan tried and failed to implement the single buyer model for power, featuring power purchase agreements between newly-privatized generation companies and the transmission company, which acted as the single buyer. The objective of this approach was to provide assurance to the new owners that they would be paid for the power that they produced. They weren’t. Non-payment by final consumers to the distribution companies meant that the distribution companies could not pay the single buyer, who in turn could not pay the generators.
As the generators could not force either the single buyer or the government to pay up, a bilateral contract market developed, with generators contracting directly with any bankable customers that they could find, albeit at a very much lower price than that of the original power purchase agreement. According to the World Bank,8 the generation price achieved by AES Silk Road generation company reduced from 2.8 US cents/kWh
4 Interview by author, June 2002. 5 Ibid. 6 ADB, Country Assistance Plan for Kazakhstan. 7 World Bank, Privatization of the Power and Natural Gas Industries. 8 Ibid.

Appendices
79
(the Power Purchase Agreement price) to 1.1 cents/kWh as a result of the need to find buyers who would actually pay.
A planned national power pool is intended to allow generators to compete at a national level. The pool was scheduled to be operational by the end of 2002.
Transmission and control - The KEGOC’s role: Despite being state-owned, the KEGOC has been successfully commercialized, is profitable, and, according to the EBRD as a lender, demonstrates good project implementation capability, so it is envisaged that the company will be able to raise financing for its future investment needs without sovereign guarantees.
One of the KEGOC’s key roles is to police the market for bulk power. It disconnects (or sheds load) from large consumers, including RECs, if they do not pay. The World Bank notes with concern that there is an apparent conflict of interest in KEGOC’s ownership of certain RECs, which it may be tempted to treat more favorably than other market participants by supplying power above their contracted amounts.
Privatization of power distribution has not been successful. Some RECs were leased to major international players, most of which found the investment climate to be worse than anticipated, leading to their subsequent withdrawal from Kazakhstan. Regulatory uncertainty, three-monthly price reviews, and artificially low household tariffs all contributed to the exodus. In particular, the investors expected to be allowed to gradually raise regulated household electricity tariffs as a result of the establishment of the Anti-monopoly Agency as an independent regulatory authority, but the agency’s independence level was too low to modernize energy pricing policies, and prices remained low.
The U.S. company AES Silk Road (AES) was granted control of two RECs, East Kazakhstan and Pavoldar, for 15 years from June 1999. AES also had power generation interests, owning Ekibastuz TPP, two hydro power plants and four CHP plants.9 The EBRD cancelled a loan that had been approved in 1999 following disagreements between AES and the agency over tariffs, and AES subsequently decided to withdraw from Kazakhstan.
Another U.S. company, Access Industries, operates the Access Energo Group REC at Petropavlovsk in Northern Kazakhstan region, together with a 350 MW power station and coal mines.10
Karaganda Power Company (KPC) was acquired as a joint venture by UK firm International Power (IP) and Israeli firm Ormat Industries (Ormat) in May 1998. It operates two coal-fired CHP plants (totaling 470 MW electricity and 1,500 MW heat) and the associated district-heating network for Kazakhstan’s second largest city.
9 BISNIS, July 2002. 10 Ibid.

Appendices
80
IP also pulled out of Kazakhstan, writing off its investment as early as in 2000, only two years after entering the market, and finally selling its 50 percent interest to Ormat11 for assumption of all contractual liabilities plus $500,000 in March 2002. IP pulled out because “The sale of our interest in Karaganda... is a demonstration of our strategy to either resolve or exit non-performing legacy investments that are outside our core target regions... As a result of circumstances in Kazakhstan whereby International Power plc no longer exercises significant influence over the KPC and there being no foreseen circumstances in the future where this is likely to change, the investment in the joint venture was reclassified as trade investment on 1st April 2000.”12
Ormat then became 100 percent owner of KPC, but according to the EBRD, Ormat is also expected to withdraw from Kazakhstan. The EBRD cites the low level of tariffs as the reason behind the withdrawal of both Ormat and IP. In 2001, the EBRD reduced the loan size for KPC to match the company’s reduced payment capability in view of the slow pace of tariff reform.
Tractebel, a Suez Lyonnaise des Eaux company, purchased the REC Almatyenergo, which provides all power and most gas to households in Kazakhstan’s largest city and renamed the company Almaty Power Consolidated (APC). Tractebel also purchased natural gas interests. On April 28, 2000 Tractebel announced that it was pulling out of Kazakhstan and would sell both APC and its gas businesses to state-owned gas company KazTransGas for $100 million. The final payment was made on November 10, 2000, when the Tractebel’s final 55 percent share in Intergas Central Asia was transferred to KazTransGas.13 In 1999 the World Bank noted “In retrospect, Tractebel may have erred in not specifying more precisely the methodology and principles in the contract that the government would use in setting prices (for gas).”14
What went wrong with privatization of power distribution? Bringing international expertise and investment to Kazakhstan are integral parts of the government’s Development Strategy of Kazakhstan to 2030. Although attracting major international companies like Access Industries (USA), AES (USA), International Power (UK) and Ormat (Israel) to the Kazakh power distribution sector might be considered a substantial achievement for government privatization policy, the subsequent withdrawal of these companies might likewise be considered to be a failure.
So what went wrong? The simple answer is a poorly designed, weak and unstable regulatory regime for the energy sector, resulting in non-cost reflective tariffs that were too low to support investment. Despite several years of policy dialogue with the international community and substantial technical assistance from USAID and the EBRD, the agency’s powers were too weak, its independence from national political
11 Formally, the deal was between Ormat Holding Corporation and Karaganda Holding Company. 12 From a press release at www.ipplc.com. 13 See www.tractebel.com. 14 World Bank, Privatization of the Power and Natural Gas Industries.
Appendices
81
intervention low; its local branches’ independence from local politics similarly too low; and the basic methodology for setting tariffs seriously flawed.
Although most of the power generation sector was privatized, mainly to foreign companies, only a handful of distribution companies were privatized, and it is in this sector that most of the bad management and inefficiencies exist. With one exception (Tractebel, which has since withdrawn from Kazakhstan), the companies were unable to pay for power and gas supplies as the Anti-monopoly Agency would not allow them to raise prices and did not collect payments effectively. This situation continues today.
The form of privatization was also sub-optimal. Deals were conducted behind closed doors rather than transparently by competitive tender, which suggests that companies may have been sold too cheaply (although this cannot be said with certainty as full details were not made public). Higher privatization revenues could have been generated had the government reduced investor risk by setting a (genuinely) independent and modern regulatory regime, run a tender managed by experienced international bankers, and sold to the highest qualified bidder.
The World Bank concluded that the privatization method that Kazakhstan used, while sub-optimal, should not be over-criticized as it was conducted extremely rapidly in response to the 1996 crisis, when there was a real risk of the power system collapsing as a result of unpaid suppliers and workers threatening to withdraw their services and labor. Hence the major weakness of privatization program, according to the World Bank, was not the privatization method itself, but rather the privatization of power generation and gas transmission only, with only a handful of power distribution companies being privatized. Also, as neither the government, the private sector, nor consumers were satisfied with the results, the privatization program clearly failed to produce a “win-win outcome” as it could have done.
Can investor confidence in the power sector be restored? International investors who entered the Kazakh power sector during the mid-late 1990s knew that these were high-risk investments.15 Systems required substantial investment to bring them up to date; appropriate energy legislation was not in place; the rule of law was and remains weak; regulatory risk was high, as there was a nascent regulatory regime that did not subsequently develop into a strong, empowered and independent regulatory authority; there was a tradition of low tariffs which has persisted; and there were serious non-payment problems which have also persisted. The prices that the investors paid for the assets are understood to have been low, reflecting the high risk, but ultimately the risk did not pay off, investors lost money and withdrew from Kazakhstan.
In view of the above, it is likely to be difficult to attract substantial international investment to Kazakhstan in the future unless there is a substantial change to the status quo in terms of legislation, regulation and, in particular, tariffs.
15 The same can be said for investors in the downstream natural gas sector.

Appendices
82
The Anti-monopoly Agency from 2003 is expected to implement a new tariff methodology that was designed with technical assistance from the EBRD. According to the EBRD, “the implementation of a long-term and transparent methodology is vital for attracting private investment in the sector.” 16 The success or failure of the new tariff methodology is dependent to a large extent on the agency’s ability to resist outside intervention in its affairs. Without a strengthening of the regulator’s independence, which would involve a considerable change to the status quo, such resistance may be difficult to achieve, and could undermine recovery of investor confidence in the power distribution sector. The proposals for a new tariff methodology are summarized in chapter 6.
In summary, the steps required to bring investors back are now well understood. According to the World Bank, the experience of privatization so far, although sub-optimal, has provided Kazakhstan with first-hand experience of some things that can go wrong, and in this respect may have laid the foundation for future market deregulation and introduction of competitive mechanisms in the sector.17
Attitude of trade unions to privatization. The attitude of trade unions to privatization has been positive. Unlike in some other countries in the region, there has been no significant opposition by the management and staff of power sector companies. According to the World Bank, this is because wages arrears were high, and investors seeking to buy power sector assets were required to pay employees’ back pay (within limits) as a condition of privatization, so staff welcomed the transition to the private sector.18 By contrast, in other countries trade unions often seek to prevent privatization, perceiving (often correctly) that redundancies will follow.
Ownership and characteristics of district heating. Ownership of the district-heating companies was transferred to local governments under the Government Programme on Privatization and Restructuring in the Power Sector (Decision 663 of May 1996).
Technical characteristics of the systems, approaches to management, pricing and tariffs, and dealing with non-payment, the extent of metering and collection rates all vary widely from oblast to oblast. Both boiler houses and heat-electric generating stations are used with oil and coal fueling most of the systems. Systems need substantial investment and fundamental management reform, but at present, tariffs are set to support investment and the political will and know-how to implement management reforms are absent.
Improving the district heating networks requires medium- to long-term municipal investment. Municipalities have difficulty making investments of any kind, partly as a change of the governor (who is appointed by the president) can change investment priorities overnight, and partly as budgets are centrally-controlled and unpredictable, with the government sometimes even withdrawing “excess” funds from prosperous 16 EBRD, Strategy For Kazakhstan. 17 World Bank, Privatization of the Power and Natural Gas Industries. 18 World Bank, Republic of Kazakhstan, Country Assistance Evaluation.

Appendices
83
regions. It is technically possible for municipalities to borrow money, but practically the administrative burden of a long and complicated central approval process from central government hinders borrowing.
The number and size of apartments and the extent of district heating. The size of dwellings, together with the thermal performance of buildings, weather patterns and comfort levels determine a building’s heating requirement. In the absence of metering, size of dwellings is also used to determine the share of the heating bill to be paid by an individual household.
There are some 4.1 million dwellings in Kazakhstan, of which 2.6 million urban and 1.5 million rural. The average area of a dwelling in 2001 was 58.1 square meters (625 sq. ft.) for the whole of Kazakhstan, or 53.3 (574 sq. ft.) for urban dwellings. (See appendices 2.2 - 2.4.)
Around 7 million people, representing about 70% of the urban population, live in district-heated buildings.19 In total, some 1.8 million apartments are served by district-heating networks, and around 0.2 million are in buildings that have heat meters in the basement. There is no market penetration of apartment-level metering at all in Kazakhstan. (See appendix 2.5.)
The government favors continued use of district heating and CHP development. The government is formally committed to the continued use of district heating systems, preferably with the heat being generated by CHP systems, in preference to individual heating solutions. The Program of the Development of the Electric Power Sector to 2030,20 that the government by a Government Decision in April 1999, calls for the reconstruction and modernization of existing systems of heat supply with CHP systems. Implementation of modern autonomous high-quality heat sources will be allowed whenever this is more economically and environmentally viable than either CHP or centralized heat supply from boiler houses.
Ownership and characteristics of the gas sector. Some 1.66 million of Kazakhstan’s 4.15 million households are connected to natural gas networks. A further 1.89 million households use LPG, either in bottled form for use in individual appliances or from very large pressure vessels that supply several buildings through local networks. (See appendix 2.6)
Tractebel of Belgium bought a concession to manage all downstream gas transmission assets in 1997, but withdrew from Kazakhstan in 2000, selling its gas assets to KazTransGas.
The main national oil company, Kazakhoil, and the main national oil and gas transportation company, TransNefteGaz, merged in February 2002 to form Kazmunaigaz, which is designed to be a “national champion” oil and gas company that
19 Interview by author with Danial Duisengaliev of the Electricity Association, June 10, 2002. 20 Energy Charter Secretariat, Kazakhstan: Investment climate.
Appendices
84
will be able to compete on equal terms with international companies that wish to exploit the reportedly huge, and largely unexplored petroleum-rich areas of the Caspian sea.
The Kazakh natural gas network is fragmented. The west of the country consumes domestically produced gas and also exports; the southern part of the country features a completely separate network that is entirely dependent on imported natural gas; and six of the fourteen oblasts have no access to natural gas at all. Domestic consumption (residential and industrial) is around 2.5 BCM per year, but gasification projects that are under way are expected to raise this to around 3.9 BCM per year by 2005.21 One of the drivers of the gasification plans was a Law of August 1999 that requires gas exploitation projects to be included as integral parts of oil exploitation projects to reduce the widespread practice of flaring.
The value of natural gas exports is volatile as prices are linked to oil prices. However, both export volumes and export values are generally rising22 from 2.4 BCM in 1997 (value $21 million), 2.3 billion in 1998 ($23 million), 4.2 BCM in 1999 ($25 million), 5.2 BCM in 2000 ($38 million), and 4.2 billion in the first eight months of 2001($54 million). Most of the gas is sold to Russia, with a small amount going to Georgia. The six natural gas distribution companies have not been privatized.
21 Ibid. 22 IMF, based on information provided by the Kazakhstan authorities and staff estimates.

Appendices
85
Appendix 2.2:
Number of Households in Kazakhstan
Urban apartments 1,996,154 Urban houses/villas 667,050 Rural 1,489,536 Total number of households 4,152,740
Source: Agency on Statistics.

Appendices
86
Appendix 2.3:
Number and Size of Dwellings, Urban and Rural, 1997, 1999, 2000
No of dwell-ings
(000s)
Ave.area(m2)
No of dwell-ings
(000s)
Ave. area(m2)
No of dwell-ings
(000s)
Ave. area (m2)
1997 1999 2000 Akmola Oblast 191.8 55.2 255.6 56.7 249.0 54.6Aktobe Oblast 189.4 54.0 187.0 55.6 180.2 56.6Almaty Oblast 419.2 54.8 400.0 56.0 382.7 59.9Atirau Oblast 107.9 56.9 109.6 59.0 96.2 63.1Eastern Kazakhstan Oblast
498.5 51.2 471.7 52.2 469.7 52.4
Zhambyl Oblast 250.5 57.7 242.4 59.0 236.5 61.4Western Kazakhstan Oblast
173.8 54.2 281.5 52.6 169.7 52.0
Karaganda Oblast 538.0 51.9 500.4 55.8 455.4 53.6Kostanai Oblast 382.1 53.2 344.3 55.2 323.6 51.9Kzylorda Oblast 117.8 72.0 109.8 74.9 116.9 81.3Mangistau Oblast 86.5 56.5 84.5 55.0 78.3 56.6Pavlodar Oblast 300.9 52.6 299.9 53.4 259.9 52.6Northern Kazakhstan Oblast
368.7 53.0 244.0 53.8 229.2 53.9
Southern Kazakhstan Oblast
389.9 69.4 427.4 64.4 403.8 83.0
Astana City 88.0 50.4 82.6 59.4 98.4 48.4Almaty City 375.9 53.0 367.2 56.6 370.2 52.0 Kazakhstan - average 55.3 56.7 58.1Kazakhstan - total 4,478.
9 4,307.9 4,119.
8
Area in square feet:
Kazakhstan - average 595 610 625

Appendices
87
Note: The source refers to ‘apartments’ rather than ‘dwellings’, however, it is apparent from the data provided in Appendix 2.1 that this table must describe dwellings.
Source: Regional Statistical Yearbook of Kazakhstan, 2001, 113.

Appendices
88
Appendix 2.4:
Number and Size of Dwellings, Urban Areas Only, 1997, 1999, 2000
No of dwell-ings
(000s)
Ave.area(m2)
No of dwell-ings
(000s)
Ave. area (m2)
No of dwell-ings
(000s)
Ave. area (m2)
1997 1999 2000 Akmola Oblast 83.4 49.5 137.4 52.2 128.1 50.1Aktobe Oblast 114.7 48.9 114.0 52.0 114.5 53.2Almaty Oblast 160.2 51.2 156.4 52.3 136.8 54.6Atirau Oblast 76.6 53.2 75.9 57.3 62.9 58.6Eastern Kazakhstan Oblast
331.3 49.2 315.7 50.8 310.1 50.2
Zhambyl Oblast 135.5 53.7 135.6 54.3 126.4 54.4Western Kazakhstan Oblast
85.4 51.1 97.3 48.5 84.3 47.2
Karaganda Oblast 462.1 50.7 433.1 54.1 396.7 51.9Kostanai Oblast 227.0 49.6 219.0 51.4 195.1 47.9Kzylorda Oblast 79.5 68.2 74.9 71.2 77.0 76.5Mangistau Oblast 75.3 53.8 73.8 52.4 67.0 53.3Pavlodar Oblast 215.0 50.3 218.8 51.5 181.9 48.7Northern Kazakhstan Oblast
176.0 48.3 108.7 47.9 99.2 48.3
Southern Kazakhstan Oblast
185.6 66.8 216.5 58.0 185.5 71.0
Astana City 88.0 50.4 82.6 59.4 98.4 48.4Almaty City 375.9 53.0 367.2 56.6 370.2 52.0 Kazakhstan - average urban
52.3 53.9 53.3
Kazakhstan - total urban 2,871.5
2,826.9 2,634.0
Area in square feet:
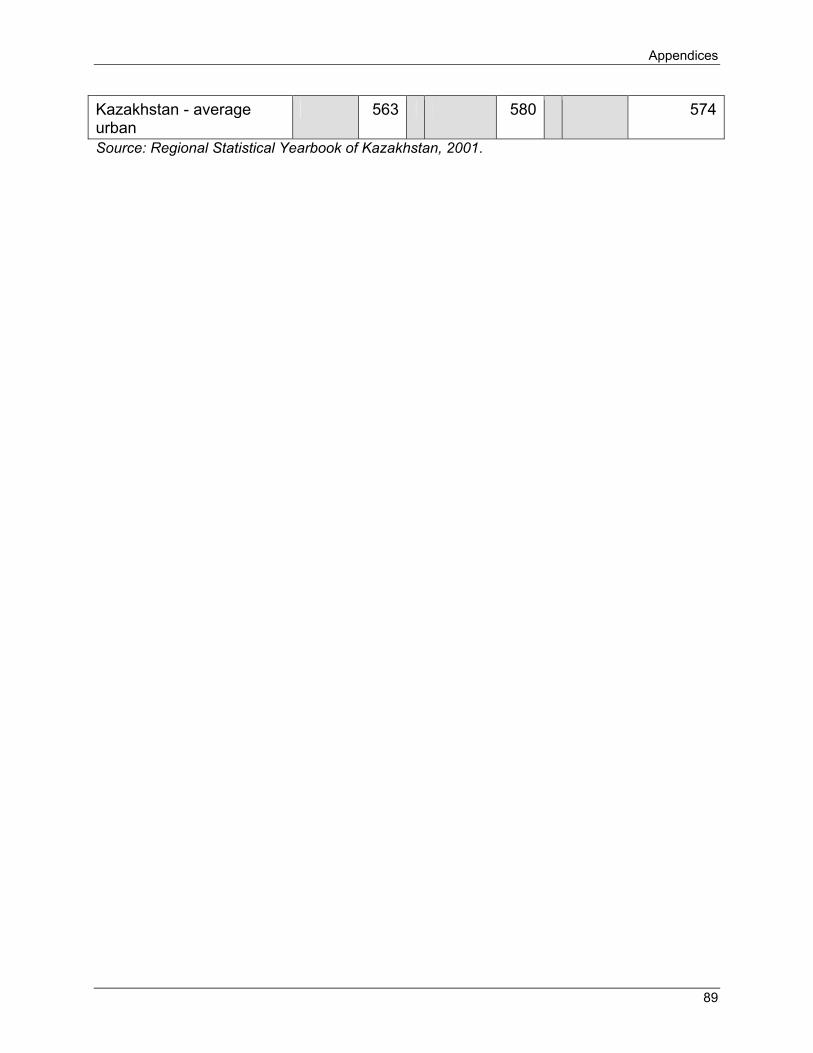
Appendices
89
Kazakhstan - average urban
563 580 574
Source: Regional Statistical Yearbook of Kazakhstan, 2001.

Appendices
90
Appendix 2.5: Number of District Heating Customers, Systems, and Meters
Number of district heating systems
60
Total number of apartments connected to DH systems
1,793,824
Average number apartments per system
29,897
Number of apartments with heat meters
0
Number of apartments without heat meters, but the building is metered
200,908
Number of apartments where neither apartment nor building metered
1,592,916
Source: Anti-monopoly Agency, 2002 and extrapolated data.
Appendix 2.6:
Number of Natural Gas Connections and LPG Customers
Households with natural gas connections Urban apartments - single meter
for the building 1,289,093
Houses and villas (urban and rural)
371,644
Total 1,660,737 Households using LPG Urban 691,833 Rural 1,194,487 Total 1,886,320

Appendices
91
Appendix 3.1:
Key Poverty Indicators for 2001
Share of population with Income below Subsistence Minimum
Total Urban Rural
Assets Coefficien
t
Unemployment Rate
% % % % % Almola 20.4 18.6 21.8 9.3 10.8Aktobe 29.4 18.4 45.3 12.9 11.4Almaty 39.3 35.0 41.1 8.9 10.2Atyrau 410 36.4 48.2 12.0 13.5East Kazakhstan 22.1 16.0 30.6 10.6 7.3Zhambyl 48.4 41.0 53.4 7.4 12.7West Kazakhstan 28.3 25.2 30.3 8.5 12.5Karaganda 22.5 20.4 30.7 9.2 9.2Kostanai 26.2 14.1 39.4 13.1 10.3Kyzyl-Orda 38.5 33.0 47.3 6.1 13.9Mangystau 46.2 34.6 95.5 13.4 10.5Pavlovdar 16.1 11.8 21.9 8.5 9.2North Kazakhstan 10.0 4.6 13.6 7.3 8.9South Kazakhstan 38.4 28.0 44.1 7.7 11.5Astana City 2.2 2.2 0.0 9.8 9.3Almaty City 5.5 5.5 0.0 7.8 10.8TOTAL 28.4 20.4 38.0 11.3 10.4Notes: ‘Poverty level’, ‘poverty line’, ‘subsistence minimum’, ‘headcount ratio’, ‘unemployment rate’ and ‘assets coefficient’ are all described in detail in the section entitled “Key poverty statistics and definitions for 2001” in chapter 3. Source: UNDP, “Thematic Poverty Maps - Kazakhstan 2001,” (2002), which in turn cites the National Statistics Agency.
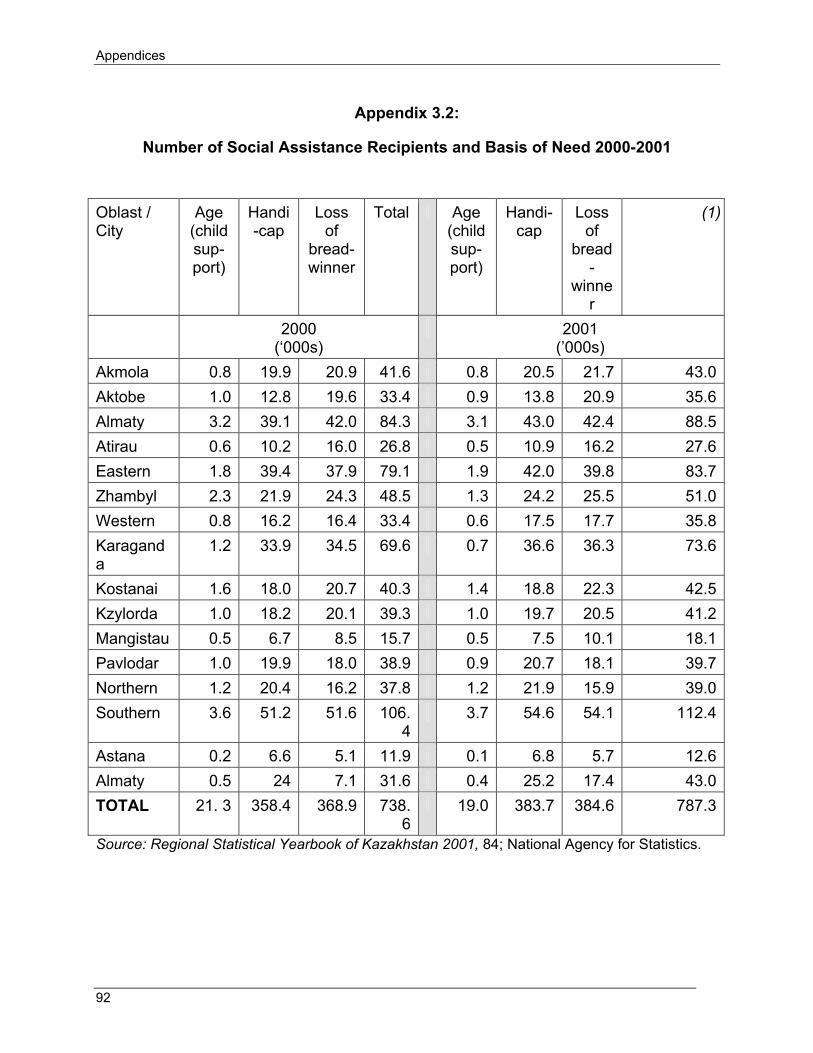
Appendices
92
Appendix 3.2:
Number of Social Assistance Recipients and Basis of Need 2000-2001
Oblast / City
Age (child sup-port)
Handi-cap
Loss of
bread-winner
Total Age (child sup-port)
Handi-cap
Loss of
bread-
winner
(1)
2000 (‘000s)
2001 (’000s)
Akmola 0.8 19.9 20.9 41.6 0.8 20.5 21.7 43.0Aktobe 1.0 12.8 19.6 33.4 0.9 13.8 20.9 35.6Almaty 3.2 39.1 42.0 84.3 3.1 43.0 42.4 88.5Atirau 0.6 10.2 16.0 26.8 0.5 10.9 16.2 27.6Eastern 1.8 39.4 37.9 79.1 1.9 42.0 39.8 83.7Zhambyl 2.3 21.9 24.3 48.5 1.3 24.2 25.5 51.0Western 0.8 16.2 16.4 33.4 0.6 17.5 17.7 35.8Karaganda
1.2 33.9 34.5 69.6 0.7 36.6 36.3 73.6
Kostanai 1.6 18.0 20.7 40.3 1.4 18.8 22.3 42.5Kzylorda 1.0 18.2 20.1 39.3 1.0 19.7 20.5 41.2Mangistau 0.5 6.7 8.5 15.7 0.5 7.5 10.1 18.1Pavlodar 1.0 19.9 18.0 38.9 0.9 20.7 18.1 39.7Northern 1.2 20.4 16.2 37.8 1.2 21.9 15.9 39.0Southern 3.6 51.2 51.6 106.
43.7 54.6 54.1 112.4
Astana 0.2 6.6 5.1 11.9 0.1 6.8 5.7 12.6Almaty 0.5 24 7.1 31.6 0.4 25.2 17.4 43.0TOTAL 21. 3 358.4 368.9 738.
619.0 383.7 384.6 787.3
Source: Regional Statistical Yearbook of Kazakhstan 2001, 84; National Agency for Statistics.

Appendices
93
Appendix 3.3:
Number of Social Assistance Recipients Compared with Total Population
Oblast/city Population
Recipients of social assistance
(000s) (000s) (%) Akmola 810.3 43.0 18.8 Aktobe 672.3 35.6 18.9 Almaty O 1,561.8 88.5 17.6 Atirau 447.1 27.6 16.2 Eastern 1,504.3 83.7 18.0 Zhambyl 985.7 51.0 19.3 Western 604.4 35.8 16.9 Karaganda 1,381.6 73.6 18.8 Kostanai 972.3 42.5 22.9 Kzylorda 605.5 41.2 14.7 Mangistau 323.7 18.1 17.9 Pavlodar 776.8 39.7 19.6 Northern 706.4 39.0 18.1 Southern 2,025.4 112.4 18.0 Astana 324.1 12.6 25.7 Almaty 1,139.9 43.0 26.5
Total 14,841.9 787.3 18.9
Sources: Social assistance statistics: see previous table. Population statistics: Regional Statistical Yearbook, Almaty (2001) 47.
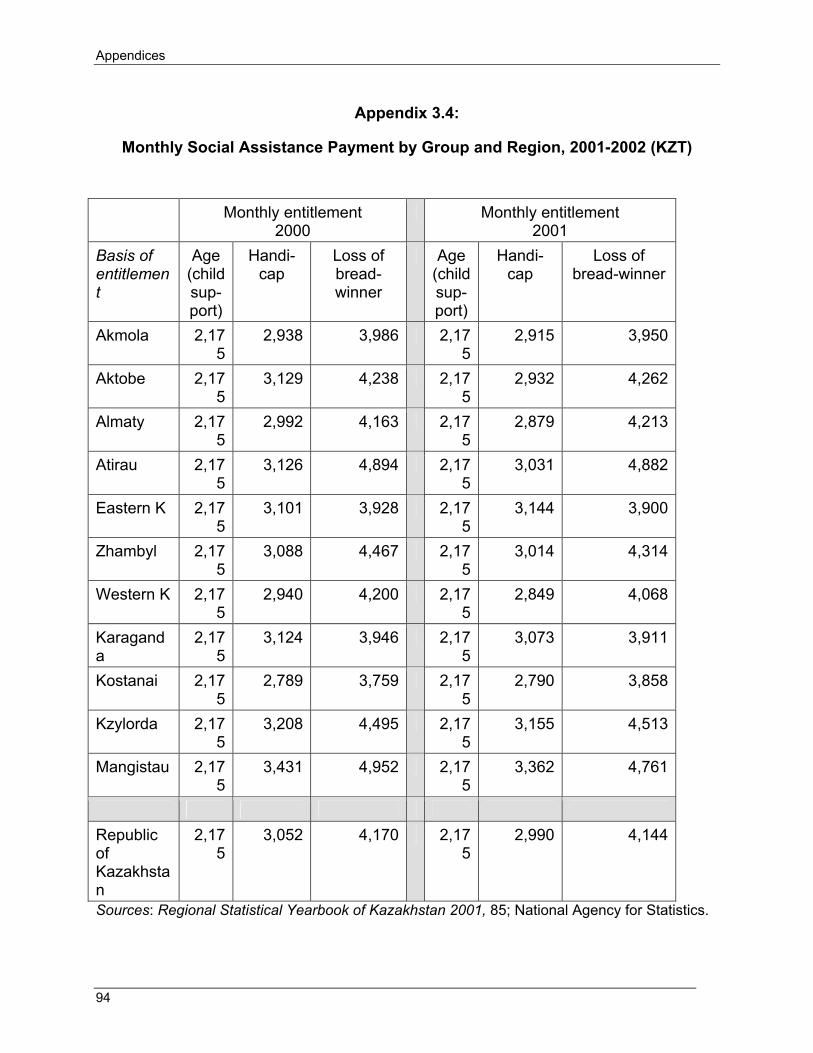
Appendices
94
Appendix 3.4:
Monthly Social Assistance Payment by Group and Region, 2001-2002 (KZT)
Monthly entitlement 2000
Monthly entitlement 2001
Basis of entitlement
Age (child sup-port)
Handi-cap
Loss of bread-winner
Age (child sup-port)
Handi-cap
Loss of bread-winner
Akmola 2,175
2,938 3,986 2,175
2,915 3,950
Aktobe 2,175
3,129 4,238 2,175
2,932 4,262
Almaty 2,175
2,992 4,163 2,175
2,879 4,213
Atirau 2,175
3,126 4,894 2,175
3,031 4,882
Eastern K 2,175
3,101 3,928 2,175
3,144 3,900
Zhambyl 2,175
3,088 4,467 2,175
3,014 4,314
Western K 2,175
2,940 4,200 2,175
2,849 4,068
Karaganda
2,175
3,124 3,946 2,175
3,073 3,911
Kostanai 2,175
2,789 3,759 2,175
2,790 3,858
Kzylorda 2,175
3,208 4,495 2,175
3,155 4,513
Mangistau 2,175
3,431 4,952 2,175
3,362 4,761
Republic of Kazakhstan
2,175
3,052 4,170 2,175
2,990 4,144
Sources: Regional Statistical Yearbook of Kazakhstan 2001, 85; National Agency for Statistics.

Appendices
95
Appendix 3.5:
Monthly Social Assistance Payment by Group and Region, 2001-2002 (USD)
Monthly entitlement 2000
Monthly entitlement 2001
Basis of entitlement
Age Handicap
Loss of breadwinn
er
Age Handicap Loss of breadwinner
- $ - - $ - - $ - - $ - - $ - - $ - Akmola 15.3
1 20.68 28.05 14.8
019.83 26.87
Aktobe 15.31
22.02 29.82 14.80
19.95 28.99
Almaty
15.31
21.06 29.30 14.80
19.59 28.66
Atirau 15.31
22.00 34.44 14.80
20.62 33.21
Eastern K 15.31
21.82 27.64 14.80
21.39 26.53
Zhambyl 15.31
21.73 31.44 14.80
20.50 29.35
Western K 15.31
20.69 29.56 14.80
19.38 27.67
Karaganda
15.31
21.98 27.77 14.80
20.90 26.61
Kostanai 15.31
19.63 26.45 14.80
18.98 26.24
Kzylorda 15.31
22.58 31.63 14.80
21.46 30.70
Mangistau 15.31
24.14 34.85 14.80
22.87 32.39
Republic of Kazakhstan
15.31
21.48 29.35 14.80
20.34 28.19
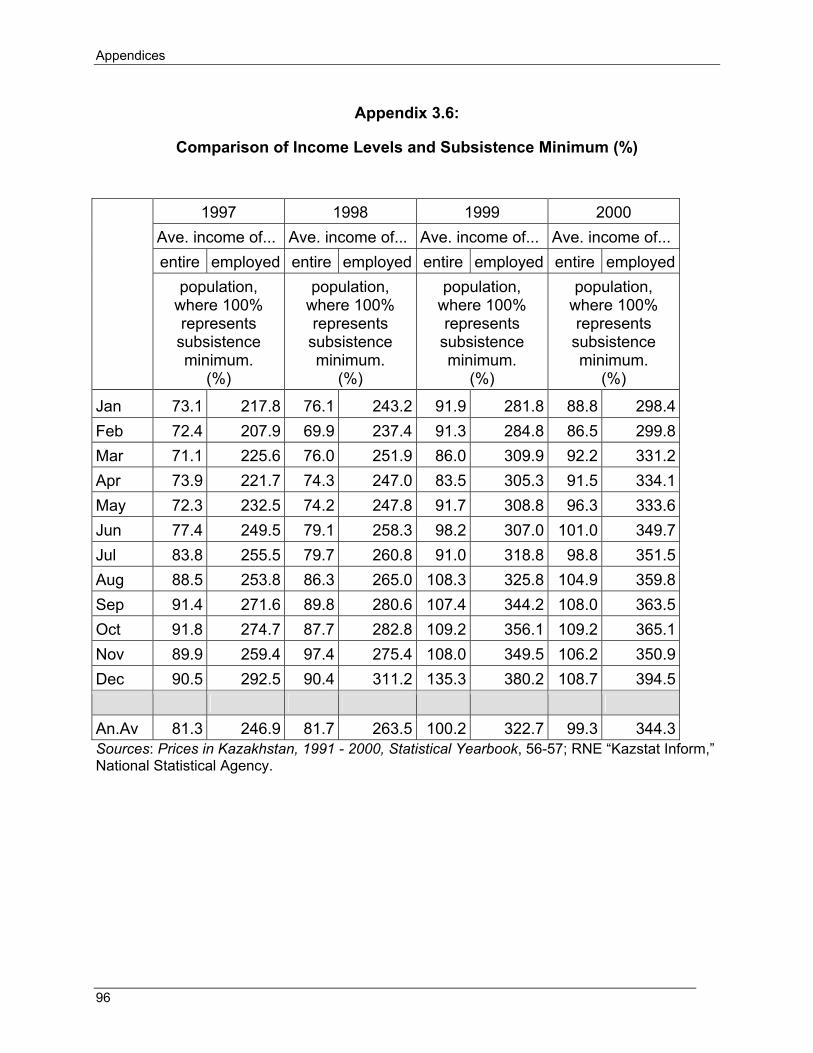
Appendices
96
Appendix 3.6:
Comparison of Income Levels and Subsistence Minimum (%)
1997 1998 1999 2000 Ave. income of... Ave. income of... Ave. income of... Ave. income of...entire employed entire employed entire employed entire employed
population, where 100% represents
subsistence minimum.
(%)
population, where 100% represents
subsistence minimum.
(%)
population, where 100% represents
subsistence minimum.
(%)
population, where 100% represents
subsistence minimum.
(%)
Jan 73.1 217.8 76.1 243.2 91.9 281.8 88.8 298.4Feb 72.4 207.9 69.9 237.4 91.3 284.8 86.5 299.8Mar 71.1 225.6 76.0 251.9 86.0 309.9 92.2 331.2Apr 73.9 221.7 74.3 247.0 83.5 305.3 91.5 334.1May 72.3 232.5 74.2 247.8 91.7 308.8 96.3 333.6Jun 77.4 249.5 79.1 258.3 98.2 307.0 101.0 349.7Jul 83.8 255.5 79.7 260.8 91.0 318.8 98.8 351.5Aug 88.5 253.8 86.3 265.0 108.3 325.8 104.9 359.8Sep 91.4 271.6 89.8 280.6 107.4 344.2 108.0 363.5Oct 91.8 274.7 87.7 282.8 109.2 356.1 109.2 365.1Nov 89.9 259.4 97.4 275.4 108.0 349.5 106.2 350.9Dec 90.5 292.5 90.4 311.2 135.3 380.2 108.7 394.5 An.Av 81.3 246.9 81.7 263.5 100.2 322.7 99.3 344.3Sources: Prices in Kazakhstan, 1991 - 2000, Statistical Yearbook, 56-57; RNE “Kazstat Inform,” National Statistical Agency.
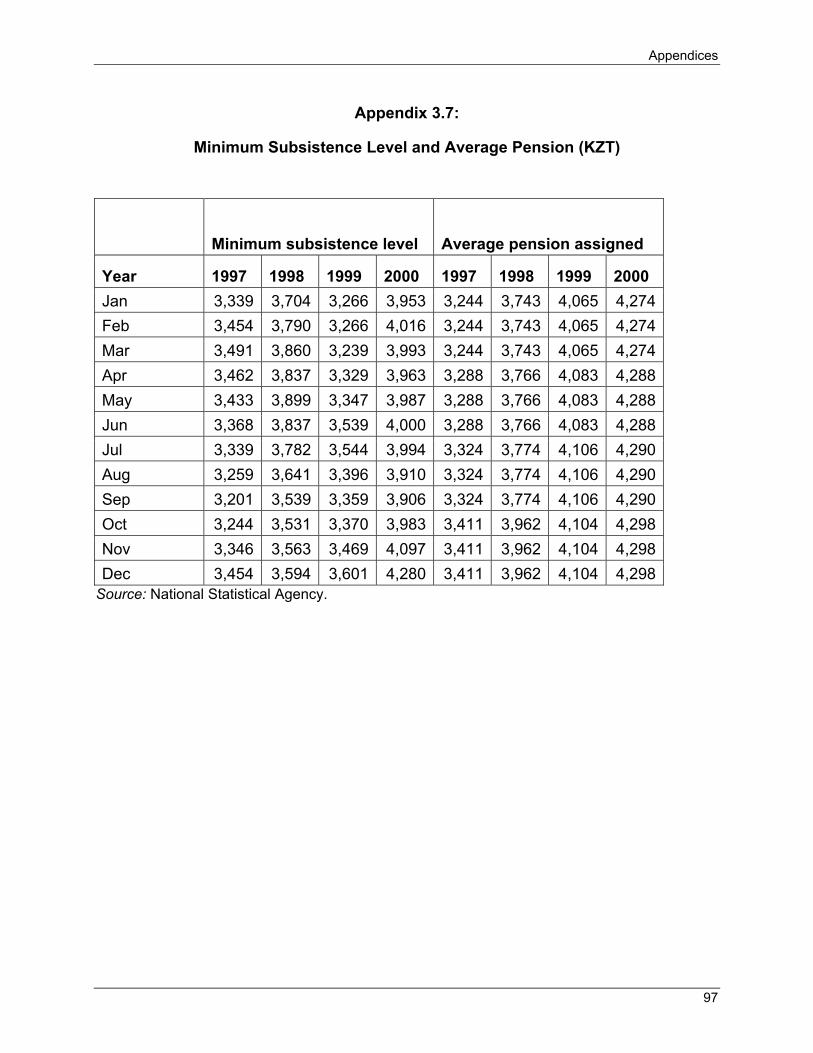
Appendices
97
Appendix 3.7:
Minimum Subsistence Level and Average Pension (KZT)
Minimum subsistence level Average pension assigned
Year 1997 1998 1999 2000 1997 1998 1999 2000 Jan 3,339 3,704 3,266 3,953 3,244 3,743 4,065 4,274Feb 3,454 3,790 3,266 4,016 3,244 3,743 4,065 4,274Mar 3,491 3,860 3,239 3,993 3,244 3,743 4,065 4,274Apr 3,462 3,837 3,329 3,963 3,288 3,766 4,083 4,288May 3,433 3,899 3,347 3,987 3,288 3,766 4,083 4,288Jun 3,368 3,837 3,539 4,000 3,288 3,766 4,083 4,288Jul 3,339 3,782 3,544 3,994 3,324 3,774 4,106 4,290Aug 3,259 3,641 3,396 3,910 3,324 3,774 4,106 4,290Sep 3,201 3,539 3,359 3,906 3,324 3,774 4,106 4,290Oct 3,244 3,531 3,370 3,983 3,411 3,962 4,104 4,298Nov 3,346 3,563 3,469 4,097 3,411 3,962 4,104 4,298Dec 3,454 3,594 3,601 4,280 3,411 3,962 4,104 4,298
Source: National Statistical Agency.
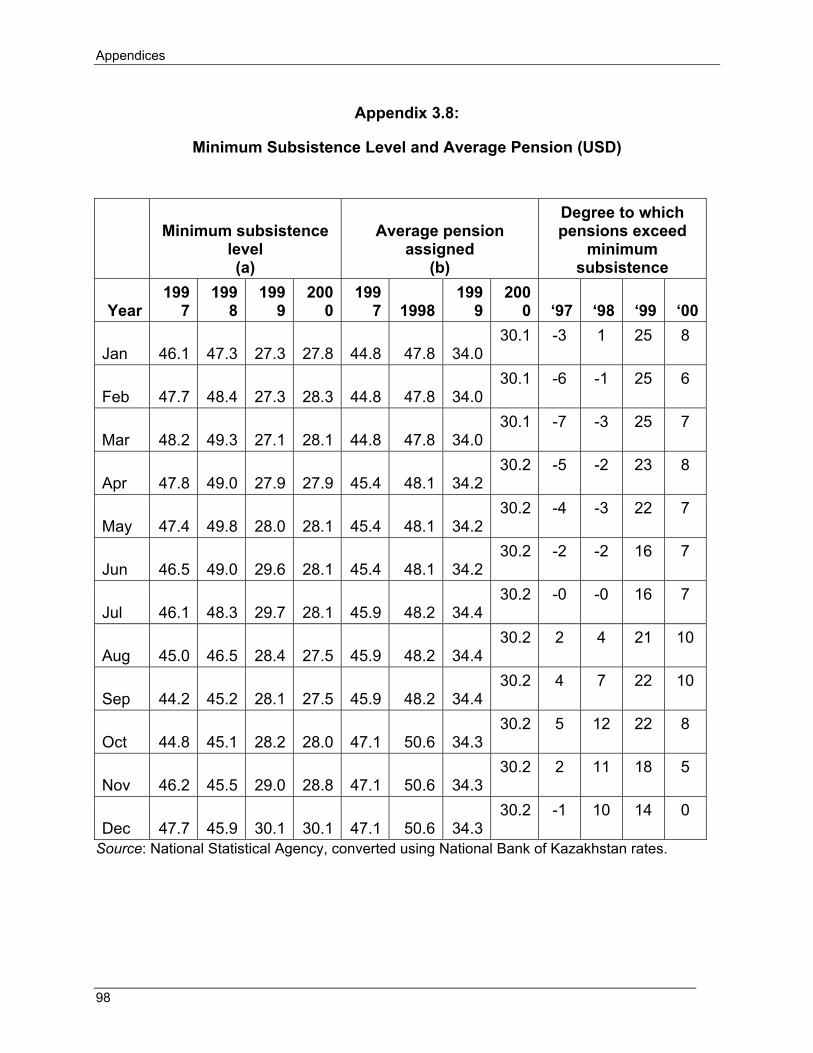
Appendices
98
Appendix 3.8:
Minimum Subsistence Level and Average Pension (USD)
Minimum subsistence level (a)
Average pension assigned
(b)
Degree to which pensions exceed
minimum subsistence
Year 199
7 199
8 199
9 200
0199
7 1998199
9200
0 ‘97 ‘98 ‘99 ‘00
Jan
46.1 47.3 27.3 27.8 44.8 47.8 34.030.1 -3 1 25 8
Feb
47.7 48.4 27.3 28.3 44.8 47.8 34.030.1 -6 -1 25 6
Mar
48.2 49.3 27.1 28.1 44.8 47.8 34.030.1 -7 -3 25 7
Apr
47.8 49.0 27.9 27.9 45.4 48.1 34.230.2 -5 -2 23 8
May
47.4 49.8 28.0 28.1 45.4 48.1 34.230.2 -4 -3 22 7
Jun
46.5 49.0 29.6 28.1 45.4 48.1 34.230.2 -2 -2 16 7
Jul
46.1 48.3 29.7 28.1 45.9 48.2 34.430.2 -0 -0 16 7
Aug
45.0 46.5 28.4 27.5 45.9 48.2 34.430.2 2 4 21 10
Sep
44.2 45.2 28.1 27.5 45.9 48.2 34.430.2 4 7 22 10
Oct
44.8 45.1 28.2 28.0 47.1 50.6 34.330.2 5 12 22 8
Nov
46.2 45.5 29.0 28.8 47.1 50.6 34.330.2 2 11 18 5
Dec
47.7 45.9 30.1 30.1 47.1 50.6 34.330.2 -1 10 14 0
Source: National Statistical Agency, converted using National Bank of Kazakhstan rates.
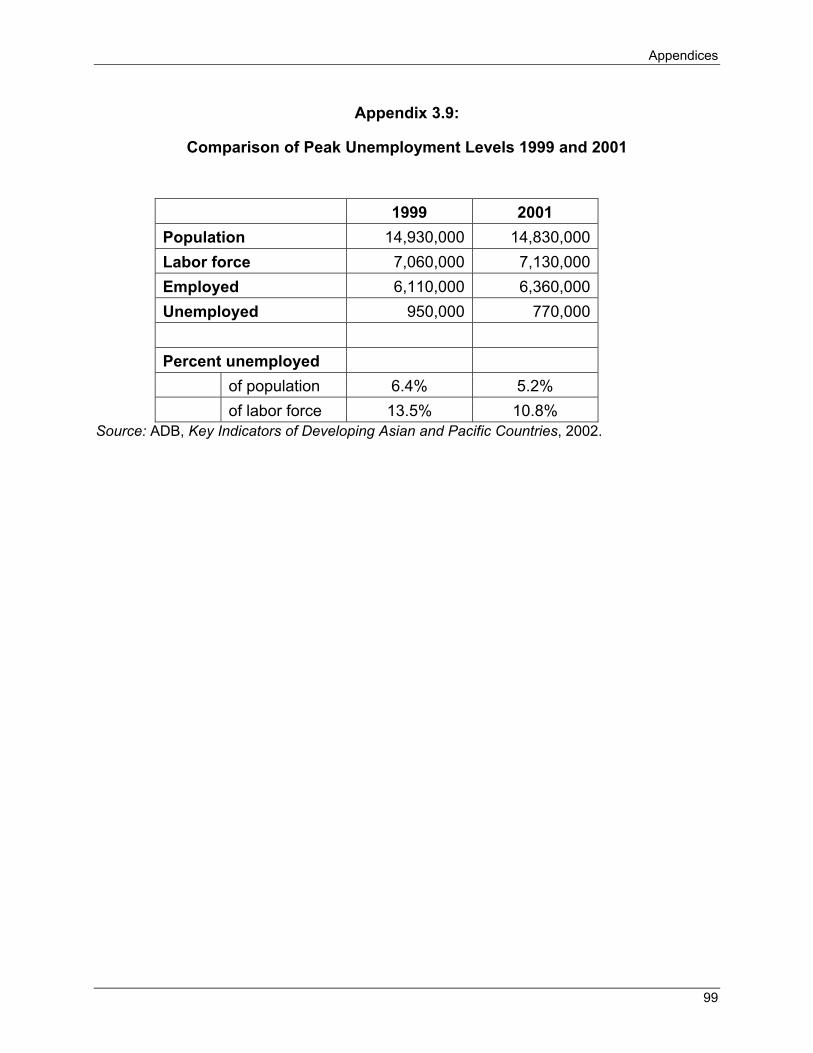
Appendices
99
Appendix 3.9:
Comparison of Peak Unemployment Levels 1999 and 2001
1999 2001 Population 14,930,000 14,830,000 Labor force 7,060,000 7,130,000 Employed 6,110,000 6,360,000 Unemployed 950,000 770,000
Percent unemployed
of population 6.4% 5.2% of labor force 13.5% 10.8%
Source: ADB, Key Indicators of Developing Asian and Pacific Countries, 2002.

Appendices
100
Appendix 4.1:
Urban Heating, Gas and Hot Water Connections, 1997, 1999 (%)
1997 (%)
1999 (%)
District heatin
g
Gas Hot water
District heating
Gas Hot water
Akmola Oblast 63 89 50 38 62 30 Aktobe Oblast 71 96 67 65 87 52 Almaty Oblast 66 92 50 53 94 39 Atirau Oblast 72 79 59 74 90 63 Eastern Kazakhstan O 70 51 58 71 54 61 Zhambyl Oblast 77 98 44 78 98 49 Western Kazakhstan O 89 94 81 92 95 82 Karaganda Oblast 78 52 53 86 62 57 Kostanai Oblast 84 97 65 84 86 59 Kzylorda Oblast 28 72 6 25 55 19 Mangistau Oblast 88 90 82 87 84 84 Pavlodar Oblast 92 46 84 91 39 82 Northern Kazakhstan O
65 95 59 60 97 57
Southern Kazakhstan O
55 76 0,5 49 63 0,5
Astana 77 94 74 85 86 78 Almaty 71 92 74 74 92 77
Republic of Kazakhstan
72 76 56 72 74 56
Source: National Agency for Statistics, Regional Statistical Yearbook of Kazakhstan 2001, 111.

Appendices
101
Appendix 4.2:
Rural Heating, Gas and Hot Water Connections, 1997 and 1999 (%)
1997 1999 District
heat Gas Hot
water District
heat Gas Hot
water Akmola Oblast 8 90 0.4 6 67 1Aktobe Oblast 6 77 1 5 47 1Almaty Oblast 13 93 3 1 85 0.2Atirau Oblast 16 48 0.2 15 59 2Eastern Kazakhstan O 9 49 4 6 57 4Zhambyl Oblast 1 98 0.1 0.5 68 0.2Western Kazakhstan O 1 98 0.1 2 96 0.4Karaganda Oblast 4 42 1 7 31 1Kostanai Oblast 11 82 1 4 68 0.1Kzylorda Oblast 0.1 21 1 0.1 20 -Mangistau Oblast 8 28 0.1 16 36 -Pavlodar Oblast 7 62 0.5 6 69 2Northern Kazakhstan O
9 83 0.4 2 97 0.2
Southern Kazakhstan O
3 47 - 3 33 -
Astana 8 90 0.4 6 67 1Almaty 6 77 1 5 47 1Republic of Kazakhstan
7 72 1 4 63 1
Source: National Agency for Statistics, Regional Statistical Yearbook of Kazakhstan 2001, 112.
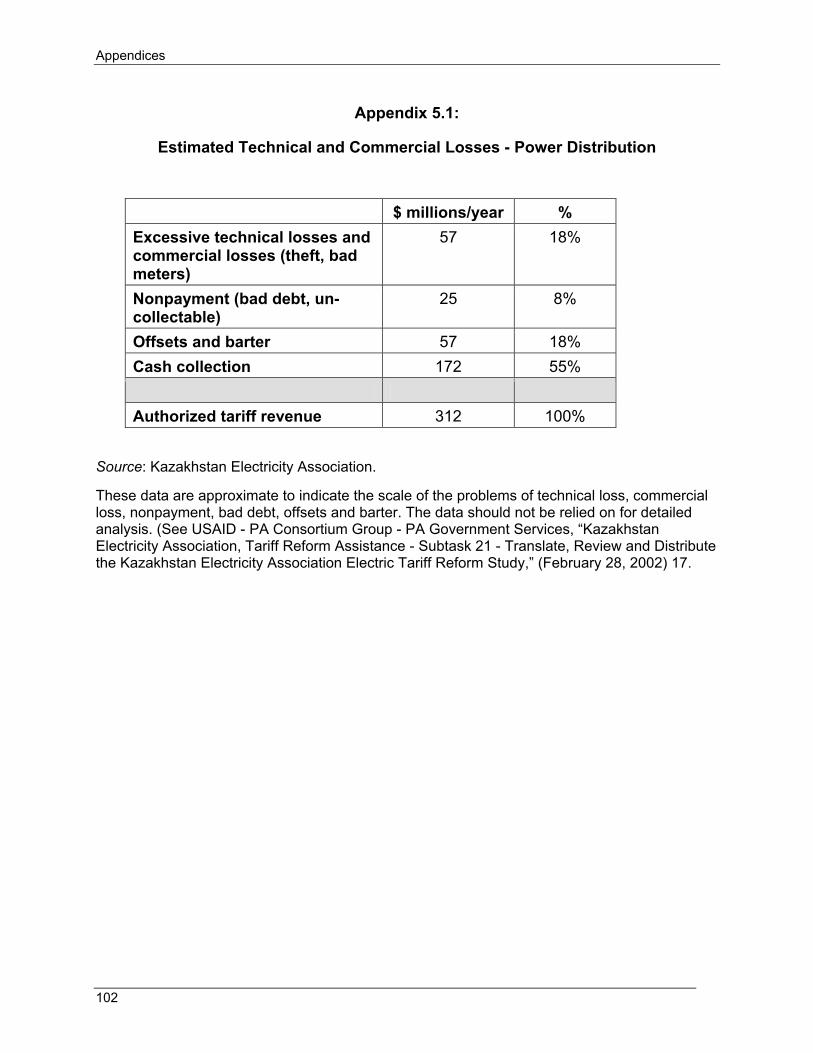
Appendices
102
Appendix 5.1:
Estimated Technical and Commercial Losses - Power Distribution
$ millions/year % Excessive technical losses and commercial losses (theft, bad meters)
57 18%
Nonpayment (bad debt, un-collectable)
25 8%
Offsets and barter 57 18% Cash collection 172 55% Authorized tariff revenue 312 100%
Source: Kazakhstan Electricity Association.
These data are approximate to indicate the scale of the problems of technical loss, commercial loss, nonpayment, bad debt, offsets and barter. The data should not be relied on for detailed analysis. (See USAID - PA Consortium Group - PA Government Services, “Kazakhstan Electricity Association, Tariff Reform Assistance - Subtask 21 - Translate, Review and Distribute the Kazakhstan Electricity Association Electric Tariff Reform Study,” (February 28, 2002) 17.

Appendices
103
Appendix 5.2:
Power Transmission Tariffs 1997 - 2002 (KZT)
Two-part transmission tariff from October 1997 ‘Flat fee’
KZT/KWh ‘Distance fee’ KZT/kWh/km
October 1997 0.00251 0.00051 Three-part transmission tariff introduced April 2000 ‘Distance fee’
‘Traffic control’
KZT/kWh
‘Flat fee’
KZT/kWh
Up to 600 km
KZT/kWh/km
Over 600 km
KZT/kWH
1st April 2000 0.031 0.22 0.00051 0.306 13th Dec.
2000 0.029 0.22 0.00051 0.306
1st July 2001 0.029 0.238 0.00077 0.462 Source: Energy Charter Secretariat, 2002.
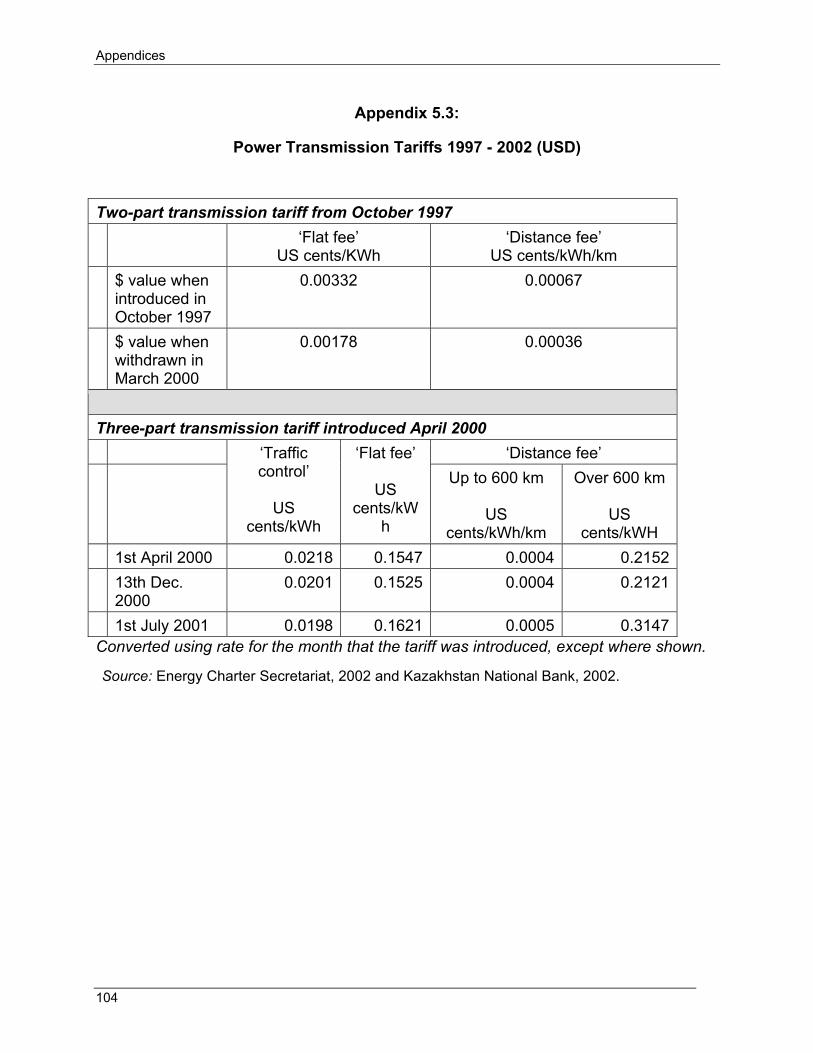
Appendices
104
Appendix 5.3:
Power Transmission Tariffs 1997 - 2002 (USD)
Two-part transmission tariff from October 1997 ‘Flat fee’
US cents/KWh ‘Distance fee’
US cents/kWh/km $ value when
introduced in October 1997
0.00332 0.00067
$ value when withdrawn in March 2000
0.00178 0.00036
Three-part transmission tariff introduced April 2000 ‘Distance fee’
‘Traffic control’
US
cents/kWh
‘Flat fee’
US cents/kW
h
Up to 600 km
US cents/kWh/km
Over 600 km
US cents/kWH
1st April 2000 0.0218 0.1547 0.0004 0.2152 13th Dec.
2000 0.0201 0.1525 0.0004 0.2121
1st July 2001 0.0198 0.1621 0.0005 0.3147Converted using rate for the month that the tariff was introduced, except where shown.
Source: Energy Charter Secretariat, 2002 and Kazakhstan National Bank, 2002.

Appendices
105
Appendix 5.4:
Electricity Prices - Industrial, Average, Household, by REC 1997 – 1999
Electricity prices - industrial, average and household - by REC, 1997 - 1999. Household Household Oblast or city, and
REC Month Ind. Ave
. excl. VAT
incl. VAT
Ind. Ave. excl
VAT incl VAT
KZT/kWh
KZT/$
US cents/kWh Astana city JSC Astana
Gorset
Oct 97 2.89 2.85 2.41 2.89 75.6 3.8 3.8 3.2 3.8 Feb 98 3.57 3.32 2.66 3.19 76.4 4.7 4.3 3.5 4.2 Jul 98 3.20 3.20 3.20 3.84 77.2 4.1 4.1 4.1 5.0 Jan 99 3.20 3.20 3.20 3.84 84.3 3.8 3.8 3.8 4.6 Apr 99 3.20 3.20 3.20 3.84 110.
32.9 2.9 2.9 3.5
Jul 99 3.20 3.20 3.20 3.84 132.2
2.4 2.4 2.4 2.9
Akmola Akmola REC Oct 97 2.89 2.85 2.41 2.89 75.6 3.8 3.8 3.2 3.8 Feb 98 3.57 3.32 2.66 3.19 76.4 4.7 4.3 3.5 4.2 Jul 98 3.61 3.53 3.33 4.00 77.2 4.7 4.6 4.3 5.2 Jan 99 3.61 3.53 3.33 4.00 84.3 4.3 4.2 4.0 4.7 Apr 99 3.61 3.53 3.33 4.00 110.
33.3 3.2 3.0 3.6
Jul 99 3.61 3.53 3.33 4.00 132.2
2.7 2.7 2.5 3.0

Appendices
106
Electricity prices - industrial, average and household - by REC, 1997 - 1999. Household Household Oblast or city, and
REC Month Ind. Ave
. excl. VAT
incl. VAT
Ind. Ave. excl.
VAT incl. VAT
KZT/kWh
KZT / $
US cents/kWh Aktyube OJSC
Aktyubenergo
Nov 97 4.20 2.53 3.50 4.20 75.6 5.6 3.3 4.6 5.6 Jan 98 4.20 2.99 3.50 4.20 76.0 5.5 3.9 4.6 5.5 Jul 98 4.20 3.32 3.50 4.20 77.2 5.4 4.3 4.5 5.4 Sep 98 4.03 3.20 3.50 4.20 79.3 5.1 4.0 4.4 5.3 Jan 99 4.03 3.20 3.50 4.20 84.3 4.8 3.8 4.2 5.0 May 99 4.10 3.82 4.00 4.80 118.
73.5 3.2 3.4 4.0
Jul 99 4.10 3.82 4.00 4.80 132.2
3.1 2.9 3.0 3.6
Almaty City APC Oct 97 3.75 3.50 3.33 4.00 75.6 5.0 4.6 4.4 5.3 Jan 98 3.75 3.50 3.33 4.00 76.0 4.9 4.6 4.4 5.3 Feb 98 3.75 3.50 3.33 4.00 76.4 4.9 4.6 4.4 5.2 Jul 98 3.75 3.50 3.33 4.00 77.2 Jan 99 3.75 3.50 3.33 4.00 84.3 4.4 4.2 4.0 4.7 Apr 99 3.75 3.50 3.33 4.00 110.
33.4 3.2 3.0 3.6
Jul 99 3.75 3.50 3.33 4.00 132.2
2.8 2.6 2.5 3.0
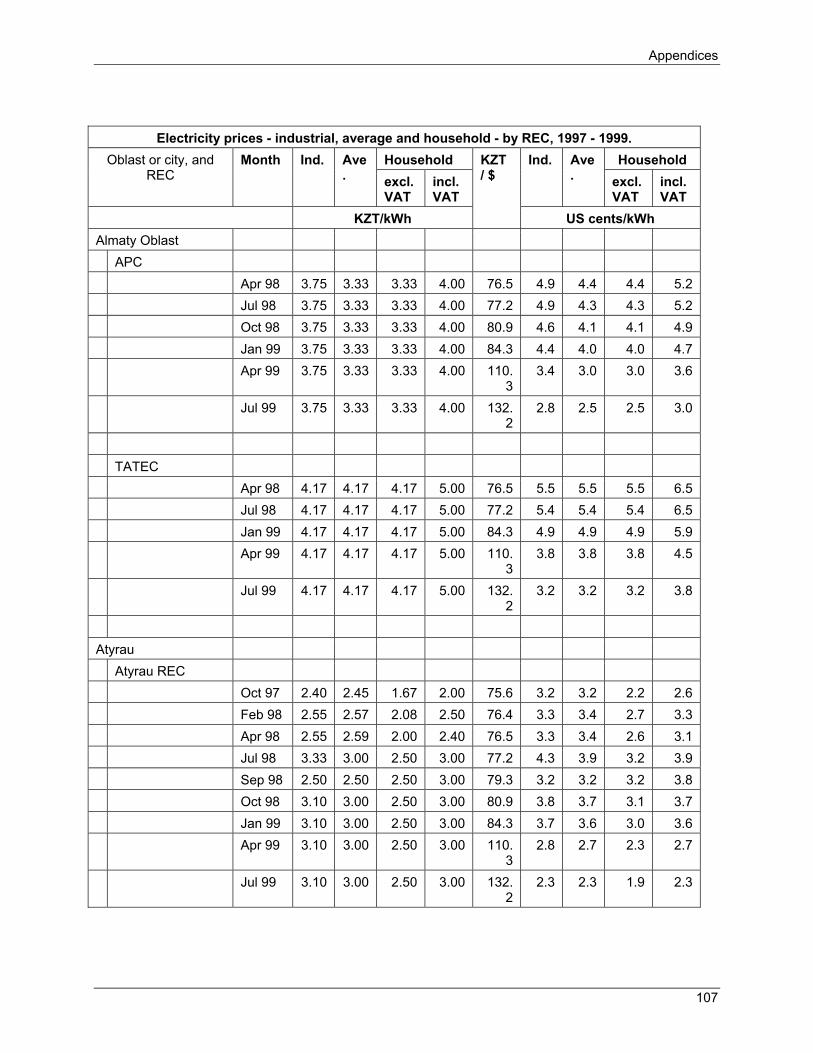
Appendices
107
Electricity prices - industrial, average and household - by REC, 1997 - 1999. Household Household Oblast or city, and
REC Month Ind. Ave
. excl. VAT
incl. VAT
Ind. Ave. excl.
VAT incl. VAT
KZT/kWh
KZT / $
US cents/kWh Almaty Oblast APC Apr 98 3.75 3.33 3.33 4.00 76.5 4.9 4.4 4.4 5.2 Jul 98 3.75 3.33 3.33 4.00 77.2 4.9 4.3 4.3 5.2 Oct 98 3.75 3.33 3.33 4.00 80.9 4.6 4.1 4.1 4.9 Jan 99 3.75 3.33 3.33 4.00 84.3 4.4 4.0 4.0 4.7 Apr 99 3.75 3.33 3.33 4.00 110.
33.4 3.0 3.0 3.6
Jul 99 3.75 3.33 3.33 4.00 132.2
2.8 2.5 2.5 3.0
TATEC Apr 98 4.17 4.17 4.17 5.00 76.5 5.5 5.5 5.5 6.5 Jul 98 4.17 4.17 4.17 5.00 77.2 5.4 5.4 5.4 6.5 Jan 99 4.17 4.17 4.17 5.00 84.3 4.9 4.9 4.9 5.9 Apr 99 4.17 4.17 4.17 5.00 110.
33.8 3.8 3.8 4.5
Jul 99 4.17 4.17 4.17 5.00 132.2
3.2 3.2 3.2 3.8
Atyrau Atyrau REC Oct 97 2.40 2.45 1.67 2.00 75.6 3.2 3.2 2.2 2.6 Feb 98 2.55 2.57 2.08 2.50 76.4 3.3 3.4 2.7 3.3 Apr 98 2.55 2.59 2.00 2.40 76.5 3.3 3.4 2.6 3.1 Jul 98 3.33 3.00 2.50 3.00 77.2 4.3 3.9 3.2 3.9 Sep 98 2.50 2.50 2.50 3.00 79.3 3.2 3.2 3.2 3.8 Oct 98 3.10 3.00 2.50 3.00 80.9 3.8 3.7 3.1 3.7 Jan 99 3.10 3.00 2.50 3.00 84.3 3.7 3.6 3.0 3.6 Apr 99 3.10 3.00 2.50 3.00 110.
32.8 2.7 2.3 2.7
Jul 99 3.10 3.00 2.50 3.00 132.2
2.3 2.3 1.9 2.3

Appendices
108
Electricity prices - industrial, average and household - by REC, 1997 - 1999. Household Household Oblast or city, and
REC Month Ind. Ave
. excl. VAT
incl. VAT
Ind. Ave. excl.
VAT incl. VAT
KZT/kWh
KZT / $
US cents/kWh East Kazakhstan REC Altaienergo Oct 97 2.55 1.93 1.93 2.31 75.6 3.4 2.6 2.6 3.1 Feb 98 2.22 2.12 2.12 2.54 76.4 2.9 2.8 2.8 3.3 Apr 98 2.22 2.12 2.12 2.54 76.5 2.9 2.8 2.8 3.3 Jul 98 2.28 2.25 2.25 2.70 77.2 3.0 2.9 2.9 3.5 Oct 98 2.28 2.25 2.25 2.70 80.9 2.8 2.8 2.8 3.3 Jan 99 2.28 2.25 2.25 2.70 84.3 2.7 2.7 2.7 3.2 Apr 99 2.28 2.25 2.25 2.70 110.
32.1 2.0 2.0 2.4
Jul 99 2.28 2.25 2.25 2.70 132.2
1.7 1.7 1.7 2.0
Semipalatinsk
RESes
May 98 2.81 2.54 2.12 2.54 76.6 3.7 3.3 2.8 3.3 Jul 98 3.75 3.18 2.25 2.70 77.2 4.9 4.1 2.9 3.5 Sep 98 2.78 2.81 2.25 2.70 79.3 3.5 3.5 2.8 3.4 Oct 98 2.78 2.70 2.25 2.70 80.9 3.4 3.3 2.8 3.3 Jan 99 2.78 2.70 2.25 2.70 84.3 3.3 3.2 2.7 3.2 Apr 99 2.78 2.70 2.25 2.70 110.
32.5 2.4 2.0 2.4
Jul 99 2.78 2.70 2.25 2.70 132.2
2.1 2.0 1.7 2.0
JSC Ayaguselektroseti
Jul ‘98 3.92 3.39 2.25 2.70 77.2 5.1 4.4 2.9 3.5 Oct ‘98 3.92 3.39 2.25 2.70 80.9 4.8 4.2 2.8 3.3 Dec
‘98 3.80 3.03 2.25 2.70 83.3 4.6 3.6 2.7 3.2
Jan ‘99 3.80 3.03 2.25 2.70 84.3 4.5 3.6 2.7 3.2 Apr ‘99 3.80 3.03 2.25 2.70 110.
33.4 2.7 2.0 2.4
Jul ‘99 3.80 3.03 2.25 2.70 132.2
2.9 2.3 1.7 2.0
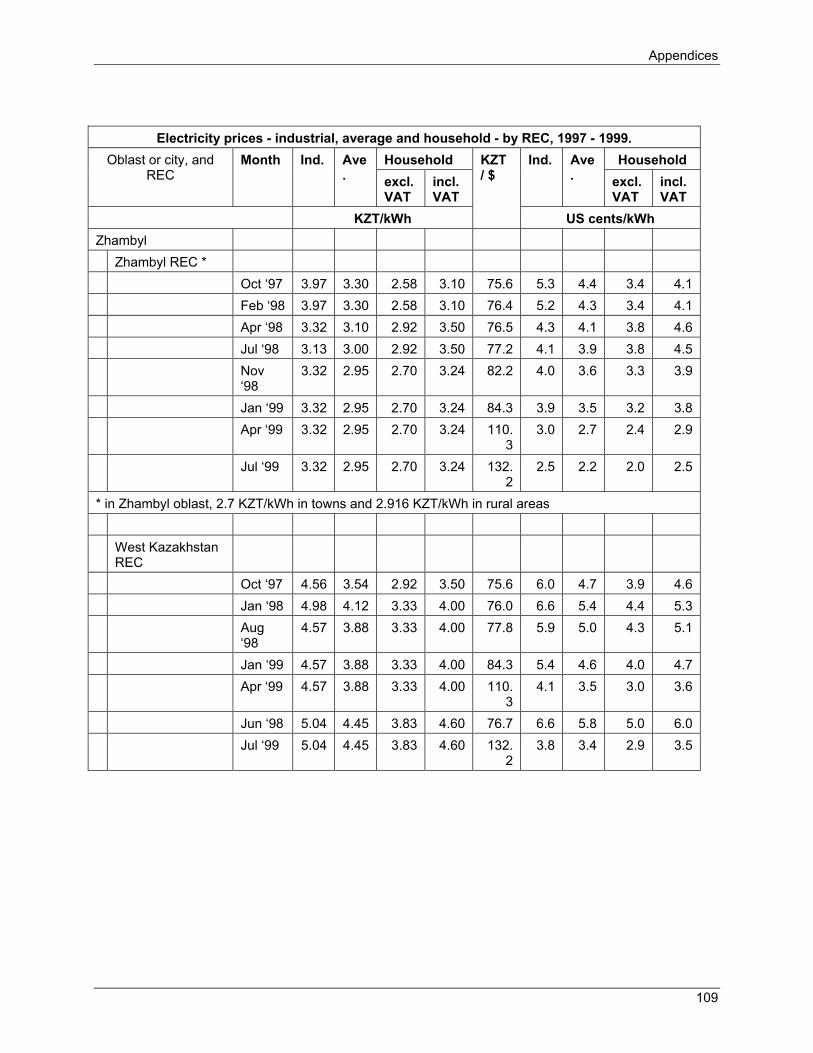
Appendices
109
Electricity prices - industrial, average and household - by REC, 1997 - 1999. Household Household Oblast or city, and
REC Month Ind. Ave
. excl. VAT
incl. VAT
Ind. Ave. excl.
VAT incl. VAT
KZT/kWh
KZT / $
US cents/kWh Zhambyl Zhambyl REC * Oct ‘97 3.97 3.30 2.58 3.10 75.6 5.3 4.4 3.4 4.1 Feb ‘98 3.97 3.30 2.58 3.10 76.4 5.2 4.3 3.4 4.1 Apr ‘98 3.32 3.10 2.92 3.50 76.5 4.3 4.1 3.8 4.6 Jul ‘98 3.13 3.00 2.92 3.50 77.2 4.1 3.9 3.8 4.5 Nov
‘98 3.32 2.95 2.70 3.24 82.2 4.0 3.6 3.3 3.9
Jan ‘99 3.32 2.95 2.70 3.24 84.3 3.9 3.5 3.2 3.8 Apr ‘99 3.32 2.95 2.70 3.24 110.
33.0 2.7 2.4 2.9
Jul ‘99 3.32 2.95 2.70 3.24 132.2
2.5 2.2 2.0 2.5
* in Zhambyl oblast, 2.7 KZT/kWh in towns and 2.916 KZT/kWh in rural areas West Kazakhstan
REC
Oct ‘97 4.56 3.54 2.92 3.50 75.6 6.0 4.7 3.9 4.6 Jan ‘98 4.98 4.12 3.33 4.00 76.0 6.6 5.4 4.4 5.3 Aug
‘98 4.57 3.88 3.33 4.00 77.8 5.9 5.0 4.3 5.1
Jan ‘99 4.57 3.88 3.33 4.00 84.3 5.4 4.6 4.0 4.7 Apr ‘99 4.57 3.88 3.33 4.00 110.
34.1 3.5 3.0 3.6
Jun ‘98 5.04 4.45 3.83 4.60 76.7 6.6 5.8 5.0 6.0 Jul ‘99 5.04 4.45 3.83 4.60 132.
23.8 3.4 2.9 3.5

Appendices
110
Electricity prices - industrial, average and household - by REC, 1997 - 1999. Household Household Oblast or city, and
REC Month Ind. Ave
. excl. VAT
incl. VAT
Ind. Ave. excl.
VAT incl. VAT
KZT/kWh
KZT / $
US cents/kWh Karaganda Karaganda REC Oct ‘97 3.40 2.47 2.50 3.00 75.6 4.5 3.3 3.3 4.0 Jan ‘98 3.54 2.58 2.50 3.00 76.0 4.7 3.4 3.3 3.9 Apr ‘98 1.77 2.13 2.50 3.00 76.5 2.3 2.8 3.3 3.9 Jul ‘98 1.67 2.06 2.50 3.00 77.2 2.2 2.7 3.2 3.9 Oct ‘98 2.26 2.37 2.50 3.00 80.9 2.8 2.9 3.1 3.7 Jan ‘99 2.26 2.37 2.50 3.00 84.3 2.7 2.8 3.0 3.6 Apr ‘99 2.42 2.44 2.50 3.00 110.
32.2 2.2 2.3 2.7
Jul ‘99 2.42 2.44 2.50 3.00 132.2
1.8 1.8 1.9 2.3
LLC Karaganda
Distribution
Apr ‘99 1.98 2.06 2.50 3.00 110.3
1.8 1.9 2.3 2.7
Jul ‘99 3.01 2.92 2.50 3.00 132.2
2.3 2.2 1.9 2.3
Zheskasgan REC Jan ‘98 2.50 2.34 2.50 3.00 76.0 3.3 3.1 3.3 3.9 Jul ‘98 2.30 2.24 2.00 2.40 77.2 3.0 2.9 2.6 3.1 Oct ‘98 2.30 2.18 2.00 2.40 80.9 2.8 2.7 2.5 3.0 Jan ‘99 2.30 2.18 2.00 2.40 84.3 2.7 2.6 2.4 2.8 Apr ‘99 2.30 2.18 2.00 2.40 110.
32.1 2.0 1.8 2.2
Jul ‘99 2.30 2.18 2.00 2.40 132.2
1.7 1.6 1.5 1.8

Appendices
111
Electricity prices - industrial, average and household - by REC, 1997 - 1999. Household Household Oblast or city, and
REC Month Ind. Ave
. excl. VAT
incl. VAT
Ind. Ave. excl.
VAT incl. VAT
KZT/kWh
KZT / $
US cents/kWh Kzylorda Kzylorda REC Oct ‘97 4.06 4.06 4.06 4.87 75.6 5.4 5.4 5.4 6.4 Jan ‘98 4.06 4.06 4.06 4.87 76.0 5.3 5.3 5.3 6.4 Jul ‘98 4.22 4.22 4.22 5.06 77.2 5.5 5.5 5.5 6.6 Jan ‘99 4.22 4.22 4.22 5.06 84.3 5.0 5.0 5.0 6.0 Apr ‘99 4.22 4.22 4.22 5.06 110.
33.8 3.8 3.8 4.6
Jul ‘99 4.22 4.22 4.22 5.06 132.2
3.2 3.2 3.2 3.8
Kostanay Kostanai REC Oct ‘97 3.76 3.57 2.50 3.00 75.6 5.0 4.7 3.3 4.0 Jan ‘98 4.00 3.69 3.00 3.60 76.0 5.3 4.9 3.9 4.7 Apr ‘98 4.00 3.69 3.33 4.00 76.5 5.2 4.8 4.4 5.2 Jul ‘98 4.00 3.92 3.67 4.40 77.2 5.2 5.1 4.8 5.7 Oct ‘98 3.50 3.50 3.50 4.20 80.9 4.3 4.3 4.3 5.2 Jan ‘99 3.50 3.50 3.50 4.20 84.3 4.2 4.2 4.2 5.0 Apr ‘99 3.50 3.50 3.50 4.20 110.
33.2 3.2 3.2 3.8
Jul ‘99 3.50 3.50 3.50 4.20 132.2
2.6 2.6 2.6 3.2

Appendices
112
Electricity prices - industrial, average and household - by REC, 1997 - 1999. Household Household Oblast or city, and
REC Month Ind. Ave
. excl. VAT
incl. VAT
Ind. Ave. excl.
VAT incl. VAT
KZT/kWh
KZT / $
US cents/kWh Mangistau Mangistau REC Oct ‘97 2.86 2.63 2.63 3.16 75.6 3.8 3.5 3.5 4.2 Jan ‘98 3.15 3.27 3.27 3.92 76.0 4.1 4.3 4.3 5.2 Mar ‘98 3.01 3.01 3.01 3.61 76.4 3.9 3.9 3.9 4.7 Apr ‘98 2.92 2.92 2.92 3.50 76.5 3.8 3.8 3.8 4.6 Jul ‘98 2.96 2.92 2.96 3.55 77.2 3.8 3.8 3.8 4.6 Aug
‘98 2.80 2.80 2.80 3.36 77.8 3.6 3.6 3.6 4.3
Oct ‘98 2.79 2.79 2.79 3.35 80.9 3.4 3.4 3.4 4.1 Jan ‘99 2.79 2.79 2.79 3.35 84.3 3.3 3.3 3.3 4.0 Apr ‘99 2.79 2.79 2.79 3.35 110.
32.5 2.5 2.5 3.0
Jul ‘99 2.91 2.91 2.79 3.49 132.2
2.2 2.2 2.1 2.6
Pavlodar Pavlodar REC Oct ‘97 2.00 2.00 2.00 2.40 75.6 2.6 2.6 2.6 3.2 Jan ‘98 2.29 2.29 2.29 2.75 76.0 3.0 3.0 3.0 3.6 Apr ‘98 2.15 2.15 2.15 2.58 76.5 2.8 2.8 2.8 3.4 Jul ‘98 2.15 2.15 2.15 2.58 77.2 2.8 2.8 2.8 3.3 Jan ‘99 2.15 2.15 2.15 2.58 84.3 2.6 2.6 2.6 3.1 Apr ‘99 2.15 2.15 2.15 2.58 110.
31.9 1.9 1.9 2.3
Jul ‘99 2.15 2.15 2.15 2.58 132.2
1.6 1.6 1.6 2.0
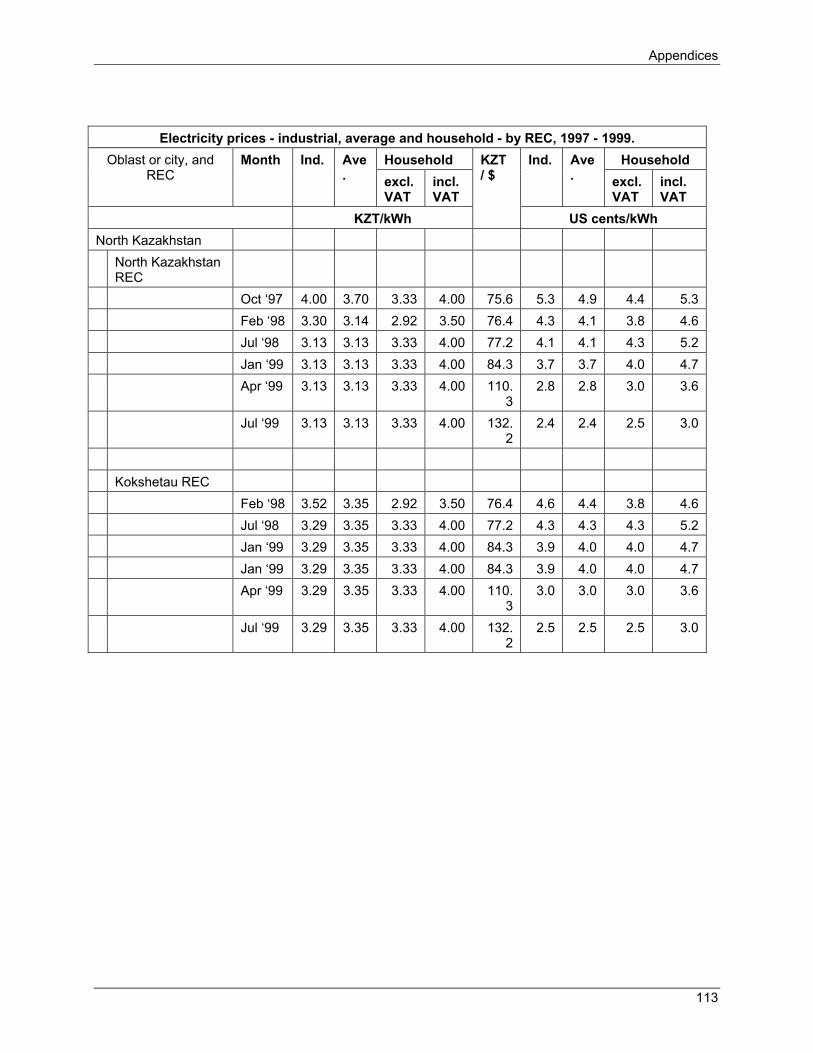
Appendices
113
Electricity prices - industrial, average and household - by REC, 1997 - 1999. Household Household Oblast or city, and
REC Month Ind. Ave
. excl. VAT
incl. VAT
Ind. Ave. excl.
VAT incl. VAT
KZT/kWh
KZT / $
US cents/kWh North Kazakhstan North Kazakhstan
REC
Oct ‘97 4.00 3.70 3.33 4.00 75.6 5.3 4.9 4.4 5.3 Feb ‘98 3.30 3.14 2.92 3.50 76.4 4.3 4.1 3.8 4.6 Jul ‘98 3.13 3.13 3.33 4.00 77.2 4.1 4.1 4.3 5.2 Jan ‘99 3.13 3.13 3.33 4.00 84.3 3.7 3.7 4.0 4.7 Apr ‘99 3.13 3.13 3.33 4.00 110.
32.8 2.8 3.0 3.6
Jul ‘99 3.13 3.13 3.33 4.00 132.2
2.4 2.4 2.5 3.0
Kokshetau REC Feb ‘98 3.52 3.35 2.92 3.50 76.4 4.6 4.4 3.8 4.6 Jul ‘98 3.29 3.35 3.33 4.00 77.2 4.3 4.3 4.3 5.2 Jan ‘99 3.29 3.35 3.33 4.00 84.3 3.9 4.0 4.0 4.7 Jan ‘99 3.29 3.35 3.33 4.00 84.3 3.9 4.0 4.0 4.7 Apr ‘99 3.29 3.35 3.33 4.00 110.
33.0 3.0 3.0 3.6
Jul ‘99 3.29 3.35 3.33 4.00 132.2
2.5 2.5 2.5 3.0

Appendices
114
Electricity prices - industrial, average and household - by REC, 1997 - 1999. Household Household Oblast or city, and
REC Month Ind. Ave
. excl. VAT
incl. VAT
Ind. Ave. excl.
VAT incl. VAT
KZT/kWh
KZT / $
US cents/kWh South Kazakhstan CJSC Energosbyt Nov
‘97 3.25 3.21 3.21 3.85 75.6 4.3 4.2 4.2 5.1
Jan ‘98 3.25 3.21 3.21 3.85 76.0 4.3 4.2 4.2 5.1 Apr ‘98 3.25 3.21 3.21 3.85 76.5 4.2 4.2 4.2 5.0 Jul ‘98 3.25 3.21 3.21 3.85 77.2 4.2 4.2 4.2 5.0 LLP Energopulse Oct ‘98 3.75 3.75 3.75 4.50 80.9 4.6 4.6 4.6 5.6 Jan ‘99 3.75 3.75 3.75 4.50 84.3 4.4 4.4 4.4 5.3 Apr ‘99 3.75 3.75 3.75 4.50 110.
33.4 3.4 3.4 4.1
Jul ‘99 3.75 3.75 3.75 4.50 132.2
2.8 2.8 2.8 3.4
Kontur & KT LLC Oct ‘98 3.25 3.21 3.85 80.9 4.0 0.0 4.0 4.8 Jan ‘99 3.25 3.21 3.85 84.3 3.9 0.0 3.8 4.6 Apr ‘99 3.25 3.21 3.21 3.85 110.
32.9 2.9 2.9 3.5
Jul ‘99 3.25 3.21 3.21 3.85 132.2
2.5 2.4 2.4 2.9
Source: Ministry of Education and Science of the Republic of Kazakhstan Almaty Institute of Power and Communication, Tariff Policy Development in Regional Electric Network Companies in Regard to the Priorities in the Economy of the Oblasts of the Republic of Kazakhstan, August 18, 2000.
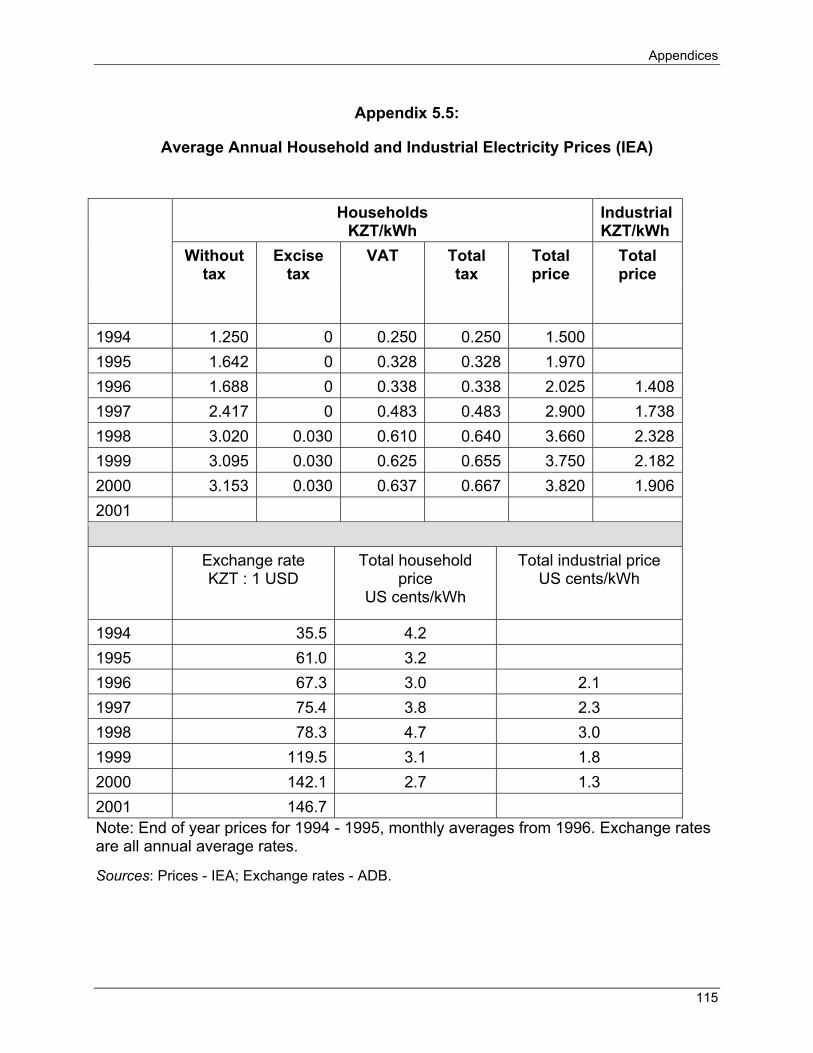
Appendices
115
Appendix 5.5:
Average Annual Household and Industrial Electricity Prices (IEA)
Households KZT/kWh
Industrial KZT/kWh
Without tax
Excise tax
VAT Total tax
Total price
Total price
1994 1.250 0 0.250 0.250 1.500 1995 1.642 0 0.328 0.328 1.970 1996 1.688 0 0.338 0.338 2.025 1.4081997 2.417 0 0.483 0.483 2.900 1.7381998 3.020 0.030 0.610 0.640 3.660 2.3281999 3.095 0.030 0.625 0.655 3.750 2.1822000 3.153 0.030 0.637 0.667 3.820 1.9062001 Exchange rate
KZT : 1 USD Total household
price US cents/kWh
Total industrial price US cents/kWh
1994 35.5 4.2 1995 61.0 3.2 1996 67.3 3.0 2.1 1997 75.4 3.8 2.3 1998 78.3 4.7 3.0 1999 119.5 3.1 1.8 2000 142.1 2.7 1.3 2001 146.7Note: End of year prices for 1994 - 1995, monthly averages from 1996. Exchange rates are all annual average rates.
Sources: Prices - IEA; Exchange rates - ADB.
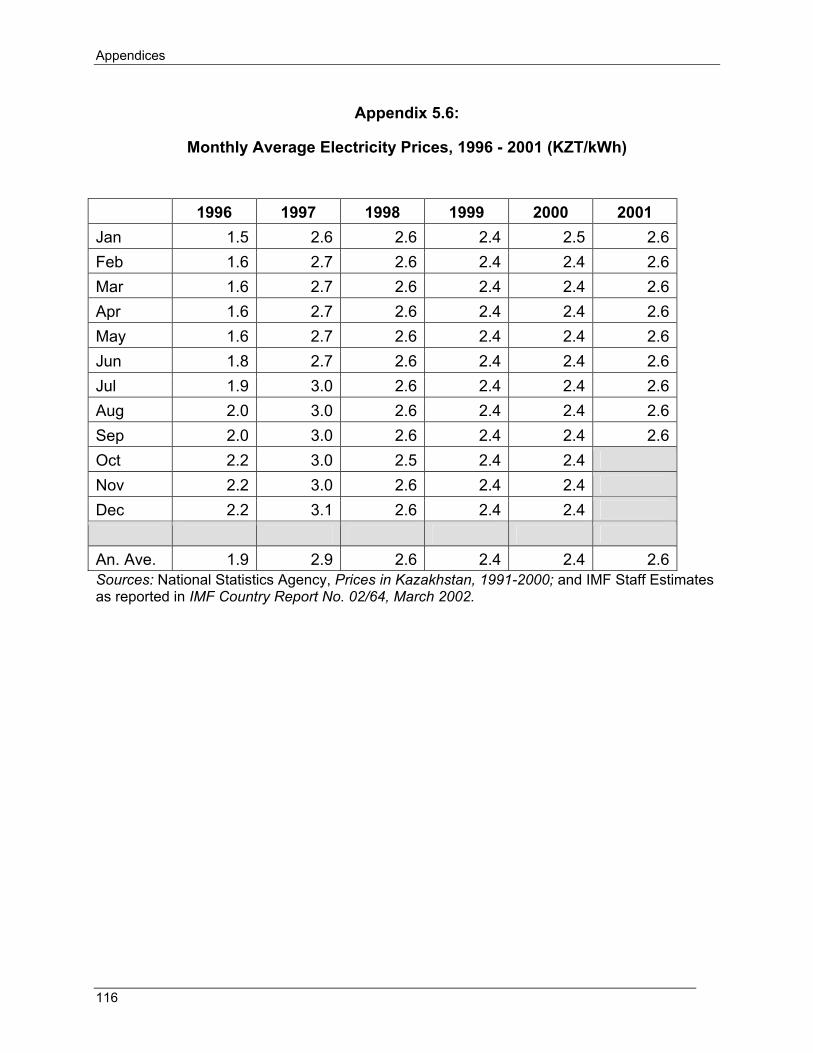
Appendices
116
Appendix 5.6:
Monthly Average Electricity Prices, 1996 - 2001 (KZT/kWh)
1996 1997 1998 1999 2000 2001 Jan 1.5 2.6 2.6 2.4 2.5 2.6Feb 1.6 2.7 2.6 2.4 2.4 2.6Mar 1.6 2.7 2.6 2.4 2.4 2.6Apr 1.6 2.7 2.6 2.4 2.4 2.6May 1.6 2.7 2.6 2.4 2.4 2.6Jun 1.8 2.7 2.6 2.4 2.4 2.6Jul 1.9 3.0 2.6 2.4 2.4 2.6Aug 2.0 3.0 2.6 2.4 2.4 2.6Sep 2.0 3.0 2.6 2.4 2.4 2.6Oct 2.2 3.0 2.5 2.4 2.4 Nov 2.2 3.0 2.6 2.4 2.4 Dec 2.2 3.1 2.6 2.4 2.4 An. Ave. 1.9 2.9 2.6 2.4 2.4 2.6Sources: National Statistics Agency, Prices in Kazakhstan, 1991-2000; and IMF Staff Estimates as reported in IMF Country Report No. 02/64, March 2002.
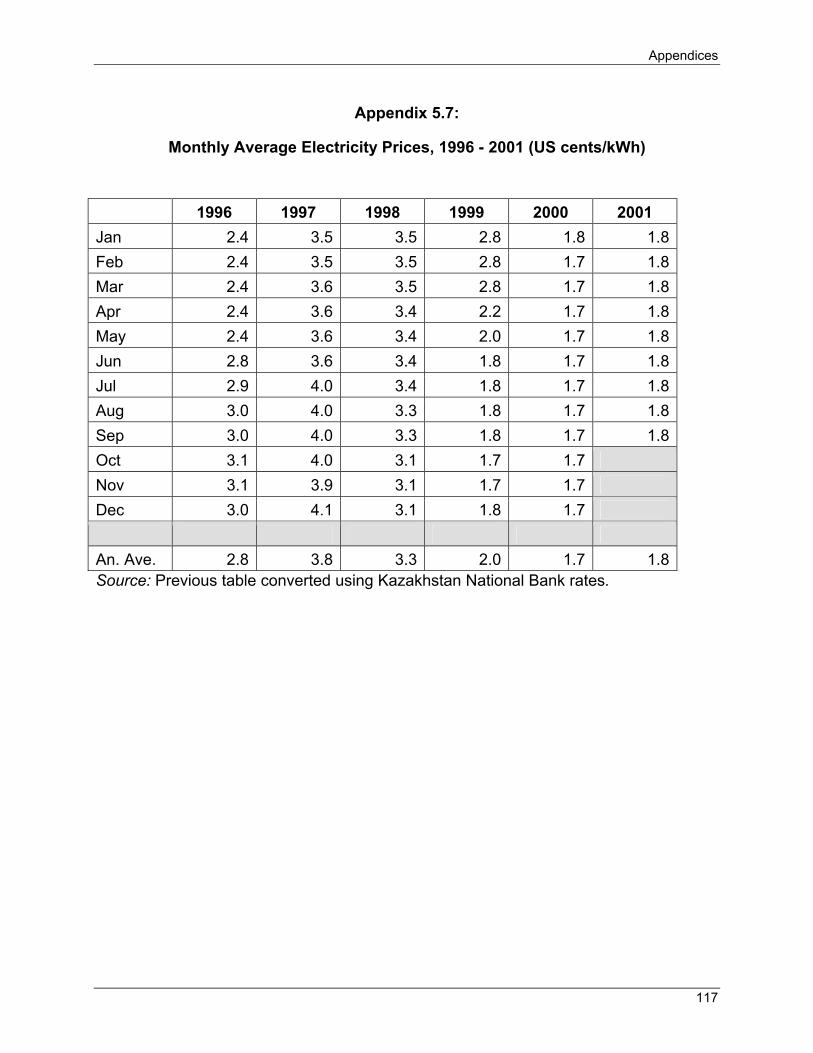
Appendices
117
Appendix 5.7:
Monthly Average Electricity Prices, 1996 - 2001 (US cents/kWh)
1996 1997 1998 1999 2000 2001 Jan 2.4 3.5 3.5 2.8 1.8 1.8Feb 2.4 3.5 3.5 2.8 1.7 1.8Mar 2.4 3.6 3.5 2.8 1.7 1.8Apr 2.4 3.6 3.4 2.2 1.7 1.8May 2.4 3.6 3.4 2.0 1.7 1.8Jun 2.8 3.6 3.4 1.8 1.7 1.8Jul 2.9 4.0 3.4 1.8 1.7 1.8Aug 3.0 4.0 3.3 1.8 1.7 1.8Sep 3.0 4.0 3.3 1.8 1.7 1.8Oct 3.1 4.0 3.1 1.7 1.7 Nov 3.1 3.9 3.1 1.7 1.7 Dec 3.0 4.1 3.1 1.8 1.7 An. Ave. 2.8 3.8 3.3 2.0 1.7 1.8Source: Previous table converted using Kazakhstan National Bank rates.
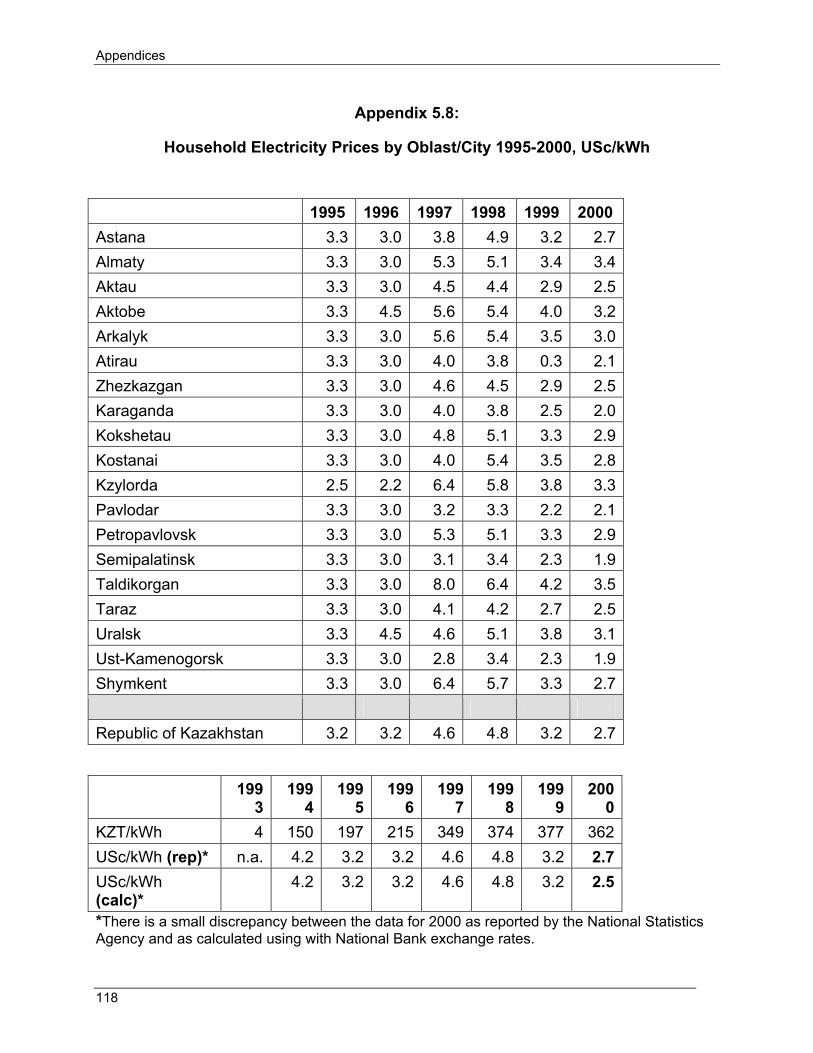
Appendices
118
Appendix 5.8:
Household Electricity Prices by Oblast/City 1995-2000, USc/kWh
1995 1996 1997 1998 1999 2000 Astana 3.3 3.0 3.8 4.9 3.2 2.7 Almaty 3.3 3.0 5.3 5.1 3.4 3.4 Aktau 3.3 3.0 4.5 4.4 2.9 2.5 Aktobe 3.3 4.5 5.6 5.4 4.0 3.2 Arkalyk 3.3 3.0 5.6 5.4 3.5 3.0 Atirau 3.3 3.0 4.0 3.8 0.3 2.1 Zhezkazgan 3.3 3.0 4.6 4.5 2.9 2.5 Karaganda 3.3 3.0 4.0 3.8 2.5 2.0 Kokshetau 3.3 3.0 4.8 5.1 3.3 2.9 Kostanai 3.3 3.0 4.0 5.4 3.5 2.8 Kzylorda 2.5 2.2 6.4 5.8 3.8 3.3 Pavlodar 3.3 3.0 3.2 3.3 2.2 2.1 Petropavlovsk 3.3 3.0 5.3 5.1 3.3 2.9 Semipalatinsk 3.3 3.0 3.1 3.4 2.3 1.9 Taldikorgan 3.3 3.0 8.0 6.4 4.2 3.5 Taraz 3.3 3.0 4.1 4.2 2.7 2.5 Uralsk 3.3 4.5 4.6 5.1 3.8 3.1 Ust-Kamenogorsk 3.3 3.0 2.8 3.4 2.3 1.9 Shymkent 3.3 3.0 6.4 5.7 3.3 2.7 Republic of Kazakhstan 3.2 3.2 4.6 4.8 3.2 2.7
1993
1994
1995
1996
1997
1998
1999
2000
KZT/kWh 4 150 197 215 349 374 377 362 USc/kWh (rep)* n.a. 4.2 3.2 3.2 4.6 4.8 3.2 2.7 USc/kWh (calc)*
4.2 3.2 3.2 4.6 4.8 3.2 2.5
*There is a small discrepancy between the data for 2000 as reported by the National Statistics Agency and as calculated using with National Bank exchange rates.

Appendices
119
Source: Prices in Kazakhstan, Statistical Yearbook, 55.

Appendices
120
Appendix 5.9:
Monthly Average District Heating Prices, 1996 - 2001 (KZT/Gcal)
1996 1997 1998 1999 2000 2001 Jan 744 1,117 1,185 1,138 1,234 1,423Feb 748 1,097 1,186 1,138 1,235 1,423Mar 754 1,097 1,186 1,139 1,234 1,423Apr 765 1,131 1,170 1,134 1,236 1,421May 838 1,094 1,168 1,138 1,236 1,421Jun 843 1,094 1,168 1,142 1,236 1,421Jul 837 1,092 1,128 1,160 1,238 1,427Aug 842 1,080 1,128 1,163 1,238 1,427Sep 843 1,082 1,120 1,163 1,238 1,427Oct 968 1,235 1,108 1,161 1,272 -Nov 1,008 1,235 1,095 1,159 1,271 -Dec 1,010 1,252 1,095 1,159 1,271 - An. Ave. 850 1,134 1,145 1,150 1,245 1,424Sources: National Statistical Agency; IMF staff estimates.
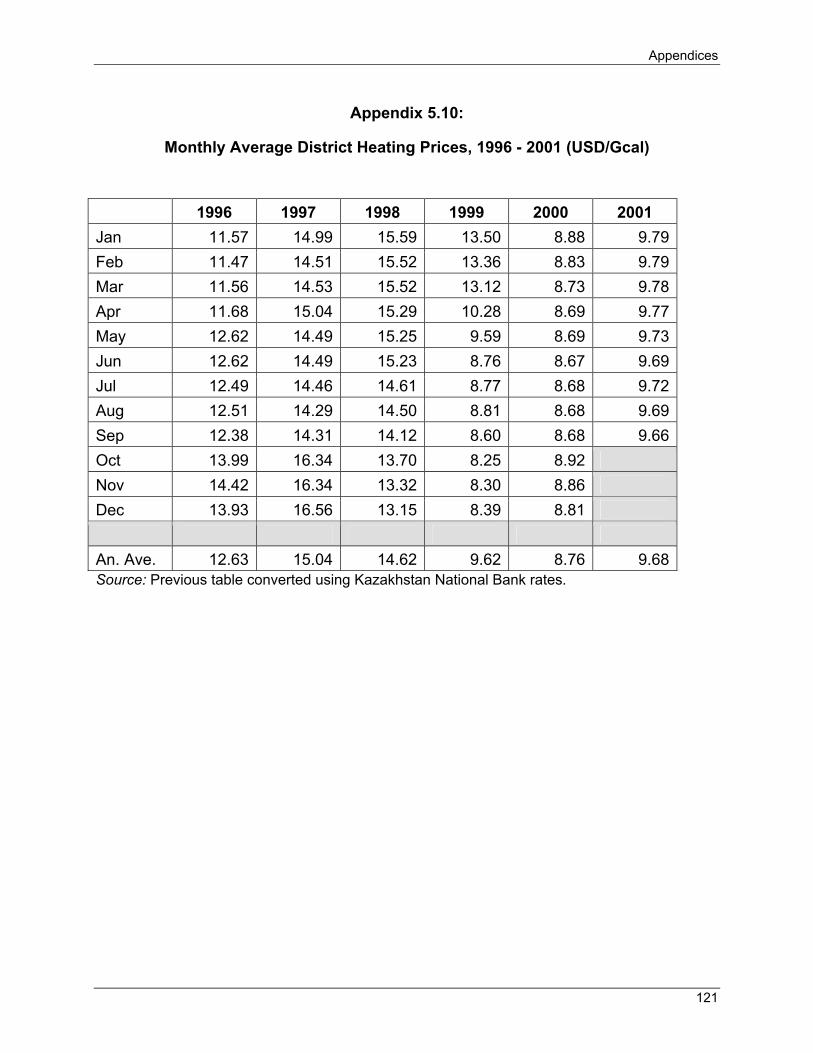
Appendices
121
Appendix 5.10:
Monthly Average District Heating Prices, 1996 - 2001 (USD/Gcal)
1996 1997 1998 1999 2000 2001 Jan 11.57 14.99 15.59 13.50 8.88 9.79Feb 11.47 14.51 15.52 13.36 8.83 9.79Mar 11.56 14.53 15.52 13.12 8.73 9.78Apr 11.68 15.04 15.29 10.28 8.69 9.77May 12.62 14.49 15.25 9.59 8.69 9.73Jun 12.62 14.49 15.23 8.76 8.67 9.69Jul 12.49 14.46 14.61 8.77 8.68 9.72Aug 12.51 14.29 14.50 8.81 8.68 9.69Sep 12.38 14.31 14.12 8.60 8.68 9.66Oct 13.99 16.34 13.70 8.25 8.92 Nov 14.42 16.34 13.32 8.30 8.86 Dec 13.93 16.56 13.15 8.39 8.81 An. Ave. 12.63 15.04 14.62 9.62 8.76 9.68Source: Previous table converted using Kazakhstan National Bank rates.
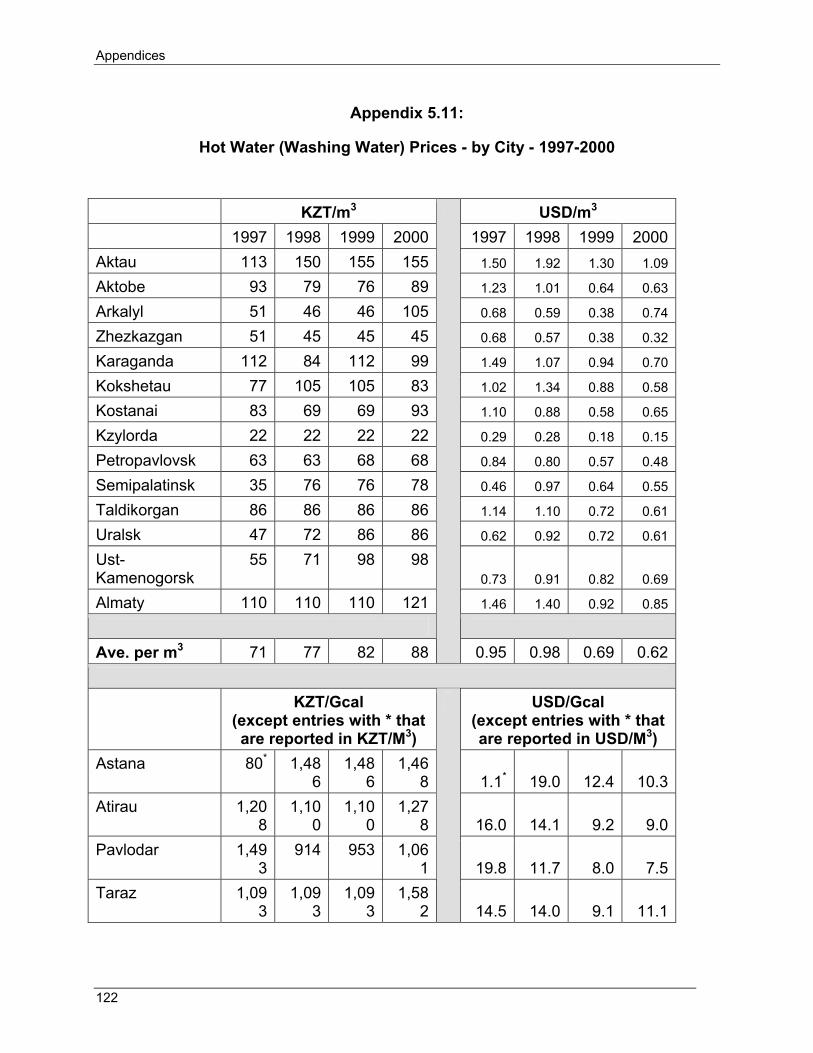
Appendices
122
Appendix 5.11:
Hot Water (Washing Water) Prices - by City - 1997-2000
KZT/m3 USD/m3 1997 1998 1999 2000 1997 1998 1999 2000
Aktau 113 150 155 155 1.50 1.92 1.30 1.09
Aktobe 93 79 76 89 1.23 1.01 0.64 0.63
Arkalyl 51 46 46 105 0.68 0.59 0.38 0.74
Zhezkazgan 51 45 45 45 0.68 0.57 0.38 0.32
Karaganda 112 84 112 99 1.49 1.07 0.94 0.70
Kokshetau 77 105 105 83 1.02 1.34 0.88 0.58
Kostanai 83 69 69 93 1.10 0.88 0.58 0.65
Kzylorda 22 22 22 22 0.29 0.28 0.18 0.15
Petropavlovsk 63 63 68 68 0.84 0.80 0.57 0.48
Semipalatinsk 35 76 76 78 0.46 0.97 0.64 0.55
Taldikorgan 86 86 86 86 1.14 1.10 0.72 0.61
Uralsk 47 72 86 86 0.62 0.92 0.72 0.61
Ust-Kamenogorsk
55 71 98 980.73 0.91 0.82 0.69
Almaty 110 110 110 121 1.46 1.40 0.92 0.85
Ave. per m3 71 77 82 88
0.95 0.98 0.69 0.62
KZT/Gcal (except entries with * that are reported in KZT/M3)
USD/Gcal (except entries with * that are reported in USD/M3)
Astana 80* 1,486
1,486
1,468 1.1* 19.0 12.4 10.3
Atirau 1,208
1,100
1,100
1,278 16.0 14.1 9.2 9.0
Pavlodar 1,493
914 953 1,061 19.8 11.7 8.0 7.5
Taraz 1,093
1,093
1,093
1,582
14.5 14.0 9.1 11.1

Appendices
123
Shymkent 63* 1,116
1,796
110*
0.8* 14.3 15.0 0.8*
Ave. per Gcal 1,265
1,142
1,286
1,347
16.77
14.58
10.76 9.48
Source: Prices in Kazakhstan, Statistical Yearbook, 2001.

Appendices
124
Appendix 5.12:
Household annual average natural gas prices, 1995 - 2000 (KZT/1,000 m3)
Source: Prices in Kazakhstan 1991-2000, page 55, National Statistics Agency
‘95 ‘96 ‘97 ‘98 ‘99 ‘00
Price per cubic meter, tenge 2 4 4 4 6 6
Tenge/USD (National Bank) 60.9 67.3 75.4 78.3 119.5 142.1
USD/000 cubic meters 33 59 53 51 50 42

Appendices
125
Appendix 5.13:
Natural Gas Prices by Oblast/City, 1997-2000, (USD/1,000m3)
1997 1998 1999 2000 2001 Almaty 67.49 62.58 80.00 65.73 Aktau 40.31 26.56 17.41 15.06 Aktobe 65.77 61.05 52.97 49.26 Taraz 68.28 63.22 59.41 54.89 Kostanai 60.59 63.22 66.95 56.30 Uralsk 34.47 39.72 39.67 28.15 Shymkent 64.04 56.83 63.43 64.74 Republic of Kazakhstan 57.28 53.00 54.23 44.05 Note: Not all oblasts are connected to natural gas networks.
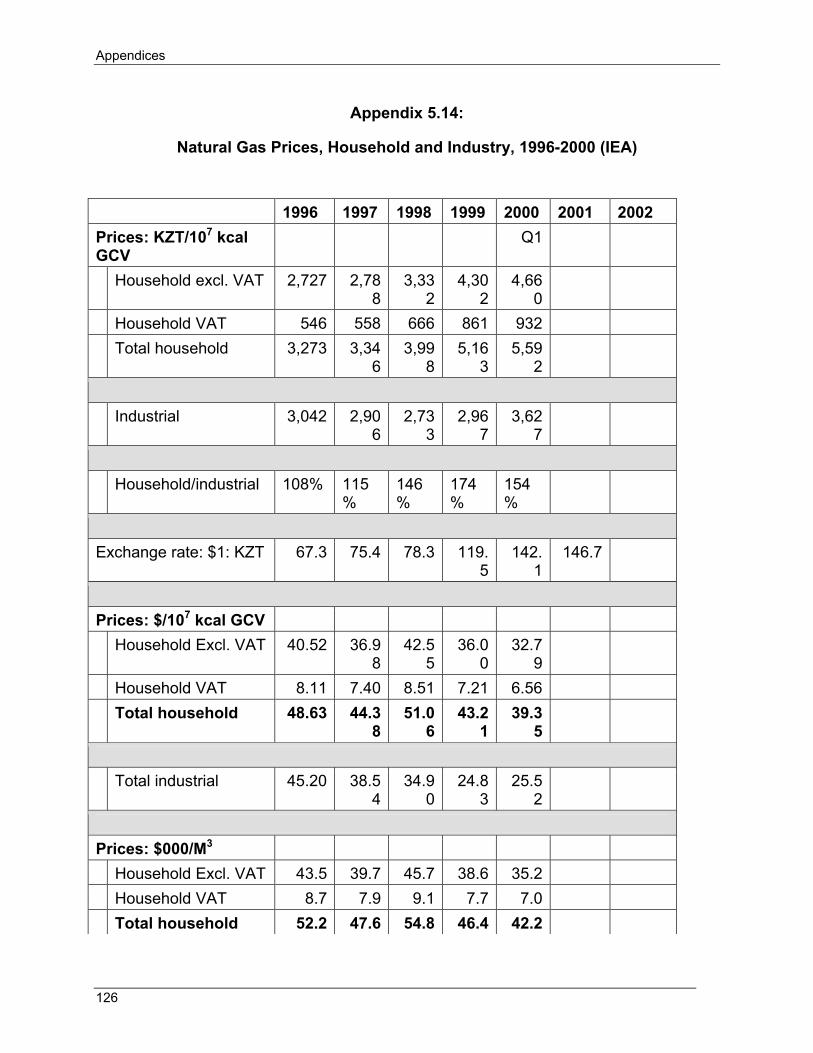
Appendices
126
Appendix 5.14:
Natural Gas Prices, Household and Industry, 1996-2000 (IEA)
1996 1997 1998 1999 2000 2001 2002 Prices: KZT/107 kcal GCV
Q1
Household excl. VAT 2,727 2,788
3,332
4,302
4,660
Household VAT 546 558 666 861 932 Total household 3,273 3,34
63,99
85,16
35,59
2
Industrial 3,042 2,906
2,733
2,967
3,627
Household/industrial 108% 115
% 146%
174%
154%
Exchange rate: $1: KZT 67.3 75.4 78.3 119.
5142.
1146.7
Prices: $/107 kcal GCV Household Excl. VAT 40.52 36.9
842.5
536.0
032.7
9
Household VAT 8.11 7.40 8.51 7.21 6.56 Total household 48.63 44.3
851.0
643.2
139.3
5
Total industrial 45.20 38.5
434.9
024.8
325.5
2
Prices: $000/M3 Household Excl. VAT 43.5 39.7 45.7 38.6 35.2 Household VAT 8.7 7.9 9.1 7.7 7.0 Total household 52.2 47.6 54.8 46.4 42.2

Appendices
127
Total industrial 48.5 41.4 37.4 26.6 27.4 Reconverted into cubic meters using IEA's assumed GCV of 9,320 kcal/m3
Price data for 2000 is for the first quarter only.
Source: IEA Energy Prices and Taxes.

Appendices
128
Appendix 5.15:
LPG Prices 1993-2000 Prices for LPG - per 50 liter bottle.
1993 1994 1995 1996 1997 1998 1999 2000 2001 1st half of 2002
KZT 12* 281 341 413 533 555 632 770 808 797USD n.a. 7.9 5.6 6.1 7.1 7.1 5.3 5.4 5.5 5.2* Datum for 1993 is in Russian rubles. The table is complied from three sources, each of which provided partial data.
Sources: Statistical Yearbook of Kazakhstan 2002, 424; “Price level and dynamics on the household market,” 1997, 124; and Republic of Kazakhstan, Statistical overview, 1999, 39.
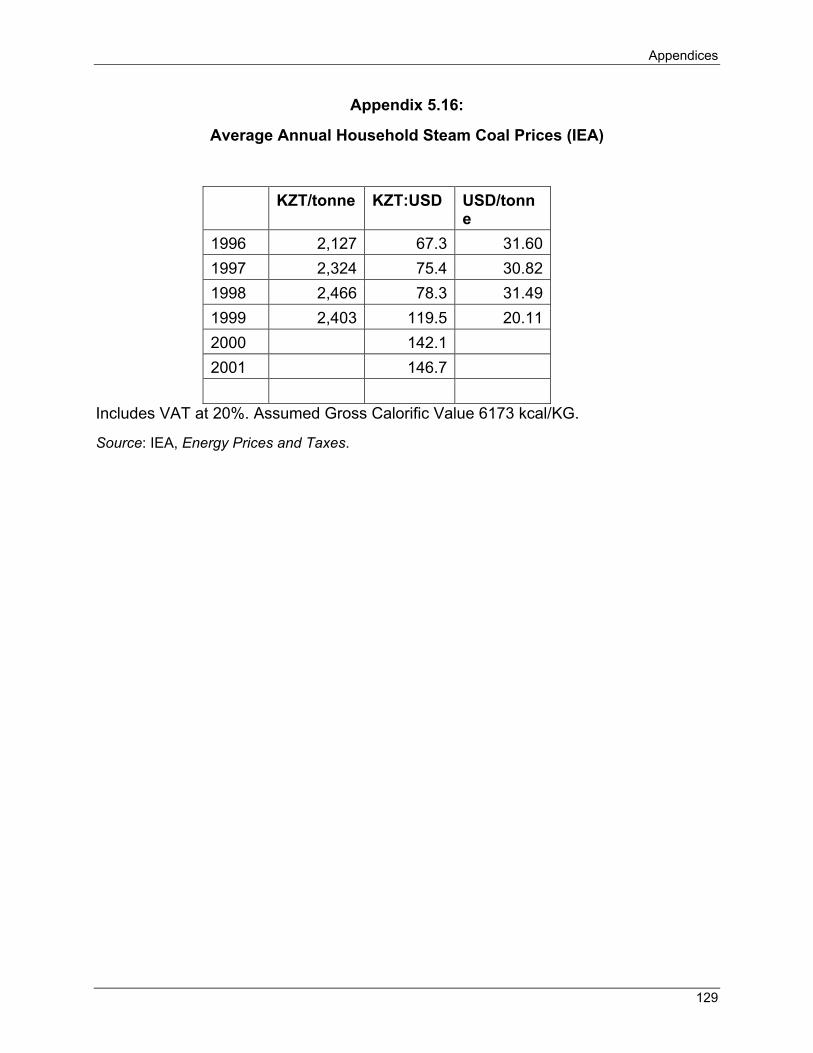
Appendices
129
Appendix 5.16:
Average Annual Household Steam Coal Prices (IEA)
KZT/tonne KZT:USD USD/tonne
1996 2,127 67.3 31.601997 2,324 75.4 30.821998 2,466 78.3 31.491999 2,403 119.5 20.112000 142.12001 146.7
Includes VAT at 20%. Assumed Gross Calorific Value 6173 kcal/KG.
Source: IEA, Energy Prices and Taxes.

Appendices
130
Appendix 6.1:
Energy Reform and Privatization in Kazakhstan
Access to utility services in some of the poorer Akimats23 is low as 56 percent of the population does not have access to at least one basic utility service, and 25 percent not even have running water. Only 44 percent of households have all utilities. The lack of utility services is a strong indicator of poverty.
Kazakhstan has been more aggressive than some other countries in the region in shaking off the collective mentality of the past, rapidly closing loss-making enterprises and embracing market principles. A four-phase privatization program began in 1991 and has brought much of the economy into the private sector. However, private sector growth remains constrained by major impediments that include endemic corruption, excessive government intervention, arbitrary tax enforcement, a small banking sector, weak regulatory frameworks, and a poorly functioning judiciary.
The power generation sector has mostly been privatized, although the privatization process was unplanned, rushed, un-competitive and opaque. Transmission remains in the hands of state-owned KEGOC, which has adopted the role of ‘policeman’ for the sector, disconnecting large consumers—including distribution companies—if they do not pay. Privatization of power distribution has been unsuccessful. A few major international players invested in Kazakh distribution companies and made radical improvements in problematic arrears, such as improving payment collection rates and providing 24/7 power supply, but a combination of regulatory uncertainty and artificially low regulated tariffs prompted these companies to cut their losses and withdraw from Kazakhstan.
Low-income power consumers are generally able to afford electricity prices, which are extremely low as a result of cross-subsidies between residential and industrial customers, together with regulatory control of pricing, resulting in tariffs that are set far below the supply cost. This form of subsidy is universal; it does not target low-income households at all, so richer households, who tend to consume more energy than poor households as they own more appliances and demand higher comfort levels, benefit from the subsidy the most. The high cost of the subsidy means that electricity companies are unable to invest in modernizing the networks, so the quality of electricity supply is low; remote parts of the country are not connected to the network at all, and blackouts and brownouts are commonplace in some areas.
The regulatory regime for the power sector is an area that needs urgent fundamental reform, as it is weak and unstable, resulting in non-cost-reflective tariffs that are too low to support investment. Despite several years of policy dialogue between the government and the international community, as well as substantial technical assistance from USAID and the European Bank for Reconstruction and Development (EBRD), the Anti-monopoly Agency’s24 powers are too weak. The Agency is not very independent
23 Kazakhstan is divided into 16 administrative regions or Akimats, of which 14 are oblasts and the other two, Astana and Almaty, are cities. The head of each Akimat is the Akim and is appointed directly by the President. 24 Energy regulator
Appendices
131
from national political intervention, and, at the local branch level, it has a similar problem. The basic methodology for setting tariffs seriously flawed.
It is expected that the Anti-monopoly Agency will implement in 2003a new tariff methodology that was designed with EBRD technical assistance, but it is not clear that the agency will be able to resist outside intervention in its affairs and successfully implement the new methodology.
Ownership of the district heating companies, which serve about 7 million people or 70 percent of the urban population, was transferred to local governments in 1996. There has been some progress towards system rehabilitation and the introduction of building-level metering in some of the richer areas, but many systems are in a state of crisis and disrepair. There has been no progress at all towards the introduction of household-level metering and control technologies and there are no suppliers of these types of equipment in Kazakhstan.
Some 1.66 million of Kazakhstan’s 4.15 million households are connected to natural gas networks and a further 1.89 million households use LPG. Tractebel of Belgium bought a concession to manage all downstream gas transmission assets in 1997, but withdrew from Kazakhstan in 2000, selling its gas assets to a local company, KazTransGas. The six natural gas distribution companies have not been privatized.