
ENERGY REDUCTION IN AUTOMOTIVE PAINT SHOPS A REVIEW OF HYBRID
108
University of Kentucky UKnowledge University of Kentucky Master's eses Graduate School 2010 ENERGY REDUCTION IN AUTOMOTIVE PAINT SHOPS A REVIEW OF HYBRID/ ELECTRIC VEHICLE BAERY MANUFACTURING Claudia Patricia Arenas Guerrero University of Kentucky, [email protected] Click here to let us know how access to this document benefits you. is esis is brought to you for free and open access by the Graduate School at UKnowledge. It has been accepted for inclusion in University of Kentucky Master's eses by an authorized administrator of UKnowledge. For more information, please contact [email protected]. Recommended Citation Arenas Guerrero, Claudia Patricia, "ENERGY REDUCTION IN AUTOMOTIVE PAINT SHOPS A REVIEW OF HYBRID/ ELECTRIC VEHICLE BAERY MANUFACTURING" (2010). University of Kentucky Master's eses. 65. hps://uknowledge.uky.edu/gradschool_theses/65
Transcript of ENERGY REDUCTION IN AUTOMOTIVE PAINT SHOPS A REVIEW OF HYBRID

University of KentuckyUKnowledge
University of Kentucky Master's Theses Graduate School
2010
ENERGY REDUCTION IN AUTOMOTIVEPAINT SHOPS A REVIEW OF HYBRID/ELECTRIC VEHICLE BATTERYMANUFACTURINGClaudia Patricia Arenas GuerreroUniversity of Kentucky, [email protected]
Click here to let us know how access to this document benefits you.
This Thesis is brought to you for free and open access by the Graduate School at UKnowledge. It has been accepted for inclusion in University ofKentucky Master's Theses by an authorized administrator of UKnowledge. For more information, please contact [email protected].
Recommended CitationArenas Guerrero, Claudia Patricia, "ENERGY REDUCTION IN AUTOMOTIVE PAINT SHOPS A REVIEW OF HYBRID/ELECTRIC VEHICLE BATTERY MANUFACTURING" (2010). University of Kentucky Master's Theses. 65.https://uknowledge.uky.edu/gradschool_theses/65

ABSTRACT OF THESIS
ENERGY REDUCTION IN AUTOMOTIVE PAINT SHOPS AND A REVIEW
OF HYBRID/ELECTRIC VEHICLE BATTERY MANUFACTURING
Automotive industry is facing fundamental challenges due to the rapid depletion offossil fuels, energy saving and environmental concerns. The need of sustainable energydevelopment has motivated the research of energy reduction and renewable energy sources.Efficient use of energy in vehicle manufacturing is demanded, as well as an alternative energysource to replace gasoline powered engines. In this thesis, we introduce a case study at anautomotive paint shop, where the largest amount of energy consumption of an automotiveassembly plant takes place. Additionally, we present a summary of recent advances in thearea of hybrid and electrical vehicles battery manufacturing, review commonly used batterytechnologies, their manufacturing processes, and related recycling and environmental issues.Our study shows that energy consumption in paint shops can be reduced substantiallyby selecting the appropriate repair capacity, reducing the number of repainted jobs andconsuming less material and energy. Also, it is seen that considerable effort needs to bedevoted to the development of batteries for hybrid and electric vehicles in the near future,which will make this area challenging and research opportunities promising.
KEYWORDS: Sustainable energy, energy reduction in automotive paint shop, renewableenergy, hybrid/electric vehicle, battery manufacturing.
Claudia Patricia Arenas Guerrero————————————————-
Author
April 20th, 2010————————————————-
Date

ENERGY REDUCTION IN AUTOMOTIVE PAINT SHOPS AND
A REVIEW OF HYBRID/ELECTRIC VEHICLE BATTERY MANUFACTURING
By
Claudia Patricia Arenas Guerrero
Dr. Jingshan Li————————————————
Director of Thesis
Dr. Stephen Gedney————————————————
Director of Graduate Studies
April 20th, 2010————————————————
Date

RULES FOR THE USE OF THESIS
Unpublished theses submitted for the Master’s degree and deposited in the University ofKentucky Library are as a rule open for inspection, but are to be used only with due regardto the rights of the authors. Bibliographical references may be noted, but quotations orsummaries of parts may be published only with the permission of the author, and with theusual scholarly acknowledgments.
Extensive copying or publication of the thesis in whole or in part also requires the consentof the Dean of the Graduate School of the University of Kentucky.
A library that borrows this thesis for use by its patrons is expected to secure the signatureof each user.
Name Date
———————————————————————————————————————-
———————————————————————————————————————-
———————————————————————————————————————-
———————————————————————————————————————-
———————————————————————————————————————-
———————————————————————————————————————-
———————————————————————————————————————-
———————————————————————————————————————-
———————————————————————————————————————-
———————————————————————————————————————-
———————————————————————————————————————-

THESIS
Claudia Patricia Arenas Guerrero
The Graduate School
University of Kentucky
2010

ENERGY REDUCTION IN AUTOMOTIVE PAINT SHOPS AREVIEW OF HYBRID/ELECTRIC VEHICLE BATTERY
MANUFACTURING
———————————————————————
THESIS———————————————————————
A thesis submitted in partial fulfillment of the requirements
for the degree of Master of Science in Electrical Engineering
in the College of Engineering at the University of Kentucky
By
Claudia Patricia Arenas Guerrero
Lexington, Kentucky
Director: Dr. Jingshan Li, Assistant Professor of Electrical Engineering
Lexington, Kentucky
2010
Copyright c© Claudia Patricia Arenas Guerrero 2010

DEDICATION
This thesis is dedicated to God, for His infinite blessings. To my parents, Hugo and Patricia,
my sister Alexandra, and my boyfriend Carlos, my sources of motivation and inspiration.

ACKNOWLEDGMENTS
I would like to express my gratitude to Dr. Jingshan Li for being an outstanding advisor
and excellent professor. His constant support and invaluable suggestions made this work
possible. Also, I would like to thank the other committee members, Dr. Larry Holloway
and Dr. YuMing Zhang for their time and effort in reviewing this work.
Next, I wish to thank the National Science Foundation (NSF) for its economical support
for my research. In addition, I want to acknowledge Stephan Biller, Jorge Arinez, Guoxian
Xiao, and Ningjian Huang from the General Motors Research & Development Center, for
their technical assistance and provision of the information analyzed in the paint shop study.
Thanks also go out to my fellow graduate students in the lab: Junwen Wang, Yang Liu,
Yao Hu, and Shuli Wang for their help in the beginning of this journey.
I am deeply grateful and forever indebted to my parents for the love, support, and
encouragement they have provided me through my entire life, to my little sister for her love
and trust, and to my nanny Luz, for being like my second mom. A very special thank you
goes out to my beloved boyfriend, without whose love, encouragement, help, and patience,
I would not have finished this thesis.
I would also like to thank my family and friends for their endless love, support, and
understanding through the duration of my studies. My sincere thanks to Carroll and Janice
Crouch for being my family since I arrived to Lexington. Finally, my regards and blessings
to all of those who supported me in some aspect during the completion of this project.
iii

TABLE OF CONTENTS
ACKNOWLEDGMENTS . . . . . . . . . . . . . . . . . . . . . . . . . . . . . . . . . . iii
LIST OF TABLES . . . . . . . . . . . . . . . . . . . . . . . . . . . . . . . . . . . . . . vi
LIST OF FIGURES . . . . . . . . . . . . . . . . . . . . . . . . . . . . . . . . . . . . . vii
Chapter 1 INTRODUCTION . . . . . . . . . . . . . . . . . . . . . . . . . . . . . . . 1
1.1 Sustainable Energy Development . . . . . . . . . . . . . . . . . . . . . . . . . 2
1.1.1 Energy and emissions reduction . . . . . . . . . . . . . . . . . . . . . . 2
1.1.2 Renewable energy for commercial vehicles . . . . . . . . . . . . . . . . 4
1.2 Summary . . . . . . . . . . . . . . . . . . . . . . . . . . . . . . . . . . . . . . 6
Chapter 2 ENERGY REDUCTION: A CASE STUDY IN AN AUTOMOTIVE
PAINT SHOP . . . . . . . . . . . . . . . . . . . . . . . . . . . . . . . . . . . . . . 8
2.1 Introduction . . . . . . . . . . . . . . . . . . . . . . . . . . . . . . . . . . . . . 8
2.2 Painting System . . . . . . . . . . . . . . . . . . . . . . . . . . . . . . . . . . 9
2.3 Model and Problem Formulation . . . . . . . . . . . . . . . . . . . . . . . . . 11
2.4 Energy Evaluation and Comparison . . . . . . . . . . . . . . . . . . . . . . . 13
2.5 Case Study . . . . . . . . . . . . . . . . . . . . . . . . . . . . . . . . . . . . . 18
2.6 Summary . . . . . . . . . . . . . . . . . . . . . . . . . . . . . . . . . . . . . . 19
Chapter 3 BATTERIES FOR HYBRID AND ELECTRIC VEHICLES . . . . . . . . 20
3.1 Introduction . . . . . . . . . . . . . . . . . . . . . . . . . . . . . . . . . . . . . 20
3.2 Hybrid, Plug-In Hybrid, And Electric Vehicles . . . . . . . . . . . . . . . . . 21
3.2.1 Hybrid electric vehicle (HEV) . . . . . . . . . . . . . . . . . . . . . . . 21
3.2.2 Plug-in hybrid electric vehicle (PHEV) . . . . . . . . . . . . . . . . . . 22
3.2.3 Electric vehicle (EV) . . . . . . . . . . . . . . . . . . . . . . . . . . . . 23
3.2.4 Parameter comparison . . . . . . . . . . . . . . . . . . . . . . . . . . . 24
3.2.5 HEV architectures . . . . . . . . . . . . . . . . . . . . . . . . . . . . . 24
3.3 Battery Parameters and Energy Management . . . . . . . . . . . . . . . . . . 25
3.3.1 Battery parameters . . . . . . . . . . . . . . . . . . . . . . . . . . . . . 26
3.3.2 Energy and battery management . . . . . . . . . . . . . . . . . . . . . 30
3.3.3 Determination of battery status . . . . . . . . . . . . . . . . . . . . . . 35
3.3.4 Prediction of battery performance . . . . . . . . . . . . . . . . . . . . 36
3.3.5 Determination of battery degradation . . . . . . . . . . . . . . . . . . 37
3.4 Battery Requirements . . . . . . . . . . . . . . . . . . . . . . . . . . . . . . . 37
3.5 Development of Battery Technology . . . . . . . . . . . . . . . . . . . . . . . 39
3.6 Lead-Acid Technology . . . . . . . . . . . . . . . . . . . . . . . . . . . . . . . 42
3.6.1 Lead-acid batteries . . . . . . . . . . . . . . . . . . . . . . . . . . . . . 44
iv

3.6.2 Valve-regulated Lead-acid (VRLA) batteries . . . . . . . . . . . . . . . 49
3.7 Nickel-Based Technology . . . . . . . . . . . . . . . . . . . . . . . . . . . . . . 51
3.7.1 Nickel-cadmium (NiCd) batteries . . . . . . . . . . . . . . . . . . . . . 51
3.7.2 Nickel-hydrogen (NiH2) batteries . . . . . . . . . . . . . . . . . . . . . 52
3.7.3 Nickel-iron (NiFe) batteries . . . . . . . . . . . . . . . . . . . . . . . . 53
3.7.4 Nickel-zinc (NiZn) batteries . . . . . . . . . . . . . . . . . . . . . . . . 53
3.7.5 Nickel-metal hydride (NiMH) batteries . . . . . . . . . . . . . . . . . . 54
3.8 Lithium Technology . . . . . . . . . . . . . . . . . . . . . . . . . . . . . . . . 60
3.8.1 Lithium polymer batteries (LPB) . . . . . . . . . . . . . . . . . . . . . 60
3.8.2 Lithium-ion (Li-ion) batteries . . . . . . . . . . . . . . . . . . . . . . . 62
3.9 Sodium-Based Technology . . . . . . . . . . . . . . . . . . . . . . . . . . . . . 72
3.9.1 Sodium-sulphur (NaS) batteries . . . . . . . . . . . . . . . . . . . . . . 73
3.9.2 Sodium-metal chloride (Na/NiCl2 or Zebra) batteries . . . . . . . . . 73
3.10 Summary . . . . . . . . . . . . . . . . . . . . . . . . . . . . . . . . . . . . . . 75
Chapter 4 CONCLUSIONS AND FUTURE WORK . . . . . . . . . . . . . . . . . . 77
APPENDIX . . . . . . . . . . . . . . . . . . . . . . . . . . . . . . . . . . . . . . . . . . 80
REFERENCES . . . . . . . . . . . . . . . . . . . . . . . . . . . . . . . . . . . . . . . . 88
VITA . . . . . . . . . . . . . . . . . . . . . . . . . . . . . . . . . . . . . . . . . . . . . 96
v

LIST OF TABLES
3.1 Characteristic parameters of HEV configurations [35, 41, 42] . . . . . . . . . . . . 24
vi
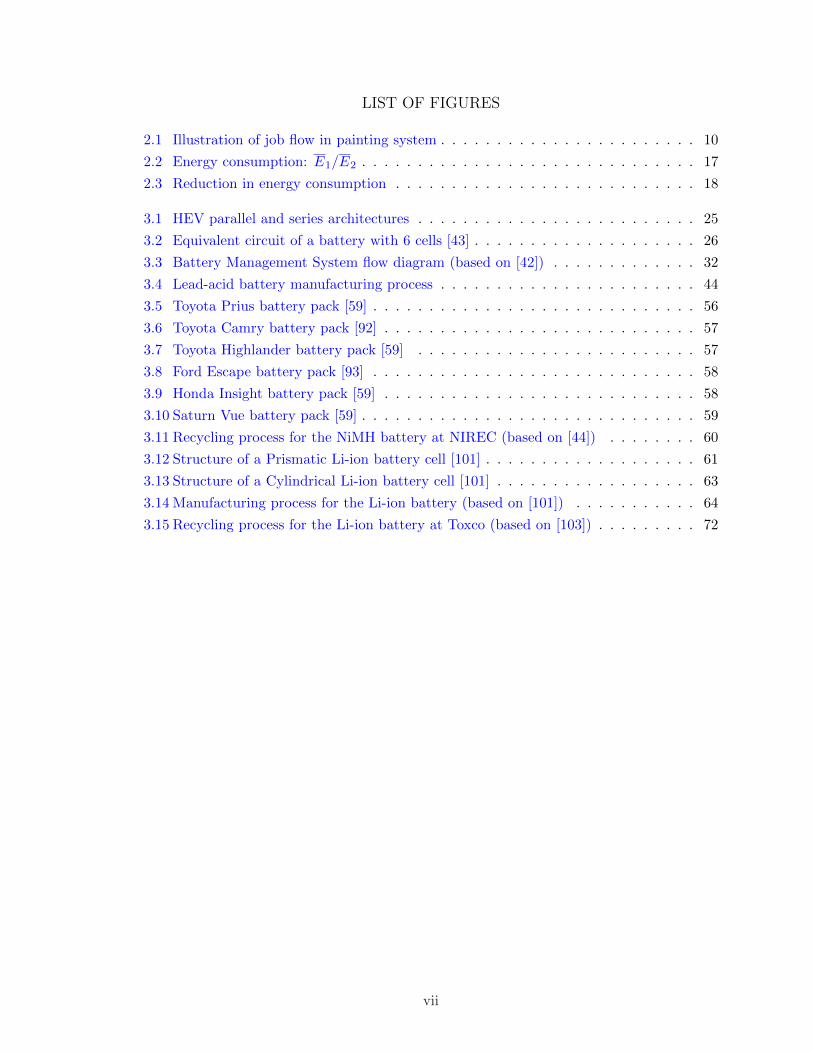
LIST OF FIGURES
2.1 Illustration of job flow in painting system . . . . . . . . . . . . . . . . . . . . . . . 10
2.2 Energy consumption: E1/E2 . . . . . . . . . . . . . . . . . . . . . . . . . . . . . . 17
2.3 Reduction in energy consumption . . . . . . . . . . . . . . . . . . . . . . . . . . . 18
3.1 HEV parallel and series architectures . . . . . . . . . . . . . . . . . . . . . . . . . 25
3.2 Equivalent circuit of a battery with 6 cells [43] . . . . . . . . . . . . . . . . . . . . 26
3.3 Battery Management System flow diagram (based on [42]) . . . . . . . . . . . . . 32
3.4 Lead-acid battery manufacturing process . . . . . . . . . . . . . . . . . . . . . . . 44
3.5 Toyota Prius battery pack [59] . . . . . . . . . . . . . . . . . . . . . . . . . . . . . 56
3.6 Toyota Camry battery pack [92] . . . . . . . . . . . . . . . . . . . . . . . . . . . . 57
3.7 Toyota Highlander battery pack [59] . . . . . . . . . . . . . . . . . . . . . . . . . 57
3.8 Ford Escape battery pack [93] . . . . . . . . . . . . . . . . . . . . . . . . . . . . . 58
3.9 Honda Insight battery pack [59] . . . . . . . . . . . . . . . . . . . . . . . . . . . . 58
3.10 Saturn Vue battery pack [59] . . . . . . . . . . . . . . . . . . . . . . . . . . . . . . 59
3.11 Recycling process for the NiMH battery at NIREC (based on [44]) . . . . . . . . 60
3.12 Structure of a Prismatic Li-ion battery cell [101] . . . . . . . . . . . . . . . . . . . 61
3.13 Structure of a Cylindrical Li-ion battery cell [101] . . . . . . . . . . . . . . . . . . 63
3.14 Manufacturing process for the Li-ion battery (based on [101]) . . . . . . . . . . . 64
3.15 Recycling process for the Li-ion battery at Toxco (based on [103]) . . . . . . . . . 72
vii

Chapter 1
INTRODUCTION
Actual increments in energy, fuel consumption and price, and the growing importance of
reducing carbon emissions, have imposed to the governments and companies around the
world the finding of solutions in order to improve energy and fuel consumption efficiency.
The need of developing sustainable and renewable energy sources has led to the analysis of
different approaches in various areas, depending on the problems and challenges of countries
around the globe. However, priorities, motivations, and policies are different for every
country, and so are the solutions proposed for them. The 2007 Report on Energy and
Climate Change by the World Energy Council (WEC) states that there is not a single
solution that can provide energy to the world, and meet its emission goals at the same time.
Given the difference between countries’ needs, each one should develop its own strategy to
climate change [1].
Worldwide, transportation is one of the areas with the greater contribution to the total
greenhouse gas (GHG) emissions. In United States, it produces around the 33% of the total
GHG emissions, and accounts for more than 60% of the total petroleum consumption [2, 3].
For this reason, the reduction of fossil fuels consumption is mandatory, and the introduction
of alternative fuels and energy storage technologies plays an important role. At the same
time, effective reduction of energy usage in the manufacturing process through an adequate
production system design will lead to significant energy savings and a considerable reduction
in carbon emissions [4, 5].
This chapter presents and introduction to the main concepts related to sustainable
energy development strategies focused on energy reduction in vehicle manufacturing sector,
and the use of renewable energy sources for hybrid and electric vehicles.
1

1.1 Sustainable Energy Development
Sustainable development has been defined as “the development that meets the needs of the
present without compromising the ability of future generations to meet their own needs”
[6, 7]. One of the main factors to achieve a sustainable development within a society is to
plan a sustainable energy development. This plan should include an efficient utilization,
conservation and supply of energy resources, with long term availability, reasonable cost,
and environmental safety, in order to minimize waste of primary resources [6, 8].
Sustainable energy development strategies can be focused on two technological chal-
lenges: energy reduction/conservation in the production process, and replacement of fossil
fuels by various sources of renewable energy. Energy reduction is associated to the efficient
usage of resources in the production processes. It is directly related to the environmentally
conscious manufacturing (ECM) concept, which includes planning, developing, and imple-
menting manufacturing processes and technologies that make an efficient use of energy,
while minimizing or eliminating waste and reducing scrap [9]. On the other hand, renew-
able energy has been considered as an important choice in many countries, but less than
15% of primary energy supply in the world is based on renewable energy [10]. According to
[1], the most used sources of energy are fossil fuels (88%), electricity from nuclear energy
(6%) occupies the second place, and electricity from hydropower, and other sources like
solar energy and wind (6%) complete the percentage. The main fossil fuels used are oil
(37%), coal (28%) and gas (23%).
1.1.1 Energy and emissions reduction
The deep reduction of energy consumption or energy efficiency in production processes is
a major objective in a sustainable energy development plan. The majority of CO2 emis-
sions associated with manufacturing facilities is related to their energy usage. The adequate
design of processes to make an efficient usage of energy and resources, and to recycle, re-
manufacture or reuse products is the main characteristic of environmental conscious man-
ufacturing (ECM). Implementation of ECM provides safer and cleaner facilities, reduced
environmental and health impact, improved product quality, lower product cost, higher pro-
2

ductivity, worker protection, and lower future costs for disposal. Energy reduction basically
points to minimize waste and resources, and includes products, processes, and technologies
that will decrease in-process waste. Thus, some activities that can be implemented in order
to achieve energy and emissions reduction include input changes, production process design
changes, product reformulation, inventory control and worker training [9].
Companies around the world are encouraged to take the necessary and appropriate steps
to identify the production processes where financially attractive improvements can be made
to reduce energy use and meet Environmental Protection Agency (EPA) regulations. In
recent years, EPA’s Office of Transportation and Air Quality (OTAQ) has established new
regulations to reduce nitrogen oxide (NOx) emissions from diesel engines, and NOx, total hy-
drocarbons (THC), and carbon monoxide (CO) from gasoline-fueled vehicles. Even though
passenger vehicle emissions levels have decreased, the overall emissions in the automotive
industry are very significant [11].
Different actions have been implemented for major automakers like Toyota, Ford and
Porsche to contribute to their overall energy reduction process [12, 13]:
• Use of modern digitally controlled heating systems and efficient lighting, energy man-
agement and control systems.
• Updated air handling and emissions control in paint process systems.
• Computerized control of air compressors in paint shop applications and pneumatic
tools.
• Encapsulation for complete dust protection, which enhances vehicle paint coat while
reducing the required amount of conditioned hall air required.
• Use of electrostatic precipitators for paint dust that decrease the emission of solvents
and particles to a minimum, exhaust air purifiers, and increased amount of circulated
air.
• Optimization of painting process to significantly reduce the footprint and energy use
of paint booths, including projects to convert paint fumes into electricity, and use of
zirconium oxide pretreatment to inhibit surface corrosion while using less energy.
3

• Flexible manufacturing to assemble different vehicles on the same production line,
using less manufacturing facilities space and optimizing tools utilization.
• Power cuts during extended production shutdown periods.
• Employee training in the sustainable energy development plan, and better practices
in manufacturing.
Vehicle production is a heavily energy consuming process. It is reported that 37 auto-
mobile assembly plants across the nation have spent about $700 million on energy every
year [14]. In automotive assembly plants, painting is the largest energy consumption unit.
More than 60% of the total energy is consumed by paint shop, mostly in painting booths
and ovens [15]. Thus, reducing energy consumption in paint shops, and in particular, in
the painting process, has significant importance. In Chapter 2, a case study to reduce
energy usage at an automotive paint shop is presented. It is shown that a suitable repair
capacity design can reduce the number of unnecessary repaints, which will also decrease the
consumption of total energy and the environmental impact.
1.1.2 Renewable energy for commercial vehicles
Renewable energy technologies produce commercial energy by taking advantage of natural
phenomena and resources, and turning them into useful energy forms. Even when not all
renewable energy technologies have zero environmental impact, there is a great environ-
mental advantage in their use with respect to the conventional energy sources. Also, most
of renewable energy resources are not exhausted, unlike fossil fuels, and favor power system
decentralization and local or small application solutions [6]. The most common renewable
energy technologies use resources such as water, wind, sea and tide, solar (thermal and
photovoltaic energies), geothermal (heat of the Earth’s core), and biomass (wood, other
combustion products, biogas, biofuels, etc.) [1, 16, 17].
Renewable energy technologies are becoming a good choice to replace conventional en-
ergy sources, due to the more and more affordable equipment and conversion systems avail-
able in the market. However, renewable resources change independently from demand, and
for this reason, it is very important to count on an energy storage mechanism. In order
4
to achieve a significant contribution to sustainable energy use, considerable development of
energy storage methods are required [18].
Recently, biofuels are being used for the transportation sector in some countries [1]; they
are solid, liquid, or gaseous fuels derived from organic matter. Most biofuels are derived
from dead plants or animal excrement. Many countries are using biofuels for transportation,
and the most common are ethanol/gasoline blends and biodiesel. Besides biofuels, electric
power is acquiring great importance in the development of new technologies for commercial
vehicles. Electric vehicles are propelled by an electric motor (or motors) and powered by
rechargeable battery packs. New research and development (R&D) in battery technologies
for hybrid and electric vehicles are being conducted, and major automakers have launched
their proposals to the market with positive results. Nickel-Metal Hydride (NiMH) batteries
have been developed for their use in hybrid electrical vehicles (HEVs), with satisfactory
results in the global market. Lithium Ion (Li-ion) batteries are being developed for princi-
pal automakers and battery manufacturers for their use in next generation HEVs, Plug-in
HEVs (PHEVs), and electric vehicles (EVs). At the same time, new battery manufacturing
technologies are being used, which impulse new developments in recycling processes and
process control.
Additionally to the battery manufacturing, the U.S. Department of Energy (DoE) has
established a program to develop supercapacitors, also called electrolytic double-layer ca-
pacitors [19]. These have capacitors and batteries characteristics, with the difference that
there is no chemical reaction, which increases cycling capacity. The storage of energy in
supercapacitors is performed as an electric field between two electrodes. This is the same
principle that capacitors use to store energy, except that supercapacitors use an electrolyte
ionic conductor instead of an insulating material. Supercapacitors have long cycle life and
power density. However, their energy density is lower than the one batteries have, and their
energy storage capacity is still low. In addition, cell balancing is needed to improve cell to
cell capacity. At the moment, supercapacitors are only considered as power-assist devices,
and are used in parallel with another energy storage device. Therefore, the implementation
cost is high and the application range is limited [18, 20, 21].
5
Lately, hydrogen (H2) is being deeply explored as a fuel for passenger vehicles. It can
be used in fuel cells to power electric motors or burned in internal combustion engines
(ICEs). By a reverse electrolysis process, hydrogen and oxygen can produce both water and
electricity. Unlike batteries, fuel cells generate electrical energy as long as they have fuel
supply, therefore they do not have limited cycle life [19]. There are many types of fuel cells,
such as: Alkaline fuel cell (AFC), Phosphoric Acid fuel cell (PAFC), Molten Carbonate
fuel cell (MCFC), Solid Oxide fuel cell (SOFC), Solid Polymer fuel cell (SPFC), and Direct
Methanol fuel cell (DMFC). Basically, the differences between them are the electrolyte used,
their operating temperature, their design, and their field of application. Except for DMFCs
in which liquid methanol is used directly as the fuel, the other types of fuel cells work with
hydrogen. Recent R&D has been focused on the SPFC technology, because PAFC and
AFC have not enough power density, and MCFC and SOFC have a very high temperature
operation that is not convenient for use in EVs. However, results have not been as expected
for implementation in passenger vehicles [18, 19].
As advances in battery technology for HEVs and EVs are the main short-term solution
for the fuel consumption of commercial vehicles, concepts related to batteries for hybrid and
EVs, their requirements, and the manufacturing processes for the major battery contestants
are studied in Chapter 3.
1.2 Summary
Importance of sustainable energy development strategies has been increased in recent years,
with the need of minimizing energy emissions and environmental impact of the different
economic sectors worldwide. The automotive industry is one of the major contributors
of energy consumption and CO2 emissions to the environment, and most of the emissions
associated with their manufacturing facilities are related to their energy usage. Therefore,
energy reduction strategies need to be implemented in vehicle manufacturing sector, with
focus on the painting process, where the highest energy consumption takes place. At the
same time, renewable energy sources need to be implemented in hybrid and electric vehicles;
novel battery technologies such as NiMH and Li-ion are the main short-term solution being
6

implemented in commercial vehicles. For this reason, the aim of this document is to present a
case study on an automobile paint system to show that a change in process design can reduce
energy usage significantly, and to analyze the state-of-the-art of battery manufacturing for
hybrid and electric vehicles.
The remaining of the document is organized as follows. In Chapter 2, a case study to
reduce energy usage at an automotive paint shop by modifying its repair capacity is pre-
sented. In Chapter 3, an introduction to HEVs, PHEVs and EVs, their characteristics and
parameters that make them important candidates for the new generation of commercial ve-
hicles is provided, as well as the main concepts necessary to understand battery operation,
performance, and energy management. Also, this chapter analyzes battery requirements
and development in the last years, reviews manufacturing processes of the main battery
technologies considered for HEVs and EVs, their recycling processes and some environmen-
tal issues. Finally, Chapter 4 collects main conclusions and some proposals for future work.
All proofs are provided in the Appendix.
7

Chapter 2
ENERGY REDUCTION: A CASE STUDY IN AN
AUTOMOTIVE PAINT SHOP
2.1 Introduction
Vehicle manufacturing is a heavily energy consuming process, and painting is the unit with
the largest energy consumption. Thus, reducing energy consumption in painting process,
has significant importance. Most of the studies on energy improvement focus on process
and technology improvement, such as renovation in painting equipment or process. For in-
stance, paper [22] describes a process based cost model for automotive painting. Using such
a model, the cost of changing the painting process and using alternative technologies can
be estimated. Likewise, [23] introduces typical vehicle painting process and identifies the
repetitive painting and curing processes as the huge energy consumers. It also presents en-
ergy consumption reduction efforts by reducing the number of processes in painting booths.
In addition, paper [24] proposes an equation to model the energy usage as well as the
environmental impacts and economic costs of each unit in paint shop, and studies the ma-
jor energy consuming ones. Recently, reference [14] summarizes the energy use in vehicle
assembly process and presents energy efficiency measures for specific process in painting
systems. It also provides suggestions to reduce energy consumption, such as reducing air
flow in painting booths, and minimizing heat recovery to reduce waste heat, etc.
Clearly such efforts have significant impact on improving energy efficiency in paint shops.
They typically require process renovation, new equipment upgrades, and significant invest-
ment in advance. Therefore, an alternative approach, which relies on system design and op-
eration, such as reducing energy consumption through efficient production operations would
be very valuable. In other words, a method to reduce energy usage through production sys-
tem design while improving productivity and quality is an area worth for investigation.
8

Due to the importance of painting operations in vehicle assembly, substantial effort has
been devoted to improvement in paint shops. Papers [25] and [26] present analytical models
to predict the throughput in paint shops and outline continuous improvement procedures.
Such methods have been successfully applied in paint shops. Papers [27] and [28] introduce
quality robustness design of repair and rework system in paint shops to improve quality
buy rate. Paper [29] describes a case study to investigate the coupling between operation
speed and paint quality. However, energy issues are not considered explicitly in these
works. Therefore, a study to investigate procedures for energy reduction through production
systems analysis is needed.
This chapter presents a case study on paint system design to reduce energy usage at
an automotive paint shop. Specifically, it is shown that by designing appropriate repair
capacity, a reduction of number of unnecessary repaints can be obtained. It will also result
in less consumption of total energy as well as emissions. The remainder of this chapter is
structured as follows: Section 2.2 introduces the painting system in an automotive paint
shop. The model and problem formulation are presented in Section 2.3. Using such a model,
the energy consumption formulas are derived in Section 2.4 and possible energy reductions
are studied. Section 2.5 describes a repair capacity redesign project. Finally, Section 2.6
presents a general summary. All proofs can be found in the Appendix.
2.2 Painting System
The automotive painting system typically consists of the following processes: painting (i.e.,
color coating and baking, including painting booths and ovens), repair (spot repair and panel
exchange), rework (where jobs will be resent to painting process again) and inspections,
which are immediately after each operation. An illustration of such processes is given in
Figure 2.1.
After painting and inspection, a good quality job will be sent to confirmation deck. A
defective job will be routed either to repair (for spot repair, such as scratch polishing, dent
removal, or for panel exchange) or to rework if the defect is severe, and in this case the
whole vehicle will be repainted. Jobs routed to component replacement will be inspected
9

Minor ReplacementComponent
ReworkProcess
Confirmation(Good jobs)
������������������
������������������
����������
����������
����������������������������
Repair
���
���
New jobs
Operations Inspections
ProcessPainting
Figure 2.1: Illustration of job flow in painting system
again after finishing the process. The good jobs will be delivered to confirmation, and still
defective jobs are routed either to spot repair or to rework. Similarly, spot repair jobs
will be sent to confirmation deck if it passes the inspection, back to spot repair again, to
component replacement, or to rework, if it is still inferior to quality standard.
Typically, component replacement can be finished quickly, but spot repair may take
longer time since all operations are manual and are followed by baking procedures. There-
fore, the number of spot repair jobs that can be carried out everyday is limited due to
floor space and resource constraints. In addition, upstream of the repair shop, small buffers
are usually designed, which again limit the repair capacity. Moreover, the repair facility is
typically designed based on a projected or average value of first time quality (i.e., the job
ratio to pass painting inspection the first time). However, due to production fluctuation,
such a goal cannot be achieved all the time. Therefore, insufficient spot repair capacity will
occur and may lead to blockage of the painting process. Such blockage is detrimental since
it may result in over-baking of the vehicles, and finally, the scraps. To avoid this blockage,
a typical practice in paint shops is to reroute the jobs that only need spot repair to rework,
and then repaint them so that the flow in the system will be able to sustain.
10

Although rerouting jobs may solve the blockage problem, this will lead to unnecessary
repaints (i.e, jobs that only need spot repair are routed to repaint), and it also introduces
new problems, since it is typical that the repaint quality is significantly lower than first time
quality. This is due to additional exposure to dirt. Moreover, unnecessary repaints may
interrupt desired sequence so that more frequent color changes may be observed. Again
this can increase painting cost and reduce paint quality. Therefore, such rerouting of jobs
will lead to a reduction of quality and an increase of repair and repaint jobs. As a result,
more jobs will be processed in painting process.
As the painting booths and ovens are the major energy consumption units, and both
new and repainted jobs are processed here, reducing the total number of jobs passing the
painting process is an effective way to cut off energy usage. This implies that the number
of unnecessary repaint jobs should be reduced. To achieve this, designing an appropriate
repair capacity is needed. Sections below intend to provide a better design option to ensure
a lower number of processed jobs and a reduction in energy consumption.
2.3 Model and Problem Formulation
To model the painting system described above, the following notation is introduced:
n: production capacity, i.e., number of first time painting jobs per day,
q(t): first time quality, i.e., percentage of good jobs after first processing at painting oper-
ations in day t,
αx: probability that a defective job should go to panel exchange after painting process
inspection,
αs: probability that a defective job should go to spot repair after painting process inspec-
tion,
αr: probability that a defective job should go to rework after painting process inspection,
βsx: probability that a job should go to panel exchange after spot repair,
βss: probability that a job should go to spot repair again after spot repair,
βsr: probability that a job should go to rework after spot repair,
βsg: probability that a job has good quality after spot repair,
11
βxs: probability that a job should go to spot repair after panel exchange,
βxr: probability that a job should go to rework after panel exchange,
βxg: probability that a job has good quality after panel exchange,
N: spot repair capacity (maximum number of jobs that can be repaired) per day,
c: unit energy cost of painting a vehicle.
The following relationships exist since the total probability is equal to one:
αx + αr + αs = 1 (1)
βsr + βss + βsx + βsg = 1 (2)
βxr + βxs + βxg = 1 (3)
The following assumptions are introduced:
(i) First time quality q(t) is considered as a random variable.
(ii) A job can be reworked or repaired multiple times. No scrapping of jobs is assumed.
Remark 1 Typically, there is a limit (e.g., four times) on how many times a vehicle
can be repainted. When the rework rate is small, which is the majority of the cases,
the probabilities that a job will be repainted or a job has to be scrapped will be very
small. Therefore, assumption ii) is acceptable.
(iii) All repainted jobs have same probability of becoming good jobs, independent of the
number of times they have been reprocessed.
(iv) All routing probabilities are constant in time. In other words, the probabilities that a
defective job should go to panel exchange, spot repair, and rework are kept unchanged
whether the job is a first-time processed job or multiple-time reprocessed job.
(v) First-time processed jobs have a higher good job ratio than repainted jobs. Repaint
quality, qr(t), is proportional to first time quality and qr(t) = ρq(t), where ρ is a
constant (0 < ρ ≤ 1).
12
Let nr(t), be the number of jobs routed to rework and repaint in day t. Then nr(t) is a
function of the first time quality and spot repair capacity. Thus, the total energy usage in
painting in day t is defined as:
E(t) = c · (n+ nr(t)). (4)
Therefore, the problem to be addressed is formulated as follows: Under assumptions
(i)-(v), develop a method to investigate the energy consumption as a function of spot repair
capacity.
The solution to this problem is presented below.
2.4 Energy Evaluation and Comparison
Consider the paint system shown in the Figure 2.1. Define ns(t) as the number of jobs that
should be routed to spot repair in day t. Then ns(t) may be larger than the jobs actually go
through spot repair in day t, which is ns(t), and ns(t) equals to min{ns(t), N}. Similarly,
let nx(t) be the number of jobs routed to panel exchange in day t, and ng(t) the number of
good jobs going to confirmation station in day t. Using conservation of flow, the following
equations describe the system behavior:
nr(t) = n[1− q(t)]αr + nr(t)[1− ρq(t)]αr + nx(t)βxr +min{ns(t), N}βsr +
max{ns(t)−N, 0},
nx(t) = n[1− q(t)]αx + nr(t)[1− ρq(t)]αx +min{ns(t), N}βsx,
ns(t) = n[1− q(t)]αs + nr(t)[1− ρq(t)]αs + nx(t)βxs +min{ns(t), N}βss,
ng(t) = nq(t) + nrρq(t) + min{ns(t), N}βsg + nxβxg.
Using the above equations, a closed formula to calculate the total energy to produce n
vehicles with good paint quality can be derived.
13

Theorem 1 Under assumption (i)-(v), the total energy consumed in day t, E(t), is
given by:
E(t) =
cn1−α′r[1−ρq(t)]+α′
r[1−q(t)]1−α′
r[1−ρq(t)] if N ≥ ns(t),
cn[1−(1−ρq(t))(1−αxβxg)+(1−q(t))(1−αxβxg)]1−[1−ρq(t)][1−αxβxg]
− cN(βsg+βsxβxg)1−[1−ρq(t)][1−αxβxg]
if N < ns(t),
(5)
where
ns(t) =nα′
s[1− q(t)]
1− [1− ρq(t)]α′r
, (6)
α′s =
αs + αxβxs1− βss − βsxβxs
, (7)
α′r = αr +
αs(βsr + βsxβxr)
1− βss − βsxβxs+
αx(βxr + βxsβsr − βssβxr)
1− βss − βsxβxs. (8)
Proof: See the Appendix.
Note that in equations (6)-(8), ns(t) indeed represents the smallest spot repair capacity
to accommodate all the jobs that should be spot repaired in day t, and α′s and α′
r represent
the actual probabilities a defective job is routed to spot repair and rework, respectively
(where all the defective jobs exiting from panel exchange and spot repair have been taken
into account). Clearly, when spot repair and panel exchange have 100% quality rate, i.e.,
βsg = βxg = 1, we have α′r = αr and α′
s = αs.
As explained in Section 2.3, typically ρ < 1, then qr(t) < q(t). When the spot repair
capacity is insufficient, the total number of jobs processed by the painting process will be
increased by rerouting the jobs that only need spot repair to repaint. This will lead to
more energy consumption, more material usage and more emissions as well. Therefore, it is
important that the spot repair capacity should be sufficient so that the unnecessary repaints
would be minimal.
As one can expect, increasing spot repair capacity leads to a reduction of number of
jobs to be processed in painting process and also a decrease of energy usage. When repair
14

capacity N is greater than ns(min{q(t)}), there will be no rerouted jobs. In this case, the
energy consumption will be a constant. Therefore, we obtain,
Corollary 1 Under assumptions (i)-(v), the average energy consumption in painting
process, E, is monotonically non-increasing with respect to N .
Proof: See the Appendix.
In many production system designs, the average value of first time quality, q, is typically
used. Let Eq be the energy consumption with a constant first time quality q, and denote
Eq(t) as the expected energy usage with random first time quality q(t). The following
relationship is obtained:
Corollary 2 Under assumptions (i)-(v),
Eq(t) > Eq. (9)
Proof: See the Appendix.
This result indicates that without considering the first time quality variability (by using
average first time quality), less processed jobs are predicted, and a smaller energy consump-
tion will be expected. In this case, typically, a smaller spot repair capacity will be selected.
However, due to variability, such capacity design may lead to more unnecessary repaints
so that more jobs need to be processed and a large energy usage will occur. Therefore,
variability in first time quality cannot be ignored.
Assume the first time quality follows a uniform distribution. An analytical expression
of E can be obtained.
Theorem 2 Under assumptions (i)-(v), assume q(t) follows a uniform distribution in
interval [qa, qb], the average energy usage, E, can be calculated as:
15

• if qs < qa,
E =cn
qb − qa
[(1
α′rρ
− (α′rρ− α′
r)(1− α′r)
(α′rρ)
2
)
×[ln(α′
rρqb + 1− α′r)− ln(α′
rρqa + 1− α′r)]+
(α′rρ− α′
r)
α′rρ
(qb − qa)
], (10)
• if qa ≤ qs ≤ qb,
E =cn
(qb − qa)
[(1
α′rρ
− (α′rρ− α′
r)(1− α′r)
(α′rρ)
2
)×
[ln(α′
rρqb + 1− α′r)
− ln(α′rρqs + 1− α′
r)]+
(α′rρ− α′
r)
α′rρ
(qb − qs)
]
+c
(qb − qa)×
[(n
(ρ− ραxβxg)− n(αxβxg + ρ− ραxβxg − 1)
(ρ− ραxβxg)2
−N(βsg + βsxβxg)
(ρ− ραxβxg)
)×
[ln((ρ− ραxβxg)qs + αxβxg
)
− ln((ρ− ραxβxg)qa + αxβxg
)]+
n(αxβxg + ρ− ραxβxg − 1)(qs − qa)
ρ− ραxβxg
], (11)
• if qs > qb,
E =c
qb − qa
[(n
(ρ− ραxβxg)− n(αxβxg + ρ− ραxβxg − 1)
(ρ− ραxβxg)2
−N(βsg + βsxβxg)
(ρ− ραxβxg)
)×
[ln
((ρ− ραxβxg)qb + αxβxg
)
− ln((ρ− ραxβxg)qa + αxβxg
)]
+n(αxβxg + ρ− ραxβxg − 1)(qb − qa)
ρ− ραxβxg
], (12)
where
qs =nα′
s −N(1− α′r)
nα′s +Nρα′
r
. (13)
Proof: See the Appendix.
Remark 2 It is shown in [28] that the quality buy rate at painting (i.e., overall quality
ratio, including both first time and repainted jobs) is practically insensitive to distribution
type of first time quality, but only dependent on mean and coefficient of variation of it.
Since energy consumption is proportional to the number of processed jobs and then to the
16

quality buy rate, a similar property will also hold. Thus, for any other distribution of first
time quality, as long as mean and coefficient of variation are known, we can find a uniform
distribution with same mean and coefficient of variation and use it for energy evaluation.
To illustrate the effect of spot repair capacity design for energy reduction, consider two
painting processes following the same uniform distribution for first time quality q(t), but
with different spot repair capacities N1 and N2. Then the energy consumptions of these two
systems, E1 and E2, can be compared using the results from Theorem 2. Here n = 1000
and ρ = 0.6. The routing probabilities are defined as follows:
αr = 0.2, αs = αx = 0.4,
βxr = βxs = 0.15, βss = βsx = βsr = 0.1. (14)
Let N2 = 50, and N1 is changing from 50 to 200. The results are shown in Figure 2.2 for
different mean values of first time quality.
50 100 150 2000.88
0.9
0.92
0.94
0.96
0.98
1
N
mea
n(E
1) /
mea
n(E
2)
mean(q)=0.65mean(q)=0.8mean(q)=0.9
Figure 2.2: Energy consumption: E1/E2
17

It can be seen that the energy usage is monotonically decreasing as a function of spot
repair capacity when it is insufficient. When the capacity is large enough so that there
is no rerouted jobs, this consumption will be constant. As we have larger spot repair
capacity, it is possible to decrease the number of jobs going through the painting process,
and therefore, the energy consumption. As one can see, the energy savings that can be
obtained are from 2− 12% for mean values of q(t) from 0.65 to 0.9. Since a huge amount of
energy is consumed in automotive paint shops, in particular in the painting process areas,
even a small percentage of reduction is still significant in overall volume.
2.5 Case Study
In this section, a spot repair capacity redesign project at an automotive paint shop is
introduced. Consider the paint system shown in Figure 2.1. The routing probabilities are
αs = 0.5, αx = 0.35, αr = 0.15, βxr = βxs = βss = βsr = βsx = 0.05. The daily production
volume is n = 765, and ρ = 0.5. The average first time quality is q = 80% with lower and
upper bounds equal to 0.65 and 0.95, respectively. The spot repair capacity is N = 90,
which is almost sufficient to avoid rerouted jobs if first time quality is constant.
90 100 110 120 130 140 1500.96
0.97
0.98
0.99
1
1.01
N
mea
n(E
) / m
ean(
E(9
0))
Figure 2.3: Reduction in energy consumption
18

The goal of this project is to provide recommendations to redesign the spot repair
capacity to reduce the number of unnecessary repaints and therefore, to reduce the energy
consumption. To accomplish this, the model introduced in Section 2.4 is used. Specifically,
the capacity of spot repair is increased from 90 to 150. The results of potential energy
reduction are illustrated in Figure 2.3. Clearly, almost a 4% of energy reduction can be
obtained. As it was said before, since the painting process consumes the largest amount of
energy in automotive assembly plant, such reduction will be significant. For example, more
than $700 million were spent by 37 assembly plants per year and 60% of it was in painting,
on average more than $11 million were spent in each paint shop. Then, a 4% reduction will
result in close to half million dollar in savings in energy per year. In addition, it reduces
a considerable amount of material cost by avoiding unnecessary repaints and can finally
improve the system throughput. Therefore, even though increasing spot repair capacity
will lead to an increase of investment cost and repair workforce, the saving over a long time
period on energy and improvement on productivity we can obtain are usually much larger
than the cost of increasing repair capacity. In particular, for systems with large volume
of production and high-profit products, the long term impact of this improvement will be
significant.
2.6 Summary
In this chapter, through a case study at an automotive paint shop, the impact of production
system design on energy consumption was investigated. Specifically, it shows that the energy
usage of a painting system can be reduced by a better design of the spot repair capacity
so that the unnecessary repaints will be smaller. Moreover, it also provides plant engineers
and managers a quantitative tool to evaluate energy improvement efforts.
Clearly, such a work will also result in a significant environment benefit due to less
emissions are generated. Therefore, the method presented here provides another approach
to reach energy efficient and environmentally friendly (EEEF) manufacturing.
19

Chapter 3
BATTERIES FOR HYBRID AND ELECTRIC VEHICLES
3.1 Introduction
The increasing demand of alternative and sustainable energy sources to replace gasoline
powered engines has intrigued the development of battery technologies for hybrid and elec-
tric vehicles. This has brought both challenges and opportunities. Not only new battery
designs with advanced features are needed, but also a high manufacturing capacity to satisfy
the increasing market is required. Different energy storage technologies have been devel-
oped and tested in commercial vehicles in order to find an economical solution that provides
emissions and fuel reduction without giving up efficiency. Thus, architectures combining
an internal combustion engine (ICE), an energy storage device, and an electric motor have
been designed to accomplish these goals.
The objective of automotive industry is to reduce fuel consumption, emissions, and
manufacturing cost, while enhancing reliability, safety and comfort [30]. The overall power
system design, the cranking and starting systems, the load leveling, and the standby power
also affect the vehicle’s electrical system, and impact the characteristics of the battery. The
growing increase in the power-consuming functions for electrical systems also requires the
improvement of the battery system and operation conditions [31, 32]. Therefore, the se-
lection of appropriate battery technology for an automotive application has a significant
importance. The production of hybrid electric vehicles (HEVs) and electric vehicles (EV)
has created a need for higher voltage batteries with long life and increased reliability [33].
To meet these demands, Nickel-Metal Hydride (NiMH) and Lithium Ion (Li-ion) technolo-
gies are major contestants. NiMH battery is already commercially used in current HEVs
with positive results, while Li-ion batteries are awaited with high expectation. Mature
20

technologies like Lead-acid, and other batteries based on nickel and sodium, have been also
studied in previous attempts in the development of HEVs and EVs.
A considerable amount of literature has been found in the design, chemistry, develop-
ment, and management systems for automotive batteries, but the case is not the same for
the manufacturing and recycling processes, and the environmental issues behind the differ-
ent battery technologies. This chapter aims to review the main characteristics of hybrid,
plug-in, and electric vehicles, and the most important parameters of batteries. At the same
time, a review of recent advances in automotive battery technologies, their manufacturing
processes, the importance of energy management and battery monitoring in the detection of
possible performance problems, as well as environmental and recycling issues is presented.
The remainder of this chapter is structured as follows: Section 3.2 presents a comparison
between hybrid and electric vehicles, and a review of commonly used architectures. In Sec-
tion 3.3, the most important battery parameters that define the performance and response
of batteries in a given application are explained, as well as the parameters related to energy,
battery management and monitoring. Section 3.4 outlines the typical requirements for new
hybrid and electric automobile batteries. The development of HEV and EV technology is
introduced in Section 3.5. In Sections 3.6-3.9, lead-acid, nickel, lithium and sodium based
technologies are described, respectively. Finally, a summary is given in Section 3.10.
3.2 Hybrid, Plug-In Hybrid, And Electric Vehicles
3.2.1 Hybrid electric vehicle (HEV)
A HEV is propelled by combining mechanical power from an ICE, with electrical power
from a battery (primary and secondary power source). Normally, the vehicle works most
of the time in the engine’s maximum efficiency zone, where the output is maintained at
an almost constant power level. The secondary power source is an energy storage device,
usually a battery or a supercapacitor, that provides auxiliary power and takes advantage
of regenerative braking and deceleration energy, which makes HEVs very efficient. The
battery starts working when more power than the engine can provide is needed. Based on
21

the percentage of battery use inside the vehicle’s design, different levels of hybridization can
be distinguished [33]-[37]:
• Micro-HEVs provide automatic engine stop/start operation with regenerative braking,
and use conventional 12V battery technology with generator capacity in the range
of 2-4 kW. The battery supplies the power demand during the stop phases, where
the engine is shut off, to save fuel and reduce noise. Other requirements, like air
conditioning, places additional demands to the battery.
• Medium HEVs supply energy for engine starting, idle loads, electrically assisted launch
from stop, torque assistance, and charge recuperation during regenerative braking,
which in turn provides higher fuel saving benefits. The most important requirement
in this type is charge acceptance, and the battery has to work at partial state of charge
(PSoC). Typical battery capacities are 4-10 kW, and electrical systems of 42V. The
Civic Hybrid, Honda Insight, and GMs Saturn VUE are examples of this category.
• Power-assist or Full HEVs offer energy for engine starting, low-speed acceleration,
idle loads, full electric launch, torque assistance, regenerative braking energy capture,
and limited electric-only range. Used power is around 50-70 kW. Electric drive and
battery typically operate at high voltages above 200V. The Toyota Prius and the Ford
Escape hybrid are examples of power-assist HEV.
All of these powertrain hybridization levels increase fuel economy by allowing the engine
to shut off while idling and during deceleration. They capture electrical energy through
regenerative braking. In all cases, the batteries have the advantage of self-recharging. In
general, the full hybrid tends to reach its best mileage in city driving, while the medium
hybrid tends to reach its best mileage on the highway [36].
3.2.2 Plug-in hybrid electric vehicle (PHEV)
Plug-In HEVs (PHEVs) provide typical full HEV capability, while at the same time, their
batteries can be recharged with electricity from an off-board power source such as a con-
ventional residential AC power outlet. This imposes large energy storage demands on the
22
battery, which are not met by previous HEV designs. The electrical power requirement
depends on vehicle weight and is above 70 kW. Important improvements in powertrain con-
figurations are also needed in order to handle the increased thermal management demands
[20, 21].
PHEVs can work in two modes: charge depleting (CD) and charge sustaining (CS).
When the PHEV is fully charged, it is driven in CD mode, where the vehicle is powered
by the energy stored in the battery. Once the SoC reaches its minimum level, the vehicle
changes to CS mode, and the fuel engine start driving the vehicle (like a HEV). After fully
charged, the range in CD mode (or all electric range-AER) is the distance a PHEV can work
electrically with the heat engine off, before the engine turns on for the first time (switched
to CS mode). A common notation is used to describe the CD range: PHEV-x, where x
means the CD range in miles (i.e. PHEV-10, is a vehicle with CD range of 10 miles) [38, 39].
A PHEV operates like a HEV when the battery is discharged to a certain SoC (depleted).
Most HEVs operate in a CS mode around a predefined SoC. During CS operation, the
battery has to meet the discharge and regenerative power with available energy around this
SoC. The United States Advanced Battery Consortium (USABC) and the FreedomCAR
partnership have set battery requirements and targets for CS power-assist HEVs [38].
3.2.3 Electric vehicle (EV)
EV, also called BEV (Battery Electric Vehicle), is a fully electric vehicle with no supplemen-
tary fuel engine. The battery must be recharged by plugging it into the electric grid every
time the mileage capacity of the battery is exhausted. The main advantages of EVs are
their independence of fuel use and their low emissions, which depend on the power source
of the utility plant producing the electricity to recharge the EV. A disadvantage of EVs
is their limited driving range, which may be several hundred miles, but is still lower than
driving demands. Thus, the principal challenge for the EV batteries is to provide a good
driving range performance before recharging, comparable to that of the ICE (approximately
300 miles). With recent technologies, recharging the battery pack of an EV can take from
four to eight hours, and the need to recharge can occur on the road; therefore, all the road
infrastructure must be changed to provide this service, and customers have to adjust their
23

schedules around it. The idea of lacking a back-up system in EVs is a big limitation that
implies more technical demands, and drives to the faster development of PHEV and HEV
technologies [36, 40].
3.2.4 Parameter comparison
In order to compare the different battery requirements related to every HEV configuration,
various parameters are taken into consideration. Table 3.1 shows the common values that
characterize each HEV configuration for parameters like power, energy, and voltage, which
are useful to select the optimal battery. The energy content and the power performance
are the main specifications for the battery design. In addition, calendar life and weight are
also important.
Table 3.1: Characteristic parameters of HEV configurations [35, 41, 42]HEV Energy(kWh) Power(kW) Voltage(V) Weight(Kg) Calendar life
Micro ∼ 0.025 2− 4 12 < 10 15 years
Medium < 1 < 10 12− 42 < 20 15 years
Full < 4 < 50− 70 > 200 < 50 15 years
Plug-in 5− 20 ∼ 80 > 200 < 50 15 years
BEV > 15 40− 80 > 300 ∼ 120 > 5 years
3.2.5 HEV architectures
One important advantage of HEVs is the flexibility to be powered by electricity, a fuel, or
both. For this, HEVs have an electric motor and a heat engine which make the vehicle’s
design more complex. In addition, an electronic control system determines the interaction
between the power sources. There are two general categories to arrange the primary and
secondary power sources: series and parallel. Figure 3.1 (based on [39]) shows a general
architecture for each configuration.
In series configuration (also called Range-Extended Electric Vehicle - REEV) a serial
drivetrain powers the vehicle using an electric motor and energy from the battery. The
output of the heat engine is converted to electrical energy by a generator, and the battery
can be charged through it, or through an electrical outlet. In parallel configuration, the
24

Figure 3.1: HEV parallel and series architectures
primary engine shaft has a direct connection to the drivetrain, providing the opportunity to
use electricity and fuel at the same time, or fuel only. In comparison to the series system,
the heat engine in the parallel system is larger, with an output around 80kW. The electric
motor is smaller, with an output around 30kW, and provides additional power when the
demand is higher than the heat engine’s capacity can handle at maximum efficiency (in
acceleration and hill-climbing). In the series system, it is common that the heat engine has
a smaller output, and the battery has a larger one. Toyota is developing the plug-in version
of the Prius, using parallel architecture, and General Motors Corporation (GM) is working
on the Chevrolet Volt based on series architecture [34, 39].
3.3 Battery Parameters and Energy Management
In this section, the most important parameters for battery design are explained, as well as
the main concepts related to battery management and monitoring.
25

3.3.1 Battery parameters
The discharging/charging behavior of a battery depends on a number of factors like current,
voltage, and temperature. This section presents the main parameters that specify the
behavior and performance of a battery for hybrid and electrical applications.
Cell and battery voltages
Electric cells have nominal voltages which represents the approximate voltage when the
cell is delivering electrical power. In order to provide a required voltage, cells have to be
connected in series. The voltage will fall when the battery is in use, and will raise when the
battery is being charged. The equivalent circuit of a battery is shown in Figure 3.2 [43]. A
general equation to represent this behavior is:
V = E − I ·R (1)
Figure 3.2: Equivalent circuit of a battery with 6 cells [43]
If the current I is zero, the terminal voltage is equal to E, and this is called the open
circuit voltage (OCV); this can be used for an approximation of SoC in some systems.
However, Lithium batteries have a high initial OCV, that falls by some millivolts and never
recovers its initial value. If the battery is being charged, then the voltage will increase by
I·R. Clearly, in electric vehicle batteries the internal resistance must be as low as possible.
The closed circuit voltage (CCV), or cell voltage under load depends on the SoC, the current,
temperature, lifetime and storage period [43, 44].
26

Internal resistance
The internal resistance determines the battery’s power output, and represents the capability
of the battery to handle a specific load. The battery internal direct current (DC) resistance
must be low to avoid voltage drop caused by the current demand, which limits the battery’s
output. This value can change depending upon the way how it is calculated, and the
SoC. In most of the battery systems, the internal resistance comprises the ohmic resistance
within the electrodes and the electrolyte. Such resistance increases when the conductivity
is reduced on the active materials, mainly when the end of discharge is approaching [44].
Battery capacity
The battery capacity is defined as the electrical charge in units of ampere-hour (Ah) that
can be extracted from the battery. This is one of the most important parameters that
must be considered in battery modeling, because usually changes in capacity are a result
of unwanted side reactions inside the cell. Capacity also depends on the time the battery
takes for discharge, the current of discharge, the end-of-discharge voltage, and temperature.
SoC and the previous storage period also have influence on it. The nominal capacity of a
battery is typically specified by the manufacturer [43, 44].
Energy stored
The main purpose of a battery is to store energy. The energy stored in a battery depends on
the electrical charge stored and its voltage; thus, it has a variable value. It also depends on
the discharge rate and the temperature. Its common measurements are given in watt-hour
(Wh) [43, 44].
Available energy
This concept refers to the energy that can be obtained from the batteries as they operate in
HEVs, between 25% and 75% SoC. An HEV battery has a capacity around 10% above and
below the nominal baseline level of 50% SoC. Thus, what is available is only about one-half
27
of the total battery energy. Therefore, in terms of battery design, it is very important to
consider the full battery capacity or energy, and not only the available value [34].
Energy density
In order to compare systems, it is very common to relate a battery energy content with its
weight or volume. Energy density is the amount of electrical energy stored per cubic meter
of battery volume. It has units of Wh/m3. If we know this value and the energy stored,
it is possible to estimate the required volume (m3), which has an important impact in the
vehicle design [43].
Specific energy
Specific energy is the amount of electrical energy stored for every kilogram of battery mass.
It has units of Wh/Kg. With the energy stored in the battery and the specific energy, an
estimation of the battery mass can be given. As a reference, a typical value for the specific
energy of a lead-acid battery is 25 Wh/kg, while a modern Li-ion battery offers 125 Wh/Kg
or more [43, 44].
Specific power
Specific power is the amount of power obtained per kilogram of battery (W/Kg). It can
vary, because the power given out by the battery depends upon the load connected to it.
However, it is not recommended to operate a battery close to its maximum power for more
than a few seconds, because it is going to discharge very fast and the operation will be
inefficient. Some batteries have very good specific energy, but with low specific power,
which means they store a lot of energy, but can only give it out slowly. Thus, high specific
power normally results in lower specific energy because at high power, energy is taken out
of a battery quickly, which reduces the available energy [43].
Energy efficiency
Energy efficiency is the ratio between released energy and stored energy. This is a very
important parameter, and is very used in electric vehicles to analyze how efficient their
28

use of energy is, which results in the reduction of emissions. Energy efficiency will change
considerably with how a battery is used: if it is charged and discharged very fast, energy
efficiency decreases in the same proportion. An energy efficiency as high as possible is the
desirable result. Therefore, the battery must have limited losses in terms of energy transfer
and self-discharge [18, 43].
Duty cycle
In general terms, the battery is operated at a nominal SoC level near 50%, so that it can
deal with charge/discharge overcurrents without going into overcharge (above 80% SoC),
deep discharge (below 20% SoC), or overdischarge (below 0% SoC). A normal operating
window for HEV batteries is between 30-70% SoC, but it can change depending upon the
technology used; it is seen that only about half of the capacity is being used. The nominal
hybrid operating level is chosen depending on the charge-delivery and charge-acceptance
characteristics of the electrochemistry and battery type being used in the vehicle. In design,
a level below 50% SoC would be used if a battery is better on discharge than on charge
acceptance, but, if it is better in charge acceptance, a level above 50% would be chosen [34].
Battery life
The exact number depends on the deep cycles, the battery type and design, and also on
how the battery is used. Over the time, battery performance degrades, including power,
energy capacity, and safety. Two types of battery life can be considered: calendar life and
deep cycle life. Calendar life is the battery’s ability to resist degradation over time, and is
independent of how much the battery is used. The USABC, the Massachusetts Institute
of Technology (MIT) and the Electric Power Research Institute (EPRI) have set a goal for
battery life in 15 years at a temperature of 35 ◦C. On the other hand, deep cycle life is the
number of discharge-recharge cycles the battery can perform. One full deep cycle would be:
starting at 90% SoC, ending at 25% SoC, and recharging back to 90% SoC. The USABC’s
battery goal is 5,000 deep cycles. This goal assumes one complete deep cycle each day, 330
days of the year, for the 15 year life span of the vehicle [39].
29

Operating voltage limits
U.S. Department of Energy (DOE) and the Partnership for a Next Generation of Vehicles
(PNGV) have specified an operating range of 300-400V, which implies an OCV of 350 V
at 50% SOC. This allows for a 50V window either way during operation, necessary for
compatibility with the control system electronics [34].
Depth of discharge (DoD) and self-discharge
Energy storage is followed for a quick release of energy on demand. The discharge is also
called the power transmission rate, and can be a limiting factor that determines the time
needed to extract the stored energy without affecting the battery life [18].
Self-discharge is the amount of energy dissipated for the battery over a given amount of
time without using it. This is an important factor to determine for how long the battery
can be left without recharging. This parameter changes with battery type and temperature
[43].
Cycling capacity
Cycling capacity is the number of times the battery can release the energy level required
after each recharge [18].
3.3.2 Energy and battery management
Conventionally, the alternator output voltage in electric vehicles systems was chosen to guar-
antee sufficient recharge of the battery after lighting and engine cranking. In the present,
the alternator voltage setpoint is typically modified depending on estimated battery tem-
perature, vehicle acceleration demand, etc. With the introduction of fuel-saving strategies,
power supply management, and vehicle electrification, energy and battery management be-
comes mandatory for HEVs and EVs [45, 46]. The final goal of energy management is to
guarantee the suitable electrical power supply to a component. If the expected voltage or
the available energy under an estimated load is too low, energy balance may be improved by
a reduction of energy consumption or by an increment of energy generation. In other words,
30

energy management refers to control of generation, flow, storage, and energy consumption,
and it depends almost completely on battery management [45, 47].
The term battery management should be used only if an active feedback is given to the
battery. Normally, batteries are only passively monitored, and information is provided, but
not managed. Common measurements of observable values such as voltage, temperature,
and current are provided by the Battery Management Systems (BMS). These values are
input data processed during Battery State Detection (BSD). BSD is related to the analysis
of non-observable values, or internal parameters and properties that may not be accessible
for direct measurement, such as acid gravity, active material utilization, no homogeneities,
etc., but that help to determine battery state, performance, and capacity. In addition,
battery management covers the control of current and voltage levels, recharge conditions,
operational limits with respect to SoC and temperature, temperature management, among
others [47].
Battery management is important to analyze the battery state of charge (SoC), state
of health (SoH), state of function (SoF), and ensure that the vehicle can be restarted. In
the case of back-up batteries, the SoC and SoH are monitored to verify that the battery is
always capable of carrying out the required duty cycle in a given moment [48].
Battery management system (BMS)
BMS is a solution to provide accurate information about the battery state, and to ensure
two basic functions: improvement of reliability and robustness of the power-supply system,
and reduction of fuel utilization and CO2 emissions, which require higher demands on the
battery. BMS consists of a sensor that measures current, voltage and temperature of the
battery, and an algorithm that determines characteristic information about the battery
state, charging voltages and refresh cycles. BMS’ outputs are defined in terms of SoC, SoH
and SoF. This information is very important for hybrid and EVs, to perform system-level
energy management. However, in recent automotive applications, other parameters like
dynamic power delivery and charge acceptance are as important as battery state [46, 49].
Usually, BMS uses an acquisition unit for monitoring battery voltages, currents, tem-
peratures, and other parameters like pressure, and estimating battery status. In addition,
31

electrical, chemical and thermal models are included to determine SoC, SoH, SoF, internal
cell temperature, internal resistance, etc. Using these values, the BMS can define the next
adequate load limits. Through a Controller Area Network (CAN) interface, these results
are communicated to the energy management system to define the load flow between the
ICE, the electric drive and the hydraulic braking system, as shown in Figure 3.3. Also,
BMS controls the cooling system: it regulates the cooling fan speed if air is used, or the
pump delivery in case of a liquid cooling system.
Figure 3.3: Battery Management System flow diagram (based on [42])
Additionally to those functions, BMS is in charge of the battery safety supervision,
to ensure that voltages, currents, and temperatures are within appropiate ranges. It also
32

checks insulation state, and if needed, it can operate the contactors to disconnect the battery
from the powertrain. Finally, the communication between the vehicle management system
and the BMS is supervised, and an emergency disconnection can occur when any problem
is detected [42].
Knowledge of the SoC, SoH and SoF permits specific and dynamic battery manage-
ment. This could include consumption control, switching of quiescent and charging current,
warning signs, as well as control information to increase the SoC.
State of charge (SoC) SoC is the percentage of electrical charge actually stored in the
battery with respect to the total storage capacity. However, battery manufacturers are
interested in the amount of charge they can get instantly from the battery, including the
actual status of the battery. SoC is a monotonous state function, which does not change
with temperature changes or with time without an electrical current flowing. Therefore,
algorithms and mathematical treatments can be applied to SoC values. Many approaches
have been made to implement SoC sensors within the batteries, making use of property
changes of the electrolyte like specific gravity (SG), conductivity, refraction, vapor pressure,
etc. The methodology utilized to measure SoC is based on measuring the equilibrium open
circuit voltage (OCV) when the vehicle is not in use. SoC is measured by analyzing the
voltage dip on starting, and the voltage response to small fixed load applied every few hours
when the vehicle is not operating [31, 45, 48].
With a linear relationship between electrolyte’s SG and OCV, SoC can be calculated
as:
SoC = (OCVactual −OCVmin)/(OCVmax −OCVmin), (2)
where OCVmax and OCVmin are equilibrium open circuit voltages at two different SoC
values, e.g., 100 and 20%. However, this definition by itself is not very useful, because the
OCV can have many variations after a long battery relaxation time. Even if the vehicle is
parked, the OCV may need many hours to achieve the equilibrium, and it is not possible to
identify if a recharge period occurred just before. In addition, higher battery loads required
for HEVs can reduce the measured voltage and give an underestimated OCV value [31, 45].
33

Based on the SoC value, the depth-of-discharge (DoD), or the fraction of battery capacity
that can be used from the battery, can be calculated as [45]:
DoD = (1− SoC). (3)
Accurate estimation of SoC is a complex task. Classical methods for SoC estimation in-
clude: measurements of the extracted charge, battery internal impedance or resistance, and
battery voltage without load. Statistical models, or artificial-intelligence-based models can
be also used. However, the best way to provide an accurate result is by using a combination
of two or more of these methods [49].
State of health (SoH) SoH describes the battery’s degree of degradation. A battery
may not be able to fulfill a special specification, but still can have the capacity to complete
another. Then, SoH measures the internal resistance, which change with battery life at a
given SoC. Therefore, SoH is defined using the power profile which describes the battery’s
duty cycle. Under the load of this power profile P(t) or current profile I(t) of duration t0,
the voltage of the battery will show a minimum value, Umin. The lowest acceptable voltage
under load, U1, and the lowest voltage of a typical relaxed battery, Ufresh, are used to define
SoH as follow [31, 45]:
SOH = (Umin − U1)/(Ufresh − U1) (4)
As one can see, SoH is a monotonous state function that can have different values, each one
representing a state of the battery. A relaxed battery is represented by SoH=1, a battery
just meeting the threshold has SoH=0, and negative SoH values represent batteries which
fail the specified duty. SOH depends on temperature and SoC [31]; if a battery has several
duties, all the respective SoH figures can be checked, and the minimum SoH value is used
as a general value for the battery [45].
State of function (SoF) In many cases, the battery’s SoC or SoH do not help to de-
termine if the battery performs as needed [45]. Therefore, the SoF can be determined by
measuring the SoC and SoH in order to monitor battery condition. SoF defines to which
34

degree the battery could currently perform an intended function [48]. In general, SoC and
SoH compensate each other with respect to battery performance: a poorer SoC may be
acceptable for a relaxed battery with high SoH, or an old battery with lower SoH may
complete its duty if it is kept at a higher SoC. In this way, the SoF combines the bat-
tery state parameters (SoC, SoH, temperature), and in some cases the short-term previous
discharge/recharge history [45]. The SoF is based on state parameters, rather than on ref-
erence conditions, as it is the case of the SoH. When a current profile I(t) is the relevant
duty for evaluation, the voltage response can be used for calculation:
SoF = (Umin − U1)/(Ufresh − U1), (5)
for actual SoC, SoH and temperature condition. In the case of braking energy recuperation
as the target battery property, the amount of charge Q that can be recharged within a
certain period of time will give the relevant information:
SoF = (Qmin −Q1)/(Qfresh −Q1), (6)
for actual SoC, SoH and temperature condition. For other types of battery duty, the
appropriate observable values for SoF determination may be defined as needed [47].
3.3.3 Determination of battery status
In order to guarantee correct functionality of electrically powered components in the ve-
hicle, to keep the battery in its best operational window, and to detect limited battery
functionality on time, battery performance must be determined by constantly measuring
temperature, SoC and SoH. The correct strategies to define SoC and SoH have to be chosen
according to the specific environment, and should include expected operating scenarios and
acceptable error tolerances [47]. Additionally, the SoF has been proposed to define the
output of an automotive BMS. Each SOF directly sends information to the vehicle-level
energy management, regarding to which degree the battery could support specific loads,
deliver propulsion power, or accept regenerative (REGEN) charge [46].
35

In addition, voltage U, temperature T, and current I can be measured directly (ob-
servable values) to perform battery monitoring. These values are the input information
for battery state detection (BSD) [47]. This term includes the analysis of the state vector
P of the battery, and values of internal parameters that may not be accessible for direct
measurement. When analyzing the battery status, voltage and current must be evaluated
as function of time. Also, additional sensors must be needed to determine temperature and
to compensate its influence on battery properties. In [45], some alternatives are evaluated
for processing and evaluation of measured data, such as balancing of current flow for track-
ing of changes of SoC, estimation of a dynamical battery impedance, evaluation of battery
voltage at point of zero current, analysis of battery open circuit voltage, and comparisons
with characteristic patterns or mathematical models. In fact, no matter what the final
design of the vehicle electrical system is, there will be more electrical power needs in future
designs. For systems needing a highly-reliable power supply, the battery becomes a main
component into the electrical system. Therefore, determination of battery status will be of
higher importance in order to keep the battery in a good operational range, to predict its
capability, and in multiple battery systems, to control the mutual energy exchange.
3.3.4 Prediction of battery performance
Once the state values are determined, the battery behavior under a possible future load
profile can be predicted. A load profile must be predicted using characteristic data or
mathematical models, and it is characterized by the current I(t) or the power P(t) needed
as a function of time, and by the lowest (or highest) allowable voltage level. The prediction
may be made for the short-term, with current battery status, or for medium-term with
an estimated future status of the battery [45]. In addition, four different approaches have
been defined for the determination of changes in battery characteristics. When all the
information is available, these approaches may be combined with a BSD, to gather all the
information by [47]:
• monitoring of battery operating history to determine the age and actual status,
• consideration of special events, to improve estimations based on real conditions,
36

• for different load profiles, direct measurements of battery status for early detection of
health conditions,
• for parameters that are not accessible for direct measurements, use of models for
estimation of battery state and ageing.
3.3.5 Determination of battery degradation
Determination of battery performance is related to an actual battery status. Degradation
means performance under hypothetical reference conditions, such as SoH with respect to a
certain load profile. However, SoH describes the actual battery status only. For prediction
of the battery degradation and battery lifetime, a special life model is needed. Battery
properties such as corrosion, water loss, changes of active material properties, etc., must be
analyzed [45].
3.4 Battery Requirements
In vehicles with an internal combustion engine, the energy storage device is the passive
starting, lighting, and ignition (SLI) battery, which charge and discharge depending on the
energy that is consumed and generated. The battery provides the electric power for crank-
ing the ICE, maintains electrical energy during operation, and supply electrical energy when
the engine is off. This energy is recharged from an alternator driven by the internal com-
bustion engine (ICE) [31, 45]. In classic vehicles, SLI batteries are of the Lead-acid type,
with 12V nominal voltage and flooded design. An improved technology, the VRLA batter-
ies, have been used in vehicles since late 1980s without been outspread in large numbers
[50]. Lately, different battery designs are available, where Nickel and Lithium technologies
are in an advanced level of development. Also, vehicle electrical architecture changes are
under consideration, and dual voltage, high voltage, and dual battery systems are evaluated
to enhance production, distribution, storage, and management of electrical energy in the
vehicle [31].
The demand for electric power in vehicles is growing. In particular, using electrical
energy for vehicle’s propulsion presents important advantages in the attempt to reduce
37

fuel consumption and CO2 emissions. In addition to electrically controlled and powered
systems for steering, braking, and stabilization, new functions have been introduced, such
as an improved battery cycling for the ICE’s stop/start operation mode, the torque as-
sist/acceleration assist mode, electrical brake energy recovery, and energy management to
detect the battery capability to accept charge. These trends are imposing new requirements
on the energy storage devices [20, 47]. The new HEV and EV designs have to provide fuel
economy, reduced emissions, longer cycle life, safety, comfort, reliability, and availability.
As the technical demands for new automotive batteries increase, as well as the power
requirements for electrical systems, a summary of the common battery requirements are
identified as follows [21, 31, 32, 34, 45, 46], [51]-[55]:
• High battery capacity and high cycling capability to cover increased energy demands
for engine-off and idle periods. The useful battery capacity is only half of the nominal
capacity, because it must operate at a SoC close to 50%, to manage charge or discharge
and prevent overcharges above 80%, or discharge below 20%.
• High discharge power to hold up new cranking technologies, which require very fast
changes in the engine’s duty cycle for rapid acceleration or hill-climbing.
• Good recharge capability, for quick response during engine-off and idle periods. Charge
acceptance characteristics (specifically at low temperatures) define the charge balance
of the power supply system. Contrary to the deep discharge in traditional non-HEV
applications, advanced HEV applications will require good charge acceptance in a dy-
namic discharge/charge operation. This is called dynamic charge acceptance (DCA).
Batteries for HEVs and EVs are operated in a partial SoC (PSoC, between 30% and
70%) to provide a higher boost-charge acceptance during regenerative braking.
• Higher power capacity. The demand, that started from less than 500 W in the nine-
teen sixties, had been increased to more than 2 kW by the year 2000. Considerable
increments have been experienced by actual EVs (the Chevrolet Volt pack contains
16 kWh of lithium-ion cells of which 8 kwh are usable).
38

• Improved automatic stop/start features (particularly for urban traffic) and driving
strategies to minimize pollution and energy waste during engine idling [53].
• Changes in electrical network architectures, with the possibility of dual-voltage levels
due to the increased loads powered by the electrical system. There are loads that can
operate at lower voltages, and others that, because of the high power consumption,
must be operated at higher supply voltage. 42V PowerNet has been established, as
a solution to fulfil the demands for higher efficiency in the different vehicle functions
and components.
• Redundant design and battery management and monitoring to ensure high reliability
for cranking and constant energy to safety and relevant components. Additionally,
algorithms are refreshed to keep the battery in the appropriate working conditions.
These algorithms consider both the SoH and the available vehicle’s energy. In this
way, possible failures caused by low or high SoC levels can be prevented.
• Battery’s reliability depends on cells’ reliabilities; therefore, higher voltage batteries
(with a larger number of cells) have to maintain more severe reliability goals at the cell
level. Because of this, battery manufacturing processes require better process control
to meet these higher reliability levels.
These functions may be realized independently or as a combination with each other.
Satisfying all these requirements simultaneously and efficiently with respect to technical
and cost restrictions is still in progress.
3.5 Development of Battery Technology
Developing high-performance rechargeable batteries for EVs is a challenging task because
of the need to fulfil multiple battery requirements: high energy, high power, safety, long life,
low cost, resistance, and minimal environmental impact [56]. In recent years, automakers are
focusing on battery for HEVs, including 42 volts enhanced power generators/alternators,
and integrated starter-generator (ISG) systems. They have developed a set of general
39

battery performance and price goals through the Partnership for a Next Generation of
Vehicles (PNGV) and the United States Advanced Battery Consortium (USABC).
The PNGV program leads research and development (R&D) projects with the federal
government and the United States Council for Automotive Research (USCAR), formed by
Ford Motor Company, Daimler Chrysler Corporation, and GM. The main objective is to
improve competitiveness in manufacturing and to implement energy efficient solutions for
passenger vehicles [33, 57]. By 2011, PNGV’s goal is to reach a continuous production of new
passenger vehicles that accomplish an equivalent of 100 miles per gallon with conventional
fuels [34]. On the other hand, the U.S. Department of Energy’s (DOE) Vehicle Technologies
Program (including the FreedomCAR and Fuel Partnership programs) has developed R&D
activities to improve the batteries and power electronics of PHEVs while enhancing vehicle
efficiency technologies. At the same time, DOE, USABC and U.S. automakers are working
in developing advanced batteries for PHEV applications and defining battery requirements.
Several laboratories, like Argonne National Laboratory (ANL) and National Renewable
Energy Laboratory (NREL) are also conducting analysis to help define different battery
requirements [33, 38].
In the last 15 years, many different approaches have been presented by major automak-
ers and other research programs. In 1996, the EV1 from GM was introduced, moving the
concept of EV to the commercial market. In September 2000, the RHOLAB project (re-
liable, highly optimized lead-acid battery) was proposed under the UK Foresight Vehicle
Programme with the objective of developing an optimized lead-acid battery solution for
HEVs. Real vehicle data was collected from testing the battery pack in the Honda In-
sight. However, the limited driving range of lead-acid batteries had limited their market
acceptability and activated the development of higher-specific energy batteries [58, 59, 60].
NiMH batteries quickly became the technology of choice for the emerging electric vehicle
market. Major automotive companies including Daimler Chrysler, Ford, GM, Honda, and
Toyota have developed HEVs with NiMH batteries into the market [60]. Toyota introduced
Prius, the first commercial HEV, using a 6.25 Ah cylindrical sealed NiMH D-size cell [34].
In 1994, GM joined Ovonic Battery Company (OBC) to impulse NiMH battery technology
for electric and hybrid vehicle applications. After this, GM announced that they would
40

introduce the EV1 with NiMH batteries in 1999, with a driving range of up 140 miles on
a single charge. They also launched their electric conversion S-10 pick-up truck equipped
with GM Ovonic NiMH batteries, offering a range of over 90 miles [60]. Other advances
were proposed by Varta, Ovonics and SAFT in 2000, and funded by the U.S. DOE for use
in the PNGV Programme [34].
Recently, given the high cost in NiMH technology, as well as the oversized battery packs,
battery researchers have turned their interest into Li-ion technology [61]. Li-ion batteries
have a higher energy density than any other type batteries. Even though NiMH battery
holds about twice the energy per pound of the conventional lead-acid battery, Li-ion cells
hold roughly twice as much energy per pound as NiMH batteries do. The ability of Li-
ion batteries of carrying relatively high energy makes the development of EV possible. In
addition, lithium is the lightest solid element, so it is easily portable, and cheaper than other
battery raw materials [59]. To make Li-ion batteries practical for mass-produced EVs, new
technologies must be developed to increase the energy storage and fast discharge capability
of the batteries. In addition, the battery cycle life must be lengthened to the average vehicle
life, and the cost must be kept as low as possible [62].
The Toyota Vitz CVT 4, a car sold only in Japan, was the first production car to use
Li-ion batteries. It used a four-cell, 12 Ah Li-ion battery pack to power electric accessories
and restart the engine after idle stop [62]. Recently, Tesla Motors, in San Carlos CA,
presented the Tesla Roadster, an all-electric sport car that uses 6831 Li-ion cells. They give
the car up to 250 miles of range, as well as the acceleration of 0 to 60 miles per hour in
less than 4 seconds [62]. But the major developments are just starting. In January 2010,
GM launched the first Li-ion battery pack manufacturing plant in the U.S. operated by a
major automaker in Brownstown, MI [63, 64]. The raw lithium cells will be delivered from
LG Chem’s plant in Korea. After the packs are assembled at this facility they are then
transported to Detroit-Hamtramack plant where the Volts will be assembled. Production is
set to begin in March 2010. The Volt’s battery pack is made up of multiple linked battery
modules and more than 200 battery cells [63, 64]. LG Chem also plans to begin building a
Li-ion cell factory in Michigan beginning later 2010 [52]. To understand the Li-ion’s advance
in battery size, the batteries from GM’s EV1 and Volt can be compared. The EV1 pack
41

used lead-acid cells, and it was almost 8 feet long and weighed 1200 pounds. Volt pack,
using Li-ion cells, stores the same 16 KWh in a 5 foot long container weighing 400 pounds
[59].
Other battery manufacturers are also increasing their investments in Li-ion technology.
A123Systems is planning the construction of new world-class Li-ion battery manufacturing
facilities in the U.S., with the first construction location in southeast Michigan. This plant
would enable the company to dramatically expand production capacity, with full production
volumes designed to supply battery systems for five million HEVs or half million plug-in
EVs per year by 2013 [65]. Similar efforts on new lithium battery developments have also
been observed from many other manufacturers, in addition to the research that the major
automakers themselves are conducting. Once lithium batteries have met energy-storage,
power-delivery, durability, and cost goals, a large investment in manufacturing capacity will
be needed to produce them [62].
In Sections 3.6 to 3.9, main candidates for energy storage in hybrid and electric vehicles
will be surveyed. The battery technologies analyzed are those considered appropriate by
manufacturers to provide the required energy, power, cycle life, and other requirements
necessary for effective HEV operation. Manufacturing processes are reviewed, along with
key factors such as quality control, safety, cost, environmental concerns, and recycling.
3.6 Lead-Acid Technology
The lead-acid battery for classical SLI is a mature technology. The system consists of a lead
current collector, lead oxide as the positive active material, spongelike lead as the negative
active material, and sulfuric acid as the electrolyte. During discharge, active materials
are transformed into lead sulfate. Lead-acid systems have been used in many applications
due to their temperature tolerance, low cost, high adaptability, intrinsic safety, and well
established recycling process [37, 46, 53, 66]. However, lead-acid batteries face life cycle
limitations when operated at a high rate partial SoC (HRPSoC), operation mode of HEV
applications [37]. In this, the battery unit will be discharged and charged at higher rates
than in conventional automotive applications [67].
42

In addition, other disadvantages in battery performance, such as short cycle life, low
specific energy, low rate of recharge, and environmental issues in the manufacturing process
regarding to the use of lead, have been identified. There is also a problem in battery design:
the lowest corrosion rates are reached with pure lead grids, but these are restricted to use
in small cells. Moreover, to achieve low weight, high utilization of the active materials is
required, and this is related to large changes in the volume of the material that limit life
cycle. Basically, the limitations of the lead-acid system are caused by its electrochemistry.
Failures like corrosion, degradation or creation of lead sulfate in the positive material, short-
circuits, and loss of water, are among the common issues found in this technology [53].
Energy restrictions of lead-acid batteries, and the demands to reduce weight and mainte-
nance cost, accelerated the development of VRLA batteries. VRLA batteries are maintenance-
free, and power density can be boosted by increasing the surface area of the electrodes.
However, this also increases the rate of corrosion and reduces battery life [37]. Some im-
provements in energy throughput, cycle life, power density and other requirements have
been achieved with the introduction of VRLA batteries, using the absorptive glass mat
(AGM) design, which uses a glass fiber mat that is impregnated in electrolyte [46, 53].
Other proposals related to the improvement of lead-acid batteries have been developed.
Within the framework of the European project bipolar lead-acid power source (BILAPS), a
different production option was developed for the bipolar lead-acid battery. The tests show
the possibility of operating the bipolar lead-acid battery in a hybrid mode, and the costs of
the system are estimated to be much lower than those for NiMH or Li-ion based high-power
systems [68]. However, an important challenge is in manufacturing and quality control. The
technology required for manufacturing the improved lead-acid battery type is demanding.
Parameters like plate thickness, reproducible weight of active material filling, reproducible
composition of materials on assembly, quantity of electrolyte filling, and pressure on the
electrode plates on assembly, require more development and severe control [53].
43

3.6.1 Lead-acid batteries
Manufacturing process
The Lead-acid battery production process is basically an eight-stage flow shop as shown in
Figure 3.4 [69, 71].
Figure 3.4: Lead-acid battery manufacturing process
Oxide production The lead oxide may be prepared by the battery manufacturer, as in
many larger battery manufacturing facilities, or may be purchased from a supplier [70].
The ball-mill and the reaction-pot (or Barton pot) are two manufacturing processes for the
preparation of battery oxides. According to [72], ball-mill oxide is the preferred type for
ensuring product consistency, and for battery applications in places with different climatic
conditions. Oxide produced by the ball-mill process is found to be mechanically less trou-
blesome. Nevertheless, the reaction-pot method is used satisfactorily by many companies
for the production of automotive batteries. It is a cheaper process, occupies less space per
ton of oxide produced, and implies a lower investment. Oxide is generally stored in bunkers
and transferred directly to the batch weighers feeding the paste mixers. Most of the systems
are usually fully enclosed to eliminate hazardous manual operations, and to meet environ-
mental standards. A barrel is accepted or rejected based on the average percentage of pure
lead, and the homogeneity of the oxide powder in each barrel [71].
44

Grid casting Battery grids are manufactured by casting or stamping operations. In the
casting operation, lead alloy ingots are charged to a melting pot, from which the molten
lead flows into molds that form the battery grids. The stamping operation involves cutting
or stamping the battery grids from lead sheets. The grids are often casted or stamped in
doublets, and splitted apart after they have been either flash dried or cured [70]. Commonly,
the grid casting machine is the principal method of producing battery grids. Alternative
methods use expanded-metal or continuous-casting techniques. Continuous-casting process
can work with both ultra-low antimony and lead-calcium alloys. With the expanded-metal
technique, only calcium-lead alloys can be used [72]. The grids must be rigid, free from
discontinuities, and have specified weight and thickness. Two types of test are conducted
to check the grids strength and ductility. In a destructive test, a grid is bent over a 1 inch
diameter steel pipe and the final sample must be free from cracks. A non-destructive test
is a visual check for discontinuous parts and weigh of grids. Control of grid weight implies
control of its thickness, which increases the battery cost [71].
Paste mixing and grid pasting A mixture of lead oxide powder, water, and sulfuric
acid produces a positive paste. The same ingredients in slightly different proportions with
the addition of an expander make the negative paste [70, 71]. The method of preparing
pastes generally is a batch process, because in a continuous process it is difficult to get pastes
within the defined tolerances for the production of high-quality batteries [72]. Control of
types and amounts of components is essential; any major deviation in the specified quality
and amount of ingredients could produce defective plates. Paste quality is monitored by
visual inspection for color, and by density and penetration tests [71].
In the process, the pasting machines force the paste into the spaces of the grids, which
are made into plates. At the completion of this process, a chemical reaction starts in
the paste and the mass gradually hardens, liberating heat. Needle-shaped crystals of lead
sulfate are formed throughout the mass. The amount of paste carried by the grids, the
weight and the thickness of the pasted plates must be controlled to ensure high capability
of the plate to be charged [70, 71]. Some manufacturers use precut grids before pasting,
which improves the shelf life of wet batteries. This development eliminates plate cutting of
45
unformed plates as a separate operation, and removes environmental aspects by reducing
the high value scrap associated with plate cutting [72].
Curing (plate setting) For many years, curing has been made by using separate cubi-
cles or by covering pallets of pasted grids with canvas sheets, requiring more than 70 hours.
However, due to climatic changes during the year, large variability was detected. There-
fore, curing procedures use special ovens having preset humidity and temperature profiles.
These systems improve product consistency, quality and work-in-progress (WIP), since the
turnaround is reduced to less than 48 hours [70, 72].
Formation In this process, a direct current is applied to the battery terminals to store
electrical energy in the form of chemical charges. In this way, the concentration of the
sulfuric acid increases and the percentage of lead sulphate decreases. Successful formation
is measured by the absence of sulphated plates and cells that are equally charged. The
main problems encountered in the formation process are the sulphation, overcharged and
undercharged plates [71].
One of the most important manufacturing decisions is whether to make dry-charged
or wet-charged products. Although plates using antimonial grid alloy can be made into
dry or wet-formed products, those with low-antimony or calcium grids are processed only
into wet-formed products. During dry-charge formation, the battery plates are immersed
in a dilute sulfuric acid solution; the positive plates are connected to the positive pole of
a direct current (DC) source, and the negative plates connected to the negative pole of
the DC source. Then, the individual plates may be assembled into elements first and then
formed in tanks, or formed as individual plates. In the case of formed elements, these are
placed in the battery cases, the positive and negative parts of the elements are connected
to the positive and negative terminals of the battery, and the batteries are shipped dry. In
turn, the wet-charge formation process is done with the plates in the battery case. After
forming, the acid may be dumped, fresh acid is added, and a boost charge is applied to
complete the battery [70, 72].
46

Production of wet-formed batteries implies a reduced number of processes compared to
the dry-charged, and therefore, lower levels of waste are generated. Because of the reduced
number of processes, the simpler alloy situation, the environmental advantages and lower
cost of manufacture, the production of wet-formed batteries is usually preferred [72].
Plate cutting For the production of dry-charged batteries from plates formed as castings,
it is still necessary to include a plate-cutting operation prior to battery assembly. As
mentioned before, for wet-formed batteries the cutting of unformed plates will be made
before pasting [72].
Cell and battery assembly In assembly, a battery cell is formed by manually stacking
a sequence of negative plate, separator and a positive plate. These separators are made of
materials such as non-conductive plastic, or glass fiber. There is always one more negative
plate than positive so that the end plates are always negative. All positive (and all negative)
plates are welded together. Two or more cells (depending on the battery capacity) are
welded in series. Connections from the first to the last cells represent the negative and
positive terminals of the battery [71]. An alternative to the manual operation is the cast-
on connection, where positive and negative tabs are independently welded to produce an
element, and elements are automatically placed into a battery case. Then, a top is placed
on the battery case, and the terminals on the top are welded to two individual points that
connect the positive and negative plates to the positive and negative terminals, respectively
[70].
At the end of the assembly line, automatic checks are performed. Depending on whether
dry or wet-charged products are being manufactured, some other machinery may be used
(i.e., vent plug placing, labeling, shrink wrapping, powered conveyors leading to acid-filling
machines for wet-formed production, etc.) [72].
Quality control
Quality control should be performed continuously and should include: cadmium electrode
testing of both positive and negative plates, measurement of the moisture content of positive
47

plates, water absorption testing of negative plates, determination of the ohmic resistance
of cell packs, and determination of the efficiency of the oxidation inhibitor. At the same
time, operators should routinely check the temperature of the ovens used for drying pos-
itive plates, control the plate washing, and perform oxygen-analysis measurements. The
cadmium electrode test is one of the most important tools available for continuous moni-
toring of positive and negative plates. Plates can be tested immediately after the drying
machine during storage in the factory and before assembly [73].
Environmental issues
The lead oxide in the air is poisonous, and a potential danger for the worker’s health. To
provide worker protection, as well as a higher production rate, the degree of automation in
the battery manufacturing process is very important. Advanced automatic systems in the
battery production can be found in the plate manufacturing, plate stacking, and quality
inspection [72, 74].
Recycling
Recycling of automotive batteries for the recovery of lead is very important, because this is
one of the most used metals, and is highly toxic for the environment if it is not treated ad-
equately. Two methods for battery recycling are identified: pyrometallurgy and hydromet-
allurgy processes. The pyrometallurgical process is the most used one. In this process,
the batteries are crushed and separated into streams: lead materials, polypropylene scrap,
and sulphuric acid. The leadcontaining materials are smelted to produce lead bullion and
a molten silicate solution containing all of the lead oxides. This is smelted and reduced
with carbonaceous material and fluxing agents in a lead blast furnace, similar to those used
in the primary smelting of lead oxides. The low-lead slag is environmentally inert and is
disposed in industrial landfills. Nevertheless, monitoring and preventing the escape of dust
and fume is crucial and every stage has different sources of environmental impact [75, 76].
Hydrometallurgical methods are relatively new, but their economic and industrial viability
is being proved. Hydrometallurgy is a chemical metal processing technology to dissolve a
metal by using water, oxygen and other substances on a pressurized vessel. Usually there
48
are further series of chemical processes, involving a number of separation and purification
steps, which result in the production of a high purity metal. This process recovers a higher
percentage of the metal concentrated, which is more environmentally friendly, and uses less
energy [75].
3.6.2 Valve-regulated Lead-acid (VRLA) batteries
VRLA technology is not new. Changes and requirements for grids, paste chemistry and
processing, separator development, containers and vents, thermal management, and mon-
itoring/control technologies have been studied since the 90’s [77]. VRLA batteries are
characterized by immobilization of the electrolyte, which offers advantages such as preven-
tion of acid spilling, reduced gassing rates, and the possibility of partial state of charge
(PSoC) performance, since acid stratification (charging/discharging cycles repeated with-
out acid mixing) does not occur [78]. Moreover, AGM VRLA battery development is based
on previous work on active material formulations with specific additives to improve battery
life under HRPSoC cycling conditions [79]. VRLA batteries have been designed to meet
HRPSoC demands, as a response to the limitations of lead-acid batteries, in particular,
for stop&go systems. The concept is simple: the engine is automatically cut off when the
vehicle comes to a halt and is automatically restarted when the driver engages a gear, or
for an automatic transmission, when the driver releases the brake. This results in heavy
charge/discharge cycles. Based on this requirement, VRLA batteries have been tested with
positive results, and have shown responses at higher specific power than lead-acid batteries
[80].
VRLA manufacturing process does not have many differences to lead-acid batteries, but
some aspects must be considered:
Alloys and grid preparation Alloys for VRLA batteries must have low corrosion rates,
and must form a good corrosion layer with the positive active material [81]. While these com-
ponents do not affect the energy production from the cell, they have processing/performance
characteristics such as mechanical strength, corrosion resistance and conductivity [77].
49

Pasting and plate making Because of the cycling nature of 36/42 V applications, higher
paste densities are required. Moreover, to achieve plate thickness and uniformity levels,
orifice pasting techniques, or roll coating have to be employed. In order to have uniform
plate stack compression and minimal damage on battery assembly, tapered-plate pasting
is required [81]. Paste composition also needs considerable attention, because in most
applications, the positive active material (PAM) is a limiting factor [77].
Separator/electrolyte development In valve-regulated products, the role of the sepa-
rator is very important, and it is related to the distribution of electrolyte between the two
plates and into and across the plate surfaces. Depending upon the action of the separator,
the plate/separator porosities, and the surface areas employed, the electrolyte will distribute
unevenly within a given cell, and from cell to cell. The oxygen recombination process in
VRLA batteries is affected by volume and plate pore film thickness, which determines each
cell’s behavior. This can lead to some cells being overcharged and others undercharged [77].
Curing and drying New curing approaches have been developed to achieve a more uni-
form treatment, while maintaining a high throughput. Strict control of temperature/humidity
conditions in the plant environment ensures minimal plate carbonation during and after
drying [81].
Filling and formation Uniform electrolyte distribution must be achieved in the filling
process. This becomes more difficult by the use of thin-plate designs and high plate stack
compression levels. In order to ensure superior cycling performance and long shelf-life, plate
formation has to result in lead dioxide (PbO2) levels in excess of around 90%. With the
use of high-density pastes, this is difficult to achieve in short periods [81].
Assembly Cells are assembled with a valve that causes a small internal overpressure and
prevents a easy escape of gasses. It opens every certain time to allow the escape of hydrogen
that is not oxidized within the cell [78]. Furthermore, stronger case and lid assemblies are
required so that higher plate stack compressions and vent valve release pressures can be
employed. The top and cell-to-cell connections are critical, and are the main source of
50

battery failures. Correct assembly checks such as high potential and polarity reversal are
normally conducted [81].
Quality control
VRLA technology requires reliable, closely controlled production processes. Plate thick-
ness, reproducible weight of active material filling, reproducible composition of materials
on assembly, quantity of electrolyte filling and pressure on the electrode plates on assembly
are among the parameters that require much closer tolerances and control. Moreover, the
costs exceed those of classic automotive batteries.
Monitoring and control of battery parameters such as voltage, current, and impedance
are necessary in large systems such as EVs. Fault detection softwares identify bad con-
nections, weak modules, etc. Control functions are also applied to charge and discharge,
in order to ensure cell balancing. This helps to extend both discharge performance and
battery life. Moreover, monitoring of environmental impact related to the use of lead, and
hydrogen expulsion is mandatory [77].
3.7 Nickel-Based Technology
Alkaline batteries are nickel-based and use an alkaline solution as the electrolyte. A wide
range of commercial batteries using nickel in the positive electrode have been developed
since late 19th century. These batteries include nickel-iron (NiFe), nickel-zinc (NiZn),
nickel-cadmium (NiCd), nickel-hydrogen (NiH2), and nickel-metal hydride (NiMH) bat-
teries. These batteries are discussed below, showing NiMH as a serious contender for au-
tomotive applications. On the other hand, NiZn and NiFe batteries are rarely used, while
and NiH2 is used mainly in aerospace applications, and NiCd has presented important
environmental issues [43].
3.7.1 Nickel-cadmium (NiCd) batteries
The NiCd battery was one of the main competitors to the lead-acid battery for use in electric
vehicles because they have almost twice the specific energy of lead-acid batteries. In general,
51
NiCd batteries can be assigned to two broad categories: vented and sealed. Sealed NiCd
batteries were used in portable devices up to 1990, and vented batteries have been developed
for industrial and automotive use. In both types, NiCd batteries use metallic cadmium for
the negative electrode and nickel oxide hydroxide (NiOOH) for the positive. The electrolyte
is a solution of potassium hydroxide (KOH) containing some lithium hydroxide (LiOH), to
improve cycle life and high temperature performance [43, 82]. Unlike the lead-acid batteries,
the electrolyte does not participate in the cell reaction of NiCd batteries; it acts only as
ion conducting medium. Therefore just a small amount of electrolyte is needed and the
electrodes can be narrowly spaced. Thus, the internal resistance can be minimized to make
NiCd batteries suitable for extremely high loads [44].
The main advantages of NiCd batteries are high specific power, a long life cycle, a wide
range of operating temperatures, a good high-discharge rate, low capacity loss, and good
long term storage. The high-discharge is related to the cell construction, while the rate of
capacity loss depends on the electrode structure. In addition, NiCd batteries are capable
of long cycling even at high DODs. Regarding the principal drawbacks, it is common that
the operating voltage of each cell is about 1.2V, so 10 cells are needed in each 12V battery,
compared to 6 cells used in lead-acid batteries. This explains the higher cost of this type
of battery. Moreover, cadmium has been identified as a harmful and carcinogenic product,
with a high environmental impact [43].
3.7.2 Nickel-hydrogen (NiH2) batteries
The NiH2 cell utilizes H2 as a negative electrode, while the positive electrode is nickel
hydroxide (Ni(OH)2), and the electrolyte is potassium hydroxide, the same as in NiCd
batteries. The hydrogen electrode consists of a thin film of platinum to improve chemical
stability and catalytic properties, and is supported on a nickel foil substrate with a gas
diffusion membrane. The positive electrode is a porous powder substrate, supported by
a nickel screen, and impregnated with nickel hydroxide. The separator is a thin porous
zirconium oxide (ZrO2) ceramic cloth supporting the KOH solution. They provide high
temperature resistance and chemical resistance for long-life batteries. Additionally, the
electrode material acts only as a catalytic surface that provides or absorbs electrons. NiH2
52

batteries are hermetically sealed, because in the charged state, hydrogen remains as gaseous
hydrogen within the cell. In the discharged state, hydrogen is absorbed by the nickel
hydroxide. The generation and consumption of gaseous hydrogen during charging and
discharging give a direct relationship between the internal cell pressure and the state of
charge. The electrodes are arranged as a stack in the center, the electrolyte is soaked by
the separator, and the edges of the electrodes are sealed to prevent short circuits around
the separator [44, 82].
NiH2 cells can be manufactured in different configurations: individual pressure vessel
(IPV) cell, common pressure vessel (CPV) cell, and single pressure vessel (SPV) cell. The
IPV cell contains a single or double electrode stack in a cylindrical pressure vessel, with
voltages around 1.25 volts. The CPV cell has two stacks in series in a vessel, with voltage
of 2.5 volts. In the SPV configuration, a number of cells are connected in series and placed
in a single vessel [82].
Among major advantages of NiH2, high specific energy, long life, good discharge rate,
and ease to control SoC are identified. Also, these batteries are sealed, and therefore,
maintenance free. However, the main disadvantages are low energy density and high cost,
which limit their use mainly to aerospace projects [44].
3.7.3 Nickel-iron (NiFe) batteries
NiFe batteries are based on iron as a negative electrode and nickel oxide hydroxide (NiOOH)
as a positive. They are characterized for being robust, with high resistance to shocks and
vibrations, and long cycle life. However, high self-discharge, low efficiency, low energy and
power density, poor performance at low temperatures, and higher cost than lead-acid batter-
ies are the drawbacks of this battery. It has been considered for possible EVs applications,
with little success [82].
3.7.4 Nickel-zinc (NiZn) batteries
These batteries have NiOOH as a positive electrode and zinc (Zn) as a negative electrode.
These batteries have a higher specific energy than NiCd batteries due to the Zn electrode.
Also, NiZn batteries have a relatively low cost, good rate capability, good cycle life, and
53

do not have any environmental issues. However, they have some inconveniences related
to the use of Zn in the anode, like solubility in the potassium hydroxide (KOH) solution,
and dendrite growth on charge, which have limited their commercial application. Some
approaches have been tested, like the use of a less concentrated KOH solution, or the use of
a microporous polypropylene separator, to avoid zinc migration towards Ni electrode. Tests
in electrical vehicles show a similar performance to NiMH batteries at a lower cost, but
their limited cyclability and short life have not permitted their introduction in commercial
applications [82].
3.7.5 Nickel-metal hydride (NiMH) batteries
NiMH battery technology was introduced years ago as a substitute of the Nickel-Cadmium
(NiCd) battery, which has a limited energy density, some severe environmental concerns
associated with cadmium, high cost, and Nickel-Zinc battery, which has a short life [37].
All currently commercially available HEVs use NiMH technology as the energy storage
system (ESS). NiMH batteries have experienced great advances in the past 15 years, with
an evident increase in energy and specific power.
The NiMH battery used in today’s HEVs is relatively small, has favorable life-cycle
characteristics, high power, light weight, high level of safety, good thermal performance,
and a configurable design [83]. In fact, NiMH batteries are the only tested and considered
reliable electric power source for HEVs [36, 37, 84]. The first NiMH design had limitation
related to operating temperatures, while today’s batteries can provide suitable power even
at cold temperatures. Many of these performance advances are the result of innovations to
the metal hydride and nickel hydroxide materials [42, 46, 84]. However, the expensive raw
materials make the cost a serious issue [34].
Manufacturing process
Electrodes NiMH batteries are composed of nickel hydroxide on the positive electrode,
and hydrogen stored in an alloy consisting of vanadium, titanium, nickel, and other metals
on the negative electrode. The electrodes must be balanced to permit that the cell is always
positive-limited. This means that the negative electrode has a greater capacity than the
54

positive. The positive will reach full capacity first as the cell is charged, and the oxygen gas
generated will recombine in the negative electrode. This cycle provides a way of manage
overcharge currents efficiently [37, 85, 86].
Electrolyte The NiMH cell use an alkaline electrolyte, based in a solution of potassium
hydroxide with high conductivity. To improve cell performance and long cycle life, the
electrolyte concentration must remain constant over the entire range of state of charge or
discharge [87].
Separator The separator is made of nylon blend, to provides electrical isolation between
the electrodes while still allowing efficient ionic diffusion between them [85].
Assembly The electrode groups consist of alternately stacked positive electrodes and
negative electrodes inter-leaved with separators. Inserting these electrode groups into a
resin battery case, and sealing with a cover equipped with a valve after filling with alkaline
electrolyte, form the cell. A battery module consists of cells connected in series by metal
plates, and these are configured to permit airflow between the cells to ensure an uniform
temperature distribution. A sealing plate is equipped with a valve to prevent bursting with
an increase of internal pressure. To obtain high power characteristics, the reaction area of
the electrodes has been optimized, reducing resistance for current collection and improving
electrolyte composition [82, 85, 88].
In all cases, the materials have complex microstructures that allow the hydrogen storage
alloys to operate in the aggressive environment within the battery. An important design
factor within the metal hydride surface oxide is to maintain a balance between passivation
and corrosion. Passivation causes the active material to become electrically insulated from
the grid, which can limit the capacity of the battery available for discharge and the cycle
life. In turn, corrosion is highly destructive. Oxidation and corrosion of the anode metals
consumes electrolyte, changes the SoC balance, and creates corrosion products capable of
causing premature oxygen evolution. However, porosity within the oxide is important to
allow ionic access to the metallic catalysts and promote high rate discharge [84].
55

NiMH batteries in commercial vehicles
Today, several automakers have used the NiMH battery packs in commercial vehicles. Some
of them are presented below [59], [89]-[94].
• Toyota Prius: The Toyota Prius appeared in the U.S. in 2000, with a model change in
2004. The second generation Toyota Prius (with the Hybrid Synergy Drive system)
has an Advanced Technology Partial Zero Emission Vehicle (AT-PZEV) rating (given
by California Air Resources Board). Prius has a battery pack with 28 prismatic
NiMH modules from Panasonic, each containing six 1.2 volt cells connected in series
to produce a nominal voltage of 201.6 volts, and a total of 1.6 KWh of energy capacity.
The total number of cells is 168 (the first generation Prius consists of 228 cells packaged
in 38 modules). The weight of the battery pack is 53.3 kg. In addition, Prius uses the
conditioning air for cooling the battery. Given that power capability increases with
higher temperatures and decreases at lower temperatures, it has a control system to
monitor the battery temperature and charge level. A picture of the battery pack is
shown in Figure 3.5.
Figure 3.5: Toyota Prius battery pack [59]
• Toyota Camry: The Camry was the first hybrid model to be assembled in the U.S.
Camry drivetrain is composed of a 2.4 liter, four-cylinder gasoline engine, a 105 kW
electric motor, and a 244 volt battery pack. The battery pack consists of 34 NiMH
modules, each of which contains six 1.2 volt cells. The Camry Hybrid moves from 0
60 mph in about 8.9 seconds, about a second faster than the Prius. A battery pack’s
picture is shown in Figure 3.6.
56

Figure 3.6: Toyota Camry battery pack [92]
• Toyota Highlander: The NiMH battery of the Highlander Hybrid has 240 cells that
deliver a nominal voltage of 288 volts, but the motor generator units can operate on
voltages from 280 to 650 volts. This battery pack provides 40% more power than the
Prius battery, and is 18% smaller. Each module has its own battery monitoring and
cooling control system, which reduce efficiency problems due to heat, and ensure the
required electric power to the motor. A picture of Highlander’s battery pack is shown
below (Figure 3.7).
Figure 3.7: Toyota Highlander battery pack [59]
• Ford Escape: Introduced in 2004, Ford Escape combine SUV (Sport utility vehicle)
capability with the fuel economy and low environmental impact of a full hybrid. The
battery pack is made by Sanyo, and consists of 50 modules, and 250 NiMH cells.
Each battery cell has 1.3 volts and is contained in a stainless steel case. The nominal
voltage is 325 volts. A picture of Escape’s battery pack is shown in Figure 3.8
57

Figure 3.8: Ford Escape battery pack [93]
• Honda Insight: Figure 3.9 shows the Insight’s battery pack. This has a nominal
voltage of 144 volts, and is made of 120 Panasonic NiMH D cells of 1.2 volts, and is
monitored for the Integrated Motor Assists (IMA) power control unit.
Figure 3.9: Honda Insight battery pack [59]
• Saturn Vue: Saturn Vue uses a belt alternator starter (BAS) system, where a large
electric motor assists the traditional gas engine during acceleration. The electric
motor is powered by a 1.8 kWh, 300V NiMH battery, which is partially charged
through regenerative braking. The battery pack is made by Cobasys, consists of 22
NiMH modules and weighs about 55 lbs (Figure 3.10). The hybrid system is used to
provide the power for the accessories (12v), and the power to charge the battery.
Cost
The biggest disadvantage of NiMH batteries is the cost. The battery cost consists of two
parts, manufacturing cost and material expense [34]. The manufacturing cost depends on
58

Figure 3.10: Saturn Vue battery pack [59]
production volumes and manufacturing technology. The material cost depends on the neg-
ative electrode, positive electrode, separator, cell hardware and others, where the negative
electrode is the highest one, around 45% in total material cost. Therefore, developing a
cheap electrode is important for cost reduction of NiMH batteries [95].
Safety
Generally, NiMH cells contain a resealable safety vent into the top. In the case of charger
failure or improper cell/charger design, oxygen or even hydrogen can be generated faster
than it can be recombined. In these cases, the safety vent will open to reduce the pressure
and prevent cell rupture, and then will reseal once the pressure is relieved [85].
Recycling
To recycle the current generation of NiMH batteries, manufacturers destroy the battery
to find the metals between the plastic, plates, steel case and the wiring, to make sure the
materials are processed for disposal. Some automakers offer a compensation to help ensure
the battery is returned to a dealership and properly recycled [96].
59

After the market launch of NiMH batteries, the German company NIREC started works
on the recycling of these batteries in order to put nickel back into the cycle of materials. The
system is based on the separation, reclamation and use of the high quality nickel content
and the potential risk of hydrogen. Due to the possibility of hydrogen being released when
the NiMH batteries are broken down, the process must be done in a vacuum environment.
The batteries first pass through a cutting chamber to open up the casing and release the
stored hydrogen, then go into a collecting tank. After a stabilization period, the material
can be taken out. After separation of the plastic content, a usable product is obtained with
a high nickel content, which can be reused in stainless steel production (see Figure 3.11)
[44].
Figure 3.11: Recycling process for the NiMH battery at NIREC (based on [44])
3.8 Lithium Technology
Since late 80s, rechargeable lithium cells have been studied. They offer an increased energy
density in comparison with other rechargeable batteries, but with a still high cost. This
technology is becoming the principal choice for future development of PHEVs, and better
performance than NiCd or NiHM cells is expected. Two types of lithium batteries have
been studied recently: Lithium-Polymer and Lithium-ion batteries.
3.8.1 Lithium polymer batteries (LPB)
Lithium polymer batteries use lithium metal for the negative electrode, metal intercalation
oxide for the positive, and a polymer electrolyte. The lithium combines with the metal
60

oxide to form a lithium metal oxide and release energy. When the battery is recharged
the chemical reaction is reversed [44]. This battery has shown some difficulties related to
safety, and a decrease in performance due to passivation [43]. In addition, the operating
temperature of this battery must be kept above 40 ◦C, as below this, the electrolyte has a
low conductivity and therefore, a low performance. Therefore, heated element layers are
used to form the cell stack, and insulation is placed surrounding it, to ensure the correct
temperature no matter the external conditions. The main application for these batteries is
in telecommunications as backup power, but they have also been studied for use in electric
vehicles. However, they have been largely replaced by the lithium ion battery [82].
AVESTOR, a battery manufacturer, has been focused to the lithium metal polymer
battery (LMPB) development. The LMPB is an advanced battery technology under de-
velopment for both EV and HEV applications. A lithium metal polymer cell is made by
laminating together five thin materials including an insulator, a lithium foil anode, a solid
conductive polymer electrolyte, a metal oxide cathode and a current collector. This lami-
nate is very thin, and it is formed into a prismatic shape to construct an electrochemical
cell (EC), as shown in Figure 3.12. Different cells can be fabricated using the same man-
ufacturing equipment. This flexibility allows LMPB product configurations to be adapted
to different vehicles with little changes in the process and production cost. Because of the
solid state nature of LMPB, the cells can be wired into parallel and/or series arrangements
within a single container to build the desired module capacity and voltage [97, 98].
Figure 3.12: Structure of a Prismatic Li-ion battery cell [101]
61

3.8.2 Lithium-ion (Li-ion) batteries
The recent development in Li-ion batteries leads to a good anticipation in terms of perfor-
mance and cost, potential application in EV, and customer acceptance [35]. In comparison
with other rechargeable batteries, Li-ion provides very high specific energy and a large num-
ber of charge/discharge cycles. However, Li-ion batteries are only commercially available
in small sizes at this time. Large numbers of cells have to be assembled in series/parallel
configurations to achieve the desired battery sizes. This, combined with safety issues, and
requirement in vehicle autonomy, high energy density, high charge-discharge efficiency, good
load and temperature storage characteristics, accurate detection of battery SoC, long bat-
tery expected life, and good recyclability, present the challenges of making highly efficient
and reliable battery packs for EV [33, 49, 99, 100].
In addition to automotive companies, other manufacturers have invested in the Li-ion
technology. SAFT, a leading designer and manufacturer of advanced technology batteries,
has been focused in Li-ion energy storage technology. SAFT’s initial development focused on
prismatic designs. After evaluation, it was determined that a cylindrical form factor offered
certain performance and manufacturing advantages, specifically with respect to quality
control, automated assembly and reproducibility on an industrial scale (see Figure 3.13).
To meet the different energy and voltage requirements of individual automakers, a six
cell module was designed to provide three different voltages and capacities, by internally
connecting the cells in different fixed, series and parallel connections. In addition, SAFT’s
design places individual cell monitoring and control at the module level, and uses liquid to
cool the module and provide effective thermal management [97].
Manufacturing process
“Basically, there is no difference between the technology implemented in small portable
Li-ion cells and large industrial cells” [102]. The manufacturing process is shown in Figure
3.14, and explained as follows.
Electrodes Electrode manufacturing processes consist of coating metallic foils with a
slurry containing the active material, an electronic conductor, and a binder dissolved in
62

Figure 3.13: Structure of a Cylindrical Li-ion battery cell [101]
a solvent. After drying, this coating is calendered to the desired thickness and density.
The electrode thickness depends on the maximal power required. This allows a wide range
of power and energy ratio designs with the same basic electrode manufacturing process
[101, 102]. The material used for the cathode is a metal oxide. SAFT and Polystor use
nickel, or mixed nickel/cobalt-based cathodes, while Sony, Varta and Shin-Kobe (Hitachi)
are developing cells with manganese-based cathodes. The anode, or negative electrode, is
generally made of graphite coated on copper foil, but other forms of carbon can be used
[103].
Electrolytes The electrolyte in a lithium ion cell consists of a lithium salt dissolved in
one or more organic liquids. There is no significant difference in the nature of electrolytes,
where Lithium Hexafluorophosphate (LiPF6) is the most common salt, and cyclic or linear
carbonates are the basis of the organic solvents [102]. Lately, there is a high interest in
developing flame-retardant electrolytes, using additives, rather than replacing the organic
solvents [103].
Separators Separators, all in the form of thin microporous membranes, may be either in
polypropylene or polyethylene, or mixed polymers [102]. Separators for either high-energy
or high-power Li-ion batteries are typically made from polyolefin using layers with 50%
porosity. The separators keep the positive and negative electrodes apart, and serve as a
63

Figure 3.14: Manufacturing process for the Li-ion battery (based on [101])
64

safety device: if a cell becomes too hot, the low melting polymers melt, closing off the pores
through which the ions travel, and cutting off the cell current [103].
Cell design The main feature of Li-ion cells is that the current is carried by lithium ions,
from the positive electrode (cathode) to the negative electrode (anode) during charging, and
from negative to positive during discharging. The basic cell chemistry and design are the
same for all types of Li-ion automotive cells. Thin layers of cathode, separator, and anode
are rolled up and inserted into a cylindrical can. The gaps are filled with liquid electrolyte.
The size of the cell and the quantities of different materials contained in the cell are the
main difference between a cell optimized for high energy density (for EV) and the one for
high power (for HEV). Both cells can utilize the same basic spiral-wound design, same
materials, and even the same current collectors and separators. However, the high-power
cells must be smaller than the high-energy cells in order to dissipate the higher heat load
generated. In addition, high-power batteries require less total energy, so that the battery
packs for HEVs can be made smaller and lighter [103].
Cell assembly There are multiple designs for assembling cells into a battery pack for
electric and hybrid vehicles. The most commonly used is the modular design, where cells
are packaged together into a module. Given that Li-ion cells can suffer serious damage
on overcharge or overdischarge, control devices are included in each module. In batteries
with organic electrolyte, the end of charge and discharge voltages must be monitored for
each cell or parallel grouping, with specific battery management features. Depending on
the requirements of the vehicle, the modules can be combined into different sizes of battery
packs [101, 102]. Most automotive cell designs are cylindrical, although some manufacturers
produce prismatic cells. Prismatic cells offer better volume filling in assembly, but they are
more sensitive to deform on cycling or aging. Cylindrical cells have better mechanical
characteristics and dimensional stability within the electrode stack. Because of the small
electrode’s thickness, the cell stack is built by rolling the electrodes in spiral. The coil may
be cylindrical or flattened to make a rectangular shaped cell [101, 102].
65
The process to assemble cylindrical cells is described as follows: the electrodes are
formed from pastes of active material powders, binders, solvents, and additives. Then
the coating machines spread them on current collector foils, such as aluminum (Al) for
the cathode side and copper (Cu) for the anode side. After homogeneous thickness and
particle size are achieved, they are cut to the correct width. The stacks are formed by
putting separator, anode, separator, cathode, and then are rolled up to cylindrical cells,
inserted in cylindrical cases, and welded to a conducting tab. Then, the cells are filled with
electrolyte. The electrolyte has to wet the separator, soak in, and wet the electrodes. The
wetting and soaking process are the slowest steps and determine the speed of the line. Some
insulators, seals, and safety devices are also attached and connected. Finally, the cells are
charged, discharged (formation process), and tested to satisfy manufacturer’s requirements
[101, 104, 105].
Battery assembly Once the individual cells are ready, they are assembled together into
a module. The individual cells are placed one on top of another, and isolated with foam, so
that they do not touch each other. Each module has a determined number of cells with total
energy in the range of 1 to 2 kWh. Li-ion cell’s flexibility allows direct parallel connection
to get the desired capacity without other electronic components, and the ability to work in
any position. Given that Li-ion cells can suffer serious damage on overcharge/overdischarge,
each cell or module has an electronic board for specific battery management, monitoring and
control. Depending on the requirements of the vehicle, the modules can be combined into
different sizes of battery packs. Finally, a battery system consist of an assembly of modules
electrically connected in series, a cooling system (air or liquid), a fuse for protection against
short circuit, a contactor to insulate the battery from the vehicle, and a ground fault
detector. These subsystems are usually managed by a controller that collects information
and communicates with the automobile [101, 102].
Many manufacturers are planing to build their own battery assembly plants. In GM
plant, three primary assembly processes are identified: the battery module pre-assembly,
where cells are processed and installed into one of three battery modules. The final assembly
area is where final assembly and testing of the three modules required for each battery pack
66

takes place. Also in this area, the prismatic-shaped cells are processed and installed by
flexible automated equipment into modules, which are then delivered to the battery pack
main line. The battery pack main line area has an Automated Guided Cart (ACG) system
that includes operations for thermal and electrical assembly, quality and dimensional checks.
Battery pack’s final testing, verification and packaging for shipment are made in this area
too [52, 63, 64]. The Volt’s battery pack is made up of multiple linked battery modules and
more than 200 battery cells, storing 16 KWh in a 5-foot-long container weighing 400 lbs
[52, 64].
Process Control Additionally to having a well-designed battery, process control is just as
important. This manufacturing process is based on tight tolerances and strict control though
the process. Contamination or physical damage on the electrodes have to be identified,
because they can cause penetration of the separator, resulting in internal short circuits in
the cell. Protection method for prevention or control is needed [108]. Moreover, during
formation, as no overcharge detection mechanism exist in batteries with organic electrolyte,
special battery management features must be implemented for each cell or module, in order
to monitor charge and discharge voltages. The fuel gauge is a very used mechanism to
acquire real time information about the actual SoC [102].
Packaging and shipping The packaging is a critical step after assembly. It is important
that there is no reaction of the electrolyte with the packaging material or release of water
from the material into the electrolyte [106]. Typically, aluminum cases for Li-ion batteries
are used, since it is lighter and cheaper. Plastic is not used because it could be dissolved
by the organic electrolytes [103].
Materials for Li-ion EV batteries may change, as well as the health and safety hazards,
environmental concerns, and shipping requirements. Basically, the shipping requirements
imposed by the U.S. Department of Transportation (DOT) regulations can change depend-
ing upon 4 different cases, if the battery is cycled or uncycled (a cycled Li-ion battery is
one in which the carbon electrode has been lithiated as a result of subjecting the battery
to at least one charging cycle) [107]:
67
• Uncycled dry battery: Given that there is no free electrolyte in the battery, and the
non lithiated carbon electrode is not considered hazardous, no special requirements
have to be met.
• Uncycled wet battery: If there is free electrolyte in the battery, and it is considered
hazardous (flammable, corrosive, poison), the battery will be subject to the provisions
of the DOT transport regulations.
• Cycled battery, fully discharged state: fully discharged state means the battery has
been discharged to an extent that all or most of the lithium has been removed from
the carbon electrodes; if there is presence of lithium in the carbon matrix, on con-
tact with water, the lithiated carbon electrode would probably evolve flammable gas
(hydrogen), and be considered a hazardous material. Also, it is necessary that there
is not enough stored electrical energy in the battery such that there is no risk of a
dangerous evolution of heat or gas as a result of internal or external short circuit.
• Cycled battery, charged state: in this case, the lithiated carbon electrode evolves
hydrogen on contact with water at a high rate and there is sufficient stored energy in
the battery to suppose a significant hazard in transport. This case poses the highest
level of risk and the applicable regulatory requirements must be determined.
Safety
Li-ion battery technology is not intrinsically safe. Short circuit, overcharge, overdischarge,
and high temperature can lead to thermal runaway, fire, and explosion [105]. When an
overvoltage affects the cells, overcharge can be avoided using redundant voltage thresholds.
If a short or overloading occur, overheating can be avoided by limiting the maximum current,
with fuses or thermal sensors [102]. Because Li-ion cells do not have an inherent balance
mechanism, they need an active external system, especially in EVs, where many cells are
used in series. A basic external control system consists of a bypass circuit controlled by
a microcontroller. When a cell reaches a given SoC (or discharge) before other cells, the
bypass circuit is activated, discontinuing the charging (or discharging) process for that cell
68

until balance is reached. In this way, balance is maintained between the cells and damage
to individual cells is avoided [103].
In addition, to the fact that Li-ion batteries have highly oxidizing materials, their safety
is compromised because the cells have a poor heat dissipation. Other safety mechanisms are
also considered by manufacturers, such as pressure release valves, one-shot fuses, reversible
and irreversible positive temperature coefficient elements, shutdown separators, chemical
shuttles, non-flammable electrolytes and coatings. Compared to lithium metal batteries,
Li-ion cells are considered safer [109].
Cost
Current Li-ion battery cost per KW is still high. In theory, lithium based cells for HEVs
should be inexpensive because the raw material is a natural resource, but the costs are still
high due to expensive development processes and production costs (materials processing,
manufacturing of the cells, and packaging) [42, 105].
Even when Li-ion battery cost is still higher for comparable applications than those
of NiMH batteries, the cost projected for mass-produced EV batteries is comparable or
lower. To fabricate a battery of the same capacity and voltage, 70% fewer cells of the
same size are required. Also, little or no need for changes and cost increases are estimated
when going from PHEV designs to EV designs, because both have similar specific power
capabilities. Finally, the cost of raw materials are expected to decrease more with high
production volume than NiMH materials. As a result, the projection for mass-produced
Li-ion batteries to meet the cost requirements for PHEV applications is positive [110].
Environmental issues
The use of organic solvents in the electrode manufacture implies a high cost and multiple
environmental concerns because of their toxicity, which may reduce the potential to take
manufacturing cost down to the level required for wide adoption in many applications.
Because of this, different approaches has been provided. For example, International Battery
Company focuses on manufacturing Li-ion cells using a water soluble binder based process
for both the cathode and anode, where water is used as a medium to dissolve and disperse
69

the binders and the electrode materials. By eliminating the solvent from the manufacturing
process, the material cost and capital investment can be reduced [111].
Additionally, environmental regulations are important considerations in developing any
new battery technology. Li-ion battery manufacturing processes can generate water and
air emissions and solid waste. Paper [107] presents U.S. Environmental Protection Agency
(EPA) regulations related to these issues that have been included in the following acts: the
Clean Water Act (CWA), the Clean Air Act (CAA), and the Resource Conservation and
Recovery Act (RCRA).
In the CWA, there are 65 categories of “priority pollutants”, and some of them can
be used in Li-ion manufacturing processes, including nickel, arsenic, copper, and associ-
ated compounds. The National Pollutant Discharge Elimination System (NPDES) requires
facilities to obtain permits to start discharge of pollutants to surface waters. Industrial dis-
charge and permits issued by the publicly owned treatment works (POTWs) are required
to satisfy general pretreatment standards. In Li-ion manufacturing, substances other than
lithium and hydrogen that can be contained in the electrolyte have to be pretreated because
of their flammable characteristics.
Battery manufacturing is listed as a major source category in the CAA. Li-ion battery
manufacturing uses hazardous air pollutants like manganese, nickel, cobalt, and arsenic (and
their compounds). Additionally, other volatile organic compounds like carbon monoxide and
nitrogen oxides can be generated during manufacturing. The facility may have to accomplish
with applicable pollutant requirements specified in the State Implementation Plans (SIP).
Each state is responsible for ensuring that the air quality is maintained at a level consistent
with the National Ambient Air Quality Standard (NAAQS) program.
Finally, the RCRA controls the discharge of solid waste that the EPA considers as
hazardous, corrosive, flammable, reactive, or toxic. For example, lithium may be reactive,
and arsenic may be toxic, and therefore hazardous when discarded. Based on this, RCRA
imposed waste minimization requirements on hazardous waste generators, which include
source reduction and recycling.
70

Recycling
Recycling of automotive batteries is easier than recycling of small portable cells. First,
collection plans have been used for returning of automotive batteries with each new battery
purchase and stripping batteries from wrecks before shredding. Second, the batteries are
large enough to permit separation by type, to maximize the value of recovered materials.
Third, there is enough material in large pieces to justify partial disassembly. The recycling
approaches typically include discharging the cells, venting the electrolyte solvent, shredding
the entire package, and recovering the solvent flashed off [103]. For safety, most processing
schemes include cryogenics, inert atmospheres, or other techniques to reduce the contact
to the components. However, a generic process is proposed by the National Renewable
Energy Laboratory (NREL), for recovery of materials from Li-ion cells without cell venting
or disassembly [103, 107].
Recently, the US Department of Energy (DOE) granted $9.5 million to Toxco, to build
the first recycling facility for Li-ion vehicle batteries in America. Toxco is a leading battery
recycler and works on single-charge and rechargeable lithium batteries found in electronics
devices and industrial applications [96]. Its process consist in chilling the batteries to
−325 ◦F in liquid nitrogen (see Figure 3.15). Large batteries are sheared into three pieces
in a caustic bath, to dissolve the lithium salts, and neutralize the acidic elements. The salts
are used to produce lithium carbonate. Hydrogen and organic burn off at the surface of the
process bath. Cobalt can be recover from the sludge. The large pieces remaining are sent
to a hammer mill, to recover ferrous and nonferrous metals. Plastics and paper float to the
top and are recovered for disposal or recycling. The carbon sludge is filtered out, but is not
economical to reuse it [96, 103].
Moreover, Sony recycling process involves calcining to bake out the electrolyte, which
deactivate the cells for disassembly; in the case of large batteries, these are vented first [103].
In turn, Accurec developed the RVD (recycling through vacuum distillation) procedure for
lithium manganese oxide batteries. In France, SNAM (from French: National Union of
Metal Products and their Derivatives) also offers a reprocessing procedure for lithium sec-
ondary systems; after deactivation, the metals are separated and returned to the production
71

Figure 3.15: Recycling process for the Li-ion battery at Toxco (based on [103])
cycle [44]. In addition, Nikkei reported recently that Japan’s Nippon Mining&Metals Co.
and GS Yuasa Corp., are going to start lithium recycling from scrapped electric and hybrid
vehicles batteries. Nippon developed a technology to extract lithium from the batteries,
and plans to have its trial plant in 2011. GS Yuasa, a major producer of automotive bat-
teries, will begin collecting used Li-ion batteries to develop its recycling process based on
the lithium utilization in different parts of the batteries [96].
Li-ion batteries recycling is not a mature process, even when the cobalt recovery makes
it economically attractive. Most batteries contain small amounts of lithium carbonate,
and the material is relatively inexpensive compared to other metals, such as nickel and
cobalt. Unlike lead-acid car batteries, advanced Li-ion batteries do not use harmful acids
or metals to store electrical power. Li-ion batteries use copper, cobalt, iron and nickel that
are considered safe for landfills and incinerators after appropriate treatment, according to
the EPA [96, 103].
3.9 Sodium-Based Technology
Since 1980, a number of batteries using negative electrodes based on sodium were developed.
These batteries are characterized for using one or more liquid electrodes and a solid ceramic
electrolyte. Hence, their operation at high temperatures makes them practical to be used in
72

EVs, but no in small applications. However, their development for commercial application
has not been successful [43].
3.9.1 Sodium-sulphur (NaS) batteries
The NaS battery has a negative electrode made of molten sodium, a positive electrode made
of molten sulphur, and an electrolyte that consists of a solid β-alumina ceramic, which
conducts the sodium ions and also separates the two electrodes. Small cells are built, joined
together, and placed in an evacuated chamber to reduce heat losses. The container must
provide very good thermal insulation, and it is usually very heavy, which makes the battery
inappropriate for small applications. In addition, this battery needs a good temperature
control system to reach its operation temperature (around 350 ◦C) before it is used, to
ensure that Na and S are liquid, and the solid electrolyte has a high Na conductivity [43].
In general, a ceramic tube hermetically sealed is connected to the negative and positive
poles formed by the cell case. The sulfur is contained between the ceramic tube and the
cell case. A carbon-felt is added to provide conductivity, given that sulfur and polysodium
sulfur are electrically nonconductive. The cell case is made out of aluminum and the inside
is coated with a conductive layer to protect the cell against corrosion [44]. The energy
density of the NaS battery is very high compared with the lead-acid and the NiCd, which
makes it suitable for energy storage. Also, this battery presents good power density, high
cycle life, independence of external temperature, and moderate cost [82]. However, some
vehicle tests showed some safety issues related to the reactions between the active materials,
and risk of spontaneous fire was detected [43].
3.9.2 Sodium-metal chloride (Na/NiCl2 or Zebra) batteries
The initial research with this battery was conducted in South Africa for EV applications,
and the name Zebra (zero emission battery research activity) is commonly used. This
battery is similar to the NaS battery, but has solved NaS safety problems by using a solid
positive electrode, which is separated from the molten sodium metal by both solid and
liquid electrolytes to prevent undesirable reactions. The zebra cell uses solid nickel chloride
(NiCl2) for the positive electrode and molten sodium for the negative electrode. It has two
73

electrolytes: a beta ceramic electrolyte surrounding the sodium, and a secondary electrolyte,
sodium-aluminium chloride, used in the positive electrode chamber [43].
Cell assembly
Na/NiCl2 cells are produced in the discharged state to avoid the handling of metallic sodium.
All the required sodium is inserted as a salt. The current collector is a wire with an inside
copper core, and it is connected to the positive pole and to an outside nickel plating to
be consistent with the cell chemistry. The cathode material, a mixture of salt with nickel
powder and some samples of iron and aluminum, is filled into a β-alumina tube. This tube
is corrugated to reduce the resistance and is surrounded to the cell case, using a thin steel
sheet that forms a gap around the tube. The cell case is formed using a rectangular tube
welded and formed from a nickel-coated steel strip and a laser-welded bottom cap. Finally,
the cell case forms the negative pole [44].
Battery assembly
ZEBRA cells can be connected in parallel and in series. It is possible to connect several cells
in series, without parallel connections, because cell imbalances are leveled out by chemical
reactions. Different battery types have been made with one to five parallel strings, up to 220
cells in series, and 100 to 500 cells in one battery pack. The standard battery type Z5 has
216 cells arranged in one or two strings (557V and 278V respectively). In addition, cooling
plates are used between every second cells to permit air circulation [44]. An issue with
Zebra batteries is that they operate at a temperature of about 300 ◦C, so heat insulation is
needed. A double skinned stainless steel box is used for thermal insulation and mechanical
support. All the air is removed from the insulation, to maintain the vacuum for several
years. The main disadvantage of this battery type is that it needs to be connected to a
main energy supply when it is not in use, to keep the operation temperature [43]. However,
this battery presents many advantages, such as high energy density, a good tolerance to
overcharge and overdischarge, good cyclability, independence to external temperature, low
corrosion, and intrinsic safety, which make it a good option for further development of EV
applications [82].
74

Recycling
The main process in zebra batteries recycling is dismantling. The process is certified and
does not suppose a high cost. In summary, the stainless steel and silicon dioxide (SiO2)
that form the box are recycled by established processes. Given that the cells contain nickel
(Ni), iron (Fe), salt, and ceramic, they can be added to the steel melting process of the
stainless steel production. Nickel and iron help in the material production, and the ceramic
and salt are used to form the slag [44].
3.10 Summary
In this chapter, the main characteristics for hybrid and electric vehicles are presented, as well
as the powertrain configurations used, and the battery parameters needed to understand
their performance. It can be seen that power and energy stored are the main specifications
for the battery design. However, designers must also have in mind other aspects like safety
of the energy storage system, temperature operational ranges, stability over life in terms
of ageing and calendar life, and production issues like cost and raw materials. In addition,
energy and battery management concepts have been presented in order to understand the
importance of maintaining the battery in the appropriate operational environment by using
a BMS. Also SoC, SoH and SoF have been defined, as well as some approaches to determine
battery status.
Additionally, a review of the state of the art in battery manufacturing for hybrid and
electrical vehicles is presented. Some well-known technologies that have been considered for
these applications, such as lead-acid, nickel, lithium, and sodium-based batteries are stud-
ied, and their main advantages and limitations for commercial development are reviewed.
The main contestants for present and future development of hybrid and electric vehicles,
NiMH and Li-ion batteries are analyzed, and their manufacturing processes, as well as some
recycling and environmental issues are addressed. The NiMH battery used in actual HEVs
is relatively small and light, has good life-cycle characteristics, high power, high level of
safety, and improved thermal performance. However the cost is still high, and the recycling
processes are under development. On the other hand, Li-ion batteries are characterized for
75

high energy density, high charge-discharge efficiency, good load and temperature storage
characteristics, long battery expected life, and good recyclability. The main drawback is
safety, but different procedures and transportation requirements have been defined. It can
be seen that substantial effort needs to be devoted to large volume manufacturing of bat-
teries for EVs and HEVs in the near future, which will make this area with great challenges
and promising research opportunities.
76

Chapter 4
CONCLUSIONS AND FUTURE WORK
One of the main challenges of the 21st century is the development of a sustainable world
economy, especially regarding the transportation sector. Increments in world population,
energy consumption and green house gas emissions, as well as the depletion of fossil fuel
reserves have boosted different approaches for clean transportation development based on
new energy sources and energy reduction improvements. Therefore, energy must be obtained
from renewable resources, and produced by cleaner and more efficient technologies, while the
production processes must be redesigned to use it more efficiently, promote its conservation,
and improve productivity and quality.
In vehicle manufacturing, paint shop units consume the largest amount of energy in
the plant. This thesis presents a case study in an automotive paint shop and shows how
energy use can be reduced by a redesign of the repair capacity, so that unnecessary repaints
are minimized. This change in the process design results in significant reduction of energy
consumption. In this case, almost 4% energy reduction can be obtained. Clearly, this
also implies a great environmental benefit due to less emissions are generated. The benefit
over the long-term on energy reduction, productivity and quality will be reflected in larger
production volume, earnings, and customer satisfaction. Furthermore, this model can be
used for plant engineers and managers as a quantitative tool to evaluate energy reduction
efforts in order to meet environmental regulations.
On the other hand, recent developments on renewable energy sources for new genera-
tion vehicles have an increasing importance in transportation industry. Biofuels, hydrogen,
and electric power are target of exhaustive research from different governments and sev-
eral scientific laboratories. But short-term, the main solution being adopted for major
automakers is the development of batteries for hybrid and electric vehicles. Hybrids have
become the actual transition technology from pure electrics to other future options like fuel
77
cell vehicles. The convenience factor of energy regeneration during driving in hybrid elec-
tric vehicles (HEV), combined with actual developments of plug-in hybrid electric vehicles
(PHEV) where the battery can be externally charged, and the near future of all battery
electric vehicles (BEV) promise an increase in fuel efficiency and reduction of greenhouse
gas emissions.
Different technologies based on lead-acid, nickel, sodium and lithium have been tested
in the last 30 years with promising results, which have increased interest in their research
and development for mass production. Manufacturing processes, process control, cost,
recycling and environmental issues have been reviewed for the main candidates of each
group. Recently, two major battery technologies are in the spotlight of major automakers
and battery manufacturers: NiMH and Li-ion. NiMH batteries, actually used for most
of the HEVs in the market, are characterized for good life cycle, high level of safety, and
smaller high power cells designed to dissipate higher heat loads generated, which make these
batteries relatively smaller and lighter. In turn, Li-ion batteries are characterized for long
battery life, high charge-discharge efficiency, good thermal performance and optimized high
energy density cells, ideal for EV. However, considerable efforts need to be dedicated for
the development and mass production of advanced batteries to overcome factors related to
high cost in raw materials, manufacturing technology and process control, high safety in
production processes, shipping and handling, and new recyclability methods, which make
this a promising area for research opportunities.
In future work, the model presented in Chapter 2 can be extended to the analysis of emis-
sions generated in paint shops at the car manufacturing plants. When a car gets painted,
paint fumes containing potent greenhouse gases are captured and incinerated using a pro-
cess that consumes huge amounts of natural gas which creates significant carbon dioxide
and nitrogen oxide emissions. Following a similar analytical method based on rework and
repair capacity will enable companies to monitor CO2 and nitrogen emissions, and record
data to meet the environmental legislations and standards. Moreover, this model can be
helpful to analyze each process in more detail, and extended to be combined with Pro-
duction Systems Engineering (PSE) parameters, i.e. performance analysis and prediction.
This includes inspection allocations, buffer design, machine speed, batch size, line layout,
78

and work load balancing, etc., which are related directly to energy efficiency and product
quality.
Recently, hybrid and electric vehicle battery assembly plants have been implemented
in the U.S. for battery manufacturers and major automakers. Therefore, efforts must be
concentrated on the design, analysis and control of the production processes. Design param-
eters such as layout, capacity, reliability, cycle time, etc., may be analyzed to optimize the
manufacturing system efficiency and the product quality. Since these systems imply new
technologies and production processes, analysis and prediction of production performance,
including throughput, work-in-process, and customer demand satisfaction are required.
In addition, quality control mechanisms must be implemented, i.e., quality inspection,
quality containment and rectification, in order to ensure high quality products that meet
company standards. The effective use of repair and rework provides the opportunity to
improve system performance, and as showed before, the efficient use of resources. Finally,
processes like remanufacturing and recycling need to be studied in order to leverage resources
and decrease the environmental impact. An adequate management of remanufacturing of
products not only lessens cost, but also eases environmental burdens. At the same time,
efficient and safe use of demanufacturing processes and recycling of raw materials provide not
only an excellent method for disposal of hazardous waste, but also an important procedure
for reutilization of resources and environmental conservation.
79

APPENDIX
Proof of Theorem 1: The following two cases are considered: Case 1, when minor
repair has sufficient capacity, and Case 2, when minor repair does not have enough capacity.
Case 1: When minor repair has enough capacity, no jobs needing minor repair will be
rerouted to rework (N ≥ ns(t)). Then:
nr = n[1− q(t)]αr + nr[1− ρq(t)]αr + nxβxr + nsβsr (A.1)
nx = n[1− q(t)]αx + nr[1− ρq(t)]αx + nsβsx (A.2)
ns = n[1− q(t)]αs + nr[1− ρq(t)]αs + nxβxs + nsβss (A.3)
ng = nq(t) + nrρq(t) + nsβsg + nxβxg (A.4)
Substitute equation (A.2) into equation (A.3):
ns = n(1− q(t))αs + nr(1− ρq(t))αs + [n(1− q(t))αx + nr(1− ρq(t))αx + nsβsx]βxs
+nsβss
= n(1− q(t))(αs + αxβxs) + nr(1− ρq(t))(αs + αxβxs) + ns(βsxβxs + βss)
= α′s[n(1− q(t)) + nr(1− ρq(t))]
where
α′s =
αs + αxβxs1− βss − βsxβxs
(A.5)
Substituting ns into equation (A.2):
nx = n(1− q(t))αx + nr(1− ρq(t))αx + α′s[n(1− q(t)) + nr(1− ρq(t))]βsx
= [n(1− q(t)) + nr(1− ρq(t))](αx + α′sβsx)
= α′x[n(1− q(t)) + nr(1− ρq(t))]
80

where
α′x =
αx − αxβss + αsβsx1− βss − βsxβxs
(A.6)
Replacing ns and nx into equation (A.1):
nr = n(1− q(t))αr + nr(1− ρq(t))αr + [α′x[n(1− q(t)) + nr(1− ρq(t))]]βxr
+[α′s[n(1− q(t)) + nr(1− ρq(t))]]βsr
= (αr + α′xβxr + α′
sβsr)[n(1− q(t)) + nr(1− ρq(t))]
= α′r[n(1− q(t)) + nr(1− ρq(t))]
and
α′r = αr +
αs(βsr + βsxβxr) + αx(βxr + βxsβsr − βssβxr)
1− βss − βsxβxs. (A.7)
Therefore
nr =n[1− q(t)]α′
r
1− [1− ρq(t)]α′r
, (A.8)
and
ns =α′sn[1− q(t)]
1− [1− ρq(t)]α′r
. (A.9)
Then, using equation (4), the total energy usage in painting in day t, for (N ≥ ns(t)):
E(t) = c · (n+ nr(t))
= c[n+
n[1− q(t)]α′r
1− [1− ρq(t)]α′r
]
= cn[1− α′
r[1− ρq(t)] + α′r[1− q(t)]
1− α′r[1− ρq(t)]
] (A.10)
81

Case 2: When minor repair does not have sufficient capacity (N < ns(t)), some jobs that
only need to go to minor repair will be rerouted to rework . Then:
nr = n[1− q(t)]αr + nr[1− ρq(t)]αr + nxβxr +Nβsr + ns −N (A.11)
nx = n[1− q(t)]αx + nr[1− ρq(t)]αx +Nβsx (A.12)
ns = n[1− q(t)]αs + nr[1− ρq(t)]αs + nxβxs +Nβss (A.13)
ng = nq(t) + nrρq(t) +Nβsg + nxβxg (A.14)
Substituting equation (A.12) into equation (A.13),
ns = n(1− q(t))αs + nr(1− ρq(t))αs + [n(1− q(t))αx
+nr(1− ρq(t))αx +Nβsx]βxs +Nβss
= [n(1− q(t)) + nr(1− ρq(t))](αs + αxβxs) +N(βsxβxs + βss)
Replacing ns and nx into equation (A.11):
nr = [n(1− q(t)) + nr(1− ρq(t))]αr +Nβsr + [n(1− q(t)) + nr(1− ρq(t))](αs + αxβxs)
+N(βss + βsxβxs)−N + [n(1− q(t)) + nr(1− ρq(t))]αxβxr +Nβsxβxr
= [n(1− q(t)) + nr(1− ρq(t))](αr + αs + αxβxs + αxβxr)
+N(βsr + βss + βsxβxs + βsxβxr − 1)
Using equations (1) to (3):
nr = [n(1− q(t)) + nr(1− ρq(t))](1− αxβxg)−N(βsg + βsxβxg)
Thus,
nr =n(1− q(t))(1− αxβxg)−N(βsg + βsxβxg)
1− [1− ρq(t)][1− αxβxg](A.15)
82

Then, using equation (4), the total energy usage in painting in day t, for (N < ns(t)):
E(t) = c · (n+ nr(t)).
= c[n+
n(1− q(t))(1− αxβxg)−N(βsg + βsxβxg)
1− [1− ρq(t)][1− αxβxg]
]
=cn[1− (1− ρq(t))(1− αxβxg) + (1− q(t))(1− αxβxg)]
1− [1− ρq(t)][1− αxβxg]
− cN(βsg + βsxβxg)
1− [1− ρq(t)][1− αxβxg](A.16)
Proof of Corollary 1: When minor repair capacity is insufficient,
∂E(t)
∂N= − c(βsg + βsxβxg)
1− [1− ρq(t)][1− αxβxg]
< 0,
Therefore, E(t) is monotonically decreasing with respect to N . As a result, E(t) observe
the same monotonic properties.
Proof of Corollary 2: From equation 5 for N ≥ ns(t),
∂E(t)
∂q= −
n[α′rρ+ α′2
r qρ(ρ− 1)− α′r(ρ− 1)[1− α′
r(1− ρq)]]
[1− α′r(1− ρq)]2
< 0
we can show that
∂2E(t)
∂q2=
n[2ρ2[α′2
r + α′3r q(ρ− 1)][1− α′
r(1− ρq)]]− n
[2α′2
r ρ(ρ− 1)[1− α′r(1− ρq)]2
]
[1− α′r(1− ρq)]4
> 0.
83

From equation 5 for N < ns(t),
∂E(t)
∂q=
−cn(1− ρ+ ραxβxg − αxβxg)(αxβxg)−[cn− cN(βsg + βsxβxg)
](ρ− ραxβxg)[
αxβxg + q(ρ− ραxβxg)]2
< 0
and
∂2E(t)
∂q2=
[[cn(1− ρ+ ραxβxg − αxβxg)(αxβxg)] +
[c[n−N(βsg + βsxβxg)](ρ− ραxβxg)
][αxβxg + q(ρ− ραxβxg)
]4]
·[2(αxβxg + q(ρ− ραxβxg)
)(ρ− ραxβxg)
]
> 0
Thus E(t) is a convex function. By Jensen’s inequality [112], the conclusion is obtained.
Proof of Theorem 2: To calculate the average energy used values, the condition
N > ns(t) must be written in terms of q(t) (using equation (A.9)):
N ≥ α′sn[1− q(t)]
1− [1− ρq(t)]α′r
N −Nα′r +Nρα′
rq(t) ≥ nα′s − nα′
sq(t)
q(t) ≥ nα′s −N(1− α′
r)
nα′s +Nρα′
r
The minimum first time quality necessary to avoid rerouted jobs is qs:
qs =nα′
s −N(1− α′r)
nα′s +Nρα′
r
. (A.17)
Then, N > ns(t) implies that q(t) ≥ qs. Therefore, E(t) can be written as:
E(t) = E(E(t)/q(t) ≥ qs)Prob(q(t) ≥ qs) + E(E(t)/q(t) < qs)Prob(q(t) < qs).
When q(t) ≥ qs, no jobs are rerouted. Then, the following cases are considered:
qa ≤ qs ≤ qb, qs < qa and qs > qb.
84

Case 1: When qa ≤ qs ≤ qb:
Using E(t) from equation (A.10) to calculate the expected value for E(E(t)/q(t) ≥ qs):
E(E(t)/q(t) ≥ qs) =
∫ qb
qs
cn
[1− α′
r[1− ρq] + α′r[1− q]
1− α′r[1− ρq]
]×[
1
qb − qs
]dq
=cn
qb − qs
∫ qb
qs
1 + (α′rρ− α′
r)q
(1− α′r) + α′
rρqdq
=cn
qb − qs
[(1
α′rρ
− (α′rρ− α′
r)(1− α′r)
(α′rρ)
2
)
×[ln(α′
rρqb + 1− α′r)− ln(α′
rρqs + 1− α′r)
]
+(α′
rρ− α′r)
α′rρ
(qb − qs)
](A.18)
Using E(t) from equation (A.16) for E(E(t)/q(t) < qs):
E(E(t)/q(t) < qs) =
[ ∫ qs
qa
cn[1− (1− ρq)(1− αxβxg)]
1− (1− ρq)(1− αxβxg)dq +
∫ qs
qa
cn[(1− q)(1− αxβxg)]
1− (1− ρq)(1− αxβxg)dq
−∫ qs
qa
cN(βsg + βsxβxg)
1− (1− ρq)(1− αxβxg)dq
]×[
1
qs − qa
]
E(E(t)/q(t) < qs) =1
qs − qa
[(cn
(ρ− ραxβxg)− cn(αxβxg + ρ− ραxβxg − 1)
(ρ− ραxβxg)2
−cN(βsg + βsxβxg)
(ρ− ραxβxg)
)×
[ln
((ρ− ραxβxg)qs + αxβxg
)
− ln((ρ− ραxβxg)qa + αxβxg
)]
+cn(αxβxg + ρ− ραxβxg − 1)(qs − qa)
ρ− ραxβxg
](A.19)
85

Therefore, the average energy used equals to:
E(E(t)) =cn(qb − qs)
(qb − qa)(qb − qs)
[(1
α′rρ
− (α′rρ− α′
r)(1− α′r)
(α′rρ)
2
)
×[ln(α′
rρqb + 1− α′r)− ln(α′
rρqs + 1− α′r)]
+(α′
rρ− α′r)
α′rρ
(qb − qs)
]+
c(qs − qa)
(qb − qa)(qs − qa)
×[(
n
(ρ− ραxβxg)− n(αxβxg + ρ− ραxβxg − 1)
(ρ− ραxβxg)2
−N(βsg + βsxβxg)
(ρ− ραxβxg)
)×
[ln
((ρ− ραxβxg)qs + αxβxg
)
− ln((ρ− ραxβxg)qa + αxβxg
)]
+cn(αxβxg + ρ− ραxβxg − 1)(qs − qa)
ρ− ραxβxg
]
=cn
(qb − qa)
[(1
α′rρ
− (α′rρ− α′
r)(1− α′r)
(α′rρ)
2
)
×[ln(α′
rρqb + 1− α′r)− ln(α′
rρqs + 1− α′r)]
+(α′
rρ− α′r)
α′rρ
(qb − qs)
]+
c
(qb − qa)
×[(
n
(ρ− ραxβxg)− n(αxβxg + ρ− ραxβxg − 1)
(ρ− ραxβxg)2
−N(βsg + βsxβxg)
(ρ− ραxβxg)
)×
[ln
((ρ− ραxβxg)qs + αxβxg
)
− ln((ρ− ραxβxg)qa + αxβxg
)]
+n(αxβxg + ρ− ραxβxg − 1)(qs − qa)
ρ− ραxβxg
](A.20)
86

Case 2: When qs < qa:
Replacing qs with qa in equation (A.18), we have:
E(E(t)) =
∫ qb
qa
cn
[1− α′
r[1− ρq] + α′r[1− q]
1− α′r[1− ρq]
]×[
1
qb − qa
]dq
=cn
qb − qa
[(1
α′rρ
− (α′rρ− α′
r)(1− α′r)
(α′rρ)
2
)
×[ln(α′
rρqb + 1− α′r)− ln(α′
rρqa + 1− α′r)]
+(α′
rρ− α′r)
α′rρ
(qb − qa)
](A.21)
Case 3: When qs > qb: Replacing qs with qb in equation (A.19), we obtain:
E(E(t)) =
[ ∫ qb
qa
cn[1− (1− ρq)(1− αxβxg)]
1− (1− ρq)(1− αxβxg)dq +
∫ qs
qa
cn[(1− q)(1− αxβxg)]
1− (1− ρq)(1− αxβxg)dq
−∫ qs
qa
cN(βsg + βsxβxg)
1− (1− ρq)(1− αxβxg)dq
]×[
1
qb − qa
]
=c
qb − qa
[(n
(ρ− ραxβxg)− n(αxβxg + ρ− ραxβxg − 1)
(ρ− ραxβxg)2
−N(βsg + βsxβxg)
(ρ− ραxβxg)
)×
[ln
((ρ− ραxβxg)qb + αxβxg
)
− ln((ρ− ραxβxg)qa + αxβxg
)]
+n(αxβxg + ρ− ραxβxg − 1)(qb − qa)
ρ− ραxβxg
](A.22)
87

REFERENCES
[1] K. Hanjal, R. Van de Krol and A. Lekc, Sustainable Energy Technologies: Optionsand Prospects, Published by Springer, The Netherlands, 2008.
[2] T. Markel and A. Simpson, “Plug-In Hybrid Electric Vehicle Energy Storage Sys-tem Design”, National Renewable Energy Laboratory, Advanced Automotive BatteryConference, Baltimore, Maryland, May 2006.
[3] M.A. Kromer, A. Bandivadekar and C. Evans, “Long-term greenhouse gas emissionand petroleum reduction goals: Evolutionary pathways for the light-duty vehicle sec-tor”, Energy, vol. 35, pp. 387-397, 2010.
[4] C.P. Arenas Guerrero, J. Li, J. Wang, J. Arinez, S. Biller and N. Huang, “Productionsystem design to reduce energy consumption: a case study in automotive paint shop”,to apper at Proceedings of 2010 International Symposium on Flexible Automation(ISFA), Tokyo, Japan, July, 2010.
[5] “Annual Energy Outlook 2010 (Early Release Overview)”, Energy Information Ad-ministration (EIA), http://www.eia.doe.gov/oiaf/aeo/, Washington, DC, Decem-ber 2009.
[6] I. Dincer, “Renewable energy and sustainable development: a crucial review”, Renew-able and Sustainable Energy Reviews, vol. 4, pp. 157-175, 2000.
[7] “Our common future”, World Commission on Environment and Development, OxfordUniversity Press, Oxford, 1987.
[8] M. Jefferson, “Sustainable energy development: performance and prospects”, Renew-able Energy, vol. 31, pp. 571-582, 2006.
[9] J. Sarkis and A. Rasheed, “Greening the Manufacturing Function”, Business Hori-zons, September-October, 1995.
[10] H. Lund, “Renewable energy strategies for sustainable development”, Energy, vol. 32,pp. 912-919, 2007.
[11] “Engine And Vehicle Emissions Reduction”, Environmental Protection Agency(EPA), http://www.zyn.com/SBIR/sbres/sbhist/epa/epa-07-h1.htm, 2007.
[12] “EPA Awards Ford and Toyota 2009 Energy Star Sustained ExcellenceAwards”, Green Car Congress, http://www.greencarcongress.com/2009/04/
epa-awards-ford-2009-energy-star-sustained-excellence-award.html, 2009.
[13] “Innovative Paint Shop Facilities at Porsche Cuts Emissions to a Minimum”, TheAuto Channel, http://www.theautochannel.com/news/2009/10/09/480846.html,2009.
88

[14] C. Galitsky and E. Worrell, “Energy Efficiency Improvement and Cost Saving Oppor-tunities for the Vehicle Assembly Industry,” Lawrence Berkeley National Laboratory(LBNL-50939-Revision), 2008.
[15] T. Kolta, “Selecting Equipment to Control Air Pollution from Automotive Paint-ing Operations,” Society of Automotive Engineers (SAE) International Congress andExposition, 1992.
[16] J.A. Turner, “A Realizable Renewable Energy Future”, Science, vol. 285, pp. 687,1999.
[17] M.Z. Jacobson, “Review of solutions to global warming, air pollution, and energysecurity”, Energy and Environmental Science, vol. 2, pp. 148-173, 2009.
[18] H. Ibrahima, A. Ilincaa, and J. Perron, “Energy storage systemsCharacteristics andcomparisons”, Renewable and Sustainable Energy Reviews, vol. 12, pp. 1221-1250,2008.
[19] K.T. Chau, Y.S. Wong and C.C. Chan, “An overview of energy sources for electricvehicles”, Energy Conversion & Management, vol. 40, pp. 1021-1039, 1999.
[20] M. Anderman, “The challenge to fulfill electrical power requirements of advancedvehicles”, Journal of Power Sources, vol. 127, pp. 27, 2004.
[21] E. Karden, S. Ploumen, B. Fricke, T. Miller, and K. Snyder, “Energy storage devicesfor future hybrid electric vehicles”, Journal of Power Sources, vol. 168, pp. 211, 2007.
[22] R. Nallicheri, Automotive Painting: An Economic and Strategic Analysis, M.S. thesis,Sloan School of Management, Massachusetts Institute of Technology, Cambridge, MA,1993.
[23] S. Takahashi, K. Toda, K.Ichihara and K. Uchiyama, “Recent approaches for sav-ing energy in automotive painting,” International Body Engineering Conference andExposition, Detroit, Michigan, 1999.
[24] J. Geoffrey, A. Kemppainen and D. Shonnard, “Assessment of the Automobile Assem-bly Paint Process for Energy, Environmental, and Ecomonic Improvement,” Journalof Industrial Ecology, vol. 8, pp. 173-191, 2004.
[25] J.-T. Lim, S.M. Meerkov and F. Top, “Homogeneous, Asymptotically Reliable Se-rial Production Lines: Theory and a Case Study,” IEEE Transactions on AutomaticControl, vol. 35, pp. 524-534, 1990.
[26] J. Li, “Throughput Analysis in Automotive Paint Shops: A Case Study,” IEEE Trans-actions on Automation Sciences and Engineering, vol. 1, pp. 90-98, 2004.
[27] J. Li, D.E. Blumenfeld and S.P. Marin, “Manufacturing System Design to ImproveQuality Buy Rate: An Automotive Paint Shop Application Study,” IEEE Transac-tions on Automation Science and Engineering, vol. 4, pp. 75-79, 2007.
[28] J. Li, D.E. Blumenfeld and S.P. Marin, “Production System Design for Quality Ro-bustness,” IIE Transactions, vol. 40, pp. 162-176, 2008.
89

[29] J. Arinez, S. Biller, S.M. Meerkov and L. Zhang, “Quality/Quantity Improvementin an Automotive Paint Shop: A Case Study,” to appear in IEEE Transactions onAutomation Science and Engineering, 2010.
[30] R. Friedrich and G. Richter, “Performance requirements of automotive batteries forfuture car electrical systems”, Journal of Power Sources, vol. 78, pp. 4-11, 1999.
[31] E. Meissner and G. Richter, “Vehicle electric power systems are under change! Impli-cations for design, monitoring and management of automotive batteries”, Journal ofPower Sources, vol. 95, pp. 13-23, 2001.
[32] J.R. Pierson and R.T. Johnson, “The battery designers challenge - satisfying the ever-increasing demands of vehicle electrical systems”, Journal of Power Sources, vol. 33,pp. 309-318, 1991.
[33] T.J. Miller, “Lithium Ion battery automotive applications and requirements”, IEEE,pp. 113-118, 2002.
[34] R.F. Nelson, “Power requirements for batteries in hybrid electric vehicles”, Journalof Power Sources, vol. 91, pp. 226, 2000.
[35] O. Bitsche and G. Gutmann, “Systems for hybrid cars”, Journal of Power Sources,vol. 127, pp. 815, 2004.
[36] R. Ruegg and P. Thomas, “Linkages of DOEs Energy Storage R&D to Batteries andUltracapacitors for Hybrid, Plug-In Hybrid, and Electric Vehicles”, US Departmentof Energy-Energy Efficiency and Renewable Energy, February 2008.
[37] S.M. Lukic, R.C. Bansal, and A. Emadi, “Energy Storage Systems for AutomotiveApplications”, IEEE Transactions on industrial electronics, vol. 55, No. 6, pp. 2258-2267, 2008.
[38] A.A. Pesaran, T. Markel, H.S. Tataria and D. Howell, “Battery Requirements forPlug-In Hybrid Electric Vehicles Analysis and Rationale”, 23rd International ElectricVehicle Symposium, Anaheim, California, December 25, 2007.
[39] J. Axsen, A. Burke, and K. Kurani, “Batteries for Plug-in Hybrid Electric Vehicles(PHEVs): Goals and the State of Technology circa 2008”, Institute of TransportationStudies, University of California Davis, CA, May 2008.
[40] J. S. Cunningham, “An Analysis of Battery Electric Vehicle Production Projections”,Massachusetts Institute of Technology, June 2009.
[41] M. Duvall and M. Alexander, “Batteries for Electric Drive Vehicles-Status 2005”,Electric Power Research Institute (EPRI), Final Report, November 2005.
[42] F.V. Conte, “Battery and battery management for hybrid electric vehicles: a review”,Elektrotechnik & Informationstechnik, 123/10, pp. 424-431, 2006.
[43] J. Larminie and J. Lowry, Electric Vehicle Technology Explained, John Wiley & Sons,2003.
[44] H.A. Kiehne, Battery Technology Handbook, Second Edition, Copyright by ExpertVerlag, Germany 2003.
90
[45] E. Meissner and G. Richter, “Battery Monitoring and Electrical Energy ManagementPrecondition for future vehicle electric power systems”, Journal of Power Sources,vol. 116, pp. 7998, 2003.
[46] E. Karden, P. Shinn, P. Bostock, J. Cunningham, E. Schoultz, and D. Kok, “Require-ments for future automotive batteries a snapshot”, Journal of Power Sources, vol.144, pp. 505-512, 2005.
[47] E. Meissner and G. Richter, “The challenge to the automotive battery industry: thebattery has to become an increasingly integrated component within the vehicle electricpower system”, Journal of Power Sources, vol. 144, pp. 438-460, 2005.
[48] G.J. May, D. Calasanzio, and R. Aliberti, “VRLA automotive batteries for stop&goand dual battery systems”, Journal of Power Sources, vol. 144, pp. 411-417, 2005.
[49] A. Affanni, A. Bellini, G. Franceschini, P. Guglielmi, and C. Tassoni, “Battery Choiceand Management for New-Generation Electric Vehicles”, IEEE Transactions on In-dustrial Electronics, vol. 52, No. 5, pp. 1343-1349, 2005.
[50] D. Calasanzio, G. Cecchinato, and M. Marchetto, “Development of a valve-regulatedlead/acid battery for automotive use”, Journal of Power Sources, vol. 42, pp. 247-257,1993.
[51] L. Webster, “GM Finally Unveils Production Chevy Volt: First Look”, PopularMechanics, http://www.popularmechanics.com/automotive/new_cars/4283076.
html, September 16, 2008.
[52] Lyle, “GM Begins Mass Production at Volt Battery Assem-bly Plant Today”, GM Volt, http://gm-volt.com/2010/01/07/
gm-begins-mass-production-at-volt-battery-assembly-plant-today/, Jan-uary 7th, 2010.
[53] B. Spier and G. Gutmann, “42-V battery requirements leadacid at its limits”, Journalof Power Sources, vol. 116, pp. 99-104, 2003.
[54] K. Peters, “Design options for automotive batteries in advanced car electrical sys-tems”, Journal of Power Sources, vol. 88, pp. 83-91, 2000.
[55] K. Ehlersa, H. Hartmanna, and E. Meissne, “42 V an indication for changing require-ments on the vehicle electrical system”, Journal of Power Sources, vol. 95, pp. 43-57,2001.
[56] F. McLarnon, “Lithium Batteries for Hybrid-Electric Vehicles”, Lawrence BerkeleyNational Laboratory, vol. 1, No. 4, pp. 1-2, Winter 2000.
[57] Transportation Research Board (TRB), Review of the Research Program of the Part-nership for a New Generation of Vehicles: Seventh Report, The National AcademiesPress, http://books.nap.edu/openbook.php?record_id=10180&page=1#, 2001.
[58] A. Cooper, “Development of a lead-acid battery for a hybrid electric vehicle”, Journalof Power Sources, vol. 133, pp. 116-125, 2004.
91

[59] “The Hybrid Car Battery: A Definitive Guide”, Hybrid Cars, http://www.
hybridcars.com/hybrid-car-battery, November 6, 2008.
[60] P. Gifford, “Development of advanced nickel/metal hydride batteries for electric andhybrid vehicles”, Journal of Power Sources, vol. 80, pp. 157-163, 1999.
[61] “Expert: Lithium Ion Batteries Will Help Hybrids More Than Elec-tric Cars”, Hybrid Cars, http://www.hybridcars.com/components/
expert-lithium-ion-batteries-will-help-hybrids-more-electric-cars-26284.
html, December, 2009.
[62] J. Voelcker, “Lithium Batteries for Hybrid Cars”, IEEE Spectrum, http://spectrum.ieee.org/green-tech/advanced-cars/lithium-batteries-for-hybrid-cars,January 2007.
[63] S. Abuelsamid, “GM lithium ion battery plant goes to BrownstownTownship, MI”, Autobloggreen, http://green.autoblog.com/2009/08/13/
officially-official-gm-lithium-ion-battery-plant-goes-to-bro/, Au-gust 13th, 2009.
[64] “GM Builds First Lithium-ion Battery for Chevrolet Volt”, GM Environmental Com-mitment News, http://www.gm.com/corporate/responsibility/environment/
news/2010/voltbattery_010710.jsp, January 11, 2010.
[65] News Team, “A123Systems Seeks Grant For Hybrid Car Battery Produc-tion”, Hybrid Car Tech News, http://www.hybridcar.com/index.php?option=
com_content&task=view&id=697&Itemid=122/, January 07, 2009.
[66] P.T. Moseley “Lead/acid battery myths”, Journal of Power Sources, vol. 59, pp.81-86, 1996.
[67] P.T. Moseley and D.A.J. Rand, “Changes in the demands on automotive batteriesrequire changes in battery design”, Journal of Power Sources, vol. 133, pp. 104-109,2004.
[68] M. Saakes, R. Woortmeijer, and D. Schmal, “Bipolar leadacid battery for hybridvehicles”, Journal of Power Sources, vol. 144, pp. 536-545, 2005.
[69] P. Yenradee, “Application of optimized production technology in a capacity con-strained flow shop; a case of study in a battery factory”, Computers Ind Engng, vol.27, Nos. 1-4, pp. 217-220, 1994.
[70] Environmental Protection Agency, Metallurgical Industry: Storage Battery Produc-tion, AP 42, Fifth Edition, Volume I, Chapter 12.15, 1995. http://www.epa.gov/ttnchie1/ap42/ch12/index.html
[71] A.A. Elimam and M.M. Sartawi, “Quality-Control Practices in Lead-Acid BatteryManufacturing to Improve Quality, Cost, Reliability”, IEEE Transactions on reliabil-ity, vol. R-35, No. 4, pp. 369-374, 1986.
[72] A.M. Hardman, “Manufacturing trends in automotive battery manufacture”, Journalof Power Sources, vol. 28, pp. 155-160, 1989.
92

[73] J.E. Manders, “Quality-control technoques for dry charching”, Journal of PowerSources, vol. 19, pp. 189-199, 1987.
[74] R. Kamnik, “Automation of the car battery lid assembly operation”, Robotics andComputer Integrated Manufacturing, vol. 17, pp. 435-446, 2001.
[75] H.V. de Medina, “Clean technologies for recycling: A case study on automotive bat-teries in Brazil”, Innovation in Life Cycle Engineering and Sustainable Development,Springer - D. Brissaud et al (eds.), 199-208, 2006.
[76] M.A. Kreusch, M.J.J.S. Ponte, H.A. Ponte, N.M.S. Kaminari, C.E.B. Marino, and V.Mymrin, “Technological improvements in automotive battery recycling”, Resources,conservation and recycling, vol. 52, pp. 368-380, 2007.
[77] R.F. Nelson, “A lead/acid battery for the new millennium”, Journal of Power Sources,vol. 46, pp. 159-168, 1993.
[78] D. Berndt, “VRLA batteries, advances and limitations”, Journal of Power Sources,vol. 154, pp. 509-517, 2006.
[79] M.L. Soria, “New developments on valve-regulated leadacid batteries for advancedautomotive electrical systems”, Journal of Power Sources, vol. 144, pp. 473-485, 2005.
[80] G.J. May, D. Calasanzio, and R. Aliberti, “VRLA automotive batteries for stop&goand dual battery systems”, Journal of Power Sources, vol. 144, pp. 411-417, 2005.
[81] R.F. Nelson, “High-power batteries for the new 36/42 V automotive systems”, Journalof Power Sources, vol. 107, pp. 226-239, 2002.
[82] G. Pistoia, Battery Operated Devices and Systems: from Portable electronics to In-dustrial products, Elsevier, 2009.
[83] “Plugging into the Future”, The Economist, June 2006.
[84] M.A. Fetcenko, S.R. Ovshinsky, B. Reichman, K. Young, C. Fierro, J. Koch, A. Zallen,W. Mays, and T. Ouchi, “Recent advances in NiMH battery technology”, Journal ofPower Sources, vol. 165, pp. 544-551, 2007.
[85] “Nickel-Metal Hydride Application Manual”, Eveready Battery Co. Inc., 2001.
[86] J.C. Kopera , “Inside the Nickel Metal Hydride Battery”, Cobasys, June, 2004.
[87] “Considerations for the Utilization of NiMH Battery Technology in Stationary Appli-cations”, Cobasys. Orion, MI.
[88] A. Taniguchi, N. Fujioka, M. Ikoma, and A. Ohta, “Development of nickel/metal-hydride batteries for EVs and HEVs”, Journal of Power Sources, vol. 100, pp. 117-124,2001.
[89] “Hybrid Cars Guide”, http://www.hybrid-cars-guide.com/index.html.
[90] J. Voelcker, “30 Days of the 2010 Toyota Prius: Day 12,Battery Pack”, http://www.allaboutprius.com/blog/1019835_
30-days-of-the-2010-toyota-prius-day-12-battery-pack, April, 2009.
93

[91] “Top Hybrid Cars: A Complete Guide”, Hybrid Cars, http://www.hybridcars.com/top-hybrid-cars-list.
[92] “Hybrid Batteries Spark Waste Fears in Australia”,Mixed Power, http://www.mixedpower.com/government/
hybrid-batteries-spark-waste-fears-in-australia, August, 2008.
[93] TCC Team, “Preview: 2005 Ford Escape HEV”, The Car Connection, http://www.thecarconnection.com/review/1005390_preview-2005-ford-escape-hev, 2005.
[94] “Saturn Vue Hybrid SUV — The Two Mode Green Line”, http://www.hybridsuv.com/saturn/2009-vue-hybrid -twomode, Mar. 2008.
[95] T.-K. Ying, X.-P. Gaob, W.-K. Huc, F. Wud, and D. Noreusc, “Studies on recharge-able NiMH batteries”, International Journal of Hydrogen Energy, vol. 31, pp. 525-530,2006.
[96] “Birth of Industry to Recycle Lithium Auto Batter-ies”, Hybrid Cars, http://www.hybridcars.com/environment/
birth-industry-recycle-lithium-auto-batteries-26047.html, August 2009.
[97] R.A. Sutula, “Progress Report for the Electric Vehicle Battery Research and De-velopment Program”, U.S. Department of Energy- Office of Advanced AutomotiveTechnologies, January 2001.
[98] H. Wilkinson and S. Cornay, “Avestor Lithium-Metal-Polymer Batteries Deployedthroughout North America”, InfoBatt, http://www.springstreet.ca/InfoBatt/
About_Infobatt/infobatt_past_presentations.htm, 2005.
[99] Y. Nishi, “The Development of Lithium-Ion Secondary Battery Systems for EV andHEV”, IEEE, 1998.
[100] B. Kennedy, D. Patterson, and S. Camilleri, “Use of lithium-ion batteries in electricvehicles”, Journal of Power Sources, vol. 90, pp. 156-162, 2000.
[101] W.A. van Schalkwijk and B. Scrosati, Advances in Lithium-Ion Batteries, KluwerAcademic Publishers, New York, 2002.
[102] G. Nazri and G. Pistoia, Lithium batteries: Science and Technology, Kluwer AcademicPublishers, USA 2004.
[103] L. Gaines and R. Cuenca, “Costs of Lithium-Ion Batteries for Vehicles”, Center forTransportation Research-Argonne National Laboratory, May 2000.
[104] M. Wakihara, “Recent developments in Lithium Ion batteries”, Materials Science andEngineering, vol. R33, pp. 109-134, 2001.
[105] C. Daniel, “Materials and Processing for Lithium-Ion Batteries”, JOM, vol. 60, No.9, pp. 43-48, 2008.
[106] U. Heider, R. Oesten, and M. Jungnitz, “Challenge in manufacturing electrolyte so-lutions for lithium and lithium ion batteries quality control and minimizing contami-nation level”, Journal of Power Sources, vol. 8182, pp. 119-122, 1999.
94
[107] L.J. Vimmerstedt, S. Ring, and C. J. Hammel, “Current status of environmental,health, and safety issues of lithium ion electric vehicle batteries”, National RenewableEnergy Laboratory, September 1995.
[108] “Lithium Battery Manufacturing”, Electropedia, http://www.mpoweruk.com/
battery_manufacturing.htm.
[109] P.G. Balakrishnan, R. Ramesh, and T. Prem Kumar, “Safety mechanisms in lithium-ion batteries”, Journal of Power Sources, vol. 155, pp. 401-414, 2006.
[110] M. Duvall, “Advanced Batteries for Electric-Drive Vehicles”, Electric Power ResearchInstitute (EPRI), Final Report, May 2004.
[111] J. Muthu and J. Battaglini, “Advancements in Water-based Processing for Large For-mat Lithium Ion Cells”, International Battery, http://www.internationalbattery.com/pdf/InternationalBattery_ManufacturingWhitePaper.pdf.
[112] W. Hoeffding, “Probability Inequalities for Sums of Bounded Random Variables”,Journal of the American Statistical Association, Vol. 58, No. 301, pp. 13-30, 1963.
95

VITA
Claudia Patricia Arenas Guerrero was born on April 2, 1983 in Popayan, Colombia. She
received her B.S. degree from the Department of Electronic and Telecommunications Engi-
neering at University of Cauca in Popayan, Colombia, in June 2006. She acquired practical
experience while working as an Intern student at Occidental de Colombia Inc (OXY) in
Arauca, Colombia in 2005, and as Projects and Support engineer at Soluciones Automati-
cas Ltda, from 2006 to 2008, where she participated in different automation projects. After
working in the industrial automation and manufacturing field for 3 years, she is studying
a Masters degree in Electrical Engineering in the Department of Electrical and Computer
Engineering at the University of Kentucky since August 2008.
Publications:
• Production System design to reduce energy consumption: a case study in automo-
tive paint shop, to appear in 2010 International Symposium on Flexible Automation
(ISFA), Tokyo, Japan, July 12-14, 2010.
• Hybrid/Electrical Vehicle Battery Manufacturing: the State-of-the-Art, under review
for the 6th annual IEEE Conference on Automation Science and Engineering (CASE
2010), Toronto, Canada, August 21-24, 2010.
• Production System Design to Achieve Energy Savings in Automotive Paint Shop,
under review for publication in the International Journal of Production Research.
96


