Energy Overview: Evaluating Propane and Natural Gas Trends
11
OHIO STATE UNIVERSITY EXTENSION Technical Report TR-17-02 September 2017 Energy Overview: Evaluating Propane and Natural Gas Trends
Transcript of Energy Overview: Evaluating Propane and Natural Gas Trends

2016 Ohio HomeowneTechnical Report 16-01
OHIO STATE UNIVERSITY EXTENSION
Technical Report TR-17-02September 2017
Energy Overview: Evaluating Propane and Natural Gas Trends
ENERGY OVERVIEW: EVALUATING PROPANE AND NATURAL GAS TRENDS
Eric Romich, Assistant Professor in the Department of Extension, OSU College of Food, Agricultural, and Environmental Sciences. David Civittolo, Associate Professor in the Department of Extension, OSU College of Food, Agricultural, and Environmental Sciences. Nancy Bowen, Associate Professor in the Department of Extension, OSU College of Food, Agricultural, and Environmental Sciences. Barry Ward, Assistant Professor in the Department of Extension, OSU College of Food, Agricultural, and Environmental Sciences.
September, 2017
Energy Overview: Evaluating Propane and Natural Gas Trends is an editor-reviewed publication.
Original available at: www.go.osu.edu/farmenergy
Recommended Citation: Romich, E., Civittolo, D., Bowen, N., and Ward, B. (2017). Energy Overview: Evaluating Propane and Natural Gas Trends. TR-17-02. Columbus, Ohio: The Ohio State University.
Editors: Greg Davis, Professor & Assistant Director, OSU Extension, OSU College of Food, Agricultural, and Environmental Sciences. Barry McGraw, PMP, Director, Product Development & Commercialization, Ohio Soybean Council.
Ohio State University Extension embraces human diversity and is committed to ensuring that all research and related educational programs are available to clientele on a nondiscriminatory basis without regard to age, ancestry, color, disability, gender identity or expression, genetic information, HIV/AIDS status, military status, national origin, race, religion, sex, sexual orientation, or veteran status. This statement is in accordance with United States Civil Rights Laws and the USDA.
Roger Rennekamp, Associate Dean and Director, Ohio State University Extension
ACKNOWLEDGEMENT
This information is brought to you by Ohio soybean farmers and their checkoff. Headquartered in Worthington, the Ohio Soybean Council (OSC) is governed by a volunteer farmer board, which directs the soybean promotion and research program. The program’s primary goal is to improve soybean profitability by targeting research, education, promotion and development projects through the investment of farmer-contributed funds. For more information on the Ohio Soybean Council, visit soyohio.org .

3 Energy Overview: Evaluating Propane and Natural Gas Trends
Rapid growth in domestic oil and gas production has led to an increase in infrastructure, production and the processing of petroleum and other liquid products.
To accurately assess market trends of natural gas and other petroleum liquids such as propane, it is important to establish an understanding of the production processing pathway
from resource extraction to the finished products that are delivered to market. Additionally, it is important to clarify terms which are sometimes used interchangeably, unintentionally causing confusion. To reduce confusion and provide more detailed data, the U.S. Department of Energy, Energy Information Administration (EIA) has worked with industry and government agencies to clarify gas liquid terminology and has developed the term Hydrocarbon Gas Liquids, or HGL (USDOE/EIA, 2014). HGL includes gas liquids produced from both natural gas processing plants (fractionators) and refineries (condensate splitters) which represents an all-inclusive perspective of gas liquid products produced by midstream and downstream companies including: ethane, propane, normal butane, isobutene, natural gasoline, and refinery olefins. As outlined in Image 1, HGL starts with the extraction of hydrocarbon resources from well pads located in oil and gas formations. As a result, the production and pricing of HGLs is influenced by the production and pricing of both natural gas and petroleum or crude oil.
Introduction
Image 1: Hydrocarbon Gas Liquids Production Process
Energy Overview: Evaluating Propane and Natural Gas Trends 4
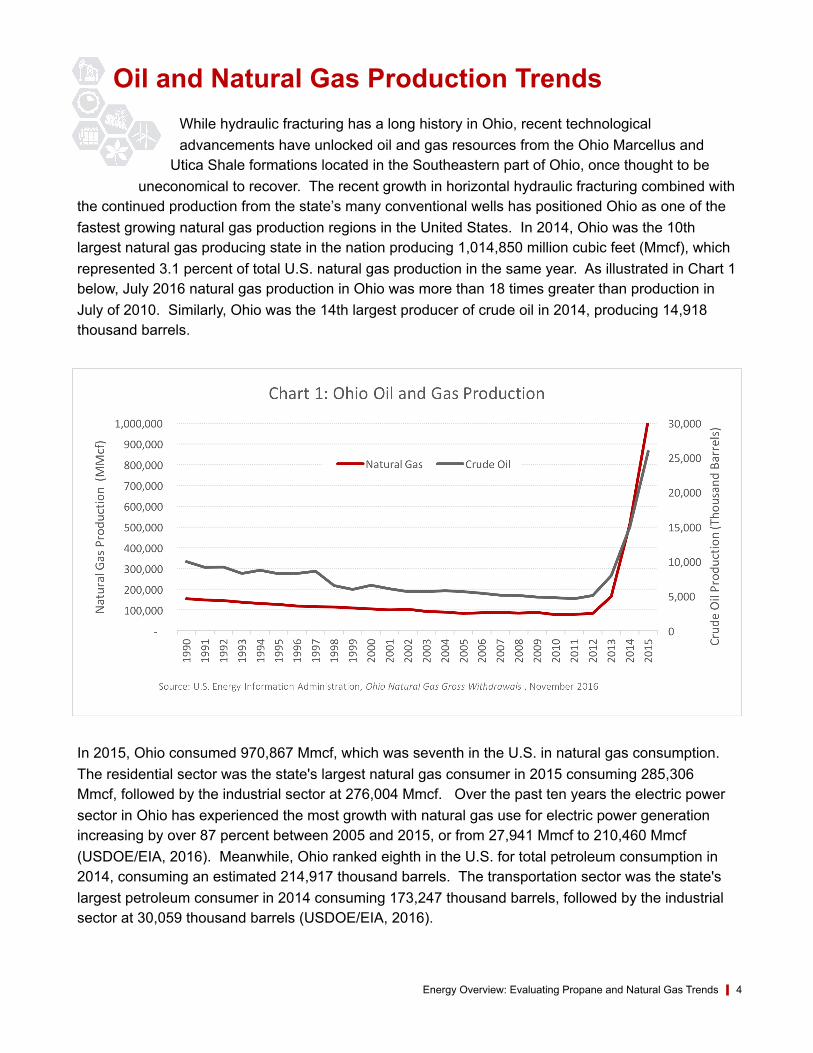
In 2015, Ohio consumed 970,867 Mmcf, which was seventh in the U.S. in natural gas consumption. The residential sector was the state's largest natural gas consumer in 2015 consuming 285,306 Mmcf, followed by the industrial sector at 276,004 Mmcf. Over the past ten years the electric power sector in Ohio has experienced the most growth with natural gas use for electric power generation increasing by over 87 percent between 2005 and 2015, or from 27,941 Mmcf to 210,460 Mmcf (USDOE/EIA, 2016). Meanwhile, Ohio ranked eighth in the U.S. for total petroleum consumption in 2014, consuming an estimated 214,917 thousand barrels. The transportation sector was the state's largest petroleum consumer in 2014 consuming 173,247 thousand barrels, followed by the industrial sector at 30,059 thousand barrels (USDOE/EIA, 2016).
While hydraulic fracturing has a long history in Ohio, recent technological advancements have unlocked oil and gas resources from the Ohio Marcellus and
Utica Shale formations located in the Southeastern part of Ohio, once thought to be uneconomical to recover. The recent growth in horizontal hydraulic fracturing combined with
the continued production from the state’s many conventional wells has positioned Ohio as one of the fastest growing natural gas production regions in the United States. In 2014, Ohio was the 10th largest natural gas producing state in the nation producing 1,014,850 million cubic feet (Mmcf), which represented 3.1 percent of total U.S. natural gas production in the same year. As illustrated in Chart 1 below, July 2016 natural gas production in Ohio was more than 18 times greater than production in July of 2010. Similarly, Ohio was the 14th largest producer of crude oil in 2014, producing 14,918 thousand barrels.
Oil and Natural Gas Production Trends

5 Energy Overview: Evaluating Propane and Natural Gas Trends
Similar to the transitions in domestic natural gas production through the use of horizontal hydraulic fracturing in shale formations over the past decade, the propane industry is in the midst of a significant evolution. Propane production in the Midwest region has also increased over the past decade. As illustrated in Chart 2, the 4-week average production from an average Midwest (PADD2) refiner, blender, and natural gas plant production of propane increased from 205 thousand barrels per day in September 2006 to 419 thousand barrels per day in September 2016. At the national level, propane consumption in the U.S. has been fairly consistent averaging 1.18 million barrels per day since 1997.
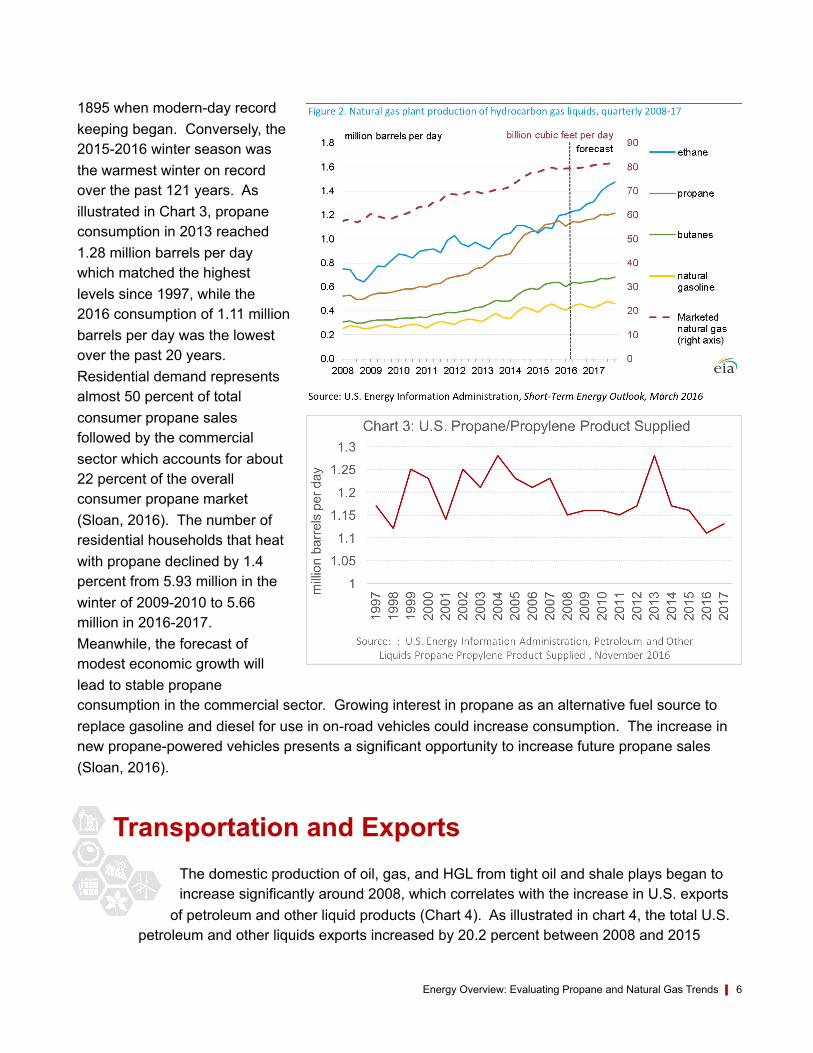
While HGL production, which includes propane, follows from both natural gas processing plants and petroleum refineries, the primary driver of the growth in propane production is related to recent increases in HGL production from domestic gas plant production. Starting in 2008, the rapid growth in oil and gas development from shale formations provided additional wet gas (natural gas liquids) as a feedstock for HGL production from natural gas processing plants. As a result, HGL production from natural gas processing plants increased by 62 percent between 2008 and 2014 (USDOE/EIA, 2014). As additional HGL infrastructure projects including fractionators, crackers, and pipelines are completed, the U.S. Energy Information Administration projects HGL production from natural gas plants will continue to grow in the short term (Figure 2) while growth in marketed natural gas production is expected to slow.
Consumption draws on propane inventory levels vary regionally based on local conditions such as weather or crop drying conditions. For example, according to the National Oceanic and Atmospheric Administration the 2013-2014 winter season was the 34th coldest for the contiguous 48 states since 1895 when contiguous 48 states since
Energy Overview: Evaluating Propane and Natural Gas Trends 6
1895 when modern-day record keeping began. Conversely, the 2015-2016 winter season was the warmest winter on record over the past 121 years. As illustrated in Chart 3, propane consumption in 2013 reached 1.28 million barrels per day which matched the highest levels since 1997, while the 2016 consumption of 1.11 million barrels per day was the lowest over the past 20 years. Residential demand represents almost 50 percent of total consumer propane sales followed by the commercial sector which accounts for about 22 percent of the overall consumer propane market (Sloan, 2016). The number of residential households that heat with propane declined by 1.4 percent from 5.93 million in the winter of 2009-2010 to 5.66 million in 2016-2017. Meanwhile, the forecast of modest economic growth will lead to stable propane consumption in the commercial sector. Growing interest in propane as an alternative fuel source to replace gasoline and diesel for use in on-road vehicles could increase consumption. The increase in new propane-powered vehicles presents a significant opportunity to increase future propane sales (Sloan, 2016).
The domestic production of oil, gas, and HGL from tight oil and shale plays began to increase significantly around 2008, which correlates with the increase in U.S. exports
of petroleum and other liquid products (Chart 4). As illustrated in chart 4, the total U.S. petroleum and other liquids exports increased by 20.2 percent between 2008 and 2015
Transportation and Exports

7 Energy Overview: Evaluating Propane and Natural Gas Trends
from 1,802 thousand barrels per day to 4,738 thousand barrels per day. In 2015, propane exports represented 12.9 percent of the total U.S. exports of petroleum and other liquid products. Furthermore, the U.S. has been a net exporter of propane since 2011 and the USDOE/EIA estimates net propane exports, which grew by 190,000 b/d in 2015 will continue to grow through 2017. According to a report from the U.S. Energy Information Administration “Several companies such as Phillips 66, Targa Resources Partners, Sunoco Logistics, and Enterprise Products Partners have announced plans to expand or build new HGL export facilities, mostly along the Gulf Coast, to take advantage of a growing excess supply of propane, normal butane, and ethane (USDOE/EIA, 2014).” These investments will provide additional infrastructure to support the growth in U.S. exports of petroleum and other liquids products.
In Ohio, increased oil and gas production in the Marcellus and Utica Shale region has fostered significant investments in midstream gas processing infrastructure and facilities including new projects by Blue Racer Midstream, MarkWest Energy Partners, and Pennent Midstream. In 2015, Ohio’s natural gas processing capacity increased to 3,325 Mmcf/day, while the fractionation capacity grew to 254,000 bbl/day. Additional investments are also occurring to expand Ohio’s pipeline infrastructure which already contains numerous interstate natural gas pipelines including the ANR Pipeline, Cheyenne Plains Gas Pipeline, Crossroads Pipeline, Dominion Transmission, Panhandle Eastern, Rockies Express, Tennessee Gas Pipeline, Texas Eastern Transmission, and Texas Gas Transmission Pipeline.

Energy Overview: Evaluating Propane and Natural Gas Trends 8
While historically propane prices have been higher than natural gas prices, the price gap between the two fuel sources varies from year to year. As earlier discussed,
advancements in horizontal hydraulic fracturing has increased production, processing and transportation capacity throughout the nation. Traditionally HGL spot prices, including
propane have tracked in sync with crude oil prices, causing them to consistently remain above the spot price of natural gas. However, in 2012, the spot price for propane in Mt. Belvieu, Texas broke away from trending with crude oil spot prices and instead aligned with natural gas pricing (Chart 5). The growth in domestic oil and natural gas production is the primary driver of the increased propane production from domestic gas production processing plants.
While national spot prices provide a foundation to assess market trends, they do not fully determine individual price points at the regional and local level, which are influenced by the transportation of product via pipelines, rail, waterways, and roads and additional overhead and operations expenses required to deliver the product. State level retail price trends can also provide valuable insight for local market trends. Over the past 15 years, residential propane prices in Ohio have increased from $9.67 per MBtu in December 1990 to $15.84 per MBtu in December 2015. Meanwhile during the same time period, residential natural gas prices in Ohio increased from $5.07 per MBtu in December 1990 to 7.17 per MBtu in December 2015.
Price Trends

9 Energy Overview: Evaluating Propane and Natural Gas Trends
While increased domestic production and supply has fostered lower propane prices, the potential for continued propane exports and the increase in demand from
petrochemical markets could lead to regional propane constraints and price spikes during peak demand events triggered by unpredictable weather conditions. In short, energy
prices fluctuate based on market conditions and are extremely volatile. Similar to agricultural commodities, the price of energy commodities such as crude oil, natural gas, electricity, heating oil, and propane are driven by the fundamentals of supply and demand. Supply factors that impact and contribute to price volatility include variations in production, storage capacity and levels, logistical and transportation infrastructure, regulations, and the amount of imports and exports. Demand factors that impact and contribute to price volatility include economic activity, emerging economies in developing nations, fluctuations in regional weather conditions, and the cost of alternative fuel sources. While there is a clear connection between consumer energy prices and the physical supply and demand of the product, another influencing factor is in the financial markets where buyers are investing in the energy futures market with no intention of ever taking delivery of the physical energy commodity (Yergin, 2012). As a general guide, the law of supply and demand suggests rising prices will encourage more supply, thus triggering an increase in investment to support exploration, new extraction technologies, and advancements in alternative sources. At the same time, higher consumer prices will encourage less energy use that will ultimately soften the market demand. These energy transitions are forcing both the natural gas and propane industry to adapt to evolving market conditions that will lead to new opportunities and challenges over the next decade.
Summary

Energy Overview: Evaluating Propane and Natural Gas Trends 10
References
Sloan, M. (2016). 2016 Propane Market Outlook: Key Market Trends, Opportunities, and Threats Facing the Consumer Propane Industry Through 2025. Propane Education and Research Council. Fairfax, VA: ICF International Inc.
United States Department of Energy, Energy Information Administration (USDOE/EIA). (2014, November). Hydrocarbon Gas Liquids (HGL): Recent Market Trends and Issues. Retrieved December 2016, from U.S. Energy Information Administration: Analysis and Projections: www.eia.gov/analysis/hgl/
United States Department of Energy, Energy Information Administration (USDOE/EIA). (2016, November). Natural Gas Consumption by End Use. Retrieved December 2016, from U.S. Energy Information Administration: www.eia.gov/dnav/ng/ng_cons_sum_dcu_SOH_a.htm
United States Department of Energy, Energy Information Administration (USDOE/EIA). (2016, November). Ohio Natural Gas Gross Withdrawals. Retrieved December 2016, from U.S. Energy Information Administration: www.eia.gov/dnav/ng/hist/n9010oh2a.htm
United States Department of Energy, Energy Information Administration (USDOE/EIA). (2016, November). Petroleum and Other Liquids: 4-Week Avg Midwest (PADD 2) Refiner, Blender, and Gas Plant Net Production of Propane and Propylene. Retrieved December 2016, from U.S. Energy Information Administration: www.eia.gov/dnav/pet/hist/LeafHandler.ashx?n=pet&s=wprnpp22&f=4
United States Department of Energy, Energy Information Administration (USDOE/EIA). (2016, November). Petroleum and Other Liquids Exports. Retrieved December 2016, from U.S. Energy Information Administration: www.eia.gov/dnav/pet/pet_move_exp_dc_NUS-Z00_mbblpd_a.htm
United States Department of Energy, Energy Information Administration (USDOE/EIA). (2016, November). Petroleum and Other Liquids Spot Prices. Retrieved December 2016, from U.S. Energy Information Administration: www.eia.gov/dnav/pet/PET_PRI_SPT_S1_D.htm
United States Department of Energy, Energy Information Administration (USDOE/EIA). (2016, November). Petroleum and Other Liquids Propane Propylene Product Supplied. Retrieved December 2016, from U.S. Energy Information Administration: www.eia.gov/dnav/pet/PET_CONS_PSUP_A_EPLLPZ_VPP_MBBLPD_M.htm
United States Department of Energy, Energy Information Administration (USDOE/EIA). (2016, June). State Energy Consumption Estimates 1960 Through 2014. Retrieved December 5, 2016, from U.S. Energy Information Administration Independent Statistics and Analysis: www.eia.gov/state/seds/sep_use/notes/use_print.pdf
Yergin, D. (2012). The Quest: Energy, Security, and the Remaking of the Modern World. New York, New York, U.S.A.: The Penguin Group.

This information is brought to you by Ohio soybean farmers and their checkoff. For more information on the Ohio Soybean Council, see www.soyohio.org/council/ and www.soyohio.org/council/contact-us/
Photo Credit: United Soybean Board