Energy management system for underground mine electric ... · Figure 1-2 10 t fuel cell mine...
161
ENERGY MANAGEMENT SYSTEM FOR UNDERGROUND MINE ELECTRIC VEHICLES FENGXIAN HE Dissertation Fengxian He Submitted in fulfilment of the requirements for the degree of Doctor of Philosophy Faculty of Science, Engineering and Technology Swinburne University of Technology 2016
Transcript of Energy management system for underground mine electric ... · Figure 1-2 10 t fuel cell mine...
ENERGY MANAGEMENT SYSTEM
FOR UNDERGROUND MINE
ELECTRIC VEHICLES
FENGXIAN HE
Dissertation
Fengxian He
Submitted in fulfilment of the requirements for the degree of
Doctor of Philosophy
Faculty of Science, Engineering and Technology
Swinburne University of Technology
2016


ABSTRACT
In most current underground mining operations, personnel carrier vehicles are driven by
diesel engines. The exhaust from the engine vehicles spreads in the air in the mine with
waste heat and noxious substances. Ventilation and filters are required to comply with
the occupational health and safety rules for working in underground mines. Regular
replacement of exhaust filters increases operating costs. Electric vehicles (EVs) provide
the significant advantages of low noise and zero emissions over diesel engine vehicles
and potentially reduce operating costs when EVs are adopted in underground mines.
Lithium iron phosphate (LiFePO4) batteries have been selected as power sources for
underground mine electric vehicles (UMEVs) due to their better safety than other
lithium ion batteries. To meet the power and energy requirements of UMEVs, battery
systems must be built with hundreds or thousands of cells connected in series and
parallel. The development of battery management systems (BMSs) is crucial to ensure
the safe and efficient operation of EV battery systems. This thesis focuses on three
aspects of BMSs: the selection of battery systems for UMEVs from many types of
LiFePO4 batteries and battery packs, the classification of cells for constructing
consistent battery packs, and the estimation of state of charge (SOC) for battery packs.
The selection of the battery system for UMEVs is explored first. Two lithium iron
phosphate (LiFePO4) batteries and their corresponding battery packs with different
capacities were chosen to make four battery systems for UMEVs. Experiments were
conducted to identify the internal resistances, capacities, open circuit voltages and states
of charge during charging/discharging periods at different ambient temperatures. A
hybrid simulation is proposed to compare these four battery systems by integrating the
experimental results of these batteries and battery packs into an UMEV model. Then,
i

the simulation of the UMEV was conducted at a specifically designed underground
mine driving cycle with variable rolling resistance coefficients and variable
uphill/downhill gradients. The results indicate the best option for the UMEV of the four
battery systems is the A123 20Ah LiFePO4 battery.
In order to reduce the cell inconsistence in the battery pack, a self-organizing map
(SOM) based classification of LiFePO4 cells for a battery pack was then investigated.
Experimental data on the cells were obtained to train the SOM. The temperature
variation, internal resistance and available capacity of the cells were used as the inputs
of the SOM, and the output of the SOM classified the cells into three groups with
similar characteristics in terms of the input parameters. The cells in the same group
were connected in series to build a sorted battery pack, whereas randomly chosen cells
were connected in series to build an unsorted battery pack. The comparison of the
consistency between the sorted battery pack and the unsorted battery pack under
different discharging conditions demonstrated the effectiveness of the proposed
classification method.
The SOC estimation based on H infinity observer is proposed for the battery packs in
UMEVs by adopting the concept of an average virtual cell (AVC) model. The terminal
voltage of the AVC was used to estimate the pack SOC in the estimation process. The
difference of the terminal voltage of each cell in the pack and the AVC was set as the
terminal voltage difference (TVD). In this study, the LiFePO4 cells were classified to
build the pack with the series-connected cells so that the TVDs of each cell in the pack
were within the pre-set value. Experiments were conducted on the battery pack to verify
the effectiveness of the proposed SOC estimation for the battery packs in UMEVs.
ii

DECLARATION
I declare that this thesis represents my own work and contains no material which has
been accepted for the award of any other degree or diploma. To the best of my
knowledge and belief, this thesis contains no material previously published or written
by another person except where due reference is made in the text of the examinable
outcome.
Fengxian He
August 2016
iii

ACKNOWLEDGEMENTS
This work would not have been successfully completed without the support of many
people. First of all, I would like to express my deep gratitude to my supervisor,
Associate Professor Weixiang Shen, for his patient guidance, enthusiastic
encouragement and great support throughout my PhD research journey. He has spent so
much time in guiding me in my research. Without his encouragement and guidance, I
would never have completed this amazing and tough journey. I would also like to thank
my associate supervisor, Professor Ajay Kapoor, for his support in my research.
I would like to thank all the staff of the Faculty of Science, Engineering and
Technology and Swinburne Research who helped me in my research during the past
four years. My PhD work was financed by a Swinburne SUPRA scholarship, and I
greatly appreciate the contribution of Swinburne University which made the award and
provided me with a comfortable and conducive working environment. I would like to
thank Professor Damon Hennery and Dr. Daya Dayawansa from Monash University for
their support and help in the ARC linkage project “From diesel to electric: a new era in
personnel transport for underground coal mines”. Dr Alex McKnight assisted by
proofreading the final draft for stylistic and grammatical errors.
I would like to thank my colleagues Xiudong Cui and Xiaopeng Chen, who helped me
in conducting the battery experiment. Thanks are due to all my friends in Melbourne
and China for their friendship and help and encouraging me to pursue my life’s dream. I
owe special thanks to Dr. Qiang Song and Dr. Rui Xiong from the Beijing Institute of
Technology for their help and encouragement.
iv

Finally, I would like to offer my deep and sincere thanks to my parents for their utmost
support and encouragement for my study. I thank them for their understanding of my
decision to remove myself from their lives in the past four years. I thank my brother for
caring for and accompanying my parents for these years. I owe a great deal to my
beloved husband, Shiqin Li, for his sacrifice for and understanding of my PhD career.
Without his love and encouragement, this thesis would not have been successfully
completed. I send a special greeting to the wonderful little life in my womb, my unborn
baby, who gives me so much to look forward to in my future!
v

Dedicated to:
My beloved parents, cherished husband & wonderful unborn baby
vi

TABLE OF CONTENTS
1.1 History of Electric Vehicles (EVs) ......................................................... 1
1.2 Underground Mine Electric Vehicles ...................................................... 4 1.2.1 Rail locomotives and LHDs in underground mines ................................ 5 1.2.2 Electric personnel carriers in underground mines ................................... 7
1.3 Batteries for EVs ..................................................................................... 9 1.3.1 Lead acid battery ................................................................................... 10 1.3.2 Ni-Cd and Nickel- Metal Hydride batteries .......................................... 10 1.3.3 Lithium-ion battery ............................................................................... 11
1.4 Battery Management System ................................................................ 13
1.5 Objectives and Major Contribution of the Thesis ................................. 16
1.6 Organization of the Thesis .................................................................... 17
2.1. Battery Selection and Simulation for UMEV ....................................... 19
ABSTRACT…………………………………………………………………………… i
DECLARATION …………………………………………………………………… iii
ACKNOWLEDGEMENTS ………………………………………………………… iv
LIST OF FIGURES …………………………………………………………………xi
LIST OF TABLES ………………………………………………………………… xvi
CHAPTER 1 INTRODUCTION …………………………………………………… 1
CHAPTER 2 LITERATURE REVIEW……………………………………………… 19
vii

2.2. Battery Uniformity and Balancing ........................................................ 25 2.2.1 Sorting methods based on observing direct measurement .................... 26 2.2.2 Sorting methods based on machine learning ......................................... 28
2.3. SOC Estimation ..................................................................................... 29 2.3.1 Discharge test method ........................................................................... 31 2.3.2 Open-circuit voltage .............................................................................. 31 2.3.3 Coulomb counting method .................................................................... 32 2.3.4 Battery model-based SOC estimation ................................................... 33 2.3.5 Machine learning method ...................................................................... 39
2.4. Summary ............................................................................................... 42
3.1 Introduction ........................................................................................... 43
3.2 Model of UMEV ................................................................................... 45 3.2.1 UMEV vehicle dynamic model ............................................................. 45 3.2.2 Motor model .......................................................................................... 48 3.2.3 Battery model ........................................................................................ 49 3.2.4 Underground mine driving cycle .......................................................... 50
3.3 Experimental Set-up and Results .......................................................... 51 3.3.1 Experimental set-up .............................................................................. 51 3.3.2 Capacity test .......................................................................................... 53 3.3.3 Pulse current discharge test ................................................................... 54 3.3.4 Pulse current charge test ........................................................................ 58
3.4 Simulation Results ................................................................................ 60 3.4.1 UMEV model implemented in modified ADVISOR ............................ 60 3.4.2 Simulation results for one UMDC ........................................................ 63 3.4.3 Simulation results for two UMDCs....................................................... 65 3.4.4 Simulation results for multiple UMDCs ............................................... 67 3.4.5 UMDC validation test ........................................................................... 69 3.4.6 Discussion ............................................................................................. 70
3.5 Conclusion............................................................................................. 71
CHAPTER 3 COMPARISON OF DIFFERENT LITHIUM IRON PHOSPHATE
BATTERY PACKS ………………………………………………… 43
viii

4.1 Introduction ........................................................................................... 72
4.2 Experiment ............................................................................................ 75
4.3 SOM-based Classification Method for Battery Sorting ........................ 76
4.4 Results and Discussion .......................................................................... 81 4.4.1 Pulse current discharge test ................................................................... 81 4.4.2 Constant current discharge test ............................................................. 86 4.4.3 EV driving cycle test ............................................................................. 89
4.5 Conclusion ............................................................................................. 92
5.1 Introduction ........................................................................................... 94
5.2 Battery Modeling and HIO for SOC Estimation ................................... 97 5.2.1 Battery modelling .................................................................................. 97 5.2.2 H infinity observer technique for SOC estimation ................................ 99 5.2.3 Battery pack SOC and cell individual SOC estimation ...................... 100
5.3 Experiment and Parameter Identification ............................................ 101 5.3.1 Experiment set-up ............................................................................... 101 5.3.2 Battery sorting approach ..................................................................... 102 5.3.3 Parameter identification ...................................................................... 102
5.4 Verification and Analysis .................................................................... 105 5.4.1 PCD test validation ............................................................................. 105 5.4.2 UDDS test validation .......................................................................... 107 5.4.3 UMDC test validation ......................................................................... 112 5.4.4 Discussion ........................................................................................... 115
5.5 Conclusions ......................................................................................... 116
CHAPTER 4 SELF-ORGANISING MAP-BASED CLASSIFICATION OF LITHIUM
IRON PHOSPHATE CELLS FOR BATTERY PACKS …………… 72
CHAPTER 5 BATTERY PACK STATE-OF-CHARGE ESTIMATION WITH H
INFINITY OBSERVER …………………………………………… 94
ix

6.1 Summary of Contributions .................................................................. 117
6.2 Future Research ................................................................................... 119 6.2.1 Battery thermal management .............................................................. 119 6.2.2 Battery state of health estimation ........................................................ 119 6.2.3 Fault diagnosis in battery packs .......................................................... 120
CHAPTER 6 CONCLUSIONS ………………………………………………………117
REFERENCES ……………………………………………………………………… 122
LIST OF PUBLICATIONS………………………………………………………… 140
x
LIST OF FIGURES
Figure 1-1 Early 1900s electric car
Figure 1-2 10 t fuel cell mine locomotive of Anglo American Platinum Ltd
Figure 1-3 GE mining battery powered LHD
Figure 1-4 Damascus underground mine electric personnel carrier
Figure 1-5 Papabrovo underground mine electric personnel carrier
Figure 1-6 Basic framework of BMS function
Figure 2-1 Top module of EV
Figure 2-2 PSAT GUI and initial windows
Figure 2-3 Key problems of cell differences
Figure 2-4 Diagram of Screening process sorting method
Figure 2-5 SOM model for cell sorting
Figure 2-6 Relationship of OCV-SOC for the lithium-ion battery derived from
experimental data of this study
Figure 2-7 Typical ECMs (a). Rint model (b). Thevenin model (c). RC model (d).DP
model
Figure 2-8 State observer for SOC estimation
Figure 2-9 Neural network for battery SOC estimation
Figure 3-1 Forces in action on UMEV
Figure 3-2 Power flow chart for UMEVs
xi
Figure 3-3 Internal resistance battery model
Figure 3-4. Single trip to workface in underground mine
Figure 3-5. Speed, grade and rolling resisitnances for one UMDC
Figure 3-6. Battery experimental setup
Figure 3-7. Voltage responses of PCD test for a single 20Ah prismatic battery at 15
Figure 3-8. Magnified transient response of voltage at the 4th pulse current discharge
Figure 3-9. Intermal resistances versus SOCs during battery discharging at temperatures
of 15, 25 and 40: a) 20Ah prismatic cell, b) 40Ah 4S2P battery pack, c) 2.3Ah
cylinder battery, d) 2.3Ah 4S battery pack
Figure 3-10. OCVs versus SOCs during battery discharging at the temperatures of 15,
25 and 40: a) 20Ah prismatic cell, b) 40Ah 4S2P battery pack, c) 2.3Ah cylinder
battery, d) 2.3Ah 4S battery pack
Figure 3-11. Voltage responses of PCC test for a single 20Ah prismatic battery at 15
Figure 3-12. OCVs versus SOCs during battery charging at the temperatures of 15,
25 and 40: a) 20Ah prismatic cell, b) 40Ah 4S2P battery pack, c) 2.3Ah cylinder
battery, d) 2.3Ah 4S battery pack
Figure 3-13. Internal resistances vesus SOCs during battery charing at the temperatures
of 15, 25 and 40: a) 20Ah prismatic cell, b) 40Ah 4S2P battery pack, c) 2.3Ah
cylinder battery, d) 2.3Ah 4S battery pack
Figure 3-14. SOCs over one UMDC
Figure 3-15. Temperatures of battery systems over one UMDC
Figure 3-16. SOCs over two UMDCs
xii

Figure 3-17. Battery system temperature over two UMDCs
Figure 3-18. SOCs over multip UMDCs
Figure 3-19. Battery system temperature over multiple UMDCs
Figure 3-20. Voltage profliles at the current profiles based on UMDC (a) 20Ah
prismatic battery, (b) 40Ah 4S2P pack
Figure 4-1.Experimental setup
Figure 4-2.SOM model for cell sorting
Figure 4-3 Average values of available capacity, temperature variation and internal
resistance for 12 cells
Figure 4-4 SOM training results with cells 1 to 12
Figure 4-5. Clustering results of 12 cells
Figure 4-6. Pulse current discharge and terminal voltage for sorted battery pack
Figure 4-7. OCVs versus SOCs for cells in sorted battery pack
Figure 4-8. OCVs versus SOCs for cells in unsorted battery pack
Figure 4-9. Discharge curves for cells in sorted battery pack
Figure 4-10.Discharge curves for cells in unsorted battery pack
Figure 4-11.Temperature difference under 2C discharge rate
Figure 4-12.Voltage difference under 2C discharge rate
Figure 4-13. Current profile for UDDS
Figure 4-14. Voltage profiles of cells in sorted battery pack xiii
Figure 4-15. Voltage profiles of cells in unsorted battery pack
Figure 4-16. Voltage difference under current profile of UDDS
Figure 4-17. Temperature difference under current profile of UDDS
Figure 5-1 Battery equivalent circuit model
Figure 5-2 Terminal voltage and current of sorted battery pack under PCD test
Figure 5-3 Experimental OCV-SOC relationship of LiFePO4 battery pack
Figure 5-4 Comparison of terminal voltages estimated from HIO with those obtained
from experiments and their errors for sorted battery pack under PCD test (a).HIO
estimated pack voltage (b). Estimated voltage error
Figure 5-5. Comparison of SOCs estimated from HIO with those obtained from
experiments and their errors for sorted battery pack under PCD test (a). HIO estimated
pack SOC (b). SOC error
Figure 5-6. Comparison of terminal voltages estimated from HIO with those obtained
from experiments and their errors for sorted battery pack under UDDS test (a). HIO
estimated terminal voltage (b). Estimated voltage error
Figure 5-7 Comparison of SOCs estimated from HIO with those obtained from
experiments and their errors for sorted battery pack under UDDS test (a).HIO estimated
pack SOC (b). estimated SOC error
Figure 5-8 Comparison SOC of AVC with the SOC of cell one and ture SOC(a) & SOC
difference (b)
xiv

Figure 5-9 Comparison of terminal voltages estimated from HIOs with those obtained
from experiments for each of four cells and their diffeences for sorted battery pack
under UDDS test (a). Observed voltge (b).voltage difference
Figure 5-10 Comparison of SOC estimated from HIOs with those obtained from
experiments for each of four cells and their diffeences for sorted battery pack under
UDDS test (a). HIO for Cell SOC (b). SOC error
Figure 5-11 Battery pack current and voltage profile under UMDC cycle test
Figure 5-12 Battery pack cell voltage variation and voltage difference under UMDC
cycle test (a).Observed voltage (b). Voltage difference
Figure 5-13 Battery pack SOC estimation and error under UMDC cycle test (a). HIO for
cell SOC (b). SOC difference
xv
LIST OF TABLES
Table 1-1 Current Electric Vehicles
Table 1-2 Underground mine electric personnel carriers
Table 1-3. Basic technical performance of battery types used in EVs
Table 1-4. Basic technical performance of Lithium-ion batteries
Table 2-1 Current commercial LiFePO4 batteries
Table 2-2 Typical lithium-ion batteries of different battery companies
Table 2-3 Current EV simulation software
Table 2-4 Fuzzy C-mean algorithm and steps
Table 2-5. Basic battery SOC estimation methods of lithium-ion battery
Table 2-6 ECMs and their characteristics and equations
Table 2-7 Summary of the Kalman filter used to estimate SOC
Table 3-1 Parameters of selected batteries and battery packs
Table 3-2 Battery capacities at temperatures of 15, 25 and 40
Table 3-3 UMEV vehicle parameters
Table 3-4. Battery system parameters
Table 3-5. Residual SOCs, energy consumption, efficiency and overall energy
efficiency and driving distances of UMEV under four battery systems after one UMDC
Table 3-6. Parameters of battery and vehicle after running for two UMDC cycle
xvi

Table 4-1.Specification of cells used for testing
Table 4-2 Key specifications of battery pack
Table 4-3 Available capacities for sorted and unsorted battery pack
Table 4-4 Voltage difference between voltage of each cell and the mean voltage of 4
cells in battery pack at SOC of 60%
Table 4-5 Voltage/SOC difference between voltage/SOC of each cell and the mean
voltage/SOC of 4 cells in sorted battery pack at SOC of 60%/OCV of 3.3V
Table 5-1 Battery pack circuit parameters at different SOCs
xvii

xviii

CHAPTER 1 INTRODUCTION
CHAPTER 1 INTRODUCTION
Due to the growing concerns over the shortage of fossil fuel and the progressively
increasing cost of fuel and tightened emission controls, researchers have identified
electric vehicles (EVs) as possible alternative modes of transportation in the future. The
electrification of transportation will have a significant impact on the vehicle industry in
relation to energy use, environmental issues and transportation. EVs are clean and
sustainable if the electricity which is used to charge the EV batteries is generated from
renewable energy resources. Since batteries have become the main power sources to
drive EVs, the development of reliable and safe battery management systems (BMSs) is
crucial for the commercialisation of EVs [1, 2]. The BMS can prevent EV batteries from
overcharging and under-discharge, optimize the driving range and enable EVs to be
driven safely.
The development of EVs has a long history dating back 150 years. From simple non-
rechargeable batteries to modern controlled battery packs, the power system of EVs has
experienced several alterations and innovations [1-3]. Recently, lithium-ion batteries
have been adopted as primary power sources in EVs due to the merits of high power
and energy densities, high operating voltage, long cycle life and low self-discharge rate.
Therefore, the development of BMSs for lithium-ion batteries is very important, as they
can ensure the safe and efficient operation of the battery systems in EVs [4, 5].
1.1 History of Electric Vehicles (EVs)
The first electric vehicle dates back to the 1830s. Between 1832 and 1839, Robert
Anderson invented the first crude electric carriage, powered by non-rechargeable
1
CHAPTER 1 INTRODUCTION
primary cells [6]. Later, more practical and more successful electric road vehicles were
invented by the middle 19th century and the newly-invented non-rechargeable electric
cells and batteries were first used by the inventors in that era [7].
In spite of their slow speed, EVs had many advantages in their early stage compared to
other vehicles. They were more stable, clean and quiet. As a result the early electric cars
became very popular as city cars, and they were also very popular due to their ease of
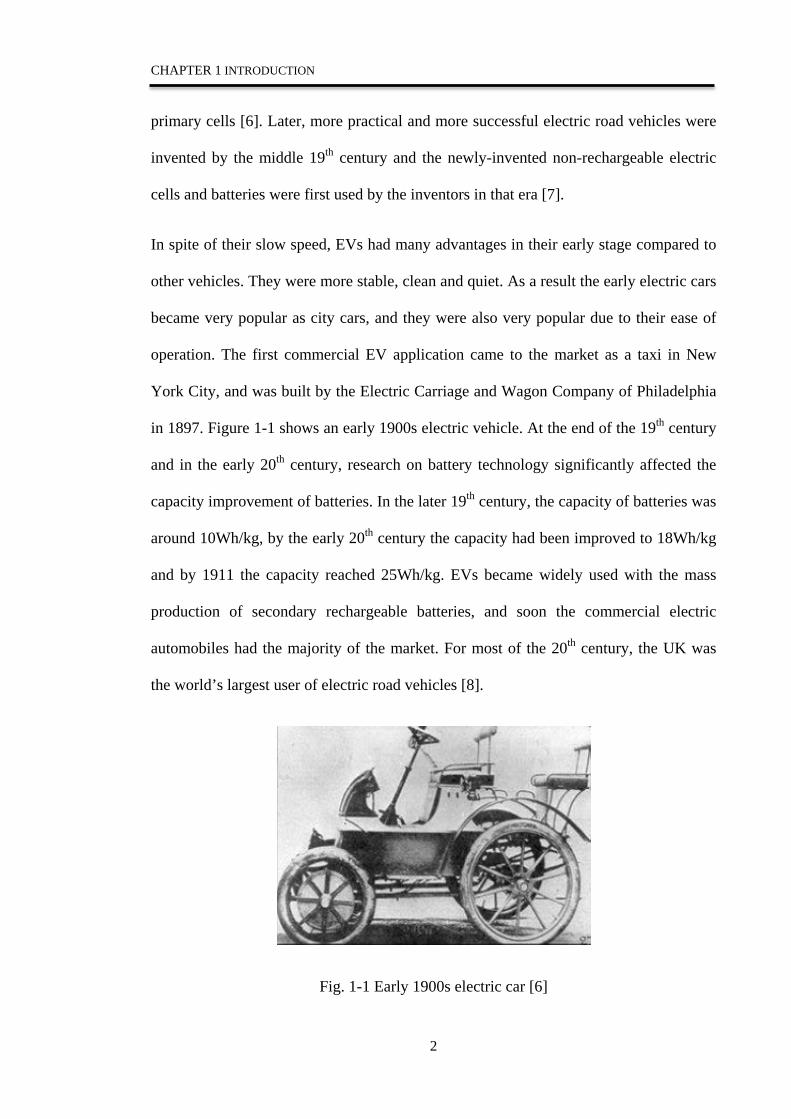
operation. The first commercial EV application came to the market as a taxi in New
York City, and was built by the Electric Carriage and Wagon Company of Philadelphia
in 1897. Figure 1-1 shows an early 1900s electric vehicle. At the end of the 19th century
and in the early 20th century, research on battery technology significantly affected the
capacity improvement of batteries. In the later 19th century, the capacity of batteries was
around 10Wh/kg, by the early 20th century the capacity had been improved to 18Wh/kg
and by 1911 the capacity reached 25Wh/kg. EVs became widely used with the mass
production of secondary rechargeable batteries, and soon the commercial electric
automobiles had the majority of the market. For most of the 20th century, the UK was
the world’s largest user of electric road vehicles [8].
Fig. 1-1 Early 1900s electric car [6]
2

CHAPTER 1 INTRODUCTION
However, by the 1930s the number of EVs decreased to nearly zero due to the
introduction of internal combustion engine vehicles (ICEVs). Compared with ICEVs,
EVs were slower and more expensive. Therefore, the leadership of EVs was overtaken
by ICEVs. In addition, the cheap price of petrol in the 1930s enabled ICEVs to travel a
long distance by carrying a petrol tank.
In the 1960s, due to the decreased air quality the U.S. government started to address
several air pollution control regulatory standards for automobiles. The energy crisis in
the 1970s and 1980s caused EVs to attract new attention from the U.S. government. The
U.S. government funded universities and laboratories to devote more time and resources
to EV research. However, because of the limited performance of EVs at this stage and
the lack of broad infrastructure support and the participation of corporations, the
development of EVs slowed rapidly during the 1960s to the late 1980s [9].
The increasing concerns with energy conservation, cost and independence as well as
environmental issues significantly stimulated the revival of EVs after the 1990s and
have encouraged people to consider the EV as an alternative mode of transportation.
From the 1990s until the present, major automobile companies have launched
aggressive strategies to develop EVs for commercialisation. Governments, academic
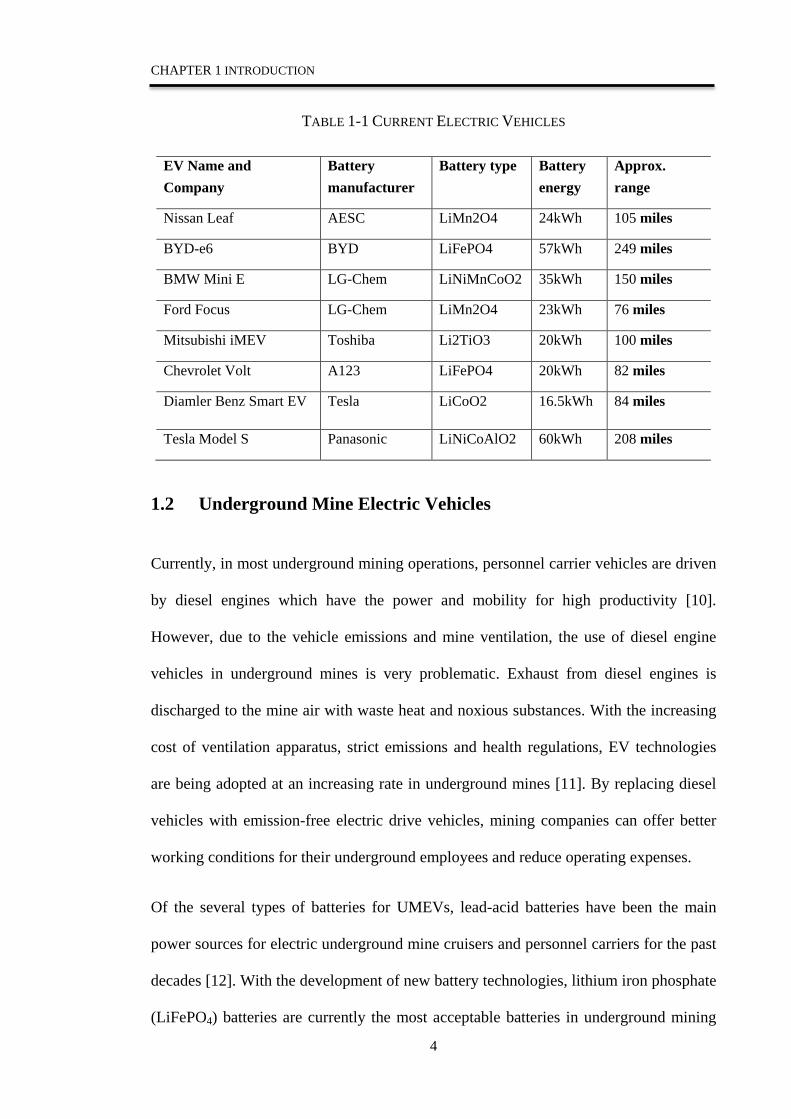
institutions and related industries are actively participating in the R&D of EVs. Table 1-
1 shows the currently popular EVs on the commercial market around the world and
their manufacturers, battery types and battery energy and travelling distances.
3
CHAPTER 1 INTRODUCTION
TABLE 1-1 CURRENT ELECTRIC VEHICLES
EV Name and Company
Battery manufacturer
Battery type Battery energy
Approx. range
Nissan Leaf AESC LiMn2O4 24kWh 105 miles
BYD-e6 BYD LiFePO4 57kWh 249 miles
BMW Mini E LG-Chem LiNiMnCoO2 35kWh 150 miles
Ford Focus LG-Chem LiMn2O4 23kWh 76 miles
Mitsubishi iMEV Toshiba Li2TiO3 20kWh 100 miles
Chevrolet Volt A123 LiFePO4 20kWh 82 miles
Diamler Benz Smart EV Tesla LiCoO2 16.5kWh 84 miles
Tesla Model S Panasonic LiNiCoAlO2 60kWh 208 miles
1.2 Underground Mine Electric Vehicles
Currently, in most underground mining operations, personnel carrier vehicles are driven
by diesel engines which have the power and mobility for high productivity [10].
However, due to the vehicle emissions and mine ventilation, the use of diesel engine
vehicles in underground mines is very problematic. Exhaust from diesel engines is
discharged to the mine air with waste heat and noxious substances. With the increasing
cost of ventilation apparatus, strict emissions and health regulations, EV technologies
are being adopted at an increasing rate in underground mines [11]. By replacing diesel
vehicles with emission-free electric drive vehicles, mining companies can offer better
working conditions for their underground employees and reduce operating expenses.
Of the several types of batteries for UMEVs, lead-acid batteries have been the main
power sources for electric underground mine cruisers and personnel carriers for the past
decades [12]. With the development of new battery technologies, lithium iron phosphate
(LiFePO4) batteries are currently the most acceptable batteries in underground mining
4

CHAPTER 1 INTRODUCTION
personnel carriers [13] due to their relatively safe and reliable characteristics compared
with other lithium ion batteries. UMEVs can be grouped into two categories: rail
locomotives and electric load-haul-dump (LHD) vehicles which are used to handle ore,
and personnel carriers.
1.2.1 Rail locomotives and LHDs in underground mines
Before the popularity of the battery technologies, fuel cells were used to power
underground vehicle in the mine locomotive [10]. The fuel cells used in underground
mine rail vehicles have many benefits, including zero emissions, low noise, low
temperature, high power density and long life. They provide with the safety,
compactness and simplicity in working environment [14]. Anglo American Platinum
Ltd developed a 10 ton fuel cell locomotive which demonstrated well in the South
Africa Tumela mine [15]. Figure 1-2 shows the fuel cell mine locomotive.
This locomotive is much heavier than other vehicles. Most locomotives in underground
mines are rail vehicles, which confines the movement of the vehicles. This kind of
vehicle carries equipment to handle ore or rocks.
5

CHAPTER 1 INTRODUCTION
Fig. 1-2 10 t fuel cell mine locomotive of Anglo American Platinum Ltd [15]
GE Mining is bringing forward its battery-powered vehicle in coal mining to the hard
rock industry through battery powered load-haul-dump vehicles, as shown in Fig. 1-3.
This vehicle is powered by GE’s advanced Durathon battery, which is a sodium metal
halide battery (NaMx) with improved performance and increased reliability. This new
technology will make underground mining industries safe, cost-efficient and clean.
Fig. 1-3 GE mining battery powered LHD [16]
6
CHAPTER 1 INTRODUCTION
1.2.2 Electric personnel carriers in underground mines
To provide miners with better working conditions, an electric personnel carrier is
essential for them to travel to the workface and to the workshop. Based on an
investigation and survey of current electric personnel carrier vehicles, batteries are the
most used power sources in electric underground mine personnel carriers and cruisers.
There are several types of batteries in use. The most popular batteries are the lead acid
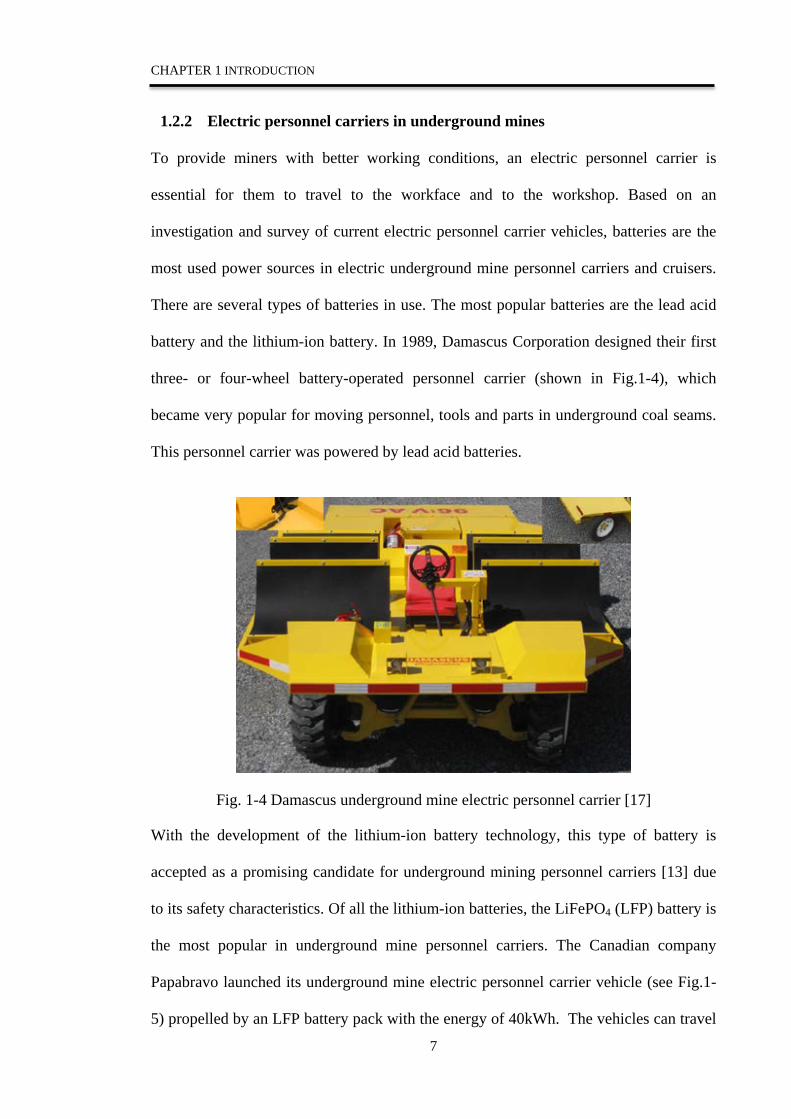
battery and the lithium-ion battery. In 1989, Damascus Corporation designed their first
three- or four-wheel battery-operated personnel carrier (shown in Fig.1-4), which
became very popular for moving personnel, tools and parts in underground coal seams.
This personnel carrier was powered by lead acid batteries.
Fig. 1-4 Damascus underground mine electric personnel carrier [17]
With the development of the lithium-ion battery technology, this type of battery is
accepted as a promising candidate for underground mining personnel carriers [13] due
to its safety characteristics. Of all the lithium-ion batteries, the LiFePO4 (LFP) battery is
the most popular in underground mine personnel carriers. The Canadian company
Papabravo launched its underground mine electric personnel carrier vehicle (see Fig.1-
5) propelled by an LFP battery pack with the energy of 40kWh. The vehicles can travel
7

CHAPTER 1 INTRODUCTION
120 km on a single charge and can re-charge for more than an hour during the crew
change. By using this green and friendly vehicle in the underground mining industry,
the air quality in underground mines and miners’ working conditions can be improved.
Table 1-2 summarizes the underground mine electric personnel carriers currently
available around the world.
Fig. 1-5 Papabrovo underground mine electric personnel carrier [13]
TABLE 1-2 UNDERGROUND MINE ELECTRIC PERSONNEL CARRIERS
Name of Carriers Company Battery type Battery energy
MAC-12 Electric transporter
Damascus Lead acid 7.2 kWh
672 Inspector’s friend John B. Long Co Lead acid 16.9 kWh
7200 Personnel carrier A.L.LEE Corporation Lead acid 8.6 kWh
GE Locomotive GE Durathon battery 24.8 kWh
Personnel carrier Papabravo LiFePO4 48 kWh
Rubber tyred car CALB Lithium ion 64 kWh
8

CHAPTER 1 INTRODUCTION
1.3 Batteries for EVs
The overall objective of EV development is to make it commercial, which means EVs
must have a range, performance, safety, comfort and reliability comparable to ICEVs. In
this context, developing a high performance, low-cost, reliable and safe alternative
energy source is essential [1]. The alternative energy sources for EVs include batteries,
fuel cells, capacitors and flywheels. Fuel cells generate energy by chemical reaction,
while batteries, capacitors and flywheels are energy storage systems using charging and
discharging processes. Currently and in the near future, batteries are considered to be
the dominant EV energy source because of their increased energy capacity and
reasonable price. The basic task of the battery is to store energy obtained from an
external power source by charging the battery and releasing the energy which is
transferred into kinetic energy by discharging. Table 1-3 shows the typical
characteristics of batteries commonly used in EVs.
TABLE 1-3. BASIC TECHNICAL PERFORMANCE OF BATTERY TYPES USED IN EVS [18]
Battery type Lead-acid Ni-Cd Ni-MH Lithium-ion
Energy density (W/kg) 30-50 45-60 70-95 80-120
Nominal voltage 2V 1.25V 1.25V 3.6V
Overcharge tolerance High Moderate Low Very low
Self-discharge Low Moderate High Very low
Operating Temperature -20~60 °C -40~60°C -20~60°C -30~60°C
Cycle life 500~1000 800 750~1200 1500~3000
Energy efficiency >80% 75% 70% 85%~95%
9
CHAPTER 1 INTRODUCTION
1.3.1 Lead acid battery
The lead acid battery has been successfully used as a commercial EV power resource
for a long time since it was invented by the French physician Gaston Planté in 1859 [19].
It was the first rechargeable battery for commercial use. It uses lead dioxide for the
anode, metallic lead for the cathode and sulphuric acid solution for the electrolyte.
The lead acid battery has a relatively low cost with a broad capacity range. It can work
under different temperature ranges [20]. A typical lead acid battery has a self-discharge
between 2% to 5% per month at room temperature [21, 22]. Lead acid batteries have
undergone steady improvements in efficiency, durability, and lifetime, and are now
widely used in many fields due to their relatively stable characteristics. The above
advantages have led to their use as the power supply for golf cars, forklifts and some
simple underground mine carriers.
The lead acid battery has a relatively short life cycle and is heavy compared with other
battery types. The lifetime of a lead acid battery is reduced with the increase of the
depth of discharge [23]. A lead acid battery cannot be fast charged, and a full charge
cycle takes 14 to16 hours. When the lead acid battery is stored, it must be in the fully
charged state to avoid sulfation. The main disadvantage of the lead acid battery is that
lead is toxic, and environmentalists would like to replace the lead acid battery with
other chemicals.
1.3.2 Ni-Cd and Nickel- Metal Hydride batteries
The nickel-cadmium battery, invented by Waldmar Jungner in 1899 [19], offered
several advantages over lead acid batteries, but the materials were expensive at the time
when it first came to commercialization. The nickel-cadmium (Ni-Cd) battery uses
nickel oxide hydroxide and metallic cadmium as electrodes. For many years, the Ni-Cd 10

CHAPTER 1 INTRODUCTION
battery was the preferred battery choice for radios, emergency medical equipment,
professional video cameras and power tools. Compared with other types of rechargeable
cells, the Ni-Cd battery offers relative short cycle life and capacity. Typically, the best
performance for Ni-based batteries is obtained at temperatures between 0 and 40 °C,
while it can work under an extremely low temperature of around minus 40°C [24]. The
nickel-based battery can accept fast charging, and the charge time can vary from 14
hours at 0.1C charge to 1C charge for 1 hour. However, cadmium has the potential for
carcinogenicity and is an environmental hazard. Despite these severe drawbacks, the Ni-
Cd batteries were accepted to propel EVs before the advent of the nickel-metal hydride
(Ni-MH) battery [25].
Research on nickel-metal-hydride batteries started in 1967. The Ni-MH battery is very
similar to the Ni-Cd battery, and uses nickel oxy hydroxide for the anode like the Ni-Cd
battery and adopts metal hydride as the cathode. Compared with the Ni-Cd battery, the
Ni-MH battery offers relatively higher specific energy, an extended life span and is
environmentally friendly. After the emergence of the Ni-MH battery, it soon replaced
the Ni-Cd in HEV applications. The Ni-MH battery has a lower price and safer
operation than the lithium-ion battery, but has the significant disadvantage of a high
self-discharge rate. It can lose 20% of its capacity within the first 24 hours after being
fully charged and 10 % per month thereafter. Therefore, it is important to store the
battery under low-voltage conditions [24, 26].
1.3.3 Lithium-ion battery
Of the existing batteries used in EVs, the most promising candidate is the lithium-ion
battery. The lithium-ion battery is superior to other type of batteries in terms of energy
density and power density, which allows it to be designed to be lighter in weight and
11

CHAPTER 1 INTRODUCTION
smaller in size. The lithium-ion battery also has the advantage of a wide temperature
range of operation, rapid charge capability, no memory effects, long cycle life and low
self-discharge rate, as shown in Table 1-2. Compared with other types of batteries, the
charging time of the lithium ion battery is very fast, from 2.5 hours to 0.5 hours with the
varying charge current [27]. Its self-discharge rate is around 1% to 2% per month at
room temperature [28]. These appealing features also explain why they are already
dominant in consumer electronics such as cell phones, laptop computers, digital
cameras, video cameras, power tools and other portable devices [29].
There are many types of lithium-ion batteries, depending on the cathode materials. The
most popular lithium-ion batteries include lithium cobalt oxide (LCO), lithium
manganese oxide (LMO), lithium iron phosphate (LFP) and lithium nickel manganese
cobalt oxide (NMC). Table 1-4 shows the performance of different lithium-ion batteries.
It can be seen that the LFP-based lithium-ion batteries are the most promising batteries
of the four types when considering all the aspects. The pivotal benefits of the LFP
batteries are enhanced safety, good thermal stability, tolerance of abuse, high current
rating and long cycle life [30].
12

CHAPTER 1 INTRODUCTION
TABLE 1-4. BASIC TECHNICAL PERFORMANCE OF LITHIUM-ION BATTERIES
Specifications LiCoO2 (LCO)
LiMn2O4 (LMO)
LiFePO4 (LFP)
LiNiMnCoO2 (NMC)
Nominal voltage (V) 3.6 3.8 3.3 3.6
Operating voltage range (V) 2.5~4.2 2.5~4.2 2~3.6 2.5~4.2
Specific energy (Wh/kg) 150-190 100-135 120-160 140-180
Cycle life (100%DOD to 80% capacity) 500+ 500+ 1000+ 500+
Operating temperature during discharge (°C)
-20~60* -30~60* -30~50 -20~60*
Operating temperature during charge (°C)
0~45 0~45 0~45 0~45
Discharge rate (continuous) 2-3C 10C 10-125C 2-3C
*[19]
1.4 Battery Management System
Generally, the capacity and voltage of a single battery cell is relatively low if it is used
in EVs. To meet the requirements of energy and power for EVs, hundreds and
thousands of single cells are required to be connected in series and parallel to build a
battery pack. The series connection of cells yields a higher total battery voltage at the
same capacity and the parallel connection of cells yields a higher total battery capacity
at the same battery voltage [31]. Usually, the battery system in EVs contains many
battery packs. To manage the battery packs, a battery management system (BMS) is
essential.
The main task of the BMS is to ensure the optimum use of the energy in the battery
system and prevent the battery system from being damaged. The BMS is able to
monitor and protect the battery cells in the battery pack, estimate the state of charge,
13

CHAPTER 1 INTRODUCTION
control the battery cells’ balance and report the status of the battery cells to the
electronic control unit (ECU) in the EV.
The BMS in the vehicle is required to interface with other vehicle control systems. It
also deals with the real-time rapidly changing charge and discharge conditions. With the
acceleration and braking of the EV, the BMS works in a harsh environment. The
hardware of the BMS in EVs is integrated with many sensors, actuators, controllers and
signal wires. The main tasks of the BMS in EVs are as follows [5, 32]:
• Protect the cells and battery pack from damage,
• Prolong the life of the battery system through the control of the cell and battery
pack to operate within the appropriate voltage, current and temperature range.
• Control and maintain the battery system in an optimum state in which the EV
can operate at its best.
The BMS has many function modules, and the basic framework of the BMS functions is
shown in Fig. 1-6.
Fig. 1-6 Basic framework of BMS function 14
CHAPTER 1 INTRODUCTION
The main function modules of the BMS can be summarised as follows:
• Measurement module. This module usually detects the voltage and temperature
of each cell and pack, as well as the total current of the battery pack.
• Management module. This module includes the protection of the battery system
from damage by monitoring the condition of the cells and battery pack, the
balancing of the battery cells to maximize the pack’s capacity and the control of
the temperature of the system to make sure it works in a safe temperature range.
• Evaluation module. This module estimates the state of the battery pack, which
includes the state of charge (SOC), state of health (SOH), pack capacity and
pack resistance by analysing the measured data
• Communication module. This module exchanges the battery system information
with the ECU and other external systems in the EV.
• Information storage module. This module stores the key data of the voltage,
current, SOC and resistance for the battery pack and the maximum and
minimum voltage and temperature of each cell as well as providing warnings
and error messages.
Although the BMS has many modules, the present research focuses on the following
parts of the BMS:
• Based on an analysis of characteristics of UMEVs, the comparison of different
battery systems was conducted through simulation to choose the best battery
system for UMEVs.
• To make a consistent battery pack, a battery sorting method based on a self-
organization map (SOM) is proposed to classify the cells into groups with
15

CHAPTER 1 INTRODUCTION
similar characteristics and the cells in the same group are used to build the
battery pack.
• The H-infinite observer is used to estimate the SOC for the sorted battery pack
and the SOC of each cell.
1.5 Objectives and Major Contribution of the Thesis
This thesis focuses on three aspects of the BMS: the selection of battery systems for
UMEVs among many types of LiFePO4 batteries and battery packs, the classification of
cells for constructing battery packs, and the estimation of state of charge (SOC) for the
battery pack.
The major contributions of the thesis are as follows:
• A modified UMEV model is developed based on the current EV model in
ADVISOR.
• An underground mine driving cycle with variable rolling resistance coefficients
and variable uphill/downhill gradients is designed.
• A hybrid simulation approach based on the modified Advanced Vehicle
Simulator is proposed to integrate the experimental results of battery packs into
the UMEV model.
• A SOM sorting approach is proposed to select cells of similar characteristics to
alleviate the problems of non-uniformity and imbalance of cells in battery packs.
• An average virtual cell model-based H infinity observer method is proposed to
estimate the state of charge (SOC) for a series-connected battery pack and cells.
16
CHAPTER 1 INTRODUCTION
In summary, the work of the thesis has the potential to significantly enhance the battery
performance of UMEVs to achieve the desired driving experience in underground
working conditions.
1.6 Organization of the Thesis
The structure of the thesis reflects the discussion about the current research and research
gaps in three aspects of the BMSs for UMEVs. The thesis is organized as follows:
Chapter 2 presents a survey of EVs and underground mine EVs as well as the current
batteries and BMSs. The main tasks of the BMS are discussed in detail, including
battery types for UMEVs, cell inconsistency in the battery pack and SOC methods for
battery packs and each cell in the pack.
Chapter 3 explores the selection of battery systems for UMEVs. The parameters of the
batteries are identified based on battery experiments under various temperatures. A
UMEV dynamic model is developed and implemented in ADVISOR. To compare the
battery systems by integrating the experimental results of these batteries and battery
packs into a UMEV model, a hybrid simulation is proposed and conducted for a
specifically designed underground mine driving cycle with variable rolling resistance
coefficients and variable uphill/downhill gradients.
Chapter 4 investigates a self-organizing map (SOM)-based classification of LiFePO4
cells for a battery pack so that the cells can be as consistent as possible before these
cells form a battery pack. The parameters of cell temperature variation, internal
resistance and available capacity obtained from the experiments are used as the inputs
of the SOM to classify the cells. Next, the output of the SOM is used to classify cells
into three groups with similar characteristics according to the input parameters. Cells in 17
CHAPTER 1 INTRODUCTION
the same group are built in series for a sorted battery pack, whereas randomly chosen
cells are connected in series to form an unsorted battery pack. The comparison of the
consistency between the sorted battery pack and the unsorted battery pack under
different discharging conditions verifies the effectiveness of the proposed classification
method and the consistency of the cells in the battery pack.
Chapter 5 presents an H infinity observer-based method to estimate the SOC for a
series-connected battery pack. An average virtual cell (AVC) model is defined and the
SOC of the AVC model is estimated to represent the pack SOC when the terminal
voltage differences (TVDs) between each individual cell in the pack and the AVC are
all less than the pre-set value. When the TVD of one cell is larger than the pre-set value,
the SOC of the cell is estimated together with the pack SOC. The LiFePO4 battery pack
is utilized to conduct the experiments to verify the effectiveness of the proposed method.
Chapter 6 provides the conclusions and recommendations for future work.
18
CHAPTER 2 LITERATURE REVIEW
CHAPTER 2 LITERATURE REVIEW
This chapter provides a broad review of LiFePO4 batteries, the sorting methods to build
battery packs and the SOC estimation method used in cells and battery packs for
UMEVs.
2.1. Battery Selection and Simulation for UMEVs
Currently, most underground mine vehicles are powered by diesel engines [10]. Due to
the exhaust and ventilation problems in underground mines, electric powered vehicles
are attracting much attention in underground mine industries [33]. As discussed in
Section 1.3 above, batteries are the main power source for electric powered vehicles.
Compared with most commercial rechargeable batteries, lithium ion batteries are the
most acceptable batteries in EVs due to their high energy and power density, long cycle
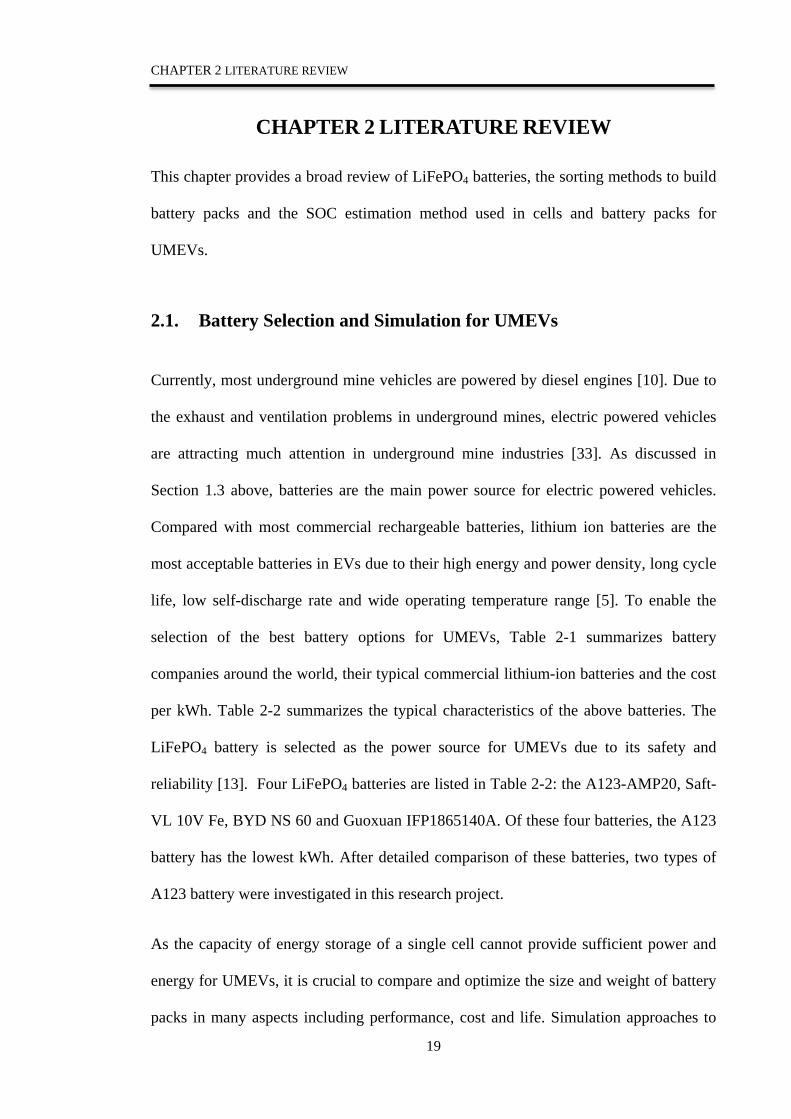
life, low self-discharge rate and wide operating temperature range [5]. To enable the
selection of the best battery options for UMEVs, Table 2-1 summarizes battery
companies around the world, their typical commercial lithium-ion batteries and the cost
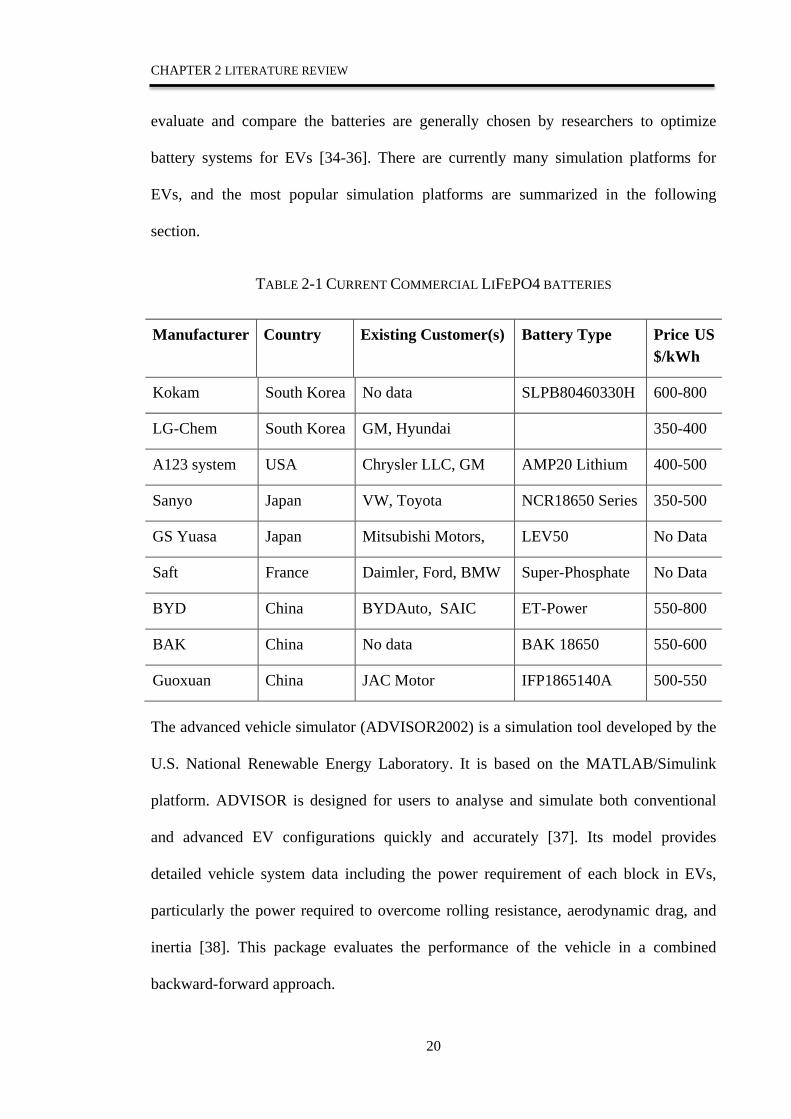
per kWh. Table 2-2 summarizes the typical characteristics of the above batteries. The
LiFePO4 battery is selected as the power source for UMEVs due to its safety and
reliability [13]. Four LiFePO4 batteries are listed in Table 2-2: the A123-AMP20, Saft-
VL 10V Fe, BYD NS 60 and Guoxuan IFP1865140A. Of these four batteries, the A123
battery has the lowest kWh. After detailed comparison of these batteries, two types of
A123 battery were investigated in this research project.
As the capacity of energy storage of a single cell cannot provide sufficient power and
energy for UMEVs, it is crucial to compare and optimize the size and weight of battery
packs in many aspects including performance, cost and life. Simulation approaches to
19
CHAPTER 2 LITERATURE REVIEW
evaluate and compare the batteries are generally chosen by researchers to optimize
battery systems for EVs [34-36]. There are currently many simulation platforms for
EVs, and the most popular simulation platforms are summarized in the following
section.
TABLE 2-1 CURRENT COMMERCIAL LIFEPO4 BATTERIES
Manufacturer Country Existing Customer(s) Battery Type Price US $/kWh
Kokam South Korea No data SLPB80460330H 600-800
LG-Chem South Korea GM, Hyundai 350-400
A123 system USA Chrysler LLC, GM AMP20 Lithium 400-500
Sanyo Japan VW, Toyota NCR18650 Series 350-500
GS Yuasa Japan Mitsubishi Motors, LEV50 No Data
Saft France Daimler, Ford, BMW Super-Phosphate No Data
BYD China BYDAuto, SAIC ET-Power 550-800
BAK China No data BAK 18650 550-600
Guoxuan China JAC Motor IFP1865140A 500-550
The advanced vehicle simulator (ADVISOR2002) is a simulation tool developed by the
U.S. National Renewable Energy Laboratory. It is based on the MATLAB/Simulink
platform. ADVISOR is designed for users to analyse and simulate both conventional
and advanced EV configurations quickly and accurately [37]. Its model provides
detailed vehicle system data including the power requirement of each block in EVs,
particularly the power required to overcome rolling resistance, aerodynamic drag, and
inertia [38]. This package evaluates the performance of the vehicle in a combined
backward-forward approach.
20
CHAPTER 2 LITERATURE REVIEW
TABLE 2-2 TYPICAL LITHIUM-ION BATTERIES OF DIFFERENT BATTERY COMPANIES
Battery Type Nominal Voltage
Energy Density (Wh/Kg)
Capacity(Ah)
Dimension
(mm)
Mass
(g)
Kokam-SLPB 80460330H
3.7V 50-80 100 8*455*325 2700
LG-Chem ICR18650S3
3.7V No data 2.2 Φ 18.5×65 48
A123-AMP20 3.3V 2400 20 7.2×160×227 496
Sanyo-NCR18650 3.6V 183 3.1 Φ 18.6×65.2 45.5
GS Yuasa-LEV50 3.7V 109 50 171×44×115 1700
Saft-VL 10V Fe 3.3V 55 10 Φ 47×173 600
BYD-NS60/55D23R
3.3V No data 60 260×170×228 12000
BAK-18650 3.6V No data 1.5 Φ 18.4 ×65 45.0
Guoxuan-IFP1865140A
3.3V 185 10 65×18×140 330
Figure 2-1 shows the structure of the module of the EV. The EV module consists of
several subsystems. Each subsystem has its own MATLAB file, which defines the
related parameters of this particular subsystem. Users can modify the subsystem
SIMULINK model as well as the M-file to fit new modelling requirements. For
example, in the energy storage subsystem, different battery models can substitute the
existing battery model. The user can change the M-file related to the battery block
diagram and choose different batteries from different companies. In this research
project, the A123 2.3Ah and 20Ah batteries were chosen to replace the Saft 6Ah lithium
ion battery. It is very easy to build your own EV model using ADVISOR.
21

CHAPTER 2 LITERATURE REVIEW
Fig. 2-1 Top module of EV
The Powertrain System Analysis Toolkit (PSAT) is a simulation toolbox for electric
power system analysis and control software, developed by the Argonne National
Laboratory and sponsored by the U.S. Department of Energy (DOE) [39]. PSAT is
developed in a MATLAB/SIMULINK environment and with graphical user interfaces
(GUIs) based on the SIMULINK-based library, which makes PSAT a user friendly
Toolbox. As a forward-looking model, PSAT provides users more than 200 predefined
configurations, which include conventional vehicles, pure EVs, fuel cell vehicles, and
hybrid EVs. PSAT’s core is the power flow routine, which also takes care of state
variable initialization. PSAT includes power flow, continuation power flow, optimal
power flow, small signal stability analysis and time domain simulation. PSAT supports
a variety of static and dynamic component models [40, 41]. Figure 2-2 shows a typical
GUI of the PSAT vehicle model.
AVL CRUISE is a simulation package that supports tasks in vehicle system and
drivetrain analysis throughout all development phases, from concept planning to final
design. Its application range covers all conventional vehicle powertrain systems to
advanced EV & HEV systems. The program provides the flexibility to develop a single
system model to meet the requirements of diverse applications in the development of
22

CHAPTER 2 LITERATURE REVIEW
powertrains and drivelines. CRUISE offers a streamlined workflow for all parameter
optimization and component matching. It is usually used in powertrain and engine
development to optimize vehicle systems, including cars, buses, trucks and hybrid
vehicles.
Fig.2-2 PSAT GUI and initial windows
EVSIM is an EV simulation module developed by Hong Kong University based on
MATLAB for Windows. EVSIM has a modular programming structure and is
programmed as M-files. It includes four hierarchical menus, namely the Main Menu,
Input Menu, Specific Data Input Menu and Output Menu. The main menu consists of
various sub-systems which are graphically presented [42]. Users can start the simulation
with the default values. On the other hand, users can alter the vehicle parameters to
perform the simulation.
23
CHAPTER 2 LITERATURE REVIEW
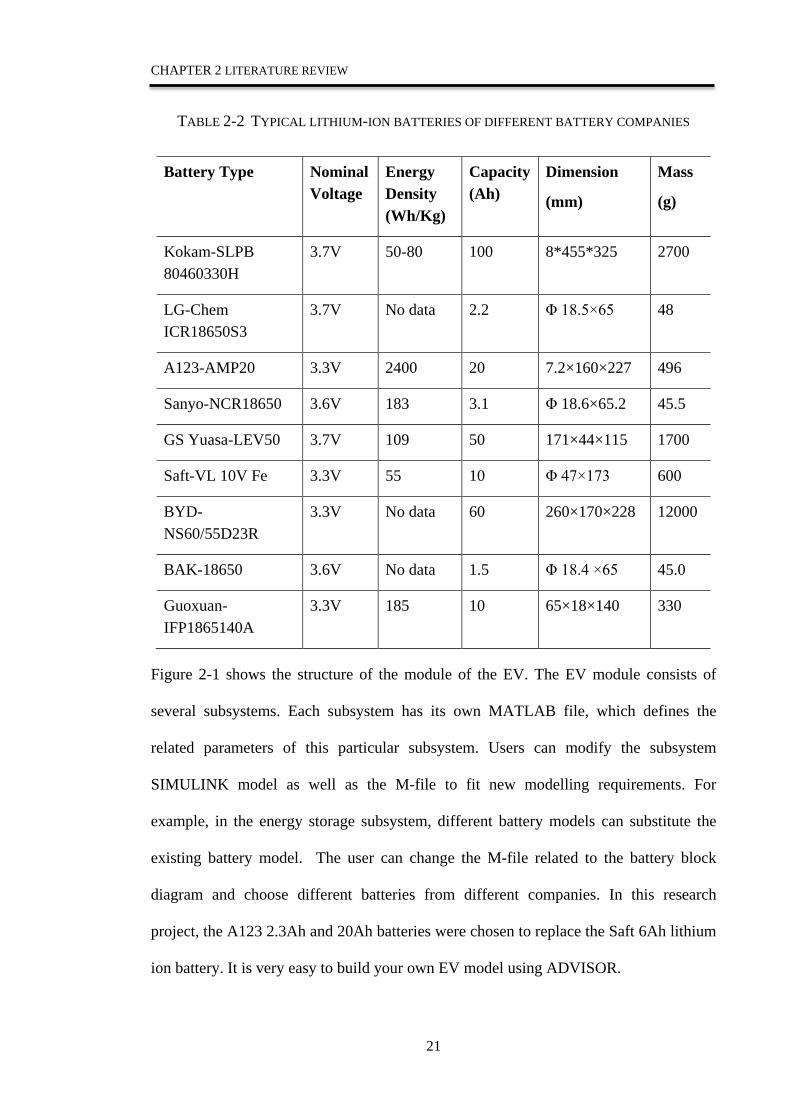
Table 2-3 summarizes the above four simulation tools. Of these software packages,
ADVISOR has more users and it is easy to modify the existing vehicle parameters. It
provides a secondary development platform and has a backward and forward
development environment, which is more flexible for users to build their own vehicle
models. In addition, the software provides users with the open source code to develop
their own models. Therefore, the ADVISOR was the best option for our research to
perform the simulation for UMEVs.
Table 2-3 Current EV simulation software
Software Name
Developer Application GUI and versatility
Development platform
ADVISOR U.S. National Renewable Energy Laboratory (NREL)
EVs, HEVs, PHEVs, normal vehicles, fuel-cell vehicles
GUI friendly and easy to use
MATLAB/Simulink
Secondary development
PSAT Argonne National Laboratory & U.S. Department of Energy (DOE)
EVs, HEVs, PHEVs, normal vehicles, fuel-cell vehicles
GUI friendly and easy to use
MATLAB/Simulink
Secondary development
CRUISE AVL EVs, HEVs, PHEVs, normal vehicles, fuel-cell vehicles
GUI C/Fortran
EVSIM Hong Kong University
EVs Graphic control and user friendly
MATLAB/Simulink
Secondary development
The details of ADVISOR simulation approaches used in the UMEV are explained in
detail in Chapter 3. 24
CHAPTER 2 LITERATURE REVIEW
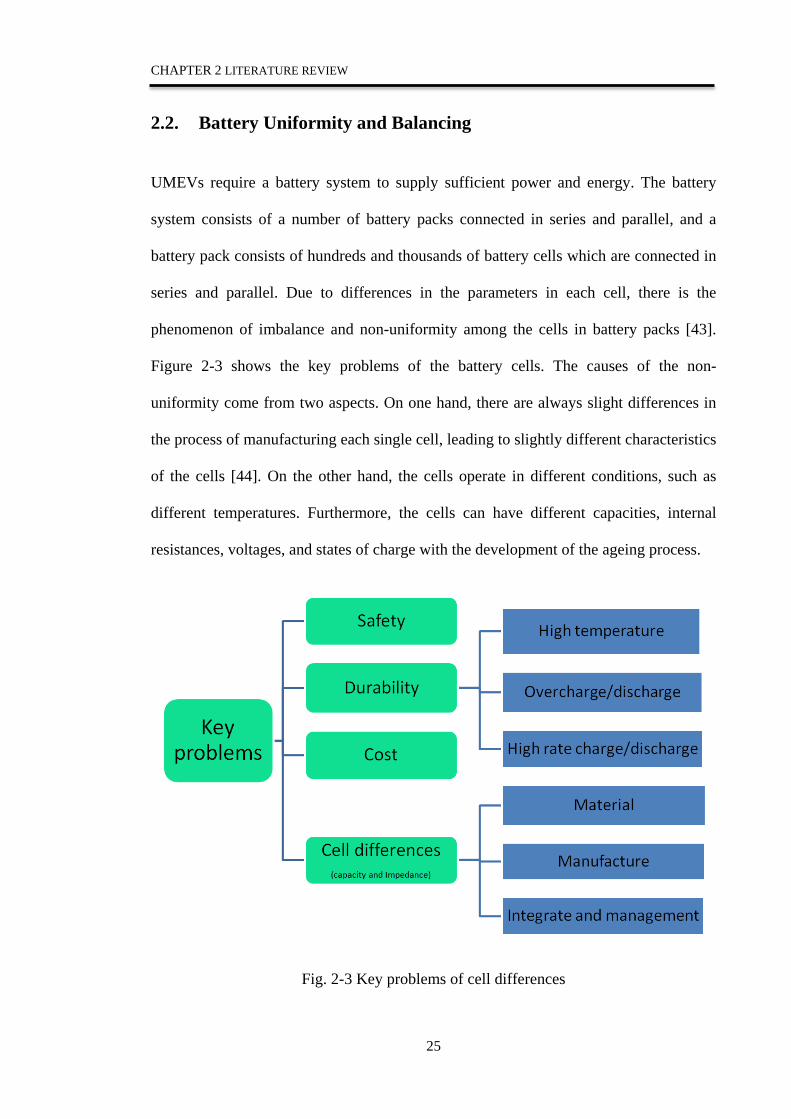
2.2. Battery Uniformity and Balancing
UMEVs require a battery system to supply sufficient power and energy. The battery
system consists of a number of battery packs connected in series and parallel, and a
battery pack consists of hundreds and thousands of battery cells which are connected in
series and parallel. Due to differences in the parameters in each cell, there is the
phenomenon of imbalance and non-uniformity among the cells in battery packs [43].
Figure 2-3 shows the key problems of the battery cells. The causes of the non-
uniformity come from two aspects. On one hand, there are always slight differences in
the process of manufacturing each single cell, leading to slightly different characteristics
of the cells [44]. On the other hand, the cells operate in different conditions, such as
different temperatures. Furthermore, the cells can have different capacities, internal
resistances, voltages, and states of charge with the development of the ageing process.
Fig. 2-3 Key problems of cell differences
25
CHAPTER 2 LITERATURE REVIEW
Due to the differences in the cells, the cell voltage is not always equal to the pack
voltage divided by the number of cells when the cells are connected in series. These
differences will cause several problems which have drawn much attention. First, un-
uniformity of cells causes incomplete charging of the battery pack. When charging the
battery pack, the charging process stops when one cell’s voltage becomes close to
unsafe condition while the other cells may not be fully charged, which means less
available capacity of the battery pack. The second problem of imbalanced battery packs
is incomplete use of the pack energy. When the battery pack discharges, the lowest
voltage cell will decide the end of the discharge process to prevent over-discharge,
while other cells still have relatively high voltage and energy left. This causes energy
waste. As a result, non-uniformity can cause safety problems. These problems affect the
on-board performance and cycle life of the battery packs in UMEVs. Therefore, it is
important to analyse the uniformity and imbalance of batteries.
In order to alleviate the inconsistency of the cells in the battery pack, several methods
have been reported in the literature to classify similar cells. There are two groups of
clustering methods. One group of methods is based on observing the directly measured
battery parameters. The other group is based on machine learning approaches.
2.2.1 Sorting methods based on observing direct measurement
Sorting methods based on observing the directly measured parameters from experiments
are used to classify the cells into groups. They can be further divided into several
classification methods, including the voltage classification method, the static capacity
classification method, the resistance matching method and combinations of these
methods.
26
CHAPTER 2 LITERATURE REVIEW
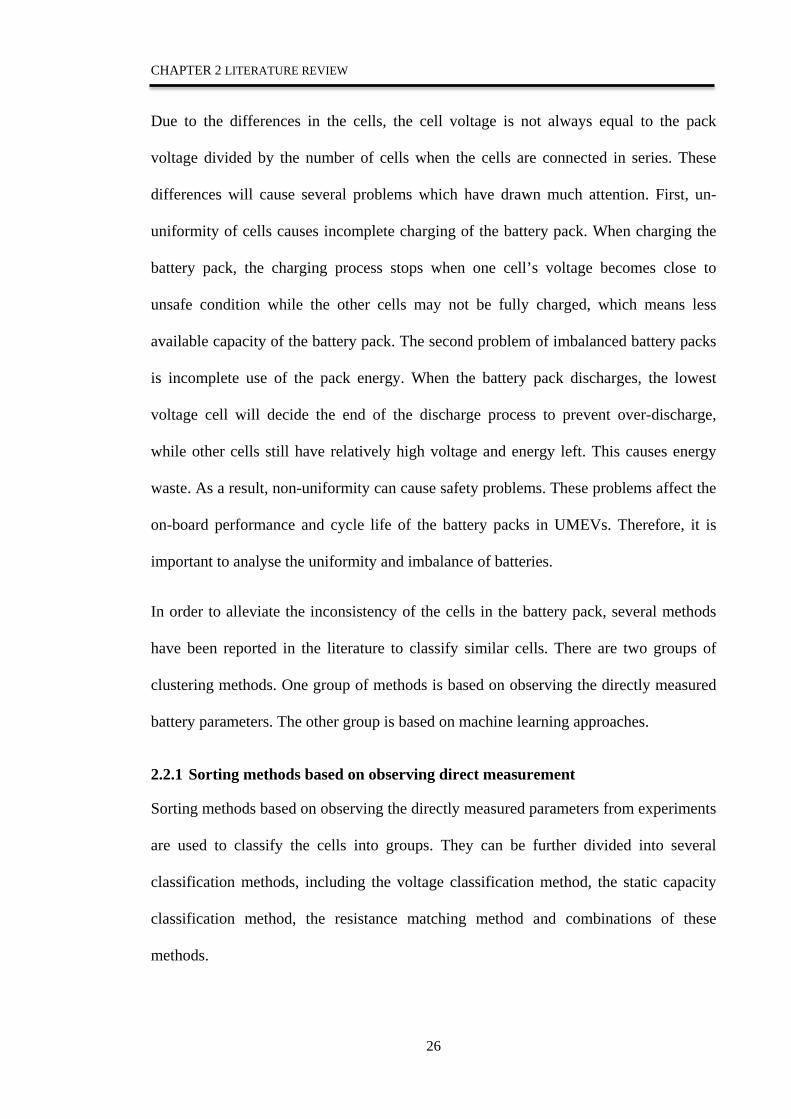
Based on the above methods, a screening process has been introduced by Kim [45]. The
screening process is a process to select cells which have similar electrochemical
characteristics. Figure 2-4 shows a diagram of the screening process. In the first
screening process, the cell’s capacity within the capacity range is chosen and entered
into the second screening step. In the second screening process, the measured internal
resistance within the range is chosen as one group. Therefore, the cells in the selected
group will have similar electrochemical characteristics in terms of capacity and
resistances. However, the thermal variances of each cell in the battery pack during
charging and discharging process are not considered.
Fig. 2-4 Screening process sorting method [45]
27

CHAPTER 2 LITERATURE REVIEW
2.2.2 Sorting methods based on machine learning
The fuzzy c-means (FCM) sorting method is a type of machine learning sorting
approach. It is a data clustering technique in which a dataset is grouped into n clusters
with every data point in the dataset belonging to every cluster to a certain degree [46].
This technique was originally introduced by Bezdek in 1973 as an improvement on
earlier clustering methods. It provides a method that shows how to group data points
that populate some multi-dimensional space into a specific number of different clusters.
Fuzzy C means uses the membership of each data point to determine which fuzzy group
it belongs to. It divides n vectors 𝑋𝑋𝑖𝑖(𝑖𝑖 = 1,2,3, … ,𝑛𝑛) into c fuzzy groups and its steps of
clustering are shown in Table 2-4.
TABLE 2-4 FUZZY C-MEAN ALGORITHM AND STEPS
Initialization :dividing n vectors ( )1,2,3, ,iX i n= … into c fuzzy groups
1
1, 1, , c
iji
u j n=
= ∀ = …∑
Then the value function of FCM will be
( ) 21 2
1 1
, ,c c n
n i i imj j
i i j
J U c c c J u d= =
… = =∑ ∑∑
Step 1:Use the random value between 0 and 1 to initialize the membership matrix U, and satisfy the constraint conditions of the following equations:
1 1 11 1
( , , , ) ( , , ) ( 1)n c
n n c j ijj i
J U c c J U c c uλ λ λ= =
⋅⋅⋅ ⋅ ⋅ ⋅ = ⋅⋅⋅ + −∑ ∑
Step 2:Use following equation to calculate the clustering centres ci, (i = 1, … , c):
1
1
nmij j
ji n
mij
j
u xc
u
=
=
=∑
∑
Step 3:If the value function calculated by the equation in step 2 or the value change
28

CHAPTER 2 LITERATURE REVIEW
compared with the last time value is less than a certain threshold, the algorithm will stop working.
Step 4:Use the equation below to calculate a new U matrix. Then return to step 2
2/( 1)
1( )
cij m
ijk kj
du
d− −
=
= ∑
The other type of machine learning sorting approach is based on neural networks and is
known as the Self-Organization Map (SOM) sorting method. SOM consists of a
competitive layer which can classify a dataset of vectors with any number of
dimensions into as many classes as the layer has neurons. The neurons are arranged in a
2-D topology, which allows the layer to form a representation of the distribution and a
two-dimensional approximation of the topology of the dataset. SOMs operate in two
modes: training and mapping. Figure 2-5 shows a SOM diagram in cell sorting. The
input vectors of the SOM can be the capacity, internal resistance, temperature and other
measureable parameters of the cells. The SOM Toolbox in MATLAB can then be used
to cluster the cells into groups with the same electrochemical characteristics.
Figure 2-5 SOM model for cell sorting
2.3. SOC Estimation
The SOC means the percentage of the remaining charge of the battery capacity when the
battery is fully charged under the specific standard conditions. The SOC uses the values
29

CHAPTER 2 LITERATURE REVIEW
between 100% and 0%, where 100% reflects a full battery and 0% reflects an empty
battery. The SOC is one of the important parameters to ensure safe operation of the
battery during charging and discharging. It can be defined as follows:
/t t NSoC C C= (2.1)
where tC represents the capacity of the battery, and NC represents the nominal capacity
of the battery. For a parallel connected battery pack, the SOC can be calculated in the
same way as for a single cell, while for cells connected in series, the battery pack SOC
has to be considered for the non-uniformity of the cells in the pack.
Accurate estimation of SOC can be used to prevent a battery from being damaged or
rapid ageing by avoiding overcharge and over-discharge. Precise estimation of the SOC
is particularly important for large lithium battery packs. Control of the SOC is a major
function of the BMS. Furthermore, for the EV industry, the large lithium battery packs
used in EVs need very precise control of the SOC in order to manage the energy flow
efficiently and safely [47].
There are many ways to estimate the SOC in an electric chemistry laboratory by
physical measurement. However, it is quite challenging to estimate the SOC of
commercial batteries without destroying the battery by disturbing the routine work of
the battery power supply, especially the online estimation in UMEVs. With the precise
estimation of the cell SOC in a sorted battery pack, the pack’s SOC can be calculated.
The literature documents a number of methods for SOC estimation summarized in
Table 2-5.
30

CHAPTER 2 LITERATURE REVIEW
TABLE 2-5. BASIC BATTERY SOC ESTIMATION METHODS OF LITHIUM-ION BATTERY
Approaches Advantages Disadvantages
Discharge test method
Accurate Very hard to implement in online estimation
Open circuit voltage method
No algorithm needed to implement
Battery needs to rest for long time
Coulomb counting method
Easy to operate Highly reliant on initial SOC value
Battery model-based method
Accurate Complex battery model, needs signal collection. Needs long computing time and large computer memory, with complicated algorithm
Machine learning method
Details of the battery are not needed
Needs large training data set and long computation time
Details of the battery estimation methods are explained in the following sections.
2.3.1 Discharge test method
One of the most reliable methods to determine the SOC is the discharge test method.
This method is to completely discharge a fully charged battery, record the discharge rate
and ambient temperature, and determine the remaining capacity which can be used to
calculate the precise SOC. However, it is time-consuming and can only be used in the
laboratory.
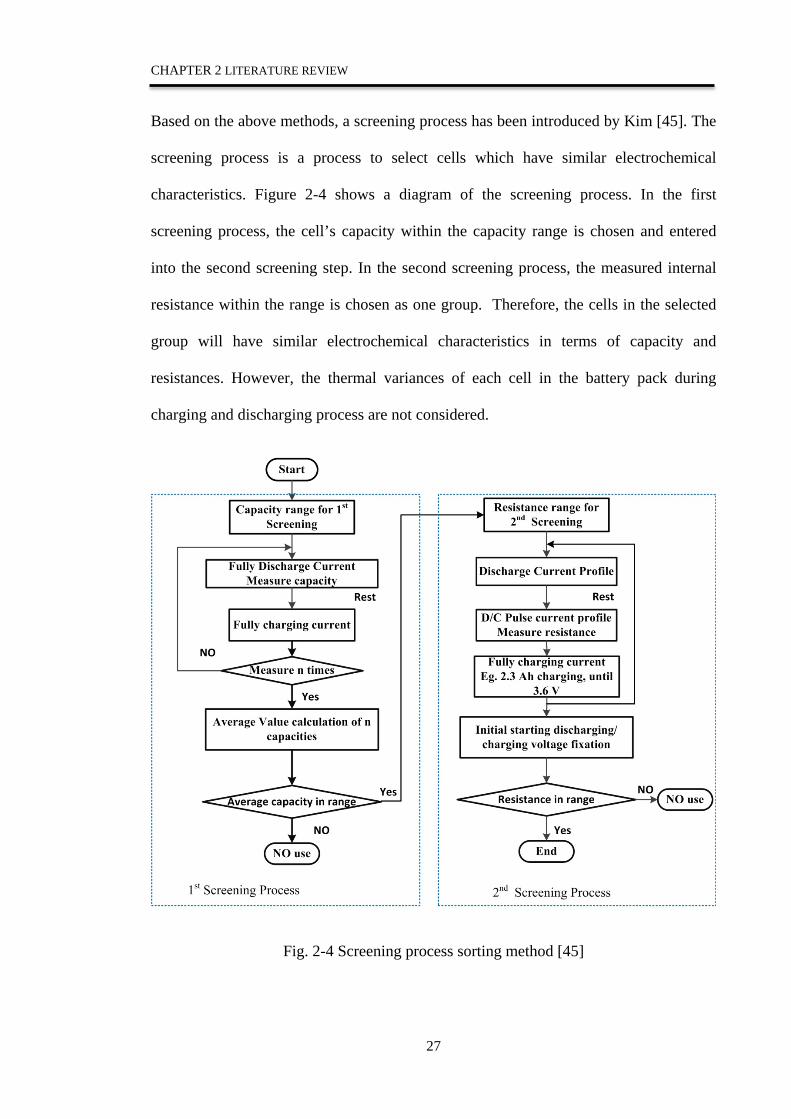
2.3.2 Open-circuit voltage
The open-circuit voltage (OCV) is the battery voltage under equilibrium conditions, i.e.
the voltage when no current is flowing in or out of the battery, and hence no reactions
occur inside the battery. For the lithium ion battery, the OCV usually has a nonlinear
relationship with the SOC [48]. The typical relationship of the OCV-SOC of lithium-ion
batteries is shown in Fig.2-6. The OCV can be used to estimate the SOC [49] based on
the relationship of the OCV-SOC curve. The greatest advantage of the OCV estimation 31
CHAPTER 2 LITERATURE REVIEW
method is that it has high precision. The disadvantage is that battery is required to rest
for a long time to achieve equilibrium. This method is not suitable for dynamic SOC
estimation. It can only be used when the UMEV is parked rather than being driven.
Fig.2-6 Relationship of OCV-SOC for the lithium-ion battery derived from
experimental data of this study
2.3.3 Coulomb counting method
The Coulomb counting method is a simple and fundamental method to acquire the
battery SOC, since it measures the discharge current directly and integrates the current
of the battery over time. The Coulomb counting method for SOC estimation can be
calculated using the following equation:
0
01 ( )
t
tt
s s I dQ
η t t= − ∫ (2.2)
where 0s represents the initial SOC, Q denotes the battery nominal capacity, η is the
Coulombic efficiency, and ( )I t is the instantaneous current.
32
CHAPTER 2 LITERATURE REVIEW
This method has quite satisfactory accuracy with the known capacity and the accurate
measurement of current. When the initial SOC is known, the SOC of a battery can be
calculated by integrating the charging and discharging currents over the operating
periods [50]. However, the precision of the battery’s initial SOC and the Coulombic
efficiency, which can be greatly influenced by the temperature and current, are difficult
to obtain, which accumulates errors in SOC estimation over time [50]. Therefore, the
Coulomb counting method used alone cannot meet the requirement of SOC accuracy.
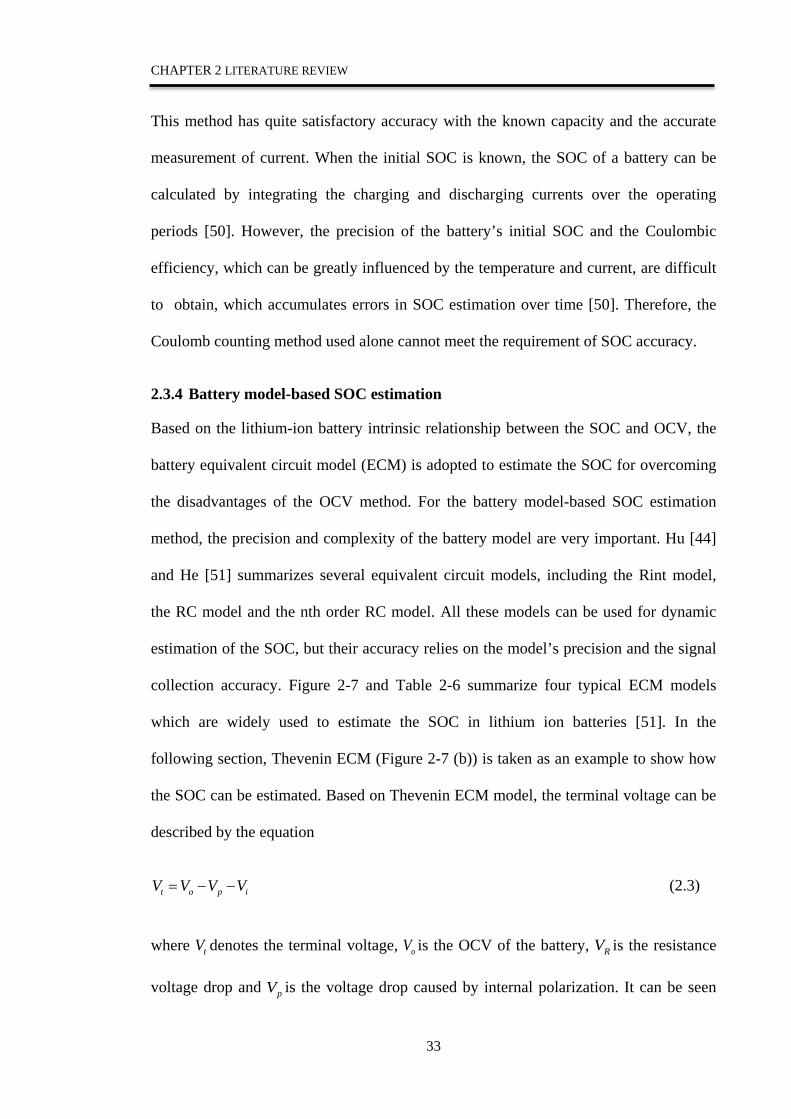
2.3.4 Battery model-based SOC estimation
Based on the lithium-ion battery intrinsic relationship between the SOC and OCV, the
battery equivalent circuit model (ECM) is adopted to estimate the SOC for overcoming
the disadvantages of the OCV method. For the battery model-based SOC estimation
method, the precision and complexity of the battery model are very important. Hu [44]
and He [51] summarizes several equivalent circuit models, including the Rint model,
the RC model and the nth order RC model. All these models can be used for dynamic
estimation of the SOC, but their accuracy relies on the model’s precision and the signal
collection accuracy. Figure 2-7 and Table 2-6 summarize four typical ECM models
which are widely used to estimate the SOC in lithium ion batteries [51]. In the
following section, Thevenin ECM (Figure 2-7 (b)) is taken as an example to show how
the SOC can be estimated. Based on Thevenin ECM model, the terminal voltage can be
described by the equation
t o p iV V V V= − − (2.3)
where tV denotes the terminal voltage, oV is the OCV of the battery, RV is the resistance
voltage drop and pV is the voltage drop caused by internal polarization. It can be seen
33

CHAPTER 2 LITERATURE REVIEW
from the equation that the battery OCV can be estimated using observer techniques
when the battery model parameters are known, and the battery parameters can be
identified by the experimental results. With the OCV, the battery SOC can be easily
obtained from the OCV-SOC look-up table.
Fig.2-7 ECMs (a) Rint model (b). Thevenin model (c) RC model (d) DP model
34
CHAPTER 2 LITERATURE REVIEW
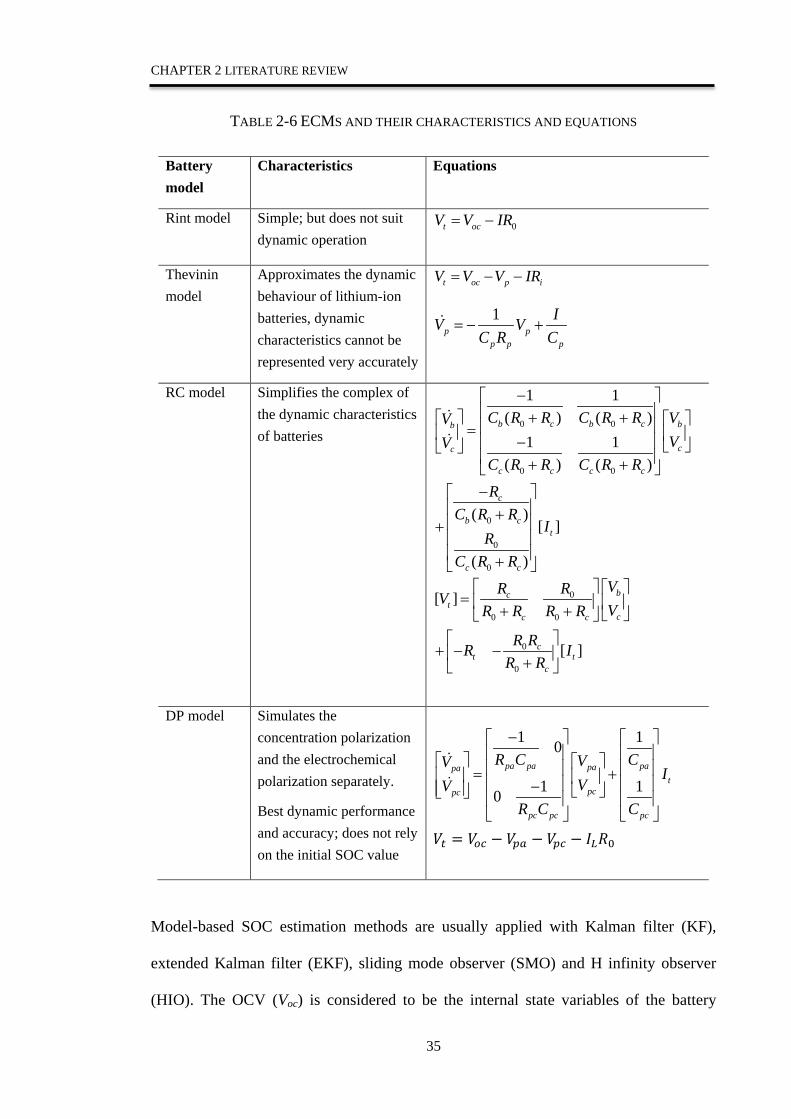
TABLE 2-6 ECMS AND THEIR CHARACTERISTICS AND EQUATIONS
Battery model
Characteristics Equations
Rint model Simple; but does not suit dynamic operation
0t ocV V IR= −
Thevinin model
Approximates the dynamic behaviour of lithium-ion batteries, dynamic characteristics cannot be represented very accurately
t oc p iV V V IR= − −
1p p
p p p
IV VC R C
= − +
RC model Simplifies the complex of the dynamic characteristics of batteries
0 0
0 0
0
0
0
1 1( ) ( )
1 1( ) ( )
( )[ ]
( )
b c b c bb
cc
c c c c
c
b ct
c c
C R R C R R VVVV
C R R C R R
RC R R
IR
C R R
− + + = − + + −
+ + +
0
0 0
0
0
[ ]
[ ]
bct
cc c
ct t
c
VR RVVR R R R
R RR IR R
= + +
+ − − +
DP model Simulates the concentration polarization and the electrochemical polarization separately.
Best dynamic performance and accuracy; does not rely on the initial SOC value
1 10
1 10
pa pa papapat
pcpc
pc pc pc
R C CVVI
VVR C C
− = + −
𝑉𝑉𝑡𝑡 = 𝑉𝑉𝑜𝑜𝑜𝑜 − 𝑉𝑉𝑝𝑝𝑝𝑝 − 𝑉𝑉𝑝𝑝𝑜𝑜 − 𝐼𝐼𝐿𝐿𝑅𝑅0
Model-based SOC estimation methods are usually applied with Kalman filter (KF),
extended Kalman filter (EKF), sliding mode observer (SMO) and H infinity observer
(HIO). The OCV (Voc) is considered to be the internal state variables of the battery
35
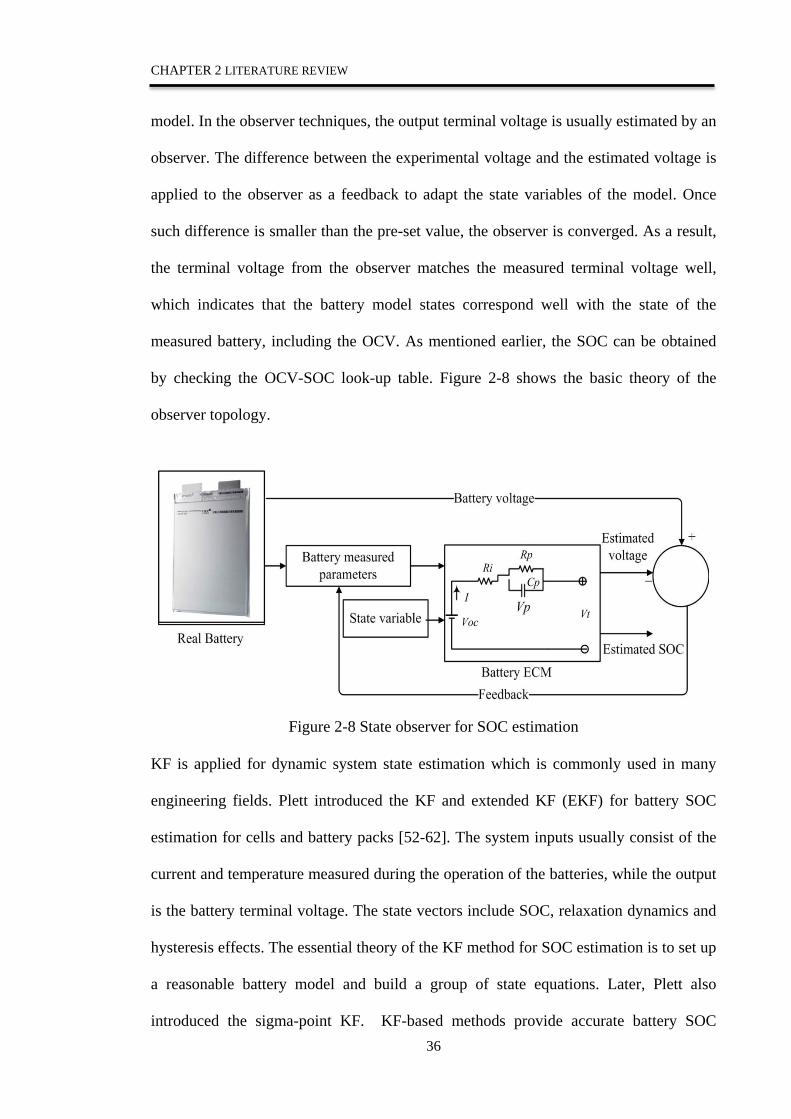
CHAPTER 2 LITERATURE REVIEW
model. In the observer techniques, the output terminal voltage is usually estimated by an
observer. The difference between the experimental voltage and the estimated voltage is
applied to the observer as a feedback to adapt the state variables of the model. Once
such difference is smaller than the pre-set value, the observer is converged. As a result,
the terminal voltage from the observer matches the measured terminal voltage well,
which indicates that the battery model states correspond well with the state of the
measured battery, including the OCV. As mentioned earlier, the SOC can be obtained
by checking the OCV-SOC look-up table. Figure 2-8 shows the basic theory of the
observer topology.
Figure 2-8 State observer for SOC estimation
KF is applied for dynamic system state estimation which is commonly used in many
engineering fields. Plett introduced the KF and extended KF (EKF) for battery SOC
estimation for cells and battery packs [52-62]. The system inputs usually consist of the
current and temperature measured during the operation of the batteries, while the output
is the battery terminal voltage. The state vectors include SOC, relaxation dynamics and
hysteresis effects. The essential theory of the KF method for SOC estimation is to set up
a reasonable battery model and build a group of state equations. Later, Plett also
introduced the sigma-point KF. KF-based methods provide accurate battery SOC 36
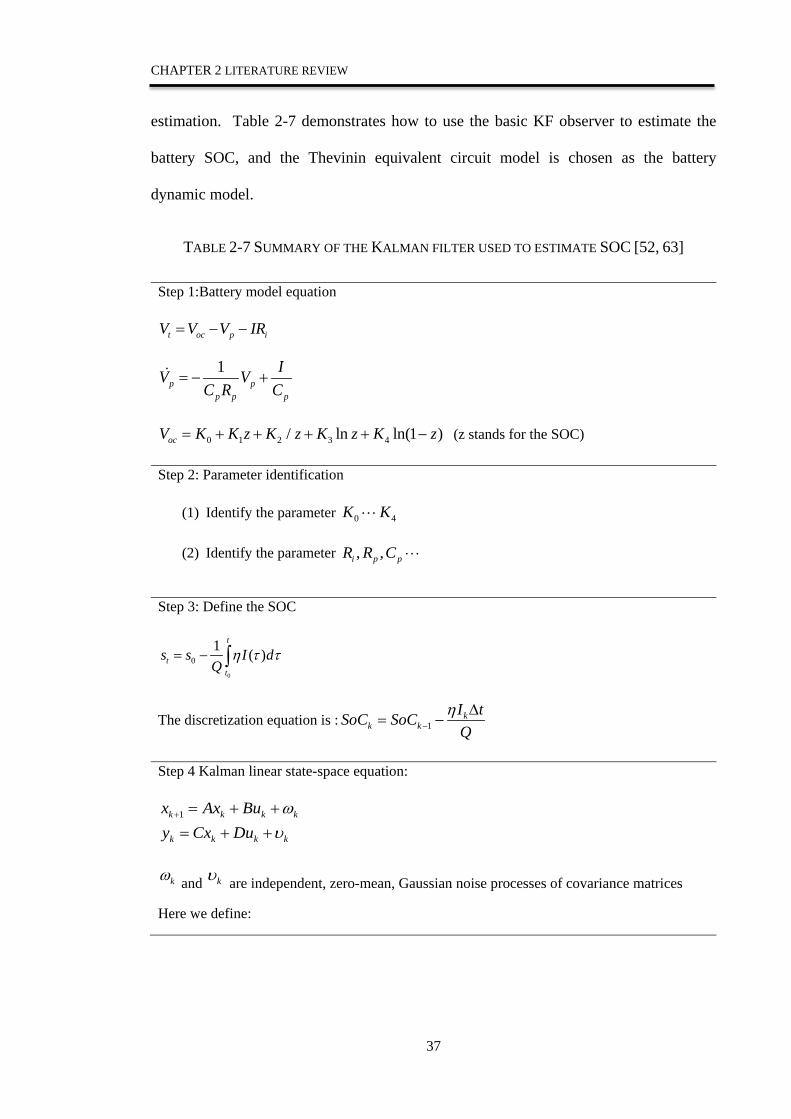
CHAPTER 2 LITERATURE REVIEW
estimation. Table 2-7 demonstrates how to use the basic KF observer to estimate the
battery SOC, and the Thevinin equivalent circuit model is chosen as the battery
dynamic model.
TABLE 2-7 SUMMARY OF THE KALMAN FILTER USED TO ESTIMATE SOC [52, 63]
Step 1:Battery model equation
t oc p iV V V IR= − −
1p p
p p p
IV VC R C
= − +
0 1 2 3 4/ ln ln(1 )ocV K K z K z K z K z= + + + + − (z stands for the SOC)
Step 2: Parameter identification
(1) Identify the parameter 0 4K K⋅ ⋅ ⋅
(2) Identify the parameter , ,i p pR R C ⋅ ⋅ ⋅
Step 3: Define the SOC
0
01 ( )
t
tt
s s I dQ
η t t= − ∫
The discretization equation is : 1k
k kI tSoC SoCQ
η−
∆= −
Step 4 Kalman linear state-space equation:
1k k k k
k k k k
x Ax Buy Cx Du
ωu
+ = + +
= + +
kω and ku are independent, zero-mean, Gaussian noise processes of covariance matrices
Here we define:
37

CHAPTER 2 LITERATURE REVIEW
11
ˆ
(1 exp( )exp( ) ( ) ˆ, , [ 1 ],
0 1k
pp p t o
p p k kx X
tRt o R C V dV zR CA B C zx dzt
Qη
−−
=
−∆ −−∆ ∂ = = = = − ∂∆
[ ]iD R= −
Step 5: Transform the ECM equation to a discrete system
, ,
, , 1 1exp( ) (1 exp( ))
t k oc k i p k
p k p k k pp p p p
V V I R Vt tV V I RR C R C− −
= − −
−∆ −∆= + −
The state variable can be defined as
,
,
[ , )k p k k
k t k
k k
x V zy Vu I
=
=
=
Step 6: Initialization
For 0,k = set
0 0
0 0 0 0
[ ]
[( )( ) ]Tx
x E xE x x x x
+
+ ++
=
= − −∑
Step7: Computation
For 1, 2,k = ⋅⋅⋅
State estimate time update: 1 1 1 1k k k k kx A x B u− +− − − −= +
Error covariance time update: , , 11 1T
x k x kk kA A ω− +
−− −= +∑ ∑ ∑
Kalman gain matrix: 1
, ,[ ]T Tx k x kk k k kG C C C ω
−− −= +∑ ∑ ∑
State estimate measurement update: [ ]k k k k k k k kx x G y C x D u+ − −= + − −
Error covariance measurement update: , ,( )x k x kk kI G C+ −= −∑ ∑
38
CHAPTER 2 LITERATURE REVIEW
SMO has been integrated in model-based SOC estimation in recent years [64-67]. The
SMO technique is based on sliding mode control and can compensate for inaccuracies
in battery models and variations noises to estimate the SOC. The state space model
matrix of the system is always fully ranked, which means that all the state variables can
be determined by observation of the battery terminal voltage. Therefore, the SMO aims
to minimize the error between the battery model terminal voltage and the measured
terminal voltage. Once the error has been converged to the pre-set value, the estimated
OCV will be compared with the experimentally determined OCV-SOC look-up table to
find the SOC of the battery.
The HIO is derived from the Kalman filter estimation method. In contrast with the
Kalman filter-based estimation method, the HIO method does not need to know the
exact system and measurement errors. The H infinity observer aims to design an
observer to minimize the error between the output of the battery and its model so that
the SOC estimation error is less than a given attenuation level. The attenuation level can
be minimized by the optimization method LMI in the MATLAB Toolbox, which can
also solve the feedback gain of the H infinity observer.
2.3.5 Machine learning method
Other algorithms such as fuzzy logic, neural network models, and the support vector
machine method [64, 68-74] are also used to estimate the SOC by using large battery
data sets to train the network model for SOC estimation. The machine learning method
does not need to consider the details of the batteries. It is suitable for the SOC
estimation of all kinds of batteries. However, a large training data set is needed to train
the network model, and the accuracy of the model can be greatly influenced by the
39
CHAPTER 2 LITERATURE REVIEW
training data and methods. The drawback is that the training process in the machine
learning method is very time-consuming.
The application of neural networks and fuzzy logic to SOC estimation for EV batteries
provides a useful tool to solve the problems that exist in conventional methods. The key
feature of a neural network is its learning capability. When the neural network is used
for battery SOC estimation, the only problem is to select the parameters as inputs of the
neural network. The relationship between the SOC and the related parameters can be
modelled by the training data. Therefore, the neural network estimation method can
ignore complicated battery models.
Figure 2-9 shows an example of a neural network SOC estimation diagram. The core of
the neural network for SOC estimation is the relationship between the SOC and the
input variables. The input variables, such as terminal voltage, discharge current,
discharged capacity and temperature should be easy to measure. The neural network has
three layers, namely the input layer, hidden layer and output layer. In Fig.2.9, the input
neurons ( )iX t from 1( )X t to 6 ( )X t are the discharged capacity, and 7 ( )X t is the
temperature. The input candidates are examined within the hidden layers with n neurons
to perform the training and study. The output ( )p t represents the SOC at time t. The
value of the SOC estimation can be expressed by ( )p t .
01( ) ( )
n
i ii
p t W F y b= +∑ (2.4)
1 exp( 2 )( )1 exp( 2 )
ii
i
yF yy
− −=
+ − (2.5)
where n is the number of neurons at the hidden layer, iW are the weights between the
hidden layer and the output layer. 01b is the bias at the output layer, and
40

CHAPTER 2 LITERATURE REVIEW
6
1( ) h
i ij j ij
y W X t b=
= +∑ is the input to the thi neurons at the hidden layer, ijW are the
weights between input layer and the hidden layer and hib is the bias at the hidden layer.
The training algorithm of the neural network is a numerical process which determines
the weights between layers and the bias in neurons. The learning process is ended when
the error function trend begins to change.
Fig. 2-9 Neural network for battery SOC estimation [75]
The support vector machine (SVM) learning approach has been adopted in various
fields of pattern recognition. When applied to battery SOC estimation, SVM can be
designed to integrate thousands of training data points and reduce all these data to one
set of support vectors. The SOC estimation steps using the SVM training include:
choose the training data, find the optimal SVM parameters, and choose and process the
41

CHAPTER 2 LITERATURE REVIEW
testing data. It is used as a nonlinear robust estimator because it is insensitive to small
changes.
Battery pack and in-pack cell SOC estimation are discussed in detail in Chapter 5.
2.4. Summary
A review of underground mine electric vehicles (UMEVs), batteries and battery
management systems has been presented in this chapter. First, the conventional UMEVs
and the batteries used in UMEVs have been briefly reviewed. Then, the currently used
UMEVs have been summarized and reviewed. Finally, three topics of the battery
management system, including the selection of battery systems for UMEVs, cell
clustering methods to alleviate the inconsistency of the cells in battery packs and battery
SOC estimation methods, have been surveyed. These three topics are thoroughly
discussed in the following chapters.
42

CHAPTER 3 COMPARISON STUDY OF DIFFERENT LITHIUM IRON PHOSPHATE BATTERY PACKS
CHAPTER 3 COMPARISON OF DIFFERENT LITHIUM
IRON PHOSPHATE BATTERY PACKS
In this chapter, the optimization of battery systems for EVs and the EV simulation
approach are further reviewed. A four-wheel-drive (4WD) UMEV model is modified,
based on the existing EV model in the ADVISOR. The experimental results on the
charge and discharge characteristics of these batteries and battery packs at different
ambient temperatures are reported. The extracted parameters of the experimental results
for four batteries are integrated into the battery model in the ADVISOR. The UMEV
model based on ADVISOR is then simulated to evaluate the performance of the UMEV
for the selection of the most suitable battery system.
3.1 Introduction
In most current underground mining operations, personnel carrier vehicles are driven by
diesel engines [10]. Exhaust from the diesel engines spreads into the mine air with
waste heat and noxious substances. Ventilation and filters are required to comply with
the occupational health and safety regulations on working conditions in underground
mine. Regular replacement of exhaust filters increases operating costs. Electric vehicles
(EVs) provide significant advantages of low noise and zero emissions over diesel
engine vehicles and hence potentially reduce operating costs when EVs are adopted in
underground mines [33]. Batteries are the main power sources for EVs. Of the existing
commercial batteries, lithium ion batteries are the most acceptable batteries in EVs due
to their high energy and power density, long cycle life, low self-discharge rate and wide
operating temperature range [5] .
43
CHAPTER 3 COMPARISON STUDY OF DIFFERENT LITHIUM IRON PHOSPHATE BATTERY PACKS
Since there is limited capacity for energy storage on board EVs, it is very important to
optimize the size and weight of battery packs in terms of the required performance,
driving distances and costs. Simulation approaches are generally used to optimize the
size of battery systems in hybrid electric vehicles (HEVs) and plug-in hybrid electric
vehicles (PHEVs) to reduce fuel consumption, costs and green-house gas emissions [34-
36], and to compare different battery systems made from nickel-metal hydrate (NiMH)
and lithium ion batteries in PHEVs for their suitability in terms of specific energy and
power density, cycle life, operational temperature and cost [76]. Simulation approaches
have also been used to evaluate hybrid energy storage systems of Li-ion batteries and
ultra-capacitors for underground mine electric vehicles (UMEVs) [33, 77], and the
simulation results show that such hybrid energy systems are suitable for the complex
and poor road conditions in underground mines. For all the above simulations, specific
software has been developed to include the models of each component of HEVs,
PHEVs and UMEVs. There is a generic software package, Advanced Vehicle Simulator
(ADVISOR), which can be used to analyses and simulate both conventional vehicles
and EVs [78]. The modified ADVISOR can compare and simulate the hybrid energy
source of the batteries and ultra-capacitors in HEVs [79, 80].
This chapter proposes a hybrid simulation approach to compare the four battery systems
by integrating the experimental results into the battery models for a four-wheel-drive
(4WD) UMEV. Since safety and reliability are particularly crucial for UMEVs, two
lithium iron phosphate (LiFePO4) batteries and their corresponding packs were chosen.
The charge and discharge characteristics of these batteries and battery packs were
experimentally studied at different ambient temperatures. The experimental data were
obtained to identify the model parameters for the batteries and battery packs. These
44
CHAPTER 3 COMPARISON STUDY OF DIFFERENT LITHIUM IRON PHOSPHATE BATTERY PACKS
models with the identified parameters were then used to evaluate the performance of the
UMEV for the selection of the most suitable battery system.
The rest of the chapter is organized as follows. The model of the UMEV and the
underground mine driving cycle (UMDC) are presented in Section 3.2, followed by an
explanation of the experimental set-up, the test results and the identified model
parameters for the batteries and battery packs. In Section 3.4, the simulation and
validation results and discussion are demonstrated. Conclusions are given in Section3.5.
3.2 Model of UMEV
The ADVISOR is a comprehensive and generic software package. It includes the
models of each component in conventional vehicles and EVs. The following section
shows only the models particularly modified for the UMEV, and accordingly the blocks
in the ADVISOR corresponding to the modified models were changed to facilitate the
simulation of the UMEV.
3.2.1 UMEV vehicle dynamic model
UMEVs experience harsh and steep road conditions compared with conventional EVs
driven on concrete pavement. To increase vehicle-road adhesion and improve
performance and stability, a 4WD vehicle has been proposed for the UMEV and the
4WD vehicle model is used to describe the UMEV. Figure 3-1 shows all the forces
acting on the 4WD UMEV in motion along a slope.
The total traction force F in the contact area between the tyres of the front and rear
wheels and the road surface propels the vehicle forward. It is produced by the
45

CHAPTER 3 COMPARISON STUDY OF DIFFERENT LITHIUM IRON PHOSPHATE BATTERY PACKS
powertrain which is then transferred through the vehicle transmission system to the
front and rear drive wheels. It can be calculated by [81-84]:
( )2 1 21 rrW uF F F W= + ×= + (3.1)
Fig. 3-1 Forces in action on UMEV
where rru is the adhesion coefficient, 1W and 2W represent the adhesion forces of the
rear and front wheels, respectively. They are expressed as
1 cos ( sin )ghb dvW mg mg mL L dt
α α= + + (3.2)
2 cos ( sin )ghd dvW mg mg mL L dt
α α= − + (3.3)
where v is vehicle moving speed, m is vehicle mass, g is acceleration of gravity, α is the
gradient of slope which varies along the road in underground mines. Along the slope, b
is the distance between the front wheel axle and the vehicle’s centre of gravity, d is the
distance between the rear wheel axle and the vehicle’s centre of gravity, L is the length
of the wheelbase, and gh is the height of the vehicle’s centre of gravity. While the
46
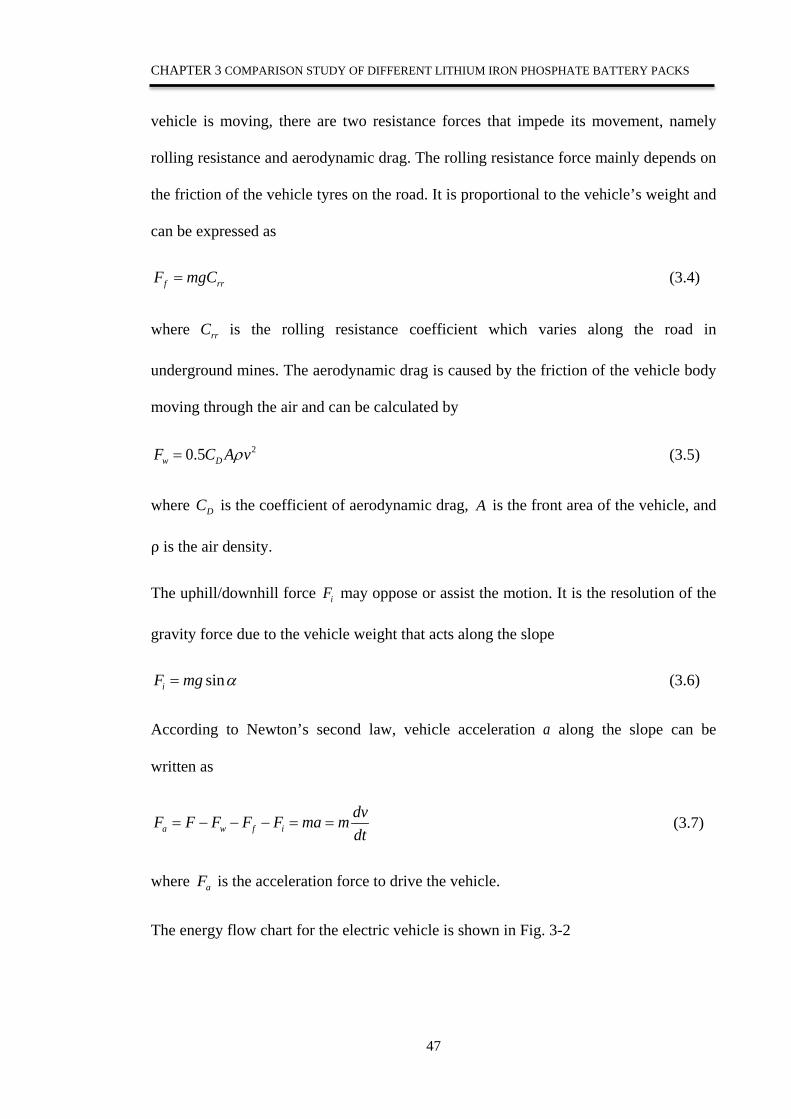
CHAPTER 3 COMPARISON STUDY OF DIFFERENT LITHIUM IRON PHOSPHATE BATTERY PACKS
vehicle is moving, there are two resistance forces that impede its movement, namely
rolling resistance and aerodynamic drag. The rolling resistance force mainly depends on
the friction of the vehicle tyres on the road. It is proportional to the vehicle’s weight and
can be expressed as
rf rF mgC= (3.4)
where rrC is the rolling resistance coefficient which varies along the road in
underground mines. The aerodynamic drag is caused by the friction of the vehicle body
moving through the air and can be calculated by
20.5w DF C A vρ= (3.5)
where DC is the coefficient of aerodynamic drag, A is the front area of the vehicle, and
ρ is the air density.
The uphill/downhill force iF may oppose or assist the motion. It is the resolution of the
gravity force due to the vehicle weight that acts along the slope
siniF mg α= (3.6)
According to Newton’s second law, vehicle acceleration a along the slope can be
written as
a w f idvF F F F F ma mdt
= − − − = = (3.7)
where aF is the acceleration force to drive the vehicle.
The energy flow chart for the electric vehicle is shown in Fig. 3-2
47

CHAPTER 3 COMPARISON STUDY OF DIFFERENT LITHIUM IRON PHOSPHATE BATTERY PACKS
Fig. 3-2 Power flow chart for UMEVs
3.2.2 Motor model
A look-up table in two dimensions is used to model the motor in the UMEV. This look-
up table includes the motor efficiencies indexed by the rotor speed and output torque,
and the motor’s maximum torques indexed by the rotor speed. The force required to
turn the motor for angular acceleration aω is
2
2
GF I arω ω= (3.8)
where I is the moment of inertia of the motor rotor, G is the gear ratio of the vehicle
system, and r is the radius of the tyre.
The output power of the motor to drive the UMEV through the wheels can be calculated
as
21 ( sin cos 0.5 )3600m m m m rr DP mg mg C C A v vt ω η α α ρ= × × = + ⋅ + ⋅ (3.9)
where /m F r Gωt = ⋅ and /m v G rω = ⋅ , mη is the motor efficiency. To achieve high
efficiency, the motor operates at high speed, and a transmission system with a gear ratio
G (<1) is required to reduce the speed as UMEVs are driven at low speeds in
underground mines.
48
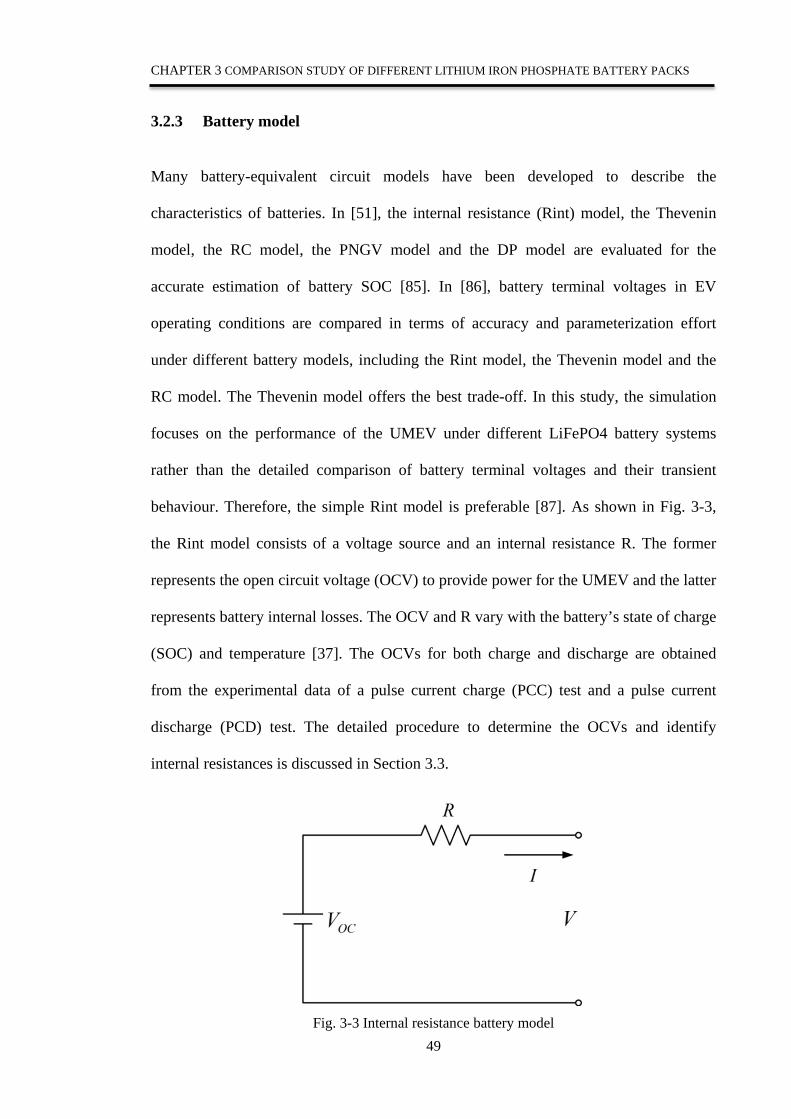
CHAPTER 3 COMPARISON STUDY OF DIFFERENT LITHIUM IRON PHOSPHATE BATTERY PACKS
3.2.3 Battery model
Many battery-equivalent circuit models have been developed to describe the
characteristics of batteries. In [51], the internal resistance (Rint) model, the Thevenin
model, the RC model, the PNGV model and the DP model are evaluated for the
accurate estimation of battery SOC [85]. In [86], battery terminal voltages in EV
operating conditions are compared in terms of accuracy and parameterization effort
under different battery models, including the Rint model, the Thevenin model and the
RC model. The Thevenin model offers the best trade-off. In this study, the simulation
focuses on the performance of the UMEV under different LiFePO4 battery systems
rather than the detailed comparison of battery terminal voltages and their transient
behaviour. Therefore, the simple Rint model is preferable [87]. As shown in Fig. 3-3,
the Rint model consists of a voltage source and an internal resistance R. The former
represents the open circuit voltage (OCV) to provide power for the UMEV and the latter
represents battery internal losses. The OCV and R vary with the battery’s state of charge
(SOC) and temperature [37]. The OCVs for both charge and discharge are obtained
from the experimental data of a pulse current charge (PCC) test and a pulse current
discharge (PCD) test. The detailed procedure to determine the OCVs and identify
internal resistances is discussed in Section 3.3.
Fig. 3-3 Internal resistance battery model
49

CHAPTER 3 COMPARISON STUDY OF DIFFERENT LITHIUM IRON PHOSPHATE BATTERY PACKS
The power provided by the battery system to drive the motor is
b bP V I η= × × (3.10)
where V is battery terminal voltage, I is battery discharge current (positive) or
regenerative current (negative), bη is battery discharge efficiency.
3.2.4 Underground mine driving cycle
An underground mine road is much more complex than the normal pavement road, and
has variable rolling resistance coefficients and variable uphill/downhill gradients. As a
result, the driving cycle in underground mines is different from standard driving cycles.
Based on data collected from Australian mines, a single trip of the UMEV to the mine
workface is proposed, taking into account the most severe conditions of the pit and drift
in Australian mines. This single trip is shown in Fig. 3-4, where there is a flat road and a
slope with the constant rolling resistance coefficients, and a flat road at the bottom with
variable rolling resistance coefficients due to the muddy surface. The underground mine
driving cycle (UMDC) is constructed as a single return trip from the workshop to the
workface and then return to the workshop. The speed of the UMEV, the road gradients
and the rolling resistance coefficients for one UMDC are shown in Fig.3-5.
Fig. 3-4 Single trip to workface in underground mine
50
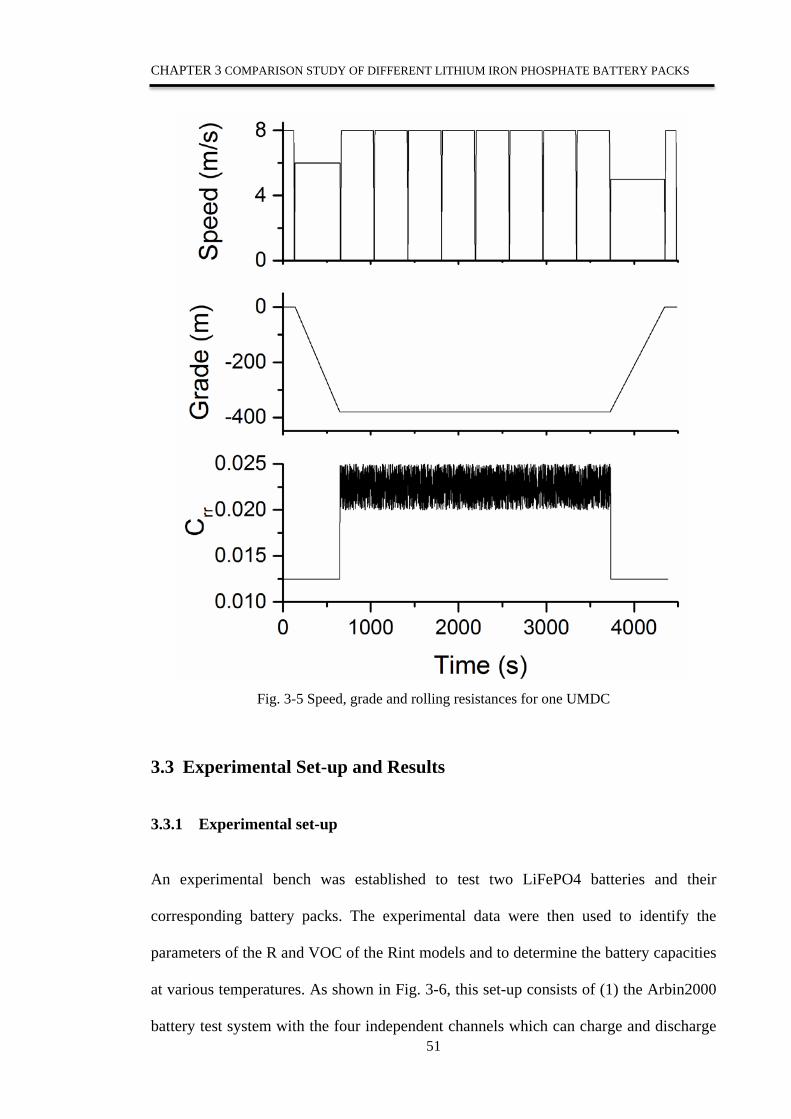
CHAPTER 3 COMPARISON STUDY OF DIFFERENT LITHIUM IRON PHOSPHATE BATTERY PACKS
Fig. 3-5 Speed, grade and rolling resistances for one UMDC
3.3 Experimental Set-up and Results
3.3.1 Experimental set-up
An experimental bench was established to test two LiFePO4 batteries and their
corresponding battery packs. The experimental data were then used to identify the
parameters of the R and VOC of the Rint models and to determine the battery capacities
at various temperatures. As shown in Fig. 3-6, this set-up consists of (1) the Arbin2000
battery test system with the four independent channels which can charge and discharge 51

CHAPTER 3 COMPARISON STUDY OF DIFFERENT LITHIUM IRON PHOSPHATE BATTERY PACKS
four batteries simultaneously using programmable currents (2) an ESPEC temperature
chamber to create different ambient temperatures in which the batteries and battery
packs can be placed (3) a PC with Arbin Mits Pro software installed to control and
monitor battery charging and discharging.
Fig. 3-6 Battery experiment set-up
In this study, there are batteries and battery packs. The following conventions are used
to name the batteries and battery packs to avoid confusion. A single battery is the
smallest unit. A number of batteries are paralleled to form a module. A number of
modules are connected in series to form a battery pack. A battery system in the UMEV
is defined as an assembly of battery packs either in series or parallel or their
combination. Two LiFePO4 batteries and their corresponding packs were chosen:
cylinder and prismatic batteries and battery packs, respectively. They include: a) a
single 20Ah LiFePO4 prismatic battery, b) 40 Ah 4S2P battery pack consisting of eight
20Ah prismatic batteries with two in parallel as a module and four of these modules in
series, where P represents the number of batteries or battery packs in parallel and S
represents the number of batteries and battery packs in series in 4S2P. c) a single 2.3Ah
cylinder battery, d) an 2.3Ah 4S1P battery pack consisting of four 2.3 Ah cylinder
batteries in series. Table 3-1 shows the parameters of the selected batteries and battery
packs.
52

CHAPTER 3 COMPARISON STUDY OF DIFFERENT LITHIUM IRON PHOSPHATE BATTERY PACKS
TABLE 3-1 PARAMETERS OF SELECTED BATTERIES AND BATTERY PACKS
a. A single 20Ah prismatic battery
b. 40Ah 4S2P battery pack
c. A single 2.3Ah cylinder battery
d. 2.3Ah 4S1P battery pack
Nominal Voltage 3.3V 13.2V 3.3V 13.2V
Capacity (Ah) 20 40 2.3 2.3
Cycle life (cycle) 2000-3000 2000 2000-3000 2000-2500
Operating
temperature
-30~55 -20~50 -30~55 -30~50
Mass (g) 496 5420 76 350
Dimensions (mm) 7.25×160×227 165×135×250 Φ26×65 28×106×68
Price (AU $) $22 $ 300 $8 $45
Picture
Three types of tests were conducted on these batteries and battery packs at the ambient
temperatures of 15, 25 and 40, which cover the temperatures in the real working
environment in Australian underground mines which are around 17~25. The tests
were a capacity test, a PCC test and a PCD test. During these tests, the current, voltage
and temperature of the batteries and battery packs were sampled at a sampling rate of 1
per second.
3.3.2 Capacity test
The capacity test is used to determine the battery capacities at various temperatures. To
conduct this test, the batteries and battery packs are put into a temperature chamber and
connected by a cable to the Arbin 2000. The constant current/constant voltage (CCCV)
charging method was adopted to charge the batteries and battery packs with different 53

CHAPTER 3 COMPARISON STUDY OF DIFFERENT LITHIUM IRON PHOSPHATE BATTERY PACKS
constant current rate. According to driving distances and speeds of current EVs in the
markets, the average driving time is 3 hours, for example, BYD Qin EV300 can drive
300 km with the speed of 100km/h. the average discharge current with respect to their
battery packs is equivalent to about 0.3C [58, 88, 89]. Also, the underground mine EV
driving cycle has an average discharge current of 0.3C. As a result, 0.3C is adopted to
discharge the batteries in EVs, where 1C refers to the charging current in terms of the
nominal capacity, namely the ratio of the nominal capacity to 1 hour [75]. The charging
voltage was maintained at 3.6V per battery and the charging current was reduced
exponentially. When the current reached a pre-set current (e.g. 0.01C), the charging
process was terminated [90]. Since one hour rest time is sufficient for the terminal
voltage of lithium ion batteries to reach the equilibrium state [65,91]. After one hour,
the batteries and battery packs at the temperatures of 15 , 25 and 40 were
discharged at the constant current of 0.3C until the cut-off voltage of 2.0V per battery
was reached, which was defined as the fully discharged state. Table 3-2 shows the
available capacities for these batteries and battery packs at different temperatures.
TABLE 3-2 BATTERY CAPACITIES AT TEMPERATURES OF 15, 25 AND 40
a. 20Ah prismatic battery
b. 40Ah 4S2P battery pack
c. 2.3Ah cylinder battery
d. 2.3Ah 4S1P battery pack
15 (Ah) 19.2 37.81 2.2 2.05
25 (Ah) 19.6 38.25 2.3 2.14
40 (Ah) 19.8 38.75 2.45 2.2
3.3.3 Pulse current discharge test
A pulse current discharge (PCD) test is used to obtain the OCV versus SOC at different
temperatures during battery discharging [91]. In the PCD test, the fully charged
54

CHAPTER 3 COMPARISON STUDY OF DIFFERENT LITHIUM IRON PHOSPHATE BATTERY PACKS
batteries and battery packs were discharged at 1C for 6 minutes and rested for 1 hour to
allow the terminal voltage to reach its equilibrium state, namely the OCV. This pulse
current discharge equals approximately 10% of the nominal capacity, which is
equivalent to a reduction in the SOC by 10%. This process was repeated until the
terminal voltage reached the cut-off voltage. The PCD test was conducted on the two
batteries and two battery packs at the temperatures of 15, 25 and 40. As an
example, Fig. 3-7 shows the current profile of the PCD and the corresponding responses
of the terminal voltage for the A123 20Ah prismatic battery at 15. The circled section
is magnified in Figure 3-8 to demonstrate the details of the transient terminal voltage at
the 4th pulse current discharge. It can be seen that when the battery begins to discharge
the terminal voltage has a steep voltage drop across the internal resistance R. Therefore,
the internal resistance can be calculated by
/tR V I= ∆ (3.11)
namely 0 1( ) / /t t tR V V I V I= − = ∆ =0.0197Ω.
Using the same equation (3.11), the discharge resistances of the two batteries and two
battery packs versus the SOCs at the temperatures of 15 , 25 and 40 were
calculated. The OCVs versus the SOCs at the temperatures of 15, 25 and 40 were
also determined using this PCD test. The results are shown in Figs. 3-9 and 3-10,
respectively. The SOCs in both cases were calculated by the ampere hour counting
method:
max max( ) /disSOC C C C= − (3.12)
where maxC is the maximum capacity of the battery, and disC is the discharged capacity.
55

CHAPTER 3 COMPARISON STUDY OF DIFFERENT LITHIUM IRON PHOSPHATE BATTERY PACKS
Fig. 3-7 Voltage responses of PCD test for a single 20Ah prismatic battery at 15
Fig. 3-8 Magnified transient response of voltage at the 4th pulse current discharge
56
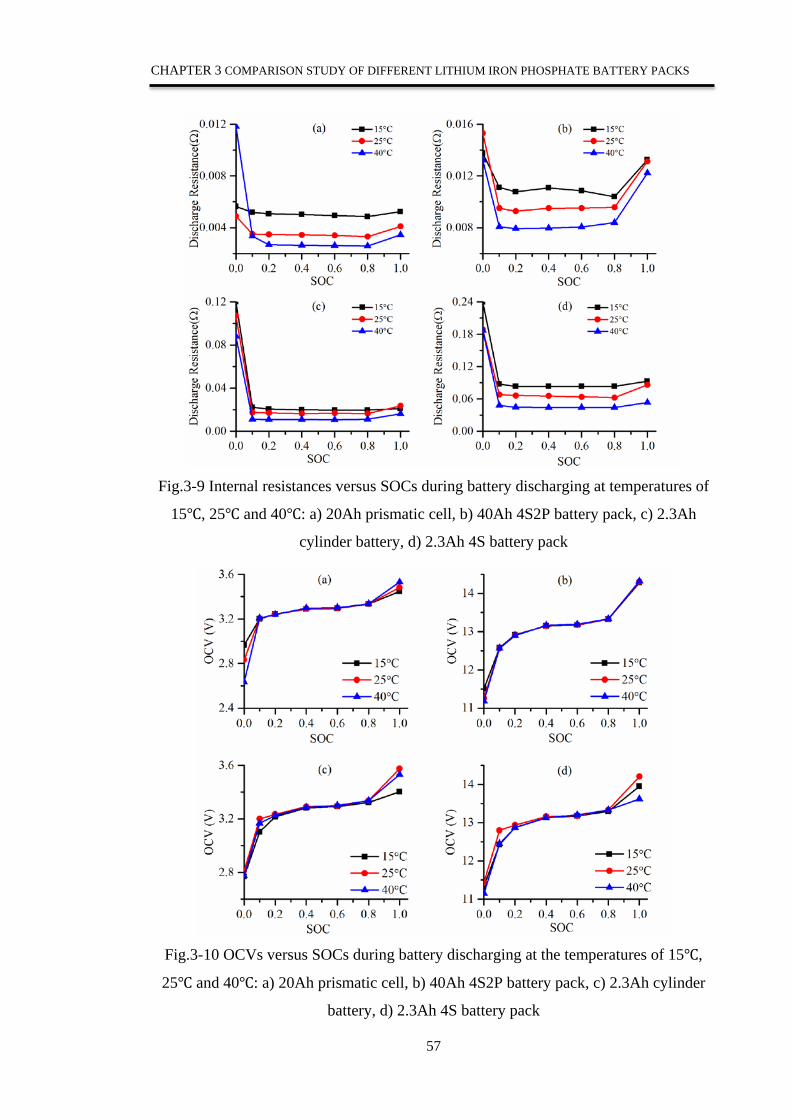
CHAPTER 3 COMPARISON STUDY OF DIFFERENT LITHIUM IRON PHOSPHATE BATTERY PACKS
Fig.3-9 Internal resistances versus SOCs during battery discharging at temperatures of
15, 25 and 40: a) 20Ah prismatic cell, b) 40Ah 4S2P battery pack, c) 2.3Ah
cylinder battery, d) 2.3Ah 4S battery pack
Fig.3-10 OCVs versus SOCs during battery discharging at the temperatures of 15,
25 and 40: a) 20Ah prismatic cell, b) 40Ah 4S2P battery pack, c) 2.3Ah cylinder
battery, d) 2.3Ah 4S battery pack
57
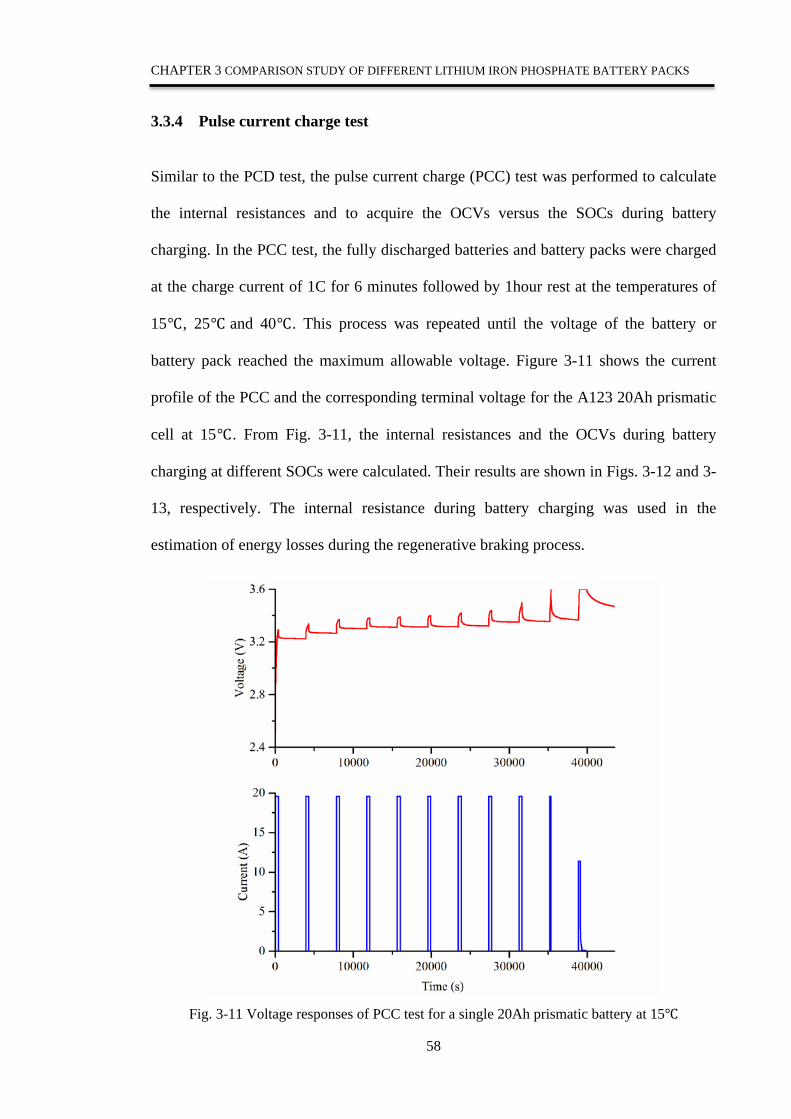
CHAPTER 3 COMPARISON STUDY OF DIFFERENT LITHIUM IRON PHOSPHATE BATTERY PACKS
3.3.4 Pulse current charge test
Similar to the PCD test, the pulse current charge (PCC) test was performed to calculate
the internal resistances and to acquire the OCVs versus the SOCs during battery
charging. In the PCC test, the fully discharged batteries and battery packs were charged
at the charge current of 1C for 6 minutes followed by 1hour rest at the temperatures of
15, 25 and 40. This process was repeated until the voltage of the battery or
battery pack reached the maximum allowable voltage. Figure 3-11 shows the current
profile of the PCC and the corresponding terminal voltage for the A123 20Ah prismatic
cell at 15. From Fig. 3-11, the internal resistances and the OCVs during battery
charging at different SOCs were calculated. Their results are shown in Figs. 3-12 and 3-
13, respectively. The internal resistance during battery charging was used in the
estimation of energy losses during the regenerative braking process.
Fig. 3-11 Voltage responses of PCC test for a single 20Ah prismatic battery at 15
58
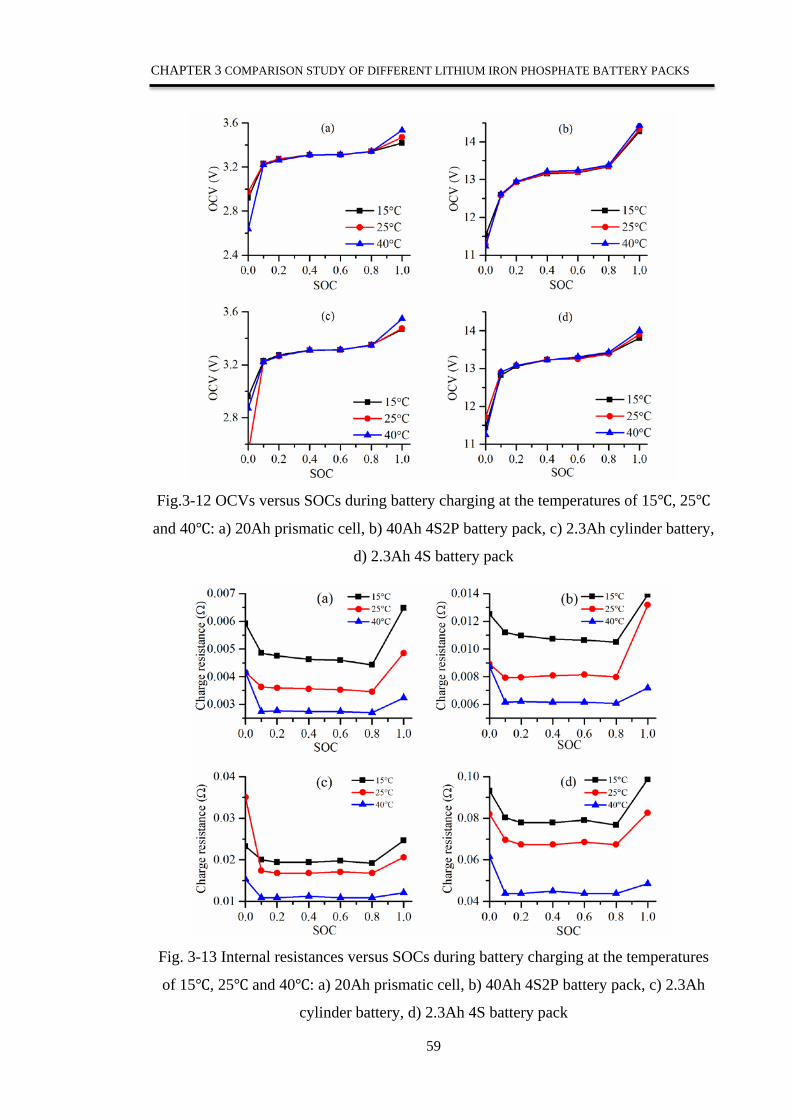
CHAPTER 3 COMPARISON STUDY OF DIFFERENT LITHIUM IRON PHOSPHATE BATTERY PACKS
Fig.3-12 OCVs versus SOCs during battery charging at the temperatures of 15, 25
and 40: a) 20Ah prismatic cell, b) 40Ah 4S2P battery pack, c) 2.3Ah cylinder battery,
d) 2.3Ah 4S battery pack
Fig. 3-13 Internal resistances versus SOCs during battery charging at the temperatures
of 15, 25 and 40: a) 20Ah prismatic cell, b) 40Ah 4S2P battery pack, c) 2.3Ah
cylinder battery, d) 2.3Ah 4S battery pack
59

CHAPTER 3 COMPARISON STUDY OF DIFFERENT LITHIUM IRON PHOSPHATE BATTERY PACKS
3.4 Simulation Results
In addition to the parameters for the battery models which were determined in the
previous section, the parameters of the model for the designed UMEV are shown in
Table 3-3. These parameters were used in the UMEV simulation.
TABLE 3-3 UMEV VEHICLE PARAMETERS
Parameters Values
Vehicle Vehicle mass and cargo mass (m) 3000kg
Coefficient of aerodynamic drag Cd 0.3
Radius of tyre (r ) 0.38m
Frontal area (A) 3 m2
Air density (ρ) 1.25k g/m3
Gravitational acceleration 9.8m/s2
Vehicle centre of gravity height ( gh ) 900mm
Wheelbase length ( L ) 3080mm
Distance between front (rear) wheel axle and vehicle centre of gravity (b = d )
1540mm
Motor Nominal power (Pm) 75 kW*
Motor efficiency (ηm) 93%-98%
Rotor inertia (I) 0.0421kg·m2
Mass of motor 90kg
Battery Battery pack energy (Eb) 44kWh
* Note: The switched reluctance motor is chosen in the UMEV
3.4.1 UMEV model implemented in modified ADVISOR
The simulation was conducted to determine the most suitable LiFePO4 battery system
for the UMEV. The model of the UMEV developed in Section 3.2 was implemented in
the modified ADVISOR. The major modifications in the ADVISOR included: 1) the
60

CHAPTER 3 COMPARISON STUDY OF DIFFERENT LITHIUM IRON PHOSPHATE BATTERY PACKS
front wheel drive (FWD) vehicle model was changed to the 4WD vehicle model. 2) the
constant rolling resistance coefficient and constant uphill/downhill gradient were
changed to variable rolling resistance coefficients and variable uphill/downhill
gradients. 3) the model parameters of the existing battery were replaced by those of the
two LiFePO4 batteries and two battery packs listed in Table 3-1. The following
paragraph is a brief explanation of the major modifications and further details can be
found in [81].
The EV model in the ADVISOR is a FWD vehicle model. For FWD vehicles, the
adhesion force loads on the two front wheels. To make full use of the vehicle weight,
the UMEV is designed to be a 4WD vehicle which can reach maximum vehicle-road
adhesion force. Hence, the vehicle’s performance and stability can be improved. The
traction control and wheel/axle block in the ADVISOR were reprogrammed to
implement the 4WD model.
The standard EV driving cycles were embedded in the ADVISOR associated with a
constant rolling resistance coefficient. Different from conventional EV driving cycles,
the UMDC has variable rolling resistance coefficients and gradients due to different
types of surfaces and uphill/downhill sections in the road, as shown in Fig. 3-5.
Therefore, the vehicle block, wheel/axle block and traction control block were
reprogrammed to allow the input of the variable rolling resistance coefficients versus
the time and speed and the input of the variable gradients versus the time and driving
distance.
The Rint model was chosen to simulate the battery in ADVISOR. Its parameters were
obtained from a SAFT lead-acid battery. In this study, the four battery systems made
from the two LiFePO4 batteries and their corresponding battery packs were used to
power the UMEV. The battery parameters extracted from the experimental data of the 61

CHAPTER 3 COMPARISON STUDY OF DIFFERENT LITHIUM IRON PHOSPHATE BATTERY PACKS
four battery systems in Section 3.3 were incorporated in the battery models to represent
these four battery systems with a total energy of 44kWh and a total nominal voltage of
370V. Battery system A was built with the 20Ah prismatic batteries. It consists of 8
packs in series, where each pack has 14 modules in series, with each module having 6
paralleled batteries. Battery system B was built with 40Ah 4S2P battery packs. It
consists of 7 packs in series, where each pack has 4 modules in series with each module
having 3 paralleled battery packs. Battery system C was built with 2.3Ah cylinder
batteries. It consists of 8 packs in series, where each has the 14 modules in series with
each module having 52 paralleled batteries. Battery system D was built with 2.3Ah
4S1P battery packs. It consists of 7 packs in series, where each pack has 4 modules in
series with each module having 52 paralleled battery packs. Table 3-4 shows the
parameters of the four battery systems. In the following simulation, it is assumed that all
the batteries and battery packs have the same electric characteristics, thus the model of
each battery system can be easily scaled up from the model of each battery and battery
pack.
TABLE 3-4 BATTERY SYSTEM PARAMETERS
Battery type 20Ah prismatic battery
40Ah 4S2P battery pack
2.3Ah cylinder battery
2.3Ah 4S1P battery pack
Battery system A B C D
Battery energy 44kWh 44kWh 44kWh 44kWh
Configuration 14S6P×8S 4S3P×7S 14S52P×8S 4S52P×7S
Number of batteries/ packs
672 84 5844 1456
Volume (L) 177 468 202 294
Weight (kg) 333 455 443 457
Price $14784 $25200 $46752 $65520
62

CHAPTER 3 COMPARISON STUDY OF DIFFERENT LITHIUM IRON PHOSPHATE BATTERY PACKS
3.4.2 Simulation results for one UMDC
The simulation of the UMEV with the four battery systems was conducted for one
UMDC. The SOCs of the four battery systems are shown in Fig. 3-14. It can be seen
that battery system C has the maximum residual SOC (76%), while battery system D
has the minimum residual SOC (72%). After 3600s, the SOC drops more quickly than
the previous period as the UMEV is driving up a slope with a gradient of 25 degrees for
10 minutes. Table 3-5 provides a summary of the residual SOCs, energy consumption,
energy storage efficiency and the overall energy efficiency and driving distances of the
UMEV at the end of one UMDC.
Fig. 3-14 SOCs over one UMDC
Figure 3-15 shows the average temperature of each battery system over one UMDC. It
can be seen that the battery systems C and D have higher temperatures than battery
systems A and B. This can be explained by the internal resistances of battery systems C
and D during charging and discharging being higher than those of battery systems A
63

CHAPTER 3 COMPARISON STUDY OF DIFFERENT LITHIUM IRON PHOSPHATE BATTERY PACKS
and B, as shown in Figs. 3-9 and 3-13, respectively. There are dramatic temperature
increases in two instances. The first is at the beginning of the UMDC when the UMEV
starts to drive downhill and the regenerative braking is taking place with high energy
losses in charge resistance. The second is at the time of 3400s when the UMEV starts to
climb the slope with a high demand for power which can cause high energy losses in
discharge resistances. There is a simple battery cooling system in ADVISOR [37]. It
works as follows. When the battery system temperature reaches 30, the cooling fan
turns on to regulate the battery system temperature. The battery system temperature
depends on the balance of the heat generation from the internal resistances and the heat
dissipation from the cooling system. It can be observed that there are some temperature
drops over one UMDC, as shown in Fig. 3-15.
TABLE 3-5 RESIDUAL SOCS, ENERGY CONSUMPTION, EFFICIENCY, OVERALL ENERGY
EFFICIENCY AND DRIVING DISTANCES OF UMEV UNDER FOUR BATTERY SYSTEMS AFTER
ONE UMDC
Battery system A B C D
Residual SOC at the end of one UMDC 74% 73% 76% 72%
Energy storage efficiency 0.97 0.9 0.95 0.9
Energy Used (kJ) 41561 43015 42545 42707
Energy to overcome aerodynamics (kJ) 1008 1008 1008 1008
Energy to overcome rolling resistance (kJ) 22059 22833 22757 22846
Overall efficiency 0.555 0.554 0.559 0.559
Driving distance (km) 32.3 32.3 32.3 32.3
64
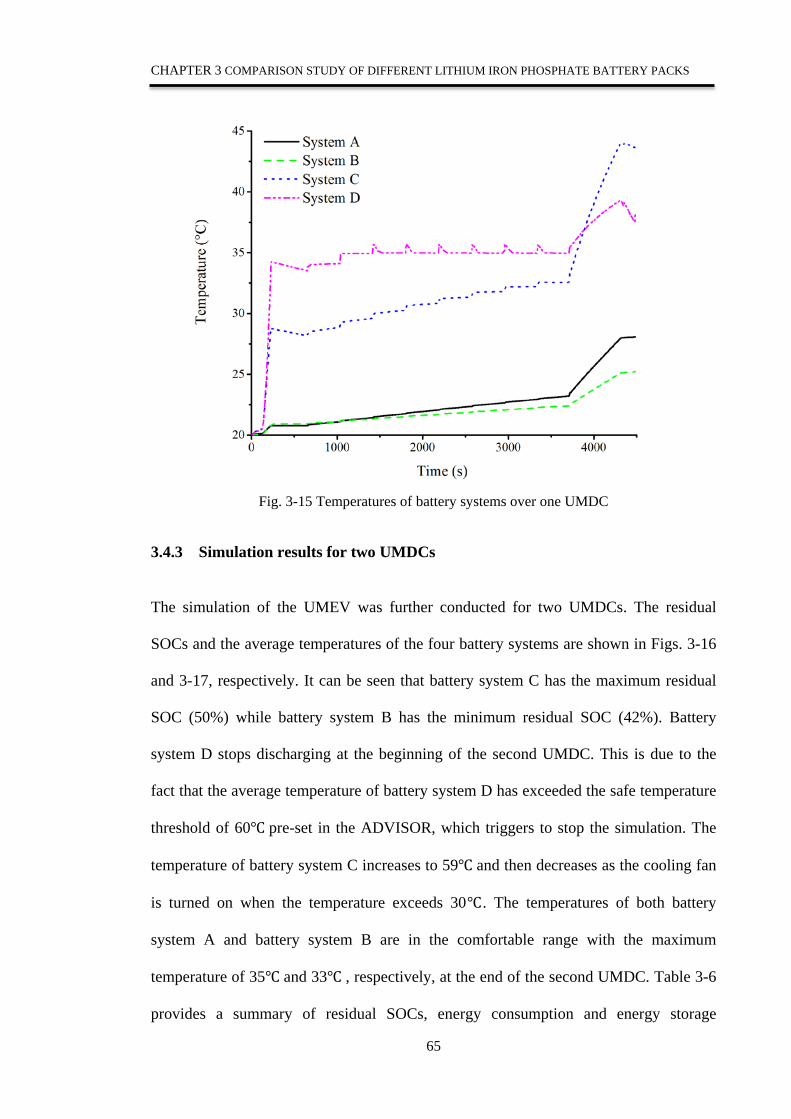
CHAPTER 3 COMPARISON STUDY OF DIFFERENT LITHIUM IRON PHOSPHATE BATTERY PACKS
Fig. 3-15 Temperatures of battery systems over one UMDC
3.4.3 Simulation results for two UMDCs
The simulation of the UMEV was further conducted for two UMDCs. The residual
SOCs and the average temperatures of the four battery systems are shown in Figs. 3-16
and 3-17, respectively. It can be seen that battery system C has the maximum residual
SOC (50%) while battery system B has the minimum residual SOC (42%). Battery
system D stops discharging at the beginning of the second UMDC. This is due to the
fact that the average temperature of battery system D has exceeded the safe temperature
threshold of 60 pre-set in the ADVISOR, which triggers to stop the simulation. The
temperature of battery system C increases to 59 and then decreases as the cooling fan
is turned on when the temperature exceeds 30. The temperatures of both battery
system A and battery system B are in the comfortable range with the maximum
temperature of 35 and 33 , respectively, at the end of the second UMDC. Table 3-6
provides a summary of residual SOCs, energy consumption and energy storage
65
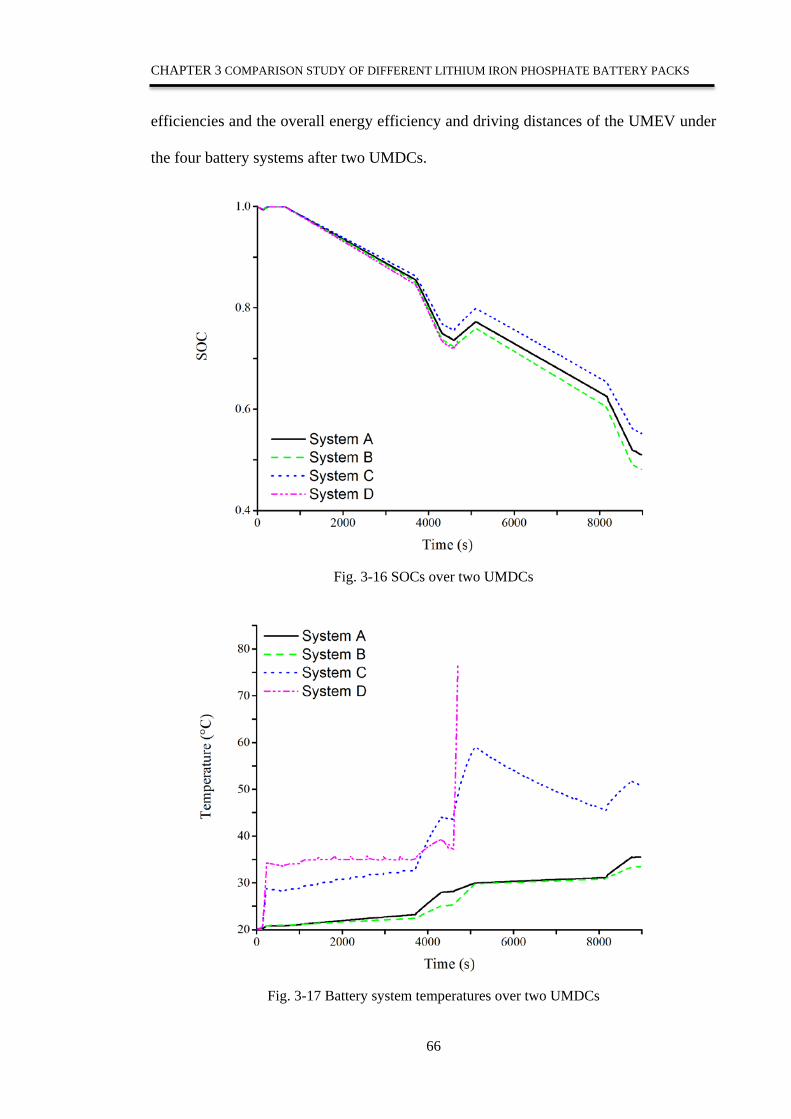
CHAPTER 3 COMPARISON STUDY OF DIFFERENT LITHIUM IRON PHOSPHATE BATTERY PACKS
efficiencies and the overall energy efficiency and driving distances of the UMEV under
the four battery systems after two UMDCs.
Fig. 3-16 SOCs over two UMDCs
Fig. 3-17 Battery system temperatures over two UMDCs
66

CHAPTER 3 COMPARISON STUDY OF DIFFERENT LITHIUM IRON PHOSPHATE BATTERY PACKS
TABLE 3-6 PARAMETERS OF BATTERY AND VEHICLE AFTER RUNNING FOR TWO UMDC
CYCLES
Battery system A B C D*
Residual SOC at the end of two UMDCs 45% 42% 50% -
Energy storage efficiency 0.98 0.9 0.95 -
Energy used (kJ) 78288 81467 80078 -
Energy to overcome aerodynamics (kJ) 2015 2015 2015 -
Energy to overcome Rolling resistance (kJ) 44123 45672 45520 -
Overall efficiency 0.589 0.585 0.594 -
Driving range (km) 64.7 64.7 64.7 34
Notes: *Simulation of the UMEV with Pack D ceased at the beginning of the second UMDC
3.4.4 Simulation results for multiple UMDCs
The simulation for multiple UMDCs was performed until the battery systems were fully
discharged. The results are shown in Fig. 3-18. It can be seen that battery system C
stopped discharging at the beginning of the third UMDC. This is caused by the
temperature of battery system C which tends to be higher than 60 , as shown in Fig. 3-
19. For battery systems A and B, the simulation stopped at the time when SOC = 0. The
highest temperatures, driving ranges, energy storage efficiencies and vehicle
efficiencies of battery systems A and B were 53 and 49, 144.8 km and 127.3km, 98%
and 90%, 65% and 60%, respectively.
67

CHAPTER 3 COMPARISON STUDY OF DIFFERENT LITHIUM IRON PHOSPHATE BATTERY PACKS
Fig. 3-18 SOCs over multiple UMDCs
Fig. 3-19 Battery system temperatures over multiple UMDCs
68
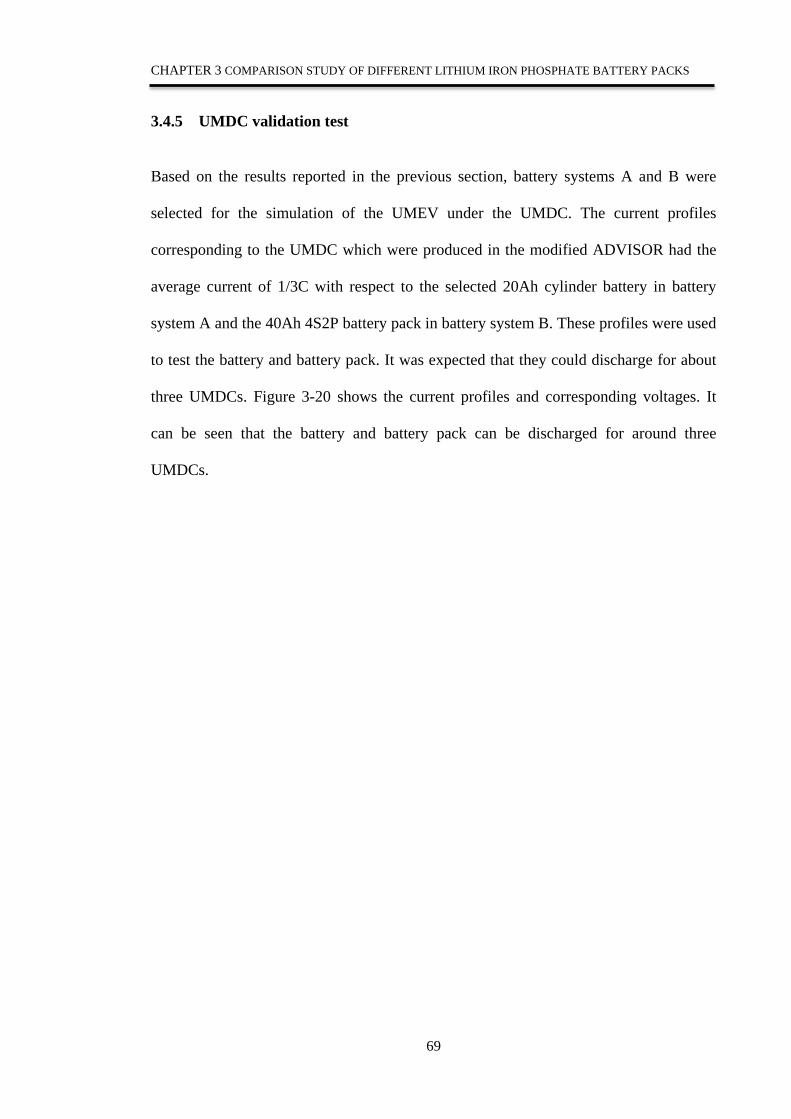
CHAPTER 3 COMPARISON STUDY OF DIFFERENT LITHIUM IRON PHOSPHATE BATTERY PACKS
3.4.5 UMDC validation test
Based on the results reported in the previous section, battery systems A and B were
selected for the simulation of the UMEV under the UMDC. The current profiles
corresponding to the UMDC which were produced in the modified ADVISOR had the
average current of 1/3C with respect to the selected 20Ah cylinder battery in battery
system A and the 40Ah 4S2P battery pack in battery system B. These profiles were used
to test the battery and battery pack. It was expected that they could discharge for about
three UMDCs. Figure 3-20 shows the current profiles and corresponding voltages. It
can be seen that the battery and battery pack can be discharged for around three
UMDCs.
69
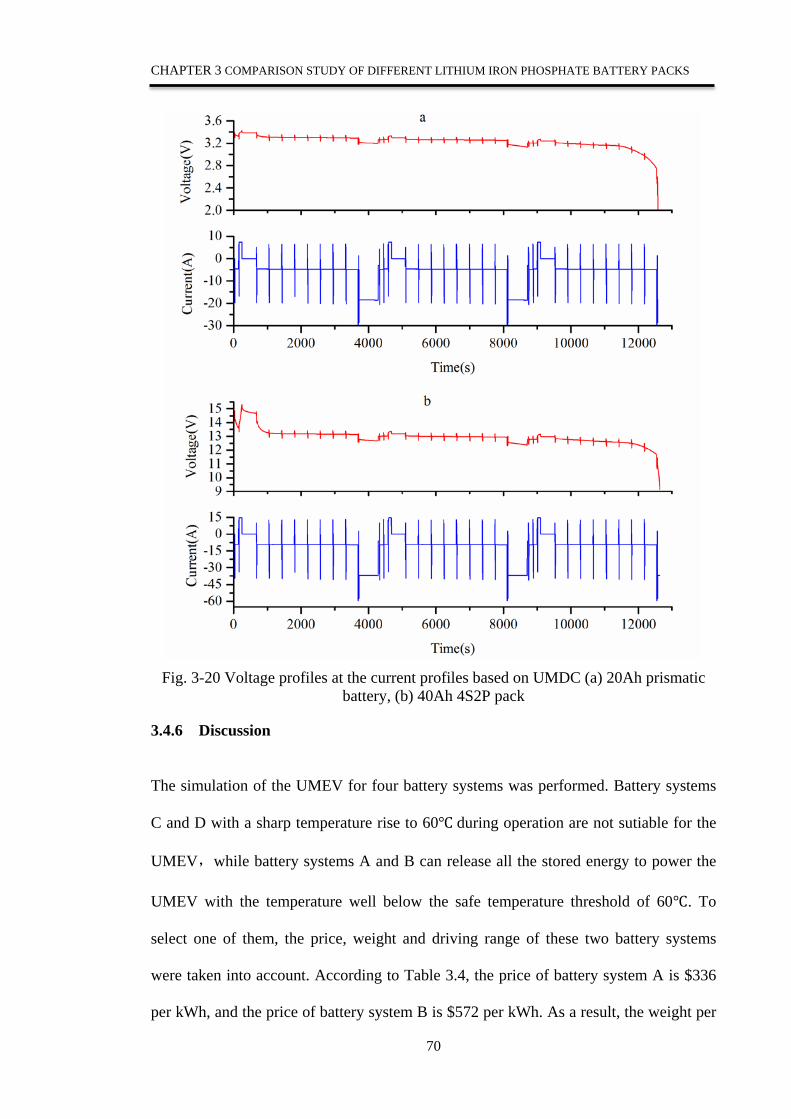
CHAPTER 3 COMPARISON STUDY OF DIFFERENT LITHIUM IRON PHOSPHATE BATTERY PACKS
Fig. 3-20 Voltage profiles at the current profiles based on UMDC (a) 20Ah prismatic
battery, (b) 40Ah 4S2P pack
3.4.6 Discussion
The simulation of the UMEV for four battery systems was performed. Battery systems
C and D with a sharp temperature rise to 60 during operation are not sutiable for the
UMEV,while battery systems A and B can release all the stored energy to power the
UMEV with the temperature well below the safe temperature threshold of 60. To
select one of them, the price, weight and driving range of these two battery systems
were taken into account. According to Table 3.4, the price of battery system A is $336
per kWh, and the price of battery system B is $572 per kWh. As a result, the weight per
70

CHAPTER 3 COMPARISON STUDY OF DIFFERENT LITHIUM IRON PHOSPHATE BATTERY PACKS
kWh for battery system A is 7.5kg per kWh while that for battery system B is 10.3kg
per kWh. The simulation results also show that the UMEV with battery system A can
drive longer than that with battery system B. Therefore, battery system A is the best
option for the UMEV.
3.5 Conclusion
In this chapter, a hybrid simulation approach was used to compare the four LiFePO4
battery systems for the four-wheel-drive UMEV by integrating the experimental results
of these battery systems into the battery models embedded in the modified Advanced
Vehicle Simulator (ADVISOR). The experimental results of these four battery systems
were used to identify the internal resistances, the relationships between open circuit
voltage and state of charge during charging and discharging periods and the capacities
at different ambient temperatures. With the modified ADVISOR, the simulations of the
UMEV were conducted at the specifically designed underground mine driving cycle
with variable rolling resistance coefficients and variable uphill/downhill gradients. The
results show that the battery system with the prismatic cell 20Ah is the best option for
the UMEV.
71
CHAPTER 4 SELF-ORGANISING MAP BASED CLASSIFICATION OF LITHIUM IRON PHOSPHATE CELL FOR BATTERY PACK
CHAPTER 4 SELF-ORGANISING MAP-BASED
CLASSIFICATION OF LITHIUM IRON PHOSPHATE
CELLS FOR BATTERY PACKS
In this chapter, the inconsistency problems of cells are further reviewed and discussed.
To alleviate problems, a self-organizing map (SOM)-based clustering method is
proposed to cluster the lithium iron phosphate (LiFePO4) cells. This method adopts the
available capacity, internal resistance and temperature variation as the input vectors to
the SOM. The SOM output clusters the cells into three categories. Cells in the same
group are connected to build a sorted battery pack and randomly selected cells are
connected to build an unsorted battery pack. These two packs are compared under
different loads in laboratory experiments. The experimental results show that the cell
consistency in the sorted pack is better than that in the unsorted pack. Therefore, the
effectiveness of the proposed SOM clustering method to make sorted battery packs with
consistent electrical characteristics is verified.
4.1 Introduction
Due to the progressively increasing cost of fuel and tightened control of emissions,
research into and innovation of electric vehicles (EVs) has grown significantly around
the world. One of the key technologies in the commercialization of EVs is batteries and
their management systems [92, 93]. Recently, lithium-ion batteries have been adopted
as primary power sources in EVs due to their high power and energy densities, high
operating voltage, long cycle life and low self-discharge rate. Therefore, the
development of lithium-ion battery management systems is very important, to ensure
the safe and efficient operation of batteries [91, 94, 95]. To meet the power and energy
72
CHAPTER 4 SELF-ORGANISING MAP BASED CLASSIFICATION OF LITHIUM IRON PHOSPHATE CELL FOR BATTERY PACK
requirements of EVs, the lithium-ion battery pack is required, which consists of
hundreds and thousands of cells in parallel and series. The cells in the pack may have
slightly different characteristics caused by intrinsic and extrinsic factors [43]. The
former derives from the manufacturing process, such as inconsistency in the
manufacturing environment and material defect. The latter derives from the application
environment, such as different operational temperatures and internal resistances of each
cell in the battery pack [44]. When these non-uniform cells are connected in series to
build a battery pack, the cell differences lead to a reduction in the pack capacity. The
reasons are explained as follows. When the pack is charging, one cell may reach the
maximum charging voltage earlier than the other cells, and the charging process has to
stop and the rest of the other cells are undercharged; when the pack is discharging, one
cell may reach the cut-off voltage earlier than the other cells, and the discharging
process has to stop and the rest of the cells are under-discharged. Therefore, the weakest
cell, which is the earliest one to be fully charged or fully discharged, determines the
available capacity and overall performance of the pack. Furthermore, these non-uniform
cells in the pack may cause safety risks and decrease the cycle life. Two measures are
normally taken to alleviate the problems of non-uniformity and imbalance of cells: one
is to select cells with similar characteristics to build the battery pack and the other is to
have battery balancing systems in the pack. This chapter focuses on the selection of
similar cells to build the pack using a self-organizing map (SOM)-based classification
method.
Different methods have been explored to select similar cells. In general, they are
divided into two groups. One group is based on the observation of measured battery
parameters. The electrochemical impedance spectroscopy method [96] has been applied
to produce the Nyquist plots of the cells at the specific frequencies and the similarities
73
CHAPTER 4 SELF-ORGANISING MAP BASED CLASSIFICATION OF LITHIUM IRON PHOSPHATE CELL FOR BATTERY PACK
of the plots observed to conduct cell clustering. The available capacity, internal
resistance and the curves of OCVs versus SOCs have been used to cluster the cells [97].
The above methods lack systematic procedures and rely heavily on personal experience.
The other group is based on machine learning approaches. A fuzzy C-mean algorithm
has been applied in the analysis of voltage differences during charging/discharging for
sorting cells [46]. The self-organizing map (SOM) method has been applied to group
cells by capturing the features of the input vectors of the SOM, where the input vectors
were the voltage and available capacity of cells, but the temperature was ignored [98].
Fang [99] also used SOM to cluster cells into three categories with high, medium and
low temperature, where the temperatures at three different discharge rates were chosen
as the input vectors, but the voltage and available capacity were not taken into account.
In this chapter, a self-organizing map (SOM) is proposed to cluster the cells. One
contribution of our work is to adopt the newly proposed input vectors to the SOM,
which are the available capacity, internal resistance and temperature variation. The
output of the SOM is three clusters which categorise the cells into three groups. Another
contribution is that the experimental comparison of the sorted pack with the unsorted
pack under different discharging current profiles has been carefully conducted, and the
sorted battery pack consists of cells which have been clustered into the same group and
the unsorted battery pack is built of randomly selected cells. The results show that the
cells in the sorted pack are more consistent than those in the unsorted pack, thereby
verifying the effectiveness of the proposed method.
The rest of this chapter is organized as follows. In Section 4.2, the results of
experiments on 12 cells with 3.3V/2.3Ah LiFePO4 on the battery testing system are
reported and the experimental data are obtained for clustering. In Section 4.3, the SOM
74

CHAPTER 4 SELF-ORGANISING MAP BASED CLASSIFICATION OF LITHIUM IRON PHOSPHATE CELL FOR BATTERY PACK
method for clustering cells is presented. In Section 4.4, the pulse current discharge
profiles and the current profiles based on urban dynamometer driving schedule (UDDS)
for EVs are used to test the sorted and unsorted battery packs to validate the proposed
method. The conclusions are given in Section4. 5.
4.2 Experiment
The sorting of cells requires numerous experimental data from the cells under
investigation. A battery testing system (BTS) was built to obtain these data, as shown in
Fig. 4-l. The BTS with the four independent channels can charge and discharge four
cells simultaneously using programmable currents. 12 LiFeO4 cells were tested under
ambient temperature. The cell specification is shown in Table 4-1. The constant
current/constant voltage (CCCV) charging method was adopted in this study to charge
the cells with the constant current of 1C until the cell voltage reached the maximum
charging voltage of 3.6V, where 1C refers to the charging current of 2.3A, namely the
ratio of nominal capacity to 1 hour (2.3Ah/1h). The charging voltage was maintained at
3.6V and the charging current was reduced exponentially. When the current reached a
pre-set current (e.g. 0.05C was adopted in this study), the charging process ended [90].
Having rested for 1 hour, the cells were discharged at the constant current of 1C. During
the test, the voltages of the cells were collected by the voltage sensors with the sampling
rate of one second. The resolution of the voltage sensor of the Arbin system is 0.1%.
For each cell, 8 number of test results were used to calculate the average available
capacity for clustering in the following section.
75

CHAPTER 4 SELF-ORGANISING MAP BASED CLASSIFICATION OF LITHIUM IRON PHOSPHATE CELL FOR BATTERY PACK
Figure 4-1.Experimental setup
TABLE 4-1 SPECIFICATION OF CELLS USED FOR TESTING
Cell type A123 26650 cylinder type LiFePO4
Nominal capacity 2.3Ah
Nominal voltage 3.3V
Cut-off voltage (upper/lower) 3.6/2.0V
Maximum continuous discharge 50A
Operating temperature -30~55 °C
4.3 SOM-based Classification Method for Battery Sorting
A self-organizing map (SOM) is a special kind of neural network. It is a well-known
unsupervised learning and data clustering method [100-102], which was initially
76
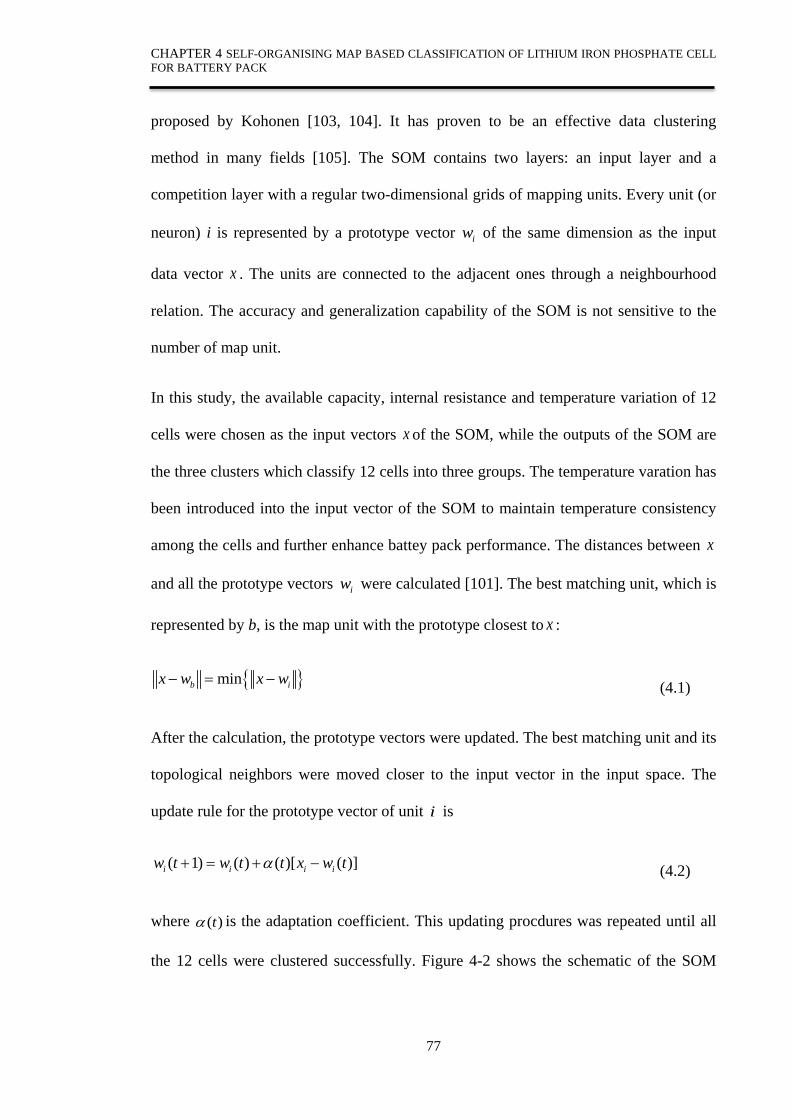
CHAPTER 4 SELF-ORGANISING MAP BASED CLASSIFICATION OF LITHIUM IRON PHOSPHATE CELL FOR BATTERY PACK
proposed by Kohonen [103, 104]. It has proven to be an effective data clustering
method in many fields [105]. The SOM contains two layers: an input layer and a
competition layer with a regular two-dimensional grids of mapping units. Every unit (or
neuron) i is represented by a prototype vector iw of the same dimension as the input
data vector x . The units are connected to the adjacent ones through a neighbourhood
relation. The accuracy and generalization capability of the SOM is not sensitive to the
number of map unit.
In this study, the available capacity, internal resistance and temperature variation of 12
cells were chosen as the input vectors x of the SOM, while the outputs of the SOM are
the three clusters which classify 12 cells into three groups. The temperature varation has
been introduced into the input vector of the SOM to maintain temperature consistency
among the cells and further enhance battey pack performance. The distances between x
and all the prototype vectors iw were calculated [101]. The best matching unit, which is
represented by b, is the map unit with the prototype closest to x :
minb ix w x w− = − (4.1)
After the calculation, the prototype vectors were updated. The best matching unit and its
topological neighbors were moved closer to the input vector in the input space. The
update rule for the prototype vector of unit i is
( 1) ( ) [ ( )( ) ]i i i iw t w t xt w tα −++ = (4.2)
where ( )tα is the adaptation coefficient. This updating procdures was repeated until all
the 12 cells were clustered successfully. Figure 4-2 shows the schematic of the SOM
77
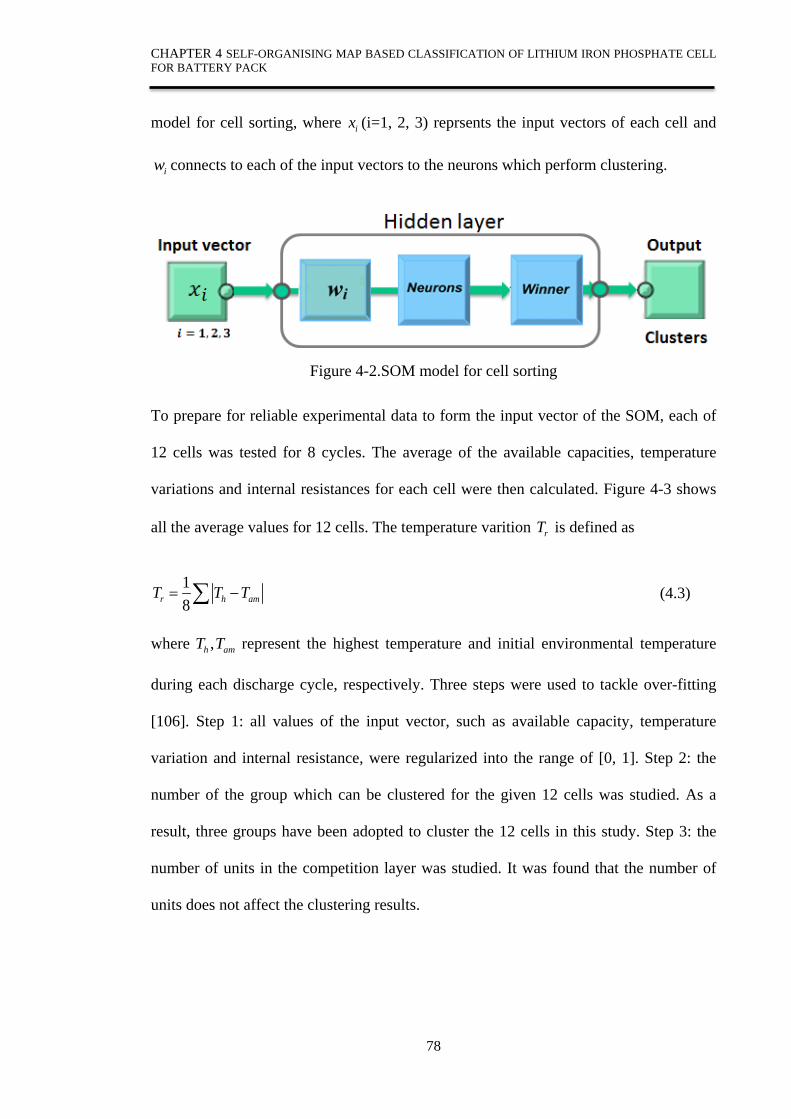
CHAPTER 4 SELF-ORGANISING MAP BASED CLASSIFICATION OF LITHIUM IRON PHOSPHATE CELL FOR BATTERY PACK
model for cell sorting, where ix (i=1, 2, 3) reprsents the input vectors of each cell and
iw connects to each of the input vectors to the neurons which perform clustering.
Figure 4-2.SOM model for cell sorting
To prepare for reliable experimental data to form the input vector of the SOM, each of
12 cells was tested for 8 cycles. The average of the available capacities, temperature
variations and internal resistances for each cell were then calculated. Figure 4-3 shows
all the average values for 12 cells. The temperature varition rT is defined as
18r h amT T T= −∑ (4.3)
where ,h amT T represent the highest temperature and initial environmental temperature
during each discharge cycle, respectively. Three steps were used to tackle over-fitting
[106]. Step 1: all values of the input vector, such as available capacity, temperature
variation and internal resistance, were regularized into the range of [0, 1]. Step 2: the
number of the group which can be clustered for the given 12 cells was studied. As a
result, three groups have been adopted to cluster the 12 cells in this study. Step 3: the
number of units in the competition layer was studied. It was found that the number of
units does not affect the clustering results.
78
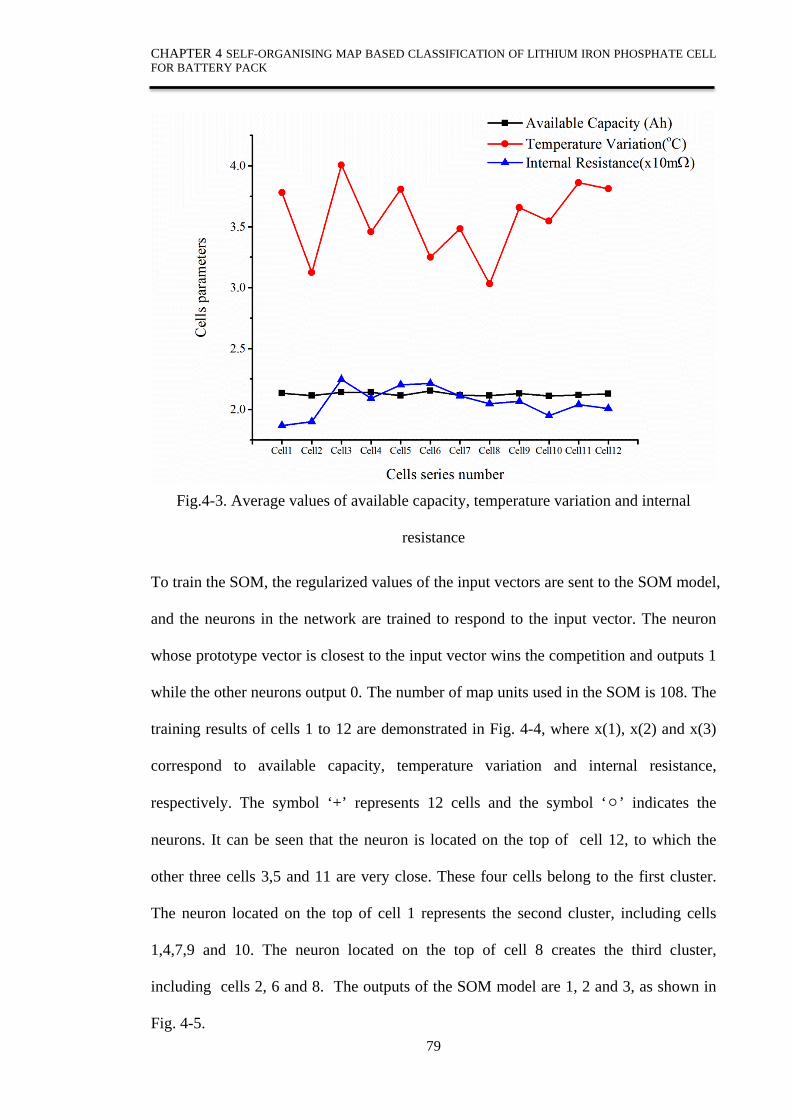
CHAPTER 4 SELF-ORGANISING MAP BASED CLASSIFICATION OF LITHIUM IRON PHOSPHATE CELL FOR BATTERY PACK
Fig.4-3. Average values of available capacity, temperature variation and internal
resistance
To train the SOM, the regularized values of the input vectors are sent to the SOM model,
and the neurons in the network are trained to respond to the input vector. The neuron
whose prototype vector is closest to the input vector wins the competition and outputs 1
while the other neurons output 0. The number of map units used in the SOM is 108. The
training results of cells 1 to 12 are demonstrated in Fig. 4-4, where x(1), x(2) and x(3)
correspond to available capacity, temperature variation and internal resistance,
respectively. The symbol ‘+’ represents 12 cells and the symbol ‘’ indicates the
neurons. It can be seen that the neuron is located on the top of cell 12, to which the
other three cells 3,5 and 11 are very close. These four cells belong to the first cluster.
The neuron located on the top of cell 1 represents the second cluster, including cells
1,4,7,9 and 10. The neuron located on the top of cell 8 creates the third cluster,
including cells 2, 6 and 8. The outputs of the SOM model are 1, 2 and 3, as shown in
Fig. 4-5. 79

CHAPTER 4 SELF-ORGANISING MAP BASED CLASSIFICATION OF LITHIUM IRON PHOSPHATE CELL FOR BATTERY PACK
Fig.4-4. SOM training results with cells 1 to 12
Fig.4-5. Clustering results of 12 cells
80

CHAPTER 4 SELF-ORGANISING MAP BASED CLASSIFICATION OF LITHIUM IRON PHOSPHATE CELL FOR BATTERY PACK
4.4 Results and Discussion
Based on the above clustering results, cells 3, 5, 11, 12 in the same cluster were
connected in series to build a battery pack named the sorted battery pack. Cells 2, 3, 6, 9
were randomly chosen to connect in series to build the other battery pack named the
unsorted battery pack. The basic parameters of these two battery packs are listed in
Table 4-2. The pulse current discharge profiles with 1C discharge rate, constant
discharge current with 2C discharge rate and the current profiles based on the UDDS for
EVs were used to test these two battery packs. The following section presents the
discussion of these experimental results.
TABLE 4-2 KEY SPECIFICATIONS OF BATTERY PACK
Battery pack
Nominal capacity 2.3Ah
Nominal voltage 13.2V
Cut-off voltage (upper/lower) 14.4/8.0V
Maximum continuous discharge 30A
Operating temperature -30~55 oC
4.4.1 Pulse current discharge test
The relationlship between the open circuit voltage (OCV) and the state of charge (SOC)
is very important, because it can infer the SOC which is a crucial parameter for battery
management systems. A pulse current discharge (PCD) test can obtain this relationship
[91]. During the test, the fully charged battery pack was discharged at 2.2A nearly to 1C
for 6 min. and rested for 1 hour to allow the terminal voltage to reach its equilibrium
state, namely the OCV. Each pulse current discharge equals approximately 10% of the
nominal capacity, which is equivalent to a reduction in the SOC by 10%. This 81
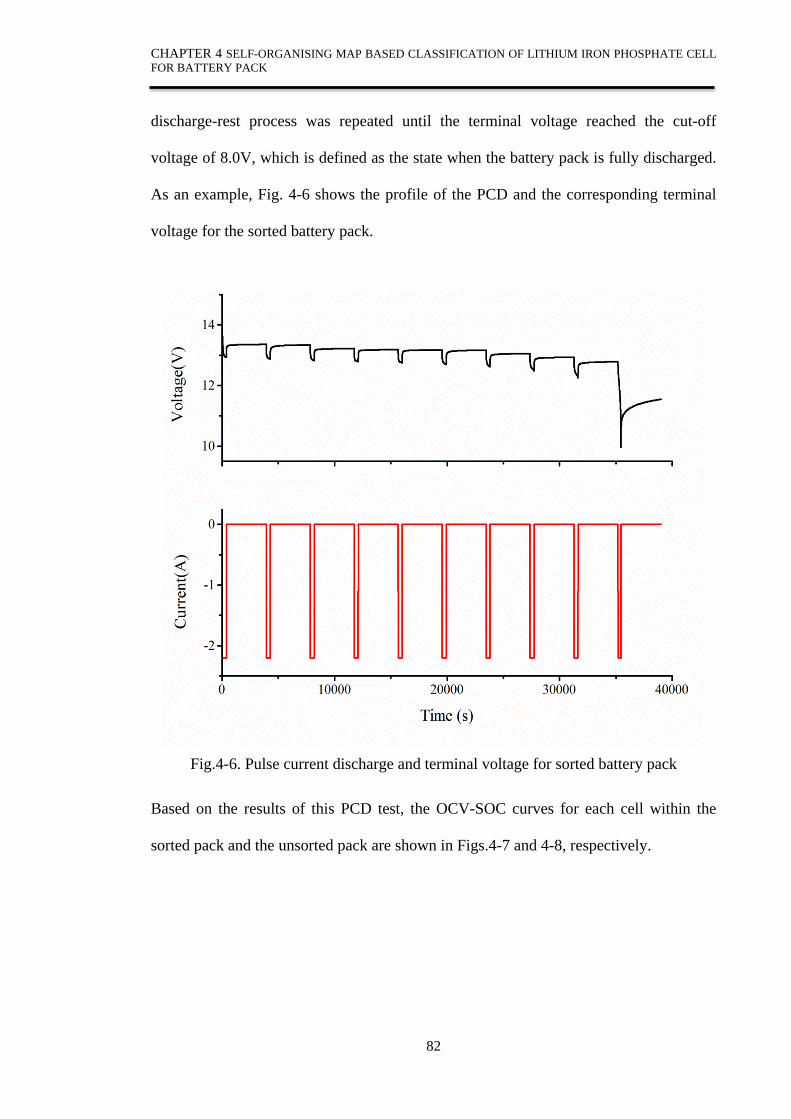
CHAPTER 4 SELF-ORGANISING MAP BASED CLASSIFICATION OF LITHIUM IRON PHOSPHATE CELL FOR BATTERY PACK
discharge-rest process was repeated until the terminal voltage reached the cut-off
voltage of 8.0V, which is defined as the state when the battery pack is fully discharged.
As an example, Fig. 4-6 shows the profile of the PCD and the corresponding terminal
voltage for the sorted battery pack.
Fig.4-6. Pulse current discharge and terminal voltage for sorted battery pack
Based on the results of this PCD test, the OCV-SOC curves for each cell within the
sorted pack and the unsorted pack are shown in Figs.4-7 and 4-8, respectively.
82

CHAPTER 4 SELF-ORGANISING MAP BASED CLASSIFICATION OF LITHIUM IRON PHOSPHATE CELL FOR BATTERY PACK
Figure 4-7. OCVs versus SOCs for cells in sorted battery pack
Figure 4-8. OCVs versus SOCs for cells in unsorted battery pack
83

CHAPTER 4 SELF-ORGANISING MAP BASED CLASSIFICATION OF LITHIUM IRON PHOSPHATE CELL FOR BATTERY PACK
Figures. 4-7 and 4-8 indicate that there is an inconsistency in the OCVs for the cells in
the sorted and unsorted packs at the low range of the SOCs from 0 to 10%. In this range
of SOCs, it may not create a problem for the battery pack during the charging process,
since the cells in the pack have low voltages far from the maximum protection voltage.
The OCVs of each cell are almost uniform at SOCs from 10% to 100% for the sorted
battery pack, while the OCVs of each cell only show uniformity at the SOCs from 80%
to 100% for the unsorted battery pack. The inconsistency of the cells in a wide range of
SOCs (e.g. 10% to 80%) affects the performance of the unsorted battery pack in
comparison with that of te sorted battery pack. Table 4-3 shows the discharge capacity
of the two battery packs, and indicates that the sorted pack has more available capacity
than the unsorted pack.
TABLE 4-3 AVAILABLE CAPACITIES FOR SORTED AND UNSORTED BATTERY PACKS
Sorted battery pack Unsorted battery pack
Discharge capacity (Ah) 2.161 2.1475
To describe the voltage inconsistency, the voltage difference between the voltage of
each cell and the mean voltage of n cells in the battery pack at the same SOC is defined
by
1/
n
ocvi ocvi ocvii
V V V n=
∆ = −∑ (4.4)
where ocviV represents the OCV at a certain SOC, and n refers to the number of cells.
For example, the voltage differences of the cells in the sorted and unsorted battery packs
at the SOC of 60% are shown in Table 4-4. It can be seen that the voltage differences of
the cells in the sorted pack are much smaller than those in the unsorted pack. This 84
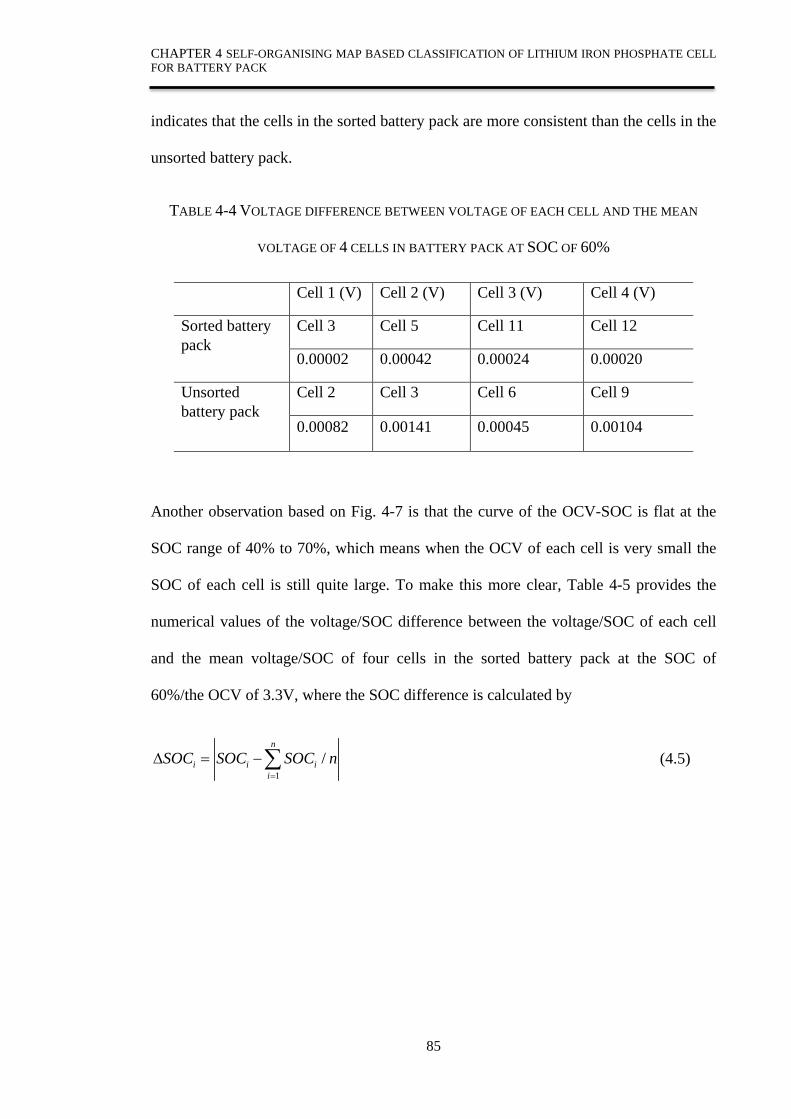
CHAPTER 4 SELF-ORGANISING MAP BASED CLASSIFICATION OF LITHIUM IRON PHOSPHATE CELL FOR BATTERY PACK
indicates that the cells in the sorted battery pack are more consistent than the cells in the
unsorted battery pack.
TABLE 4-4 VOLTAGE DIFFERENCE BETWEEN VOLTAGE OF EACH CELL AND THE MEAN
VOLTAGE OF 4 CELLS IN BATTERY PACK AT SOC OF 60%
Cell 1 (V) Cell 2 (V) Cell 3 (V) Cell 4 (V)
Sorted battery pack
Cell 3 Cell 5 Cell 11 Cell 12
0.00002 0.00042 0.00024 0.00020
Unsorted battery pack
Cell 2 Cell 3 Cell 6 Cell 9
0.00082 0.00141 0.00045 0.00104
Another observation based on Fig. 4-7 is that the curve of the OCV-SOC is flat at the
SOC range of 40% to 70%, which means when the OCV of each cell is very small the
SOC of each cell is still quite large. To make this more clear, Table 4-5 provides the
numerical values of the voltage/SOC difference between the voltage/SOC of each cell
and the mean voltage/SOC of four cells in the sorted battery pack at the SOC of
60%/the OCV of 3.3V, where the SOC difference is calculated by
1/
n
i i ii
SOC SOC SOC n=
∆ = −∑ (4.5)
85
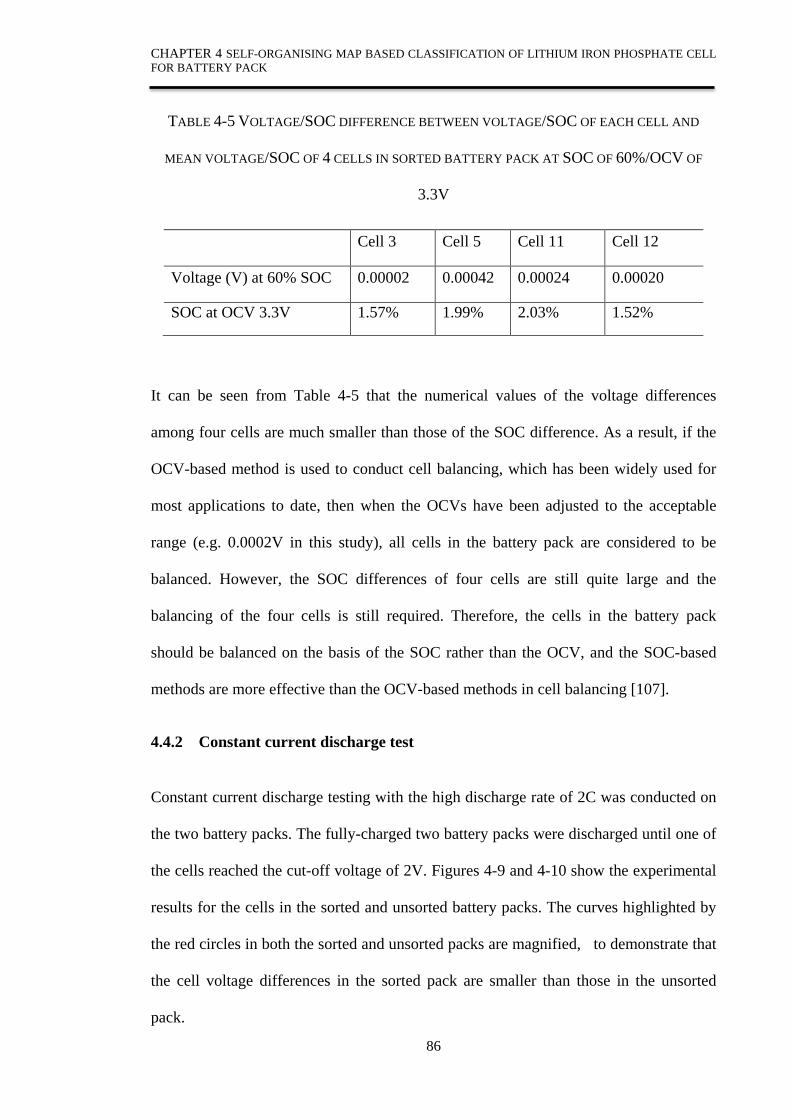
CHAPTER 4 SELF-ORGANISING MAP BASED CLASSIFICATION OF LITHIUM IRON PHOSPHATE CELL FOR BATTERY PACK
TABLE 4-5 VOLTAGE/SOC DIFFERENCE BETWEEN VOLTAGE/SOC OF EACH CELL AND
MEAN VOLTAGE/SOC OF 4 CELLS IN SORTED BATTERY PACK AT SOC OF 60%/OCV OF
3.3V
Cell 3 Cell 5 Cell 11 Cell 12
Voltage (V) at 60% SOC 0.00002 0.00042 0.00024 0.00020
SOC at OCV 3.3V 1.57% 1.99% 2.03% 1.52%
It can be seen from Table 4-5 that the numerical values of the voltage differences
among four cells are much smaller than those of the SOC difference. As a result, if the
OCV-based method is used to conduct cell balancing, which has been widely used for
most applications to date, then when the OCVs have been adjusted to the acceptable
range (e.g. 0.0002V in this study), all cells in the battery pack are considered to be
balanced. However, the SOC differences of four cells are still quite large and the
balancing of the four cells is still required. Therefore, the cells in the battery pack
should be balanced on the basis of the SOC rather than the OCV, and the SOC-based
methods are more effective than the OCV-based methods in cell balancing [107].
4.4.2 Constant current discharge test
Constant current discharge testing with the high discharge rate of 2C was conducted on
the two battery packs. The fully-charged two battery packs were discharged until one of
the cells reached the cut-off voltage of 2V. Figures 4-9 and 4-10 show the experimental
results for the cells in the sorted and unsorted battery packs. The curves highlighted by
the red circles in both the sorted and unsorted packs are magnified, to demonstrate that
the cell voltage differences in the sorted pack are smaller than those in the unsorted
pack.
86
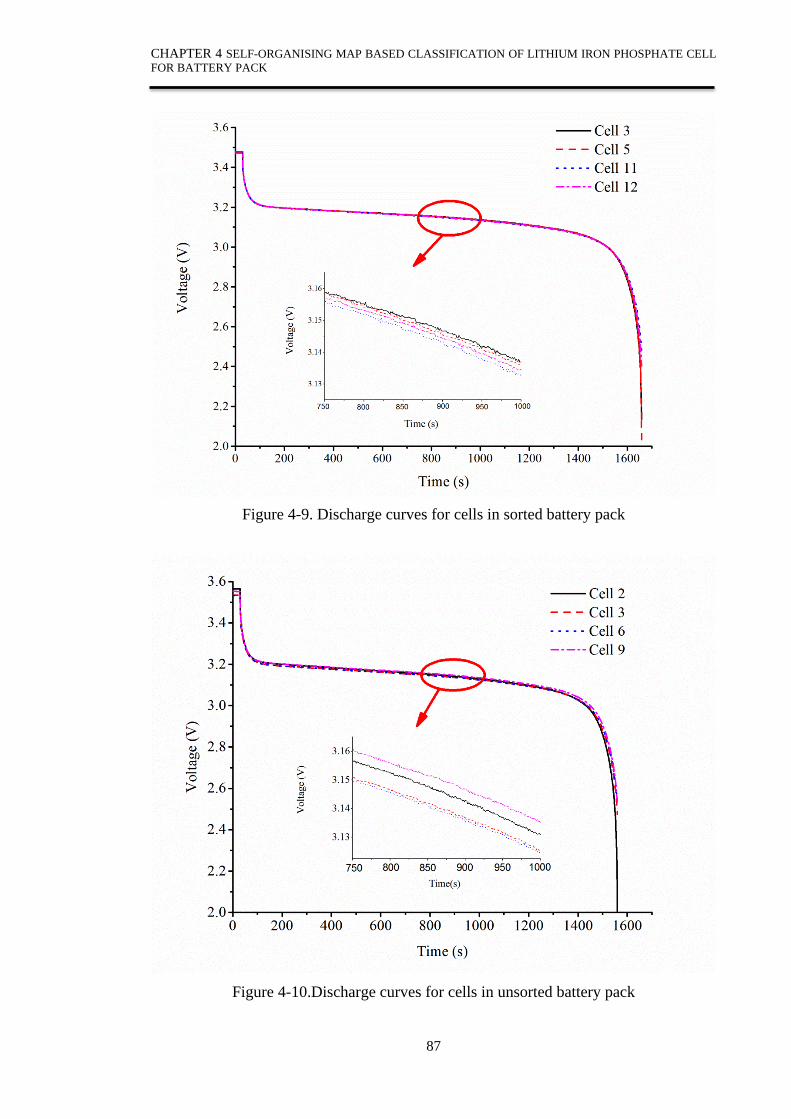
CHAPTER 4 SELF-ORGANISING MAP BASED CLASSIFICATION OF LITHIUM IRON PHOSPHATE CELL FOR BATTERY PACK
Figure 4-9. Discharge curves for cells in sorted battery pack
Figure 4-10.Discharge curves for cells in unsorted battery pack
87
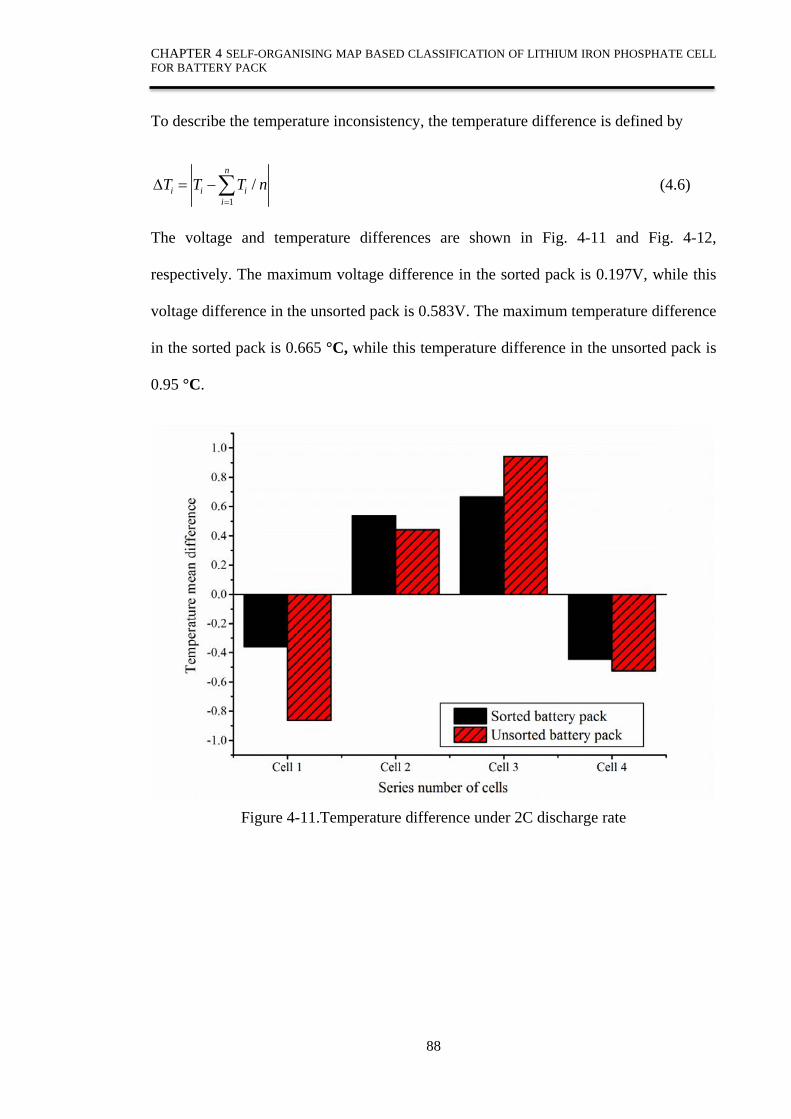
CHAPTER 4 SELF-ORGANISING MAP BASED CLASSIFICATION OF LITHIUM IRON PHOSPHATE CELL FOR BATTERY PACK
To describe the temperature inconsistency, the temperature difference is defined by
1/
n
i i ii
T T T n=
∆ = −∑ (4.6)
The voltage and temperature differences are shown in Fig. 4-11 and Fig. 4-12,
respectively. The maximum voltage difference in the sorted pack is 0.197V, while this
voltage difference in the unsorted pack is 0.583V. The maximum temperature difference
in the sorted pack is 0.665 °C, while this temperature difference in the unsorted pack is
0.95 °C.
Figure 4-11.Temperature difference under 2C discharge rate
88

CHAPTER 4 SELF-ORGANISING MAP BASED CLASSIFICATION OF LITHIUM IRON PHOSPHATE CELL FOR BATTERY PACK
Figure 4-12.Voltage difference under 2C discharge rate
4.4.3 EV driving cycle test
The current profile based on the EV driving cycle was also used to test the two battery
packs. This EV driving cycle is the urban dynamometer driving schedules (UDDSs),
which has been used for several decades in the automobile industry[108]. Figure 4-13
shows the current profile of four cycles converted from the UDDS. This profile was
loaded into the two battery packs under ambient temperature.
Figures 4-14 and 4-15 show the experimental results of voltage profiles for each of the
cells in the sorted and unsorted packs. The voltage and temperature differences for each
cell are shown in Figs 4-16 and 4-17, which indicate that the differences of the cells in
the sorted pack are smaller than those of the cells in the unsorted pack. Therefore, the
sorted battery pack has better voltage and temperature consistency than the unsorted
battery pack.
89

CHAPTER 4 SELF-ORGANISING MAP BASED CLASSIFICATION OF LITHIUM IRON PHOSPHATE CELL FOR BATTERY PACK
Figure 4-13. Current profile for UDDS
Figure 4-14. Voltage profiles of cells in sorted battery pack
90
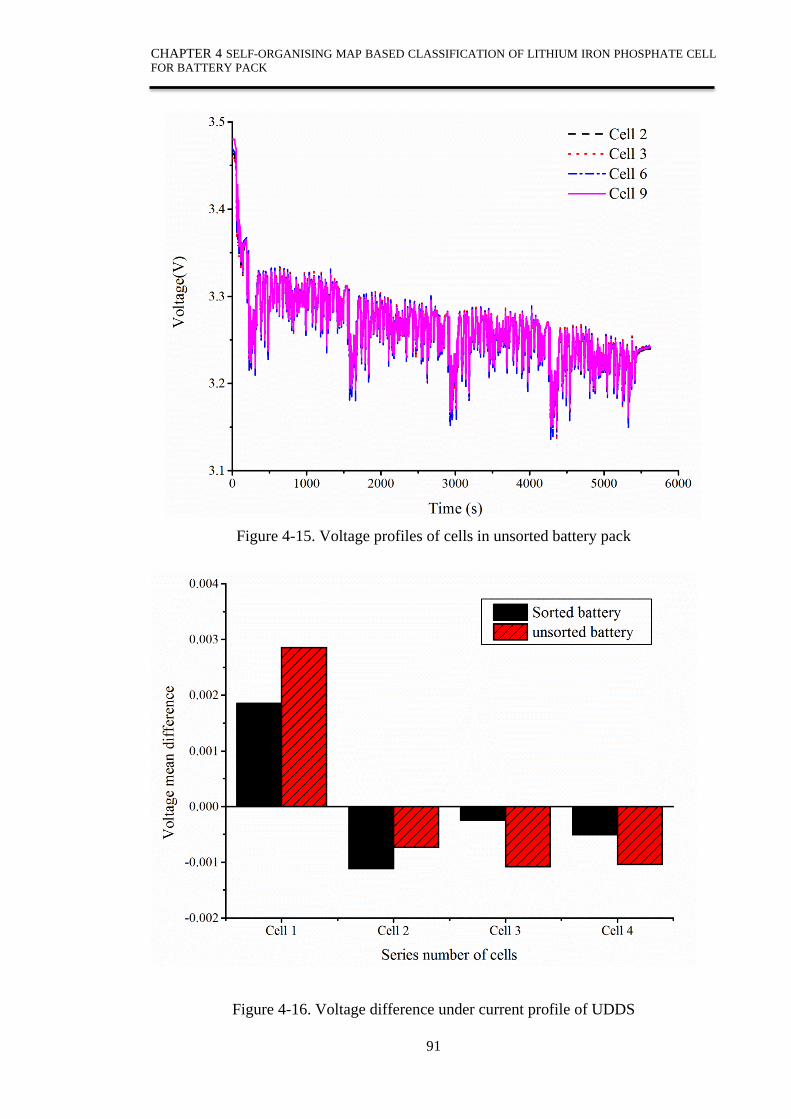
CHAPTER 4 SELF-ORGANISING MAP BASED CLASSIFICATION OF LITHIUM IRON PHOSPHATE CELL FOR BATTERY PACK
Figure 4-15. Voltage profiles of cells in unsorted battery pack
Figure 4-16. Voltage difference under current profile of UDDS
91
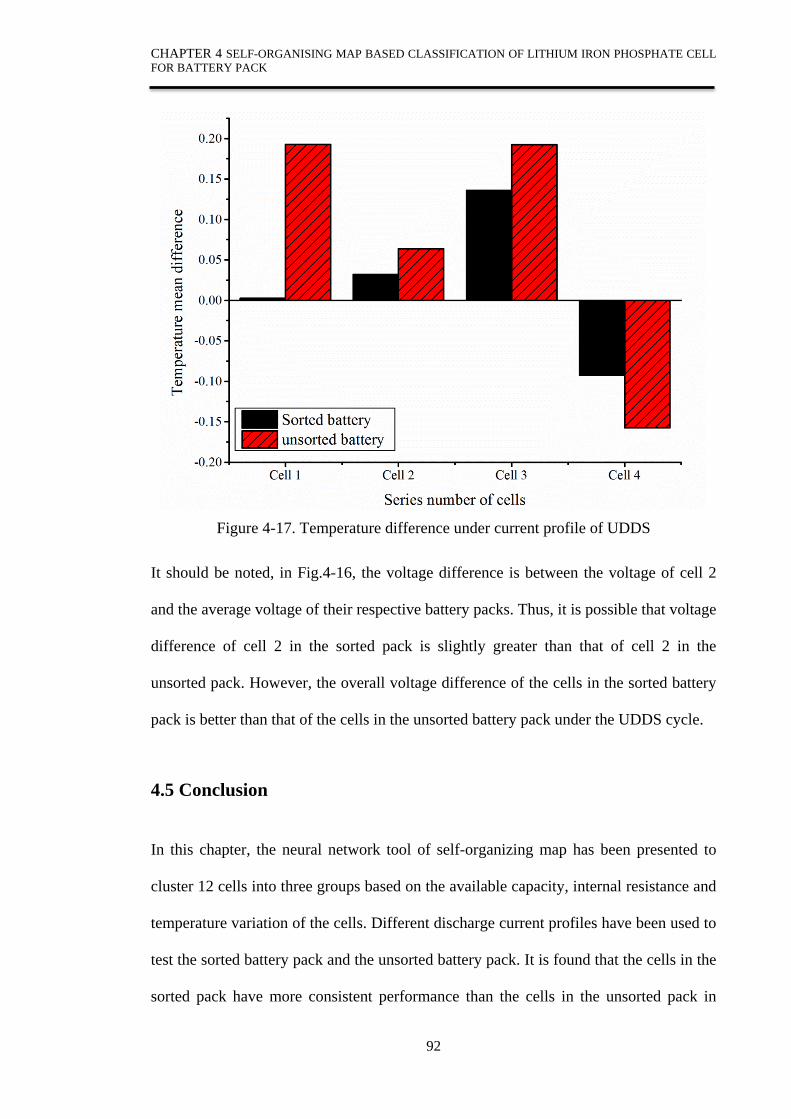
CHAPTER 4 SELF-ORGANISING MAP BASED CLASSIFICATION OF LITHIUM IRON PHOSPHATE CELL FOR BATTERY PACK
Figure 4-17. Temperature difference under current profile of UDDS
It should be noted, in Fig.4-16, the voltage difference is between the voltage of cell 2
and the average voltage of their respective battery packs. Thus, it is possible that voltage
difference of cell 2 in the sorted pack is slightly greater than that of cell 2 in the
unsorted pack. However, the overall voltage difference of the cells in the sorted battery
pack is better than that of the cells in the unsorted battery pack under the UDDS cycle.
4.5 Conclusion
In this chapter, the neural network tool of self-organizing map has been presented to
cluster 12 cells into three groups based on the available capacity, internal resistance and
temperature variation of the cells. Different discharge current profiles have been used to
test the sorted battery pack and the unsorted battery pack. It is found that the cells in the
sorted pack have more consistent performance than the cells in the unsorted pack in
92

CHAPTER 4 SELF-ORGANISING MAP BASED CLASSIFICATION OF LITHIUM IRON PHOSPHATE CELL FOR BATTERY PACK
terms of battery state of charge, terminal and open circuit voltages and temperature
variation. In addition, the experimental results also show that state of charge-based
methods for cell balancing are more effective than voltage-based methods. Future work
will consider the development of the SOC estimation method for sorted and unsorted
battery packs and a cell balancing technique based on battery SOC rather than battery
terminal voltage.
93
CHAPTER 5 BATTERY PACK STATE-OF-CHARGE ESTIMATION WITH H INFINITY OBSERVER
CHAPTER 5 BATTERY PACK STATE-OF-CHARGE
ESTIMATION WITH H INFINITY OBSERVER
In this chapter, a H-infinity observer (HIO) for SOC estimation is proposed for series-
connected battery packs in UMEVs. In the proposed method, an average virtual cell
(AVC) model is defined and the SOC of the AVC model is estimated to represent the
pack SOC when all terminal voltage differences (TVDs) between each individual cell in
the pack and the AVC are within a pre-set voltage threshold. To ensure that all the
TVDs are within the threshhold, lithium iron phosphate cells are clustered into the
group with similar characteristics and the cells in the same group are used to build the
sorted battery pack. The experimental results on pulse current discharge and current
profiles based on both urban dynamometer driving schedules (UDDSs) and an
underground mine driving cycle (UMDC) on the sorted battery pack are reported to
verify the effectiveness of the proposed HIO for pack SOC estimation for UMEVs.
5.1 Introduction
With the progressively tightening emission controls in underground mines, the
electrification of personnel carrier vehicles for underground mines has attracted
increasing attention, as electric vehicles (EVs) provide the significant advantages of low
noise and zero emissions over diesel engine vehicles [2]. EVs currently use lithium-ion
batteries as their main power source due to their high energy and power density, long
cycle life and low self-discharge rate [29]. To meet the voltage and current requirements
of EVs, hundreds and thousands of lithium-ion battery cells are required to be
connected in series and parallel to build a battery pack. In such battery packs, state of
charge (SOC) estimation is crucial to maintain the performance of the battery pack and
94
CHAPTER 5 BATTERY PACK STATE-OF-CHARGE ESTIMATION WITH H INFINITY OBSERVER
ensure the safe operation of EVs. This is very challenging due to the inconsistencies of
the cells in the pack.
A number of SOC estimation methods have been proposed, and each method has merits
in certain aspects. Generally, SOC estimation methods for a single cell can be
categorized into three types. One of the most applicable types is an ampere-hour
counting method which integrates the current over time, based on the current
measurement [50, 109]. It is the simplest SOC estimation method. The second type of
SOC estimation methods is to apply machine learning techniques, such as artificial
neural networks, fuzzy logic and the support vector machine [74, 75, 110]. They can be
applied to any types of batteries without the requirement of battery models. The third
type is model-based SOC estimation methods, such as the Kalman filter, sliding mode
observer, and H-infinity observer [54, 55, 62, 65, 91]. Model-based SOC estimation
methods are the most popular, due to the merits of the closed-loop, online and available
feed-back of the dynamic estimation error.
Studies of battery pack SOC estimation taking cell inconsistencies into account have
been carried out recently. Plett [111] introduced a method named “bar-delta filtering” to
estimate pack SOC by utilizing the similarity of the cell characteristics in the pack and
the average pack SOC. Liu et al. [112] propose a minimum voltage (V-min) model
which uses the minimal voltage of cell in the pack as the pack voltage to estimate pack
SOC using the extended Kalman filter (EKF). Roscher et al. [14] incorporate the
measured and derived impedance data to estimate the pack SOC. Dai et al. [113] apply
the EKF to estimate cell SOCs in the pack based on the differences between the average
pack SOC and the SOC differences among the cells in the pack. Kim et al. [45] propose
an improved EKF to estimate the pack SOC, where a systematic cell filtering approach
is used to choose cells with similar electro-chemical characteristics to build a sorted
95
CHAPTER 5 BATTERY PACK STATE-OF-CHARGE ESTIMATION WITH H INFINITY OBSERVER
battery pack. Xiong et al. [114] adopt a similar cell filtering approach to that in [17] to
build a sorted battery pack and apply the adaptive EKF to improve the accuracy of pack
SOC estimation. Later, Xiong et al. [115] integrate an online bias correction technique
and the adaptive EKF to estimate the cell SOC and pack SOC. Zhong et al. [116]
introduce the concept that the pack SOC depends on the SOCs of the first over-
discharged cell and the first over-charged cell in the pack, as these two cells limit the
available capacity of the pack. The unscented particle filter is then used to estimate the
SOCs of those two cells. Hua et al. [117] apply the nonlinear predictive filter to estimate
the SOC for the weakest cell in the pack and use this weakest cell SOC to represent the
pack SOC.
In this chapter, a systematic cell sorting approach based on a self-organizing map (SOM)
is used to cluster the cells into groups with similar characteristics and the cells in the
same group are connected in series to build a sorted battery pack. Based on the sorted
battery pack, an H-infinity observer (HIO) is proposed to estimate the pack SOC using
an average virtual cell (AVC) model. Compared with the other pack SOC estimation
methods, HIO for pack SOC estimation has no requirement of the assumption about the
noise while minimizing the worst statistical case estimation error to achieve high
accuracy. Pack SOC estimation using the AVC model can save computation time and
provide fast SOC estimation for each individual cell in the pack.
This chapter is organized as follows. In Section 5.2, a model-based SOC estimation
method is proposed with the explanation of the HIO for battery pack SOC estimation.
Section 5.3 demonstrates the cell test, the SOM sorting approach and battery parameter
identification. Section 5.4 evaluates the effectiveness of the HIO for battery pack SOC
estimation, followed by the conclusion.
96

CHAPTER 5 BATTERY PACK STATE-OF-CHARGE ESTIMATION WITH H INFINITY OBSERVER
5.2 Battery Modeling and HIO for SOC Estimation
5.2.1 Battery modelling
The SOC describes the ratio of the remaining capacity to the nominal capacity of a
battery with its value between 0 to 100%. It can be expressed by
0
01 ( )
t
tt
s s I dQ
η t t= − ∫ (5.1)
where 0s denotes the initial SOC, Q represents the battery nominal capacity, η is the
coulombic efficiency and is normally taken as one for discharge, and ( )I t is the
instantaneous current (assuming the discharge to be positive). The time derivative of the
SOC ts gives
( )ts IQη t= − (5.2)
Of all the battery equivalent circuit models (BECMs), the Thevenin model is widely
accepted to describe the dynamic characteristics of a lithium-ion battery, and is adopted
in this study, as shown in Fig. 5-1. According to the Kirchhoff voltage law, the
electrical behaviours of the battery in terms of this model can be expressed as
t o p iV V V IR= − − (5.3)
1p p
p p p
IV VC R C
= − + (5.4)
where Vo represents the open circuit voltage (OCV) which is directly related to the
SOC, I is the load current, Vt is the terminal voltage of the battery, Ri denotes the
internal ohmic resistance, Rp is the polarization resistance and Cp is the polarization
97
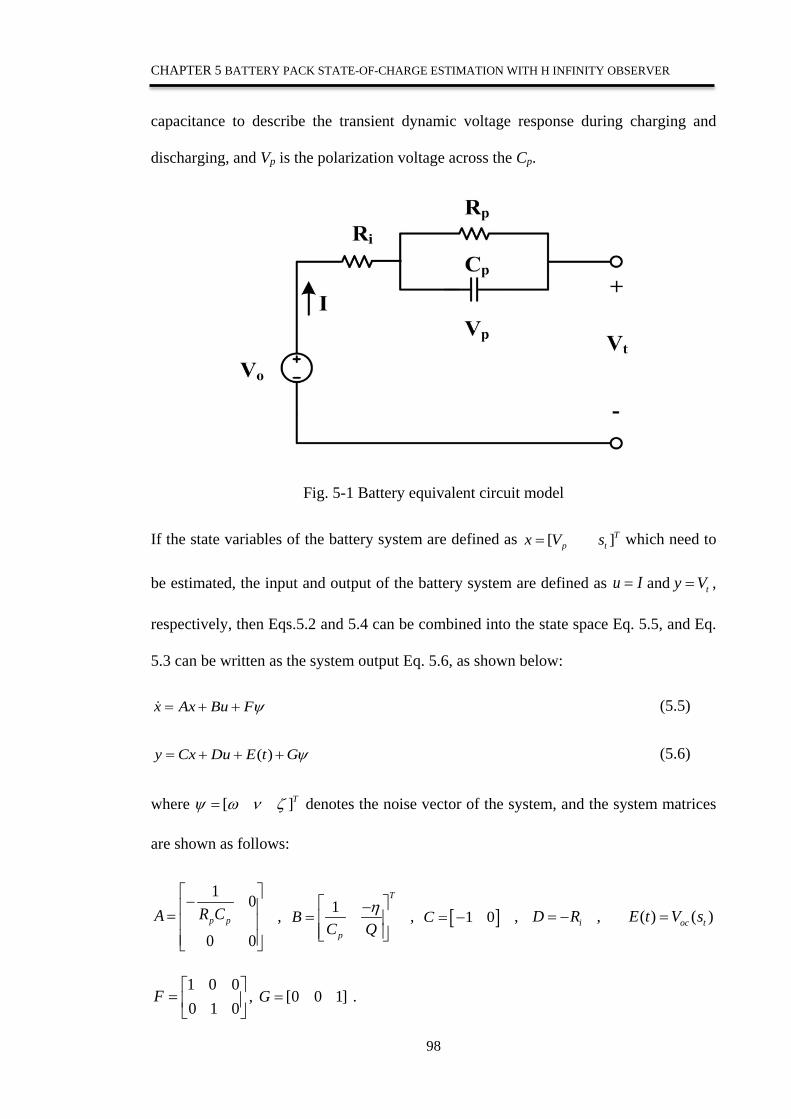
CHAPTER 5 BATTERY PACK STATE-OF-CHARGE ESTIMATION WITH H INFINITY OBSERVER
capacitance to describe the transient dynamic voltage response during charging and
discharging, and Vp is the polarization voltage across the Cp.
Fig. 5-1 Battery equivalent circuit model
If the state variables of the battery system are defined as [ ]Tp tx V s= which need to
be estimated, the input and output of the battery system are defined as u I= and ty V= ,
respectively, then Eqs.5.2 and 5.4 can be combined into the state space Eq. 5.5, and Eq.
5.3 can be written as the system output Eq. 5.6, as shown below:
x Ax Bu Fψ= + + (5.5)
( )y Cx Du E t Gψ= + + + (5.6)
where [ ]Tψ ω ν ζ= denotes the noise vector of the system, and the system matrices
are shown as follows:
1 0
0 0p pR CA
− =
, 1T
p
BC Q
η −=
, [ ]1 0C = − , iD R= − , ( ) ( )oc tE t V s=
1 0 00 1 0
F =
, [0 0 1]G = .
98
CHAPTER 5 BATTERY PACK STATE-OF-CHARGE ESTIMATION WITH H INFINITY OBSERVER
5.2.2 H infinity observer technique for SOC estimation
H-infinity observer (HIO) has been used to solve the state estimation problems in linear
and nonlinear systems. Compared with the KF, the HIO requires no prior knowledge of
noise statistics. It can minimize the effect of the worst possible disturbances on the
estimation errors and hence it is more robust against model uncertainty [118].
Based on Eqs.5.5 and 5.6, the HIO can be expressed as
ˆ ˆ ˆ( )x Ax Bu K y y= + + − (5.7)
ˆ ˆ ( )y Cx Du E t= + + (5.8)
where K is the observer gain, and x , y are the estimation values of x and y ,
respectively. The estimation errors of the state and output are defined as
ˆ ˆx ye x x e y y= − = − (5.9)
Eq. 5.9 leads to the error dynamics
( ) ( )x xe A KC e F KG ψ= − + − (5.10)
y xe Ce Fψ= + (5.11)
The aim of the HIO design for the system represented by Eqs.5.5 and 5.6 is as follows:
for a given attenuation level 0γ > , find the observers of Eqs.5.7 and 5.8 such that the
corresponding error dynamics (Eqs.5.10 and 5.11) are asymptotically stable and satisfy
the following inequality under the zero initial conditions:
xe γ ψ< (5.12)
The linear matrix inequality (LMI) approach in the MATLAB Toolbox [119] can easily
be used to solve Eq. 5.12 to obtain the attenuation termγ .
99
CHAPTER 5 BATTERY PACK STATE-OF-CHARGE ESTIMATION WITH H INFINITY OBSERVER
According to the robust control theory, the system is stable if there exists a positive
definite matrix 0TP P= > and a matrix X with a proper dimension such that the
following inequality is satisfied:
2 0( )
T T T
T
PF XGA P C X PA XC IIPF XG γ
− − + − +< −−
(5.13)
where P and X can be solved by using the function min cx solver and the feasp solver
in the LMI MATLAB Toolbox, then observer gain can be computed by 1K P X−= .
5.2.3 Battery pack SOC and cell individual SOC estimation
Battery packs in EVs normally consist of hundreds of cells connected in series. Their
diversities lead to the differences of the terminal voltage in each cell in the pack. Based
on the relationship of the terminal voltage and the SOC of each cell, the average virtual
cell (AVC) model is defined and the SOC of the AVC model is estimated to represent
the pack SOC. The terminal voltage of the AVC tnV is
/tn tV V n= (5.14)
where n denotes the number of cells connected in series in the pack. The terminal
voltage difference (TVD) between the ith cell in the pack and the AVC is defined as
i it tnV V V∆ = − (5.15)
Depending on the value of the TVD, the SOC estimation of the pack and each cell will
be carried out in the following two ways:
• when the TVDs iV∆ of all cells in the pack are less than the pre-set voltage
threshold, which is normally for the sorted battery pack, the terminal voltage of
the AVC tnV is used to estimate the pack SOC based on the HIO, and this pack 100

CHAPTER 5 BATTERY PACK STATE-OF-CHARGE ESTIMATION WITH H INFINITY OBSERVER
SOC also represents the SOC of each individual cell in the pack. This will
significantly save computation time.
• When the TVD iV∆ of one cell in the pack (e.g, the kth cell) is larger than the
pre-set threshold, the SOC estimation can be divided into two steps. The first
step is to estimate the SOC for that cell individually using the terminal voltage
ktV of that cell. The second step is to calculate the terminal voltage of the AVC
for the battery pack not including the kth cell using the equation
( 1) ( ) / ( 1)t n t ktV V V n− = − − , this terminal voltage ( 1)t nV − is then used to estimate the
SOC of the battery pack not including the kth cell. Similarly, if the TVDs iV∆
of the lth and mth cells are larger than the pre-set threshold, the SOCs of the lth
and mth cells will be estimated individually, then the pack SOC not including
the lth and mth cells can be estimated in the same manner as the pack not
including the kth cell. The above two steps can be repetitively applied to the
pack SOC and the SOCs of the cells the TVDs iV∆ of which are larger than the
pre-set threshold. The TVDs of the cells in the sorted battery pack gradually
become larger and exceed the pre-set threshold, since the cells in the pack are
exposed to different operational environments (e.g. temperature) and ageing
speeds with the increase of charging and discharging cycles.
5.3 Experiment and Parameter Identification
5.3.1 Experiment set-up
An experimental bench was established to validate the proposed HIO for pack SOC
estimation. As shown in Fig. 4-1, the test bench consisted of (1) the Arbin2000 battery
101
CHAPTER 5 BATTERY PACK STATE-OF-CHARGE ESTIMATION WITH H INFINITY OBSERVER
test, (2) an ESPEC temperature chamber, (3) a PC with Arbin Mits Pro software
installed. The LiFePO4 battery cells, which are widely used in EVs, were selected for
testing in this study. The cell has a nominal capacity of 2.3Ah and a nominal voltage of
3.3V. Based on the proposed method, the experimental data were used to firstly cluster
the cells for building the sorted battery pack, then identify the parameters of the battery
models and finally to verify the effectiveness of the proposed HIO for the pack SOC
estimation.
5.3.2 Battery sorting approach
The battery sorting approach based on a self-organizing map (SOM) was used to cluster
12 LiFePO4 battery cells to build a battery pack. Its details are explained in our previous
research work [120] and Chapter 4. In this sorting approach, the available capacity,
internal resistance and temperature variation of 12 cells are chosen as the input vectors
of the SOM, while the outputs of the SOM are three clusters which classify 12 cells into
three groups. Four cells in one of the groups with similar characteristics are selected to
connect in series to build a battery pack which is named the sorted battery pack in the
following sections.
5.3.3 Parameter identification
To obtain the BECM parameters in Fig. 1, the pulse current discharge (PCD) test was
conducted on the sorted battery pack at room temperature. In the PCD test, the sorted
battery pack in the fully charged state (SOC=100%) is discharged at 1C for 6 minutes
and then rested for 1 hour to allow the terminal voltage to reach its equilibrium state
where the terminal voltage is considered as the open circuit voltage (OCV). Each PCD at
1C discharge for 6 minutes is equivalent to approximately 10% of the nominal capacity
which equals the 10% SOC reduction. This process is repeated until the terminal voltage
102

CHAPTER 5 BATTERY PACK STATE-OF-CHARGE ESTIMATION WITH H INFINITY OBSERVER
reaches the cut-off voltage when the battery pack is fully discharged (SOC=0%). Figure
5-2 shows the discharge current profile and the corresponding terminal voltage. Figure 5-
3 shows the OCV versus the SOC of the sorted battery pack under the PCD test, where
the OCV versus the SOC is obtained by using the ampere-hour counting method based
on experimental data. Ten sets of transient responses in the terminal voltage correspond
to ten sets of the PCDs. Therefore, ten sets of the BECM parameters for different SOCs
and their relative mean square errors (RMSEs) between the BECM and the experimental
data are shown in Table 5-1.
Using the MATLAB LMI toolbox, the inequality Eq. 5.12 can be solved, the minimum
attenuation level of γ is 0.905. By selecting 1.55γ = , the estimation process is more
robust. Then,the matrix P and X can be obtained as
3.76 1.621.62 3.76
P−
= −
0.59212.1337
X =
and the observer gain
1 0.49360.7801
K P X− = =
.
103

CHAPTER 5 BATTERY PACK STATE-OF-CHARGE ESTIMATION WITH H INFINITY OBSERVER
Fig.5-2 Terminal voltage and current of sorted battery pack under PCD test
Fig.5-3 Experimental OCV-SOC relationship of LiFePO4 battery pack
104
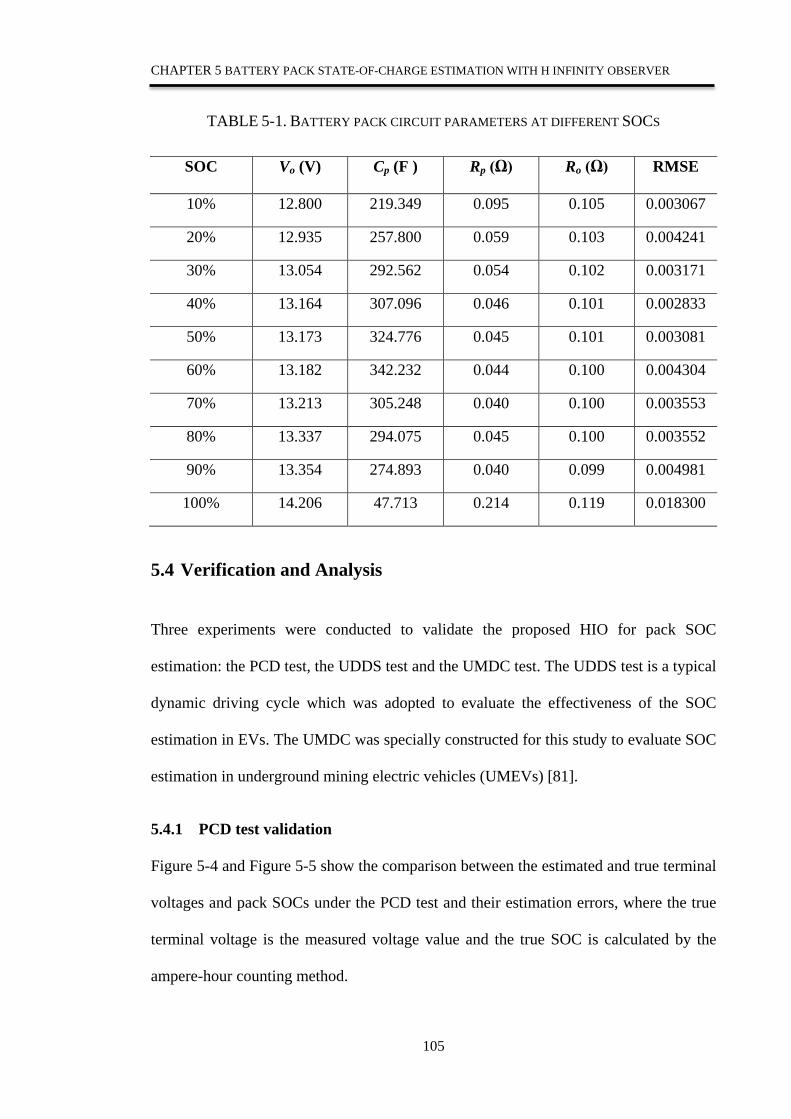
CHAPTER 5 BATTERY PACK STATE-OF-CHARGE ESTIMATION WITH H INFINITY OBSERVER
TABLE 5-1. BATTERY PACK CIRCUIT PARAMETERS AT DIFFERENT SOCS
SOC Vo (V) Cp (F ) Rp (Ω) Ro (Ω) RMSE
10% 12.800 219.349 0.095 0.105 0.003067
20% 12.935 257.800 0.059 0.103 0.004241
30% 13.054 292.562 0.054 0.102 0.003171
40% 13.164 307.096 0.046 0.101 0.002833
50% 13.173 324.776 0.045 0.101 0.003081
60% 13.182 342.232 0.044 0.100 0.004304
70% 13.213 305.248 0.040 0.100 0.003553
80% 13.337 294.075 0.045 0.100 0.003552
90% 13.354 274.893 0.040 0.099 0.004981
100% 14.206 47.713 0.214 0.119 0.018300
5.4 Verification and Analysis
Three experiments were conducted to validate the proposed HIO for pack SOC
estimation: the PCD test, the UDDS test and the UMDC test. The UDDS test is a typical
dynamic driving cycle which was adopted to evaluate the effectiveness of the SOC
estimation in EVs. The UMDC was specially constructed for this study to evaluate SOC
estimation in underground mining electric vehicles (UMEVs) [81].
5.4.1 PCD test validation
Figure 5-4 and Figure 5-5 show the comparison between the estimated and true terminal
voltages and pack SOCs under the PCD test and their estimation errors, where the true
terminal voltage is the measured voltage value and the true SOC is calculated by the
ampere-hour counting method.
105

CHAPTER 5 BATTERY PACK STATE-OF-CHARGE ESTIMATION WITH H INFINITY OBSERVER
It can be seen from Fig.5-5(a) that the SOC estimation only has a slight difference from
the true SOC. These results are obtained when the SOC is purposely set to the wrong
initial SOC of 82 percent, where the true initial SOC is 100 percent for the fully charged
battery pack. This indicates that the HIO can estimate the pack SOC accurately,
regardless of initial SOCs. The estimated SOC can track the true SOC and the errors
most of the time are maintained within 3%, as shown in Fig.5-5(b). The terminal
voltage errors between the estimated and experimental values are only within 5% for
most of the time, except at the initial state and the end of discharge, as shown in Fig.5-
4(b).
Fig.5-4 Comparison of terminal voltages estimated from HIO with those obtained from
experiments and their errors for sorted battery pack under PCD test (a).HIO estimated
pack voltage (b). Estimated voltage error
106

CHAPTER 5 BATTERY PACK STATE-OF-CHARGE ESTIMATION WITH H INFINITY OBSERVER
Fig.5-5. Comparison of SOCs estimated from HIO with those obtained from
experiments and their errors for sorted battery pack under PCD test (a). HIO estimated
pack SOC (b). SOC error
5.4.2 UDDS test validation
In Chapter 4 the UDDS cycle was used to do the validation. Figure 4-13 shows the
current profile of four cycles converted from the UDDS using the EV simulation progam
[80]. In this chapter, UDDS continues to be used to do the validation.
Figure 5-6 shows the comparison between the estimated and true terminal voltages and
pack SOCs under the UDDS test and their estimation errors, where the current profile
based on the UDDS is obtained using the EV simulation progam [80]. Due to the
107

CHAPTER 5 BATTERY PACK STATE-OF-CHARGE ESTIMATION WITH H INFINITY OBSERVER
regenerative characteristic in the UDDS, the estimated voltage is a little bit larger than
the true value which can be seen from Fig.5-6 (a). It can be seen from Fig. 5-7 (a) that
the estimated pack SOC can track the true pack SOC with the maximum SOC error
below 5%, as shown in Fig. 5-7(b) for the entire discharge period.
Fig.5-6. Comparison of terminal voltages estimated from HIO with those obtained from
experiments and their errors for sorted battery pack under UDDS test (a). HIO estimated
terminal voltage (b). Estimated voltage error
108

CHAPTER 5 BATTERY PACK STATE-OF-CHARGE ESTIMATION WITH H INFINITY OBSERVER
Fig. 5-7 Comparison of SOCs estimated from HIO with those obtained from
experiments and their errors for sorted battery pack under UDDS test (a).HIO estimated
pack SOC (b).estimated SOC error
As mentioned previously, when the TVDs iV∆ of all cells are less than the pre-set
threshold, the SOC of the AVC model can be used to represent the pack SOC. Figure 5-8
shows the comparison of the estimated SOC of a cell (e.g. cell one in the pack) and the
SOC of the AVC with the true pack SOC under the UDDS test. Due to the convergence
speed of HIO, the SOC error at high SOC value is little bit larger than that of low SOC
value. However, the estimated SOCs of both cell one and the AVCs are very close to the
true pack SOC with the error less than 5%, which is indicated by the small SOC
109
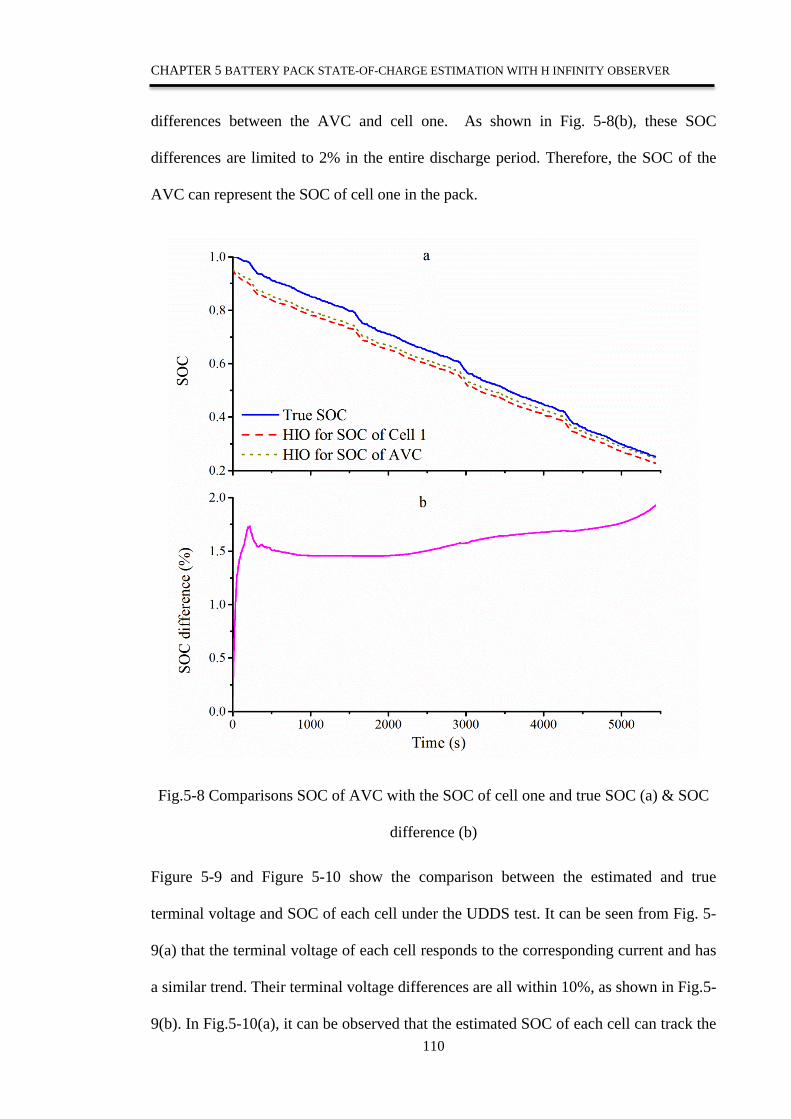
CHAPTER 5 BATTERY PACK STATE-OF-CHARGE ESTIMATION WITH H INFINITY OBSERVER
differences between the AVC and cell one. As shown in Fig. 5-8(b), these SOC
differences are limited to 2% in the entire discharge period. Therefore, the SOC of the
AVC can represent the SOC of cell one in the pack.
Fig.5-8 Comparisons SOC of AVC with the SOC of cell one and true SOC (a) & SOC
difference (b)
Figure 5-9 and Figure 5-10 show the comparison between the estimated and true
terminal voltage and SOC of each cell under the UDDS test. It can be seen from Fig. 5-
9(a) that the terminal voltage of each cell responds to the corresponding current and has
a similar trend. Their terminal voltage differences are all within 10%, as shown in Fig.5-
9(b). In Fig.5-10(a), it can be observed that the estimated SOC of each cell can track the 110

CHAPTER 5 BATTERY PACK STATE-OF-CHARGE ESTIMATION WITH H INFINITY OBSERVER
true SOC with their maximum SOC differences between each cell and the AVC below
5%, as shown in Fig.5-10(b).
Fig.5-9 Comparison of terminal voltages estimated from HIOs with those obtained from
experiments for each of four cells and their differences for sorted battery pack under
UDDS test (a). Observed voltage (b).voltage difference
111

CHAPTER 5 BATTERY PACK STATE-OF-CHARGE ESTIMATION WITH H INFINITY OBSERVER
Fig.5-10 Comparison of SOC estimated from HIOs with those obtained from
experiments for each of four cells and their differences for sorted battery pack under
UDDS test (a).HIO for cell SOC (b).SOC error
5.4.3 UMDC test validation
The underground mine road consists of variable rolling resistance coefficients and
variable uphill/downhill gradients. The driving cycle in underground mines is different
from the existing standard driving cycles. Based on the data collected from Australian
mines, a single return trip of the UMEV to the mine workface is proposed, taking into
account the most severe conditions of the pit and drift in Australian mines [81]. The
underground mine driving cycle (UMDC) is constructed as a single return trip from the 112
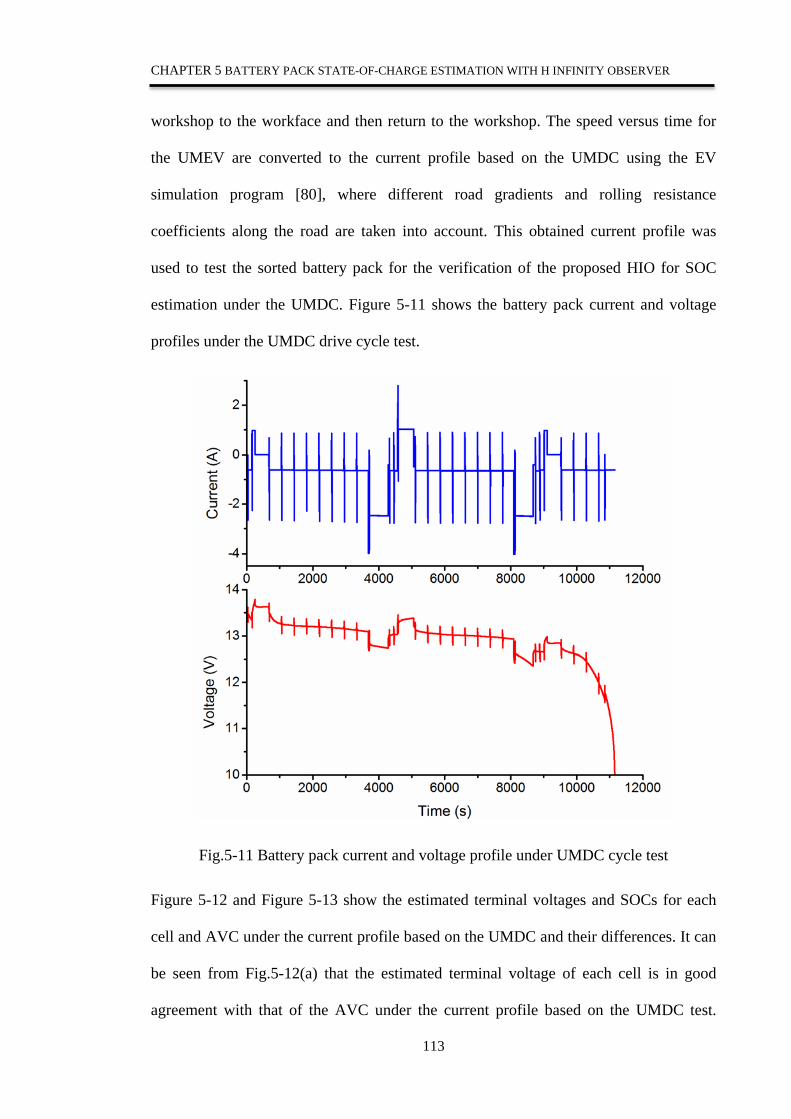
CHAPTER 5 BATTERY PACK STATE-OF-CHARGE ESTIMATION WITH H INFINITY OBSERVER
workshop to the workface and then return to the workshop. The speed versus time for
the UMEV are converted to the current profile based on the UMDC using the EV
simulation program [80], where different road gradients and rolling resistance
coefficients along the road are taken into account. This obtained current profile was
used to test the sorted battery pack for the verification of the proposed HIO for SOC
estimation under the UMDC. Figure 5-11 shows the battery pack current and voltage
profiles under the UMDC drive cycle test.
Fig.5-11 Battery pack current and voltage profile under UMDC cycle test
Figure 5-12 and Figure 5-13 show the estimated terminal voltages and SOCs for each
cell and AVC under the current profile based on the UMDC and their differences. It can
be seen from Fig.5-12(a) that the estimated terminal voltage of each cell is in good
agreement with that of the AVC under the current profile based on the UMDC test.
113

CHAPTER 5 BATTERY PACK STATE-OF-CHARGE ESTIMATION WITH H INFINITY OBSERVER
Their terminal voltage differences are within 10%, except for the last 10% SOC
discharge time.
Fig.5-12 Battery pack cell voltage variation and voltage difference under UMDC cycle
test (a).Observed voltage (b).Voltage difference
It can also be seen from Fig. 5-13(a) that the estimated SOC of each cell can track the
SOC of the AVC, as indicated by their small SOC differences between each cell and the
AVC less than 5%, as shown in Fig. 5-13(b).
114

CHAPTER 5 BATTERY PACK STATE-OF-CHARGE ESTIMATION WITH H INFINITY OBSERVER
Fig.5-13 Battery pack SOC estimation and error under UMDC cycle test (a). HIO for
cell SOC (b).SOC difference
5.4.4 Discussion
Based on the above three validation tests, the performance of the proposed HIO for pack
SOC estimation has been effectively verified in the sorted battery pack, where the TVDs
between each cell and the AVC is less than the pre-set voltage threshold. The results
show that the SOC of the AVC can be used to represent the pack SOC and the SOC of
each cell in the pack.
115

CHAPTER 5 BATTERY PACK STATE-OF-CHARGE ESTIMATION WITH H INFINITY OBSERVER
5.5 Conclusion
This chapter has presented the H-infinity observer (HIO) for pack SOC estimation in
underground mine electric vehicles (UMEVs). Lithium iron phosphate battery cells
have been selected to conduct the experiments in this study. They were first sorted into
groups with similar characteristics and then the sorted cells were connected in series to
build the battery pack. Based on the sorted battery pack, the average virtual cell (AVC)
model is defined and the SOC of the AVC is estimated to represent the pack SOC. The
experimental results of the sorted battery pack under pulse current discharge and current
profiles based on UDDS and UMDC were used to verify the performance of the
proposed HIO for the pack SOC estimation. The results show that the proposed
approach has robust tracking capability of the pack SOC under the operational
conditions of the UMEV.
116

CHAPTER 6 CONCLUSIONS
CHAPTER 6 CONCLUSIONS
In this chapter, the contributions of the current work are highlighted and summarized.
In addition, some research topics are proposed for future research.
6.1 Summary of Contributions
The battery management system (BMS) for EVs is a very broad and complex topic. In
the present thesis, the BMS for underground mine electric vehicles (UMEVs) has been
investigated. Given the special road conditions and the heavy weight of UMEVs,
battery selection is important for the UMEV battery system, and the hybrid simulation
method has been used for battery selection in this study. To alleviate the inconsistency
of the cells in the battery pack, a new battery sorting method is proposed to cluster the
cells into groups to make battery packs for UMEVs. The most important part of the
BMS is the state of charge (SOC) estimation of the battery pack. A new pack SOC
estimation approach based on H infinity observer is proposed using the average virtual
cell (AVC) model.
The key contributions of the thesis are summarized as follows.
In Chapter 3, a hybrid simulation method is proposed for the selection of battery
systems for UMEVs. The dynamic model of a four wheel drive UMEV has been
developed by modifying the existing EV model in the ADVISOR platform. The
experimental results of the four battery systems were integrated with the battery model
used in the UMEV to compare and evaluate battery performance in the UMEV. A
specifically designed driving cycle with diverse rolling resistance coefficients and
variable uphill/downhill gradients for underground mines has been adopted as the load
117
CHAPTER 6 CONCLUSIONS
for the UMEV. The simulation of the UMEV was performed under the underground
mine driving cycle. The results show that the best option for UMEVs is the battery
system which is made of A123 20Ah LiFePO4 batteries.
In Chapter 4, a self-organizing map (SOM)-based cell clustering method is proposed to
cluster the cells to alleviate the inconsistency of the cells in the battery pack. The
experimental results of 12 LiFePO4 cells were analysed to extract the parameters of the
available capacity, internal resistance and temperature variation. These parameters were
adopted as the input vectors for the SOM, and the output of the SOM clusters the cells
into three groups. The cells in the same group were chosen to build a sorted battery pack
which was then compared with the unsorted battery pack. The consistency of the sorted
battery pack was tested and evaluated, and the results show that it provides better
performance than the unsorted battery pack, thereby verifying the effectiveness of the
proposed method for cell clustering.
In Chapter 5, an H infinity observer-based SOC estimation method for battery packs is
proposed based on the adoption of the concept of an average voltage cell (AVC) model.
The terminal voltage of the AVC was used to estimate the pack SOC in the estimation
process. The differences of the terminal voltage of each cell in the pack and the AVC
were set as the terminal voltage differences (TVDs) and these TVDs are less than the
pre-set value with the proposed cell clustering method in this study. When the TVD of
one cell is more than the pre-set value, this cell’s SOC is estimated based on its own
terminal voltage. The performance of the proposed approach for the pack SOC
estimation was verified under the UDDS and the specifically designed underground
mine driving cycle. The results show that the proposed method has robust tracking
capability for the pack SOC estimation in the operating conditions of UMEVs.
118
CHAPTER 6 CONCLUSIONS
6.2 Future Research
The following topics related to the battery management system are proposed for future
research.
6.2.1 Battery thermal management
Battery temperature affects the availability of battery discharge power, energy and
charge acceptance during energy recovery from regenerative braking. Temperature also
affects the life of the battery [121, 122]. Therefore, batteries should ideally operate
within a certain temperature range that is optimum for performance and life. The
desirable operating temperature range of the LiFePO4 battery is 20°C to 45°C [123,
124]. In addition to considering the temperature of a battery pack, uneven temperature
distribution in a pack should also be considered [124, 125]. Temperature variations
from cell to cell in a pack could lead to different charge/discharge behaviours for each
cell. This, in turn, could lead to electrically unbalanced cells/packs, and reduced battery
pack performance. The unbalance and inconsistence of cells will cause safety issues and
affect the cycle life of the battery pack. Equalization for battery pack is necessary to
prevent the enlargement of the inconsistence in cell capacity and temperature and can be
used to ensure the lifetime of the battery pack to be extended [126-131]. And the goal of
a thermal management system is to deliver a battery pack at an optimum average
temperature with even temperature distribution.
6.2.2 Battery state of health estimation
The battery state of health (SOH) reflects the general condition of a battery and its
ability to deliver the specified performance compared with a new battery [132, 133].
With the increasing number of cycles, the inconsistence of each battery in the pack can
cause the reduction in the battery pack capacity and the SOH of the battery pack will be
119
CHAPTER 6 CONCLUSIONS
reduced [134]. However, if the SOM is used to sort the cells into a group based on the
experimental data of the aging cells, this SOM will be still effective. The battery SOH
condition can be determined by the capacity, internal resistance, power density, self-
discharge rate and other battery parameters. It can be obtained by comparing the
parameters at the current states with those of a new or healthy battery. For example, in
the case of battery capacity, it is not easy to estimate battery capacity online because the
battery needs to be fully charged and fully discharged when carrying out capacity
estimation.
The SOH estimation methods currently available include the durability model-based
estimation method and the battery model-based parameter identification method [135-
140]. Similar to SOC estimation, EV battery pack SOH estimation is quite challenging
due to the number of cells connected in the pack which may produce inconsistent
behaviours.
6.2.3 Fault diagnosis in battery packs
Fault diagnosis has been applied in vehicles and other industrial applications for many
years. Compared with other mechanical and electrical systems, EVs are much more
complex due to electrochemical characteristics of lithium ion battery systems and
hysteresis and inconsistency among the cells in the battery pack. As a result, fault
diagnosis for battery systems in EVs is challenging [141]. Since battery faults affect the
performance and life of EVs, early fault diagnosis of battery systems can reduce losses,
minimize maintenance fees and ensure vehicle performance, safety and reliability [142].
Therefore, fault diagnosis is one of the technologies necessary to ensure the safety of
battery packs.
120

CHAPTER 6 CONCLUSIONS
Faults in battery systems are mainly related to the following parameters: voltage,
current, temperature during battery charging and discharging [141]. Faults can occur
due to over-voltage or under-voltage, over-current or short circuits and abnormal
temperature [143]. Analysis of the durability, reliability and failure mode of lithium ion
batteries is crucial to guarantee cell quality and the safety of the battery pack. Fault
diagnosis functionality should be included in the BMS and provide early alarms of
unhealthy cells in the battery pack.
121

REFERENCES
REFERENCES
[1] C. C. Chan, "An overview of electric vehicle technology," Proceedings of the
IEEE, vol. 81, pp. 1202-1213, 1993.
[2] C. C. Chan, "The past, present and future of electric vehicle development," in
Proceedings of the IEEE 1999 International Conference on Power Electronics
and Drive Systems, vol.1, pp. 11-13, 1999.
[3] M. DeLuchi, Q. Wang, and D. Sperling, "Electric vehicles: Performance, life-
cycle costs, emissions, and recharging requirements," Transportation Research
Part A: General, vol. 23, pp. 255-278, 1989.
[4] D. Xu, L. Wang, and J. Yang, "Research on li-ion battery management system,"
in 2010 International Conference on Electrical and Control Engineering
(ICECE) , pp. 4106-4109, 2010.
[5] L. Lu, X. Han, J. Li, J. Hua, and M. Ouyang, "A review on the key issues for
lithium-ion battery management in electric vehicles," Journal of Power Sources,
vol. 226, pp. 272-288, 2013.
[6] A. c. G. Mary Bellis. (6th May). The Early Years, Electric cars from 1830 to
1930. Available: http://inventors.about.com/
[7] C.C. Chan, Modern electric vehicle technology, 2001.
[8] S. H. Robin Cowan. (1996, 6th May). Escaping Lock-in: the Case of the Electric
Vehicle Available: http://www.cgl.uwaterloo.ca/~racowan/escape.html
[9] L. Situ, "Electric Vehicle development: The past, present and future," in PESA
2009 3rd International Conference on Power Electronics Systems and
Applications, pp. 1-3, 2009.
122
REFERENCES
[10] D. L. B. Arnold R. Miller, "Advanced underground vehicle power and control
fuellcell mine locomotive," Proceeding of the 2002 U.S. DOE Hydrogen
Program Review, pp. 5-9, 2002.
[11] W. G. Oetringhaus, "Railless vehicle underground mining," United States Patent,
1985.
[12] M. A. Reyes and T. Novak, "Injury surveillance and safety considerations for
large-format, lead-acid batteries used in mining applications," in IEEE Industry
Applications Society Annual Meeting, pp. 1-7, 2014.
[13] Mining.com. (2012, March 13). Electric underground vechile revolutionizes the
mining industry. Available: http://www.mining.com/electric-underground-
vehicle-revolutionizes-the-mining-industry/
[14] M. A. Roscher, O. S. Bohlen, and D. U. Sauer, "Reliable state estimation of
multicell lithium-ion battery systems," IEEE Transactions on Energy Conversion,
vol. 26, pp. 737-743, 2011.
[15] D. D. Berndt, Maintenance-free batteries : lead-acid, nickel/cadmium,
nickel/hydride : a handbook of battery technology, 1997.
[16] (2016, 25/04). GE fairchild battery powered load haul dump. Available:
http://www.getransportation.com/mining/ge-fairchild-battery-powered-load-
haul-dump
[17] (25/04). MAC-12 AC 96V electric transporter. Available:
http://www.damascuscorp.com/vehicles/mac12.aspx
[18] S. A. H. K.E. Aifantis, and R.V. Kumar, "High energy density lithium batteries,
materials, engineering, applications," Germany: Wiley-VCH publisher, 2010.
123

REFERENCES
[19] D. Berndt, Maintenance-free batteries : lead-acid, nickel/cadmium,
nickel/hydride : a handbook of battery technology, Taunton, Somerset, England :
New York: Research Studies Press ; John Wiley, 1993.
[20] D. G. Enos, "Chapter 3 - Lead-acid batteries for medium- and large-scale energy
storage A2 - Menictas, Chris," in Advances in Batteries for Medium and Large-
Scale Energy Storage, M. Skyllas-Kazacos and T. M. Lim, Eds., Woodhead
Publishing, pp. 57-71, 2015.
[21] X. Zhang and C. Mi, Vehicle power management: modeling, control and
optimization. London: Springer London, 2011.
[22] D. A. J. Rand and P. T. Moseley, "Chapter 13 - Energy storage with lead–acid
batteries," in Electrochemical Energy Storage for Renewable Sources and Grid
Balancing, ed Amsterdam: Elsevier, pp. 201-222, 2015.
[23] J. Garche, P. T. Moseley, and E. Karden, "5 - Lead–acid batteries for hybrid
electric vehicles and battery electric vehicles," in Advances in Battery
Technologies for Electric Vehicles, ed: Woodhead Publishing, pp. 75-101, 2015.
[24] M. Fetcenko, J. Koch, and M. Zelinsky, "6 - Nickel–metal hydride and nickel–
zinc batteries for hybrid electric vehicles and battery electric vehicles A2 -
Scrosati, Bruno," in Advances in Battery Technologies for Electric Vehicles, J.
Garche and W. Tillmetz, Eds., ed: Woodhead Publishing, pp. 103-126, 2015.
[25] K. T. Chau, Y. S. Wong, and C. C. Chan, "An overview of energy sources for
electric vehicles," Energy Conversion and Management, vol. 40, pp. 1021-1039,
1999.
[26] W. H. Zhu, Y. Zhu, and B. J. Tatarchuk, "Self-discharge characteristics and
performance degradation of Ni-MH batteries for storage applications,"
International Journal of Hydrogen Energy, vol. 39, pp. 19789-19798, 2014.
124

REFERENCES
[27] W.X. Shen, T. Tu Vo, and A. Kapoor, "Charging algorithms of lithium-ion
batteries: An overview," in 2012 7th IEEE Conference on Industrial Electronics
and Applications (ICIEA), pp. 1567-1572, 2012.
[28] H. S. Ryu, H. J. Ahn, K. W. Kim, J. H. Ahn, K. K. Cho, and T. H. Nam, "Self-
discharge characteristics of lithium/sulfur batteries using TEGDME liquid
electrolyte," Electrochimica Acta, vol. 52, pp. 1563-1566, 2006.
[29] X. Chen, W. X. Shen, T. Tu Vo, Z. Cao, A. Kapoor, "An overview of lithium-
ion batteries for electric vehicles," presented at the The 10th International Power
and Energy Conference (IPEC 2012), pp. 230-235, 2012.
[30] I. Buchmann. (10th Dec). Battery university-Types of lithium-ion. Available:
http://batteryuniversity.com/learn/article/types_of_lithium_ion
[31] H. J. Bergveld, "Battery management systems design by modelling," Eindhoven
Philips Research Laboratories, 2001.
[32] B. Lawson. (10th Jan). Battery management systems (BMS). Available:
http://www.mpoweruk.com/bms.htm
[33] B. Kras, B. Polnik, and R. Konsek, "Suspended battery drivetrain as an example
of advanced control and safety system of li-ion battery pack technology in
mining industry," in 2013 World Electric Vehicle Symposium and Exhibition
(EVS27), pp. 1-8, 2013.
[34] M. Redelbach, E. D. Özdemir, and H. E. Friedrich, "Optimizing battery sizes of
plug-in hybrid and extended range electric vehicles for different user types,"
Energy Policy, vol. 73, pp. 158-168, 2014.
[35] B. Wahono, W. B. Santoso, A. Nur, and Amin, "Analysis of range extender
electric vehicle performance using vehicle simulator," Energy Procedia, vol. 68,
pp. 409-418, 2015.
125

REFERENCES
[36] C.-S. N. Shiau, C. Samaras, R. Hauffe, and J. J. Michalek, "Impact of battery
weight and charging patterns on the economic and environmental benefits of
plug-in hybrid vehicles," Energy Policy, vol. 37, pp. 2653-2663, 2009.
[37] V. H. Johnson, "Battery performance models in ADVISOR," Journal of Power
Sources, vol. 110, pp. 321-329, 2002.
[38] K. J. Kelly, " Modelling tools for predicting the impact of rolling resistance on
energy usage and fuel effieciency for realistic driving cycles," presented at the
International Tire Exhibition and Conference, 2002.
[39] D. W. Gao, C. Mi, and A. Emadi, " Modeling and simulation of electric and
hybrid vehicles," Proceedings of the IEEE, vol. 95, pp. 729-745, 2007.
[40] B. D. G. Z. Aymeric Rousseau, Justin Kern, John Anderson, Mike Duoba,
"Honda insight validation using PSAT", SAE Technical Paper 2001-01-2538,
2001
[41] F. Milano, "An open source power system analysis toolbox," in IEEE
Transactions on Power Systems, vol. 20, no. 3, pp. 1199-1206, 2005..
[42] Y. S. W. a. C. C. C. K. T. Chau, "EVSIM — A PC-based simulation tool for an
electric vehicle technology course," International Journal of Electrical
Engineering Education, vol. 04, pp.167-179, 2000
[43] J. Wang, Z. Sun, X. Wei, and H. Dai, "Lifespan uniformity for the battery pack
in the automotive application," Automotive Safety and Energy, vol. Vol. 2 No. 3,
pp.223-228, 2011.
[44] F. Wen, C. Lin, J. Jiang, and Z. Wang, "A new evaluation method to the
sonsistency of lithium-ion batteries in electric vehicles," in 2012 Asia-Pacific
Power and Energy Engineering Conference (APPEEC), pp. 1-4, 2012
126

REFERENCES
[45] J. Kim and B. H. Cho, "Screening process-based modeling of the multi-cell
battery string in series and parallel connections for high accuracy state-of-charge
estimation," Energy, vol. 57, pp. 581-599, 2013.
[46] L. Guo and G. W. Liu, "Research of lithium-ion battery sorting method based on
fuzzy C-means algorithm," Advanced Materials Research, pp.983-988 , 2011.
[47] B. Lawson. (10th Jan). State of charge (SOC) determination. Available:
http://www.mpoweruk.com/soc.htm
[48] I. Snihir, W. Rey, E. Verbitskiy, A. Belfadhel-Ayeb, and P. H. L. Notten,
"Battery open-circuit voltage estimation by a method of statistical analysis,"
Journal of Power Sources, vol. 159, pp. 1484-1487, 2006.
[49] M. A. Roscher and D. U. Sauer, "Dynamic electric behavior and open-circuit-
voltage modeling of LiFePO4-based lithium ion secondary batteries," Journal of
Power Sources, vol. 196, pp. 331-336, 2011.
[50] K. S. Ng, C.-S. Moo, Y.-P. Chen, and Y.-C. Hsieh, "Enhanced coulomb
counting method for estimating state-of-charge and state-of-health of lithium-ion
batteries," Applied Energy, vol. 86, pp. 1506-1511, 2009.
[51] H. He, R. Xiong, and J. Fan, "Evaluation of lithium-ion battery equivalent
circuit models for state of charge estimation by an experimental approach,"
Energies, vol. 4, pp. 582-598, 2011.
[52] G. L. Plett, "Extended Kalman filtering for battery management systems of
LiPB-based HEV battery packs: Part 1. Background," Journal of Power Sources,
vol. 134, pp. 252-261, 2004.
[53] G. L. Plett, "Extended Kalman filtering for battery management systems of
LiPB-based HEV battery packs: Part 2. Modeling and identification," Journal of
Power Sources, vol. 134, pp. 262-276, 2004.
127

REFERENCES
[54] G. L. Plett, "Extended Kalman filtering for battery management systems of
LiPB-based HEV battery packs: Part 3. State and parameter estimation," Journal
of Power Sources, vol. 134, pp. 277-292, 2004.
[55] G. L. Plett, "Sigma-point Kalman filtering for battery management systems of
LiPB-based HEV battery packs: Part 1: Introduction and state estimation,"
Journal of Power Sources, vol. 161, pp. 1356-1368, 2006.
[56] G. L. Plett, "Sigma-point Kalman filtering for battery management systems of
LiPB-based HEV battery packs: Part 2: Simultaneous state and parameter
estimation," Journal of Power Sources, vol. 161, pp. 1369-1384, 2006.
[57] H. He, R. Xiong, X. Zhang, F. Sun, and J. Fan, "State-of-charge estimation of
the lithium-ion battery using an adaptive extended Kalman filter based on an
improved Thevenin model," IEEE Transactions on Vehicular Technology, vol.
60, pp. 1461-1469, 2011.
[58] J. Wang, J. Guo, and L. Ding, "An adaptive Kalman filtering based State of
Charge combined estimator for electric vehicle battery pack," Energy
Conversion and Management, vol. 50, pp. 3182-3186, 2009.
[59] S. Sepasi, R. Ghorbani, and B. Y. Liaw, "Improved extended Kalman filter for
state of charge estimation of battery pack," Journal of Power Sources, vol. 255,
pp. 368-376, 2014.
[60] F. Sun, X. Hu, Y. Zou, and S. Li, "Adaptive unscented Kalman filtering for state
of charge estimation of a lithium-ion battery for electric vehicles," Energy, vol.
36, pp. 3531-3540, 2011.
[61] R. Xiong, X. Gong, C. C. Mi, and F. Sun, "A robust state-of-charge estimator for
multiple types of lithium-ion batteries using adaptive extended Kalman filter,"
Journal of Power Sources, vol. 243, pp. 805-816, 2013.
128
REFERENCES
[62] R. Xiong, H. He, F. Sun, and K. Zhao, "Evaluation on state of charge estimation
of batteries with adaptive extended Kalman filter by experiment approach,"
IEEE Transactions on Vehicular Technology, vol. 62, pp. 108-117, 2013
[63] S. S. Haykin, Kalman Filtering & Neural Networks. New York: John Wiley &
Sons, Inc. Engineering, 2001.
[64] X. Chen, W. X. Shen, M. Dai, Z. Cao, J. Jin, and A. Kapoor, "Robust adaptive
sliding mode observer using RBF neural network for lithium-ion battery state of
charge estimation in electric vehicles," IEEE Transactions on Vehicular
Technology, vol 65. , pp. 1936-1947, 2015.
[65] X. Chen, W. X. Shen, Z. Cao, and A. Kapoor, "A novel approach for state of
charge estimation based on adaptive switching gain sliding mode observer in
electric vehicles," Journal of Power Sources, vol. 246, pp. 667-678, 2014.
[66] N. Koirala, F. He, and W.X. Shen, "Comparison of two battery equivalent circuit
models for state of charge estimation in electric vehicles," in 2015 IEEE 10th
Conference on Industrial Electronics and Applications (ICIEA), pp. 17-22, 2015.
[67] C. Unterrieder, R. Priewasser, S. Marsili, and M. Huemer, "Battery state
estimation using mixed Kalman/H-infinity, adaptive Luenberger and sliding
mode observer," in 2013 IEEE Vehicle Power and Propulsion Conference
(VPPC), pp. 1-6, 2013.
[68] N. Abolhassani Monfared, N. Gharib, H. Moqtaderi, M. Hejabi, M. Amiri, F.
Torabi, et al., "Prediction of state-of-charge effects on lead-acid battery
characteristics using neural network parameter modifier," Journal of Power
Sources, vol. 158, pp. 932-935, 2006.
129

REFERENCES
[69] W. X. Shen, "State of available capacity estimation for lead-acid batteries in
electric vehicles using neural network," Energy Conversion and Management,
vol. 48, pp. 433-442, 2007.
[70] T. Weigert, Q. Tian, and K. Lian, "State-of-charge prediction of batteries and
battery–supercapacitor hybrids using artificial neural networks," Journal of
Power Sources, vol. 196, pp. 4061-4066, 2011.
[71] C. Hametner and S. Jakubek, "State of charge estimation for Lithium Ion cells:
Design of experiments, nonlinear identification and fuzzy observer design,"
Journal of Power Sources, vol. 238, pp. 413-421, 2013.
[72] M. Charkhgard and M. Farrokhi, "State-of-charge estimation for lithium-ion
batteries ssing neural networks and EKF," IEEE Transactions on Industrial
Electronics, vol. 57, pp. 4178-4187, 2010.
[73] J. N. Hu, J. J. Hu, H. B. Lin, X. P. Li, C. L. Jiang, X. H. Qiu, et al., "State-of-
charge estimation for battery management system using optimized support
vector machine for regression," Journal of Power Sources, vol. 269, pp. 682-693,
2014.
[74] T. Hansen and C. J. Wang, "Support vector based battery state of charge
estimator," Journal of Power Sources, vol. 141, pp. 351-358, 2005.
[75] W. X. Shen, C. C. Chan, E. W. C. Lo, and K. T. Chau, "A new battery available
capacity indicator for electric vehicles using neural network," Energy
Conversion and Management, vol. 43, pp. 817-826, 2002.
[76] J. P. Aditya and M. Ferdowsi, "Comparison of NiMH and Li-ion batteries in
automotive applications," in IEEE Vehicle Power and Propulsion Conference,
pp. 1-6, 2008.
130

REFERENCES
[77] L. Antti., "Evaluation of energy storage system requirements for hybrid mining
loader," in IEEE Vehicle Power and Propulsion Conference (VPPC), pp. 1-6,
2011.
[78] K. B. Wipke, M. R. Cuddy, and S. D. Burch, "ADVISOR 2.1: a user-friendly
advanced powertrain simulation using a combined backward/forward approach,"
IEEE Transactions on Vehicular Technology, vol. 48, pp. 1751-1761, 1999.
[79] A. C. Baisden and A. Emadi, "ADVISOR-based model of a battery and an ultra-
capacitor energy source for hybrid electric vehicles," IEEE Transactions on
Vehicular Technology, vol. 53, pp. 199-205, 2004.
[80] R. C. Kroeze and P. T. Krein, "Electrical battery model for use in dynamic
electric vehicle simulations," in IEEE Power Electronics Specialists Conference,
pp. 1336-1342, 2008.
[81] F. He, X. Cui, W. X. Shen, A. Kapoor, D. Honnery, and D. Dayawansa,
"Modelling of electric vehicles for underground mining personnel transport," in
8th IEEE Conference on Industrial Electronics and Applications (ICIEA), pp.
870-875, 2013.
[82] J. Larminie and J. Lowry: ‘Electric vehicle technology explained’, Wiley, 2003.
[83] T. D. Gillespie. (1992). Fundamentals of vehicle dynamics. Available:
https://books.google.com.au/books?id=L6xd0nx5KbwC
[84] W. W. Marr, W. J. Walsh, and P. C. Symons, "Modeling battery performance in
electric vehicle applications," Energy Conversion and Management, vol. 33, pp.
843-847, 1992.
[85] H. He, R. Xiong, H. Guo, and S. Li, "Comparison study on the battery models
used for the energy management of batteries in electric vehicles," Energy
Conversion and Management, vol. 64, pp. 113-121, 2012.
131
REFERENCES
[86] M. Einhorn, F. V. Conte, C. Kral, and J. Fleig, "Comparison, selection, and
parameterization of electrical battery models for automotive applications," IEEE
Transactions on Power Electronics, vol. 28, pp. 1429-1437, 2013.
[87] Y. Xing, W. He, M. Pecht, and K. L. Tsui, "State of charge estimation of
lithium-ion batteries using the open-circuit voltage at various ambient
temperatures," Applied Energy, vol. 113, pp. 106-115, 2014.
[88] Masiero, G., Ogasavara, M.H., Jussani, A.C., and Risso, M.L.: ‘Electric vehicles
in China: BYD strategies and government subsidies’, RAI Revista de
Administração e Inovação, 13, (1), pp. 3-11,2016.
[89] Z. Ma, J. Jiang, W. Shi, W. Zhang, and C. C. Mi, "Investigation of path
dependence in commercial lithium-ion cells for pure electric bus applications:
Aging mechanism identification," Journal of Power Sources, vol. 274, pp. 29-40,
2015.
[90] W. X. Shen, T. T. Vo, and A. Kapoor, "Charging algorithms of lithium-ion
batteries: An overview," in 7th IEEE Conference on Industrial Electronics and
Applications (ICIEA), pp. 1567-1572, 2012.
[91] X. Chen, W. X. Shen, Z. Cao, and A. Kapoor, "Adaptive gain sliding mode
observer for state of charge estimation based on combined battery equivalent
circuit model," Computers & Chemical Engineering, vol. 64, pp. 114-123, 2014.
[92] T.-K. Lee;, Y. Kim;, D. M. Rizzo;, and Z. S. Filipi, "Battery power management
in heavy-duty HEVs based on the estimated critical surface charge,"
International Journal of Vehicle Design, vol.61, No.1/2/3/4, pp.108-127, 2013.
[93] X. Hu, R. Xiong, and B. Egardt, "Model-based dynamic power assessment of
lithium-ion batteries considering different operating conditions," IEEE
Transactions on Industrial Informatics, vol. 10, pp. 1948-1959, 2014.
132

REFERENCES
[94] Y. Zou, X. Hu, H. Ma, and S. E. Li, "Combined state of charge and state of
health estimation over lithium-ion battery cell cycle lifespan for electric
vehicles," Journal of Power Sources, vol. 273, pp. 793-803, 2015.
[95] M. Muratori;, M. Canova;, and Y. Guezennec, "A spatially-reduced dynamic
model for the thermal characterisation of Li-ion battery cells," International
Journal of Vehicle Design, vol. 58, No.2/3/4, , pp.134-158, 2012.
[96] H. Wang, K. Dong, G. Li, and F. Wu, "Research on the consistency of the power
battery based on multi-points impedance spectrum," in 2010 International Forum
on Strategic Technology (IFOST), pp. 1-4, 2010.
[97] J. Kim, J. Shin, C. Chun, and B. H. Cho, "Stable configuration of a Li-Ion series
battery pack based on a screening process for improved voltage/SOC balancing,"
IEEE Transactions on Power Electronics, vol. 27, pp. 411-424, 2012.
[98] R. Paolo, F. Leonardo, M. Adriano, C. Matteo, L. Sauro, F. Luca, et al.,
"Selection of lithium cells for EV battery pack using self-organizing map,"
Automotive Safety and Energy, vol. 2 No.2, p. 8, 2011.
[99] K. Fang, S. Chen, D. Mu, B. Wu, and F. Wu, "Investigation of nickel–metal
hydride battery sorting based on charging thermal behavior," Journal of Power
Sources, vol. 224, pp. 120-124, 2013.
[100] F. Trentini, M. Hagenbuchner, A. Sperduti, and F. Scarselli, "A Self-Organising
Map Approach for Clustering of XML Documents," in 2006 IJCNN
International Joint Conference on Neural Networks, pp. 1805-1812, 2006.
[101] J. Vesanto and E. Alhoniemi, "Clustering of the self-organizing map," IEEE
Transactions on Neural Networks, vol. 11, pp. 586-600, 2000.
133

REFERENCES
[102] X. Zhang, J. Chen, and J. Dong, "Color clustering using self-organizing maps,"
in 2007 ICWAPR International Conference on Wavelet Analysis and Pattern
Recognition, pp. 986-989, 2007.
[103] T. Kohonen, "The self-organizing map," Proceedings of the IEEE, vol. 78, pp.
1464-1480, 1990.
[104] T. Kohonen, E. Oja, O. Simula, A. Visa, and J. Kangas, "Engineering
applications of the self-organizing map," Proceedings of the IEEE, vol. 84, pp.
1358-1384, 1996.
[105] S. S. Haykin, Neural networks and learning machines, Prentice Hall, 2009.
[106] U. Seiddert and L. C. Jain, Self-organizing neural networks : recent advances
and applications. New York : Physica-Verlag, 2001.
[107] J. Xu, S. Li, C. Mi, Z. Chen, and B. Cao, "SOC based battery cell balancing with
a novel topology and reduced component count," Energies, vol. 6, pp. 2726-
2740, 2013.
[108] G. Hunt. USABC electric vehicle battery test procedures manual [Online].
Available: http://www.uscar.org/guest/article_view.php?articles_id=86
[109] H. Blanke, O. Bohlen, S. Buller, R. W. D. Doncker, B. Fricke, A. Hammouche,
et al., "Impedance measurements on lead-acid batteries for state-of-charge, state-
of-health and cranking capability prognosis in electric and hybrid electric
vehicles," Journal of Power Sources, vol. 144, pp. 418-425, 2005.
[110] W. X. Shen, C. C. Chan, E. W. C. Lo, and K. T. Chau, "Adaptive neuro-fuzzy
modeling of battery residual capacity for electric vehicles," IEEE Transactions
on Industrial Electronics, vol. 49, pp. 677-684, 2002.
134
REFERENCES
[111] G. L. Plett, " Efficient battery pack state estimation using bar-delta filtering,"
presented at The International Battery, Hybrid and Fuel Cell Electric Vehicle
Symposium (EVS24), Stavanger, Norway, 2009.
[112] X. Liu, Y. He, and Z. Chen, "State-of-charge estimation for power Li-ion battery
pack using Vmin-EKF," in 2010 2nd International Conference on Software
Engineering and Data Mining (SEDM) , pp. 27-31, 2010.
[113] H. Dai, X. Wei, Z. Sun, J. Wang, and W. Gu, "Online cell SOC estimation of Li-
ion battery packs using a dual time-scale Kalman filtering for EV applications,"
Applied Energy, vol. 95, pp. 227-237, 2012.
[114] R. Xiong, F. Sun, X. Gong, and H. He, "Adaptive state of charge estimator for
lithium-ion cells series battery pack in electric vehicles," Journal of Power
Sources, vol. 242, pp. 699-713, 2013.
[115] F. Sun, R. Xiong, and H. He, "A systematic state-of-charge estimation
framework for multi-cell battery pack in electric vehicles using bias correction
technique," Applied Energy, vol. 162, pp. 1399-1409, 2016.
[116] L. Zhong, C. Zhang, Y. He, and Z. Chen, "A method for the estimation of the
battery pack state of charge based on in-pack cells uniformity analysis," Applied
Energy, vol. 113, pp. 558-564, 2014.
[117] Y. Hua, A. Cordoba-Arenas, N. Warner, and G. Rizzoni, "A multi time-scale
state-of-charge and state-of-health estimation framework using nonlinear
predictive filter for lithium-ion battery pack with passive balance control,"
Journal of Power Sources, vol. 280, pp. 293-312, 2015.
[118] D. Simon, "Optimal state estimation Kalman, H infinity and nonlinear
approaches," N.J. Hoboken: Wiley-Interscience, 2006.
135
REFERENCES
[119] H. Li and M. Fu, "A linear matrix inequality approach to robust H infinity
filtering," IEEE Transactions on Signal Processing, vol. 45, pp. 2338-2350, 1997.
[120] F. He, W. X. Shen, Q. Song, A. Kapoor, D. Honnery, and D. Dayawansa, "Self-
organising map based classification of LiFePO4 cells for battery pack in EVs,"
International Journal of Vehicle Design, vol. 69, pp. 151-167, 2015.
[121] M. Debert, G. Colin, G. Bloch, and Y. Chamaillard, "An observer looks at the
cell temperature in automotive battery packs," Control Engineering Practice, vol.
21, pp. 1035-1042, 2013.
[122] Z. Rao and S. Wang, "A review of power battery thermal energy management,"
Renewable and Sustainable Energy Reviews, vol. 15, pp. 4554-4571, 2011.
[123] A. Marongiu, T. Pavanarit, and D. U. Sauer, "Influence of current and
temperature variation on a LiFePO4 battery total capacity," in 2013 World
Electric Vehicle Symposium and Exhibition (EVS27) , pp. 1-11, 2013.
[124] N. Yang, X. Zhang, B. Shang, and G. Li, "Unbalanced discharging and aging
due to temperature differences among the cells in a lithium-ion battery pack with
parallel combination," Journal of Power Sources, vol. 306, pp. 733-741, 2016.
[125] B. Wu, V. Yufit, M. Marinescu, G. J. Offer, R. F. Martinez-Botas, and N. P.
Brandon, "Coupled thermal–electrochemical modelling of uneven heat
generation in lithium-ion battery packs," Journal of Power Sources, vol. 243, pp.
544-554, 2013.
[126] F. Baronti, R. Roncella, and R. Saletti, "Performance comparison of active
balancing techniques for lithium-ion batteries," Journal of Power Sources, vol.
267, pp. 603-609, 2014.
136
REFERENCES
[127] J. Gallardo-Lozano, E. Romero-Cadaval, M. I. Milanes-Montero, and M. A.
Guerrero-Martinez, "Battery equalization active methods," Journal of Power
Sources, vol. 246, pp. 934-949, 2014.
[128] W. Han, L. Zhang, and Y. Han, "Computationally efficient methods for state of
charge approximation and performance measure calculation in series-connected
battery equalization systems," Journal of Power Sources, vol. 286, pp. 145-158,
2015.
[129] Y. Wang, C. Zhang, Z. Chen, J. Xie, and X. Zhang, "A novel active equalization
method for lithium-ion batteries in electric vehicles," Applied Energy, vol. 145,
pp. 36-42, 2015.
[130] Y. Zheng, M. Ouyang, L. Lu, J. Li, X. Han, and L. Xu, "On-line equalization for
lithium-ion battery packs based on charging cell voltages: Part 2. Fuzzy logic
equalization," Journal of Power Sources, vol. 247, pp. 460-466, 2014.
[131] Y. Zheng, M. Ouyang, L. Lu, J. Li, X. Han, and L. Xu, "On-line equalization for
lithium-ion battery packs based on charging cell voltages: Part 1. Equalization
based on remaining charging capacity estimation," Journal of Power Sources,
vol. 247, pp. 676-686, 2014.
[132] H. Dai, X. Wei, and Z. Sun, "A new SOH prediction concept for the power
lithium-ion battery used on HEVs," in 2009 VPPC IEEE Vehicle Power and
Propulsion Conference, pp. 1649-1653, 2009.
[133] K. M. Tsang and W. L. Chan, "State of health detection for Lithium ion batteries
in photovoltaic system," Energy Conversion and Management, vol. 65, pp. 7-12,
2013.
137
REFERENCES
[134] L. Lu, X. Han, J. Li, J. Hua, and M. Ouyang, "A review on the key issues for
lithium-ion battery management in electric vehicles," Journal of Power Sources,
vol. 226, pp. 272-288, 2013.
[135] D. Andre, C. Appel, T. Soczka-Guth, and D. U. Sauer, "Advanced mathematical
methods of SOC and SOH estimation for lithium-ion batteries," Journal of
Power Sources, vol. 224, pp. 20-27, 2013.
[136] I. Baghdadi, O. Briat, P. Gyan, and J. M. Vinassa, "State of health assessment
for lithium batteries based on voltage–time relaxation measure," Electrochimica
Acta, vol. 194, pp. 461-472, 2016.
[137] Z. Guo, X. Qiu, G. Hou, B. Y. Liaw, and C. Zhang, "State of health estimation
for lithium ion batteries based on charging curves," Journal of Power Sources,
vol. 249, pp. 457-462, 2014.
[138] C. Lin, A. Tang, and W. Wang, "A Review of SOH Estimation Methods in
Lithium-ion Batteries for Electric Vehicle Applications," Energy Procedia, vol.
75, pp. 1920-1925, 2015.
[139] S. Torai, M. Nakagomi, S. Yoshitake, S. Yamaguchi, and N. Oyama, "State-of-
health estimation of LiFePO4/graphite batteries based on a model using
differential capacity," Journal of Power Sources, vol. 306, pp. 62-69, 2016.
[140] Y. Zou, X. Hu, H. Ma, and S. E. Li, "Combined state of charge and state of
health estimation over lithium-ion battery cell cycle lifespan for electric
vehicles," Journal of Power Sources, vol. 273, pp. 793-803, 2015.
[141] C. Wu, C. Zhu, Y. Ge, and Y. Zhao, "A review on fault mechanism and
diagnosis approach for Li-Ion batteries," Journal of Nanomaterials, vol.2015,
pp.1-9, 2015.
138

REFERENCES
[142] A. Barré, B. Deguilhem, S. Grolleau, M. Gérard, F. Suard, and D. Riu, "A
review on lithium-ion battery ageing mechanisms and estimations for
automotive applications," Journal of Power Sources, vol. 241, pp. 680-689, 2013.
[143] Y. Zheng, X. Han, L. Lu, J. Li, and M. Ouyang, "Lithium ion battery pack
power fade fault identification based on Shannon entropy in electric vehicles,"
Journal of Power Sources, vol. 223, pp. 136-146, 2013.
139

LIST OF PUBLICATIONS
1. Fengxian He, Xiudong Cui, W. X. Shen, A. Kapoor, Damon Honnery, Daya
Dayawansa , “Modelling of Electric Vehicles for Underground Mining Personnel
Transport “in Proceedings of the 2013 8th IEEE Conference on Industrial
Electronics and Applications (ICIEA 2013), Australia, 19-21 June, 2013, pp. 870-
875.
2. Fengxian He, W. X. Shen, Qiang Song, A. Kapoor, Damon Honnery, Daya
Dayawansa, “Clustering LiFePO4 cells for battery pack based on neural network in
EVs”, in Proceedings of the 2014 IEEE Conference and Expo on Transportation
Electrification Asia-Pacific (ITEC Asia-Pacific), Beijing, Aug. 31 -Sept. 3, 2014, pp.
1-5.
3. Fengxian He, W. X. Shen, Qiang Song, A. Kapoor, Damon Honnery, Daya
Dayawansa, “Self-organising map based classification of LiFePO4 cells for battery
pack in EVs”, International Journal of Vehicle Design, vol.69, pp.151-167. 2015.
4. Narayani Koirala, Fengxian He and W. X. Shen, “Comparison of two battery
equivalent circuit models for state of charge estimation in electric vehicles”, in
Proceeding of 2015 IEEE 10th Conference on Industrial Electronics and
Applications (ICIEA), 15-17 June, 2015, pp.17-22.
5. Fengxian He, W. X. Shen, A. Kapoor, Damon Honnery, Daya Dayawansa, “H
infinity observer based state of charge estimation for battery packs in electric
vehicles”, Accepted by 2016 IEEE 11th Conference on Industrial Electronics and
Applications (ICIEA).
6. Fengxian He, W. X. Shen, Xiudong Cui, A. Kapoor, Damon Honnery, Daya
Dayawansa, “Quantitative comparison for selection of LiFePO4 battery system in
140
underground mine electric vehicles”, submitted to IEEE Transactions on
Transportation Electrification, March, 2016.
7. Fengxian He, W. X. Shen, A. Kapoor, Damon Honnery, Daya Dayawansa, “State of
charge estimation for battery packs using H infinity observer in underground mine
electric vehicles”, submitted to SAE International Journal of Passage car, Electronic
& Electric System, May 2016.
8. Fengxian He, W. X. Shen,Daya Dayawansa, Damon Honnery, Rahul Rao, Travis
Leenaerts: ‘Battery Management System for a Compact Electric Personnel Transport
Vehicle for Underground Coal Mines’, Final report for ARC Linkage Project
(LP110200302), 28 pages, March, 2016.
141