Energy Management Strategy - Gloucester and Building... · Energy Management Strategy . ... the...
16
Transcript of Energy Management Strategy - Gloucester and Building... · Energy Management Strategy . ... the...


Energy Management Strategy
Gloucester’s Energy Management Strategy sets out the way for the organisation to measure and manage all the energy and water resources it uses. The main areas it looks at are gas, electricity and water use in buildings along with any other fuels used in delivering the Council’s services, this includes fleet vehicle fuel use.
The main reasons for doing this are to reduce cost by saving on energy and water resources used, but there are wider environmental reasons for reducing energy use as it helps to reduce the Council’s impact on climate change. The Council has a leadership role within the local community in so far as it must set an example of good practice and high standards and act as a model for other public sector organisations and large and small private businesses.
As a Local Authority responsible for a large and varied property portfolio with many of its buildings such as the City Museum, Guildhall and GL1 Leisure Centre open to the public, it is important that these buildings are managed effectively and efficiently. Energy use is one of the main costs involved in maintaining our operational buildings, part of running a good organisation is keeping on top of energy costs. Gloucester City Council also has a duty as a community leader and enforcement agency in setting an example of good practice within its own estate.
In delivering its services to the community the City Council also uses energy through its fleet vehicles and through staff travel, the types of vehicle and fuel used also have impacts on air quality and emissions to the atmosphere. The revised and updated energy strategy sets out how we will work to manage our energy use over the next five years. In order to do this we will continue to invest in our buildings where this can reduce our energy use and seek out and research further opportunities to both generate renewable energy from our buildings and land. We will also record and report all fleet vehicle fuel use and water costs, and seek ways to reduce these. Where possible we will also use fuels which have a lower level of harmful CO2, emissions and particulates.
We will increase the awareness of energy as a key cost factor among all our staff at all levels and develop through sub-metering much more local accountability for local energy costs in our buildings. The 2012-16 Action Plan set out below sets out short medium and long term actions to achieve our objectives of making the Council’s energy management effective.
The Gloucester City Energy Management Strategy was first produced in 2003 and formally adopted by Council in that year. It was produced by a team of officers who analysed all of the City Council’s energy use and set in place a number of practical projects to reduce energy use across the estate following advice from the Carbon Trust and Department of Climate Change. In order to implement this, a steering group was established which reports to Cabinet annually on progress together with a network of energy champions to encourage all staff to actively reduce the energy they used in the workplace. The Carbon Trust carried out surveys of the Council’s main buildings and produced reports with recommendations for energy saving measures. In the intervening period a number of these ‘invest to save’ projects have been delivered. The officer steering group was re-launched as the Energy Action Delivery Group in 2011 and has now taken on the role of being the delivery vehicle for the Council’s energy policy. It reports to Asset Management Group bi-monthly and annually to

Cabinet on progress towards the strategy targets. The current strategy also responds to the 2012 KPMG Audit Report which made a number of recommendations for improvement of the Council’s energy management, these have all been adopted in the revised action plan
The Council’s Priorities
This section sets out the reference points where the energy strategy links up with the Council’s formally adopted policies; The Councils overall vision for Gloucester as set out in the Council’s Corporate Plan 2011-14 which sets out to ‘Create pride in our city’ and work towards ‘a greener cleaner city’. “This will be done by reducing CO2 emissions per head in Gloucester’s administrative area and by implementing a number of environmental schemes.”
By showing community leadership in the way the Council manages its own impact on CO2 emissions by steadily reducing the Council’s energy use in all buildings and in its operational vehicles where this will not impact on comfort or effectiveness of service. In demonstrating good husbandry of resources whenever we design operate and improve our buildings is also vital. Innovation and lifetime planning for new construction projects and plant operations is important as short term savings can have an impact with high long term operational costs and energy use particularly in new buildings.
The Corporate Plan also commits “to implement our Climate Change Strategy leading by example and encouraging others to do their bit”. There are the guiding principles of considering people, place and prosperity and it states “we will consider the impact on the environment of everything we do”.
In the Council’s Climate Change Strategy 2008-11 the Council makes the following commitments; to value environmental responsibility, to maximise the reduction of greenhouse gas emissions and to increase the amount of electricity that is generated in Gloucester from low carbon or renewable resources.
Background
Gloucester City Council is a relatively small district authority with a range of operational buildings which include the four warehouse offices in the Docks, the leisure centre GL1, the Oxstalls Tennis Centre, the Guildhall, Folk and City Museums and a crematorium. The combined gas and electricity bill for the year 2010-11 was £847,800, the water bill for the same period was £148,725. The City Council also owns the Eastern Avenue depot and fleet vehicles along with a range of other buildings such as the city car parks, a number of playing field changing rooms, public conveniences, the Robinswood Hill Country Park and various other miscellaneous buildings. The variety and nature of the Council’s activities and services make collating the annual energy use and attempting to control and reduce it a major task. The Council also owns a number of older and listed buildings which are preserved as part of the city’s unique heritage but can be difficult to heat and insulate. There are also a number of new buildings or relatively modern ones such as GL1, Oxstalls Tennis Centre, the Eastern Avenue Depot, The Arbor, and the Folk Museum education centre. Running swimming pools at GL1 and cremators at the Crematorium are particularly heavy energy users.
Since adopting its first Energy Management Strategy in 2003, Gloucester City Council has changed considerably as an organisation reducing its direct services organisations for housing, refuse collection, leisure, revenues and benefits and transferring these services over to external providers. However, the buildings used

in most cases remain the City Council’s property and as with the depot and GL1 the operational and maintenance costs can be considerable.
New lighting at GL1 sports centre now has motion and light sensitive programmable lighting in all areas, and below, Oxstalls Tennis Centre.
Gloucester’s Historic Guildhall has undergone a draft proofing of all windows in 2012 using the Ventrolla system.

The progress towards reducing energy costs has become harder over time with the more simple energy reductions made, the more difficult and often expensive measures remain outstanding. In order to address this problem, and prioritise future projects, a prioritised programme of capital investment projects has been produced so that costs, savings and payback periods can be evaluated before implementation. The original top ten projects (see Appendix 1) included technical improvements to update and replace lighting, draught proofing and insulation of buildings, modernisation of plant and renewable energy generation technology. In 2011 this list was further updated and refreshed (see Appendix 2) with eight ‘invest to save’ projects (as some of the original ten had been implemented). Staff awareness is also important as the “switch it off” and “save it” messages need to be driven home. Clear messages sent out from senior managers to this effect have helped to achieve results. Other factors such as national and international energy costs have also resulted in the price of gas and electricity rising considerably over the last five years. This has increased the urgency and importance of making any efficiency savings. Figure 1 below illustrates the rising level of costs year on year.
Figure 1 - Energy Cost Trends (£) for all main operational sites
0
200,000
400,000
600,000
800,000
1,000,000
1,200,000
£ Ste
rling
Year
Energy Costs by Year
Gas
Electricity
TOTAL

Building Energy Performance
Under this legislation which was introduced in 2008 each of the Council’s buildings with a usable floor space of 1000 sq metres has to be assessed each year for its performance against national benchmarks of similar buildings. In 2013-14 it is likely that this figure will be reduced so that all buildings with 500 sq metres of useable floors pace will need a certificate.
Table 1 below shows how our main buildings perform, whilst there are no A rated buildings, C and B ratings represent good practice in terms of the energy used in these buildings each year.
Site
Table 1 - Energy ratings for Council buildings
Energy Rating 2009
Energy Rating 2010
Energy Rating 2011
Energy Rating 2012
Oxstalls Tennis Centre B B C B Guildhall B C C E Eastgate Market Hall B C B B Eastgate St Offices C D C C City Museum C C C D North Warehouse D D E D Herbert, Kimberley, Phillpotts E E E G GL1 Leisure Centre E E E E
*Guildhall floor area used for first three years calculation was not correct figure.
The rating is based on the amount of energy used in the previous year so the rating looks at how the building has been run in terms of energy use compared with other buildings used for the same purpose.
The Energy Action Delivery Group is working to focus energy improvements on the lower performing buildings to improve their rating over time to move all sites to A, B and C ratings. Investments in more modern plant, heating controls and lighting will be targeted at these lower rated buildings in order to raise them up to the higher benchmark D or above rating. Each building has to display its current rating certificate in a public area which enables every visitor to see the current performance of the building. Planned renewal/upgrade of the ageing heating system in the Herbert/Kimberley/Phillpotts complex should improve its current low rating.
The National Picture
The Climate Change Act 2008 commits the United Kingdom to legally binding targets for green house gas emission reductions of at least 80% by 2050 and reductions in CO2 emissions of at least 26% by 2020 against a 1990 baseline.
The Government and European Union have introduced a number of regulatory schemes in response to the challenges of man-made climate change, these are aimed at ensuring secure and safe energy supplies for the future. Along with the 2012 Energy Bill, they aim to encourage greater efficiency, reduce greenhouse gas emissions and encourage diversification of energy supply particularly towards alternative and renewable sources. The main schemes in this area are Carbon Reduction Commitment Energy Efficiency Scheme, Building Regulations, Energy Performance Certificates, Display Energy Certificates, Climate Change Levy and Climate

Change Agreements. There are also financial incentives to encourage the adoption of new technologies, these are Enhanced Capital Allowances, Feed in Tariffs and Renewable Heat Incentive plus the Green Deal.
Monitoring and Measuring.
The importance of measuring and monitoring use of energy in all our buildings is clear as without this detailed information we cannot get accurate bills and quantify improvements in efficiency.
‘What is not measured will not be saved’ so clear reporting lines have been established since the first energy strategy was adopted in Gloucester in 2003. A manager’s report is produced each month for the Energy Action Delivery Group so that trends in energy use can be discussed and analysis made of any changing patterns of usage and action taken.
Figure 2 - Energy Use in kWh 2004-12 for all main operational buildings
A twelve month comparison table is produced so that use can be compared with the same period in the previous year. Recommendations from the Energy Action Delivery Group are presented to the Asset Management Group. Periodically this group of more senior managers guides decision making and approves expenditure on capital projects which will improve energy efficiency. A further report on the years energy use with a more detailed analysis is made to Cabinet each year. Following the 2012 KPMG audit report on the Council’s energy use a number of improvements were identified. Of those included was the need to adopt Automated meter reading, more clear and granular reporting of total energy use at sites such as GL1 where generation capacity has been installed. The Council also has chosen to report annually its overall energy use which includes transport travel and fleet vehicles (along with all buildings and other sources) and CO2 emissions annually, compared with a 2008 baseline (when reporting started).
This information is posted annually on the Council’s website and reported to the Department of Climate Change (see Appendix 3 for most recent report and table).

Energy Use and Monitoring
Gloucester City Council has thirteen sites which have gas meters, the total gas use for the most recent year is 10597071 kWh (2012) at a cost of £458,872 (2010). All gas is purchased from West Mercia Services contract which has resulted in a favourable low tariff for the City Council. All gas meters have to be read manually at present though technology is available to have automated meter reading for gas meters. It is a long term objective to have this technology installed.
Gas
Gloucester City Council has currently 86 metered electricity supplies, the total electricity used in the most recent year was 4864490 kWh (2012 figure) at an annual cost in (2010 *figure) of £532,508. All electricity supplies are within the West Mercia Services contract as part of this meters are being converted to Automated Meter Reading but only a relatively small number of sites have so far been transferred. Automated meter reading enables accurate billing without any estimates and online access to meter readings and consumption data. *(most recent available figure)
Electricity
Gloucester City Council has currently 45 sites which are receiving water bills with separate Severn Trent Water accounts. Of these 20 are for buildings which vary in size from large Docks offices to public conveniences. There are also 25 sites which are car parks or open spaces such as land at the depot which are charged for drainage and water run off. Of all these, 28 sites are metered and 17 sites are charged on rateable value. Automated Meter Reading is available for Water meters but this is a long term objective at present. In the short term consolidation of all sites into a single managed account with accurate annual reporting is the key objective .The total water bill for all sites for the most recent full year was £148,725, due to the current system of billing we now have no annual reporting of usage. (This will be available when bill consolidation is in place).
Water
Gloucester City Council has a number of pool vehicles for staff use, a Mayors car and various vehicles used by the Countryside Unit. The breakdown of fuel use from these vehicles can be seen in a table at Appendix 4. The largest figure in the table is, however, from the diesel fleet operated by Enterprise which used 380,319 litres of fuel in the last year. The table also includes rail mileage travelled (19,824 miles) and staff journeys for work using their own vehicles (40,043 miles). The Council has an active staff travel plan which works to reduce the travel of staff and promote the use of sustainable travel modes. Significant reductions have been achieved in this area over the past year.
Fleet and Vehicle Fuel

The Energy Management Strategy Objectives are to:-
1. Minimise the Council’s carbon footprint by reducing energy use across all its buildings by 2% per year.
2. Raise awareness of and promote energy efficiency among staff at all levels though formal training programme.
3. Increase the amount of energy generated from renewable sources within the city and where opportunities arise on Council Land and buildings.
4. Set an example to other employers and businesses by demonstrating best practice in energy management in order to be seen in a community leadership role in this field.
5. To monitor and evaluate all energy projects using the International Performance Measurement and Verification Protocol to ensure improvements are independently verified and savings made.
What we plan to do
In order to deliver the above objectives, a revised and updated action plan has been developed as set out below. The Energy Action Delivery Group will be tasked with implementing the action plan with bi-monthly reporting to the Asset Management Group and the Asset Manager along with an annual report to Cabinet.
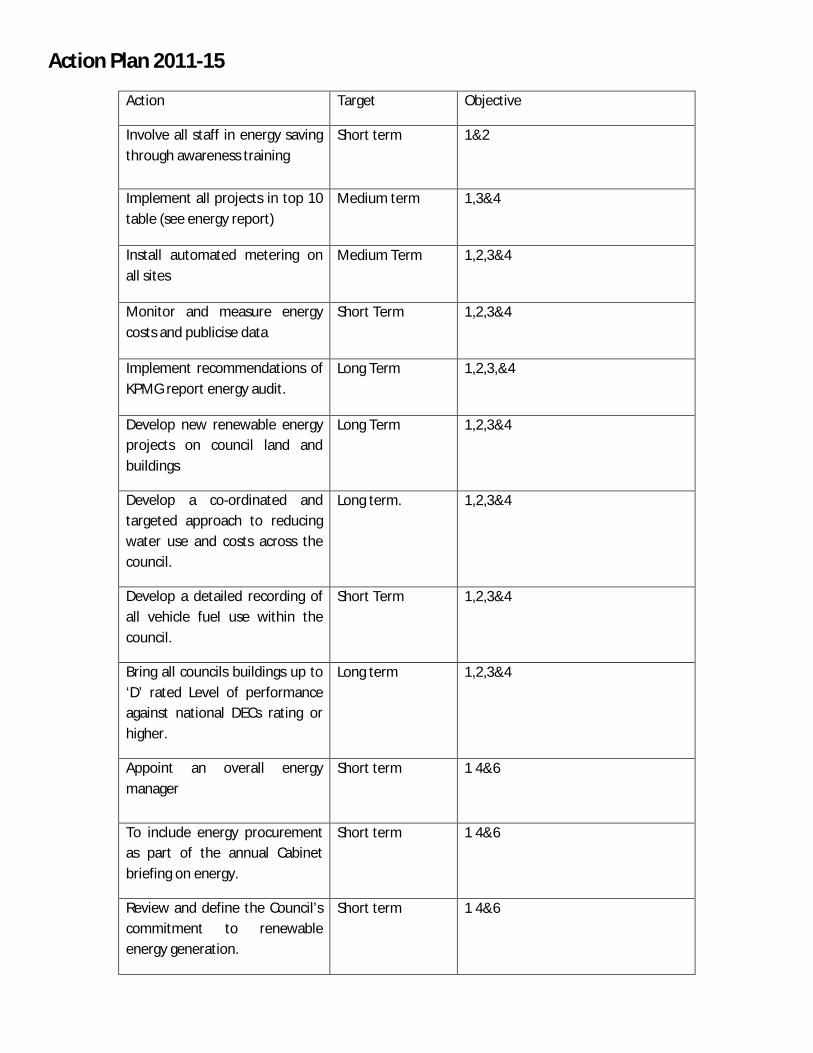
Action Plan 2011-15
Action Target Objective
Involve all staff in energy saving through awareness training
Short term 1&2
Implement all projects in top 10 table (see energy report)
Medium term 1,3&4
Install automated metering on all sites
Medium Term 1,2,3&4
Monitor and measure energy costs and publicise data
Short Term 1,2,3&4
Implement recommendations of KPMG report energy audit.
Long Term 1,2,3,&4
Develop new renewable energy projects on council land and buildings
Long Term 1,2,3&4
Develop a co-ordinated and targeted approach to reducing water use and costs across the council.
Long term. 1,2,3&4
Develop a detailed recording of all vehicle fuel use within the council.
Short Term 1,2,3&4
Bring all councils buildings up to ‘D’ rated Level of performance against national DECs rating or higher.
Long term 1,2,3&4
Appoint an overall energy manager
Short term 1 4&6
To include energy procurement as part of the annual Cabinet briefing on energy.
Short term 1 4&6
Review and define the Council’s commitment to renewable energy generation.
Short term 1 4&6

Undertake cost benefit analysis of purchasing electricity from mixed renewable sources under WMS contract.
Medium term 1 4&6
Implement a more sophisticated and detailed system of metering and monitoring and analysis of energy and water use to include consolidation to a single account.
Short Term 1 4&6
Assess the in use performance of all energy and carbon reduction schemes to consider the extent of delivery against the original business case.
Medium Term 1 4&6
Reporting of all metered grid electricity and also additional capacity to show full actual use.
Short Term 1 4&6
Review effectiveness of current energy awareness campaign. Develop and implement new campaign.
Short Term 1 4&6
At GL1 undertake detailed review of; staff awareness campaign, patterns of gas, electricity and water consumption.
Medium Term 1 4&6
At GL1 carry out a detailed energy reduction exercise to optimise existing use and deliver sustainable reductions.
Long Term 1 4&6
At GL1 discuss possible changes to management agreement to incentivise aspire to achieve defined energy reduction targets.
Medium Term 1 4&6
GL1 consumption reporting ensure reporting of overall consumption of both grid and CHP electricity
Short Term 1 4&6

GL1 CHP conduct more detailed review of the CHP to consider; fluctuating pattern of generation, design vs. actual performance, control and optimisation of heat demand using CHP and existing gas boilers, cost benefit of extending generating periods and grid feed in opportunities.
Long Term 1 4&6
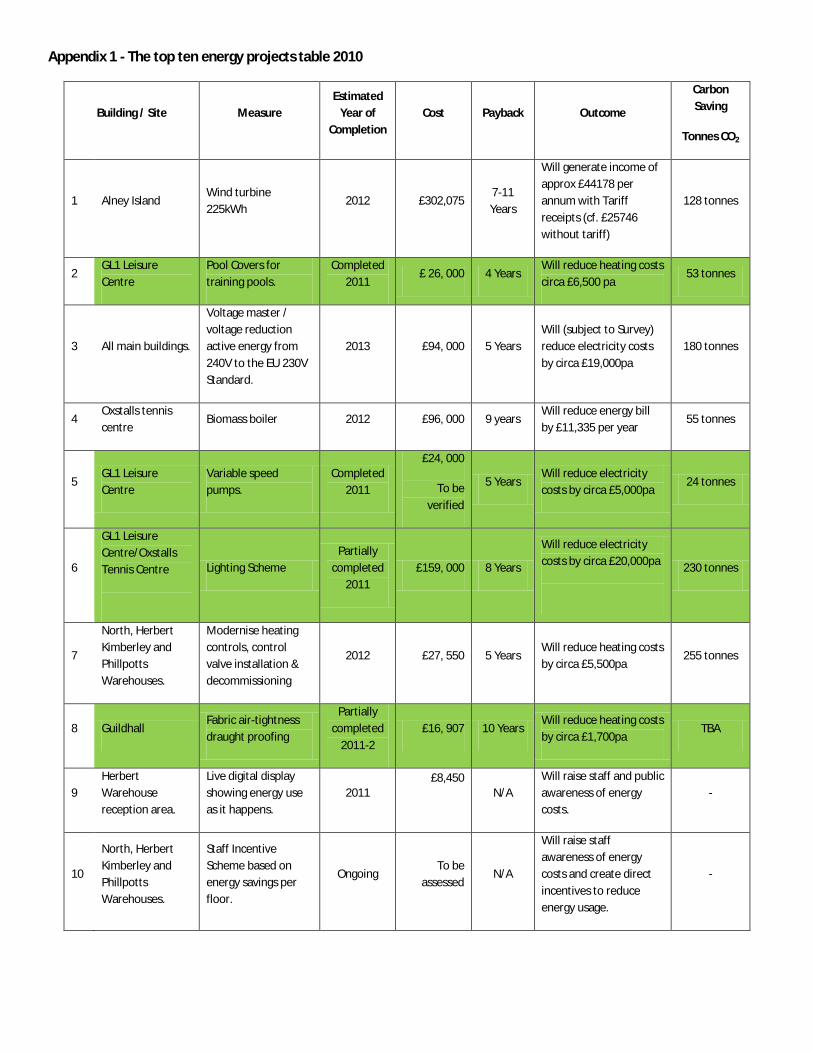
Appendix 1 - The top ten energy projects table 2010
Building / Site Measure Estimated
Year of Completion
Cost Payback Outcome
Carbon Saving
Tonnes CO2
1 Alney Island Wind turbine 225kWh
2012 £302,075 7-11 Years
Will generate income of approx £44178 per annum with Tariff receipts (cf. £25746 without tariff)
128 tonnes
2 GL1 Leisure Centre
Pool Covers for training pools.
Completed 2011
£ 26, 000 4 Years Will reduce heating costs circa £6,500 pa
53 tonnes
3 All main buildings.
Voltage master / voltage reduction active energy from 240V to the EU 230V Standard.
2013 £94, 000 5 Years Will (subject to Survey) reduce electricity costs by circa £19,000pa
180 tonnes
4 Oxstalls tennis centre
Biomass boiler 2012 £96, 000 9 years Will reduce energy bill by £11,335 per year
55 tonnes
5 GL1 Leisure Centre
Variable speed pumps.
Completed 2011
£24, 000
To be verified
5 Years Will reduce electricity costs by circa £5,000pa
24 tonnes
6
GL1 Leisure Centre/Oxstalls Tennis Centre
Lighting Scheme Partially
completed 2011
£159, 000 8 Years
Will reduce electricity costs by circa £20,000pa
230 tonnes
7
North, Herbert Kimberley and Phillpotts Warehouses.
Modernise heating controls, control valve installation & decommissioning
2012 £27, 550 5 Years Will reduce heating costs by circa £5,500pa
255 tonnes
8 Guildhall Fabric air-tightness draught proofing
Partially completed
2011-2 £16, 907 10 Years
Will reduce heating costs by circa £1,700pa
TBA
9 Herbert Warehouse reception area.
Live digital display showing energy use as it happens.
2011 £8,450
N/A
Will raise staff and public awareness of energy costs.
-
10
North, Herbert Kimberley and Phillpotts Warehouses.
Staff Incentive Scheme based on energy savings per floor.
Ongoing To be
assessed N/A
Will raise staff awareness of energy costs and create direct incentives to reduce energy usage.
-

Appendix 2 - Revised list of energy projects approved in 2011
Building / Site Measure Estimated
Year of Completion
Cost Payback
Approx.
Annual Saving / income
Outcome
Carbon Saving
Tonnes CO2 pa
1 Alney Island Wind turbine 330 KW
2012 £750,000 7-Years £107,500
Will generate 554,200kwh pa and generate £118,558 pa.
246 tonnes
2 Oxstalls tennis centre
Biomass boiler 2012 £120000 6 years £20,000
Pay back will depend upon RHI level. Savings/income app. £20000 pa
55 tonnes
3 PV for Oxstalls Install PV cells on roofs to generate electricity
2011-2 £26400 6.6 years £4,000 Income/savings of £5000 per year
4.4 tonnes
5
Oxstalls Tennis Centre
Lighting Scheme 2011 £159, 000 8 Years £19,875 Will reduce electricity costs by circa £20,000pa
230 tonnes
6
Herbert Kimberley and Phillpotts Warehouses
Modernise heating controls, control valve installation & decommissioning
2012 £27, 550 5 Years £5,500 Will reduce heating costs by circa £5,500pa
255 tonnes
7 GL1 CHP Extend exhaust flue serving the GL1 CHP unit
2011 £1,500 8 Years £175
Unnecessary downtime during Air Conditioning Servicing will be avoided
Nominal
8
Hempsted Meadows Biomass Woodchip production unit
Processing of recycled and waste timber to maximise the value of the material
2012 £25,000 8 Years £3,125
Will provide an income and ensure sustainable source of material for Oxstalls Tennis Centre
Nominal

Appendix 3 - Gloucester City Council Emissions Year on year comparison table
GHG emissions in tonnes CO2 2008 2009 2010 2011
Scope 1
Gas consumption 3307 2465 2219 2402
Owned transport 436 26 33 34
Process emissions
Fugitive emissions
total scope 1 3743 2491 2252 2436
Scope 2
Purchased electricity 2452 2545 2528 2319
Total scope 2 2452 2545 2528 2319
Significant Scope 3
Business Travel 49 42 33 472
Contractor Fleet 549 822 1422 1232
Public transport/ business Travel 3 5 4 2
Waste Disposal/Recycling 14 12 15 1
Total Significant Scope 3 615 881 1474 1707
Total Gross Emissions 6813 5913 6257 6009
Change against base year 100% -13% -8% -12%
This year’s figures in more detail.
Gloucester City Council Emissions Table 2011-12
Scope 1 or Scope3 Scope 3 All scopes Grand total GHG
2010 CO2 CH4 N2O GHG Total Direct
Total Indirect GHG
Source of Emissions
Total kg CO2e
Total kg CO2e
Total kg CO2e
Total kg CO2e Total kg CO2e Total kg CO2e
Electricity 2032924 1022 12466 2046413 273120 2319533 Gas 2173247 3179 1272 2177698 225082 2402780 Public Transport 1755 2 100 1856 286 2142 Staff Travel 13661 10 43 13715 2749 16862 Own Vehicle fleet 28301 22 220 28543 5855 34398 Contractor Fleet 1010467 342 7264 1018073 214651 1232725 Waste Disposal 1150 Totals 5260355 4577 21365 5286298 721743 6009590

Appendix 4 - Fleet fuel and staff travel data table
Emissions for 2011-12 Gloucester City Council (Raw Data). Source Type of unit Quantity CO2eKg
Petrol smart car miles 1251 399
Electric smart car. miles 2070 0*
Staff travel for work miles 40043 16463
Staff travel for work total miles 43364 16862
Rail staff miles 19824 2142
Diesel fleet litres 6370 20647
Gas oil fleet litres 273 984
Lpg fleet litres 321 554
Normal petrol fleet litres 4396 12213
Own veh fleet total litres 11360 34398
Diesel fleet enterprise litres 380319 1232725 *Electric smart car emissions part of electricity total