ENERGY IN TASMANIA PERFORMANCE REPORT 2014 15 in Tasmania 2014... · GBE Government Business...
178
ENERGY IN TASMANIA – PERFORMANCE REPORT 2014–15 Office of the Tasmanian Economic Regulator
Transcript of ENERGY IN TASMANIA PERFORMANCE REPORT 2014 15 in Tasmania 2014... · GBE Government Business...
ENERGY IN TASMANIA – PERFORMANCE REPORT
2014–15
Office of the Tasmanian Economic Regulator
Printed January 2016
Office of the Tasmanian Economic Regulator
ISBN 978-0-7246-5388-1
Copyright
© Office of the Tasmanian Economic Regulator
CONTACT DETAILS
Office of the Tasmanian Economic Regulator
Office hours: 8.45am to 5.00pm, Monday to Friday
(except public holidays)
Postal address: GPO Box 770, Hobart, Tasmania 7001
Telephone: (03) 6166 4422 or international +61 3 6166 4422
Email: [email protected]
Website: www.economicregulator.tas.gov.au
ENERGY IN TASMANIA - PERFORMANCE REPORT 2014-15
TABLE OF CONTENTS
TABLE OF CONTENTS .................................................................................... 1
ACRONYMS ............................................................................................................... I
EXECUTIVE SUMMARY ........................................................................................... V
1 OVERVIEW OF THE TASMANIAN ENERGY INDUSTRY ............................. 1
2 ENERGY CONSUMPTION IN TASMANIA ..................................................... 5
2.1 Introduction ................................................................................. 5
2.2 Residential energy consumption ................................................. 6
2.3 Commercial energy consumption ............................................... 7
2.4 Industry energy consumption ...................................................... 8
2.5 Electricity demand ....................................................................... 8
3 OVERVIEW OF THE TASMANIAN ELECTRICITY SUPPLY INDUSTRY ... 13
3.1 Introduction ............................................................................... 13
3.2 Industry structure and participants ............................................ 13
4 ELECTRICITY REGULATION ...................................................................... 15
4.1 Introduction ............................................................................... 15
4.2 Legislative and regulatory framework ....................................... 15
5 REGULATORY BODIES .............................................................................. 19
5.1 Introduction ............................................................................... 19
5.2 Australian Energy Market Commission ..................................... 19
5.3 Australian Energy Regulator ..................................................... 20
5.4 Australian Energy Market Operator .......................................... 21
5.5 Tasmanian Economic Regulator ............................................... 22
5.5.1 Overview ................................................................................. 22
5.5.2 Pricing and pricing related functions ....................................... 23
5.5.3 Regulatory reporting ............................................................... 28
5.5.4 Performance reporting ............................................................ 29
ENERGY IN TASMANIA - PERFORMANCE REPORT 2014-15
5.5.5 Customer Consultative Committee ......................................... 29
6 OTHER GOVERNMENT BODIES ................................................................ 31
6.1 Introduction ............................................................................... 31
6.2 Department of Treasury and Finance ....................................... 31
6.3 Energy Policy Branch, Department of State Growth ................. 31
6.4 Energy Ombudsman ................................................................. 32
6.5 Electrical safety standards and licensing .................................. 33
6.6 Climate change policies and regulators .................................... 34
6.6.1 Carbon pricing mechanism ..................................................... 34
6.6.2 Direct Action Policy ................................................................. 35
6.6.3 Renewable Energy Target ...................................................... 35
6.6.4 Clean Energy Regulator ......................................................... 37
6.6.5 Clean Energy Finance Corporation ........................................ 37
6.6.6 Australian Renewable Energy Agency ................................... 37
6.6.7 Climate Change Authority ....................................................... 37
7 GENERATION .............................................................................................. 39
7.1 Installed capacity ...................................................................... 39
7.2 Reserve plant margin ................................................................ 40
7.3 Hydro generation ...................................................................... 41
7.3.1 Water storage ......................................................................... 42
7.4 Thermal generation ................................................................... 43
7.5 Wind generation ........................................................................ 45
7.6 Embedded generation ............................................................... 46
7.6.1 Solar Photovoltaic ................................................................... 46
7.6.2 Solar hot water ........................................................................ 48
7.6.3 Large embedded generators .................................................. 48
7.7 Generation performance ........................................................... 49
7.7.1 Availability ............................................................................... 49
7.7.2 Planned outage factor............................................................. 51
7.7.3 Forced outage factor............................................................... 52
7.7.4 System adequacy ................................................................... 53
7.7.5 Basslink imports ...................................................................... 54
8 TRANSMISSION ........................................................................................... 57
8.1 Introduction ............................................................................... 57
8.2 Availability ................................................................................. 57
ENERGY IN TASMANIA - PERFORMANCE REPORT 2014-15
8.3 Reliability ................................................................................... 58
8.4 Comparison with other jurisdictions .......................................... 60
8.5 Average outage duration ........................................................... 62
8.6 Connection site performance .................................................... 62
8.6.1 Unplanned outages ................................................................. 63
8.6.2 Planned outages ..................................................................... 63
8.7 Connection site security for firm connection points ................... 63
8.8 Constraints ................................................................................ 64
8.8.1 Transmission system constraints ........................................... 64
8.8.2 Transmission network capacity constraints ............................ 65
8.8.3 Terminal substation capacity constraints................................ 65
8.9 System losses ........................................................................... 65
8.9.1 Energy losses in the NEM ...................................................... 65
8.10 Transmission security and planning criteria .............................. 66
8.11 Basslink Interconnector ............................................................. 66
8.11.1 Basslink operation .................................................................. 68
8.12 Basslink technical performance ................................................ 68
8.12.1 Basslink imports (market operations) ..................................... 69
9 ELECTRICITY DISTRIBUTION .................................................................... 71
9.1 Introduction ............................................................................... 71
9.2 The distribution network ............................................................ 71
9.3 Performance measures ............................................................. 72
9.3.1 SAIDI ...................................................................................... 72
9.3.2 SAIFI ....................................................................................... 72
9.3.3 CAIDI ...................................................................................... 73
9.4 Performance standards ............................................................. 73
9.4.1 Communities ........................................................................... 74
9.5 Overall distribution network performance ................................. 75
9.5.1 Major event days .................................................................... 76
9.5.2 Performance excluding Major Event Days ............................. 77
9.5.3 Cause of supply interruptions ................................................. 77
9.5.4 Response to interruptions ....................................................... 80
9.6 Distribution network performance for TEC community categories ................................................................................. 81
9.6.1 Critical infrastructure category ................................................ 81
9.6.2 High density commercial category .......................................... 82
9.6.3 Urban and regional centres category ..................................... 82
9.6.4 Higher density rural category .................................................. 83
ENERGY IN TASMANIA - PERFORMANCE REPORT 2014-15
9.6.5 Lower density rural category .................................................. 83
9.7 Distribution network performance for communities within TEC categories ................................................................................. 84
9.7.1 Critical infrastructure community SAIDI and SAIFI ................. 85
9.7.2 High density commercial communities SAIDI and SAIFI ........ 85
9.7.3 Urban and regional centre communities SAIDI and SAIFI ..... 85
9.7.4 Higher density rural communities SAIDI and SAIFI ................ 86
9.7.5 Lower density rural communities SAIDI and SAIFI ................ 87
9.8 Interstate distribution network performance comparisons ........ 88
9.9 Guaranteed service levels ........................................................ 91
9.10 Reliability improvement ............................................................. 92
9.11 Quality ....................................................................................... 93
9.12 Call centre performance ............................................................ 93
9.13 Customer charter payments ...................................................... 94
10 TASMANIAN ELECTRICITY MARKET ........................................................ 97
10.1 Wholesale market ................................................................... 97
10.1.1 The National Electricity Market ............................................... 97
10.1.2 Spot market overview ........................................................... 101
10.1.3 Derivatives Market ................................................................ 104
10.1.4 Frequency control ancillary services .................................... 106
10.2 Retail market ........................................................................... 108
10.2.1 Tasmanian electricity customers .......................................... 109
10.3 Retail market activity indicators .............................................. 109
10.3.1 Disconnection rates .............................................................. 109
10.3.2 Customer complaints ............................................................ 110
10.4 Customers experiencing payment difficulties .......................... 110
10.4.1 Customers repaying a debt .................................................. 110
10.4.2 Payment plans and hardship program.................................. 111
10.4.3 Centrepay ............................................................................. 112
10.4.4 Community service agreements ........................................... 112
10.4.5 Tasmanian Government assistance for vulnerable households ........................................................................... 113
10.5 Call centre performance .......................................................... 113
11 BASS STRAIT ISLANDS ............................................................................ 115
11.1 Introduction ............................................................................. 115
11.2 Regulatory arrangements ....................................................... 116
11.3 Generation .............................................................................. 116
ENERGY IN TASMANIA - PERFORMANCE REPORT 2014-15
11.3.1 Flinders Island ...................................................................... 116
11.3.2 King Island ............................................................................ 116
11.4 Distribution networks ............................................................... 117
11.5 Performance ........................................................................... 117
11.5.1 Flinders Island ...................................................................... 118
11.5.2 King Island ............................................................................ 122
11.6 Retail ....................................................................................... 126
11.6.1 Performance Reporting ........................................................ 126
11.6.2 Price comparison .................................................................. 126
11.7 Community Service Obligation (CSO) .................................... 127
12 FUTURE DIRECTIONS............................................................................... 129
12.1 Introduction ............................................................................. 129
12.2 Issues ...................................................................................... 129
13 OVERVIEW OF THE NATURAL GAS INDUSTRY ..................................... 131
13.1 Introduction ............................................................................. 131
13.2 Transmission ........................................................................... 131
13.3 Distribution .............................................................................. 131
13.4 Retail ....................................................................................... 132
13.5 Industry participants ................................................................ 132
14 GAS REGULATION .................................................................................... 133
14.1 Introduction ............................................................................. 133
14.2 Legislative and regulatory framework ..................................... 133
14.3 Regulators ............................................................................... 135
14.3.1 Tasmanian Economic Regulator .......................................... 135
14.3.2 Tasmanian Energy Ombudsman .......................................... 137
14.3.3 Director of Gas Safety .......................................................... 137
15 GAS TRANSMISSION ................................................................................ 139
15.1 Introduction ............................................................................. 139
15.2 Performance ........................................................................... 139
16 GAS DISTRIBUTION .................................................................................. 141
16.1 Introduction ............................................................................. 141
ENERGY IN TASMANIA - PERFORMANCE REPORT 2014-15
16.2 Supply ..................................................................................... 141
16.3 Customer numbers ................................................................. 141
16.4 Customer complaints .............................................................. 142
16.5 Reliability of supply ................................................................. 143
17 GAS RETAIL .............................................................................................. 145
17.1 Introduction ............................................................................. 145
17.2 Performance ........................................................................... 145
17.3 Pricing ..................................................................................... 146
18 FUTURE DIRECTIONS............................................................................... 147
18.1 Introduction ............................................................................. 147
18.2 Issues ...................................................................................... 147
19 OVERVIEW OF OTHER FUEL SOURCES ................................................ 149
20 PETROLEUM .............................................................................................. 151
20.1 Introduction ............................................................................. 151
20.2 Regulation ............................................................................... 151
20.3 Consumption ........................................................................... 152
20.4 Available resource .................................................................. 152
21 COAL .......................................................................................................... 153
21.1 Introduction ............................................................................. 153
21.2 Regulation ............................................................................... 153
21.3 Consumption ........................................................................... 153
21.4 Available resource .................................................................. 154
21.5 Future directions ..................................................................... 154
22 WOOD ........................................................................................................ 155
22.1 Introduction ............................................................................. 155
22.2 Regulation ............................................................................... 155
22.3 Consumption ........................................................................... 155
22.4 Available resource .................................................................. 156

ENERGY IN TASMANIA - PERFORMANCE REPORT 2014-15
22.5 Future directions ..................................................................... 156
APPENDIX 1 – CONTRIBUTIONS TO THE ECONOMY ....................................... A-1
Electricity .......................................................................................... A-1
Gas ................................................................................................ A-3
Other fuel sources ............................................................................ A-3

ENERGY IN TASMANIA – PERFORMANCE REPORT 2014-15 I
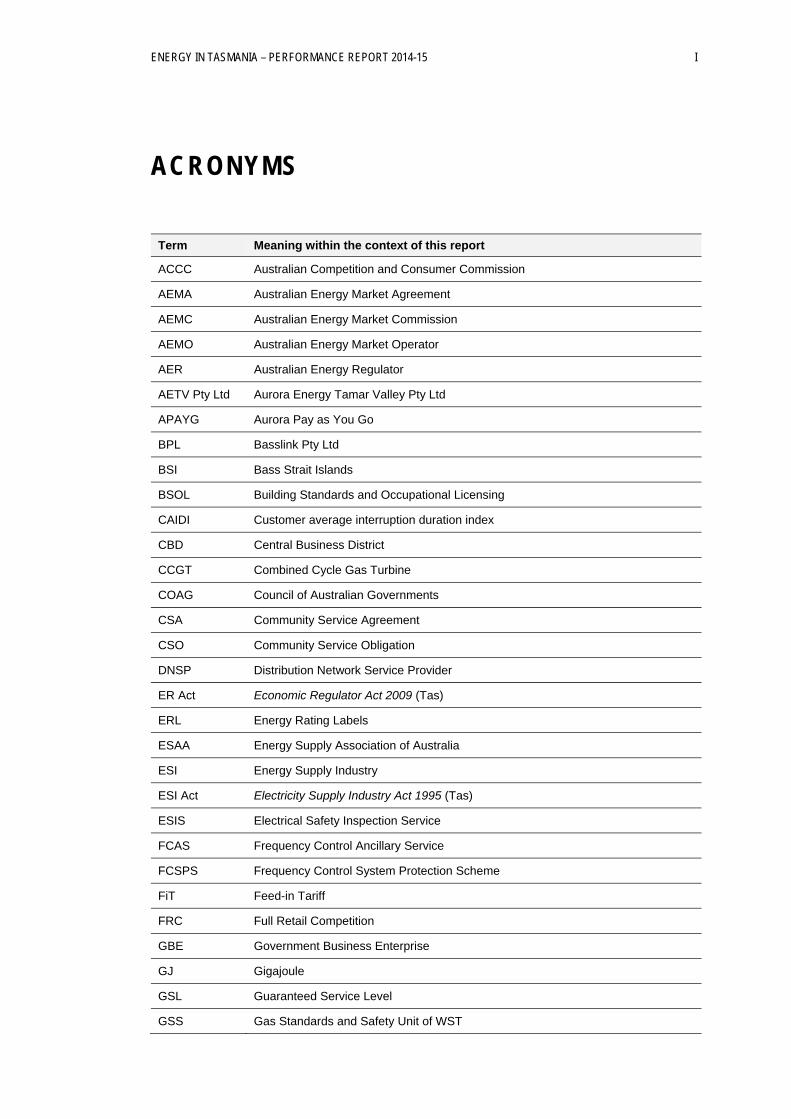
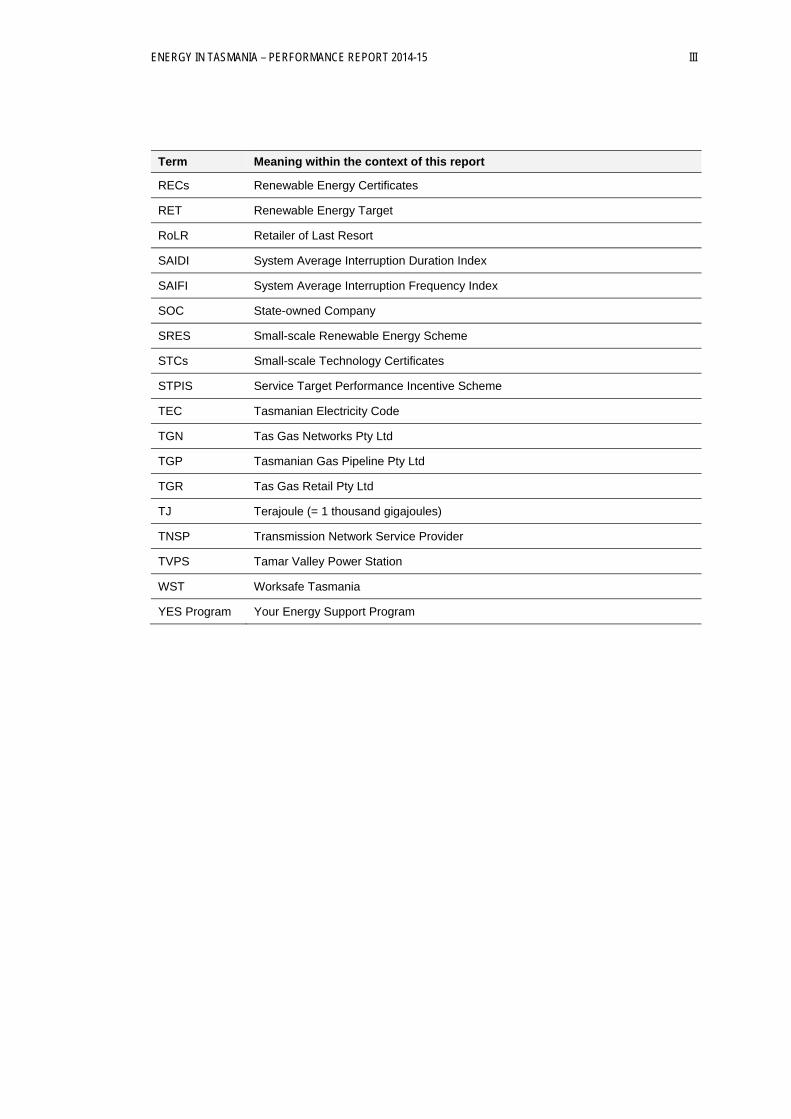
ACRONYMS
Term Meaning within the context of this report
ACCC Australian Competition and Consumer Commission
AEMA Australian Energy Market Agreement
AEMC Australian Energy Market Commission
AEMO Australian Energy Market Operator
AER Australian Energy Regulator
AETV Pty Ltd Aurora Energy Tamar Valley Pty Ltd
APAYG Aurora Pay as You Go
BPL Basslink Pty Ltd
BSI Bass Strait Islands
BSOL Building Standards and Occupational Licensing
CAIDI Customer average interruption duration index
CBD Central Business District
CCGT Combined Cycle Gas Turbine
COAG Council of Australian Governments
CSA Community Service Agreement
CSO Community Service Obligation
DNSP Distribution Network Service Provider
ER Act Economic Regulator Act 2009 (Tas)
ERL Energy Rating Labels
ESAA Energy Supply Association of Australia
ESI Energy Supply Industry
ESI Act Electricity Supply Industry Act 1995 (Tas)
ESIS Electrical Safety Inspection Service
FCAS Frequency Control Ancillary Service
FCSPS Frequency Control System Protection Scheme
FiT Feed-in Tariff
FRC Full Retail Competition
GBE Government Business Enterprise
GJ Gigajoule
GSL Guaranteed Service Level
GSS Gas Standards and Safety Unit of WST
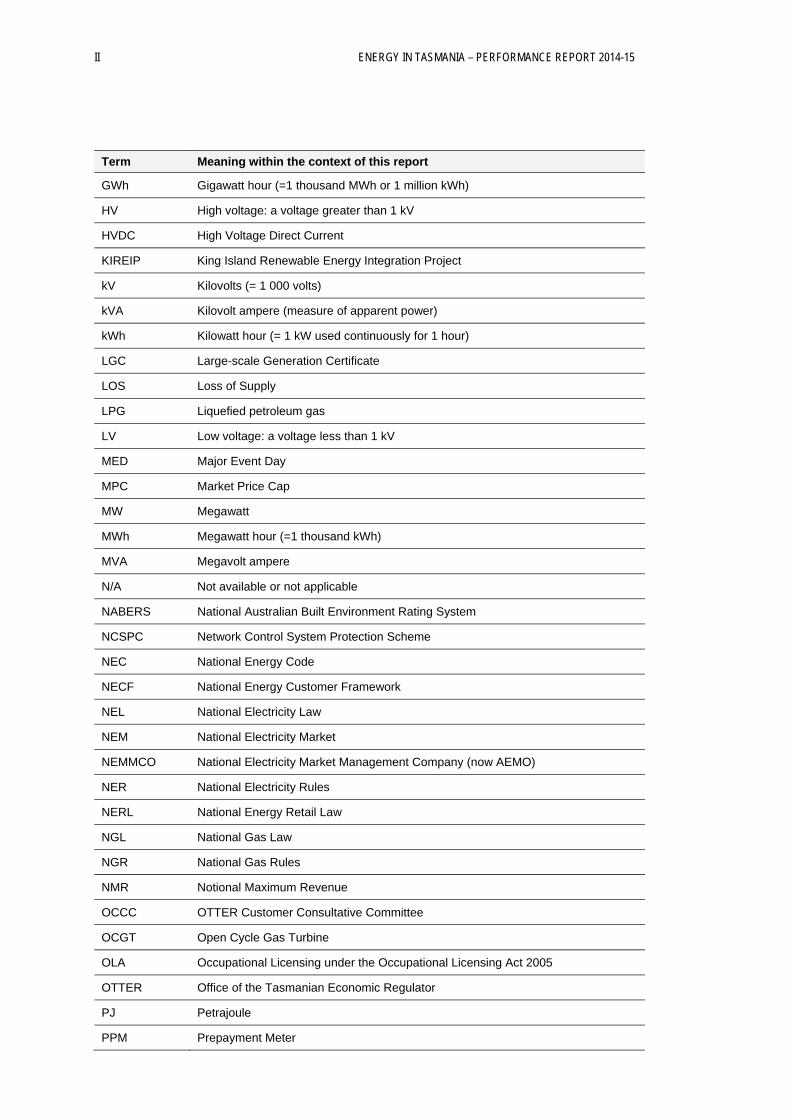
II ENERGY IN TASMANIA – PERFORMANCE REPORT 2014-15
Term Meaning within the context of this report
GWh Gigawatt hour (=1 thousand MWh or 1 million kWh)
HV High voltage: a voltage greater than 1 kV
HVDC High Voltage Direct Current
KIREIP King Island Renewable Energy Integration Project
kV Kilovolts (= 1 000 volts)
kVA Kilovolt ampere (measure of apparent power)
kWh Kilowatt hour (= 1 kW used continuously for 1 hour)
LGC Large-scale Generation Certificate
LOS Loss of Supply
LPG Liquefied petroleum gas
LV Low voltage: a voltage less than 1 kV
MED Major Event Day
MPC Market Price Cap
MW Megawatt
MWh Megawatt hour (=1 thousand kWh)
MVA Megavolt ampere
N/A Not available or not applicable
NABERS National Australian Built Environment Rating System
NCSPC Network Control System Protection Scheme
NEC National Energy Code
NECF National Energy Customer Framework
NEL National Electricity Law
NEM National Electricity Market
NEMMCO National Electricity Market Management Company (now AEMO)
NER National Electricity Rules
NERL National Energy Retail Law
NGL National Gas Law
NGR National Gas Rules
NMR Notional Maximum Revenue
OCCC OTTER Customer Consultative Committee
OCGT Open Cycle Gas Turbine
OLA Occupational Licensing under the Occupational Licensing Act 2005
OTTER Office of the Tasmanian Economic Regulator
PJ Petrajoule
PPM Prepayment Meter
ENERGY IN TASMANIA – PERFORMANCE REPORT 2014-15 III
Term Meaning within the context of this report
RECs Renewable Energy Certificates
RET Renewable Energy Target
RoLR Retailer of Last Resort
SAIDI System Average Interruption Duration Index
SAIFI System Average Interruption Frequency Index
SOC State-owned Company
SRES Small-scale Renewable Energy Scheme
STCs Small-scale Technology Certificates
STPIS Service Target Performance Incentive Scheme
TEC Tasmanian Electricity Code
TGN Tas Gas Networks Pty Ltd
TGP Tasmanian Gas Pipeline Pty Ltd
TGR Tas Gas Retail Pty Ltd
TJ Terajoule (= 1 thousand gigajoules)
TNSP Transmission Network Service Provider
TVPS Tamar Valley Power Station
WST Worksafe Tasmania
YES Program Your Energy Support Program

ENERGY IN TASMANIA – PERFORMANCE REPORT 2014-15 V
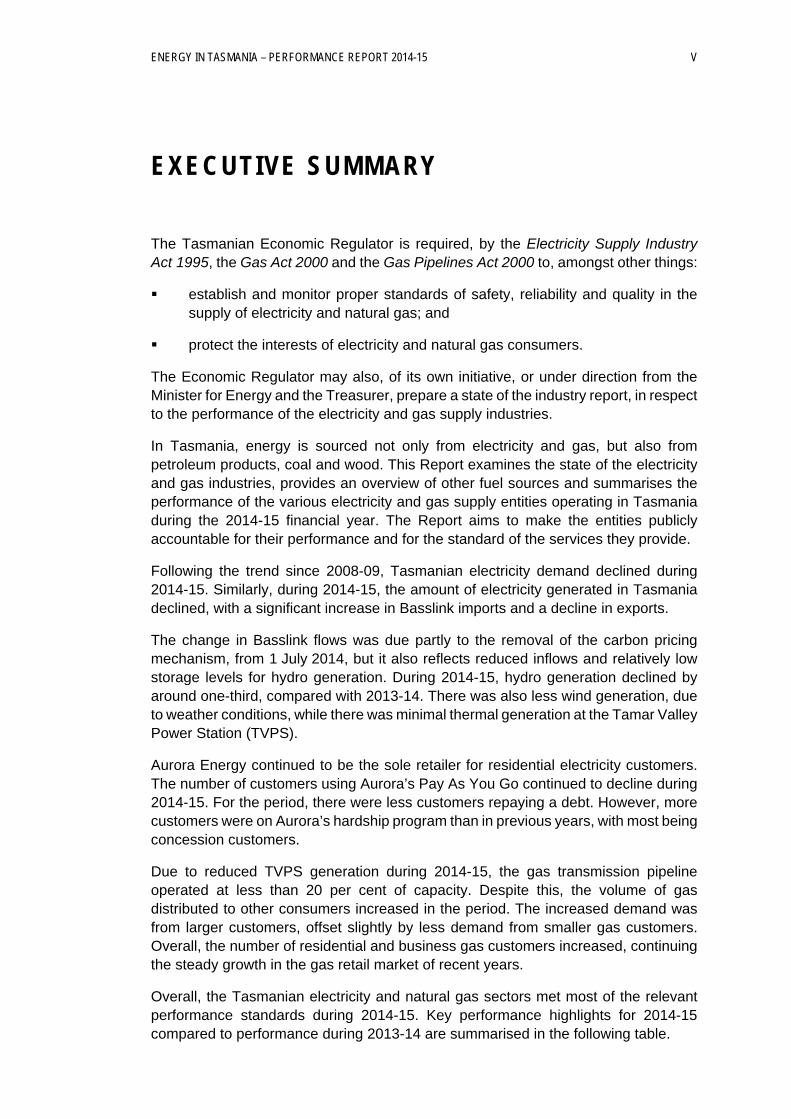
EXECUTIVE SUMMARY
The Tasmanian Economic Regulator is required, by the Electricity Supply Industry Act 1995, the Gas Act 2000 and the Gas Pipelines Act 2000 to, amongst other things:
establish and monitor proper standards of safety, reliability and quality in the supply of electricity and natural gas; and
protect the interests of electricity and natural gas consumers.
The Economic Regulator may also, of its own initiative, or under direction from the Minister for Energy and the Treasurer, prepare a state of the industry report, in respect to the performance of the electricity and gas supply industries.
In Tasmania, energy is sourced not only from electricity and gas, but also from petroleum products, coal and wood. This Report examines the state of the electricity and gas industries, provides an overview of other fuel sources and summarises the performance of the various electricity and gas supply entities operating in Tasmania during the 2014-15 financial year. The Report aims to make the entities publicly accountable for their performance and for the standard of the services they provide.
Following the trend since 2008-09, Tasmanian electricity demand declined during 2014-15. Similarly, during 2014-15, the amount of electricity generated in Tasmania declined, with a significant increase in Basslink imports and a decline in exports.
The change in Basslink flows was due partly to the removal of the carbon pricing mechanism, from 1 July 2014, but it also reflects reduced inflows and relatively low storage levels for hydro generation. During 2014-15, hydro generation declined by around one-third, compared with 2013-14. There was also less wind generation, due to weather conditions, while there was minimal thermal generation at the Tamar Valley Power Station (TVPS).
Aurora Energy continued to be the sole retailer for residential electricity customers. The number of customers using Aurora’s Pay As You Go continued to decline during 2014-15. For the period, there were less customers repaying a debt. However, more customers were on Aurora’s hardship program than in previous years, with most being concession customers.
Due to reduced TVPS generation during 2014-15, the gas transmission pipeline operated at less than 20 per cent of capacity. Despite this, the volume of gas distributed to other consumers increased in the period. The increased demand was from larger customers, offset slightly by less demand from smaller gas customers. Overall, the number of residential and business gas customers increased, continuing the steady growth in the gas retail market of recent years.
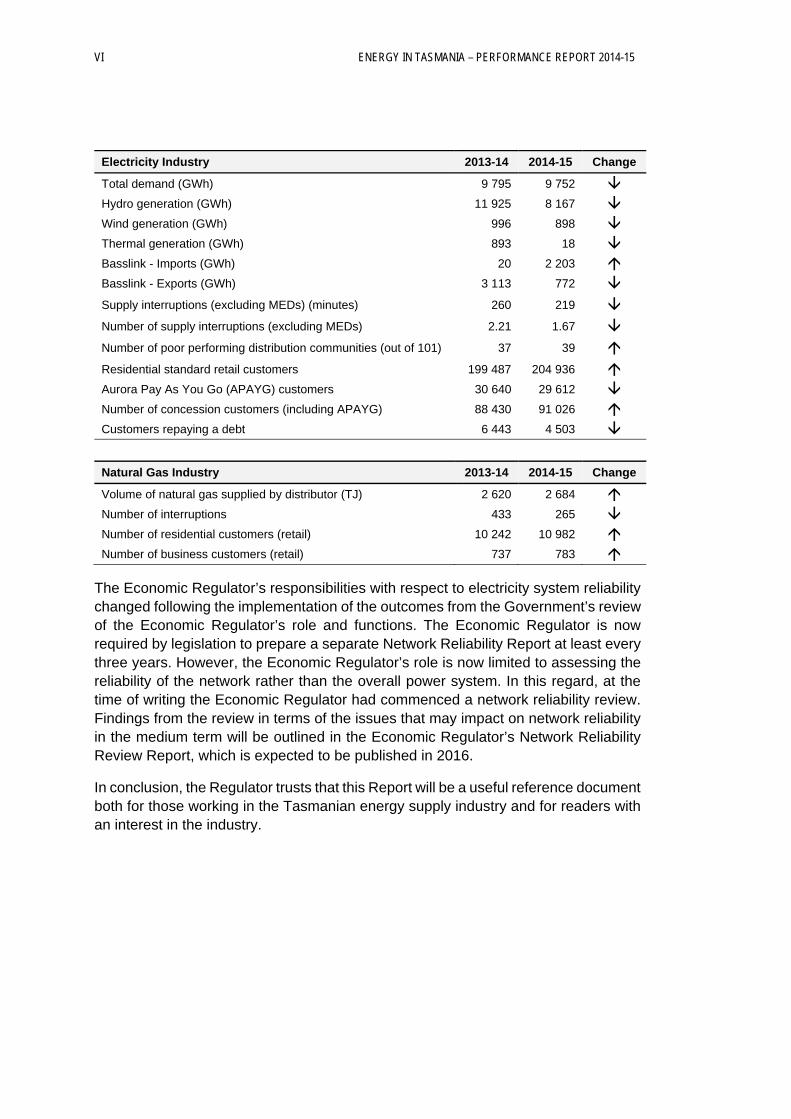
Overall, the Tasmanian electricity and natural gas sectors met most of the relevant performance standards during 2014-15. Key performance highlights for 2014-15 compared to performance during 2013-14 are summarised in the following table.
VI ENERGY IN TASMANIA – PERFORMANCE REPORT 2014-15
Electricity Industry 2013-14 2014-15 Change
Total demand (GWh) 9 795 9 752 Hydro generation (GWh) 11 925 8 167 Wind generation (GWh) 996 898 Thermal generation (GWh) 893 18 Basslink - Imports (GWh) 20 2 203 Basslink - Exports (GWh) 3 113 772 Supply interruptions (excluding MEDs) (minutes) 260 219 Number of supply interruptions (excluding MEDs) 2.21 1.67 Number of poor performing distribution communities (out of 101) 37 39 Residential standard retail customers 199 487 204 936 Aurora Pay As You Go (APAYG) customers 30 640 29 612 Number of concession customers (including APAYG) 88 430 91 026 Customers repaying a debt 6 443 4 503
Natural Gas Industry 2013-14 2014-15 Change
Volume of natural gas supplied by distributor (TJ) 2 620 2 684 Number of interruptions 433 265 Number of residential customers (retail) 10 242 10 982 Number of business customers (retail) 737 783
The Economic Regulator’s responsibilities with respect to electricity system reliability changed following the implementation of the outcomes from the Government’s review of the Economic Regulator’s role and functions. The Economic Regulator is now required by legislation to prepare a separate Network Reliability Report at least every three years. However, the Economic Regulator’s role is now limited to assessing the reliability of the network rather than the overall power system. In this regard, at the time of writing the Economic Regulator had commenced a network reliability review. Findings from the review in terms of the issues that may impact on network reliability in the medium term will be outlined in the Economic Regulator’s Network Reliability Review Report, which is expected to be published in 2016.
In conclusion, the Regulator trusts that this Report will be a useful reference document both for those working in the Tasmanian energy supply industry and for readers with an interest in the industry.
ENERGY IN TASMANIA – PERFORMANCE REPORT 2014-15 1
1 OVERVIEW OF THE TASMANIAN ENERGY INDUSTRY
Public reporting of performance is an important tool to protect consumers and promote efficiency and competition. This is particularly the case in markets dominated by a limited number of players as is the case with the Tasmanian energy supply industry.
In this regard, the Electricity Supply Industry Act 1995 (ESI Act) gives the Tasmanian Economic Regulator (the Regulator) certain functions to protect the interests of electricity consumers through, among other things, establishing and enforcing appropriate standards of safety, security, reliability and quality. The Regulator is also responsible for gas regulation under the Gas Act 2000 (Gas Act), Gas Pipelines Act 2000 (Gas Pipelines Act) and the Gas Pipelines Access (Tasmania) Act 2000.
Under the ESI Act, the Gas Act and the Gas Pipelines Act, the Economic Regulator may prepare state of the industry performance reports with respect to the performance of the electricity supply and gas supply industries.
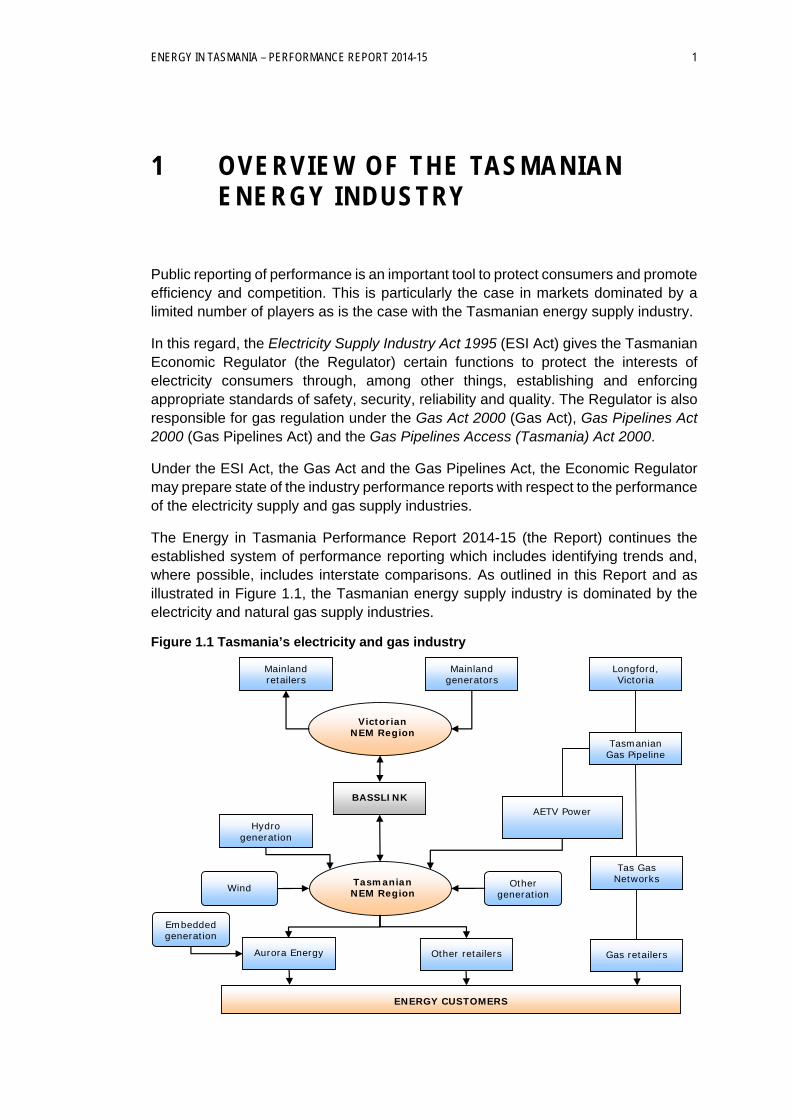
The Energy in Tasmania Performance Report 2014-15 (the Report) continues the established system of performance reporting which includes identifying trends and, where possible, includes interstate comparisons. As outlined in this Report and as illustrated in Figure 1.1, the Tasmanian energy supply industry is dominated by the electricity and natural gas supply industries.
Figure 1.1 Tasmania’s electricity and gas industry
Mainland retailers
Mainland generators
Longford, Victoria
Victorian NEM Region
Tasmanian Gas Pipeline
BASSLINK
Hydro generation
AETV Power
Tas Gas Networks
Gas retailers Other retailers Aurora Energy
Tasmanian NEM Region
ENERGY CUSTOMERS
Wind Other generation
Embedded generation
2 ENERGY IN TASMANIA – PERFORMANCE REPORT 2014-15
The Report also includes sections, prepared by the Department of State Growth, in relation to other fuel sources namely petroleum, coal and wood. The Economic Regulator does not have any regulatory role in relation to these additional fuel sources.
The Report, therefore, aims to provide consumers with a comprehensive review of the performance of the Tasmanian energy industry, covering all major energy sources used in Tasmania.
The energy supply industry is of fundamental importance to the Tasmanian economy. The price and reliability of energy supplied impacts significantly on the economic performance of other sectors of the Tasmanian economy. In addition, it provides employment, generates investment, and contributes to the State Budget by way of taxes and returns to owners (ie income tax equivalent payments, guarantee fees and dividends). More details about the respective contributions made by the electricity, gas and other fuel source industries to the Tasmanian economy are outlined in Appendix 1.
The energy supply industry in Tasmania is also exposed to national and international economic developments. With the Basslink electricity interconnector, the gas transmission pipeline, and greater sea and air access, Tasmania's economy has become more closely integrated with the Australian mainland economy. State economic performance and, to a lesser degree, growth in population and household expenditure, also have an impact on aggregate energy usage and on the economic performance of the energy supply industry.
In this regard, Chapter 2 of this Report outlines Tasmanian energy consumption during 2014-15 and presents an overview of Tasmanian energy demand and the contributions made by the various energy sources to the amount of energy consumed during 2014-15.
The balance of the Report (with the exception of the chapters on other fuels) presents the Economic Regulator’s assessment of the performance during 2014-15 of the various entities involved in the electricity supply and gas supply industries.
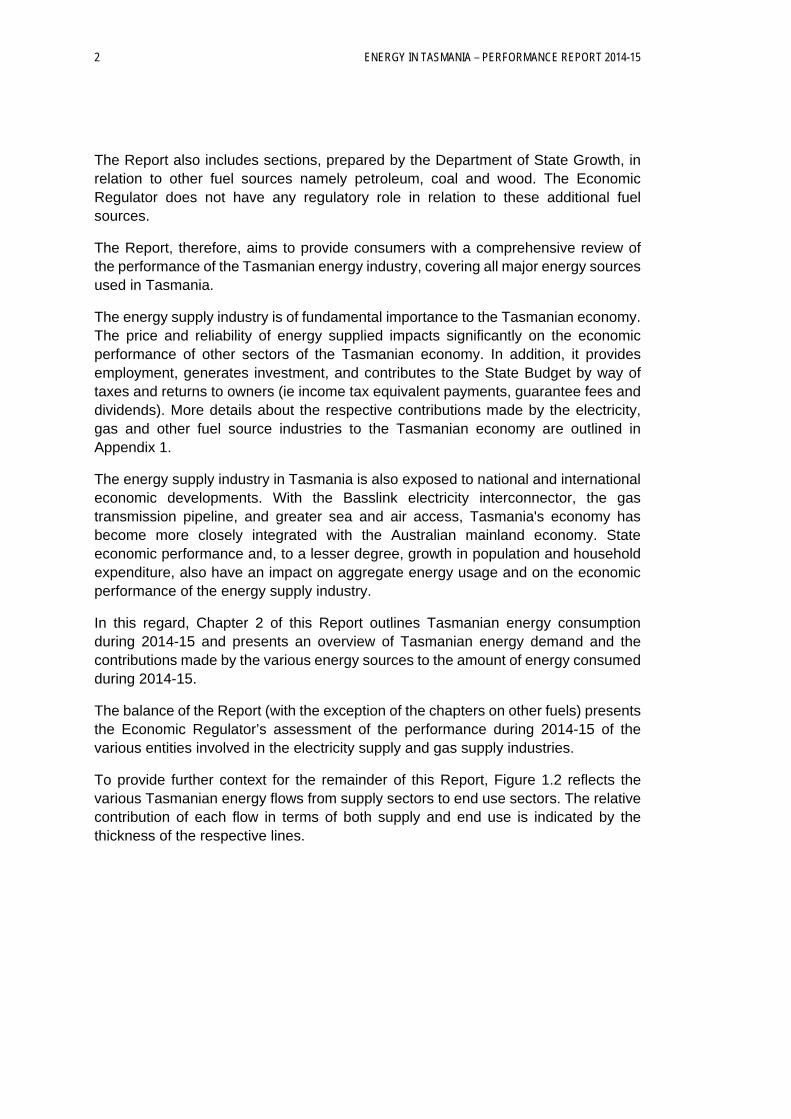
To provide further context for the remainder of this Report, Figure 1.2 reflects the various Tasmanian energy flows from supply sectors to end use sectors. The relative contribution of each flow in terms of both supply and end use is indicated by the thickness of the respective lines.
ENERGY IN TASMANIA – PERFORMANCE REPORT 2014-15 3
Figure 1.2 Tasmanian Energy Flow Diagram
Source: All data derived from Department of Industry and Science, Australian Energy Statistics 2015, except electricity supply and Basslink data (from TasNetworks) and some gas data.
Notes: (a) All residential and commercial vehicle use is included within the transport end use sector. (b) Electricity network losses are calculated based on an estimation of 8%. (c) Liquid Fuels includes 0.4 PJ of Biofuels.
ThermalPower Station
Elec
tric
ity
Net
wor
k
Transport
Residential
Commercial
Industrial
Basslink Export
Network LossesThermal Losses
Liquid Fuels
Coal
Wood
Gas
Hydro
Wind
Basslink ImportEmbedded
Generation
SUPPLY END USE

ENERGY IN TASMANIA – PERFORMANCE REPORT 2014-15 5
2 ENERGY CONSUMPTION IN TASMANIA
2.1 Introduction
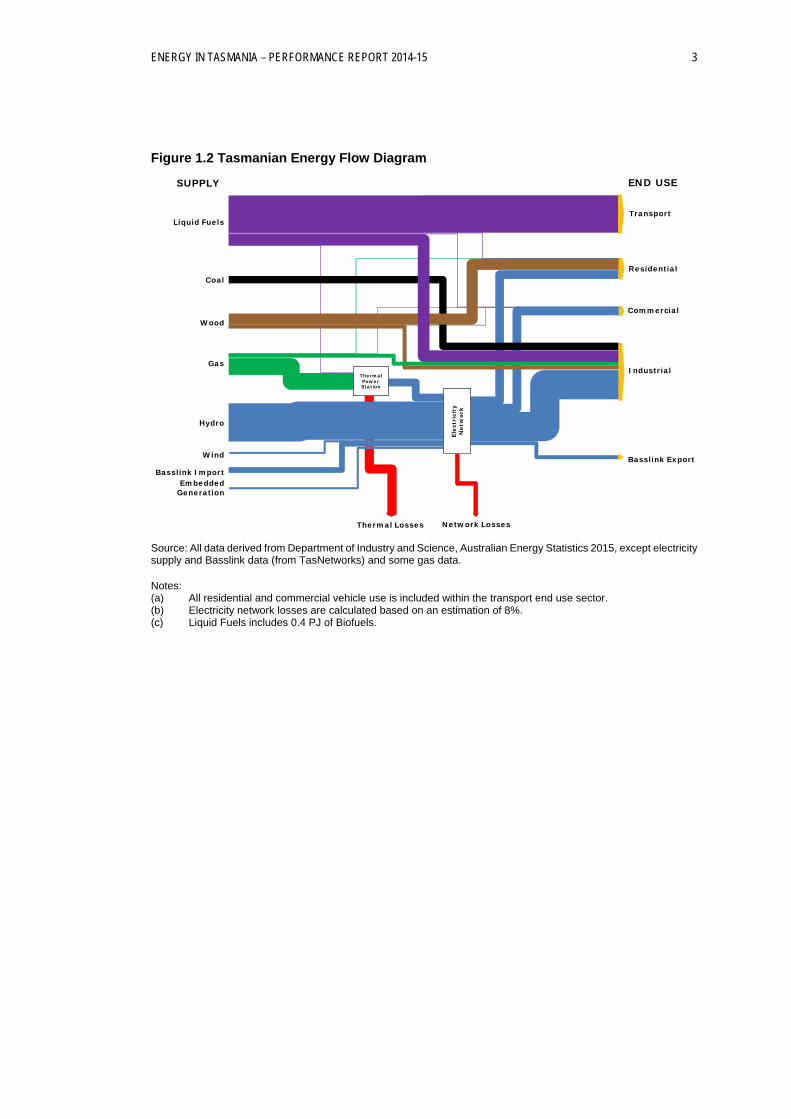
Most of Tasmania’s energy is consumed by the manufacturing (40 per cent) and transport sectors (24 per cent) with the residential sector consuming just 13 per cent of energy. Figure 2.1 and Figure 2.2 show the break-down of energy consumed in Tasmania by end use sector and fuel type respectively.
Figure 2.1 Tasmanian energy consumption by end use sector (2013-14)
Source: Department of Industry, Innovation and Science, Australian Energy Statistics 2015.
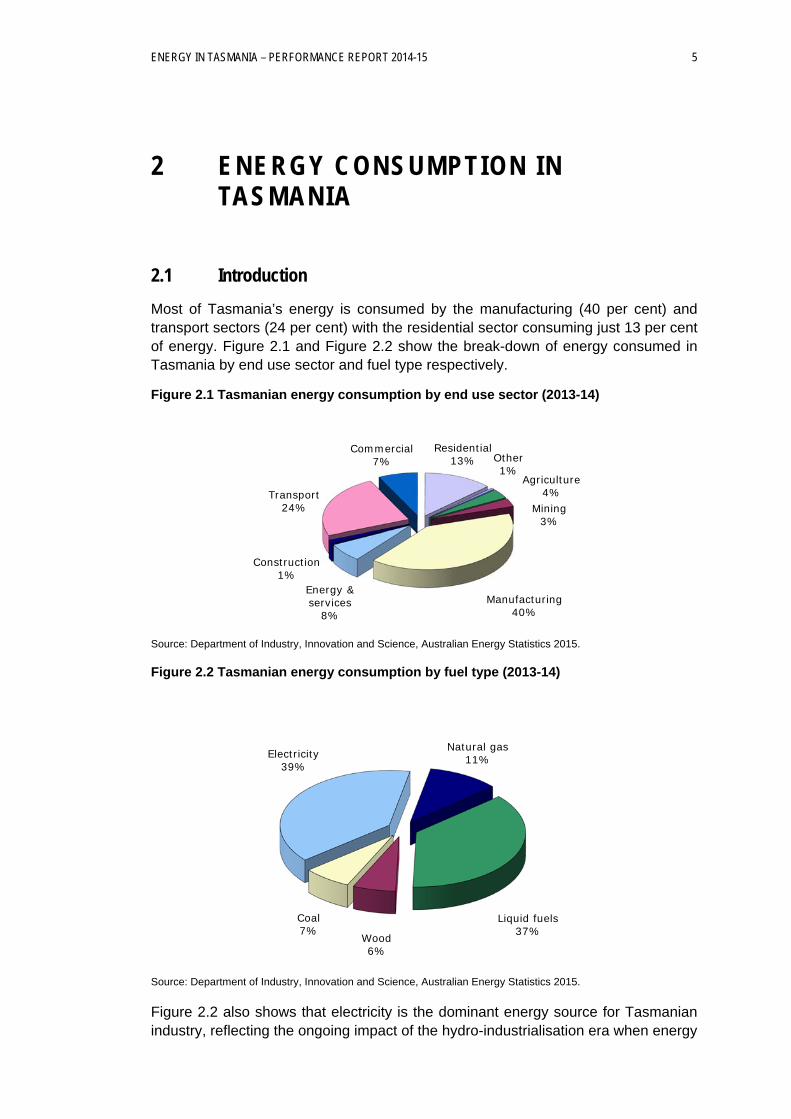
Figure 2.2 Tasmanian energy consumption by fuel type (2013-14)
Source: Department of Industry, Innovation and Science, Australian Energy Statistics 2015.
Figure 2.2 also shows that electricity is the dominant energy source for Tasmanian industry, reflecting the ongoing impact of the hydro-industrialisation era when energy
Agriculture4%
Mining3%
Manufacturing40%
Energy & services
8%
Construction1%
Transport24%
Commercial7%
Residential13% Other
1%
Liquid fuels37%Wood
6%
Coal7%
Electricity39%
Natural gas11%
6 ENERGY IN TASMANIA – PERFORMANCE REPORT 2014-15
intensive industries such as aluminium, manganese and zinc smelting and paper and cement manufacturing were established in Tasmania.
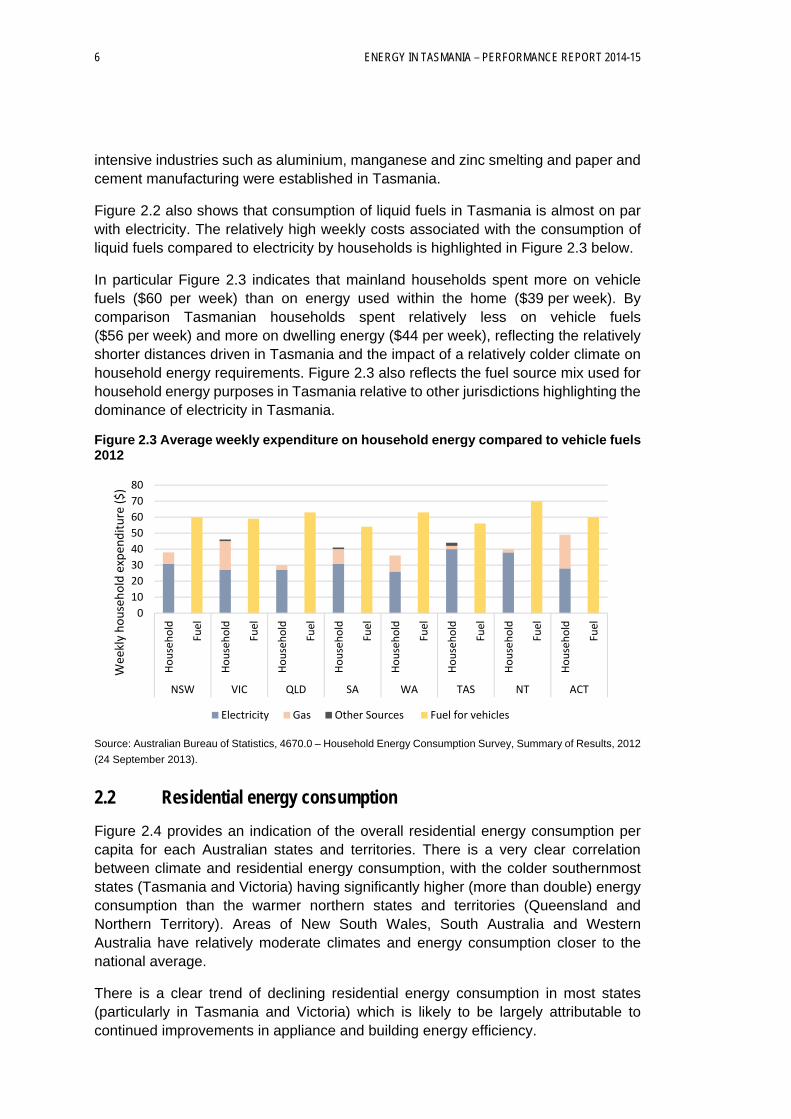
Figure 2.2 also shows that consumption of liquid fuels in Tasmania is almost on par with electricity. The relatively high weekly costs associated with the consumption of liquid fuels compared to electricity by households is highlighted in Figure 2.3 below.
In particular Figure 2.3 indicates that mainland households spent more on vehicle fuels ($60 per week) than on energy used within the home ($39 per week). By comparison Tasmanian households spent relatively less on vehicle fuels ($56 per week) and more on dwelling energy ($44 per week), reflecting the relatively shorter distances driven in Tasmania and the impact of a relatively colder climate on household energy requirements. Figure 2.3 also reflects the fuel source mix used for household energy purposes in Tasmania relative to other jurisdictions highlighting the dominance of electricity in Tasmania.
Figure 2.3 Average weekly expenditure on household energy compared to vehicle fuels 2012
Source: Australian Bureau of Statistics, 4670.0 – Household Energy Consumption Survey, Summary of Results, 2012
(24 September 2013).
2.2 Residential energy consumption
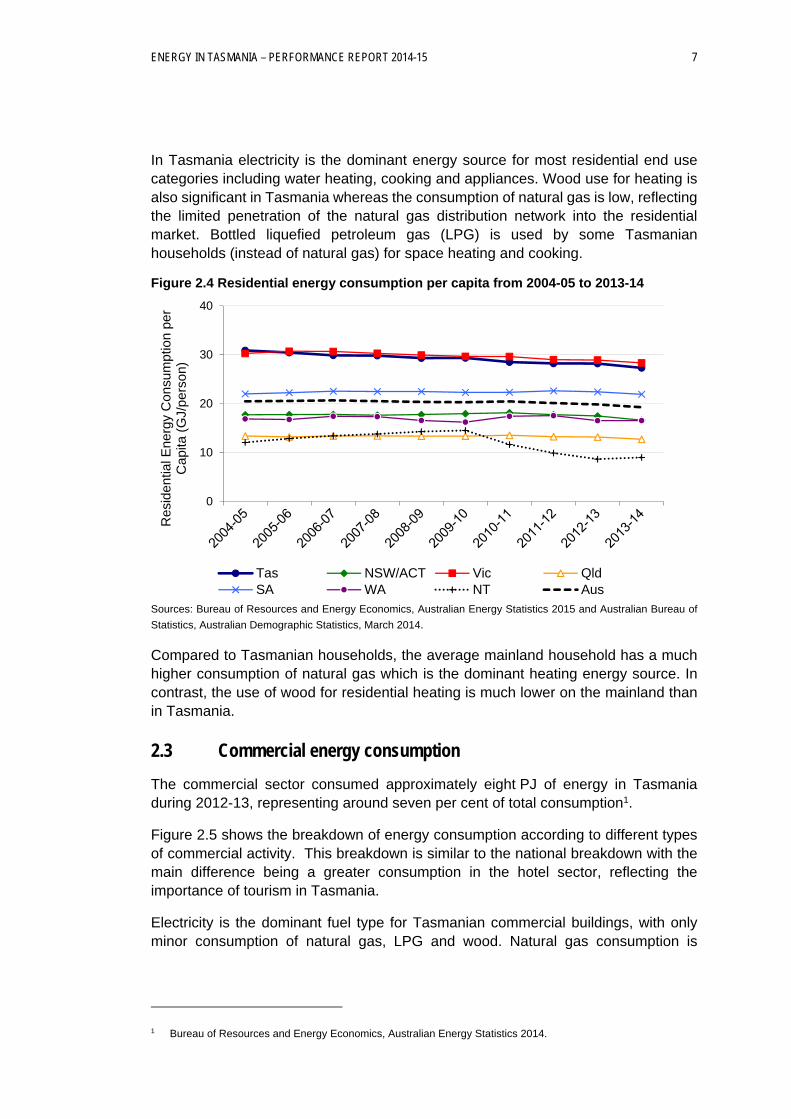
Figure 2.4 provides an indication of the overall residential energy consumption per capita for each Australian states and territories. There is a very clear correlation between climate and residential energy consumption, with the colder southernmost states (Tasmania and Victoria) having significantly higher (more than double) energy consumption than the warmer northern states and territories (Queensland and Northern Territory). Areas of New South Wales, South Australia and Western Australia have relatively moderate climates and energy consumption closer to the national average.
There is a clear trend of declining residential energy consumption in most states (particularly in Tasmania and Victoria) which is likely to be largely attributable to continued improvements in appliance and building energy efficiency.
0
10
20
30
40
50
60
70
80
Household
Fuel
Household
Fuel
Household
Fuel
Household
Fuel
Household
Fuel
Household
Fuel
Household
Fuel
Household
Fuel
NSW VIC QLD SA WA TAS NT ACT
Weekly household expen
diture ($)
Electricity Gas Other Sources Fuel for vehicles
ENERGY IN TASMANIA – PERFORMANCE REPORT 2014-15 7
In Tasmania electricity is the dominant energy source for most residential end use categories including water heating, cooking and appliances. Wood use for heating is also significant in Tasmania whereas the consumption of natural gas is low, reflecting the limited penetration of the natural gas distribution network into the residential market. Bottled liquefied petroleum gas (LPG) is used by some Tasmanian households (instead of natural gas) for space heating and cooking.
Figure 2.4 Residential energy consumption per capita from 2004-05 to 2013-14
Sources: Bureau of Resources and Energy Economics, Australian Energy Statistics 2015 and Australian Bureau of
Statistics, Australian Demographic Statistics, March 2014.
Compared to Tasmanian households, the average mainland household has a much higher consumption of natural gas which is the dominant heating energy source. In contrast, the use of wood for residential heating is much lower on the mainland than in Tasmania.
2.3 Commercial energy consumption
The commercial sector consumed approximately eight PJ of energy in Tasmania during 2012-13, representing around seven per cent of total consumption1.
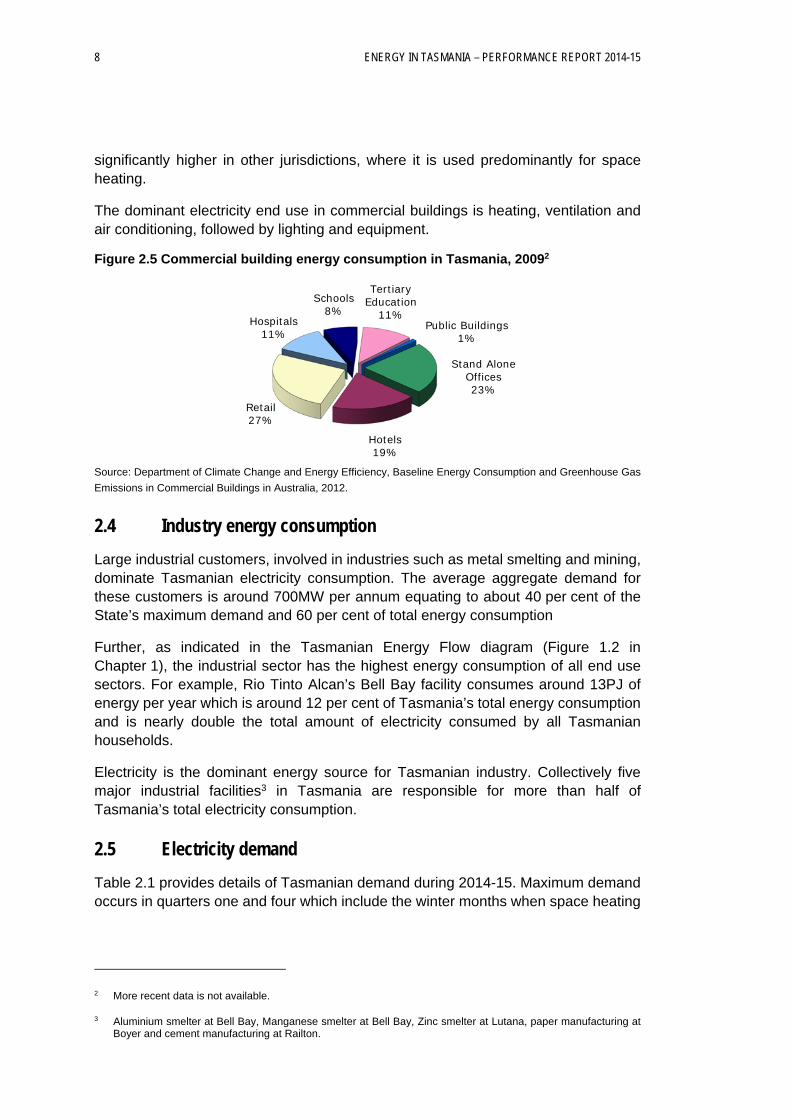
Figure 2.5 shows the breakdown of energy consumption according to different types of commercial activity. This breakdown is similar to the national breakdown with the main difference being a greater consumption in the hotel sector, reflecting the importance of tourism in Tasmania.
Electricity is the dominant fuel type for Tasmanian commercial buildings, with only minor consumption of natural gas, LPG and wood. Natural gas consumption is
1 Bureau of Resources and Energy Economics, Australian Energy Statistics 2014.
0
10
20
30
40
Res
iden
tial E
nerg
y C
onsu
mpt
ion
per
Cap
ita (
GJ/
pers
on)
Tas NSW/ACT Vic QldSA WA NT Aus
8 ENERGY IN TASMANIA – PERFORMANCE REPORT 2014-15
significantly higher in other jurisdictions, where it is used predominantly for space heating.
The dominant electricity end use in commercial buildings is heating, ventilation and air conditioning, followed by lighting and equipment.
Figure 2.5 Commercial building energy consumption in Tasmania, 20092
Source: Department of Climate Change and Energy Efficiency, Baseline Energy Consumption and Greenhouse Gas
Emissions in Commercial Buildings in Australia, 2012.
2.4 Industry energy consumption
Large industrial customers, involved in industries such as metal smelting and mining, dominate Tasmanian electricity consumption. The average aggregate demand for these customers is around 700MW per annum equating to about 40 per cent of the State’s maximum demand and 60 per cent of total energy consumption
Further, as indicated in the Tasmanian Energy Flow diagram (Figure 1.2 in Chapter 1), the industrial sector has the highest energy consumption of all end use sectors. For example, Rio Tinto Alcan’s Bell Bay facility consumes around 13PJ of energy per year which is around 12 per cent of Tasmania’s total energy consumption and is nearly double the total amount of electricity consumed by all Tasmanian households.
Electricity is the dominant energy source for Tasmanian industry. Collectively five major industrial facilities3 in Tasmania are responsible for more than half of Tasmania’s total electricity consumption.
2.5 Electricity demand
Table 2.1 provides details of Tasmanian demand during 2014-15. Maximum demand occurs in quarters one and four which include the winter months when space heating
2 More recent data is not available.
3 Aluminium smelter at Bell Bay, Manganese smelter at Bell Bay, Zinc smelter at Lutana, paper manufacturing at Boyer and cement manufacturing at Railton.
Stand Alone Offices23%
Hotels19%
Retail27%
Hospitals11%
Schools8%
Tertiary Education
11%Public Buildings
1%
ENERGY IN TASMANIA – PERFORMANCE REPORT 2014-15 9
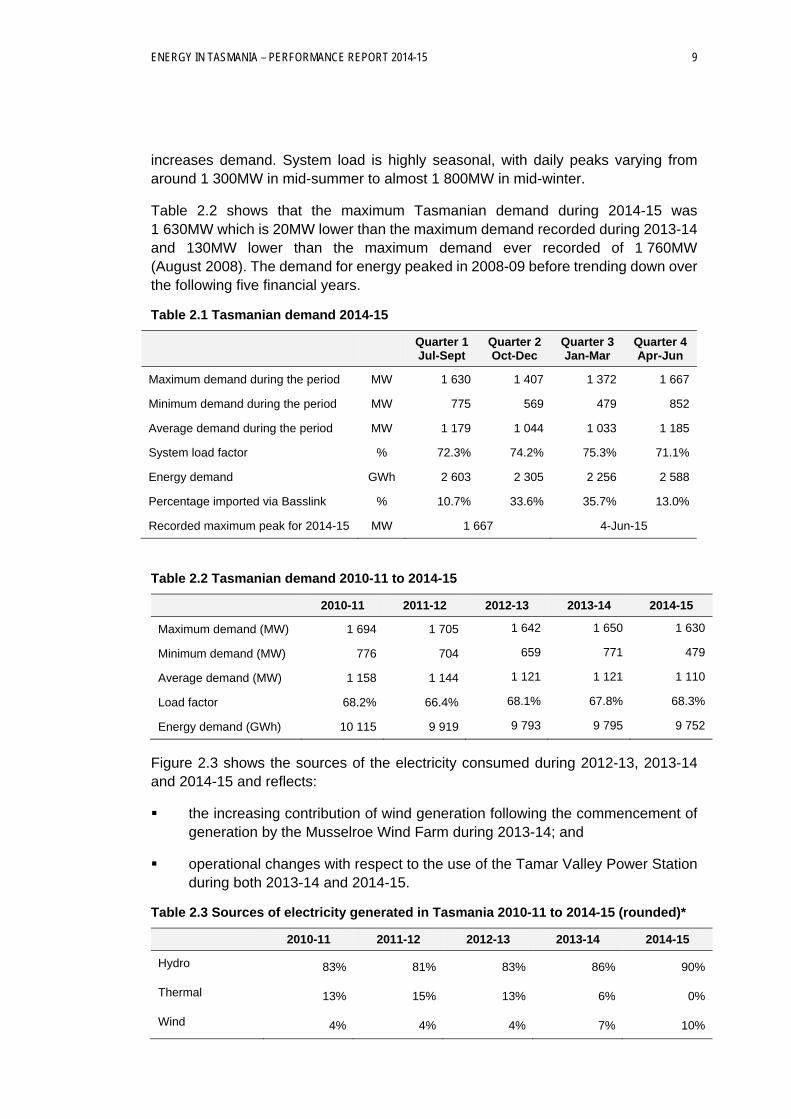
increases demand. System load is highly seasonal, with daily peaks varying from around 1 300MW in mid-summer to almost 1 800MW in mid-winter.
Table 2.2 shows that the maximum Tasmanian demand during 2014-15 was 1 630MW which is 20MW lower than the maximum demand recorded during 2013-14 and 130MW lower than the maximum demand ever recorded of 1 760MW (August 2008). The demand for energy peaked in 2008-09 before trending down over the following five financial years.
Table 2.1 Tasmanian demand 2014-15
Quarter 1 Jul-Sept
Quarter 2 Oct-Dec
Quarter 3 Jan-Mar
Quarter 4 Apr-Jun
Maximum demand during the period MW 1 630 1 407 1 372 1 667
Minimum demand during the period MW 775 569 479 852
Average demand during the period MW 1 179 1 044 1 033 1 185
System load factor % 72.3% 74.2% 75.3% 71.1%
Energy demand GWh 2 603 2 305 2 256 2 588
Percentage imported via Basslink % 10.7% 33.6% 35.7% 13.0%
Recorded maximum peak for 2014-15 MW 1 667 4-Jun-15
Table 2.2 Tasmanian demand 2010-11 to 2014-15
2010-11 2011-12 2012-13 2013-14 2014-15
Maximum demand (MW) 1 694 1 705 1 642 1 650 1 630
Minimum demand (MW) 776 704 659 771 479
Average demand (MW) 1 158 1 144 1 121 1 121 1 110
Load factor 68.2% 66.4% 68.1% 67.8% 68.3%
Energy demand (GWh) 10 115 9 919 9 793 9 795 9 752
Figure 2.3 shows the sources of the electricity consumed during 2012-13, 2013-14 and 2014-15 and reflects:
the increasing contribution of wind generation following the commencement of generation by the Musselroe Wind Farm during 2013-14; and
operational changes with respect to the use of the Tamar Valley Power Station during both 2013-14 and 2014-15.
Table 2.3 Sources of electricity generated in Tasmania 2010-11 to 2014-15 (rounded)*
2010-11 2011-12 2012-13 2013-14 2014-15
Hydro 83% 81% 83% 86% 90%
Thermal 13% 15% 13% 6% 0%
Wind 4% 4% 4% 7% 10%
10 ENERGY IN TASMANIA – PERFORMANCE REPORT 2014-15
*excludes Basslink imports and solar PV
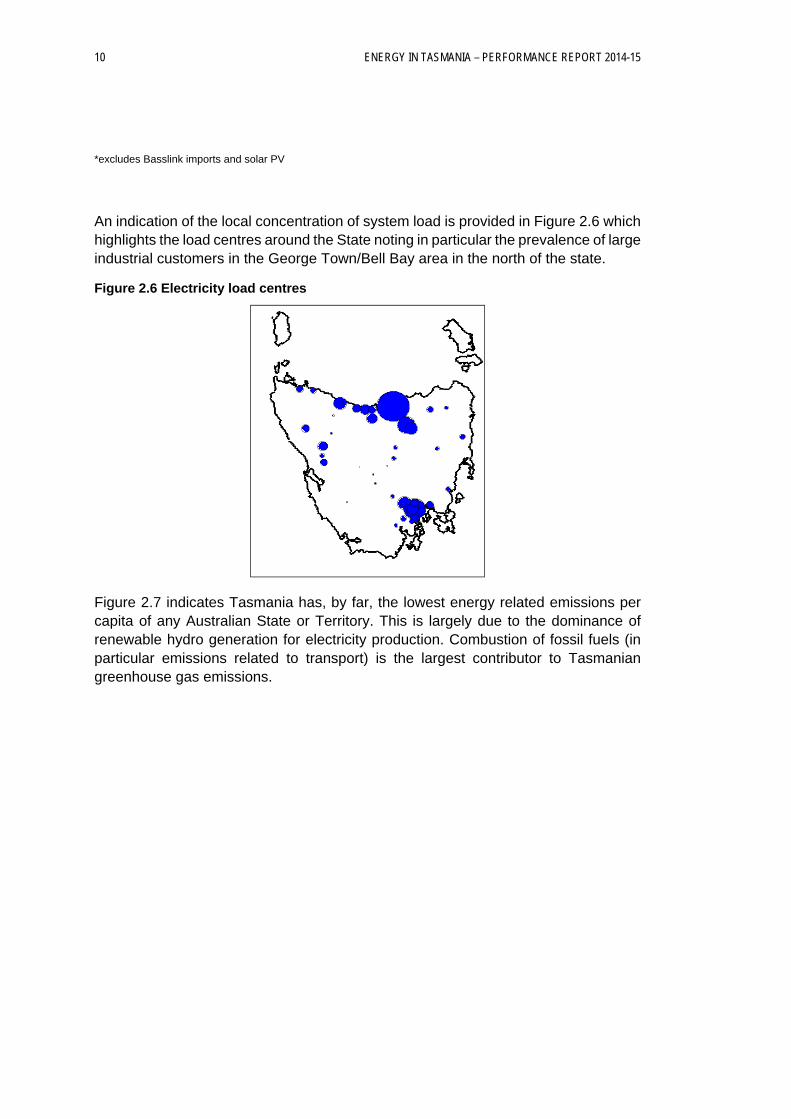
An indication of the local concentration of system load is provided in Figure 2.6 which highlights the load centres around the State noting in particular the prevalence of large industrial customers in the George Town/Bell Bay area in the north of the state.
Figure 2.6 Electricity load centres
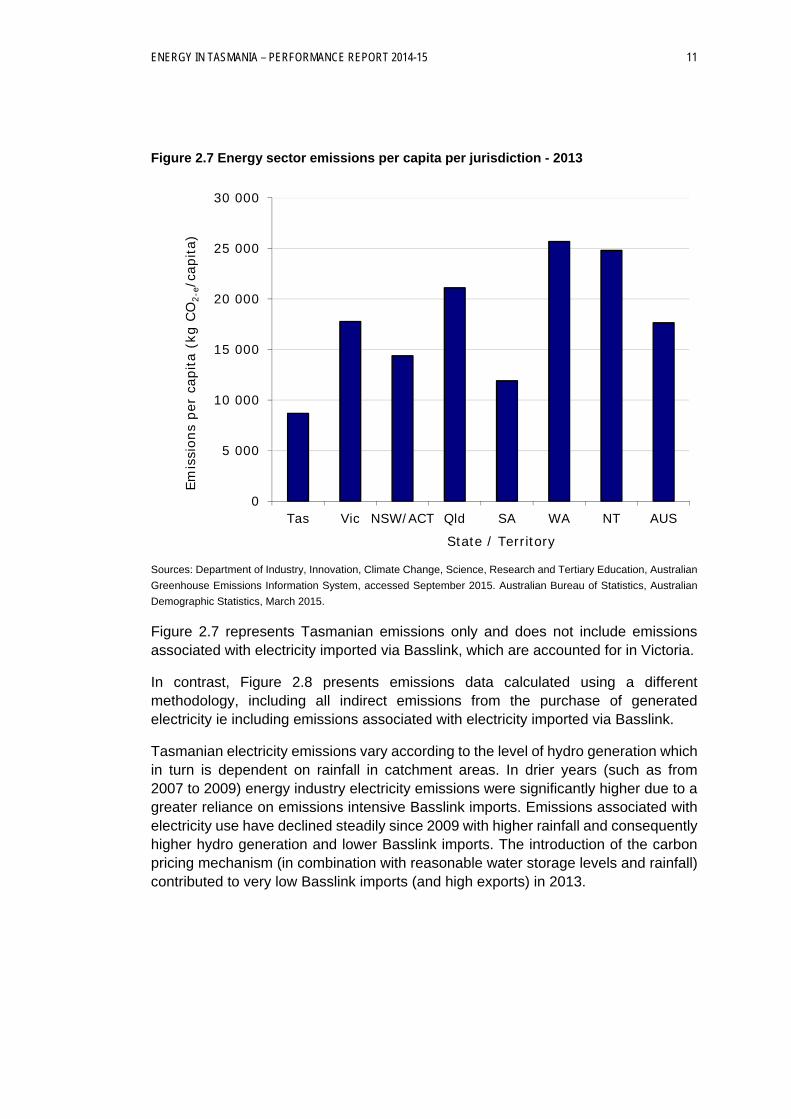
Figure 2.7 indicates Tasmania has, by far, the lowest energy related emissions per capita of any Australian State or Territory. This is largely due to the dominance of renewable hydro generation for electricity production. Combustion of fossil fuels (in particular emissions related to transport) is the largest contributor to Tasmanian greenhouse gas emissions.
273
ENERGY IN TASMANIA – PERFORMANCE REPORT 2014-15 11
Figure 2.7 Energy sector emissions per capita per jurisdiction - 2013
Sources: Department of Industry, Innovation, Climate Change, Science, Research and Tertiary Education, Australian
Greenhouse Emissions Information System, accessed September 2015. Australian Bureau of Statistics, Australian
Demographic Statistics, March 2015.
Figure 2.7 represents Tasmanian emissions only and does not include emissions associated with electricity imported via Basslink, which are accounted for in Victoria.
In contrast, Figure 2.8 presents emissions data calculated using a different methodology, including all indirect emissions from the purchase of generated electricity ie including emissions associated with electricity imported via Basslink.
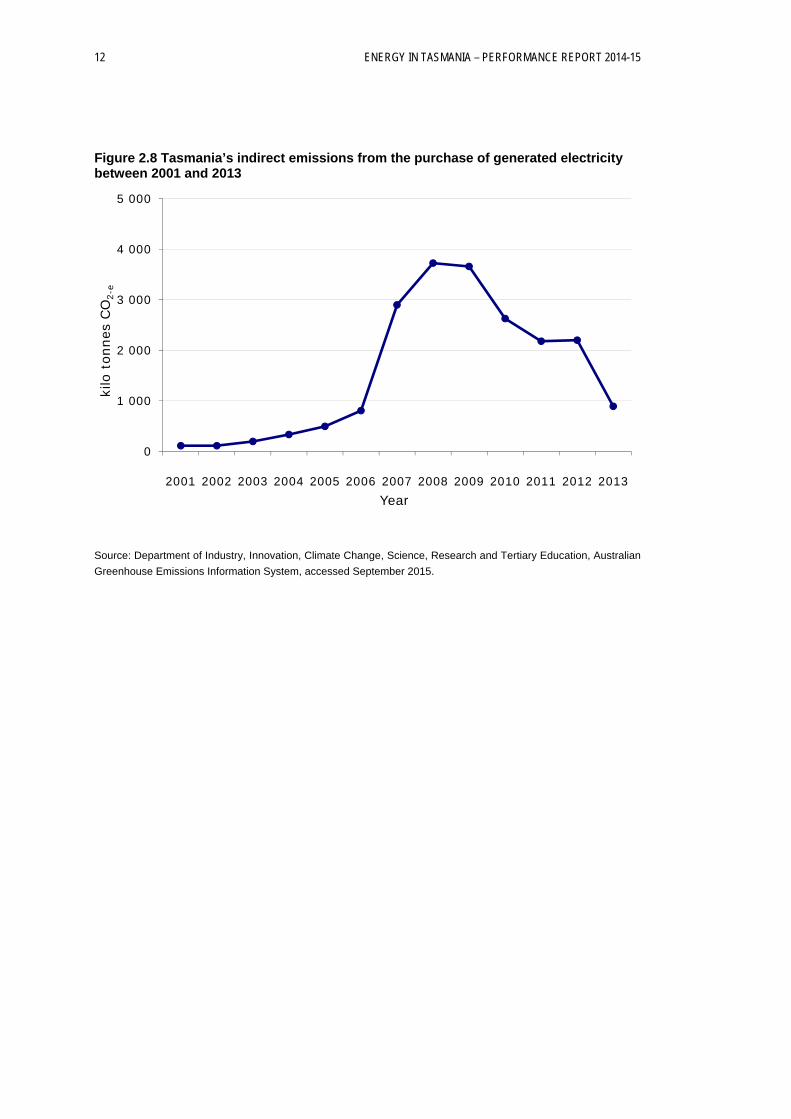
Tasmanian electricity emissions vary according to the level of hydro generation which in turn is dependent on rainfall in catchment areas. In drier years (such as from 2007 to 2009) energy industry electricity emissions were significantly higher due to a greater reliance on emissions intensive Basslink imports. Emissions associated with electricity use have declined steadily since 2009 with higher rainfall and consequently higher hydro generation and lower Basslink imports. The introduction of the carbon pricing mechanism (in combination with reasonable water storage levels and rainfall) contributed to very low Basslink imports (and high exports) in 2013.
0
5 000
10 000
15 000
20 000
25 000
30 000
Tas Vic NSW/ACT Qld SA WA NT AUS
Emis
sion
s pe
r ca
pita
(kg
CO
2-e/
capi
ta)
State / Territory
12 ENERGY IN TASMANIA – PERFORMANCE REPORT 2014-15
Figure 2.8 Tasmania’s indirect emissions from the purchase of generated electricity between 2001 and 2013
Source: Department of Industry, Innovation, Climate Change, Science, Research and Tertiary Education, Australian
Greenhouse Emissions Information System, accessed September 2015.
0
1 000
2 000
3 000
4 000
5 000
2001 2002 2003 2004 2005 2006 2007 2008 2009 2010 2011 2012 2013
kilo
ton
nes
CO
2-e
Year
ENERGY IN TASMANIA – PERFORMANCE REPORT 2014-15 13
3 OVERVIEW OF THE TASMANIAN ELECTRICITY SUPPLY INDUSTRY
3.1 Introduction
This Chapter provides an overview of the electricity supply industry in Tasmanian together with details of the current industry participants.
3.2 Industry structure and participants
The Tasmanian electricity supply industry comprises the generation, transmission, distribution and retail sectors. The Tasmanian generation and retail sectors are open to competition whilst transmission and distribution services are provided by a privately owned entity and a Government owned utility. The key participants as at 30 June 2015 were as follows:
The major electricity generator in Tasmania is Hydro Tasmania, a Government Business Enterprise that holds a licence for electricity generation in Tasmania as well as responsibility for generation, distribution and retailing on King and Flinders Islands – the ‘Bass Strait Islands’ (BSI).
Hydro Tasmania also owns and operates the gas-fired Tamar Valley Power Station (TVPS).
Hydro Tasmania also partly owns and operates the wind farms at Studland Bay and Bluff Point (collectively known as Woolnorth) and the Musselroe wind farm.
Hydro Tasmania sells the electricity it generates from its Tasmanian mainland operations in the National Electricity Market.
Hydro Tasmania's Ministerial Charter is intended to ensure that the reliability and security of the State's hydro system is maintained.
TasNetworks, a State-owned Company (SOC) operating under Corporations Law, provides transmission and distribution services on mainland Tasmania. TasNetworks distribution and transmission services are subject to economic regulation by the Australian Energy Regulator (AER).
Basslink Pty Ltd, a wholly owned subsidiary of the Keppel Infrastructure Trust, owns and operates the Bass Strait interconnector. Basslink Pty Ltd is classified as a transmission network service provider (TNSP) under the National Electricity Market (NEM).
Aurora Energy Pty Ltd (Aurora Energy), a SOC operating under Corporations Law, holds a retail authorisation for mainland Tasmania and is also the
14 ENERGY IN TASMANIA – PERFORMANCE REPORT 2014-15
regulated offer retailer for Tasmania and the “retailer of last resort” (RoLR)1. As the regulated offer retailer for the Tasmania jurisdiction Aurora Energy is required to supply electricity at Standing Offer prices to small customers (ie those consuming less than 150 MWh per annum) on mainland Tasmania.
ERM Power Retail Pty Ltd and by Progressive Green Pty Ltd are also authorised retailers and provide retail services to Tasmanian customers.
1 Under the National Electricity Customer Framework (NECF) scheme, the RoLR is required to ensure ongoing supply to consumers in cases where a retailer unexpectedly exits the industry.
ENERGY IN TASMANIA – PERFORMANCE REPORT 2014-15 15
4 ELECTRICITY REGULATION
4.1 Introduction
This chapter provides an overview of the regulatory framework for the Tasmanian electricity supply industry. The framework is a combination of national and jurisdictional arrangements.
All states and territories signed the Australian Energy Market Agreement (AEMA) in 2004, which outlined the intended functions and powers of the Australian Energy Regulator (AER) and the Australian Energy Market Commission (AEMC), as well as those functions that would remain with state and territory regulators.
In 2007, the Council of Australian Governments (COAG) agreed to establish a single, industry-funded national energy market operator for both electricity and gas - the Australian Energy Market Operator (AEMO)1, to provide energy market governance on a national basis. With respect to electricity, AEMO took over former NEMMCO functions.
COAG also established the Standing Council on Energy and Resources2 (SCER) which was replaced by the COAG Energy Council in December 2013. The COAG Energy Council’s focus is on developing an integrated and coherent national energy policy.
4.2 Legislative and regulatory framework
The National Electricity Law (NEL) and National Electricity Rules (NER) provide the overarching national regulatory framework for the electricity industry. However, many complementary state-based regulatory instruments remain.
The Economic Regulator Act 2009 (ER Act) created an independent Tasmanian Economic Regulator with responsibility under the Electricity Supply Industry Act 1995 (ESI Act) for regulating the Tasmanian electricity supply industry3.
The ESI Act also requires the Regulator to issue the Tasmanian Electricity Code (TEC). The TEC was based largely on the then National Electricity Code (NEC) but has been amended significantly following subsequent state and national reforms to the electricity supply industry.
1 For information on the history of AEMO, please see www.aemo.com.au
2 SCER replaced the Ministerial Council on Energy.
3 From 1 July 2015, the three person Tasmanian Economic Regulator Board was replaced and a single Tasmanian Economic Regulator appointed in accordance with legislative amendments introduced following the Government’s review of the Regulator’s role and functions. See section 5.5of this Report for further details.
16 ENERGY IN TASMANIA – PERFORMANCE REPORT 2014-15
On 1 July 2012 the National Energy Customer Framework (NECF) commenced in Tasmania with the AER assuming responsibility for authorising retailers operating in Tasmania4.
The NECF is a legislative package, comprising the National Energy Retail Law (NERL) and the National Energy Retail Rules (NERR) that implements the remainder of the national energy reforms agreed to between jurisdictions. The NECF also facilitates the transition to the national regulation of energy markets. Specifically, the NECF transfers consumer protection functions such as minimum contract terms and conditions and customer protection from state jurisdictions to the AER. However, the Regulator continues to be responsible for price regulation of standing offer prices (see Chapter 5).
The NECF introduced a new set of national laws, rules, and regulations governing the retail sale of energy to consumers. Due to changed reporting requirements for retailers under the NECF the Regulator no longer reports on retail electricity consumption.
Although under the NECF the AER is responsible for regulating energy retailers, retailers authorised to sell electricity under the NERL who operate in Tasmania also have obligations under the following Tasmanian legislation in addition to those under the National Energy Retail Law (Tasmania) Act:
Electricity Supply Industry Regulations 2008;
Electricity Supply Industry (Customer) Regulations 2012; and
Electricity Supply Industry (Pricing and Related Matters) Regulations 2013.
Full retail contestability for residential and business customers was introduced on 1 July 2014. Further information on the NECF and retail market reforms can be found on the AER’s website at www.aer.gov.au and the AEMC’s website at www.aemc.gov.au.
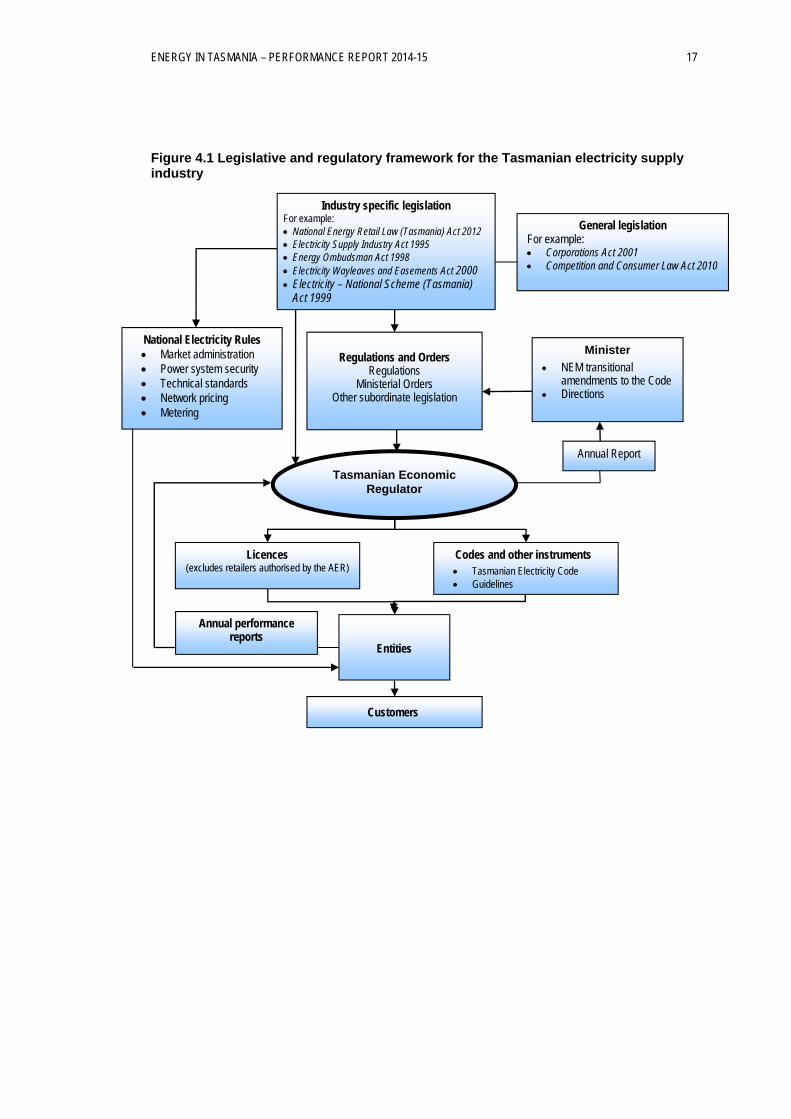
Figure 4.1 provides a schematic representation of the legislative and regulatory framework governing the Tasmanian electricity supply industry.
4 The AER had been responsible for the regulation of transmission services since 2009.
ENERGY IN TASMANIA – PERFORMANCE REPORT 2014-15 17
Figure 4.1 Legislative and regulatory framework for the Tasmanian electricity supply industry
Regulations and Orders Regulations
Ministerial Orders Other subordinate legislation
Minister
NEM transitional amendments to the Code
Directions
Tasmanian Economic Regulator
National Electricity Rules Market administration Power system security Technical standards Network pricing Metering
Licences (excludes retailers authorised by the AER)
Entities
Annual performance reports
Customers
Codes and other instruments Tasmanian Electricity Code Guidelines
General legislation For example: Corporations Act 2001 Competition and Consumer Law Act 2010
Industry specific legislation For example: National Energy Retail Law (Tasmania) Act 2012 Electricity Supply Industry Act 1995 Energy Ombudsman Act 1998 Electricity Wayleaves and Easements Act 2000 Electricity – National Scheme (Tasmania)
Act 1999
Annual Report

ENERGY IN TASMANIA – PERFORMANCE REPORT 2014-15 19
5 REGULATORY BODIES
5.1 Introduction
This Chapter provides a description of the National and Tasmanian regulatory bodies involved in regulating the Tasmanian energy supply industry and outlines their respective roles and functions.
5.2 Australian Energy Market Commission
The AEMC was established as a national independent body in 2005, in accordance with the Australian Energy Market Agreement (AEMA).
The AEMC is responsible for market development and providing advice to relevant organisations in relation to the NEM.
The AEMC also makes rules under the National Electricity Law, the National Gas Law and the National Energy Retail Law. These rules cover areas such as participation in the wholesale spot market for electricity and similar markets for gas, economic regulation of network services and energy-specific consumer protections. The AEMC does not have any regulatory enforcement responsibilities and is unable to initiate rule changes itself other than those of a minor administrative nature1.
The AEMC’s Reliability Panel (established by the AEMC under the National Electricity Law):
monitors, reviews and reports on the safety, security and reliability of the national electricity system, in accordance with the NER;
at the request of the AEMC, provides advice in relation to the safety, security and reliability of the national electricity system; and
manages and executes any other functions or powers conferred on it under the Law and the Rules.
The Reliability Panel sets the frequency standards for Tasmanian. Although Tasmania is a participating jurisdiction in the NEM, the Tasmanian power system is not synchronised with the mainland’s power system due to the Basslink interconnector being an asynchronous direct current (DC) connection. As a result, the frequency operating standards adopted in Tasmania allow for wider variations than their NEM mainland equivalents. The significantly wider standards recognise that a large number of installed hydroelectric generators are unable to change their output rapidly therefore relatively large fluctuations in power can occur in Tasmania
1 For further information on the AEMC, please see www.aemc.gov.au
20 ENERGY IN TASMANIA – PERFORMANCE REPORT 2014-15
(compared to the mainland) from the operations of large industrial users, generator trips, transmission line trips and power transfers over Basslink.
The Reliability Panel has set Tasmanian frequency standards that specify the normal operating frequency band (49.85 to 50.15 Hz) for the power system and the duration and circumstances in which the frequency is allowed to deviate from that frequency band (eg if a contingency or load event occurs).
A system protection scheme (SPS) was constructed in conjunction with Basslink to manage network contingencies or an outage on Basslink. The SPS encompasses two parts; the Frequency Control System Protection Scheme (FCSPS) and the Network Control System Protection Scheme (NCSPS).
The FCSPS is designed to ensure that, following the loss of Basslink, the Tasmanian frequency remains within the standards by initiating load shedding by contracted customers or increased or decreased output from contracted generators.
The NCSPS facilitates higher power transfers from Tasmania to Victoria via Basslink by allowing selected transmission lines in Tasmania to transfer power up to 95 per cent of their continuous ratings under normal system conditions, prior to the occurrence of a transmission contingency. For more information on the NCSPS refer to pages 137-8 of the 2011-12 Energy in Tasmania report.
The Tasmanian Economic Regulator has a Memorandum of Understanding with the AEMC to facilitate the sharing of relevant information, cooperation and coordination between the organisations.
5.3 Australian Energy Regulator
The AER is a statutory body established in 2005 and funded by the Australian Government. Although the AER is part of the ACCC it operates as a separate legal entity. The AER is accountable to governments and market participants through consultation, reporting, transparent obligations and accessible avenues of appeal against regulatory decisions.
The AER exercises powers under a national energy legislative framework which, for electricity, includes the NEL, the NECF and associated rules and sector specific regulatory functions. It is responsible for the regulation of the electricity wholesale market and economic regulation of electricity and gas transmission and distribution networks. As such, the AER is responsible for the economic regulation of TasNetworks’ distribution and transmission services. The AER's determination specifies the revenues, prices and levels of service in respect of those services2.
2 TasNetworks was formed on 1 July 2014 following a merger between Aurora Energy’s distribution network and Transend’s transmission network. As a result, while Aurora Energy (as a distributor) submitted the regulatory proposal to the AER for the distribution network, the AER’s subsequent determination applies to TasNetworks.
ENERGY IN TASMANIA – PERFORMANCE REPORT 2014-15 21
5.4 Australian Energy Market Operator
The AEMO was created in 2009 by COAG to manage the NEM and gas markets. It is an independent, member-based organisation with membership split 60/40 between government and industry. Government members of AEMO include the state governments of Queensland, New South Wales, Victoria, South Australia and Tasmania, the Australian Capital Territory and the Commonwealth. Private members include Australia’s major energy generators, wholesalers and retailers.
In relation to electricity, AEMO is responsible for:
power system operation and market operation;
national transmission planning;
monitoring transmission services; and
facilitating energy market development.
AEMO’s functions are set out in the NEL while the NER prescribes all procedures and processes for market operations, power system security, network connection and access, pricing for network services in the NEM and national transmission planning.
In its power system security role, AEMO is responsible for:
ensuring that the power system is operated in a safe, secure and reliable manner; and
emergency management in respect to the power system.
To ensure that key technical characteristics of the power system such as frequency, network loading and voltage are maintained within prescribed limits AEMO operates an ancillary services market. More details about ancillary services are set out in Chapter 7 (Generation).
AEMO exercises its emergency management responsibilities under an agreed framework in all NEM jurisdictions (Tasmania, Victoria, South Australia, Australian Capital Territory, New South Wales and Queensland) known as the Power System Emergency Management Plan (PSEMP).
There are also a number of other national plans in relation to emergency management:
the National Gas Emergency Response Protocol; and
the National Liquid Fuel Emergency Response Plan.
Tasmania has committed to aligning its emergency management procedures with these national plans through memoranda of understanding with the mainland jurisdictions.
There are currently a number of committees in Tasmania that deal with emergency management issues in relation to the energy supply industry. At the time of writing,
22 ENERGY IN TASMANIA – PERFORMANCE REPORT 2014-15
the Department of State Growth was reviewing the roles and functions of these committees.
5.5 Tasmanian Economic Regulator
5.5.1 Overview
With the exception of specific legislative provisions, the Economic Regulator is not subject to Ministerial direction and therefore operates independently from the Tasmanian Government.
The Electricity Supply Industry Act 1995 (ESI Act) gives the Economic Regulator certain functions to protect the interests of electricity consumers by, among other things, establishing and enforcing appropriate standards of safety, security, reliability and quality.
During 2014-15, the structure of the Economic Regulator and its role and functions changed as a result of the introduction of changes in the Economic Regulator Amendment Act 2015 (the Amendment Act). The Amendment Act was based on the outcomes from the Government’s review of the Economic Regulator’s role and functions and made a number of consequential amendments to the industry specific acts that govern the Economic Regulator’s operations.
In terms of the Economic Regulator Act 2009 (ER Act) and the Economic Regulator itself, the Amendment Act:
reduced the membership of the Economic Regulator from a three person panel to a single person with the capacity to appoint an Assistant Economic Regulator for specific functions if required;
provided for the capacity to appoint an Acting Economic Regulator in instances where the Regulator is indisposed;
required that all appointments are to be made by the Minister responsible for the ER Act; and
allowed for the appointment of the Economic Regulator to be external to the State Service.
With respect to electricity, the Amendment Act required the Economic Regulator to:
prepare an energy industry performance report on its own initiative, or if directed to by the Energy Minister with the agreement of the Minister responsible for the ER Act (ie the Treasurer);
prepare interstate electricity price comparisons on its own initiative or if directed to by the Minister responsible for the pricing-related provisions in the ESI Act, with agreement from the Minister responsible for the ER Act;
produce annual comparisons of Aurora Pay as You Go (APAYG) and standard tariff prices for electricity customers in Tasmania; and
ENERGY IN TASMANIA – PERFORMANCE REPORT 2014-15 23
prepare a report on Tasmania’s electricity network reliability every three years or more frequently at the Regulator’s own initiative or if directed to by the Energy Minister, with the agreement of the Minister responsible for the ER Act.
The Amendment Act received Royal Assent on 19 May 2015 with the consequential changes becoming effective from 1 July 2015.
In relation to this Report, on 7 September 2015, the Minister for Energy and the Treasurer jointly directed the Regulator to prepare a performance report for 2014-15.
During 2014-15 the Economic Regulator had the following responsibilities in relation to electricity:
administering the licensing system for electricity entities (with the exception of retailer authorisations which are the AER’s responsibility);
monitoring and regulating technical standards;
monitoring and enforcing compliance;
issuing, maintaining, administering and enforcing electricity codes and guidelines;
reviewing and reporting on the power system reliability3;
regulating prices for declared electrical services (eg raise contingency FCAS);
determining regulated Feed-in Tariff (FiT) rates;
determining Aurora Energy’s standing offer retail electricity prices;
monitoring wholesale electricity financial contract prices; and
other functions under the electricity legislative and regulatory frameworks.
5.5.2 Pricing and pricing related functions
The Economic Regulator is responsible for determining standing offer prices and making regulated feed-in tariff (FiT) rate determinations for standard FiT customers. The Economic Regulator also monitors certain wholesale electricity financial contract prices.
5.5.2.1 Standing offer prices
The framework under which the Economic Regulator sets standing offer prices includes the:
ESI Act;
3 Changed to network reliability from 1 July 2015.
24 ENERGY IN TASMANIA – PERFORMANCE REPORT 2014-15
Electricity Supply Industry (Pricing and Related Matters) Regulations 2013; and
Electricity Guideline for the Approval of Standing Offer Prices in accordance with the 2013 Standing Offer Determination (April 2014).
The prices paid by small customers for the supply of electricity are determined by the Economic Regulator after undertaking a price investigation which considers the costs a retailer incurs in supplying electricity to small customers4. The resulting determination sets out a formula which calculates a notional maximum revenue (NMR) which is then used to determine the maximum standing offer prices5.
The NMR is composed of the following costs:
purchasing electricity for resale (wholesale electricity costs);
transporting electricity over the network (network costs);
complying with mandatory renewable energy schemes (RET costs);
AEMO market charges;
providing services to customers including billing, collection and responding to enquiries (cost to serve); and
a margin to compensate the retailer for its investment in the business and the risks it assumes in providing those retail services.
Subject to the Economic Regulator’s approval, standing offer prices are adjusted each year in accordance with the relevant determination and the Economic Regulator’s price reset guideline.
The Economic Regulator approved Aurora Energy’s pricing proposal for 2014-15 on 19 June 2014 which saw a price reduction of 7.8 per cent for 2014-15. On 19 June 2015 the Regulator approved a 1.95 per cent price increase for 2015-16.
5.5.2.2 Regulated FiT rates
The Economic Regulator is also responsible for determining the annual Regulated FiT rate that applies to Standard FiT customers.
Standard FiT customers are customers who installed a qualifying micro distributed generation system on or after 31 August 2013. The regulated FiT rate determination does not apply to Transitional FiT customers who:
had a qualifying micro distributed generation system installed as at 31 August 2013; or
4 Customers who consume up to 150 MWh per annum.
5 A determination is the legal document that specifies how the prices are calculated during each year of the regulatory period.
ENERGY IN TASMANIA – PERFORMANCE REPORT 2014-15 25
entered into a contract to install a qualifying new micro distributed generation system or extend an existing micro distributed generation system before 31 August 2013 and the new system or extension was installed and connected before 31 August 2014.
In December 2012 the COAG agreed on revised National Principles for FiT Arrangements. These revised principles outline, among other things, that all premium FiT arrangements were to be closed to new participants by 2014.
Consistent with the COAG reforms, and as part of the 2013 Tasmanian electricity reforms, the FiT rate applying in Tasmania was reviewed.
The Tasmanian Government announced on 18 August 2013 that:
the then current 1:1 FiT arrangement would be closed at midnight on 30 August 2013 and would be grandfathered for existing (or contracted) installations until 1 January 2019;
customers applying to install eligible micro distributed generation systems on or after 31 August 2013 were entitled to a ‘transitional FiT’ of 8 c/kWh from 31 August 2013 until 31 December 2013;
the Economic Regulator would determine the FiT rate to apply from 1 January 2014 for all new installations occurring on or after 31 August 2013; and
the Economic Regulator would review the FiT rate on an annual basis.
The Economic Regulator was required by the Minister of Finance to prepare a report recommending a minimum FiT rate to apply from 1 January 2014, for net exported electricity. The report was completed in October 2013 and in November 2013 legislation was passed which, among other things, provided legal power for the first FiT determination to be made incorporating the recommended FiT as specified in the Economic Regulator’s report.
In December 2013, the Economic Regulator made a Regulated FiT Determination for Standard FiT Customers6, following an amendment to the ESI Act and Electricity Supply Industry (Pricing and Related Matters) Regulations 2013. For the period 1 July 2014 to 30 June 2015, the Economic Regulator determined a regulated FiT rate of 5.500 c/kWh.
Transitional FiT customers continue to receive the benefit of the transitional FiT rates in respect of billing periods, and those parts of billing periods, that expire before 1 January 2019 (ie 28.283 cents per kWh for residential customers and, for small business customers, 38.577 cents per kWh for the first 500 kWh supplied during each billing period and 28.319 cents per kWh for each kWh supplied above 500 kWh during each billing period).
6 See Regulated Feed-in Tariff Determination for Standard Feed-in Tariff Customers (6 December 2014).
26 ENERGY IN TASMANIA – PERFORMANCE REPORT 2014-15
5.5.2.3 Wholesale contract prices
To facilitate the introduction of Full Retail Contestability (FRC)7 on mainland Tasmania from 1 July 2014 and to provide certainty for retailers entering the Tasmanian electricity market, the Economic Regulator became responsible, from 1 January 2014, for regulating certain financial contracts offered by Hydro Tasmania8.
The framework includes a legislated instrument (known as the Wholesale Contract Regulatory Instrument) which specifies the terms and conditions for the financial derivative contracts and how prices for the contracts are derived.
Under the framework, Hydro Tasmania is required to offer four regulated derivative contracts to authorised retailers operating in Tasmania.
The aim of providing regulated derivative contracts is to reduce the risk faced by retailers entering the Tasmanian market to a level comparable to the risk facing retailers in other regions of the NEM and consequently increasing the likelihood of retailers entering the Tasmanian market.
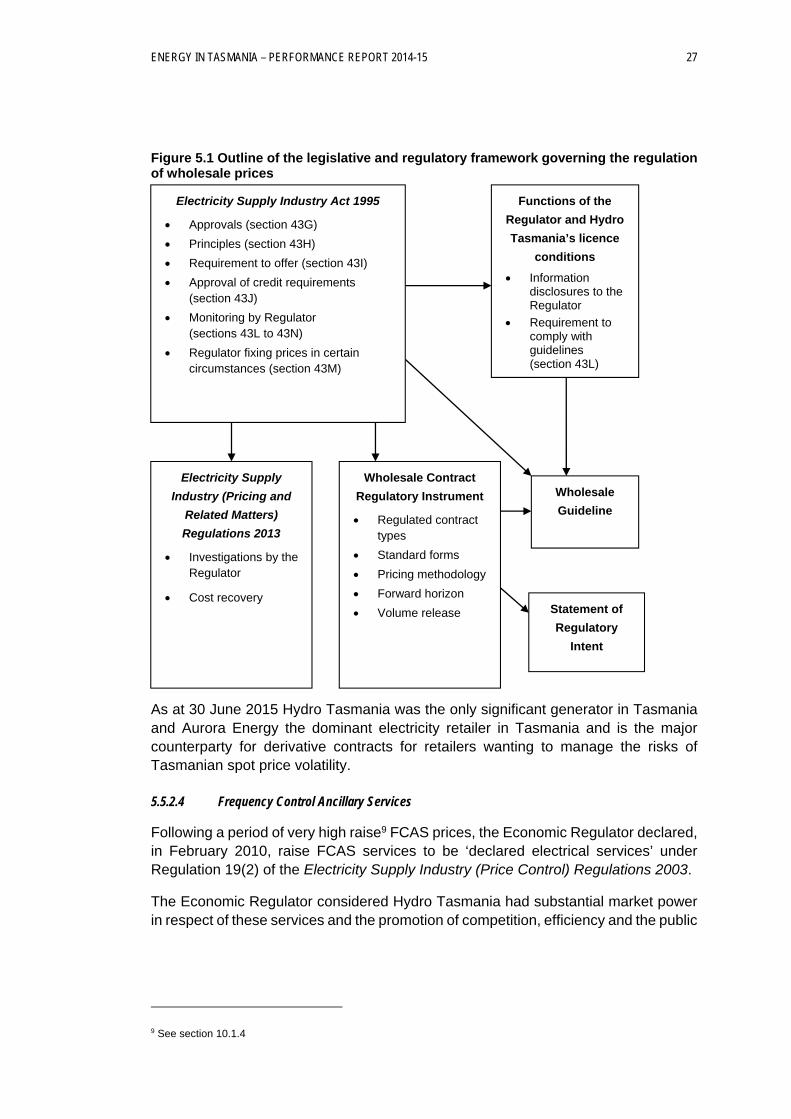
As depicted in Figure 5.1 the framework governing the regulation of Hydro Tasmania’s wholesale contract prices includes the:
ESI Act;
Electricity Supply Industry (Pricing and Related Matters) Regulations 2013;
Wholesale Contract Regulatory Instrument;
Statement of Regulatory Intent - Wholesale Contract Regulation (April 2014); and
Electricity Wholesale Contract Guideline (Version 1, December 2013).
7 All electricity customers are able to choose their retailer. Also referred to as Full Retail Competition (FRC).
8 Additional information on the regulation of Hydro Tasmania’s derivative contacts can be found at: http://www.economicregulator.tas.gov.au/domino/otter.nsf/elect-v/06R
ENERGY IN TASMANIA – PERFORMANCE REPORT 2014-15 27
Figure 5.1 Outline of the legislative and regulatory framework governing the regulation of wholesale prices
As at 30 June 2015 Hydro Tasmania was the only significant generator in Tasmania and Aurora Energy the dominant electricity retailer in Tasmania and is the major counterparty for derivative contracts for retailers wanting to manage the risks of Tasmanian spot price volatility.
5.5.2.4 Frequency Control Ancillary Services
Following a period of very high raise9 FCAS prices, the Economic Regulator declared, in February 2010, raise FCAS services to be ‘declared electrical services’ under Regulation 19(2) of the Electricity Supply Industry (Price Control) Regulations 2003.
The Economic Regulator considered Hydro Tasmania had substantial market power in respect of these services and the promotion of competition, efficiency and the public
9 See section 10.1.4
Electricity Supply
Industry (Pricing and
Related Matters)
Regulations 2013
Investigations by the Regulator
Cost recovery
Wholesale Contract
Regulatory Instrument
Regulated contract types
Standard forms
Pricing methodology
Forward horizon
Volume release
Wholesale
Guideline
Electricity Supply Industry Act 1995
Approvals (section 43G)
Principles (section 43H)
Requirement to offer (section 43I)
Approval of credit requirements (section 43J)
Monitoring by Regulator (sections 43L to 43N)
Regulator fixing prices in certain circumstances (section 43M)
Functions of the
Regulator and Hydro
Tasmania’s licence
conditions
Information disclosures to the Regulator
Requirement to comply with guidelines (section 43L)
Statement of
Regulatory
Intent
28 ENERGY IN TASMANIA – PERFORMANCE REPORT 2014-15
interest required the making of the declaration. For more information refer to the Regulator’s FCAS Final Report10.
The Economic Regulator also determined that the price of the FCAS ‘safety net’ contract would be calculated on 15 January and 15 July of each year of the Determination. The Determination commenced on 28 January 2011 and expires on 31 January 2016.
In accordance with Regulation 35 of the Electricity Supply Industry (Pricing and Related Matters) Regulations 2013 the Economic Regulator is required, to invite submissions on whether the declaration of FCAS as a declared electrical service should be retained or revoked.
On 27 April 2015, the Economic Regulator published its Retention or revocation of the declaration of raise contingency Frequency Control Ancillary Services (FCAS) as a declared electrical service – Consultation Paper which outlined the circumstances that, in the Regulator’s view, warranted the revocation of the declaration.
After considering submissions on this consultation paper the Economic Regulator decided to revoke the determination11. In making this decision the Regulator noted that it will continue to monitor FCAS pricing to ensure that regulatory action can be taken if evidence is found of inappropriate pricing behaviour.
5.5.3 Regulatory reporting
Under their respective licences, electricity entities are required to develop a series of management plans in accordance with the TEC. Management plans include asset management, vegetation management and emergency management plans. Certain licensees are also required to produce a compliance plan which outlines the procedures, practices and strategies for managing and auditing the licensee’s compliance with the applicable legislation, regulations and codes.
In accordance with the Regulator’s Regulatory Reporting Guideline Version 3, July 2014, licensees’ compliance and management plans are periodically reviewed by an independent appraiser who then prepares a report for the Economic Regulator.
The timing and scope of these appraisals is determined by the Economic Regulator based on the outcomes of a risk assessment which considers the outcomes from previous appraisals and the likely impact of any changed circumstances on the entity’s operations and, therefore, compliance with obligations.
These independent reviews are designed to confirm the veracity of the data reported by the entity and to provide an independent assessment of a licensee’s ability to meet its licence obligations. At the conclusion of the review, the independent appraiser prepares a report for the Regulator setting out its findings including providing an
10 Tasmanian Economic Regulator, FCAS Pricing Investigation Final Report, December 2010.
11 http://www.energyregulator.tas.gov.au/domino/otter.nsf/8f46477f11c891c7ca256c4b001b41f2/9375ad00fc37f027ca257e340001effa?OpenDocument
ENERGY IN TASMANIA – PERFORMANCE REPORT 2014-15 29
opinion on the level of compliance demonstrated and identifying areas for improvement. The Economic Regulator monitors the entity’s progress in implementing the recommended improvements.
During 2014-15 the following electricity industry compliance and management plans were independently appraised:
AETV Pty Ltd – Compliance Plan and Asset Management Plan;
Basslink Pty Ltd – Compliance Plan and Asset Management Plan; and
Hydro Tasmania – Compliance with the Wholesale Contract Regulatory Instrument in relation to regulated contract volumes and the associated ‘traffic light’ volume indicators.
5.5.4 Performance reporting
Electricity licensees are also required to report annually on their performance against a range of measures detailed in the Regulator’s Electricity Supply Industry Performance and Information Reporting Guideline (Version 2.3 September 2014). This information is then used to prepare this Report.
5.5.5 Customer Consultative Committee
The OTTER Customer Consultative Committee (OCCC) was created with the dual purpose of ensuring that groups representing customer interests are informed of developments in the industries regulated by the Economic Regulator and the Economic Regulator is made aware of issues impacting on customers and stakeholders.
More information about the OCCC’s activities during 2014-15 are outlined in the Tasmanian Economic Regulator’s Annual Report for 2014-15: Annual Report 2014-15.

ENERGY IN TASMANIA – PERFORMANCE REPORT 2014-15 31
6 OTHER GOVERNMENT BODIES
6.1 Introduction
This Chapter describes the key roles and functions of each of the Tasmanian Government bodies involved in the Tasmanian energy supply industry.
The Chapter also lists the various climate change policies and associated regulators that were in place during 2014-15 together with an overview of the major policy changes that occurred in relation to climate change during the year.
6.2 Department of Treasury and Finance
The Department of Treasury and Finance (Treasury) has been responsible for managing the implementation of major energy initiatives and policies such as Tasmania’s entry to the NEM and the transition to retail competition.
The administration of the ESI Act is shared between Treasury and the Energy Policy Branch, a unit within the Department of State Growth.
Treasury is responsible for administering Part 2 (Administration) and Divisions 3 (Special provisions relating to Hydro-Electric Corporation), 4 (Retailing of electricity to certain customers), 4A (Wholesale electricity pricing and contracts ), 5 (Restrictions on re-supply), 5A (Feed-in tariffs), 6 (Disputes) and 10 (Miscellaneous) of Part 3 and the making of regulations under section 122 of the ESI Act1, to the extent that those regulations relate to contestable customers, price regulation2 and contracts.
Treasury is also responsible for providing advice on electricity market arrangements in the State, particularly in relation to regulatory issues and facilitating competition in the electricity supply industry.
6.3 Energy Policy Branch, Department of State Growth
The Energy Policy Branch supports the Director of Energy Planning whose functions include:
assisting the Minister for Energy in planning and co-ordinating the provision of energy in the State;
monitoring factors affecting the supply and demand for energy in Tasmania;
1 Administrative Arrangements Order 2015.
2 Whilst Treasury is responsible for the pricing provisions of the ESI Act, the Economic Regulator is responsible for the actual determination of standing offer prices and regulated FiT rates and the monitoring of wholesale prices in accordance with the various pricing provisions.
32 ENERGY IN TASMANIA – PERFORMANCE REPORT 2014-15
developing commercial applications of renewable energy; and
producing and publishing information and reports on energy related matters.
The Department of State Growth is responsible for administering all provisions of the ESI Act not administered by Treasury and the Department of Justice (ie Part 2 (Administration) and Divisions 3 (Special provisions relating to Hydro-Electric Corporation), 4 (Retailing of electricity to certain customers), 4A (Wholesale electricity pricing and contracts ), 5 (Restrictions on re supply), 5A (Feed-in tariffs), 6 (Disputes) and 10 (Miscellaneous) of Part 3 and the making of regulations under section 122 of the ESI Act, to the extent that those regulations relate to contestable customers, price regulation and contracts; and Part 8 (Enforcement) and regulations that relate to Part 8 respectively).
The Energy Policy Branch also represents Tasmania’s views and interests on energy matters to national policy and regulatory bodies and provides input into the development of the national regulatory framework that applies to Tasmania's energy industry.
The Energy Policy Branch is also responsible for developing and administering the Government’s Energy Strategy.
6.4 Energy Ombudsman
The Energy Ombudsman investigates complaints relating to the supply of electricity and natural gas and is funded through a levy imposed on the relevant energy supply industry licensees. Details about complaints in relation to the supply of gas are outlined in Chapters 16 and 17.
A summary of electricity complaints received by the Energy Ombudsman over the previous five years is shown in Table 6.13. In 2014 15, the number of energy related complaints declined considerably, most notably the number of complaints about Aurora Energy (Retail). In 2014-15, billing accounted for over half the complaints. Readers seeking further information on complaints regarding the supply of electricity in Tasmania should refer to the Ombudsman’s Annual Report 2014-15 which is available on the Ombudsman’s website: http://www.energyombudsman.tas.gov.au/publications_and_media/annual_reports.
3 The Energy Ombudsman defines complaint issue categories consistent with those reported on by other jurisdictions in the Australia and New Zealand Energy and Water Ombudsman Network (ANZEWON).
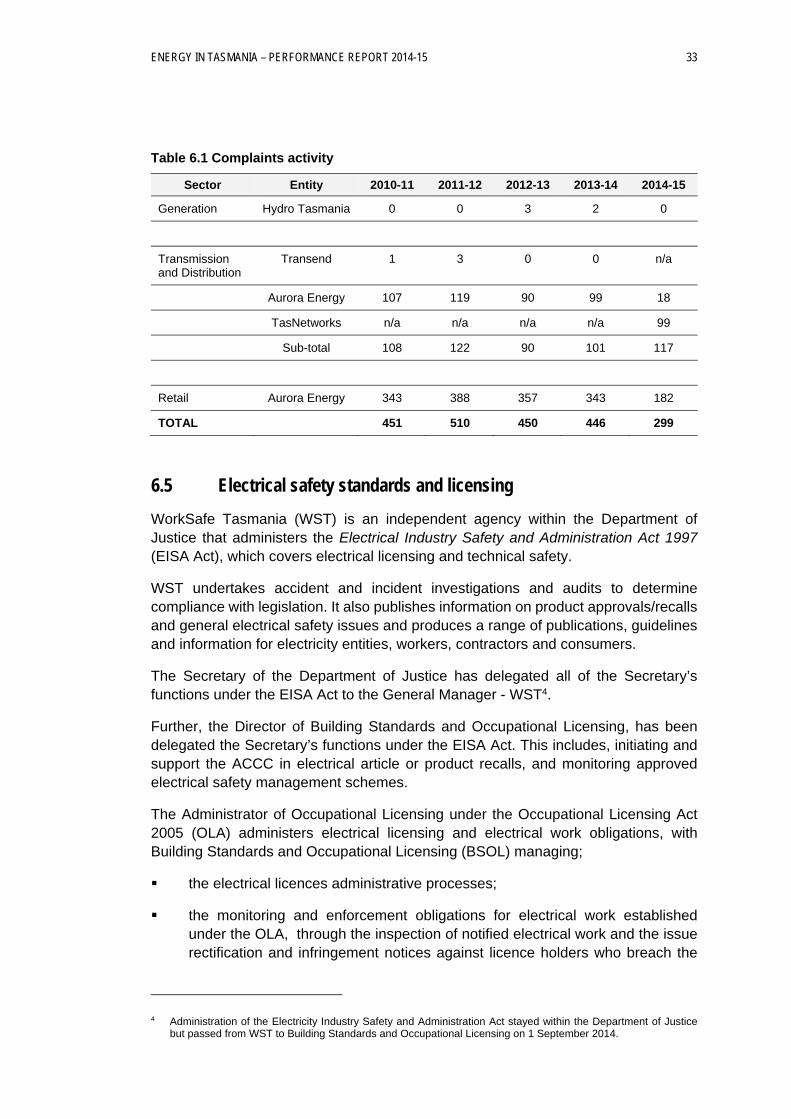
ENERGY IN TASMANIA – PERFORMANCE REPORT 2014-15 33
Table 6.1 Complaints activity
Sector Entity 2010-11 2011-12 2012-13 2013-14 2014-15
Generation Hydro Tasmania 0 0 3 2 0
Transmission and Distribution
Transend 1 3 0 0 n/a
Aurora Energy 107 119 90 99 18
TasNetworks n/a n/a n/a n/a 99
Sub-total 108 122 90 101 117
Retail Aurora Energy 343 388 357 343 182
TOTAL 451 510 450 446 299
6.5 Electrical safety standards and licensing
WorkSafe Tasmania (WST) is an independent agency within the Department of Justice that administers the Electrical Industry Safety and Administration Act 1997 (EISA Act), which covers electrical licensing and technical safety.
WST undertakes accident and incident investigations and audits to determine compliance with legislation. It also publishes information on product approvals/recalls and general electrical safety issues and produces a range of publications, guidelines and information for electricity entities, workers, contractors and consumers.
The Secretary of the Department of Justice has delegated all of the Secretary’s functions under the EISA Act to the General Manager - WST4.
Further, the Director of Building Standards and Occupational Licensing, has been delegated the Secretary’s functions under the EISA Act. This includes, initiating and support the ACCC in electrical article or product recalls, and monitoring approved electrical safety management schemes.
The Administrator of Occupational Licensing under the Occupational Licensing Act 2005 (OLA) administers electrical licensing and electrical work obligations, with Building Standards and Occupational Licensing (BSOL) managing;
the electrical licences administrative processes;
the monitoring and enforcement obligations for electrical work established under the OLA, through the inspection of notified electrical work and the issue rectification and infringement notices against licence holders who breach the
4 Administration of the Electricity Industry Safety and Administration Act stayed within the Department of Justice but passed from WST to Building Standards and Occupational Licensing on 1 September 2014.
34 ENERGY IN TASMANIA – PERFORMANCE REPORT 2014-15
OLA, by “authorised officers” appointed under the OLA. This is predominantly managed by the Electrical Safety Inspection Service (ESIS); and
identified breaches through fines, or legal and disciplinary proceedings.
the Electricity Standards and Safety Unit of BSOL manages and monitors the ESIS, which is currently contracted to TechSafe Australia Pty Ltd. The ESIS obligations include the;
inspection of notified electrical work; and
investigation of electric shocks, fires and incidents, in relation to defective electrical work and electrical equipment or installation failure.
During 2014-155:
there were no electrical fatalities recorded;
there were no serious electrical accidents reported;
desktop audits of electrical contractors were conducted, which identified no major safety issues, but some concerns that in general the industry is not 100 per cent compliant with recording and notification requirements; and
two audits of approved Electrical Safety Management Systems conducted, under Part 8 of the EIS&A, identified no major safety issues.
6.6 Climate change policies and regulators
The following climate change policies and climate change regulators were in place during 2014-15.
6.6.1 Carbon pricing mechanism
The carbon pricing mechanism commenced on 1 July 2012 and applied to Australia’s largest carbon emitters (ie those with annual emissions greater than 25 000 tonnes of carbon dioxide equivalent). It covered approximately 60 per cent of Australia’s carbon emissions and included the electricity generation and stationary energy sectors. Emissions from households, on-road business use of light vehicles and the agriculture, forestry and fishery industries were not included.
Liable entities were required to acquire and surrender carbon units equivalent to the carbon emissions they produced or, alternatively, pay a shortfall charge. Emission reduction targets could be met through progressive reductions in the pollution cap. The carbon pricing legislation was repealed by the Australian Government on 17 July 2014 with retrospective effect from 1 July 2014.
5 Department of Justice, Annual Report 2014-15.
ENERGY IN TASMANIA – PERFORMANCE REPORT 2014-15 35
6.6.2 Direct Action Policy
Following the repeal of the carbon pricing mechanism the Australian Government implemented its Direct Action Policy.
The Direct Action Policy introduced a variety of initiatives that have the objective of reducing Australia’s carbon emissions, including:
a $2.5 billion Emissions Reduction Fund to support direct action by business to reduce emissions;
boosting renewable energy, especially solar; and
supporting emerging technologies through the Renewable Energy Target.
6.6.3 Renewable Energy Target
The Australian Government’s Renewable Energy Target (RET) scheme creates a guaranteed market for renewable energy, using a mechanism of tradable certificates with each certificate representing one megawatt hour of renewable electricity generated.
The RET operates in two parts: the Large Renewable Energy Target (LRET) applies to large-scale renewable energy generators while the Small-Scale Renewable Energy Scheme (SRES) applies to owners of small-scale solar panel, wind, and hydro systems.
Wholesale purchasers of electricity who are liable under the RET (generally retailers) are required to purchase and surrender certificates in accordance with the RET, in proportion to their total electrical purchases from an electricity grid (with an installed capacity of 100 MW or more).
On 17 February 2014, the Australian Government announced a review of the RET scheme by an Expert Panel. The Panel’s review was released in August 2014 and concluded that the cost of the RET outweighed its benefits and that significant change was required. The review recommended that:
the Large-scale Renewable Energy Target (LRET) be either closed to new entrants or modified so that targets to 2020 are set one year in advance and increase by half of projected additional electricity demand in that year; and
the Small-scale Renewable Energy Scheme (SRES) be either terminated immediately or phased out more rapidly (by 2020 rather than 2030)6.
The Climate Change Authority subsequently conducted its biennial review as required by its enabling legislation and:
6 http://www.climatechangeauthority.gov.au/reviews/2014-renewable-energy-target-review/report#chapter1
36 ENERGY IN TASMANIA – PERFORMANCE REPORT 2014-15
stated that it did not favour any significant scaling back of the 2020 LRET of 41 000 GWh;
recommended a rescheduling of the current target to increase the likelihood it will be met; and
noted the challenges of climate change are ongoing and recommended the Government consider the role of the RET beyond 20207.
After considering the outcomes from these reviews, the Australian Government decided to set a new 2020 target for large-scale generation of 33 000 GWh. The Government stated that this target will double the amount of large-scale renewable energy being delivered by the scheme compared to current levels and means that about 23.5 per cent of Australia’s electricity generation in 2020 will be from renewable sources8. The legislation required to implement these changes was passed by the Australian Parliament on 23 June 2015.
Figure 6.1 shows the number of renewable energy certificates (RECs) generated in Tasmania between 2002 and 2014 (calendar years) from the various renewable energy sources together with Tasmania’s percentage contribution to the national annual REC target for each of those years. The significantly higher number of RECs generated in Tasmania in each of the 2012, 2013 and 2014 calendar years reflect the incentive created by the existence of the carbon pricing mechanism during those years.
7 http://www.climatechangeauthority.gov.au/reviews/2014-renewable-energy-target-review/
8 https://www.environment.gov.au/climate-change/renewable-energy-target-scheme
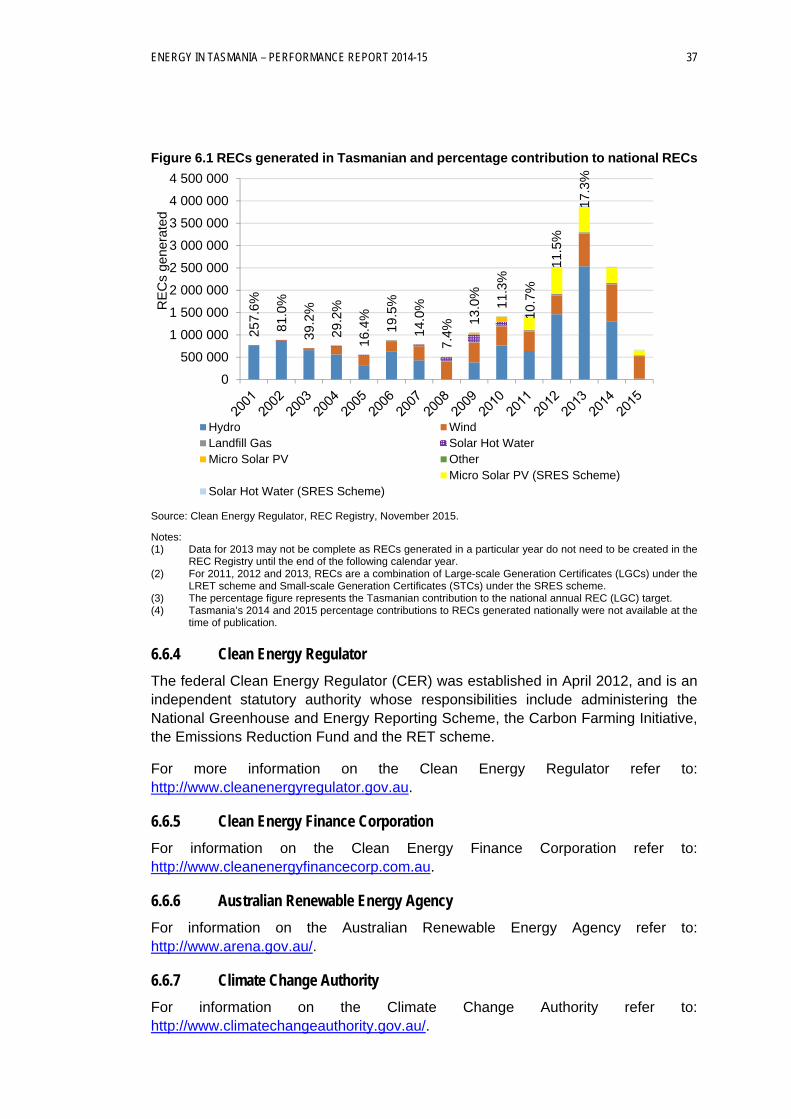
ENERGY IN TASMANIA – PERFORMANCE REPORT 2014-15 37
Figure 6.1 RECs generated in Tasmanian and percentage contribution to national RECs
Source: Clean Energy Regulator, REC Registry, November 2015.
Notes: (1) Data for 2013 may not be complete as RECs generated in a particular year do not need to be created in the
REC Registry until the end of the following calendar year. (2) For 2011, 2012 and 2013, RECs are a combination of Large-scale Generation Certificates (LGCs) under the
LRET scheme and Small-scale Generation Certificates (STCs) under the SRES scheme. (3) The percentage figure represents the Tasmanian contribution to the national annual REC (LGC) target. (4) Tasmania’s 2014 and 2015 percentage contributions to RECs generated nationally were not available at the
time of publication.
6.6.4 Clean Energy Regulator
The federal Clean Energy Regulator (CER) was established in April 2012, and is an independent statutory authority whose responsibilities include administering the National Greenhouse and Energy Reporting Scheme, the Carbon Farming Initiative, the Emissions Reduction Fund and the RET scheme.
For more information on the Clean Energy Regulator refer to: http://www.cleanenergyregulator.gov.au.
6.6.5 Clean Energy Finance Corporation
For information on the Clean Energy Finance Corporation refer to: http://www.cleanenergyfinancecorp.com.au.
6.6.6 Australian Renewable Energy Agency
For information on the Australian Renewable Energy Agency refer to: http://www.arena.gov.au/.
6.6.7 Climate Change Authority
For information on the Climate Change Authority refer to: http://www.climatechangeauthority.gov.au/.
257.
6%
81.0
%
39.2
%
29.2
%
16.4
%
19.5
%
14.0
%
7.4%
13.0
%
11.3
%
10.7
%
11.5
%
17.3
%
0
500 000
1 000 000
1 500 000
2 000 000
2 500 000
3 000 000
3 500 000
4 000 000
4 500 000R
EC
s ge
nera
ted
Hydro WindLandfill Gas Solar Hot WaterMicro Solar PV Other
Micro Solar PV (SRES Scheme)Solar Hot Water (SRES Scheme)

ENERGY IN TASMANIA – PERFORMANCE REPORT 2014-15 39
7 GENERATION
The Tasmanian electricity generation system comprises hydroelectric, thermal, wind and embedded generators.
No single generator holds an exclusive licence for generation in Tasmania. All generators with capacity greater than five MW must hold a licence issued by the Regulator and be registered as a generator in the NEM unless exempted from registration by AEMO. As at 30 June 2015 the following entities held generation licences:
Hydro-Electric Corporation (Hydro Tasmania);
Woolnorth Bluff Point Wind Farm Pty Ltd (formerly Roaring 40’s Wind Pty Ltd);
Woolnorth Studland Bay Wind Farm Pty Ltd;
LMS Energy Pty Ltd;
AGL Energy Services Pty Ltd;
Cascade Renewable Energy Pty Ltd;
Aurora Energy (Tamar Valley) Pty Ltd;
Musselroe Wind Farm Pty Ltd;
Tasmanian Irrigation Pty Ltd; and
Simplot Australia Pty Ltd.
7.1 Installed capacity
As at 30 June 2015 the total installed generating capacity1 on mainland Tasmania was 2 976 MW, comprising 2 281MW of hydro-electric generation, 387MW of thermal generation and 308MW of wind generation.
When importing electricity into Tasmania, Basslink effectively acts as a generator therefore Figure 7.1 shows the share of installed capacity for each generation source in Tasmania including Basslink’s capacity to supply electricity to Tasmania2.
1 Installed capacity is the normal maximum operating rating, also known as nameplate rating.
2 The Basslink Interconnector is able to transmit 500 megawatts (MW) of energy on a continuous basis.
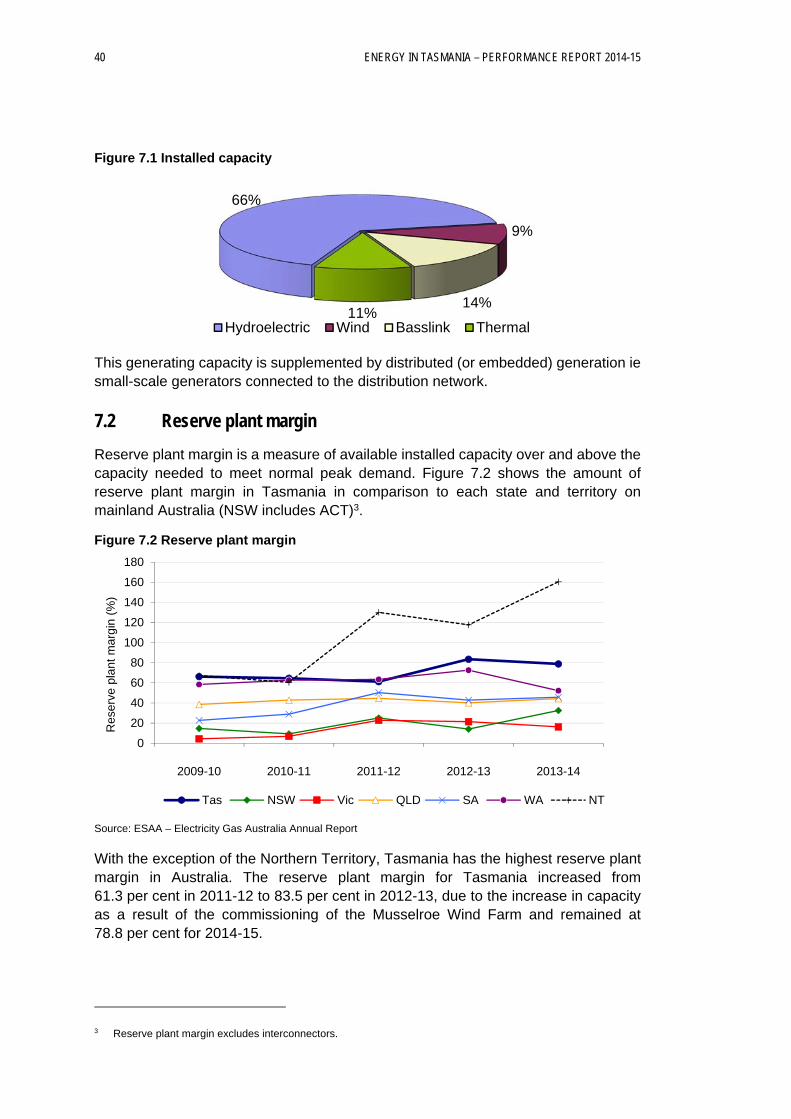
40 ENERGY IN TASMANIA – PERFORMANCE REPORT 2014-15
Figure 7.1 Installed capacity
This generating capacity is supplemented by distributed (or embedded) generation ie small-scale generators connected to the distribution network.
7.2 Reserve plant margin
Reserve plant margin is a measure of available installed capacity over and above the capacity needed to meet normal peak demand. Figure 7.2 shows the amount of reserve plant margin in Tasmania in comparison to each state and territory on mainland Australia (NSW includes ACT)3.
Figure 7.2 Reserve plant margin
Source: ESAA – Electricity Gas Australia Annual Report
With the exception of the Northern Territory, Tasmania has the highest reserve plant margin in Australia. The reserve plant margin for Tasmania increased from 61.3 per cent in 2011-12 to 83.5 per cent in 2012-13, due to the increase in capacity as a result of the commissioning of the Musselroe Wind Farm and remained at 78.8 per cent for 2014-15.
3 Reserve plant margin excludes interconnectors.
66%
9%
14%11%
Hydroelectric Wind Basslink Thermal
0
20
40
60
80
100
120
140
160
180
2009-10 2010-11 2011-12 2012-13 2013-14
Res
erve
pla
nt m
argi
n (%
)
Tas NSW Vic QLD SA WA NT
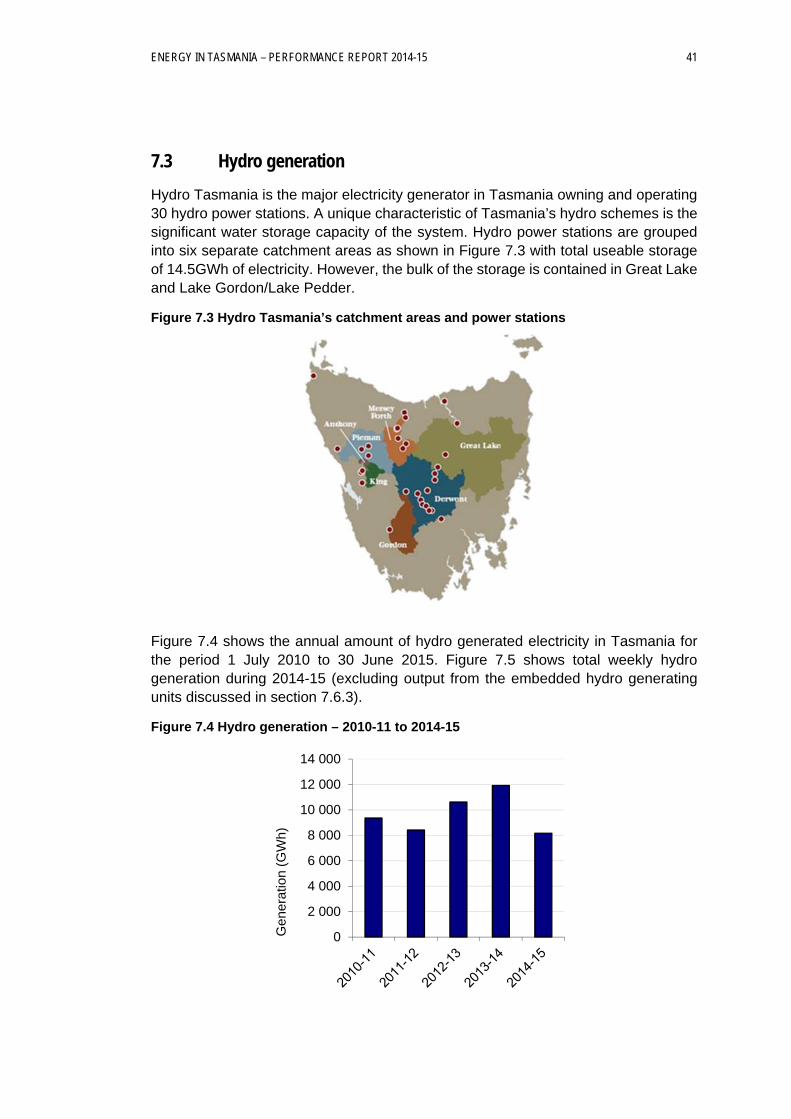
ENERGY IN TASMANIA – PERFORMANCE REPORT 2014-15 41
7.3 Hydro generation
Hydro Tasmania is the major electricity generator in Tasmania owning and operating 30 hydro power stations. A unique characteristic of Tasmania’s hydro schemes is the significant water storage capacity of the system. Hydro power stations are grouped into six separate catchment areas as shown in Figure 7.3 with total useable storage of 14.5GWh of electricity. However, the bulk of the storage is contained in Great Lake and Lake Gordon/Lake Pedder.
Figure 7.3 Hydro Tasmania’s catchment areas and power stations
Figure 7.4 shows the annual amount of hydro generated electricity in Tasmania for the period 1 July 2010 to 30 June 2015. Figure 7.5 shows total weekly hydro generation during 2014-15 (excluding output from the embedded hydro generating units discussed in section 7.6.3).
Figure 7.4 Hydro generation – 2010-11 to 2014-15
0
2 000
4 000
6 000
8 000
10 000
12 000
14 000
Gen
erat
ion
(GW
h)
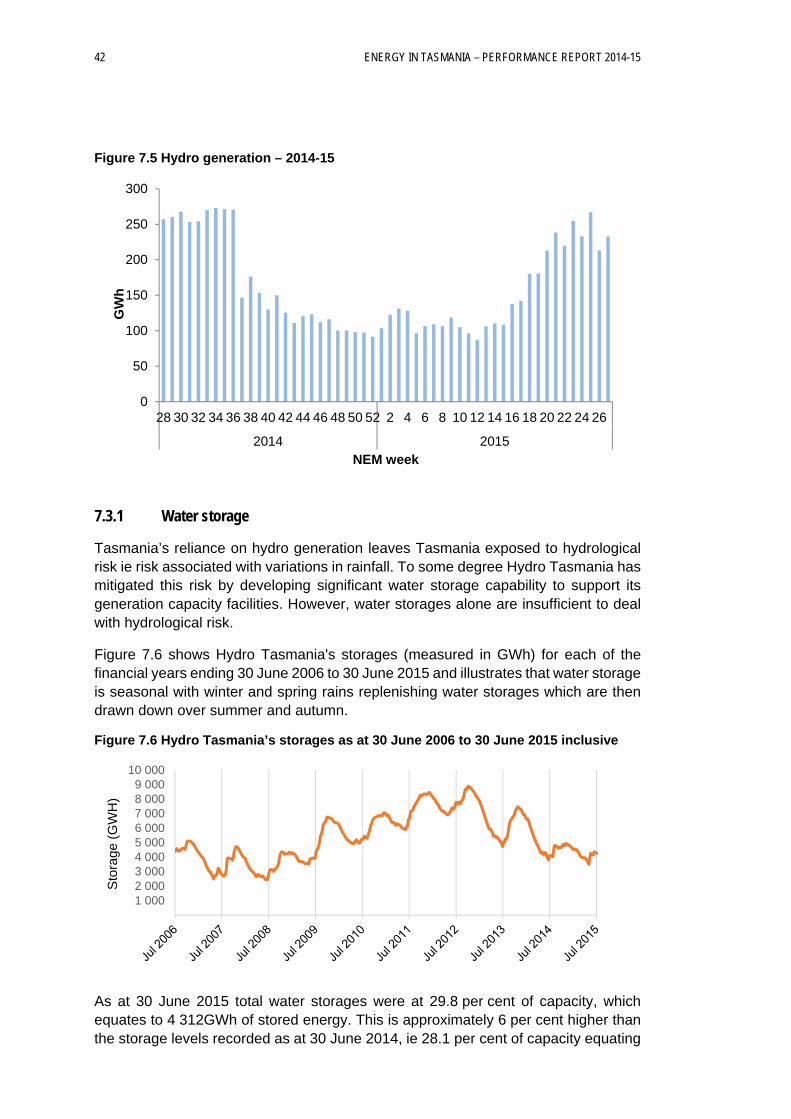
42 ENERGY IN TASMANIA – PERFORMANCE REPORT 2014-15
Figure 7.5 Hydro generation – 2014-15
7.3.1 Water storage
Tasmania’s reliance on hydro generation leaves Tasmania exposed to hydrological risk ie risk associated with variations in rainfall. To some degree Hydro Tasmania has mitigated this risk by developing significant water storage capability to support its generation capacity facilities. However, water storages alone are insufficient to deal with hydrological risk.
Figure 7.6 shows Hydro Tasmania's storages (measured in GWh) for each of the financial years ending 30 June 2006 to 30 June 2015 and illustrates that water storage is seasonal with winter and spring rains replenishing water storages which are then drawn down over summer and autumn.
Figure 7.6 Hydro Tasmania’s storages as at 30 June 2006 to 30 June 2015 inclusive
As at 30 June 2015 total water storages were at 29.8 per cent of capacity, which equates to 4 312GWh of stored energy. This is approximately 6 per cent higher than the storage levels recorded as at 30 June 2014, ie 28.1 per cent of capacity equating
0
50
100
150
200
250
300
28 30 32 34 36 38 40 42 44 46 48 50 52 2 4 6 8 10 12 14 16 18 20 22 24 26
2014 2015
GW
h
NEM week
1 0002 0003 0004 0005 0006 0007 0008 0009 000
10 000
Sto
rage
(G
WH
)
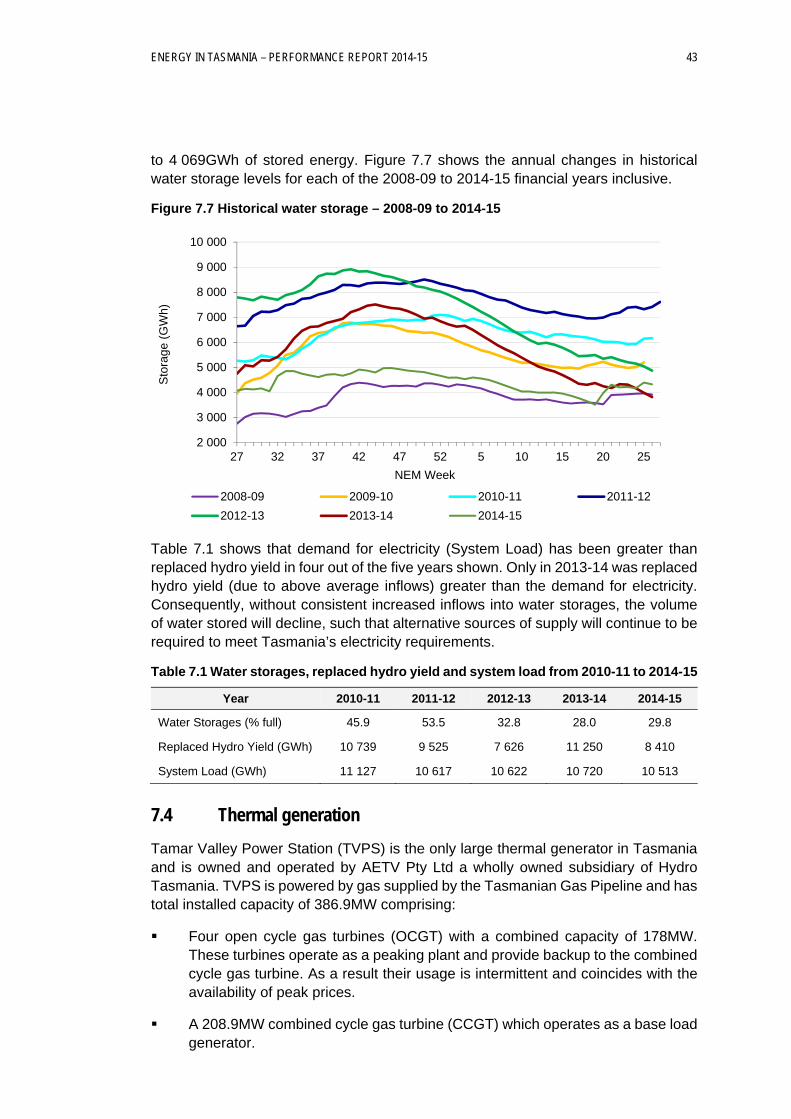
ENERGY IN TASMANIA – PERFORMANCE REPORT 2014-15 43
to 4 069GWh of stored energy. Figure 7.7 shows the annual changes in historical water storage levels for each of the 2008-09 to 2014-15 financial years inclusive.
Figure 7.7 Historical water storage – 2008-09 to 2014-15
Table 7.1 shows that demand for electricity (System Load) has been greater than replaced hydro yield in four out of the five years shown. Only in 2013-14 was replaced hydro yield (due to above average inflows) greater than the demand for electricity. Consequently, without consistent increased inflows into water storages, the volume of water stored will decline, such that alternative sources of supply will continue to be required to meet Tasmania’s electricity requirements.
Table 7.1 Water storages, replaced hydro yield and system load from 2010-11 to 2014-15
Year 2010-11 2011-12 2012-13 2013-14 2014-15
Water Storages (% full) 45.9 53.5 32.8 28.0 29.8
Replaced Hydro Yield (GWh) 10 739 9 525 7 626 11 250 8 410
System Load (GWh) 11 127 10 617 10 622 10 720 10 513
7.4 Thermal generation
Tamar Valley Power Station (TVPS) is the only large thermal generator in Tasmania and is owned and operated by AETV Pty Ltd a wholly owned subsidiary of Hydro Tasmania. TVPS is powered by gas supplied by the Tasmanian Gas Pipeline and has total installed capacity of 386.9MW comprising:
Four open cycle gas turbines (OCGT) with a combined capacity of 178MW. These turbines operate as a peaking plant and provide backup to the combined cycle gas turbine. As a result their usage is intermittent and coincides with the availability of peak prices.
A 208.9MW combined cycle gas turbine (CCGT) which operates as a base load generator.
2 000
3 000
4 000
5 000
6 000
7 000
8 000
9 000
10 000
27 32 37 42 47 52 5 10 15 20 25
Sto
rage
(G
Wh)
NEM Week
2008-09 2009-10 2010-11 2011-12
2012-13 2013-14 2014-15
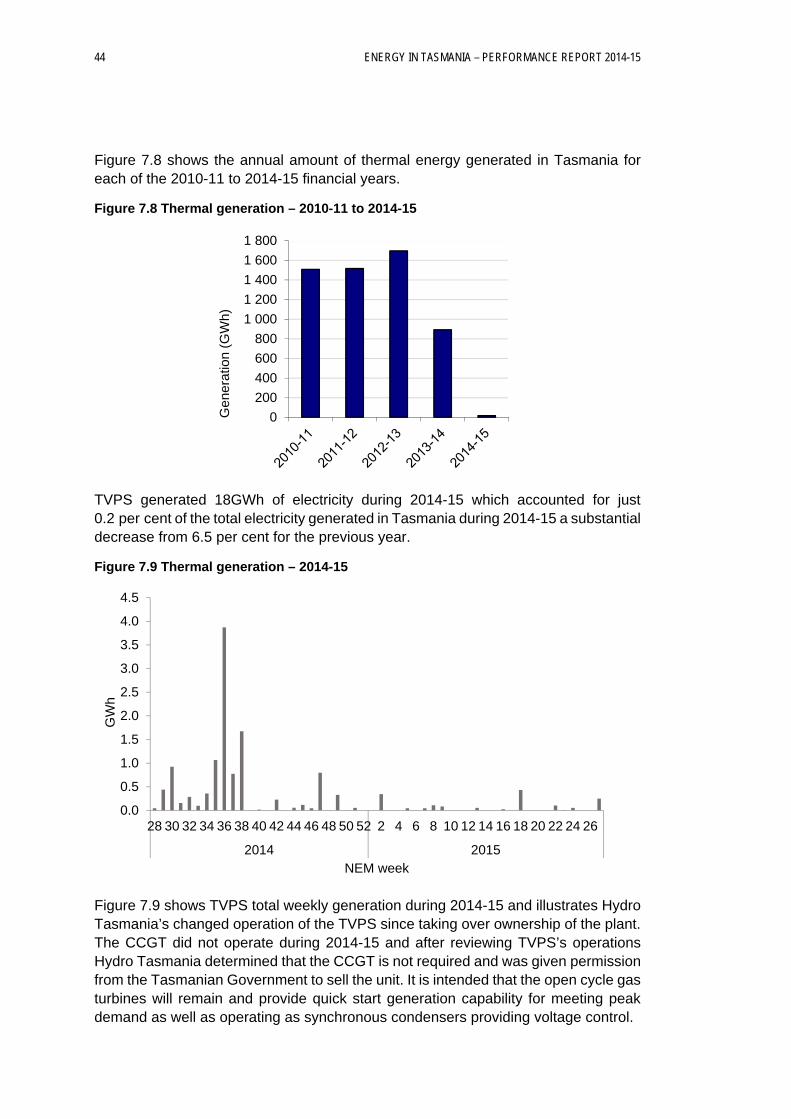
44 ENERGY IN TASMANIA – PERFORMANCE REPORT 2014-15
Figure 7.8 shows the annual amount of thermal energy generated in Tasmania for each of the 2010-11 to 2014-15 financial years.
Figure 7.8 Thermal generation – 2010-11 to 2014-15
TVPS generated 18GWh of electricity during 2014-15 which accounted for just 0.2 per cent of the total electricity generated in Tasmania during 2014-15 a substantial decrease from 6.5 per cent for the previous year.
Figure 7.9 Thermal generation – 2014-15
Figure 7.9 shows TVPS total weekly generation during 2014-15 and illustrates Hydro Tasmania’s changed operation of the TVPS since taking over ownership of the plant. The CCGT did not operate during 2014-15 and after reviewing TVPS’s operations Hydro Tasmania determined that the CCGT is not required and was given permission from the Tasmanian Government to sell the unit. It is intended that the open cycle gas turbines will remain and provide quick start generation capability for meeting peak demand as well as operating as synchronous condensers providing voltage control.
0
200
400
600
800
1 000
1 200
1 400
1 600
1 800G
ener
atio
n (G
Wh)
0.0
0.5
1.0
1.5
2.0
2.5
3.0
3.5
4.0
4.5
28 30 32 34 36 38 40 42 44 46 48 50 52 2 4 6 8 10 12 14 16 18 20 22 24 26
2014 2015
GW
h
NEM week
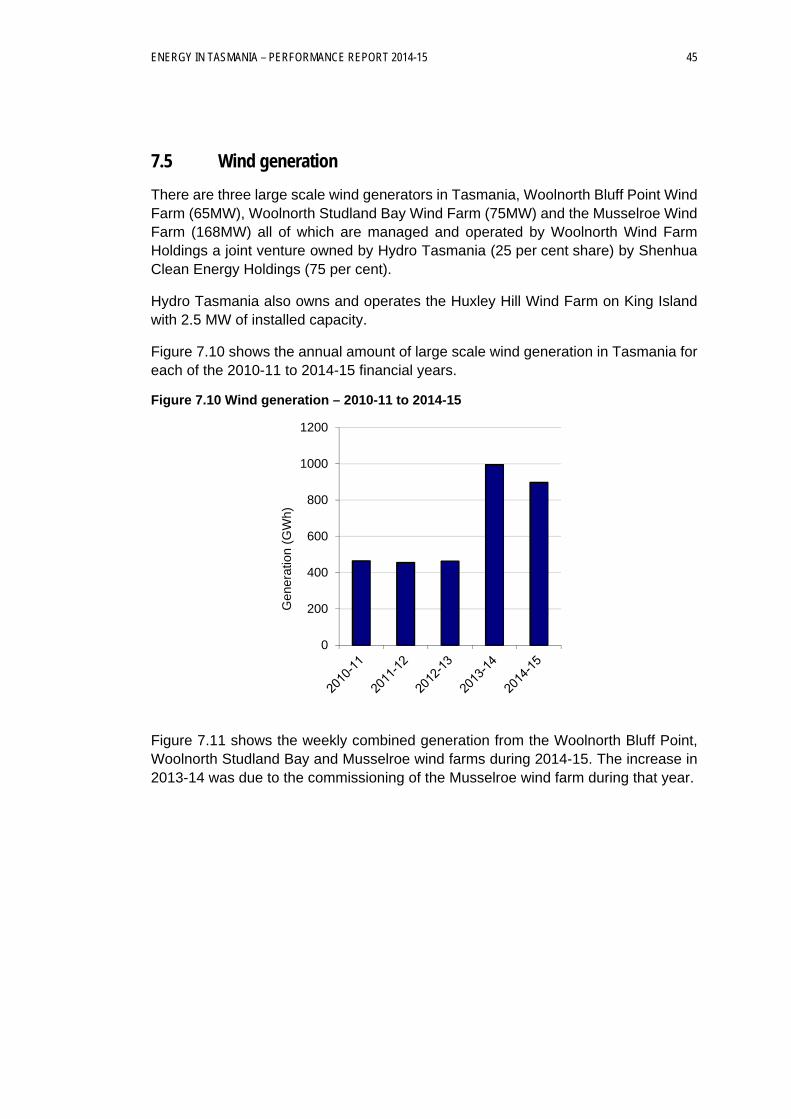
ENERGY IN TASMANIA – PERFORMANCE REPORT 2014-15 45
7.5 Wind generation
There are three large scale wind generators in Tasmania, Woolnorth Bluff Point Wind Farm (65MW), Woolnorth Studland Bay Wind Farm (75MW) and the Musselroe Wind Farm (168MW) all of which are managed and operated by Woolnorth Wind Farm Holdings a joint venture owned by Hydro Tasmania (25 per cent share) by Shenhua Clean Energy Holdings (75 per cent).
Hydro Tasmania also owns and operates the Huxley Hill Wind Farm on King Island with 2.5 MW of installed capacity.
Figure 7.10 shows the annual amount of large scale wind generation in Tasmania for each of the 2010-11 to 2014-15 financial years.
Figure 7.10 Wind generation – 2010-11 to 2014-15
Figure 7.11 shows the weekly combined generation from the Woolnorth Bluff Point, Woolnorth Studland Bay and Musselroe wind farms during 2014-15. The increase in 2013-14 was due to the commissioning of the Musselroe wind farm during that year.
0
200
400
600
800
1000
1200
Gen
erat
ion
(GW
h)
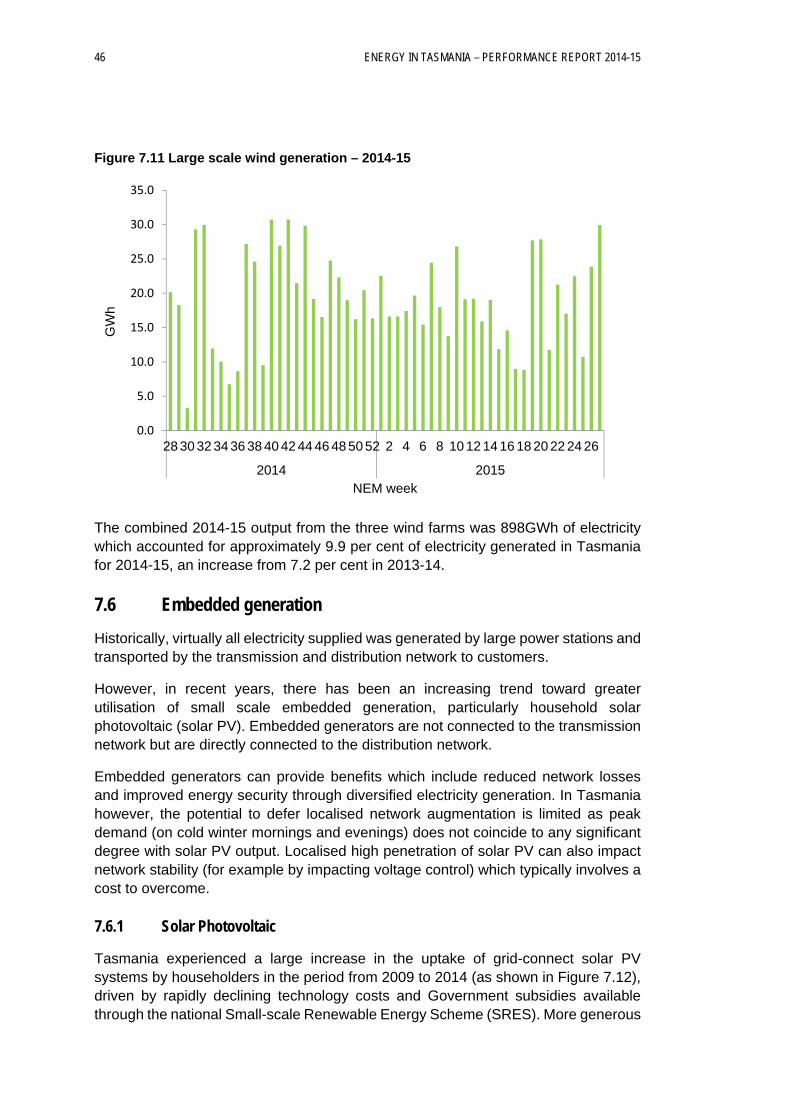
46 ENERGY IN TASMANIA – PERFORMANCE REPORT 2014-15
Figure 7.11 Large scale wind generation – 2014-15
The combined 2014-15 output from the three wind farms was 898GWh of electricity which accounted for approximately 9.9 per cent of electricity generated in Tasmania for 2014-15, an increase from 7.2 per cent in 2013-14.
7.6 Embedded generation
Historically, virtually all electricity supplied was generated by large power stations and transported by the transmission and distribution network to customers.
However, in recent years, there has been an increasing trend toward greater utilisation of small scale embedded generation, particularly household solar photovoltaic (solar PV). Embedded generators are not connected to the transmission network but are directly connected to the distribution network.
Embedded generators can provide benefits which include reduced network losses and improved energy security through diversified electricity generation. In Tasmania however, the potential to defer localised network augmentation is limited as peak demand (on cold winter mornings and evenings) does not coincide to any significant degree with solar PV output. Localised high penetration of solar PV can also impact network stability (for example by impacting voltage control) which typically involves a cost to overcome.
7.6.1 Solar Photovoltaic
Tasmania experienced a large increase in the uptake of grid-connect solar PV systems by householders in the period from 2009 to 2014 (as shown in Figure 7.12), driven by rapidly declining technology costs and Government subsidies available through the national Small-scale Renewable Energy Scheme (SRES). More generous
0.0
5.0
10.0
15.0
20.0
25.0
30.0
35.0
28 30 32 34 36 38 40 42 44 46 48 50 52 2 4 6 8 10 12 14 16 18 20 22 24 26
2014 2015
GW
h
NEM week
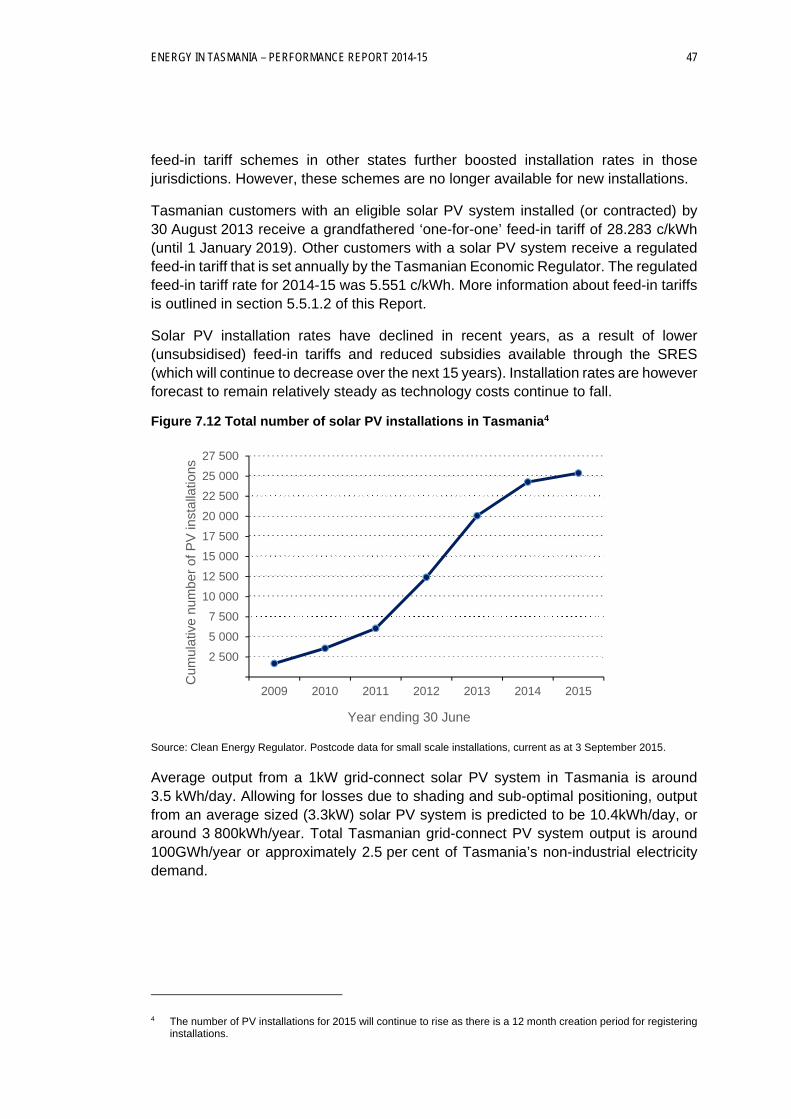
ENERGY IN TASMANIA – PERFORMANCE REPORT 2014-15 47
feed-in tariff schemes in other states further boosted installation rates in those jurisdictions. However, these schemes are no longer available for new installations.
Tasmanian customers with an eligible solar PV system installed (or contracted) by 30 August 2013 receive a grandfathered ‘one-for-one’ feed-in tariff of 28.283 c/kWh (until 1 January 2019). Other customers with a solar PV system receive a regulated feed-in tariff that is set annually by the Tasmanian Economic Regulator. The regulated feed-in tariff rate for 2014-15 was 5.551 c/kWh. More information about feed-in tariffs is outlined in section 5.5.1.2 of this Report.
Solar PV installation rates have declined in recent years, as a result of lower (unsubsidised) feed-in tariffs and reduced subsidies available through the SRES (which will continue to decrease over the next 15 years). Installation rates are however forecast to remain relatively steady as technology costs continue to fall.
Figure 7.12 Total number of solar PV installations in Tasmania4
Source: Clean Energy Regulator. Postcode data for small scale installations, current as at 3 September 2015.
Average output from a 1kW grid-connect solar PV system in Tasmania is around 3.5 kWh/day. Allowing for losses due to shading and sub-optimal positioning, output from an average sized (3.3kW) solar PV system is predicted to be 10.4kWh/day, or around 3 800kWh/year. Total Tasmanian grid-connect PV system output is around 100GWh/year or approximately 2.5 per cent of Tasmania’s non-industrial electricity demand.
4 The number of PV installations for 2015 will continue to rise as there is a 12 month creation period for registering installations.
2 500
5 000
7 500
10 000
12 500
15 000
17 500
20 000
22 500
25 000
27 500
2009 2010 2011 2012 2013 2014 2015
Cum
ulat
ive
num
ber
of P
V in
stal
latio
ns
Year ending 30 June
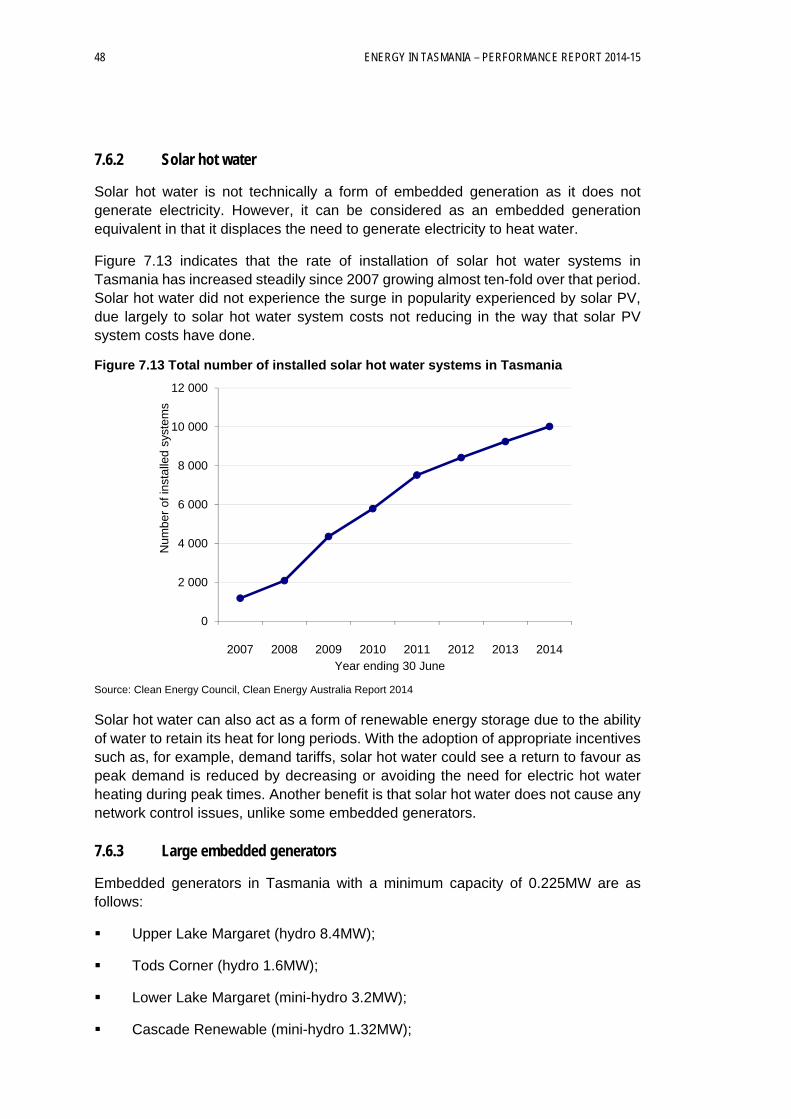
48 ENERGY IN TASMANIA – PERFORMANCE REPORT 2014-15
7.6.2 Solar hot water
Solar hot water is not technically a form of embedded generation as it does not generate electricity. However, it can be considered as an embedded generation equivalent in that it displaces the need to generate electricity to heat water.
Figure 7.13 indicates that the rate of installation of solar hot water systems in Tasmania has increased steadily since 2007 growing almost ten-fold over that period. Solar hot water did not experience the surge in popularity experienced by solar PV, due largely to solar hot water system costs not reducing in the way that solar PV system costs have done.
Figure 7.13 Total number of installed solar hot water systems in Tasmania
Source: Clean Energy Council, Clean Energy Australia Report 2014
Solar hot water can also act as a form of renewable energy storage due to the ability of water to retain its heat for long periods. With the adoption of appropriate incentives such as, for example, demand tariffs, solar hot water could see a return to favour as peak demand is reduced by decreasing or avoiding the need for electric hot water heating during peak times. Another benefit is that solar hot water does not cause any network control issues, unlike some embedded generators.
7.6.3 Large embedded generators
Embedded generators in Tasmania with a minimum capacity of 0.225MW are as follows:
Upper Lake Margaret (hydro 8.4MW);
Tods Corner (hydro 1.6MW);
Lower Lake Margaret (mini-hydro 3.2MW);
Cascade Renewable (mini-hydro 1.32MW);
0
2 000
4 000
6 000
8 000
10 000
12 000
2007 2008 2009 2010 2011 2012 2013 2014
Num
ber
of in
stal
led
syst
ems
Year ending 30 June
ENERGY IN TASMANIA – PERFORMANCE REPORT 2014-15 49
Jackson Street, Glenorchy (land fill gas 1.6MW);
Remount Road, Launceston (land fill gas 1.1MW);
McRobies Gully, South Hobart (land fill gas 1.0MW);
Meander Dam (mini-hydro 1.9MW);
Nieterana (mini-hydro 2.2MW);
Launceston General Hospital (co-generation gas 2.0MW);
Fonterra, north west coast (co-generation gas 2.0MW);
Simplot (co-generation gas 7.9MW);
Sisters Creek (wind 0.225MW);
Blowing in the wind, Sassafras (wind 0.225MW); and
Parangana (mini-hydro 0.78MW).
7.7 Generation performance
Unless granted an exemption from reporting requirements by the Regulator, all entities holding a generation licence under the ESI Act are required to report annually on their performance to the Regulator.
The key aspects of generation performance are:
availability;
reliability;
the adequacy of generating plant to meet generation requirements on an ongoing basis; and
in the case of Hydro Tasmania, the adequacy of water storages (or hydrology).
7.7.1 Availability
As with any electro-mechanical plant, generating plant cannot be available at all times. The availability factor reflects the combined effect of planned maintenance and forced (unplanned) outages and expresses the loss in generation capacity (MWh) due to all outage causes.
Availability factors have become less important since Tasmania joined the NEM as scheduling and planned outages are incorporated into market operations. Plant availability is reflected through wholesale market prices rather than technical indicators, with plant availability becoming a commercial consideration for the generating businesses involved.
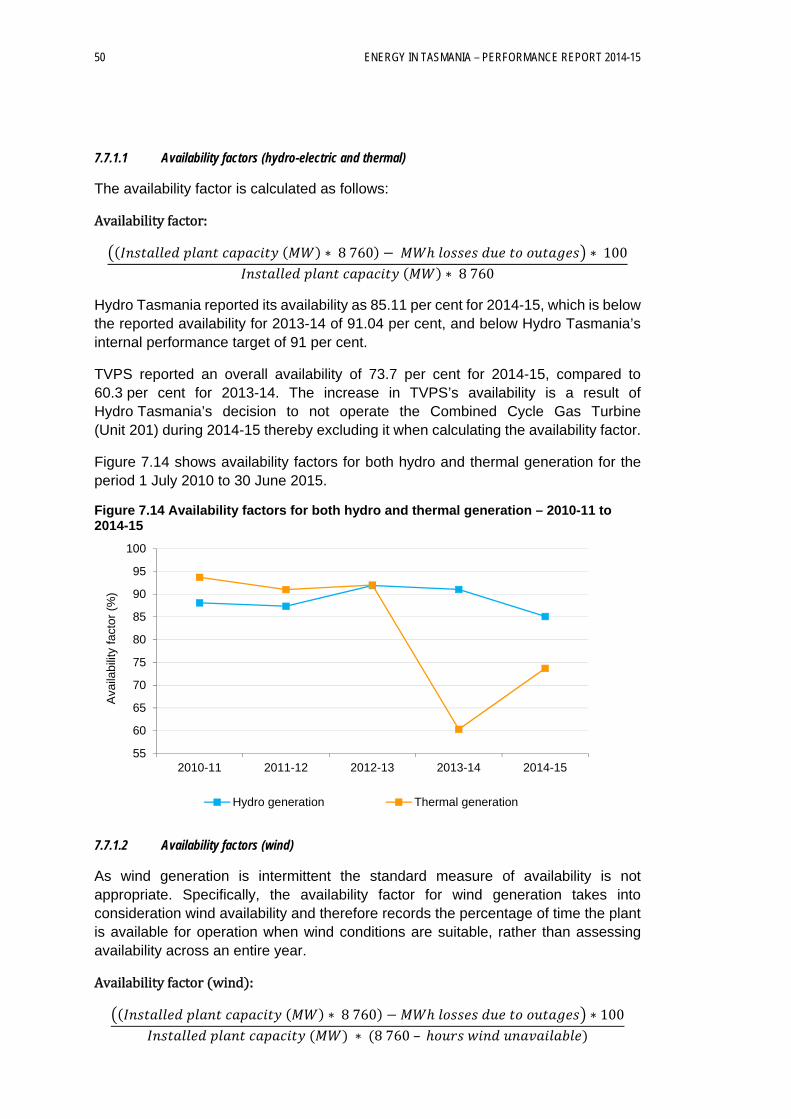
50 ENERGY IN TASMANIA – PERFORMANCE REPORT 2014-15
7.7.1.1 Availability factors (hydro-electric and thermal)
The availability factor is calculated as follows:
Availabilityfactor:
∗ 8760 ∗ 100 ∗ 8760
Hydro Tasmania reported its availability as 85.11 per cent for 2014-15, which is below the reported availability for 2013-14 of 91.04 per cent, and below Hydro Tasmania’s internal performance target of 91 per cent.
TVPS reported an overall availability of 73.7 per cent for 2014-15, compared to 60.3 per cent for 2013-14. The increase in TVPS’s availability is a result of Hydro Tasmania’s decision to not operate the Combined Cycle Gas Turbine (Unit 201) during 2014-15 thereby excluding it when calculating the availability factor.
Figure 7.14 shows availability factors for both hydro and thermal generation for the period 1 July 2010 to 30 June 2015.
Figure 7.14 Availability factors for both hydro and thermal generation – 2010-11 to 2014-15
7.7.1.2 Availability factors (wind)
As wind generation is intermittent the standard measure of availability is not appropriate. Specifically, the availability factor for wind generation takes into consideration wind availability and therefore records the percentage of time the plant is available for operation when wind conditions are suitable, rather than assessing availability across an entire year.
Availabilityfactor wind :
∗ 8760 ∗ 100 ∗ 8760–
55
60
65
70
75
80
85
90
95
100
2010-11 2011-12 2012-13 2013-14 2014-15
Ava
ilabi
lity
fact
or (
%)
Hydro generation Thermal generation
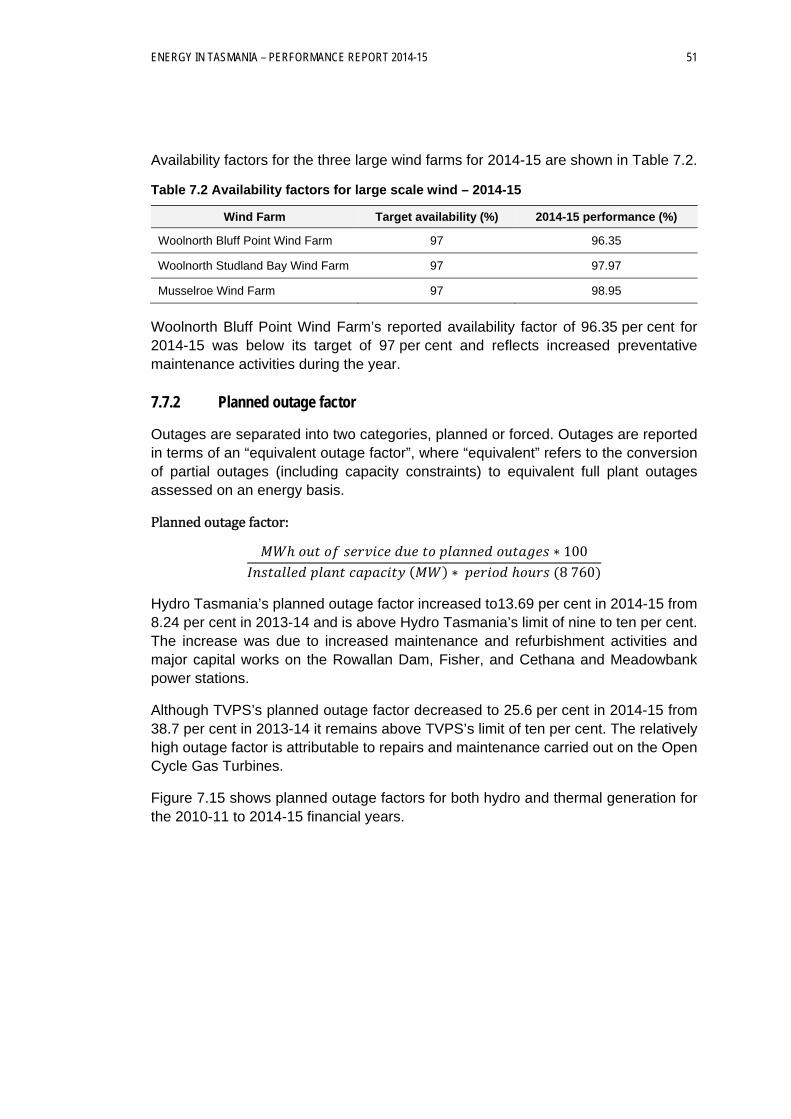
ENERGY IN TASMANIA – PERFORMANCE REPORT 2014-15 51
Availability factors for the three large wind farms for 2014-15 are shown in Table 7.2.
Table 7.2 Availability factors for large scale wind – 2014-15
Wind Farm Target availability (%) 2014-15 performance (%)
Woolnorth Bluff Point Wind Farm 97 96.35
Woolnorth Studland Bay Wind Farm 97 97.97
Musselroe Wind Farm 97 98.95
Woolnorth Bluff Point Wind Farm’s reported availability factor of 96.35 per cent for 2014-15 was below its target of 97 per cent and reflects increased preventative maintenance activities during the year.
7.7.2 Planned outage factor
Outages are separated into two categories, planned or forced. Outages are reported in terms of an “equivalent outage factor”, where “equivalent” refers to the conversion of partial outages (including capacity constraints) to equivalent full plant outages assessed on an energy basis.
Plannedoutagefactor:
∗ 100 ∗ 8760
Hydro Tasmania’s planned outage factor increased to13.69 per cent in 2014-15 from 8.24 per cent in 2013-14 and is above Hydro Tasmania’s limit of nine to ten per cent. The increase was due to increased maintenance and refurbishment activities and major capital works on the Rowallan Dam, Fisher, and Cethana and Meadowbank power stations.
Although TVPS’s planned outage factor decreased to 25.6 per cent in 2014-15 from 38.7 per cent in 2013-14 it remains above TVPS’s limit of ten per cent. The relatively high outage factor is attributable to repairs and maintenance carried out on the Open Cycle Gas Turbines.
Figure 7.15 shows planned outage factors for both hydro and thermal generation for the 2010-11 to 2014-15 financial years.
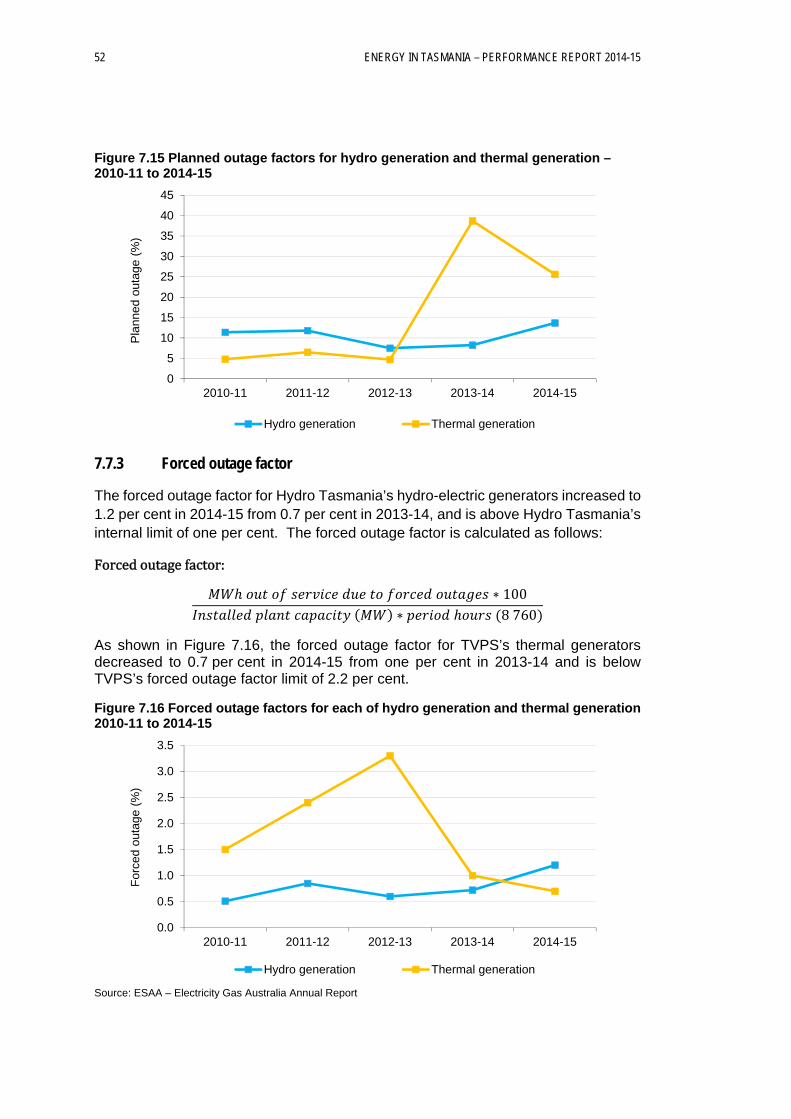
52 ENERGY IN TASMANIA – PERFORMANCE REPORT 2014-15
Figure 7.15 Planned outage factors for hydro generation and thermal generation – 2010-11 to 2014-15
7.7.3 Forced outage factor
The forced outage factor for Hydro Tasmania’s hydro-electric generators increased to 1.2 per cent in 2014-15 from 0.7 per cent in 2013-14, and is above Hydro Tasmania’s internal limit of one per cent. The forced outage factor is calculated as follows:
Forcedoutagefactor:
∗ 100 ∗ 8760
As shown in Figure 7.16, the forced outage factor for TVPS’s thermal generators decreased to 0.7 per cent in 2014-15 from one per cent in 2013-14 and is below TVPS’s forced outage factor limit of 2.2 per cent.
Figure 7.16 Forced outage factors for each of hydro generation and thermal generation 2010-11 to 2014-15
Source: ESAA – Electricity Gas Australia Annual Report
0
5
10
15
20
25
30
35
40
45
2010-11 2011-12 2012-13 2013-14 2014-15
Pla
nned
out
age
(%)
Hydro generation Thermal generation
0.0
0.5
1.0
1.5
2.0
2.5
3.0
3.5
2010-11 2011-12 2012-13 2013-14 2014-15
For
ced
outa
ge (
%)
Hydro generation Thermal generation
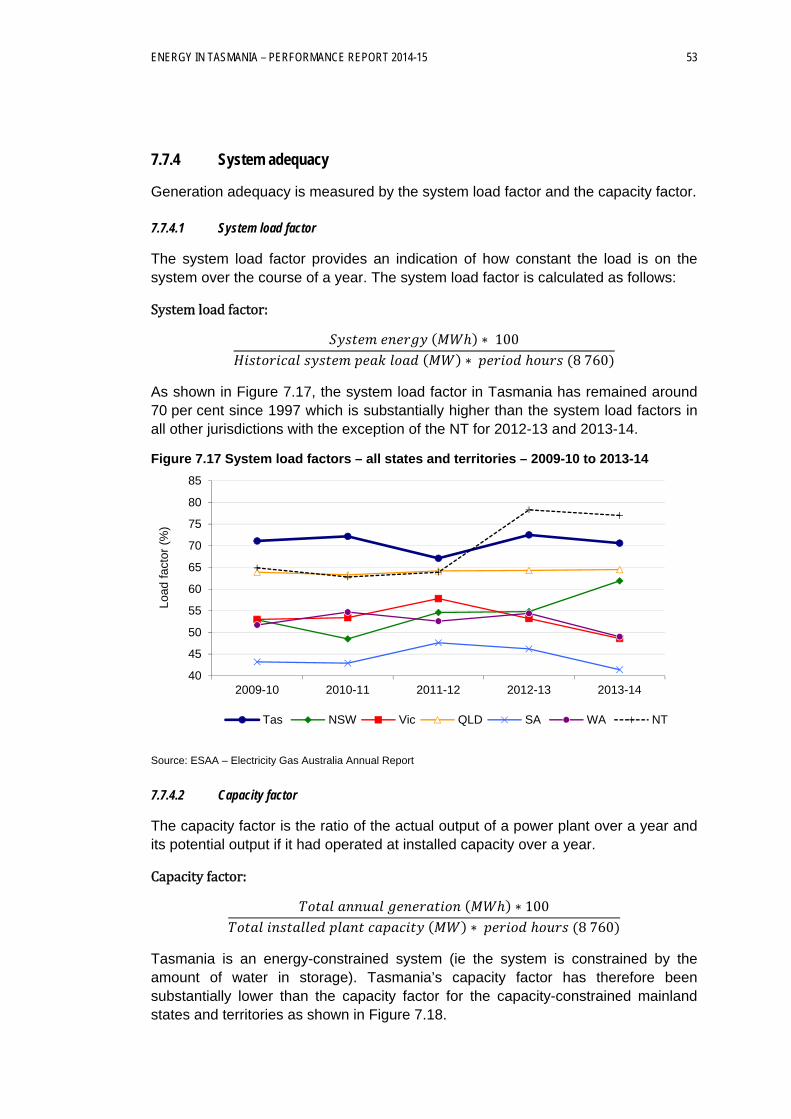
ENERGY IN TASMANIA – PERFORMANCE REPORT 2014-15 53
7.7.4 System adequacy
Generation adequacy is measured by the system load factor and the capacity factor.
7.7.4.1 System load factor
The system load factor provides an indication of how constant the load is on the system over the course of a year. The system load factor is calculated as follows:
Systemloadfactor:
∗ 100 ∗ 8760
As shown in Figure 7.17, the system load factor in Tasmania has remained around 70 per cent since 1997 which is substantially higher than the system load factors in all other jurisdictions with the exception of the NT for 2012-13 and 2013-14.
Figure 7.17 System load factors – all states and territories – 2009-10 to 2013-14
Source: ESAA – Electricity Gas Australia Annual Report
7.7.4.2 Capacity factor
The capacity factor is the ratio of the actual output of a power plant over a year and its potential output if it had operated at installed capacity over a year.
Capacityfactor:
∗ 100 ∗ 8760
Tasmania is an energy-constrained system (ie the system is constrained by the amount of water in storage). Tasmania’s capacity factor has therefore been substantially lower than the capacity factor for the capacity-constrained mainland states and territories as shown in Figure 7.18.
40
45
50
55
60
65
70
75
80
85
2009-10 2010-11 2011-12 2012-13 2013-14
Load
fac
tor
(%)
Tas NSW Vic QLD SA WA NT
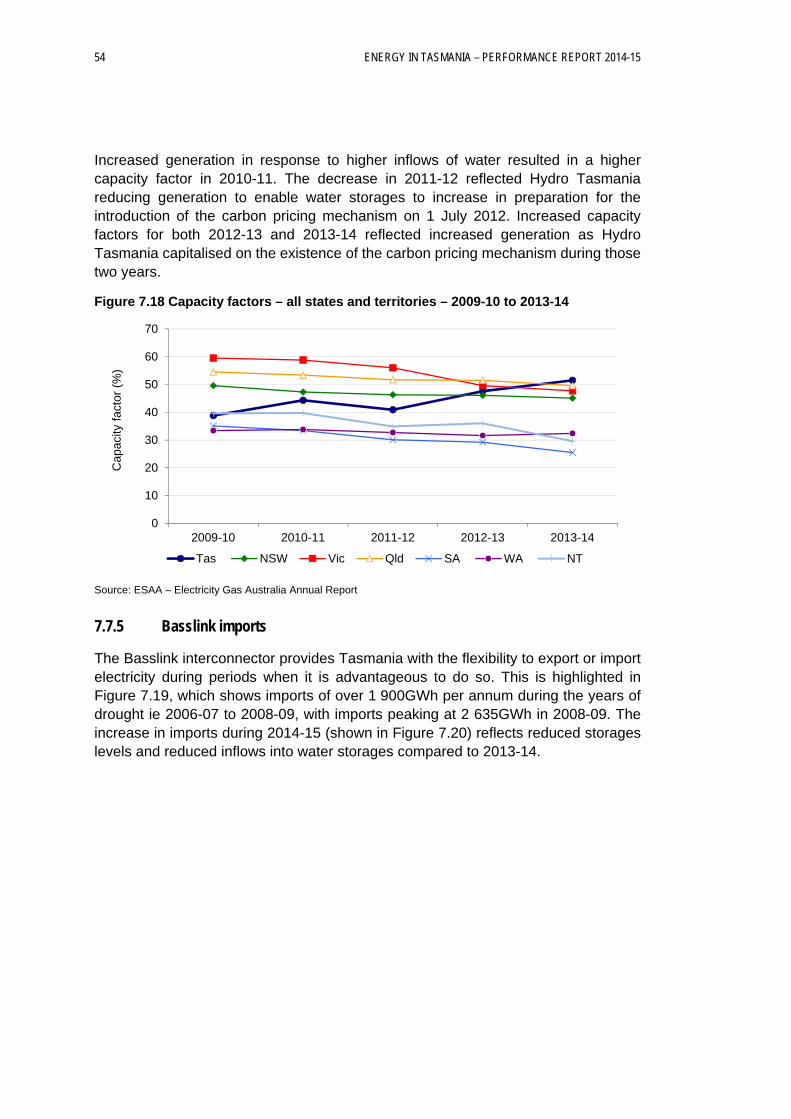
54 ENERGY IN TASMANIA – PERFORMANCE REPORT 2014-15
Increased generation in response to higher inflows of water resulted in a higher capacity factor in 2010-11. The decrease in 2011-12 reflected Hydro Tasmania reducing generation to enable water storages to increase in preparation for the introduction of the carbon pricing mechanism on 1 July 2012. Increased capacity factors for both 2012-13 and 2013-14 reflected increased generation as Hydro Tasmania capitalised on the existence of the carbon pricing mechanism during those two years.
Figure 7.18 Capacity factors – all states and territories – 2009-10 to 2013-14
Source: ESAA – Electricity Gas Australia Annual Report
7.7.5 Basslink imports
The Basslink interconnector provides Tasmania with the flexibility to export or import electricity during periods when it is advantageous to do so. This is highlighted in Figure 7.19, which shows imports of over 1 900GWh per annum during the years of drought ie 2006-07 to 2008-09, with imports peaking at 2 635GWh in 2008-09. The increase in imports during 2014-15 (shown in Figure 7.20) reflects reduced storages levels and reduced inflows into water storages compared to 2013-14.
0
10
20
30
40
50
60
70
2009-10 2010-11 2011-12 2012-13 2013-14
Cap
acity
fac
tor
(%)
Tas NSW Vic Qld SA WA NT
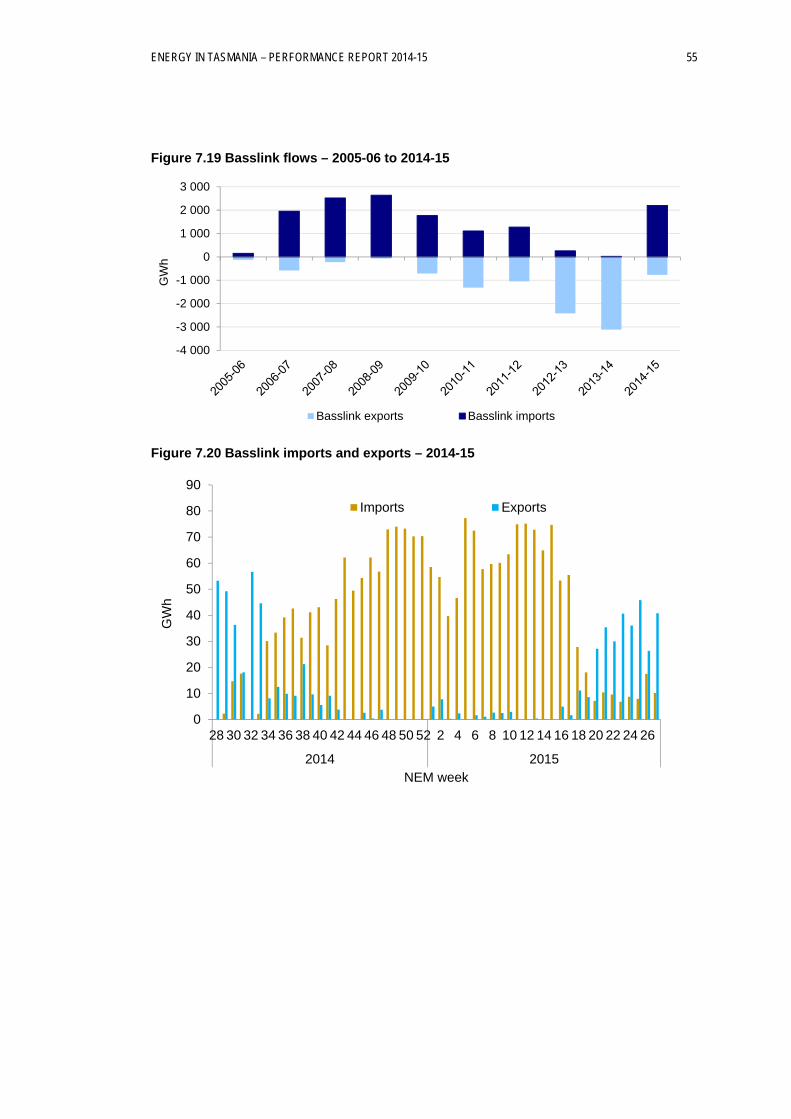
ENERGY IN TASMANIA – PERFORMANCE REPORT 2014-15 55
Figure 7.19 Basslink flows – 2005-06 to 2014-15
Figure 7.20 Basslink imports and exports – 2014-15
-4 000
-3 000
-2 000
-1 000
0
1 000
2 000
3 000
GW
h
Basslink exports Basslink imports
0
10
20
30
40
50
60
70
80
90
28 30 32 34 36 38 40 42 44 46 48 50 52 2 4 6 8 10 12 14 16 18 20 22 24 26
2014 2015
GW
h
NEM week
Imports Exports

ENERGY IN TASMANIA – PERFORMANCE REPORT 2014-15 57
8 TRANSMISSION
8.1 Introduction
The transmission network transmits electricity from generators to:
the distribution system;
major industrial customers in Tasmania; and
the national electricity grid via the Basslink interconnector.
As noted in Chapter 3, TasNetworks and Basslink Pty Ltd (BPL) provide transmission services in Tasmania.
TasNetworks, a SOC, owns and operates the electricity transmission system in Tasmania whilst BPL owns and operates the Basslink high voltage direct current (HVDC) electricity interconnector connecting the Tasmanian power system to the Victorian power system.
Under their respective licences and in accordance with the Economic Regulator’s Electricity Supply Industry Information and Performance Reporting Guideline (Version 2.3, September 2014), both TasNetworks and BPL are required to report annually on their performance to the Economic Regulator.
The key aspects of transmission performance are:
availability;
reliability;
quality; and
security of electricity supply.
Information on these aspects was gathered from BPL’s and TasNetworks’ respective 2014-15 performance reports and TasNetworks’ 2015 Annual Planning Report.
8.2 Availability
The Regulator’s ESI Performance and Information Reporting Guideline requires TasNetworks to report on transmission circuit availability and system minutes off supply.
Transmission line circuit availability measures overall transmission line circuit availability and may be affected by both planned outages (maintenance and construction) and unplanned outages (fault and forced). Transmission line circuit availability is a performance indicator of the effectiveness of the transmission business’ asset management practices.
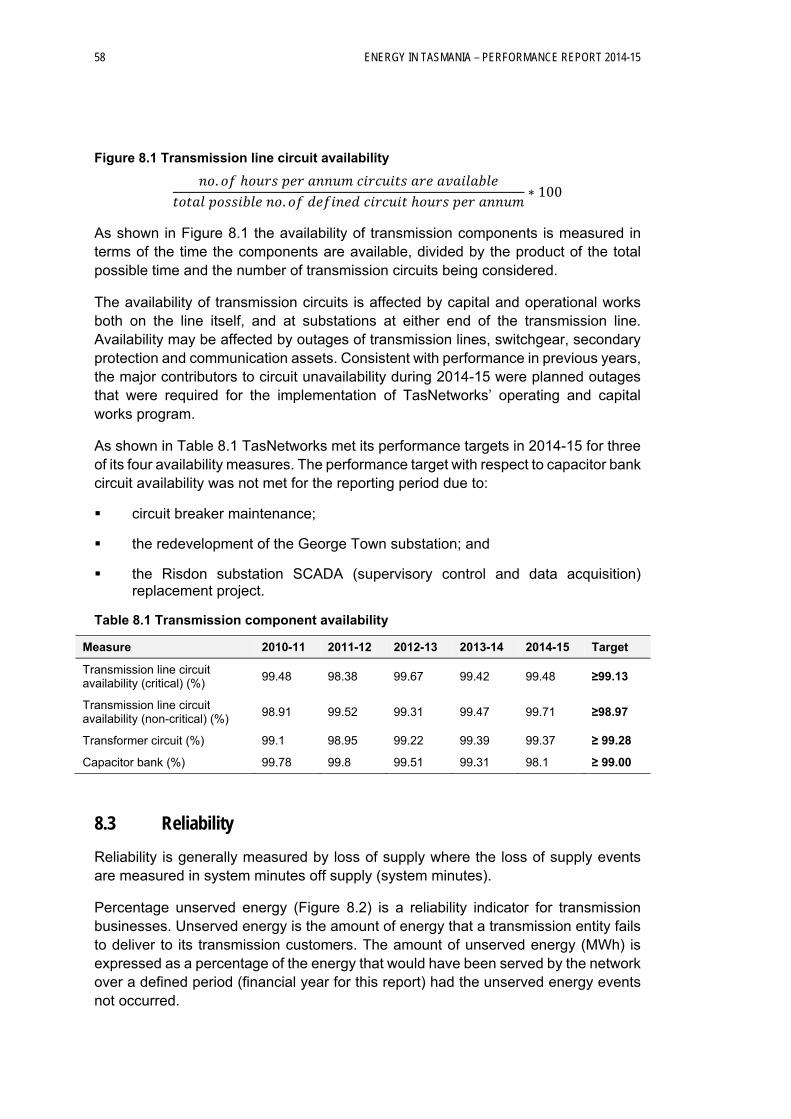
58 ENERGY IN TASMANIA – PERFORMANCE REPORT 2014-15
Figure 8.1 Transmission line circuit availability
. .
∗ 100
As shown in Figure 8.1 the availability of transmission components is measured in terms of the time the components are available, divided by the product of the total possible time and the number of transmission circuits being considered.
The availability of transmission circuits is affected by capital and operational works both on the line itself, and at substations at either end of the transmission line. Availability may be affected by outages of transmission lines, switchgear, secondary protection and communication assets. Consistent with performance in previous years, the major contributors to circuit unavailability during 2014-15 were planned outages that were required for the implementation of TasNetworks’ operating and capital works program.
As shown in Table 8.1 TasNetworks met its performance targets in 2014-15 for three of its four availability measures. The performance target with respect to capacitor bank circuit availability was not met for the reporting period due to:
circuit breaker maintenance;
the redevelopment of the George Town substation; and
the Risdon substation SCADA (supervisory control and data acquisition) replacement project.
Table 8.1 Transmission component availability
Measure 2010-11 2011-12 2012-13 2013-14 2014-15 Target
Transmission line circuit availability (critical) (%)
99.48 98.38 99.67 99.42 99.48 ≥99.13
Transmission line circuit availability (non-critical) (%)
98.91 99.52 99.31 99.47 99.71 ≥98.97
Transformer circuit (%) 99.1 98.95 99.22 99.39 99.37 ≥ 99.28
Capacitor bank (%) 99.78 99.8 99.51 99.31 98.1 ≥ 99.00
8.3 Reliability
Reliability is generally measured by loss of supply where the loss of supply events are measured in system minutes off supply (system minutes).
Percentage unserved energy (Figure 8.2) is a reliability indicator for transmission businesses. Unserved energy is the amount of energy that a transmission entity fails to deliver to its transmission customers. The amount of unserved energy (MWh) is expressed as a percentage of the energy that would have been served by the network over a defined period (financial year for this report) had the unserved energy events not occurred.
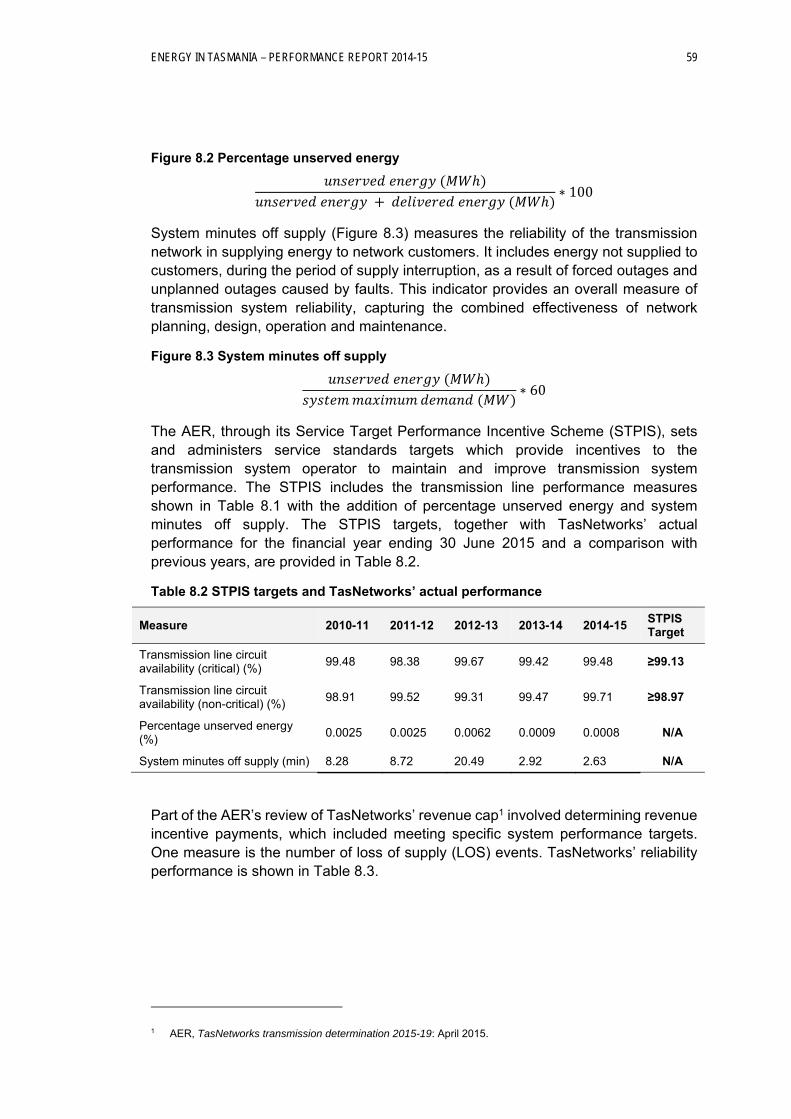
ENERGY IN TASMANIA – PERFORMANCE REPORT 2014-15 59
Figure 8.2 Percentage unserved energy
∗ 100
System minutes off supply (Figure 8.3) measures the reliability of the transmission network in supplying energy to network customers. It includes energy not supplied to customers, during the period of supply interruption, as a result of forced outages and unplanned outages caused by faults. This indicator provides an overall measure of transmission system reliability, capturing the combined effectiveness of network planning, design, operation and maintenance.
Figure 8.3 System minutes off supply
∗ 60
The AER, through its Service Target Performance Incentive Scheme (STPIS), sets and administers service standards targets which provide incentives to the transmission system operator to maintain and improve transmission system performance. The STPIS includes the transmission line performance measures shown in Table 8.1 with the addition of percentage unserved energy and system minutes off supply. The STPIS targets, together with TasNetworks’ actual performance for the financial year ending 30 June 2015 and a comparison with previous years, are provided in Table 8.2.
Table 8.2 STPIS targets and TasNetworks’ actual performance
Measure 2010-11 2011-12 2012-13 2013-14 2014-15 STPIS Target
Transmission line circuit availability (critical) (%)
99.48 98.38 99.67 99.42 99.48 ≥99.13
Transmission line circuit availability (non-critical) (%)
98.91 99.52 99.31 99.47 99.71 ≥98.97
Percentage unserved energy (%)
0.0025 0.0025 0.0062 0.0009 0.0008 N/A
System minutes off supply (min) 8.28 8.72 20.49 2.92 2.63 N/A
Part of the AER’s review of TasNetworks’ revenue cap1 involved determining revenue incentive payments, which included meeting specific system performance targets. One measure is the number of loss of supply (LOS) events. TasNetworks’ reliability performance is shown in Table 8.3.
1 AER, TasNetworks transmission determination 2015-19: April 2015.
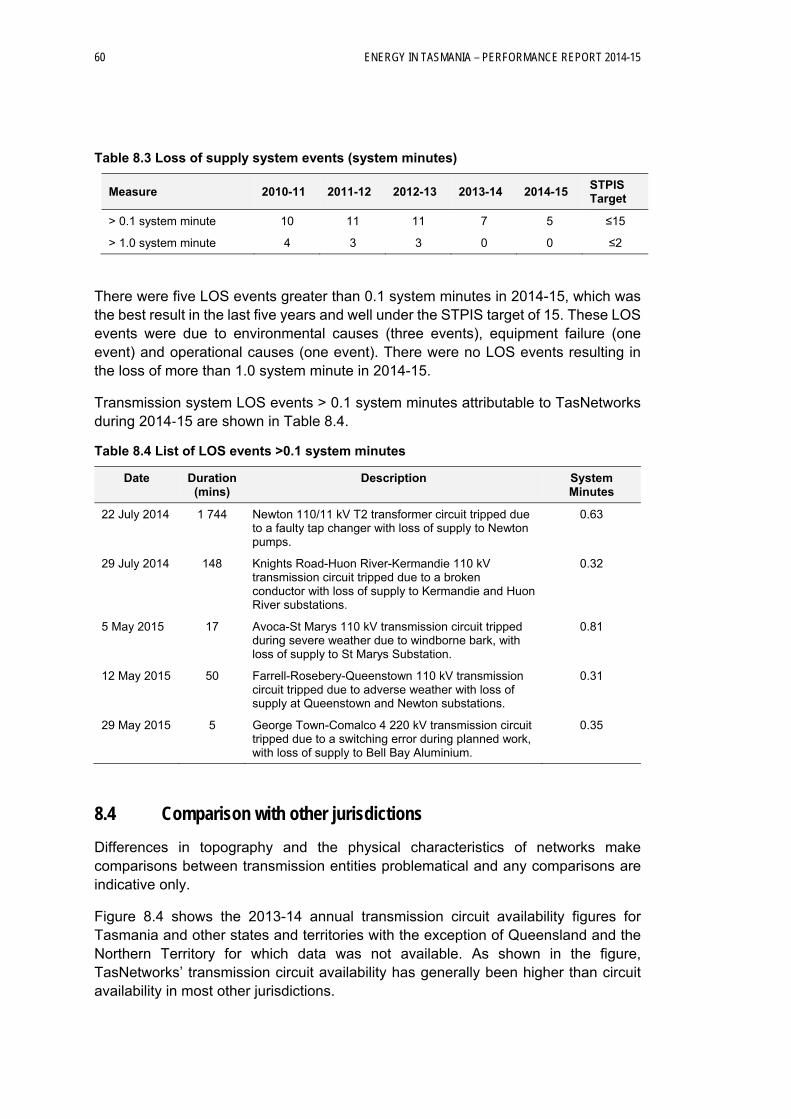
60 ENERGY IN TASMANIA – PERFORMANCE REPORT 2014-15
Table 8.3 Loss of supply system events (system minutes)
Measure 2010-11 2011-12 2012-13 2013-14 2014-15 STPIS Target
> 0.1 system minute 10 11 11 7 5 ≤15
> 1.0 system minute 4 3 3 0 0 ≤2
There were five LOS events greater than 0.1 system minutes in 2014-15, which was the best result in the last five years and well under the STPIS target of 15. These LOS events were due to environmental causes (three events), equipment failure (one event) and operational causes (one event). There were no LOS events resulting in the loss of more than 1.0 system minute in 2014-15.
Transmission system LOS events > 0.1 system minutes attributable to TasNetworks during 2014‐15 are shown in Table 8.4.
Table 8.4 List of LOS events >0.1 system minutes
Date Duration (mins)
Description System Minutes
22 July 2014 1 744 Newton 110/11 kV T2 transformer circuit tripped due to a faulty tap changer with loss of supply to Newton pumps.
0.63
29 July 2014 148 Knights Road-Huon River-Kermandie 110 kV transmission circuit tripped due to a broken conductor with loss of supply to Kermandie and Huon River substations.
0.32
5 May 2015 17 Avoca-St Marys 110 kV transmission circuit tripped during severe weather due to windborne bark, with loss of supply to St Marys Substation.
0.81
12 May 2015 50 Farrell-Rosebery-Queenstown 110 kV transmission circuit tripped due to adverse weather with loss of supply at Queenstown and Newton substations.
0.31
29 May 2015 5 George Town-Comalco 4 220 kV transmission circuit tripped due to a switching error during planned work, with loss of supply to Bell Bay Aluminium.
0.35
8.4 Comparison with other jurisdictions
Differences in topography and the physical characteristics of networks make comparisons between transmission entities problematical and any comparisons are indicative only.
Figure 8.4 shows the 2013-14 annual transmission circuit availability figures for Tasmania and other states and territories with the exception of Queensland and the Northern Territory for which data was not available. As shown in the figure, TasNetworks’ transmission circuit availability has generally been higher than circuit availability in most other jurisdictions.
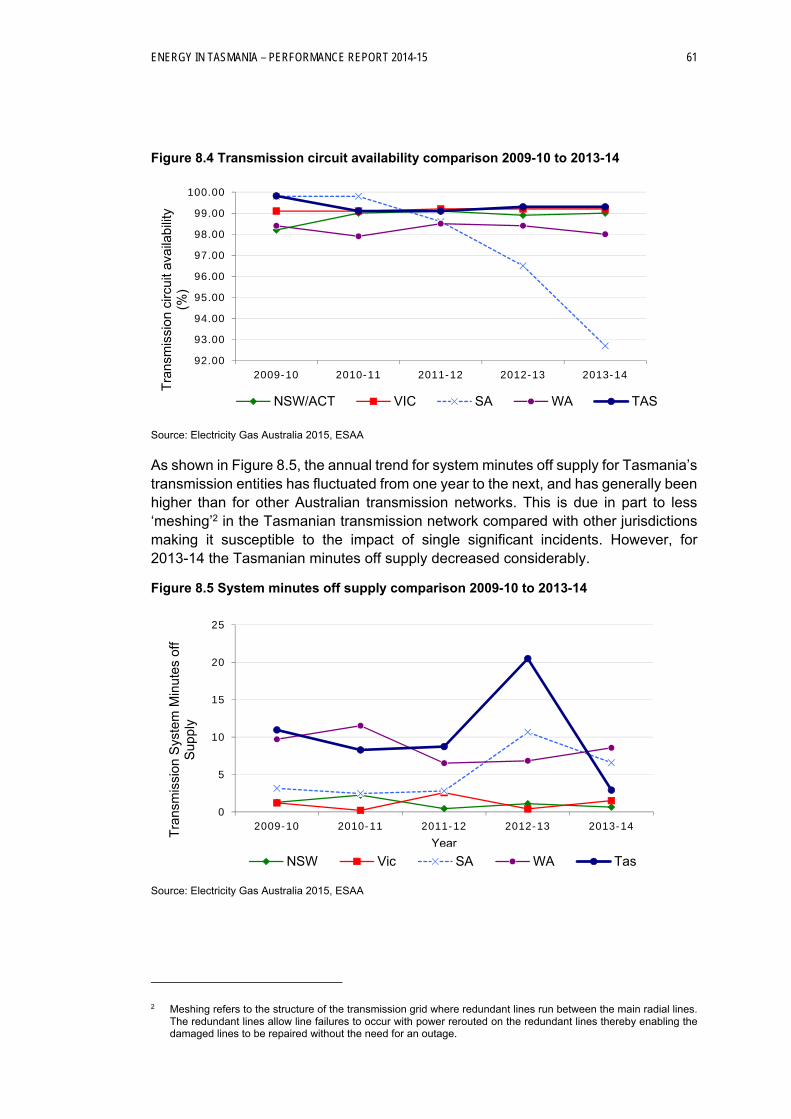
ENERGY IN TASMANIA – PERFORMANCE REPORT 2014-15 61
Figure 8.4 Transmission circuit availability comparison 2009-10 to 2013-14
Source: Electricity Gas Australia 2015, ESAA
As shown in Figure 8.5, the annual trend for system minutes off supply for Tasmania’s transmission entities has fluctuated from one year to the next, and has generally been higher than for other Australian transmission networks. This is due in part to less ‘meshing’2 in the Tasmanian transmission network compared with other jurisdictions making it susceptible to the impact of single significant incidents. However, for 2013-14 the Tasmanian minutes off supply decreased considerably.
Figure 8.5 System minutes off supply comparison 2009-10 to 2013-14
Source: Electricity Gas Australia 2015, ESAA
2 Meshing refers to the structure of the transmission grid where redundant lines run between the main radial lines. The redundant lines allow line failures to occur with power rerouted on the redundant lines thereby enabling the damaged lines to be repaired without the need for an outage.
92.00
93.00
94.00
95.00
96.00
97.00
98.00
99.00
100.00
2009-10 2010-11 2011-12 2012-13 2013-14
Tra
nsm
issi
on c
ircui
t ava
ilabi
lity
(%)
NSW/ACT VIC SA WA TAS
0
5
10
15
20
25
2009-10 2010-11 2011-12 2012-13 2013-14
Tra
nsm
issi
on S
yste
m M
inut
es o
ff S
uppl
y
Year
NSW Vic SA WA Tas
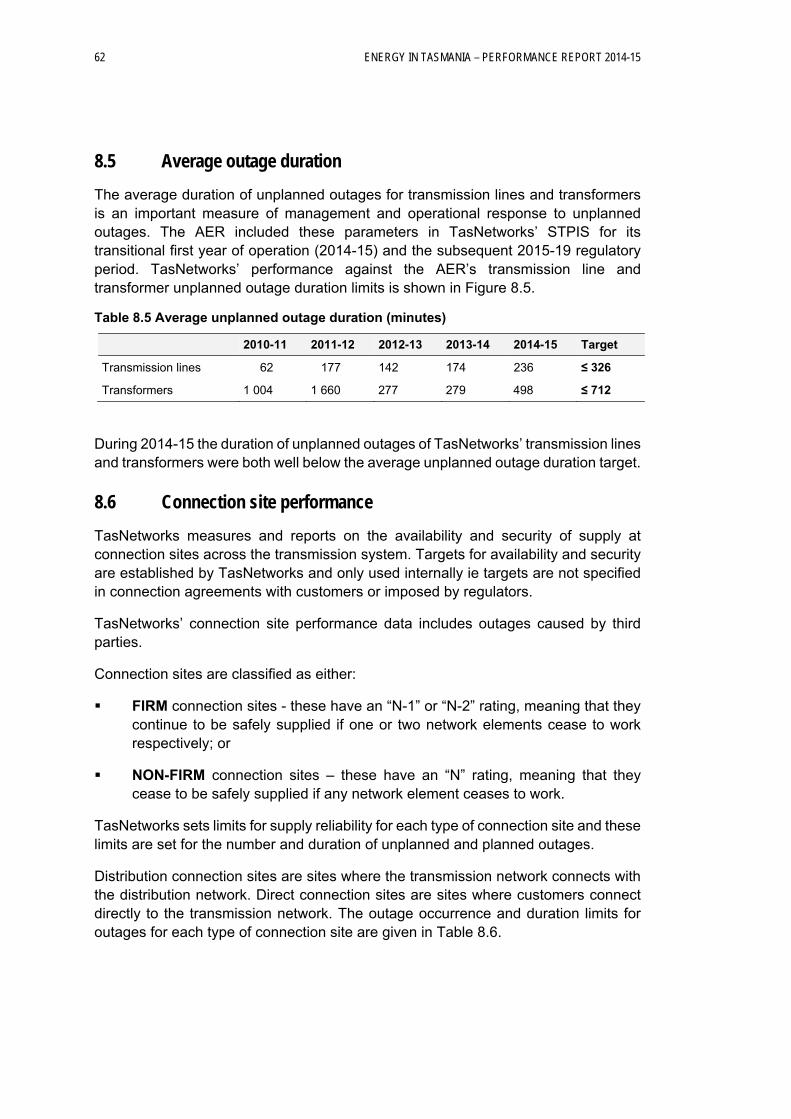
62 ENERGY IN TASMANIA – PERFORMANCE REPORT 2014-15
8.5 Average outage duration
The average duration of unplanned outages for transmission lines and transformers is an important measure of management and operational response to unplanned outages. The AER included these parameters in TasNetworks’ STPIS for its transitional first year of operation (2014-15) and the subsequent 2015-19 regulatory period. TasNetworks’ performance against the AER’s transmission line and transformer unplanned outage duration limits is shown in Figure 8.5.
Table 8.5 Average unplanned outage duration (minutes)
2010-11 2011-12 2012-13 2013-14 2014-15 Target
Transmission lines 62 177 142 174 236 ≤ 326
Transformers 1 004 1 660 277 279 498 ≤ 712
During 2014-15 the duration of unplanned outages of TasNetworks’ transmission lines and transformers were both well below the average unplanned outage duration target.
8.6 Connection site performance
TasNetworks measures and reports on the availability and security of supply at connection sites across the transmission system. Targets for availability and security are established by TasNetworks and only used internally ie targets are not specified in connection agreements with customers or imposed by regulators.
TasNetworks’ connection site performance data includes outages caused by third parties.
Connection sites are classified as either:
FIRM connection sites - these have an “N-1” or “N-2” rating, meaning that they continue to be safely supplied if one or two network elements cease to work respectively; or
NON-FIRM connection sites – these have an “N” rating, meaning that they cease to be safely supplied if any network element ceases to work.
TasNetworks sets limits for supply reliability for each type of connection site and these limits are set for the number and duration of unplanned and planned outages.
Distribution connection sites are sites where the transmission network connects with the distribution network. Direct connection sites are sites where customers connect directly to the transmission network. The outage occurrence and duration limits for outages for each type of connection site are given in Table 8.6.
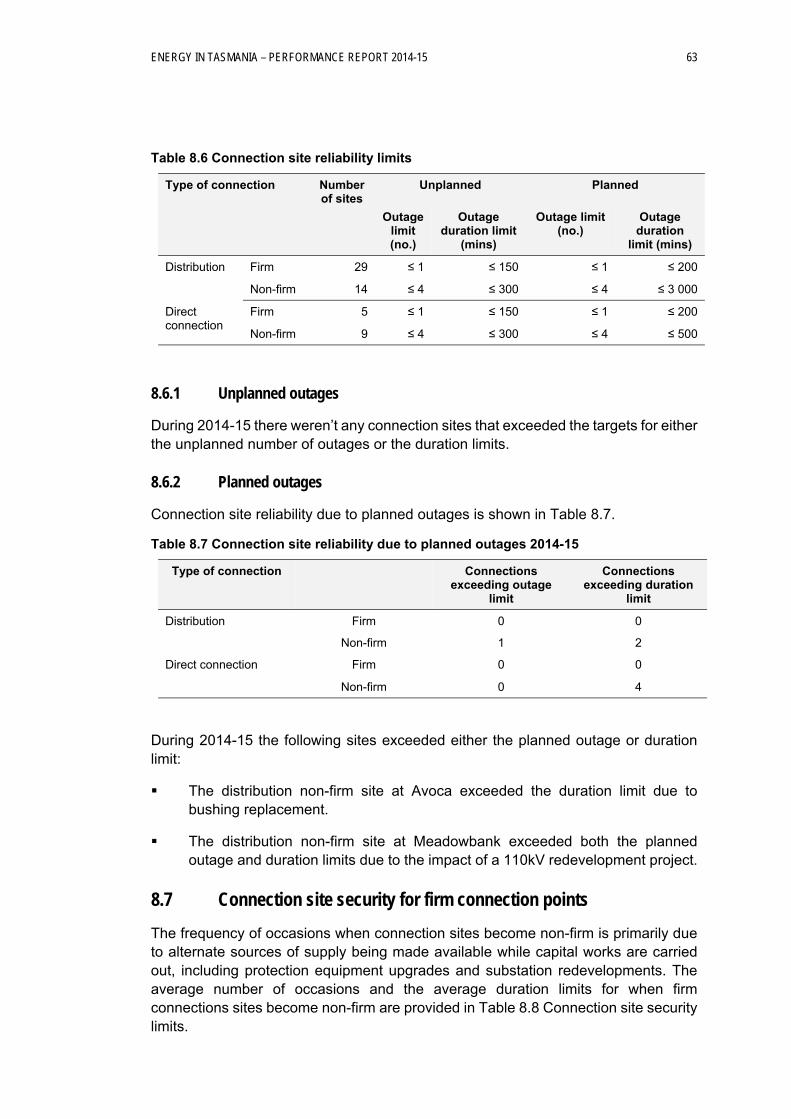
ENERGY IN TASMANIA – PERFORMANCE REPORT 2014-15 63
Table 8.6 Connection site reliability limits
Type of connection Number of sites
Unplanned Planned
Outage limit (no.)
Outage duration limit
(mins)
Outage limit (no.)
Outage duration
limit (mins)
Distribution Firm 29 ≤ 1 ≤ 150 ≤ 1 ≤ 200
Non-firm 14 ≤ 4 ≤ 300 ≤ 4 ≤ 3 000
Direct connection
Firm 5 ≤ 1 ≤ 150 ≤ 1 ≤ 200
Non-firm 9 ≤ 4 ≤ 300 ≤ 4 ≤ 500
8.6.1 Unplanned outages
During 2014-15 there weren’t any connection sites that exceeded the targets for either the unplanned number of outages or the duration limits.
8.6.2 Planned outages
Connection site reliability due to planned outages is shown in Table 8.7.
Table 8.7 Connection site reliability due to planned outages 2014-15
Type of connection Connections exceeding outage
limit
Connections exceeding duration
limit
Distribution Firm 0 0
Non-firm 1 2
Direct connection Firm 0 0
Non-firm 0 4
During 2014-15 the following sites exceeded either the planned outage or duration limit:
The distribution non-firm site at Avoca exceeded the duration limit due to bushing replacement.
The distribution non-firm site at Meadowbank exceeded both the planned outage and duration limits due to the impact of a 110kV redevelopment project.
8.7 Connection site security for firm connection points
The frequency of occasions when connection sites become non-firm is primarily due to alternate sources of supply being made available while capital works are carried out, including protection equipment upgrades and substation redevelopments. The average number of occasions and the average duration limits for when firm connections sites become non-firm are provided in Table 8.8 Connection site security limits.
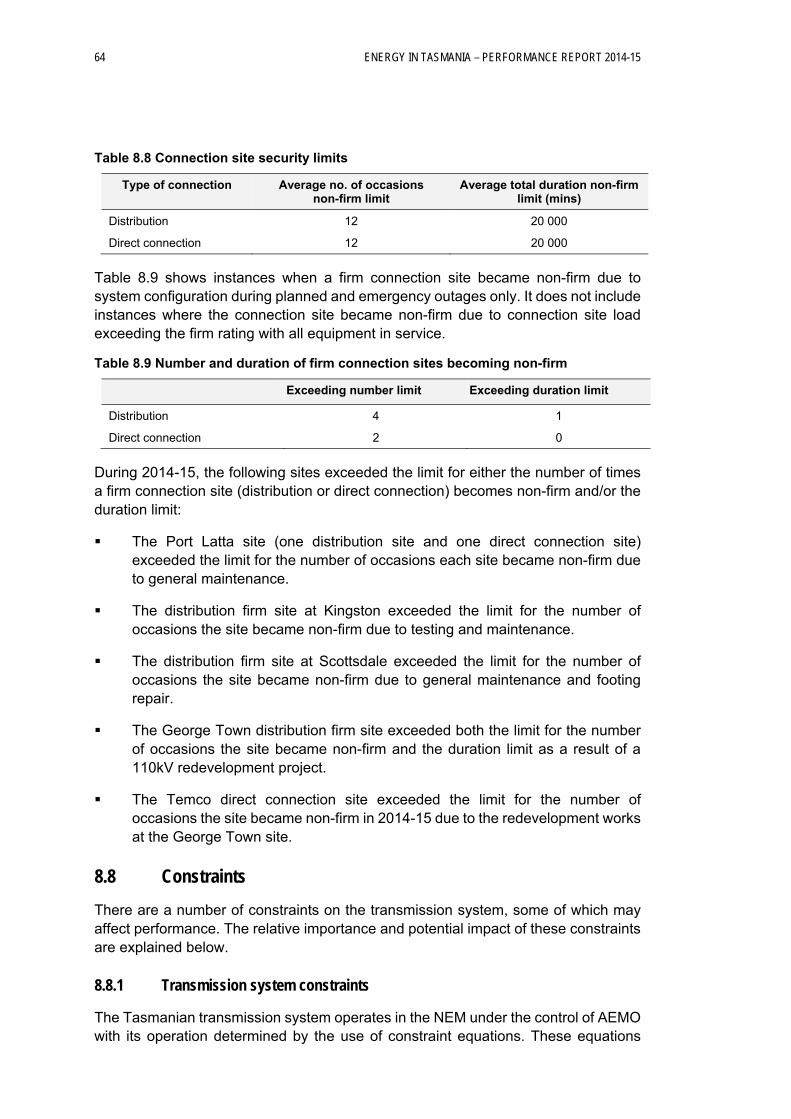
64 ENERGY IN TASMANIA – PERFORMANCE REPORT 2014-15
Table 8.8 Connection site security limits
Type of connection Average no. of occasions non-firm limit
Average total duration non-firm limit (mins)
Distribution 12 20 000
Direct connection 12 20 000
Table 8.9 shows instances when a firm connection site became non-firm due to system configuration during planned and emergency outages only. It does not include instances where the connection site became non-firm due to connection site load exceeding the firm rating with all equipment in service.
Table 8.9 Number and duration of firm connection sites becoming non-firm
Exceeding number limit Exceeding duration limit
Distribution 4 1
Direct connection 2 0
During 2014-15, the following sites exceeded the limit for either the number of times a firm connection site (distribution or direct connection) becomes non-firm and/or the duration limit:
The Port Latta site (one distribution site and one direct connection site) exceeded the limit for the number of occasions each site became non-firm due to general maintenance.
The distribution firm site at Kingston exceeded the limit for the number of occasions the site became non-firm due to testing and maintenance.
The distribution firm site at Scottsdale exceeded the limit for the number of occasions the site became non-firm due to general maintenance and footing repair.
The George Town distribution firm site exceeded both the limit for the number of occasions the site became non-firm and the duration limit as a result of a 110kV redevelopment project.
The Temco direct connection site exceeded the limit for the number of occasions the site became non-firm in 2014-15 due to the redevelopment works at the George Town site.
8.8 Constraints
There are a number of constraints on the transmission system, some of which may affect performance. The relative importance and potential impact of these constraints are explained below.
8.8.1 Transmission system constraints
The Tasmanian transmission system operates in the NEM under the control of AEMO with its operation determined by the use of constraint equations. These equations
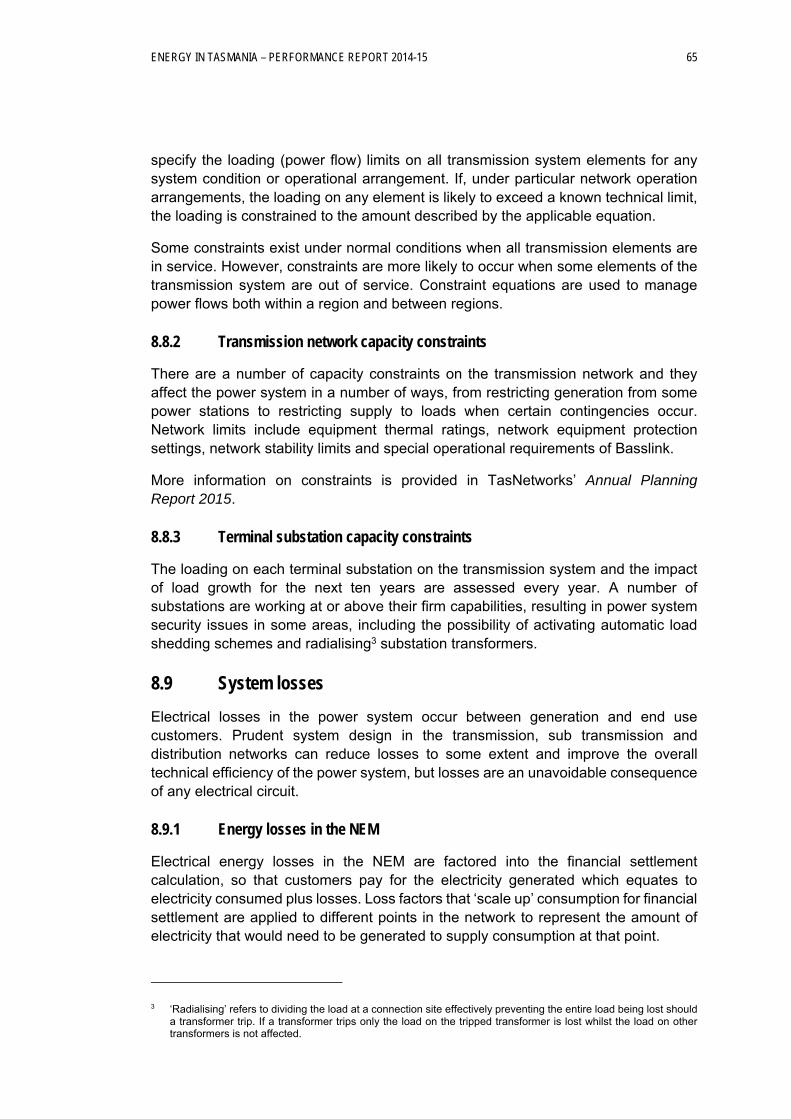
ENERGY IN TASMANIA – PERFORMANCE REPORT 2014-15 65
specify the loading (power flow) limits on all transmission system elements for any system condition or operational arrangement. If, under particular network operation arrangements, the loading on any element is likely to exceed a known technical limit, the loading is constrained to the amount described by the applicable equation.
Some constraints exist under normal conditions when all transmission elements are in service. However, constraints are more likely to occur when some elements of the transmission system are out of service. Constraint equations are used to manage power flows both within a region and between regions.
8.8.2 Transmission network capacity constraints
There are a number of capacity constraints on the transmission network and they affect the power system in a number of ways, from restricting generation from some power stations to restricting supply to loads when certain contingencies occur. Network limits include equipment thermal ratings, network equipment protection settings, network stability limits and special operational requirements of Basslink.
More information on constraints is provided in TasNetworks’ Annual Planning Report 2015.
8.8.3 Terminal substation capacity constraints
The loading on each terminal substation on the transmission system and the impact of load growth for the next ten years are assessed every year. A number of substations are working at or above their firm capabilities, resulting in power system security issues in some areas, including the possibility of activating automatic load shedding schemes and radialising3 substation transformers.
8.9 System losses
Electrical losses in the power system occur between generation and end use customers. Prudent system design in the transmission, sub transmission and distribution networks can reduce losses to some extent and improve the overall technical efficiency of the power system, but losses are an unavoidable consequence of any electrical circuit.
8.9.1 Energy losses in the NEM
Electrical energy losses in the NEM are factored into the financial settlement calculation, so that customers pay for the electricity generated which equates to electricity consumed plus losses. Loss factors that ‘scale up’ consumption for financial settlement are applied to different points in the network to represent the amount of electricity that would need to be generated to supply consumption at that point.
3 ‘Radialising’ refers to dividing the load at a connection site effectively preventing the entire load being lost should a transformer trip. If a transformer trips only the load on the tripped transformer is lost whilst the load on other transformers is not affected.
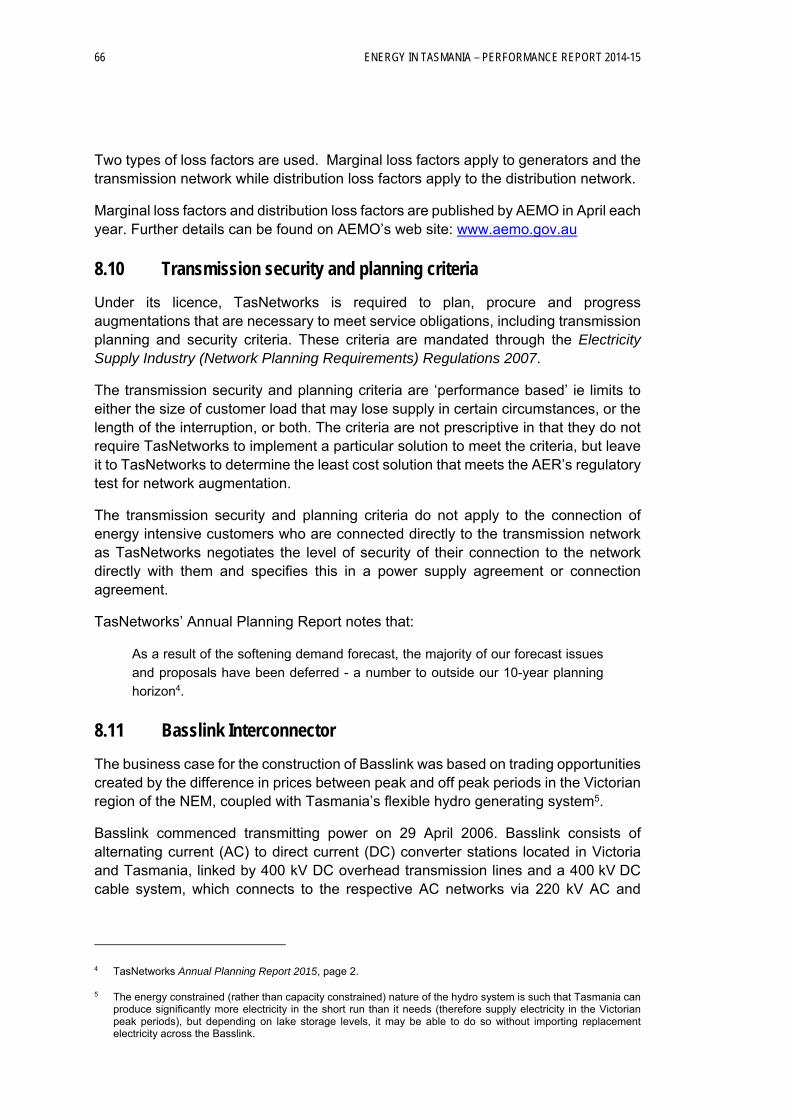
66 ENERGY IN TASMANIA – PERFORMANCE REPORT 2014-15
Two types of loss factors are used. Marginal loss factors apply to generators and the transmission network while distribution loss factors apply to the distribution network.
Marginal loss factors and distribution loss factors are published by AEMO in April each year. Further details can be found on AEMO’s web site: www.aemo.gov.au
8.10 Transmission security and planning criteria
Under its licence, TasNetworks is required to plan, procure and progress augmentations that are necessary to meet service obligations, including transmission planning and security criteria. These criteria are mandated through the Electricity Supply Industry (Network Planning Requirements) Regulations 2007.
The transmission security and planning criteria are ‘performance based’ ie limits to either the size of customer load that may lose supply in certain circumstances, or the length of the interruption, or both. The criteria are not prescriptive in that they do not require TasNetworks to implement a particular solution to meet the criteria, but leave it to TasNetworks to determine the least cost solution that meets the AER’s regulatory test for network augmentation.
The transmission security and planning criteria do not apply to the connection of energy intensive customers who are connected directly to the transmission network as TasNetworks negotiates the level of security of their connection to the network directly with them and specifies this in a power supply agreement or connection agreement.
TasNetworks’ Annual Planning Report notes that:
As a result of the softening demand forecast, the majority of our forecast issues
and proposals have been deferred - a number to outside our 10-year planning
horizon4.
8.11 Basslink Interconnector
The business case for the construction of Basslink was based on trading opportunities created by the difference in prices between peak and off peak periods in the Victorian region of the NEM, coupled with Tasmania’s flexible hydro generating system5.
Basslink commenced transmitting power on 29 April 2006. Basslink consists of alternating current (AC) to direct current (DC) converter stations located in Victoria and Tasmania, linked by 400 kV DC overhead transmission lines and a 400 kV DC cable system, which connects to the respective AC networks via 220 kV AC and
4 TasNetworks Annual Planning Report 2015, page 2.
5 The energy constrained (rather than capacity constrained) nature of the hydro system is such that Tasmania can produce significantly more electricity in the short run than it needs (therefore supply electricity in the Victorian peak periods), but depending on lake storage levels, it may be able to do so without importing replacement electricity across the Basslink.
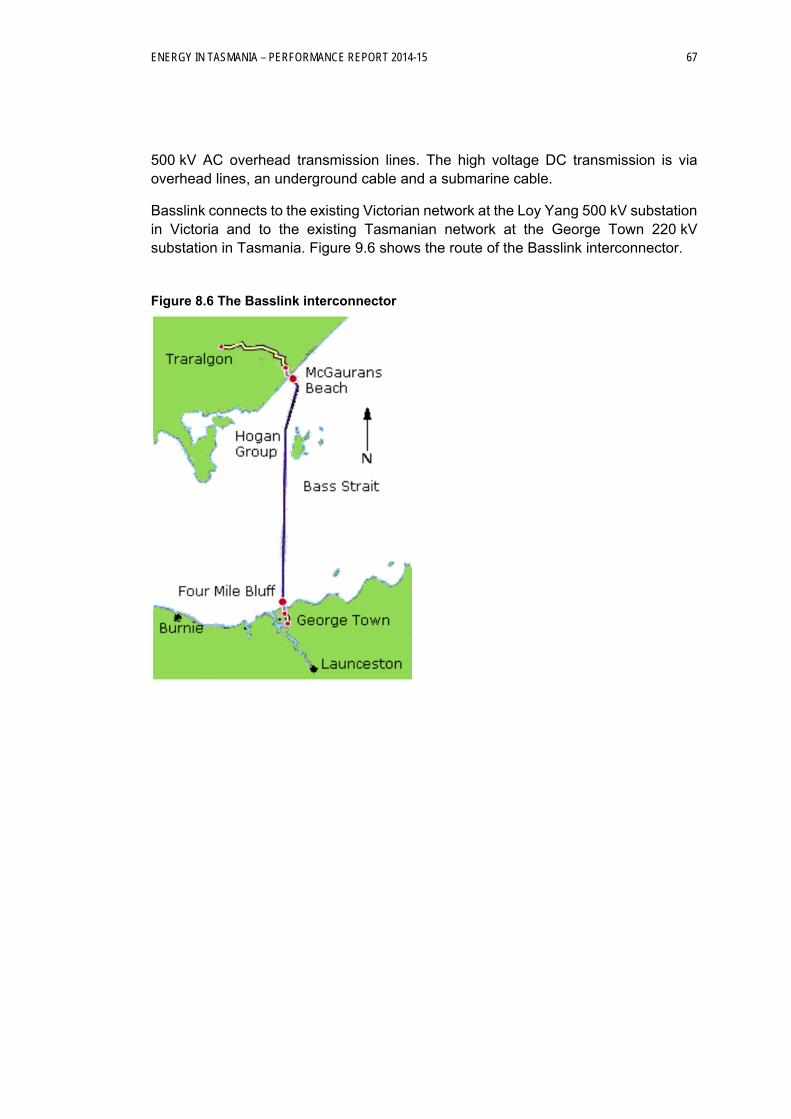
ENERGY IN TASMANIA – PERFORMANCE REPORT 2014-15 67
500 kV AC overhead transmission lines. The high voltage DC transmission is via overhead lines, an underground cable and a submarine cable.
Basslink connects to the existing Victorian network at the Loy Yang 500 kV substation in Victoria and to the existing Tasmanian network at the George Town 220 kV substation in Tasmania. Figure 9.6 shows the route of the Basslink interconnector.
Figure 8.6 The Basslink interconnector
68 ENERGY IN TASMANIA – PERFORMANCE REPORT 2014-15
The main features of Basslink are:
it is rated to export (from Tasmania to Victoria) 500 MW and import (from Victoria to Tasmania) 478 MW on a continuous basis and export up to 630 MW from Tasmania for limited periods6;
power transfer at high levels on Basslink is supported in Tasmania by a Network Control System Protection Scheme (NCSPS) and a Frequency Control System Protection Scheme (FCSPS) that initiates tripping of contracted generators and loads in Tasmania following the occurrence of certain network contingencies or an outage on Basslink; and
the Basslink control system responds to variations in the Tasmanian system frequency through its frequency control function. Basslink is capable of varying power transfer in response to differences in frequency between the Australian mainland and Tasmania networks. Basslink therefore provides a means of transferring frequency control ancillary service (FCAS) between the networks thereby assisting in maintaining power system security in Tasmania.
8.11.1 Basslink operation
Generally electricity is exported during periods of peak Victorian prices and imported during periods of low Tasmanian price.
Basslink’s flow direction7 is determined in response to the differences in spot prices in the Tasmanian and Victorian NEM regions. Even in the situation where Tasmania has a general shortage of electricity (for example, a prolonged dry spell and Hydro Tasmania’s water storages are low), Basslink therefore may operate in both directions at any time. Only in exceptional circumstances will Basslink operate for a prolonged period in one direction.
The operation of the link during normal hydrological situations displays a seasonal profile.
In summer, there is southward flow on weekends to take advantage of lower Victorian prices and northward flows during the week to take advantage of higher priced Victorian peak summer demand. In winter, electricity tends to flow northward during the day and southward at night, when prices are low in Victoria.
8.12 Basslink technical performance8
BPL is required to report annually on Basslink’s technical performance in accordance with the conditions of Basslink's transmission licence. Performance targets are set out
6 Exports and imports are measured at the Tasmanian connection point.
7 It takes 30 minutes to reverse the flow direction.
8 Further detail on Basslink’s operational requirements and performance targets can be found in the Electricity Supply Industry Expert Panel Report, An Independent Review of the Tasmanian Electricity Supply Industry Final Report Volume II, March 2012.
ENERGY IN TASMANIA – PERFORMANCE REPORT 2014-15 69
in the Basslink Operations Agreement (BOA) between the State of Tasmania and the operators of Basslink, and in the Basslink Services Agreement (BSA) between Hydro Tasmania and BPL. Basslink’s technical performance for the 2010-11 to 2014-15 financial years inclusive is summarised in Table 8.10.
Table 8.10 Basslink technical performance
2010-11 2011-12 2012-13 2013-14 2014-15
Basslink availability (%) 99.62 98.67 99.89 98.77 98.71
Minutes unavailable 1 197 6 990 578 6 462 6 780
Total unplanned outages 1 3 5 4 2
Availability is measured as the amount of energy that has been transmitted over the HVDC system, except as limited by forced and scheduled outages. It is expressed as a percentage based on the maximum continuous capacity of the HVDC system.
With all interconnectors, particularly monopole9 links like Basslink that lack the redundancy provided by a second HVDC cable, availability can be affected by planned and unplanned outages.
Planned outages typically have less impact because they are usually undertaken during periods of reduced system load or when a reduction in availability can be managed by affected customers.
In 2014-15 Basslink availability was 98.71 per cent, which is above the minimum availability of 97 per cent, and the performance target of 97.5 per cent.
8.12.1 Basslink imports (market operations)
The Basslink interconnector provides Tasmania with the flexibility to export or import electricity during periods when it is advantageous to do so. This is highlighted in Figure 8.7 which shows imports of over 1 900 GWh per annum during the years of drought ie 2006-07 to 2008-09, with imports peaking at 2 635 GWh in 2008-09.
From April 2012 to the end of August 2014 Tasmania was a net exporter of electricity to the mainland. In the first half of the 2014-15 financial year and in alignment with the removal of the carbon pricing mechanism, there was a significant increase in Basslink imports into Tasmania compared to the preceding two and a half years. Whilst still a net export month, August 2014 saw as much energy imported into Tasmania via Basslink as for the whole of 201310.
9 A monopole HVDC configuration is one where one of the terminals of the rectifier is connected to earth ground and the other terminal is connected to a transmission line.
10 TasNetworks’ 2015 Annual Planning Report.
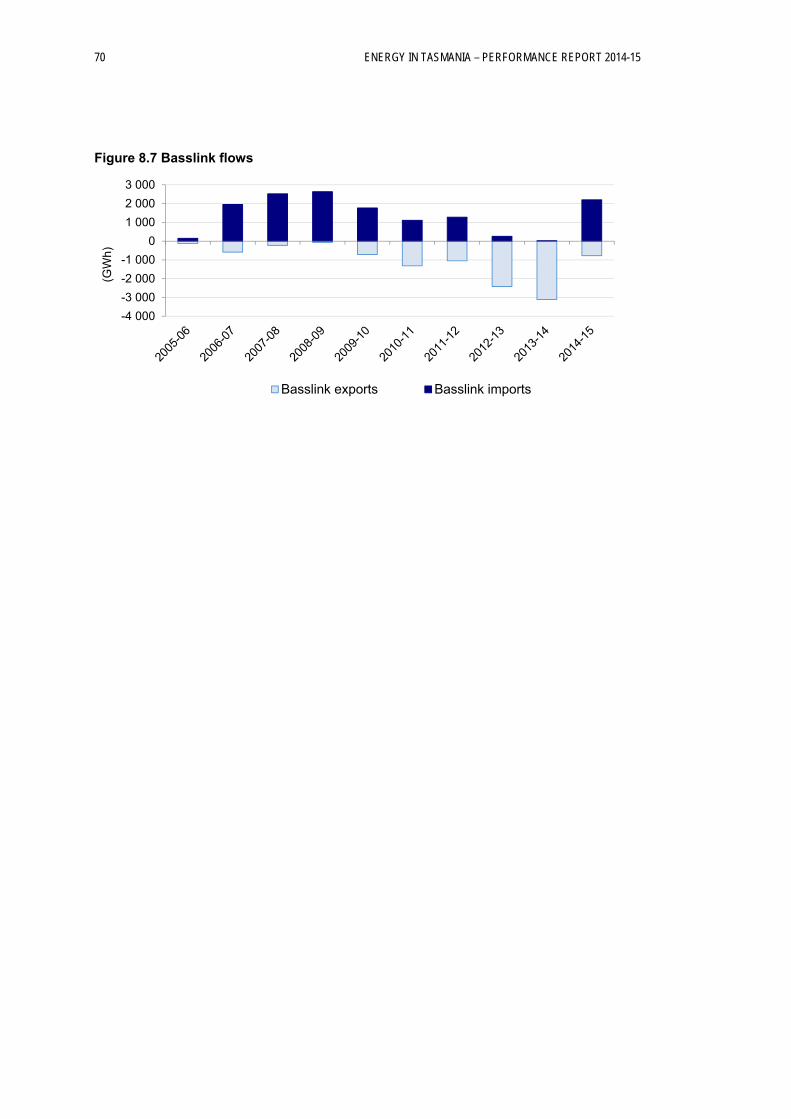
70 ENERGY IN TASMANIA – PERFORMANCE REPORT 2014-15
Figure 8.7 Basslink flows
-4 000
-3 000
-2 000
-1 000
0
1 000
2 000
3 000
(GW
h)
Basslink exports Basslink imports
ENERGY IN TASMANIA – PERFORMANCE REPORT 2014-15 71
9 ELECTRICITY DISTRIBU TION
9.1 Introduction
TasNetworks is the distribution network service provider (DNSP) in Tasmania
(excluding the Bass Strait Islands – refer to Chapter 11 of this Report) and is required
to report on the performance of its distribution network in accordance with its licence
and the Economic Regulator’s Electricity Supply Industry Information and
Performance Reporting Guideline (Version 2.3, September 2014).
The key criteria for assessing the performance of a DNSP include:
reliability - measured in terms of the number and duration of interruptions to
electricity supply;
quality - measured in terms of acceptable levels of voltage and frequency; and
customer service - measured in terms of call centre performance and the
number of Customer Charter payments the DNSP is required to make.
9.2 The distribution network
The distribution network comprises the system of poles, wires and underground
cables which carry electricity at high and low voltage (44 kV and below),
transformation equipment and the associated control, protection and maintenance
equipment.
The distribution network supplies electricity to 284 470 installations across 68 000
square kilometres in Tasmania. The distribution network is connected to the
transmission system at 43 ‘terminal substations’ throughout Tasmania. The
distribution connection points, and the asset boundary between the distribution and
transmission networks, are on the customers’ side of the terminal substations’ feeder
circuit breaker equipment. Due to historical infrastructure design there are two
locations where the distribution network feeders1 are directly connected to
Hydro Tasmania’s assets.
The HV distribution network distributes electricity at 44, 33, 22 or 11 kV. There are
404 high voltage distribution feeders which are categorised on the basis of the
predominant supply area they service. The HV distribution network is best
characterised as a rural overhead network as most of the HV feeders and almost all
the LV network are overhead cables, with underground cables restricted to the central
business districts, subdivisions and commercial centres in the urban and suburban
areas.
1 A feeder is a high voltage distribution circuit, of usually 11 kV or 22 kV that runs from a substation often with many branches supplying a wide geographic area.
72 ENERGY IN TASMANIA – PERFORMANCE REPORT 2014-15
There are 32 294 distribution substations that reduce voltage to 230/400 volts to
supply the majority of customers through the low voltage network. There are a number
of HV customers with their own distribution substations that take electricity supply
directly at 22 kV and 11 kV and some energy intensive customers that are supplied
via dedicated distribution feeders.
Rural distribution feeders are generally longer than urban feeders and of a radial
nature with limited ability to interconnect with other adjacent rural distribution feeders.
Urban distribution feeders, on the other hand, have greater flexibility due to redundant
electricity lines providing alternate routes for electricity to reach customers in the event
of the failure of a main line.
Whilst distribution system assets themselves are not overly complex, their
management is difficult by virtue of:
the number of assets;
variations in the age and condition of those assets;
the geographic spread of assets across the State; and
the diverse nature of the environment in which those assets operate.
Due to the varying conditions they are exposed to, rural feeders tend to have longer
interruptions than urban feeders, which impacts on performance levels. Feeders in
different areas are therefore expected to have different performance levels. These
differences, and the fact that customer numbers and density in urban areas is higher
than in rural areas, are reflected in the supply reliability standards which are discussed
in section 9.4.
9.3 Performance measures
The reliability of supply of the distribution network is assessed using a range of
measures. The three most common measures are System Average Interruption
Duration Index (SAIDI), System Average Interruption Frequency Index (SAIFI) and
Customer Average Interruption Duration Index (CAIDI).
9.3.1 SAIDI
SAIDI is generally reported over a one-year period and measures the average number
of minutes a customer is without power from both planned and unplanned supply
interruptions. A SAIDI of 150 minutes means that customers connected to the feeder
or supply area being measured were without power for an average of 150 minutes
during the past 12 months.
9.3.2 SAIFI
SAIFI is a measure of how often a customer, on average, loses supply during one
year. A SAIFI of two means that a customer connected to the feeder or supply area
being measured lost, on average, supply twice during the past 12 months.
ENERGY IN TASMANIA – PERFORMANCE REPORT 2014-15 73
9.3.3 CAIDI
CAIDI is normally associated with “average restoration time” and is generally reported
over a one-year period. It is the average length of time in minutes a customer is
without power due to both planned and unplanned interruptions during the year. A
CAIDI of 60 minutes means the average interruption duration for the average
customer was 60 minutes during the past 12 months.
9.4 Performance standards
Distribution network performance is based on five supply reliability categories. The
boundaries of four of these categories are defined on the basis of annual electricity
consumption:
High Density Commercial (Hobart, Launceston, Burnie, Devonport, Rosny,
Glenorchy, Kings Meadows and Kingston);
Urban and Regional Centres;
Higher Density Rural; and
Lower Density Rural.
The boundary of the fifth category - Critical Infrastructure (Hobart CBD emergency
services) - is defined on the basis of its required level of network security rather than
electricity consumption. Each of the five categories has a frequency of interruption
limit and a cumulative interruption duration limit specified in the TEC.
In accordance with the TEC, TasNetworks is required to use reasonable endeavours
to ensure that the frequency of interruptions for a category, calculated as the average
of all “communities” (discussed in section 9.4.1) in that category, and the cumulative
duration of interruptions for a category, calculated as the average of all communities
in that category, was less than the appropriate limit set in the TEC.
The economic regulation of the distribution network transferred to the Australian
Energy Regulator (AER) on 1 July 2012. Under the NER, the AER is responsible for
developing and implementing a Service Target Performance Incentive Scheme
(STPIS), applicable to licensed DNSPs on mainland Tasmania2, to provide financial
incentives to maintain and improve distribution network service performance. For
TasNetworks, the STPIS was included in the Aurora Energy distribution
determination3 that commenced on 1 July 2012.
The STPIS that applies to TasNetworks (formally applied to Aurora Energy) includes
a customer service component (telephone answering), but excludes the STPIS
2 This means Aurora Energy (Distribution) for the period up until 30 June 2014 and TasNetworks from 1 July 2014.
3 TasNetworks was formed on 1 July 2014 following a merger between Aurora Energy’s (Distribution) and Transend. As a result, while Aurora Energy (as a distributor) submitted the regulatory proposal to the AER for the distribution network, the AER’s subsequent distribution determination applies to TasNetworks.
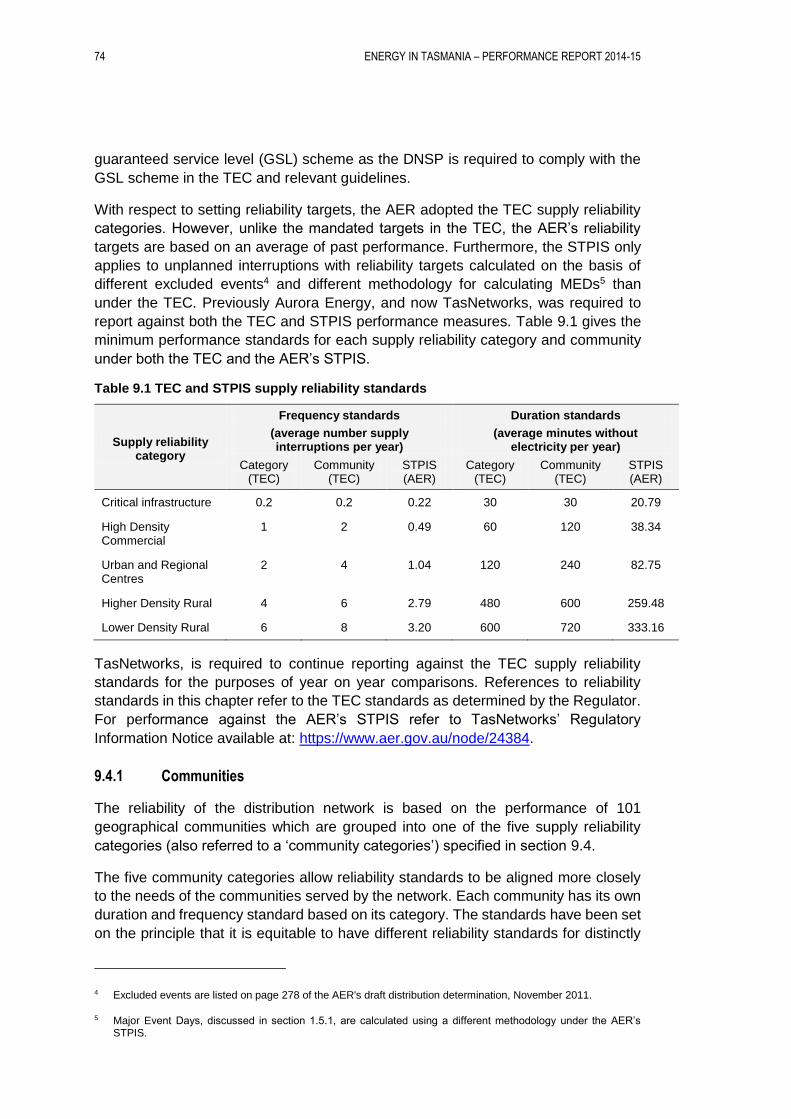
74 ENERGY IN TASMANIA – PERFORMANCE REPORT 2014-15
guaranteed service level (GSL) scheme as the DNSP is required to comply with the
GSL scheme in the TEC and relevant guidelines.
With respect to setting reliability targets, the AER adopted the TEC supply reliability
categories. However, unlike the mandated targets in the TEC, the AER’s reliability
targets are based on an average of past performance. Furthermore, the STPIS only
applies to unplanned interruptions with reliability targets calculated on the basis of
different excluded events4 and different methodology for calculating MEDs5 than
under the TEC. Previously Aurora Energy, and now TasNetworks, was required to
report against both the TEC and STPIS performance measures. Table 9.1 gives the
minimum performance standards for each supply reliability category and community
under both the TEC and the AER’s STPIS.
Table 9.1 TEC and STPIS supply reliability standards
Supply reliability category
Frequency standards
(average number supply interruptions per year)
Duration standards
(average minutes without electricity per year)
Category (TEC)
Community (TEC)
STPIS (AER)
Category (TEC)
Community (TEC)
STPIS (AER)
Critical infrastructure 0.2 0.2 0.22 30 30 20.79
High Density Commercial
1 2 0.49 60 120 38.34
Urban and Regional Centres
2 4 1.04 120 240 82.75
Higher Density Rural 4 6 2.79 480 600 259.48
Lower Density Rural 6 8 3.20 600 720 333.16
TasNetworks, is required to continue reporting against the TEC supply reliability
standards for the purposes of year on year comparisons. References to reliability
standards in this chapter refer to the TEC standards as determined by the Regulator.
For performance against the AER’s STPIS refer to TasNetworks’ Regulatory
Information Notice available at: https://www.aer.gov.au/node/24384.
9.4.1 Communities
The reliability of the distribution network is based on the performance of 101
geographical communities which are grouped into one of the five supply reliability
categories (also referred to a ‘community categories’) specified in section 9.4.
The five community categories allow reliability standards to be aligned more closely
to the needs of the communities served by the network. Each community has its own
duration and frequency standard based on its category. The standards have been set
on the principle that it is equitable to have different reliability standards for distinctly
4 Excluded events are listed on page 278 of the AER's draft distribution determination, November 2011.
5 Major Event Days, discussed in section 1.5.1, are calculated using a different methodology under the AER’s STPIS.
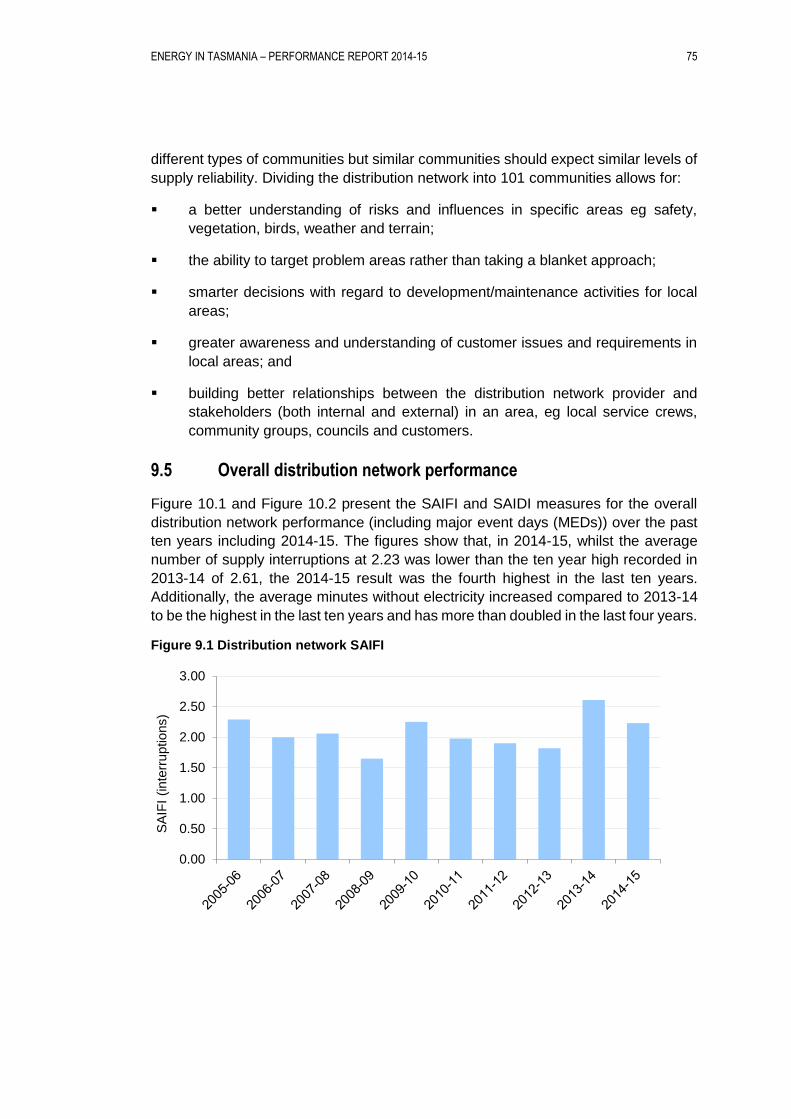
ENERGY IN TASMANIA – PERFORMANCE REPORT 2014-15 75
different types of communities but similar communities should expect similar levels of
supply reliability. Dividing the distribution network into 101 communities allows for:
a better understanding of risks and influences in specific areas eg safety,
vegetation, birds, weather and terrain;
the ability to target problem areas rather than taking a blanket approach;
smarter decisions with regard to development/maintenance activities for local
areas;
greater awareness and understanding of customer issues and requirements in
local areas; and
building better relationships between the distribution network provider and
stakeholders (both internal and external) in an area, eg local service crews,
community groups, councils and customers.
9.5 Overall distribution network performance
Figure 10.1 and Figure 10.2 present the SAIFI and SAIDI measures for the overall
distribution network performance (including major event days (MEDs)) over the past
ten years including 2014-15. The figures show that, in 2014-15, whilst the average
number of supply interruptions at 2.23 was lower than the ten year high recorded in
2013-14 of 2.61, the 2014-15 result was the fourth highest in the last ten years.
Additionally, the average minutes without electricity increased compared to 2013-14
to be the highest in the last ten years and has more than doubled in the last four years.
Figure 9.1 Distribution network SAIFI
0.00
0.50
1.00
1.50
2.00
2.50
3.00
SA
IFI
(inte
rruptions)
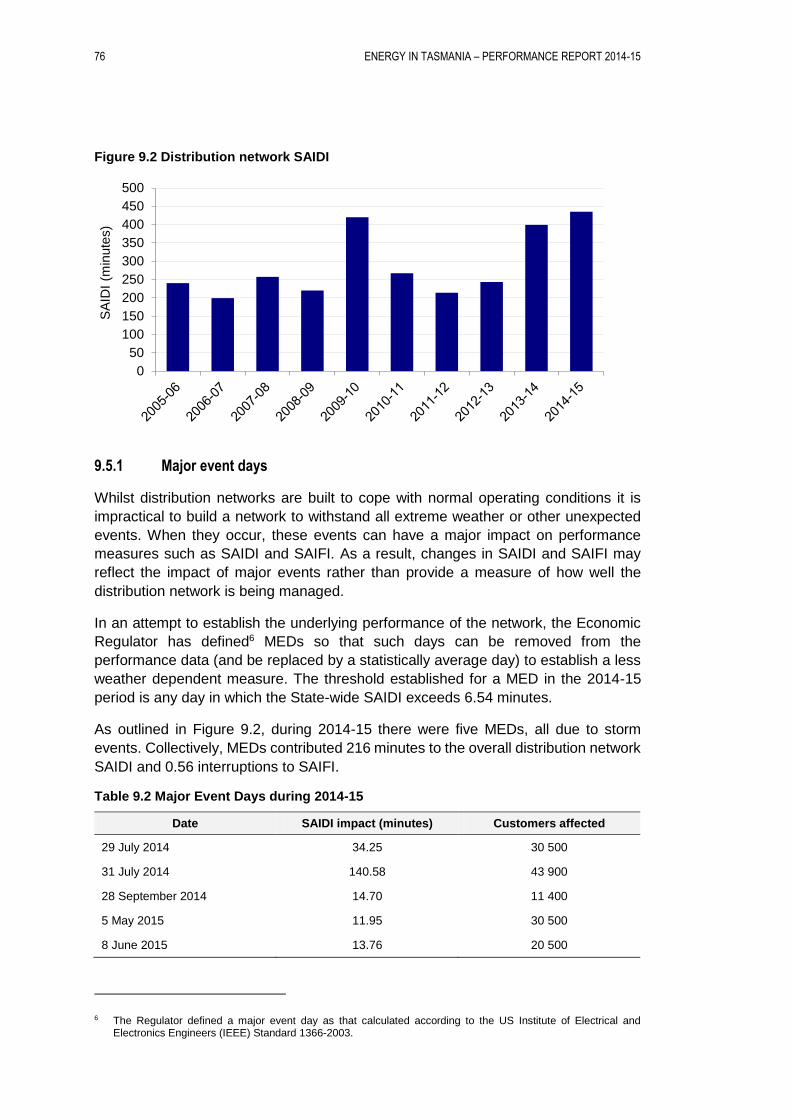
76 ENERGY IN TASMANIA – PERFORMANCE REPORT 2014-15
Figure 9.2 Distribution network SAIDI
9.5.1 Major event days
Whilst distribution networks are built to cope with normal operating conditions it is
impractical to build a network to withstand all extreme weather or other unexpected
events. When they occur, these events can have a major impact on performance
measures such as SAIDI and SAIFI. As a result, changes in SAIDI and SAIFI may
reflect the impact of major events rather than provide a measure of how well the
distribution network is being managed.
In an attempt to establish the underlying performance of the network, the Economic
Regulator has defined6 MEDs so that such days can be removed from the
performance data (and be replaced by a statistically average day) to establish a less
weather dependent measure. The threshold established for a MED in the 2014-15
period is any day in which the State-wide SAIDI exceeds 6.54 minutes.
As outlined in Figure 9.2, during 2014-15 there were five MEDs, all due to storm
events. Collectively, MEDs contributed 216 minutes to the overall distribution network
SAIDI and 0.56 interruptions to SAIFI.
Table 9.2 Major Event Days during 2014-15
Date SAIDI impact (minutes) Customers affected
29 July 2014 34.25 30 500
31 July 2014 140.58 43 900
28 September 2014 14.70 11 400
5 May 2015 11.95 30 500
8 June 2015 13.76 20 500
6 The Regulator defined a major event day as that calculated according to the US Institute of Electrical and Electronics Engineers (IEEE) Standard 1366-2003.
0
50
100
150
200
250
300
350
400
450
500
SA
IDI
(min
ute
s)
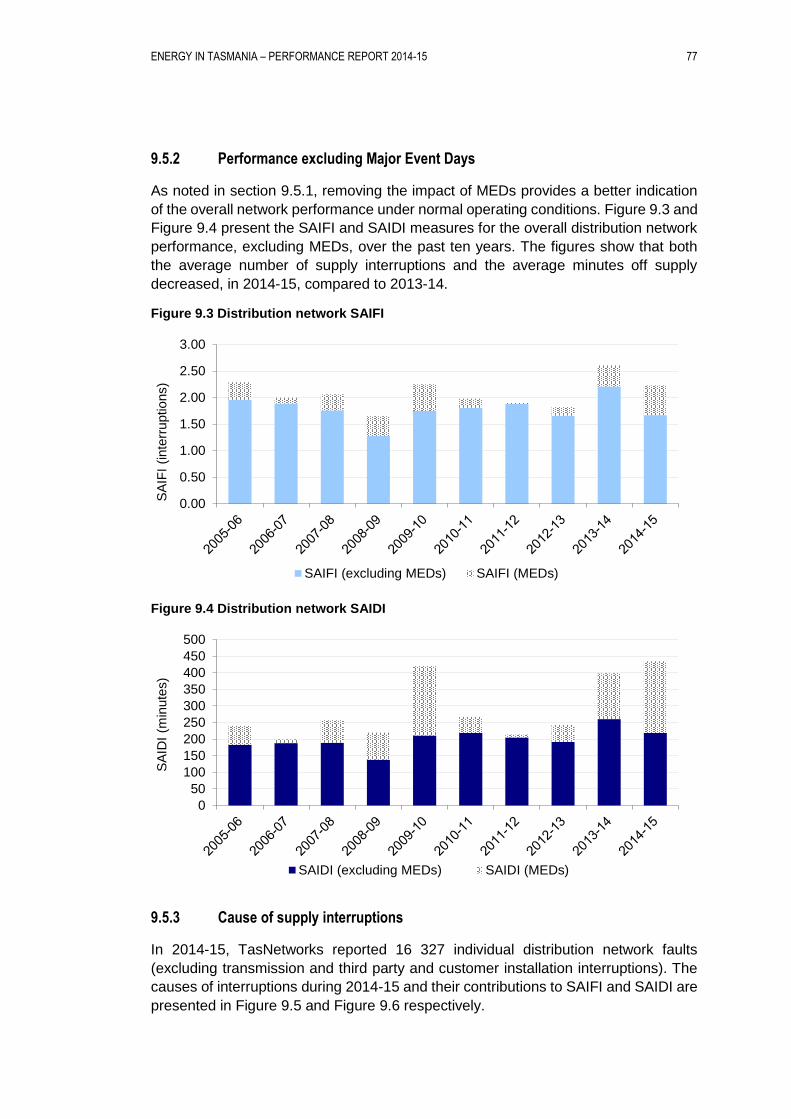
ENERGY IN TASMANIA – PERFORMANCE REPORT 2014-15 77
9.5.2 Performance excluding Major Event Days
As noted in section 9.5.1, removing the impact of MEDs provides a better indication
of the overall network performance under normal operating conditions. Figure 9.3 and
Figure 9.4 present the SAIFI and SAIDI measures for the overall distribution network
performance, excluding MEDs, over the past ten years. The figures show that both
the average number of supply interruptions and the average minutes off supply
decreased, in 2014-15, compared to 2013-14.
Figure 9.3 Distribution network SAIFI
Figure 9.4 Distribution network SAIDI
9.5.3 Cause of supply interruptions
In 2014-15, TasNetworks reported 16 327 individual distribution network faults
(excluding transmission and third party and customer installation interruptions). The
causes of interruptions during 2014-15 and their contributions to SAIFI and SAIDI are
presented in Figure 9.5 and Figure 9.6 respectively.
0.00
0.50
1.00
1.50
2.00
2.50
3.00
SA
IFI
(inte
rruptions)
SAIFI (excluding MEDs) SAIFI (MEDs)
0
50
100
150
200
250
300
350
400
450
500
SA
IDI
(min
ute
s)
SAIDI (excluding MEDs) SAIDI (MEDs)
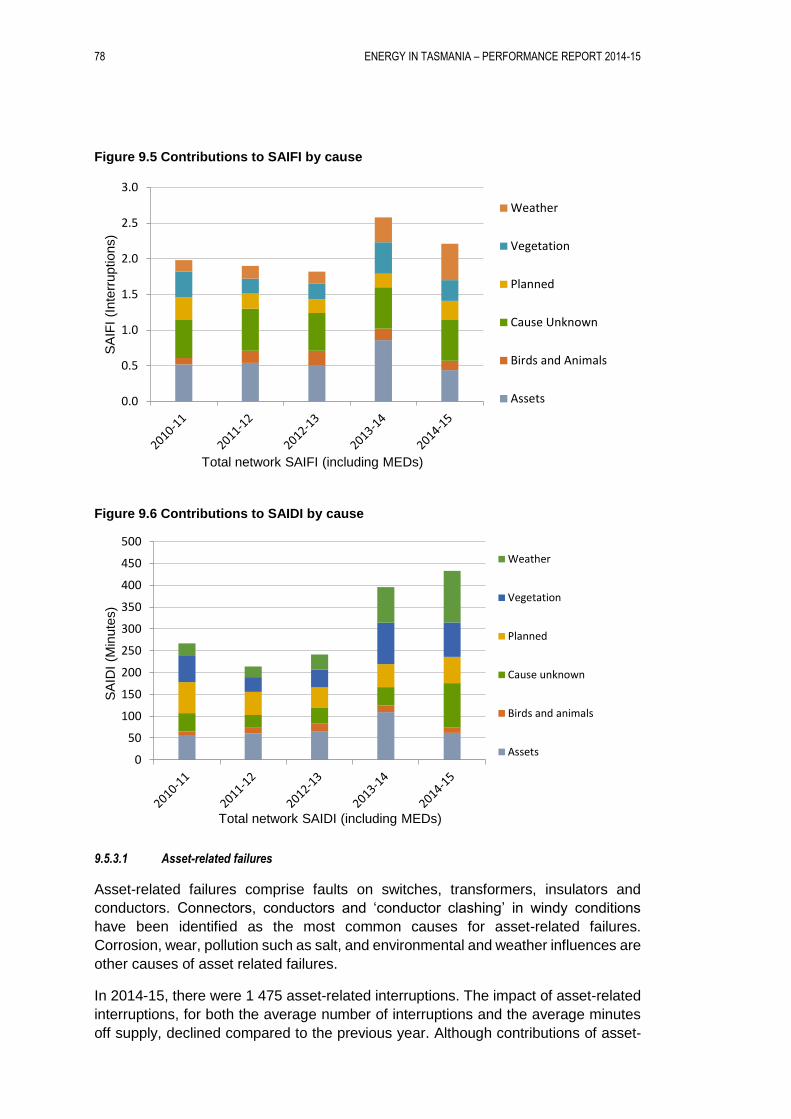
78 ENERGY IN TASMANIA – PERFORMANCE REPORT 2014-15
Figure 9.5 Contributions to SAIFI by cause
Figure 9.6 Contributions to SAIDI by cause
9.5.3.1 Asset-related failures
Asset-related failures comprise faults on switches, transformers, insulators and
conductors. Connectors, conductors and ‘conductor clashing’ in windy conditions
have been identified as the most common causes for asset-related failures.
Corrosion, wear, pollution such as salt, and environmental and weather influences are
other causes of asset related failures.
In 2014-15, there were 1 475 asset-related interruptions. The impact of asset-related
interruptions, for both the average number of interruptions and the average minutes
off supply, declined compared to the previous year. Although contributions of asset-
0.0
0.5
1.0
1.5
2.0
2.5
3.0
SA
IFI
(Inte
rruptions)
Weather
Vegetation
Planned
Cause Unknown
Birds and Animals
Assets
Total network SAIFI (including MEDs)
0
50
100
150
200
250
300
350
400
450
500
SA
IDI
(Min
ute
s)
Weather
Vegetation
Planned
Cause unknown
Birds and animals
Assets
Total network SAIDI (including MEDs)
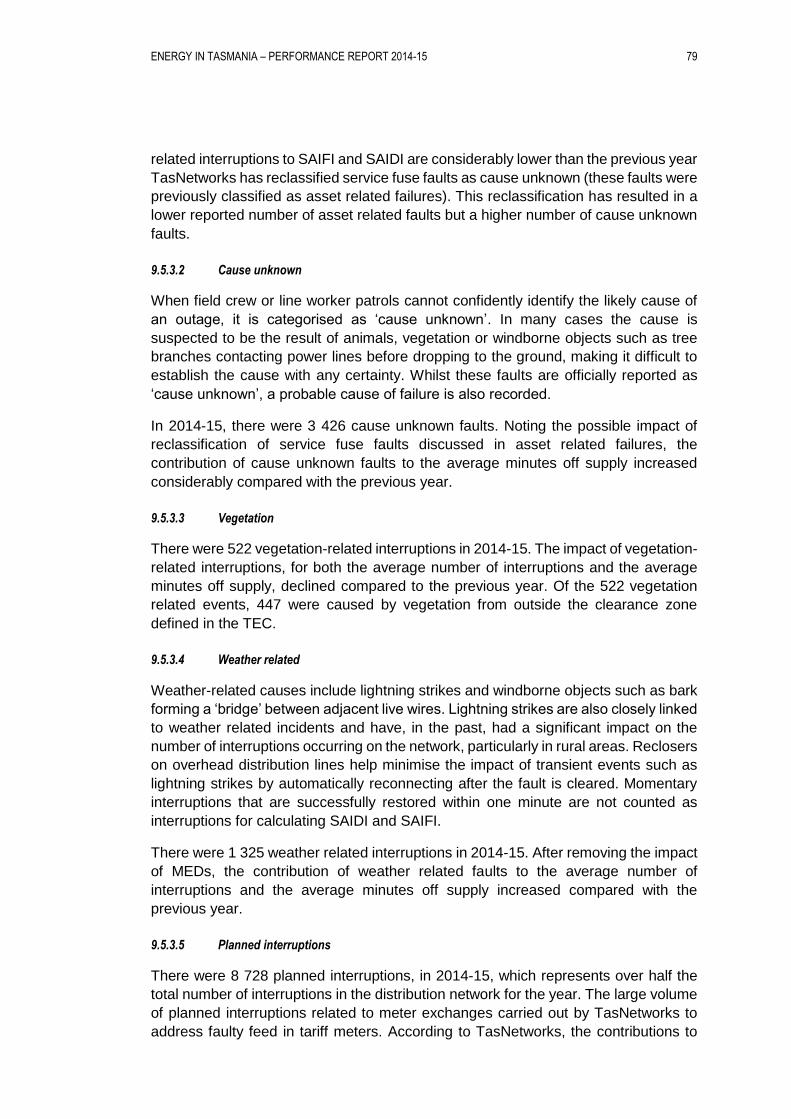
ENERGY IN TASMANIA – PERFORMANCE REPORT 2014-15 79
related interruptions to SAIFI and SAIDI are considerably lower than the previous year
TasNetworks has reclassified service fuse faults as cause unknown (these faults were
previously classified as asset related failures). This reclassification has resulted in a
lower reported number of asset related faults but a higher number of cause unknown
faults.
9.5.3.2 Cause unknown
When field crew or line worker patrols cannot confidently identify the likely cause of
an outage, it is categorised as ‘cause unknown’. In many cases the cause is
suspected to be the result of animals, vegetation or windborne objects such as tree
branches contacting power lines before dropping to the ground, making it difficult to
establish the cause with any certainty. Whilst these faults are officially reported as
‘cause unknown’, a probable cause of failure is also recorded.
In 2014-15, there were 3 426 cause unknown faults. Noting the possible impact of
reclassification of service fuse faults discussed in asset related failures, the
contribution of cause unknown faults to the average minutes off supply increased
considerably compared with the previous year.
9.5.3.3 Vegetation
There were 522 vegetation-related interruptions in 2014-15. The impact of vegetation-
related interruptions, for both the average number of interruptions and the average
minutes off supply, declined compared to the previous year. Of the 522 vegetation
related events, 447 were caused by vegetation from outside the clearance zone
defined in the TEC.
9.5.3.4 Weather related
Weather-related causes include lightning strikes and windborne objects such as bark
forming a ‘bridge’ between adjacent live wires. Lightning strikes are also closely linked
to weather related incidents and have, in the past, had a significant impact on the
number of interruptions occurring on the network, particularly in rural areas. Reclosers
on overhead distribution lines help minimise the impact of transient events such as
lightning strikes by automatically reconnecting after the fault is cleared. Momentary
interruptions that are successfully restored within one minute are not counted as
interruptions for calculating SAIDI and SAIFI.
There were 1 325 weather related interruptions in 2014-15. After removing the impact
of MEDs, the contribution of weather related faults to the average number of
interruptions and the average minutes off supply increased compared with the
previous year.
9.5.3.5 Planned interruptions
There were 8 728 planned interruptions, in 2014-15, which represents over half the
total number of interruptions in the distribution network for the year. The large volume
of planned interruptions related to meter exchanges carried out by TasNetworks to
address faulty feed in tariff meters. According to TasNetworks, the contributions to
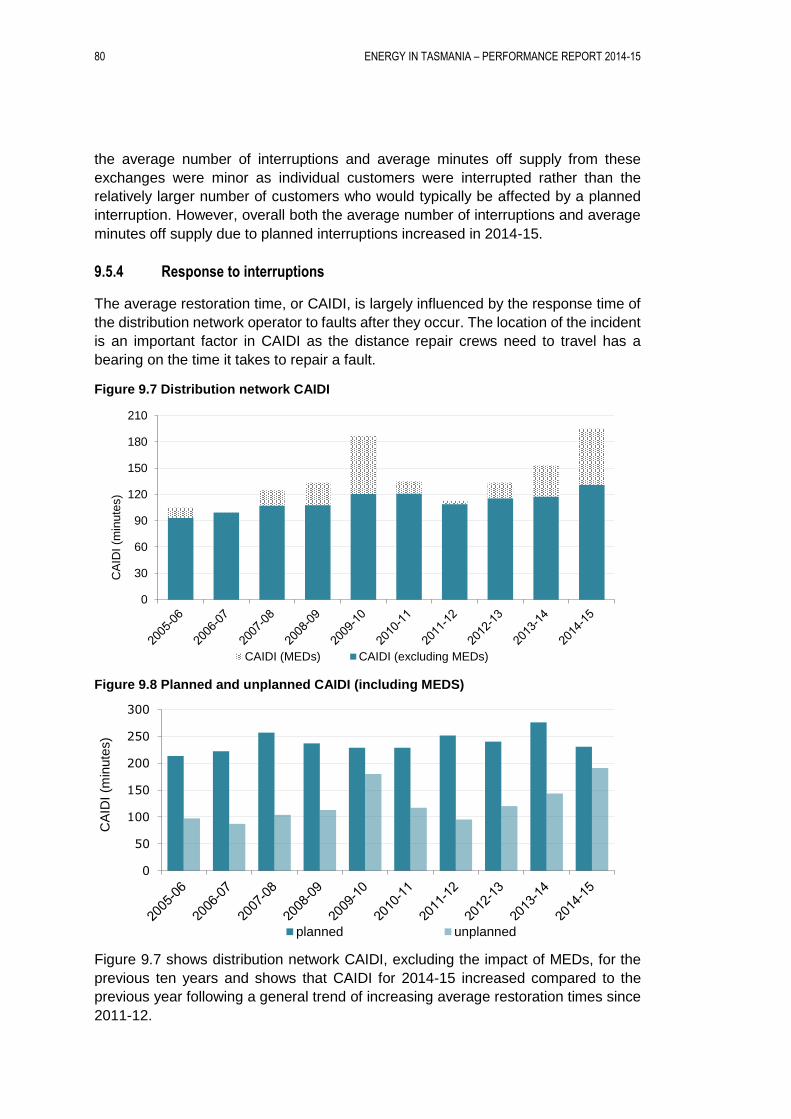
80 ENERGY IN TASMANIA – PERFORMANCE REPORT 2014-15
the average number of interruptions and average minutes off supply from these
exchanges were minor as individual customers were interrupted rather than the
relatively larger number of customers who would typically be affected by a planned
interruption. However, overall both the average number of interruptions and average
minutes off supply due to planned interruptions increased in 2014-15.
9.5.4 Response to interruptions
The average restoration time, or CAIDI, is largely influenced by the response time of
the distribution network operator to faults after they occur. The location of the incident
is an important factor in CAIDI as the distance repair crews need to travel has a
bearing on the time it takes to repair a fault.
Figure 9.7 Distribution network CAIDI
Figure 9.8 Planned and unplanned CAIDI (including MEDS)
Figure 9.7 shows distribution network CAIDI, excluding the impact of MEDs, for the
previous ten years and shows that CAIDI for 2014-15 increased compared to the
previous year following a general trend of increasing average restoration times since
2011-12.
0
30
60
90
120
150
180
210
CA
IDI
(min
ute
s)
CAIDI (MEDs) CAIDI (excluding MEDs)
0
50
100
150
200
250
300
CA
IDI
(min
ute
s)
planned unplanned
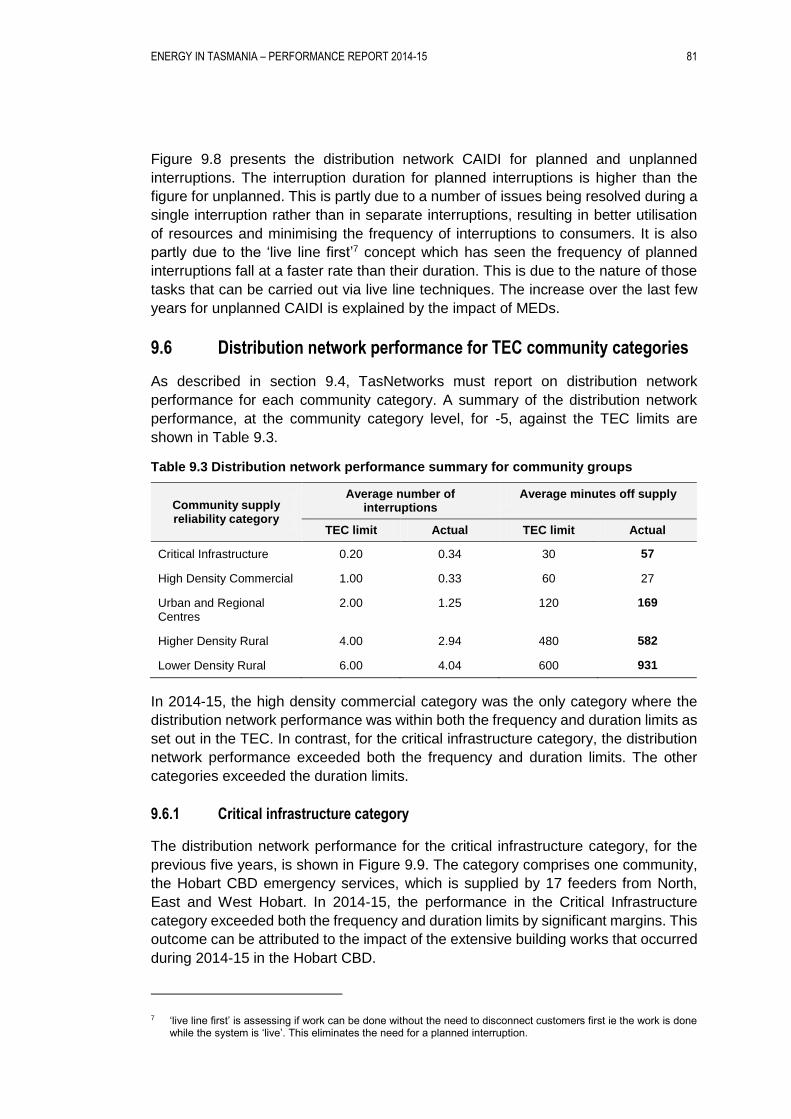
ENERGY IN TASMANIA – PERFORMANCE REPORT 2014-15 81
Figure 9.8 presents the distribution network CAIDI for planned and unplanned
interruptions. The interruption duration for planned interruptions is higher than the
figure for unplanned. This is partly due to a number of issues being resolved during a
single interruption rather than in separate interruptions, resulting in better utilisation
of resources and minimising the frequency of interruptions to consumers. It is also
partly due to the ‘live line first’7 concept which has seen the frequency of planned
interruptions fall at a faster rate than their duration. This is due to the nature of those
tasks that can be carried out via live line techniques. The increase over the last few
years for unplanned CAIDI is explained by the impact of MEDs.
9.6 Distribution network performance for TEC community categories
As described in section 9.4, TasNetworks must report on distribution network
performance for each community category. A summary of the distribution network
performance, at the community category level, for -5, against the TEC limits are
shown in Table 9.3.
Table 9.3 Distribution network performance summary for community groups
Community supply reliability category
Average number of interruptions
Average minutes off supply
TEC limit Actual TEC limit Actual
Critical Infrastructure 0.20 0.34 30 57
High Density Commercial 1.00 0.33 60 27
Urban and Regional Centres
2.00 1.25 120 169
Higher Density Rural 4.00 2.94 480 582
Lower Density Rural 6.00 4.04 600 931
In 2014-15, the high density commercial category was the only category where the
distribution network performance was within both the frequency and duration limits as
set out in the TEC. In contrast, for the critical infrastructure category, the distribution
network performance exceeded both the frequency and duration limits. The other
categories exceeded the duration limits.
9.6.1 Critical infrastructure category
The distribution network performance for the critical infrastructure category, for the
previous five years, is shown in Figure 9.9. The category comprises one community,
the Hobart CBD emergency services, which is supplied by 17 feeders from North,
East and West Hobart. In 2014-15, the performance in the Critical Infrastructure
category exceeded both the frequency and duration limits by significant margins. This
outcome can be attributed to the impact of the extensive building works that occurred
during 2014-15 in the Hobart CBD.
7 ‘live line first’ is assessing if work can be done without the need to disconnect customers first ie the work is done while the system is ‘live’. This eliminates the need for a planned interruption.
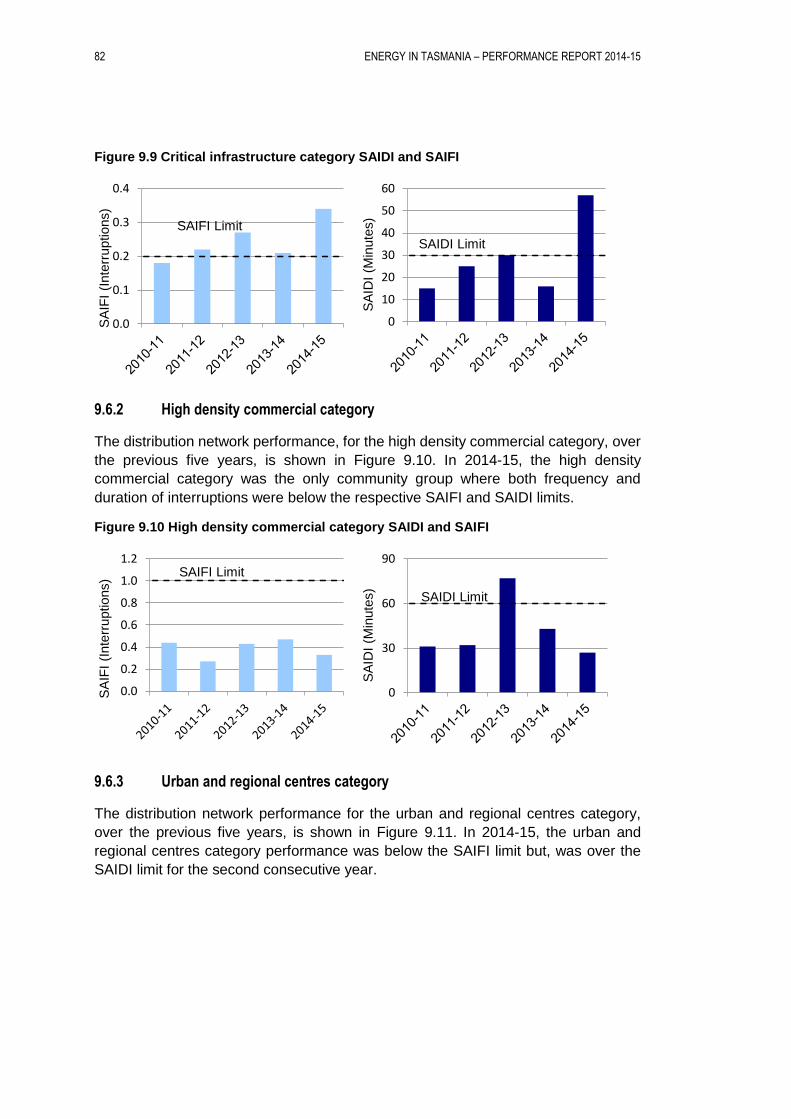
82 ENERGY IN TASMANIA – PERFORMANCE REPORT 2014-15
Figure 9.9 Critical infrastructure category SAIDI and SAIFI
9.6.2 High density commercial category
The distribution network performance, for the high density commercial category, over
the previous five years, is shown in Figure 9.10. In 2014-15, the high density
commercial category was the only community group where both frequency and
duration of interruptions were below the respective SAIFI and SAIDI limits.
Figure 9.10 High density commercial category SAIDI and SAIFI
9.6.3 Urban and regional centres category
The distribution network performance for the urban and regional centres category,
over the previous five years, is shown in Figure 9.11. In 2014-15, the urban and
regional centres category performance was below the SAIFI limit but, was over the
SAIDI limit for the second consecutive year.
0.0
0.1
0.2
0.3
0.4
SA
IFI
(Inte
rruptions)
SAIFI Limit
0
10
20
30
40
50
60
SA
IDI
(Min
ute
s)
SAIDI Limit
0.0
0.2
0.4
0.6
0.8
1.0
1.2
SA
IFI
(Inte
rruptions)
SAIFI Limit
0
30
60
90
SA
IDI
(Min
ute
s)
SAIDI Limit
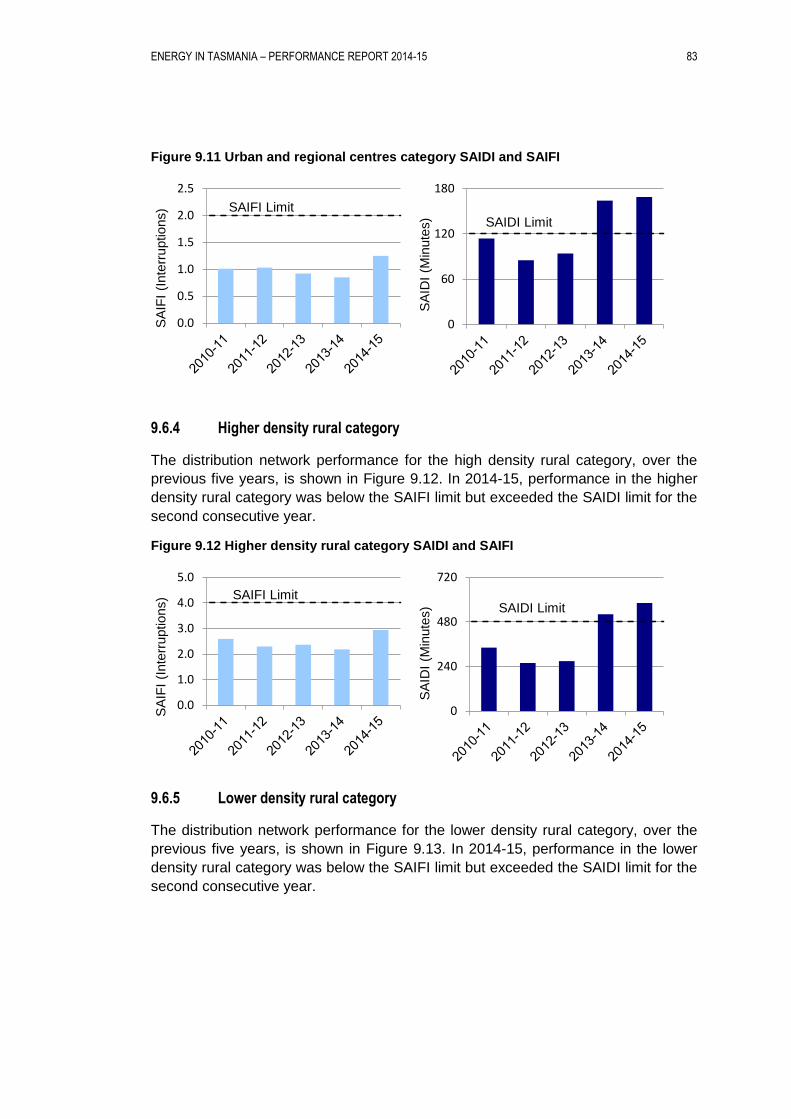
ENERGY IN TASMANIA – PERFORMANCE REPORT 2014-15 83
Figure 9.11 Urban and regional centres category SAIDI and SAIFI
9.6.4 Higher density rural category
The distribution network performance for the high density rural category, over the
previous five years, is shown in Figure 9.12. In 2014-15, performance in the higher
density rural category was below the SAIFI limit but exceeded the SAIDI limit for the
second consecutive year.
Figure 9.12 Higher density rural category SAIDI and SAIFI
9.6.5 Lower density rural category
The distribution network performance for the lower density rural category, over the
previous five years, is shown in Figure 9.13. In 2014-15, performance in the lower
density rural category was below the SAIFI limit but exceeded the SAIDI limit for the
second consecutive year.
0.0
0.5
1.0
1.5
2.0
2.5
SA
IFI
(Inte
rruptions) SAIFI Limit
0
60
120
180
SA
IDI
(Min
ute
s) SAIDI Limit
0.0
1.0
2.0
3.0
4.0
5.0
SA
IFI
(Inte
rruptions) SAIFI Limit
0
240
480
720
SA
IDI
(Min
ute
s) SAIDI Limit
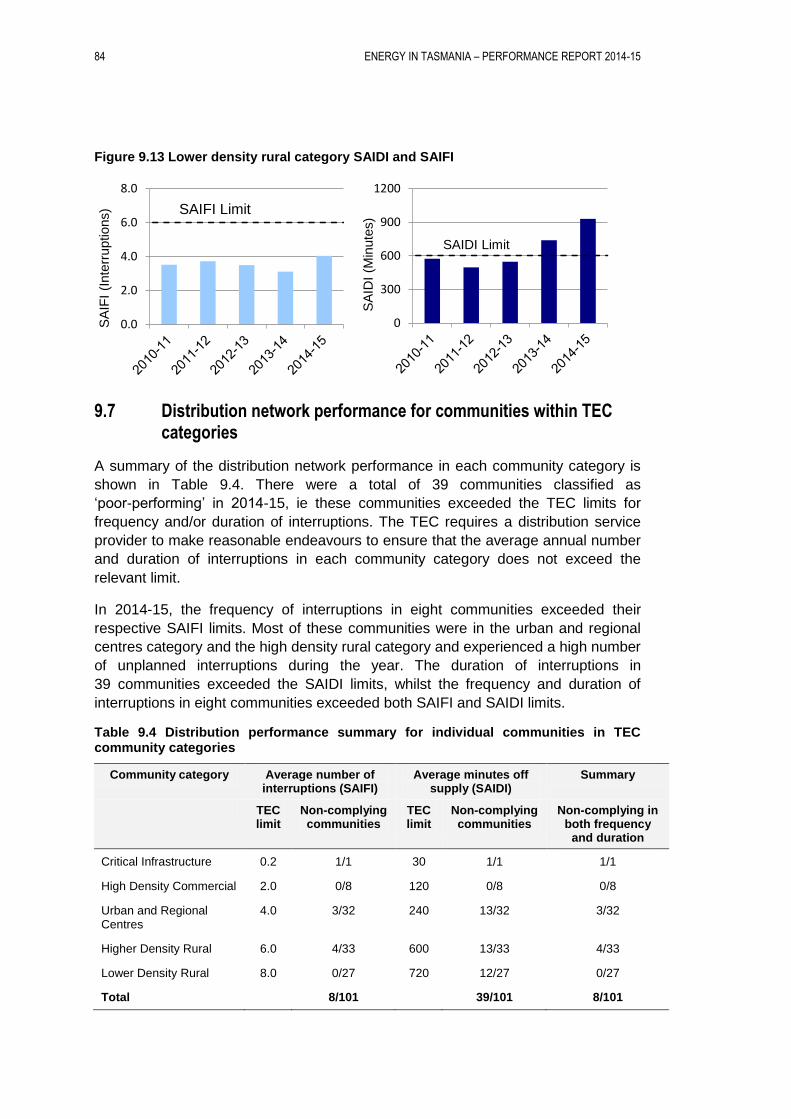
84 ENERGY IN TASMANIA – PERFORMANCE REPORT 2014-15
Figure 9.13 Lower density rural category SAIDI and SAIFI
9.7 Distribution network performance for communities within TEC categories
A summary of the distribution network performance in each community category is
shown in Table 9.4. There were a total of 39 communities classified as
‘poor-performing’ in 2014-15, ie these communities exceeded the TEC limits for
frequency and/or duration of interruptions. The TEC requires a distribution service
provider to make reasonable endeavours to ensure that the average annual number
and duration of interruptions in each community category does not exceed the
relevant limit.
In 2014-15, the frequency of interruptions in eight communities exceeded their
respective SAIFI limits. Most of these communities were in the urban and regional
centres category and the high density rural category and experienced a high number
of unplanned interruptions during the year. The duration of interruptions in
39 communities exceeded the SAIDI limits, whilst the frequency and duration of
interruptions in eight communities exceeded both SAIFI and SAIDI limits.
Table 9.4 Distribution performance summary for individual communities in TEC community categories
Community category Average number of interruptions (SAIFI)
Average minutes off supply (SAIDI)
Summary
TEC limit
Non-complying communities
TEC limit
Non-complying communities
Non-complying in both frequency
and duration
Critical Infrastructure 0.2 1/1 30 1/1 1/1
High Density Commercial 2.0 0/8 120 0/8 0/8
Urban and Regional Centres
4.0 3/32 240 13/32 3/32
Higher Density Rural 6.0 4/33 600 13/33 4/33
Lower Density Rural 8.0 0/27 720 12/27 0/27
Total 8/101 39/101 8/101
0.0
2.0
4.0
6.0
8.0
SA
IFI
(Inte
rruptions) SAIFI Limit
0
300
600
900
1200
SA
IDI
(Min
ute
s)
SAIDI Limit
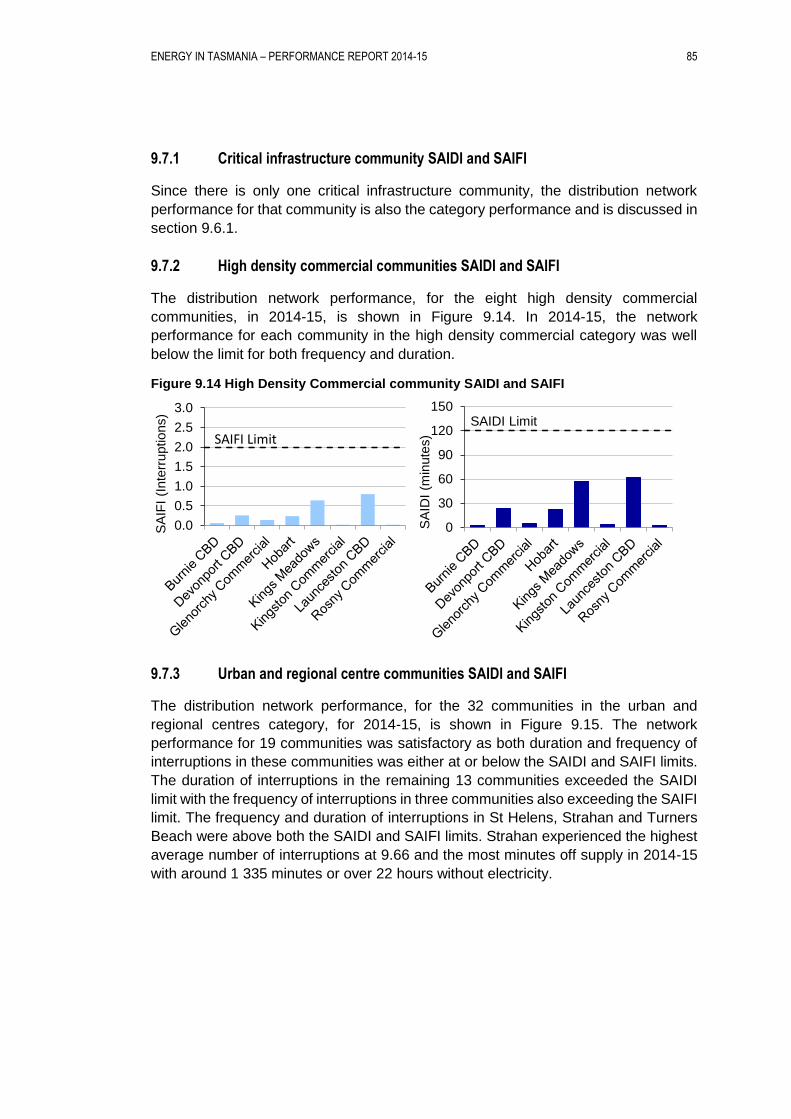
ENERGY IN TASMANIA – PERFORMANCE REPORT 2014-15 85
9.7.1 Critical infrastructure community SAIDI and SAIFI
Since there is only one critical infrastructure community, the distribution network
performance for that community is also the category performance and is discussed in
section 9.6.1.
9.7.2 High density commercial communities SAIDI and SAIFI
The distribution network performance, for the eight high density commercial
communities, in 2014-15, is shown in Figure 9.14. In 2014-15, the network
performance for each community in the high density commercial category was well
below the limit for both frequency and duration.
Figure 9.14 High Density Commercial community SAIDI and SAIFI
9.7.3 Urban and regional centre communities SAIDI and SAIFI
The distribution network performance, for the 32 communities in the urban and
regional centres category, for 2014-15, is shown in Figure 9.15. The network
performance for 19 communities was satisfactory as both duration and frequency of
interruptions in these communities was either at or below the SAIDI and SAIFI limits.
The duration of interruptions in the remaining 13 communities exceeded the SAIDI
limit with the frequency of interruptions in three communities also exceeding the SAIFI
limit. The frequency and duration of interruptions in St Helens, Strahan and Turners
Beach were above both the SAIDI and SAIFI limits. Strahan experienced the highest
average number of interruptions at 9.66 and the most minutes off supply in 2014-15
with around 1 335 minutes or over 22 hours without electricity.
0.0
0.5
1.0
1.5
2.0
2.5
3.0
SA
IFI
(Inte
rruptions)
SAIFI Limit
0
30
60
90
120
150
SA
IDI
(min
ute
s)
SAIDI Limit
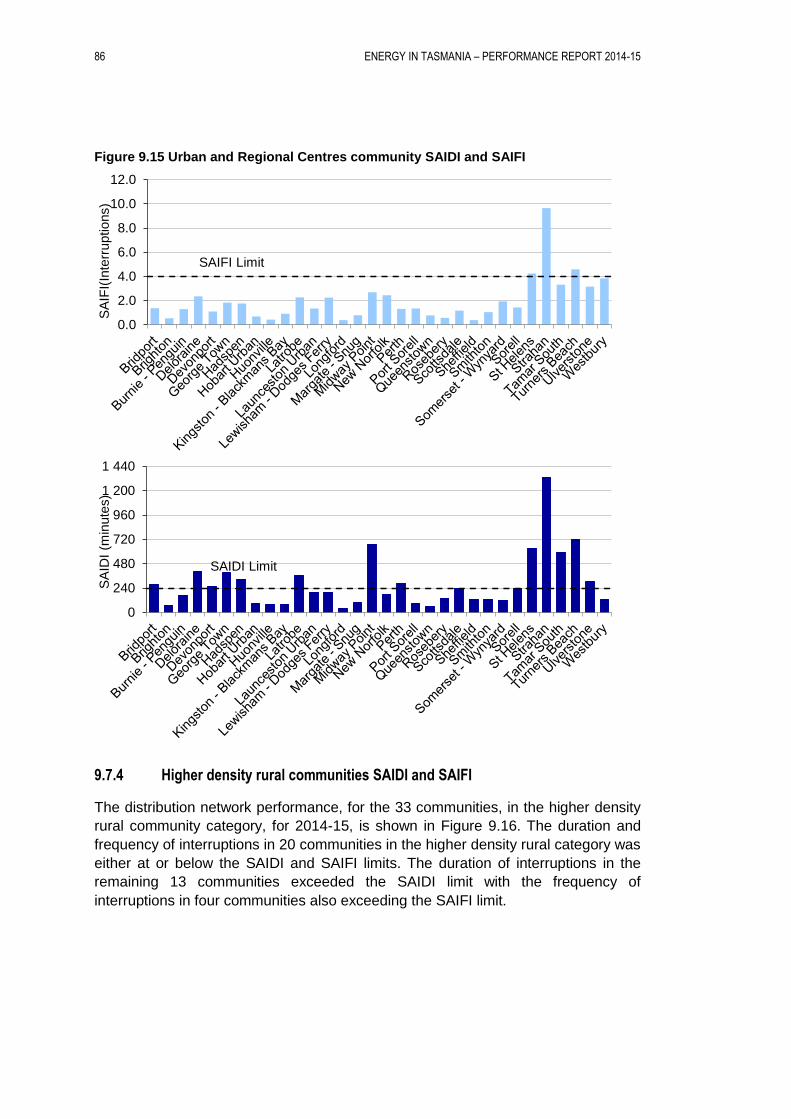
86 ENERGY IN TASMANIA – PERFORMANCE REPORT 2014-15
Figure 9.15 Urban and Regional Centres community SAIDI and SAIFI
9.7.4 Higher density rural communities SAIDI and SAIFI
The distribution network performance, for the 33 communities, in the higher density
rural community category, for 2014-15, is shown in Figure 9.16. The duration and
frequency of interruptions in 20 communities in the higher density rural category was
either at or below the SAIDI and SAIFI limits. The duration of interruptions in the
remaining 13 communities exceeded the SAIDI limit with the frequency of
interruptions in four communities also exceeding the SAIFI limit.
0.0
2.0
4.0
6.0
8.0
10.0
12.0
SA
IFI(
Inte
rruptions)
SAIFI Limit
0
240
480
720
960
1 200
1 440
SA
IDI
(min
ute
s)
SAIDI Limit
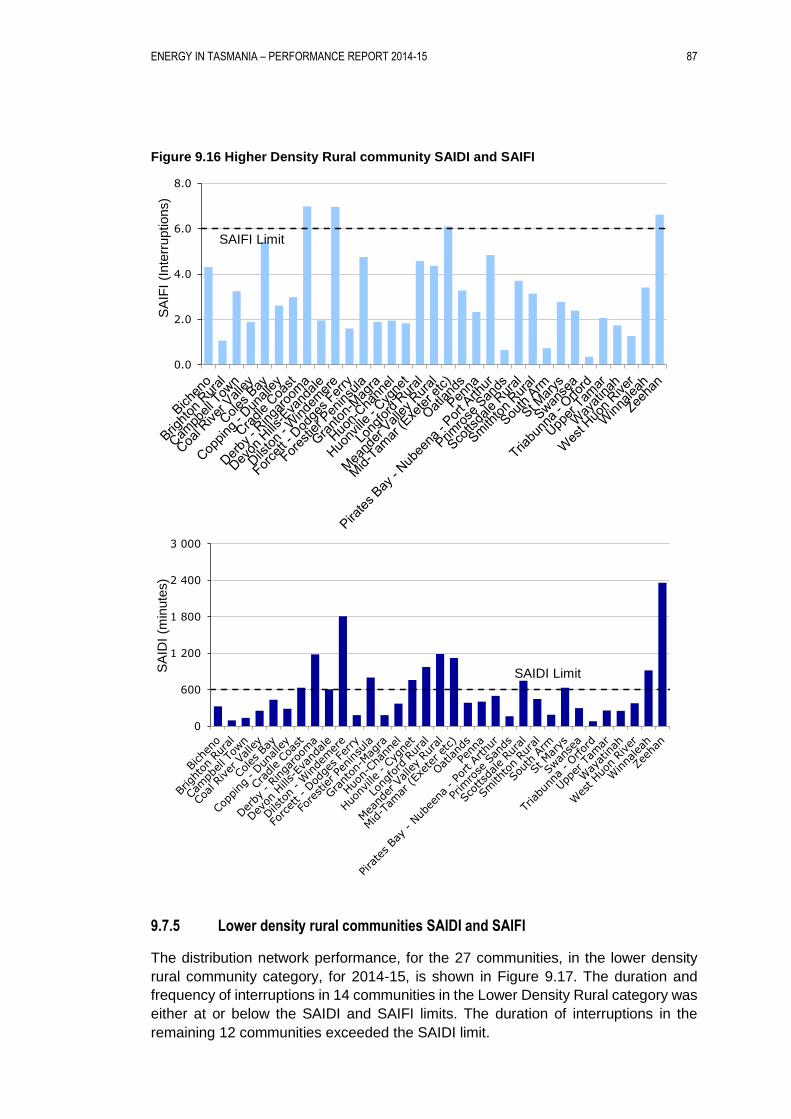
ENERGY IN TASMANIA – PERFORMANCE REPORT 2014-15 87
Figure 9.16 Higher Density Rural community SAIDI and SAIFI
9.7.5 Lower density rural communities SAIDI and SAIFI
The distribution network performance, for the 27 communities, in the lower density
rural community category, for 2014-15, is shown in Figure 9.17. The duration and
frequency of interruptions in 14 communities in the Lower Density Rural category was
either at or below the SAIDI and SAIFI limits. The duration of interruptions in the
remaining 12 communities exceeded the SAIDI limit.
0.0
2.0
4.0
6.0
8.0
SA
IFI
(Inte
rruptions)
SAIFI Limit
0
600
1 200
1 800
2 400
3 000
SA
IDI
(min
ute
s)
SAIDI Limit
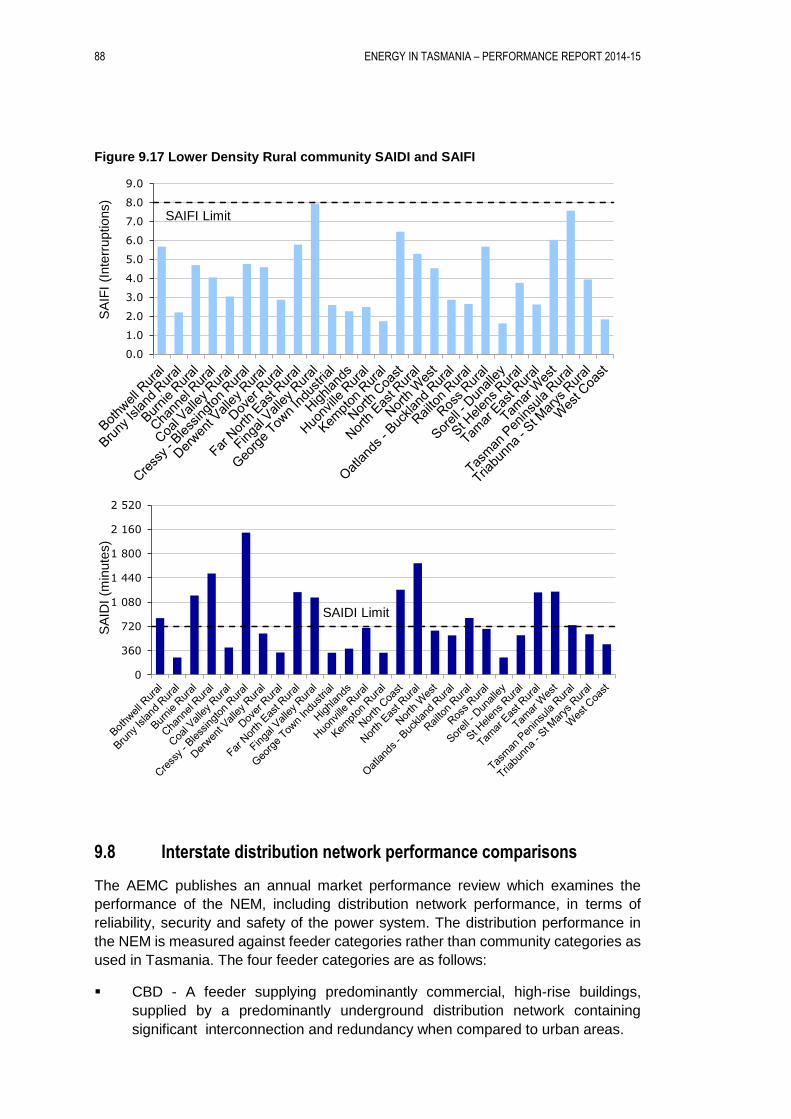
88 ENERGY IN TASMANIA – PERFORMANCE REPORT 2014-15
Figure 9.17 Lower Density Rural community SAIDI and SAIFI
9.8 Interstate distribution network performance comparisons
The AEMC publishes an annual market performance review which examines the
performance of the NEM, including distribution network performance, in terms of
reliability, security and safety of the power system. The distribution performance in
the NEM is measured against feeder categories rather than community categories as
used in Tasmania. The four feeder categories are as follows:
CBD - A feeder supplying predominantly commercial, high-rise buildings,
supplied by a predominantly underground distribution network containing
significant interconnection and redundancy when compared to urban areas.
0.0
1.0
2.0
3.0
4.0
5.0
6.0
7.0
8.0
9.0
SA
IFI
(Inte
rruptions)
SAIFI Limit
0
360
720
1 080
1 440
1 800
2 160
2 520
SA
IDI
(min
ute
s)
SAIDI Limit
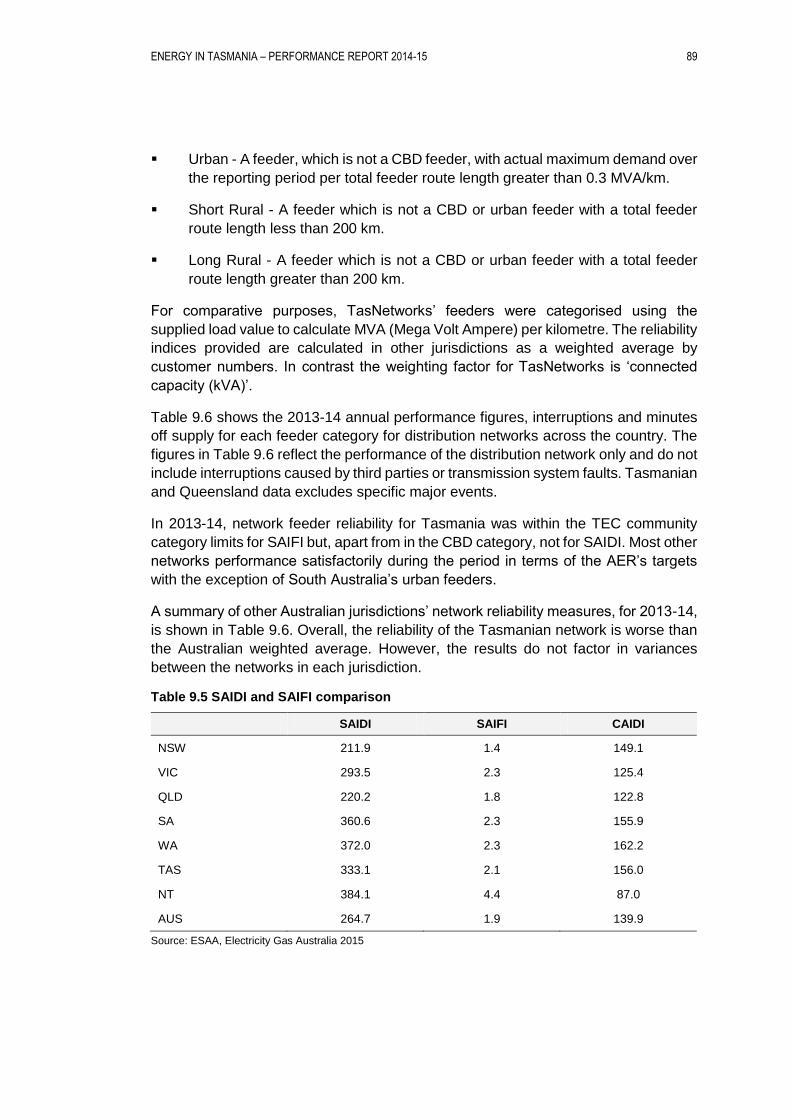
ENERGY IN TASMANIA – PERFORMANCE REPORT 2014-15 89
Urban - A feeder, which is not a CBD feeder, with actual maximum demand over
the reporting period per total feeder route length greater than 0.3 MVA/km.
Short Rural - A feeder which is not a CBD or urban feeder with a total feeder
route length less than 200 km.
Long Rural - A feeder which is not a CBD or urban feeder with a total feeder
route length greater than 200 km.
For comparative purposes, TasNetworks’ feeders were categorised using the
supplied load value to calculate MVA (Mega Volt Ampere) per kilometre. The reliability
indices provided are calculated in other jurisdictions as a weighted average by
customer numbers. In contrast the weighting factor for TasNetworks is ‘connected
capacity (kVA)’.
Table 9.6 shows the 2013-14 annual performance figures, interruptions and minutes
off supply for each feeder category for distribution networks across the country. The
figures in Table 9.6 reflect the performance of the distribution network only and do not
include interruptions caused by third parties or transmission system faults. Tasmanian
and Queensland data excludes specific major events.
In 2013-14, network feeder reliability for Tasmania was within the TEC community
category limits for SAIFI but, apart from in the CBD category, not for SAIDI. Most other
networks performance satisfactorily during the period in terms of the AER’s targets
with the exception of South Australia’s urban feeders.
A summary of other Australian jurisdictions’ network reliability measures, for 2013-14,
is shown in Table 9.6. Overall, the reliability of the Tasmanian network is worse than
the Australian weighted average. However, the results do not factor in variances
between the networks in each jurisdiction.
Table 9.5 SAIDI and SAIFI comparison
SAIDI SAIFI CAIDI
NSW 211.9 1.4 149.1
VIC 293.5 2.3 125.4
QLD 220.2 1.8 122.8
SA 360.6 2.3 155.9
WA 372.0 2.3 162.2
TAS 333.1 2.1 156.0
NT 384.1 4.4 87.0
AUS 264.7 1.9 139.9
Source: ESAA, Electricity Gas Australia 2015
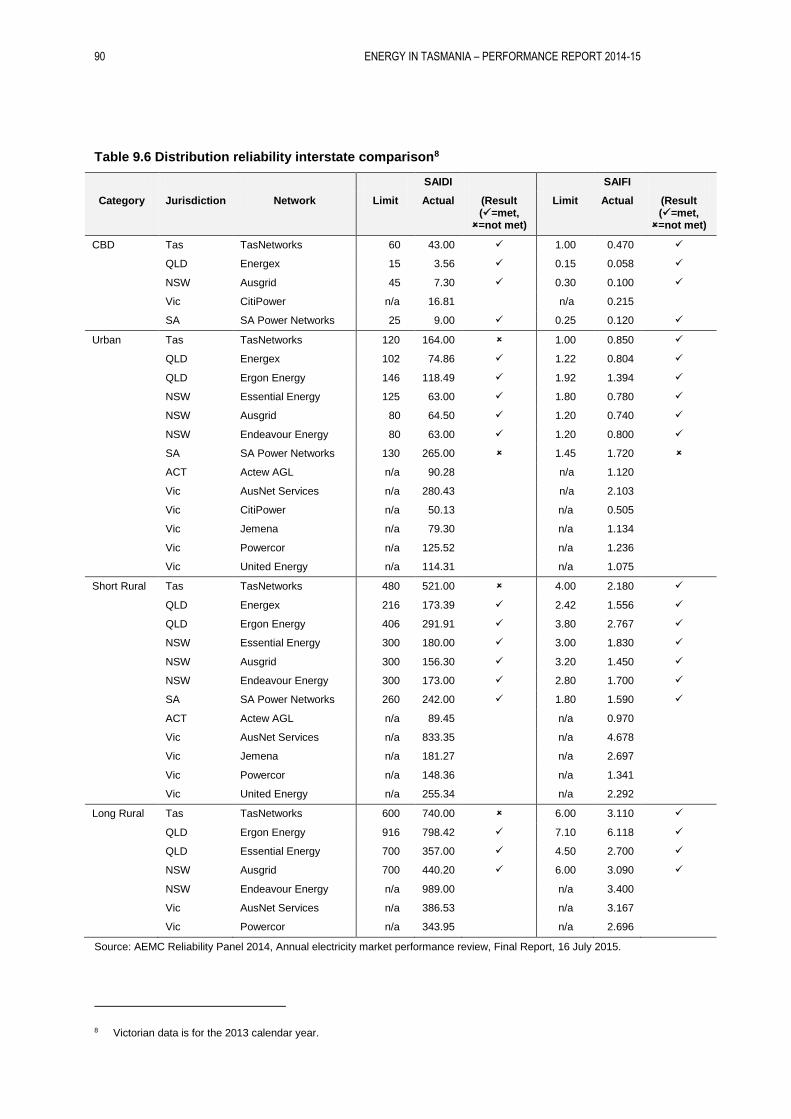
90 ENERGY IN TASMANIA – PERFORMANCE REPORT 2014-15
Table 9.6 Distribution reliability interstate comparison8
SAIDI SAIFI
Category Jurisdiction Network Limit Actual (Result (=met,
=not met)
Limit Actual (Result (=met,
=not met)
CBD Tas TasNetworks 60 43.00 1.00 0.470
QLD Energex 15 3.56 0.15 0.058
NSW Ausgrid 45 7.30 0.30 0.100
Vic CitiPower n/a 16.81 n/a 0.215
SA SA Power Networks 25 9.00 0.25 0.120
Urban Tas TasNetworks 120 164.00 1.00 0.850
QLD Energex 102 74.86 1.22 0.804
QLD Ergon Energy 146 118.49 1.92 1.394
NSW Essential Energy 125 63.00 1.80 0.780
NSW Ausgrid 80 64.50 1.20 0.740
NSW Endeavour Energy 80 63.00 1.20 0.800
SA SA Power Networks 130 265.00 1.45 1.720
ACT Actew AGL n/a 90.28 n/a 1.120
Vic AusNet Services n/a 280.43 n/a 2.103
Vic CitiPower n/a 50.13 n/a 0.505
Vic Jemena n/a 79.30 n/a 1.134
Vic Powercor n/a 125.52 n/a 1.236
Vic United Energy n/a 114.31 n/a 1.075
Short Rural Tas TasNetworks 480 521.00 4.00 2.180
QLD Energex 216 173.39 2.42 1.556
QLD Ergon Energy 406 291.91 3.80 2.767
NSW Essential Energy 300 180.00 3.00 1.830
NSW Ausgrid 300 156.30 3.20 1.450
NSW Endeavour Energy 300 173.00 2.80 1.700
SA SA Power Networks 260 242.00 1.80 1.590
ACT Actew AGL n/a 89.45 n/a 0.970
Vic AusNet Services n/a 833.35 n/a 4.678
Vic Jemena n/a 181.27 n/a 2.697
Vic Powercor n/a 148.36 n/a 1.341
Vic United Energy n/a 255.34 n/a 2.292
Long Rural Tas TasNetworks 600 740.00 6.00 3.110
QLD Ergon Energy 916 798.42 7.10 6.118
QLD Essential Energy 700 357.00 4.50 2.700
NSW Ausgrid 700 440.20 6.00 3.090
NSW Endeavour Energy n/a 989.00 n/a 3.400
Vic AusNet Services n/a 386.53 n/a 3.167
Vic Powercor n/a 343.95 n/a 2.696
Source: AEMC Reliability Panel 2014, Annual electricity market performance review, Final Report, 16 July 2015.
8 Victorian data is for the 2013 calendar year.
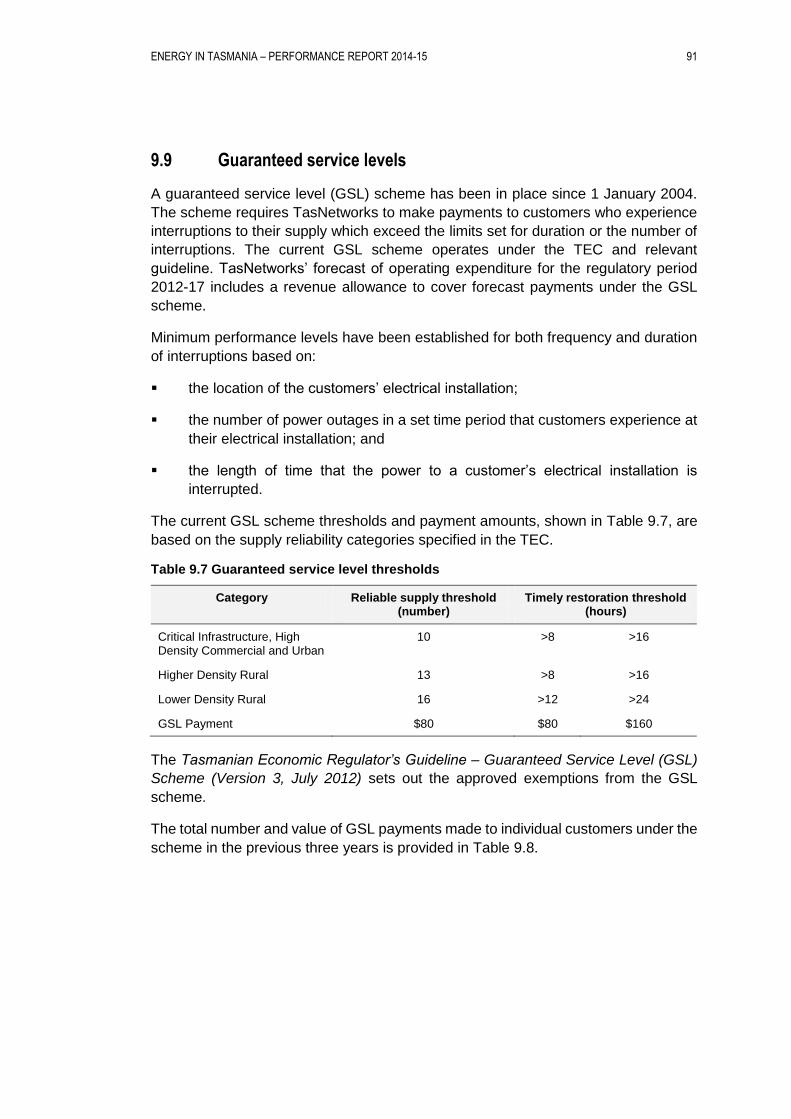
ENERGY IN TASMANIA – PERFORMANCE REPORT 2014-15 91
9.9 Guaranteed service levels
A guaranteed service level (GSL) scheme has been in place since 1 January 2004.
The scheme requires TasNetworks to make payments to customers who experience
interruptions to their supply which exceed the limits set for duration or the number of
interruptions. The current GSL scheme operates under the TEC and relevant
guideline. TasNetworks’ forecast of operating expenditure for the regulatory period
2012-17 includes a revenue allowance to cover forecast payments under the GSL
scheme.
Minimum performance levels have been established for both frequency and duration
of interruptions based on:
the location of the customers’ electrical installation;
the number of power outages in a set time period that customers experience at
their electrical installation; and
the length of time that the power to a customer’s electrical installation is
interrupted.
The current GSL scheme thresholds and payment amounts, shown in Table 9.7, are
based on the supply reliability categories specified in the TEC.
Table 9.7 Guaranteed service level thresholds
Category Reliable supply threshold (number)
Timely restoration threshold (hours)
Critical Infrastructure, High Density Commercial and Urban
10 >8 >16
Higher Density Rural 13 >8 >16
Lower Density Rural 16 >12 >24
GSL Payment $80 $80 $160
The Tasmanian Economic Regulator’s Guideline – Guaranteed Service Level (GSL)
Scheme (Version 3, July 2012) sets out the approved exemptions from the GSL
scheme.
The total number and value of GSL payments made to individual customers under the
scheme in the previous three years is provided in Table 9.8.
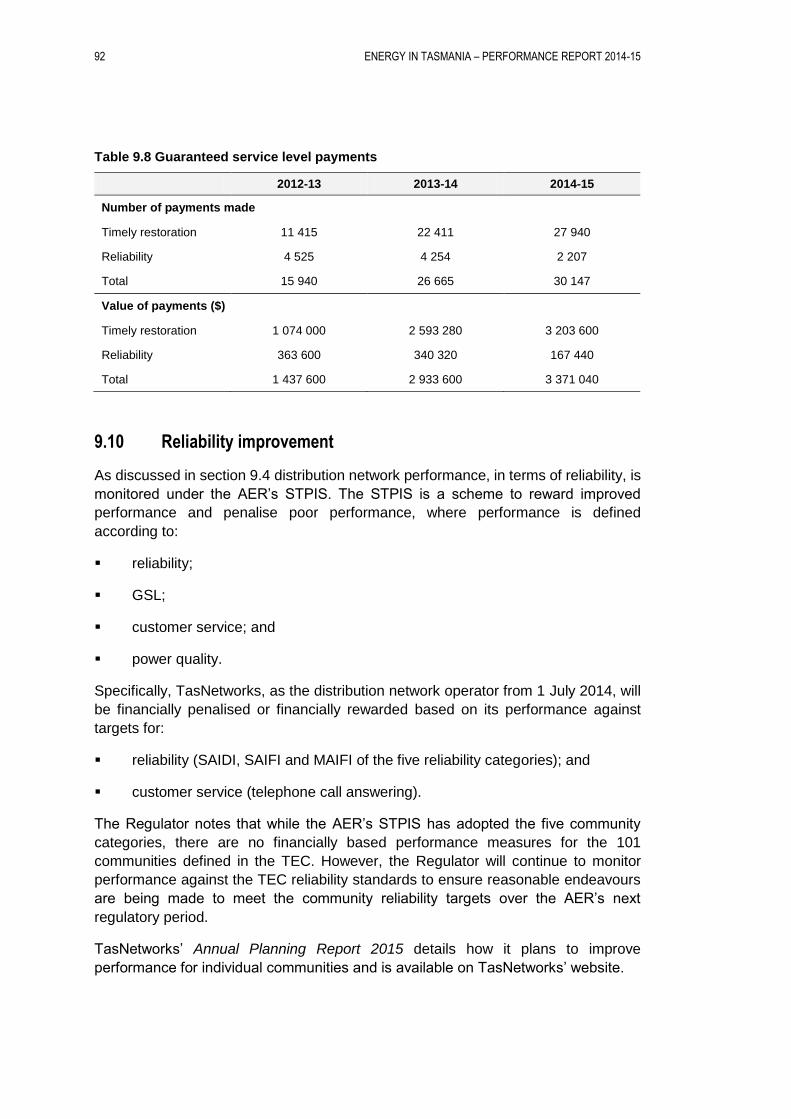
92 ENERGY IN TASMANIA – PERFORMANCE REPORT 2014-15
Table 9.8 Guaranteed service level payments
2012-13 2013-14 2014-15
Number of payments made
Timely restoration 11 415 22 411 27 940
Reliability 4 525 4 254 2 207
Total 15 940 26 665 30 147
Value of payments ($)
Timely restoration 1 074 000 2 593 280 3 203 600
Reliability 363 600 340 320 167 440
Total 1 437 600 2 933 600 3 371 040
9.10 Reliability improvement
As discussed in section 9.4 distribution network performance, in terms of reliability, is
monitored under the AER’s STPIS. The STPIS is a scheme to reward improved
performance and penalise poor performance, where performance is defined
according to:
reliability;
GSL;
customer service; and
power quality.
Specifically, TasNetworks, as the distribution network operator from 1 July 2014, will
be financially penalised or financially rewarded based on its performance against
targets for:
reliability (SAIDI, SAIFI and MAIFI of the five reliability categories); and
customer service (telephone call answering).
The Regulator notes that while the AER’s STPIS has adopted the five community
categories, there are no financially based performance measures for the 101
communities defined in the TEC. However, the Regulator will continue to monitor
performance against the TEC reliability standards to ensure reasonable endeavours
are being made to meet the community reliability targets over the AER’s next
regulatory period.
TasNetworks’ Annual Planning Report 2015 details how it plans to improve
performance for individual communities and is available on TasNetworks’ website.
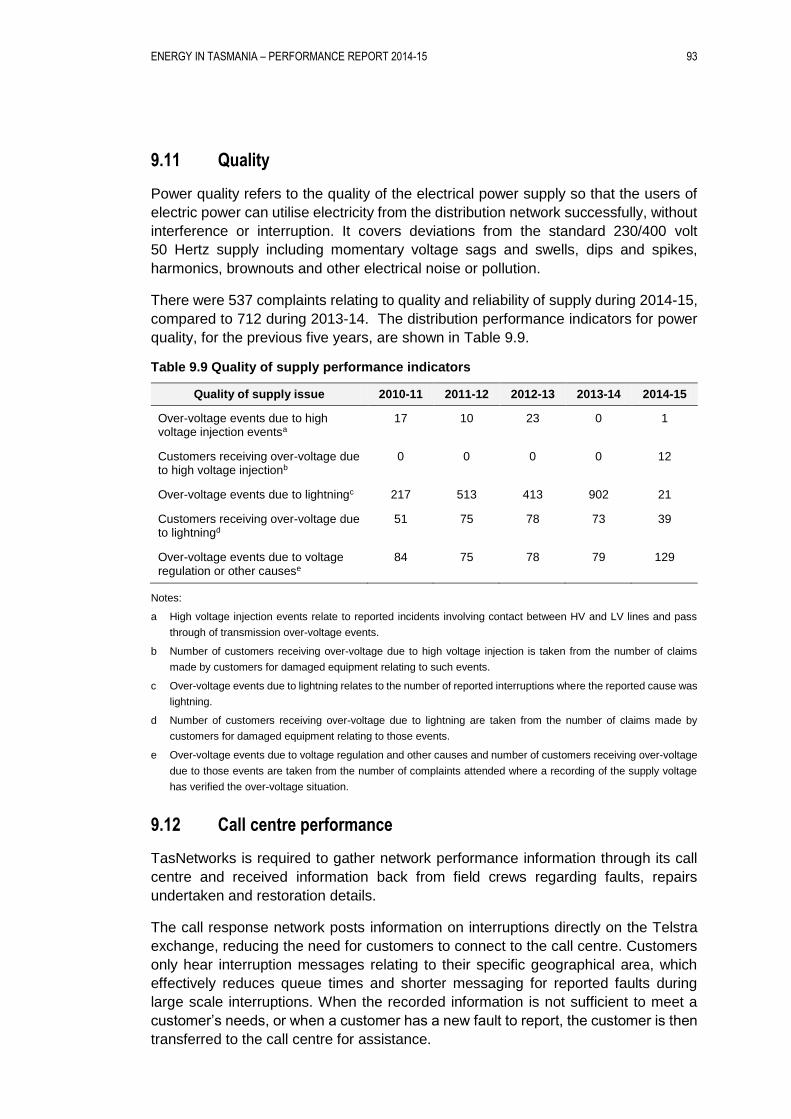
ENERGY IN TASMANIA – PERFORMANCE REPORT 2014-15 93
9.11 Quality
Power quality refers to the quality of the electrical power supply so that the users of
electric power can utilise electricity from the distribution network successfully, without
interference or interruption. It covers deviations from the standard 230/400 volt
50 Hertz supply including momentary voltage sags and swells, dips and spikes,
harmonics, brownouts and other electrical noise or pollution.
There were 537 complaints relating to quality and reliability of supply during 2014-15,
compared to 712 during 2013-14. The distribution performance indicators for power
quality, for the previous five years, are shown in Table 9.9.
Table 9.9 Quality of supply performance indicators
Quality of supply issue 2010-11 2011-12 2012-13 2013-14 2014-15
Over-voltage events due to high voltage injection eventsa
17 10 23 0 1
Customers receiving over-voltage due to high voltage injectionb
0 0 0 0 12
Over-voltage events due to lightningc 217 513 413 902 21
Customers receiving over-voltage due to lightningd
51 75 78 73 39
Over-voltage events due to voltage regulation or other causese
84 75 78 79 129
Notes:
a High voltage injection events relate to reported incidents involving contact between HV and LV lines and pass
through of transmission over-voltage events.
b Number of customers receiving over-voltage due to high voltage injection is taken from the number of claims
made by customers for damaged equipment relating to such events.
c Over-voltage events due to lightning relates to the number of reported interruptions where the reported cause was
lightning.
d Number of customers receiving over-voltage due to lightning are taken from the number of claims made by
customers for damaged equipment relating to those events.
e Over-voltage events due to voltage regulation and other causes and number of customers receiving over-voltage
due to those events are taken from the number of complaints attended where a recording of the supply voltage
has verified the over-voltage situation.
9.12 Call centre performance
TasNetworks is required to gather network performance information through its call
centre and received information back from field crews regarding faults, repairs
undertaken and restoration details.
The call response network posts information on interruptions directly on the Telstra
exchange, reducing the need for customers to connect to the call centre. Customers
only hear interruption messages relating to their specific geographical area, which
effectively reduces queue times and shorter messaging for reported faults during
large scale interruptions. When the recorded information is not sufficient to meet a
customer’s needs, or when a customer has a new fault to report, the customer is then
transferred to the call centre for assistance.
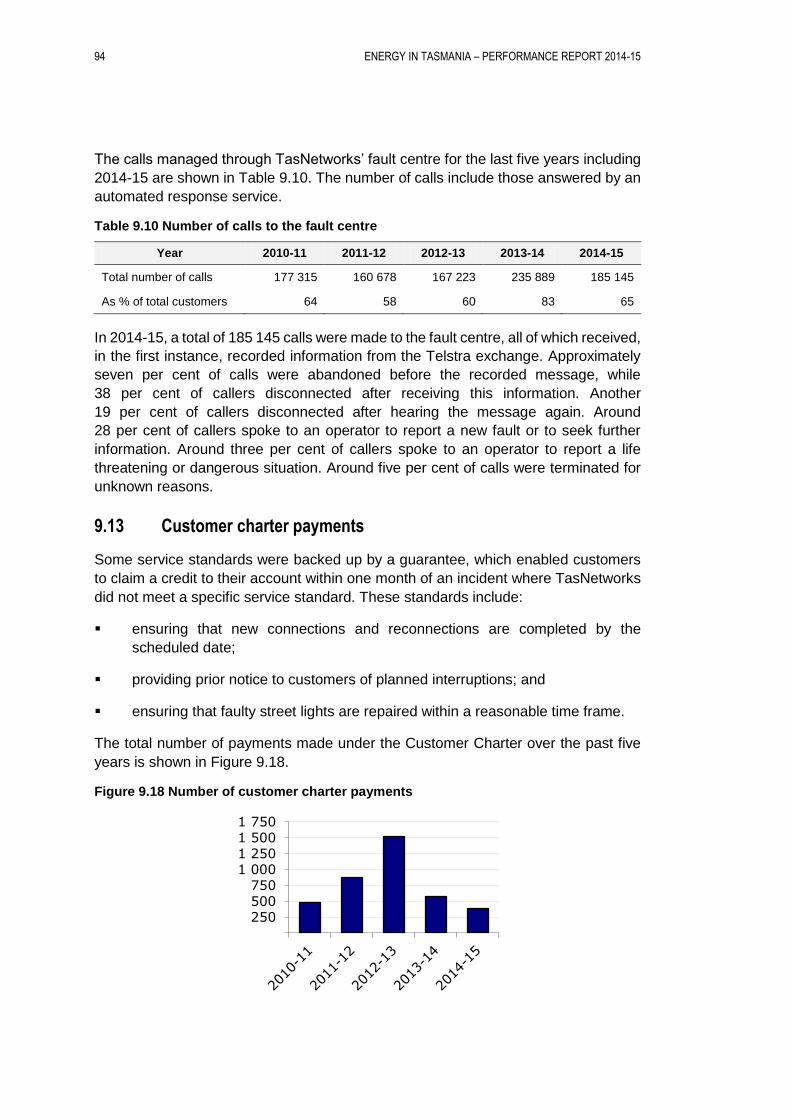
94 ENERGY IN TASMANIA – PERFORMANCE REPORT 2014-15
The calls managed through TasNetworks’ fault centre for the last five years including
2014-15 are shown in Table 9.10. The number of calls include those answered by an
automated response service.
Table 9.10 Number of calls to the fault centre
Year 2010-11 2011-12 2012-13 2013-14 2014-15
Total number of calls 177 315 160 678 167 223 235 889 185 145
As % of total customers 64 58 60 83 65
In 2014-15, a total of 185 145 calls were made to the fault centre, all of which received,
in the first instance, recorded information from the Telstra exchange. Approximately
seven per cent of calls were abandoned before the recorded message, while
38 per cent of callers disconnected after receiving this information. Another
19 per cent of callers disconnected after hearing the message again. Around
28 per cent of callers spoke to an operator to report a new fault or to seek further
information. Around three per cent of callers spoke to an operator to report a life
threatening or dangerous situation. Around five per cent of calls were terminated for
unknown reasons.
9.13 Customer charter payments
Some service standards were backed up by a guarantee, which enabled customers
to claim a credit to their account within one month of an incident where TasNetworks
did not meet a specific service standard. These standards include:
ensuring that new connections and reconnections are completed by the
scheduled date;
providing prior notice to customers of planned interruptions; and
ensuring that faulty street lights are repaired within a reasonable time frame.
The total number of payments made under the Customer Charter over the past five
years is shown in Figure 9.18.
Figure 9.18 Number of customer charter payments
250 500 750
1 0001 2501 5001 750
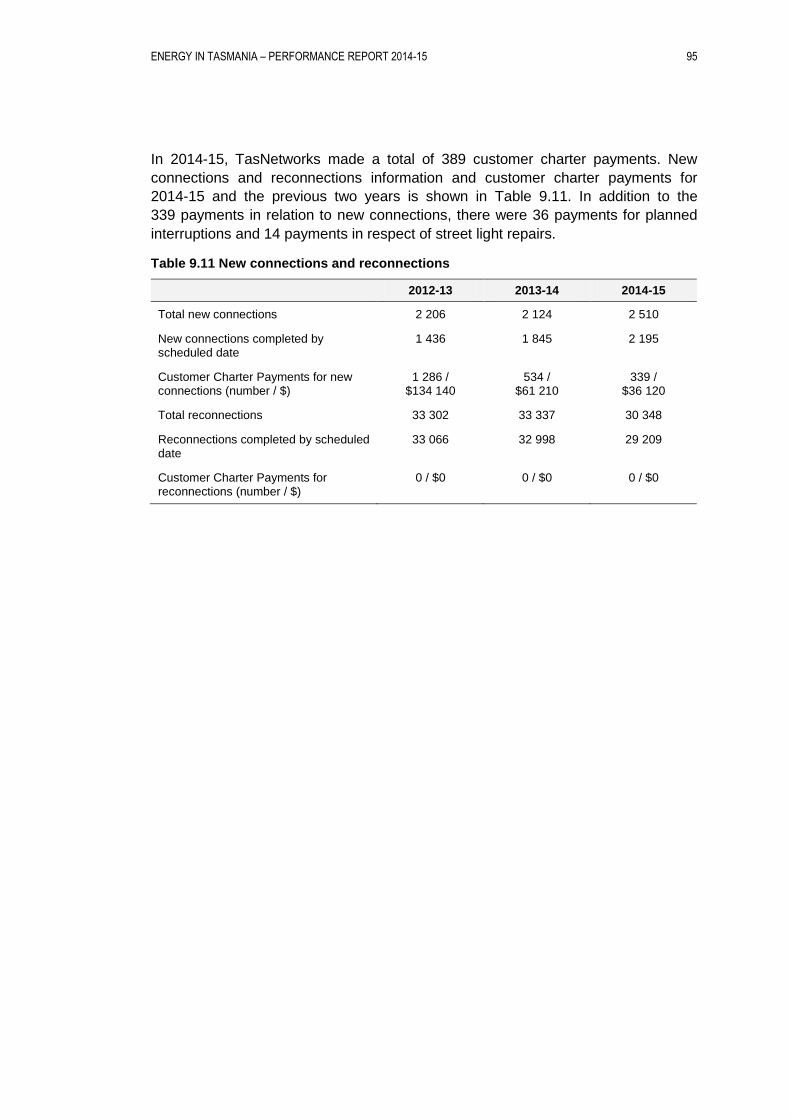
ENERGY IN TASMANIA – PERFORMANCE REPORT 2014-15 95
In 2014-15, TasNetworks made a total of 389 customer charter payments. New
connections and reconnections information and customer charter payments for
2014-15 and the previous two years is shown in Table 9.11. In addition to the
339 payments in relation to new connections, there were 36 payments for planned
interruptions and 14 payments in respect of street light repairs.
Table 9.11 New connections and reconnections
2012-13 2013-14 2014-15
Total new connections 2 206 2 124 2 510
New connections completed by scheduled date
1 436 1 845 2 195
Customer Charter Payments for new connections (number / $)
1 286 / $134 140
534 / $61 210
339 / $36 120
Total reconnections 33 302 33 337 30 348
Reconnections completed by scheduled date
33 066 32 998 29 209
Customer Charter Payments for reconnections (number / $)
0 / $0 0 / $0 0 / $0

ENERGY IN TASMANIA – PERFORMANCE REPORT 2014-15 97
10 TASMANIAN ELECTRICIT Y MARKET
This chapter discusses the electricity market in Tasmania. The chapter firstly covers
the dynamics and operation of the wholesale electricity market and includes a
discussion of the associated electricity derivatives market and frequency control
ancillary services market.
The chapter includes wholesale market data for the period from 1 July 2014 to
30 June 2015 provided by NEM-ReviewTM software1 and available from
www.nemweb.com.au.
The chapter also describes the Tasmanian retail electricity market and includes
performance statistics in respect of small customers for the period from 1 July 2014
to 30 June 2015.
10.1 Wholesale market
10.1.1 The National Electricity Market
The National Electricity Market (NEM)2 is a wholesale electricity spot market where
supply and demand is met simultaneously in real-time through a centrally-coordinated
dispatch process.
The NEM comprises five regional market jurisdictions (Queensland, New South
Wales, Victoria, South Australia and Tasmania3) connected by a number of
interconnectors into a single alternating current system and associated synchronous
electricity transmission grid.
All generation is aggregated and scheduled at five minute intervals during every hour
of every day. Generators enter bids for each of their generating units comprising the
amount of electricity the generator is willing to sell at each price for each generating
unit. The bids are stacked from lowest to highest price with respective quantities
offered aggregated. The price bid of the last generator to be dispatched to equalise
supply and demand sets the regional dispatch price and the average of the six
dispatch prices in each half hour (ie trading interval) sets the spot price4 which is paid
to all generators within that region for that trading interval irrespective of each
generating unit’s bid price.
1 NEM–Review provides data on Australia's National Electricity Market (NEM).
2 For more information on the NEM, please refer to http://www.aemo.com.au/About-the-Industry/Energy-Markets/National-Electricity-Market
3 Tasmania entered the NEM in May 2005.
4 The spot price is also referred to as the ‘pool price’ or ‘Regional Reference Price’ (RRP).
98 ENERGY IN TASMANIA – PERFORMANCE REPORT 2014-15
There are parallel markets in ancillary services such as Frequency Control Ancillary
Services (FCAS) and System Restart Ancillary Services (SRAS) and co-optimisation
of the energy and ancillary services markets determines which generators are
dispatched in each time interval to meet demand across all NEM regions at least cost.
As noted in section 6.4, the Australian Energy Market Operator (AEMO) is the national
electricity market and system operator. AEMO’s functions are prescribed in the
National Electricity Laws (NEL) whilst the National Electricity Rules (NER) prescribe
procedures and processes for market operations, power system security, network
connection and access pricing for network services in the NEM and national
transmission planning.
Also as noted in sections 6.2 and 6.3, the Australian Energy Market Commission
(AEMC) and the Australian Energy Regulator (AER) are responsible for overseeing
and regulating the NEM. The AEMC is responsible for rule-making in response to
requests for rule changes, usually from NEM participants. The AER is responsible for
enforcing and monitoring compliance with the NER, as well as for economic regulation
of electricity transmission.
Entities participating in the NEM are required to be registered5 with AEMO and are
categorised as:
Customers - (usually retailers) who submit bids to purchase electricity through
the central dispatch process. A customer’s load must be controllable according
to dispatch instructions issued by AEMO. Electricity retailers’ on-sell electricity
purchased from the NEM, and transported, from the generator via the
transmission and distribution network, to electricity consumers. Retailers
provide services to electricity customers such as arranging for supply, carrying
out billing and revenue collection, and bundling product options to suit
customers’ needs.
Generators - any person who owns controls or operates a generating system
connected to a transmission or distribution network must register as a generator
unless they meet the criteria for exemption from registration. Depending on how
they have classified their generating units, non-exempt generators will register
in one of the following categories:
- Market Scheduled Generator;
- Market Semi-scheduled Generator;
- Market Non-scheduled Generator;
- Non-Market Scheduled Generator;
- Non-Market Semi-scheduled Generator; or
5 The National Electricity Rules allow exemption from registration to be granted by either AEMO or the AER. For more information refer to: http://www.aemo.com.au/Electricity/Registration.
ENERGY IN TASMANIA – PERFORMANCE REPORT 2014-15 99
- Non-market Non-scheduled Generator.
Generators are categorised as follows:
- a market generating unit which sells its output through the spot market;
- a non-market generating unit which sells its entire output directly to a local
retailer or customer at the same connection point under a power purchase
agreement;
- a generating unit that is not scheduled by AEMO as part of central
dispatch;
- a generator scheduled by AEMO as part of central dispatch; and
- a semi-scheduled generating unit that has intermittent output and a
nameplate rating of 30 MW or greater (or is part of a group of
generating units connected at a common connection point with a
combined nameplate rating of 30 MW or greater), unless AEMO
approves its classification as a scheduled generating unit or a
non-scheduled generating unit.
Network Service Providers (NSP) - any person who owns, controls or operates
a transmission or distribution network must register as a NSP unless the AER
provides an exemption. A NSP may have a network service dispatched and
settled through the market by classifying the service as a market network
service and a scheduled network service and registering as a Market NSP.
Other participants - includes Traders and Reallocators, and Special Participants
(a System Operator or Distribution System Operator who carries out certain
functions under the NER must be registered with AEMO).
10.1.1.1 Participants in the Tasmanian Region of the NEM
As noted in section 4.2, the following entities participate in the Tasmanian region of
the NEM:
10.1.1.1.1 Customers
Three registered market customers (retailers) operate in the Tasmanian NEM region
- Progressive Green, Aurora Energy and ERM.
10.1.1.1.2 Generators
With the ownership of the Tamar Valley Power Station transferring from Aurora
Energy to Hydro Tasmania on 1 June 2013 Hydro Tasmania now has a controlling
interest in all NEM participating generating units in Tasmania.6
6 Hydro Tasmania does not fully control all wind farms. The Huxley Hill wind farm on King Island is owned and operated by Hydro Tasmania, however, the Musselroe, Studland Bay and Bluff Point Wind Farms are operated under a joint venture between Shenhua Clean Energy (SCE) and Hydro Tasmania (Woolnorth Wind Farm Holdings). SCE owns a 75 per cent share in the wind farms with Hydro Tasmania holding the other 25 per cent.
100 ENERGY IN TASMANIA – PERFORMANCE REPORT 2014-15
Hydro Tasmania is registered as:
a market scheduled generator (22 hydroelectric generating units7 and five
thermal (gas) generating units8);
a market non-scheduled generator (5 hydroelectric generating units and two
wind generating units)9; and
a market semi-scheduled generator (one wind generating unit).10
10.1.1.1.3 Other generators
Generators with installed capacity11 of less than 5 MW have a standing exemption
from AEMO registration. Generating systems with an installed capacity of greater than
5 MW but less than 30 MWs can apply for an exemption from registration. In Tasmania
there are a number of smaller generators with a combined installed capacity of around
30 MW which are excluded from the central dispatch process but whose output can
feed into the power system. These include:
landfill gas-fired turbines (eg Launceston Renewable Energy Facility (LMS
Energy Pty Ltd));
mini-hydro developments (eg Meander and Midlands mini-hydro schemes
operated by Tasmanian Irrigation Pty Ltd12); and
co-generation plants (eg Simplot’s Ulverstone Co-generation Facility13).
10.1.1.1.4 Network Service Provider
There were two registered NSPs in the Tasmanian NEM region during 2014-15.
TasNetworks (transmission and distribution) is a regulated NSP while Basslink Pty
Ltd (Basslink) is a Market NSP as its network service is dispatched and settled
through the market. Hydro Tasmania effectively controls Basslink flows through the
7 Bastyan Power Station, Catagunya / Liapootah / Wayatinah Power Station x 3, Cethana Power Station, Devils Gate Power Station, Fisher Power Station, Gordon Power Station, John Butters Power Station, Lake Echo Power Station, Lemonthyme / Wilmot Power Station x 2, Mackintosh Power Station, Meadowbank Power Station, Poatina Power Station, Poatina Power Station, Reece Power Station x2, Tarraleah Power Station, Trevallyn Power Station, Tribute Power Station, Tungatinah Power Station.
8 208 MW Mitsubishi combined cycle unit (CCGT); a 58 MW Rolls Royce open cycle gas turbine (OCGT); and three Pratt and Whitney 40 MW gas turbines.
9 Butlers Gorge Power Station, Cluny Power Station, Paloona Power Station, Repulse Power Station, Rowallan Power Station, Woolnorth Studland Bay / Bluff Point Wind Farm, Woolnorth Studland Bay / Bluff Point Wind Farm.
10 The Musselroe Wind Farm.
11 Installed capacity is the normal maximum operating rating, also known as nameplate rating.
12 Each of these schemes are registered as non-market non-scheduled generators
13 Exempt from registration due to nameplate rating exceeding 5 MW but less than 30 MW and exporting less than 20 GWh in any 12-month period.
ENERGY IN TASMANIA – PERFORMANCE REPORT 2014-15 101
Basslink Services Agreement (BSA)14 in place between Hydro Tasmania and
Basslink.
10.1.1.1.5 Other Participants
In the Tasmanian NEM region TasNetworks is also registered during 2014-15 as
Special Participant System Operator and Special Participant Distribution Operator.
10.1.1.2 Spot market volatility
The electricity spot market is extremely volatile due to a number of factors including:
the need to continuously and instantaneously match supply with demand. In
times of high demand, more expensive electricity generation is used because
generally, electricity cannot be stored economically;
available capacity and demand ie regions with capacity constraints and high
demand will tend to have higher prices;
fluctuations in demand ie regions with large variations in demand will require
quicker response and generally more expensive generation to be used at times
of peak demand;
unexpected generator outages and network constraints can lead to more
expensive generating units being dispatched to ensure supply is met; and
weather as, in the long term, prolonged drought can constrain the availability of
hydro generation and, in the short term, extreme hot weather will significantly
increase the demand for electricity and storms may initiate network constraints.
The National Electricity Rules limit spot price volatility by setting a maximum spot
price, referred to as the Market Price Cap (MPC) for each financial year. The MPC
for the 2014-15 financial year was $13 500/MWh15.
10.1.2 Spot market overview
10.1.2.1 Volume and price
Table 10.1 shows market turnover in Tasmania was highest in the first quarter of the
2014-15 financial year reflecting the increase in electricity usage during winter. In
contrast the market turnover for mainland Australian jurisdictions is highest in the third
quarter of the financial year ie during summer.
14 The BSA specifies a range of operational requirements between Hydro Tasmania and Basslink establishing the rights and obligations of both parties with respect to the operation of Basslink.
15 The Market Price Cap (MPC) is specified in the National Electricity Rules as the maximum price generators can bid into the market. The MPC is automatically triggered when AEMO directs network service providers to interrupt customer supply in order to keep supply and demand in the system: http://www.aemc.gov.au/electricity/guidelines-and-standards.html.
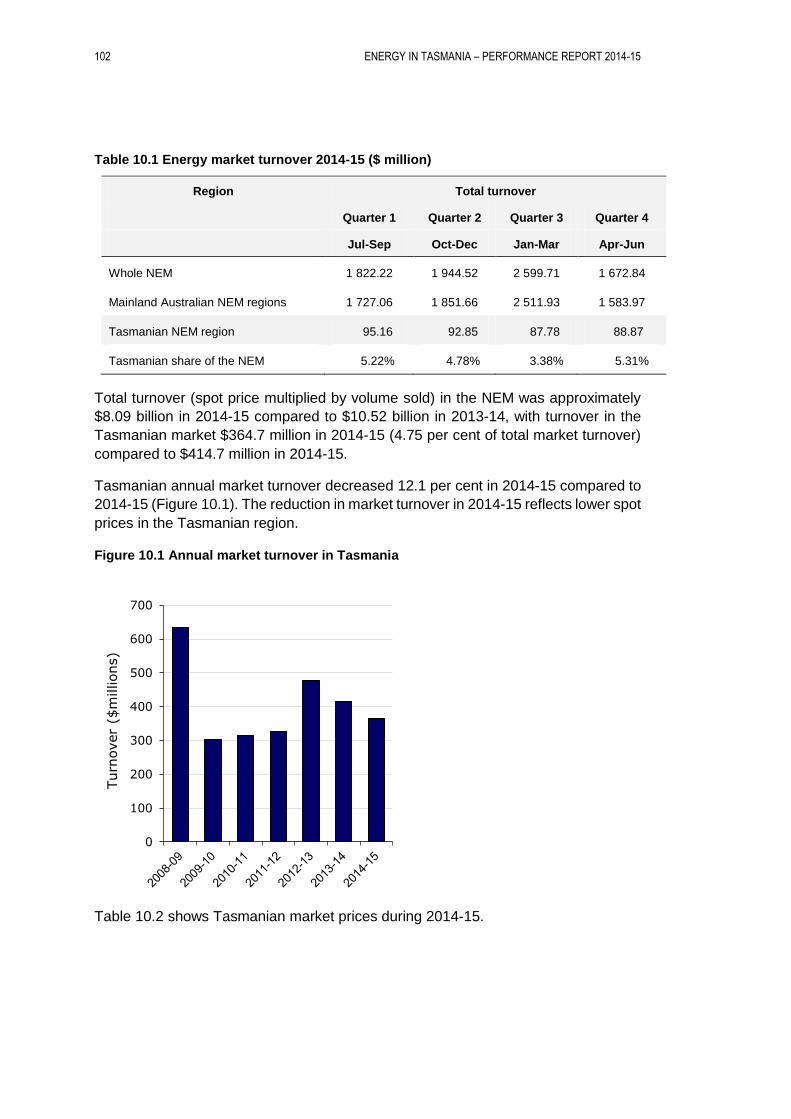
102 ENERGY IN TASMANIA – PERFORMANCE REPORT 2014-15
Table 10.1 Energy market turnover 2014-15 ($ million)
Region Total turnover
Quarter 1 Quarter 2 Quarter 3 Quarter 4
Jul-Sep Oct-Dec Jan-Mar Apr-Jun
Whole NEM 1 822.22 1 944.52 2 599.71 1 672.84
Mainland Australian NEM regions 1 727.06 1 851.66 2 511.93 1 583.97
Tasmanian NEM region 95.16 92.85 87.78 88.87
Tasmanian share of the NEM 5.22% 4.78% 3.38% 5.31%
Total turnover (spot price multiplied by volume sold) in the NEM was approximately
$8.09 billion in 2014-15 compared to $10.52 billion in 2013-14, with turnover in the
Tasmanian market $364.7 million in 2014-15 (4.75 per cent of total market turnover)
compared to $414.7 million in 2014-15.
Tasmanian annual market turnover decreased 12.1 per cent in 2014-15 compared to
2014-15 (Figure 10.1). The reduction in market turnover in 2014-15 reflects lower spot
prices in the Tasmanian region.
Figure 10.1 Annual market turnover in Tasmania
Table 10.2 shows Tasmanian market prices during 2014-15.
0
100
200
300
400
500
600
700
Turn
over
($m
illions)
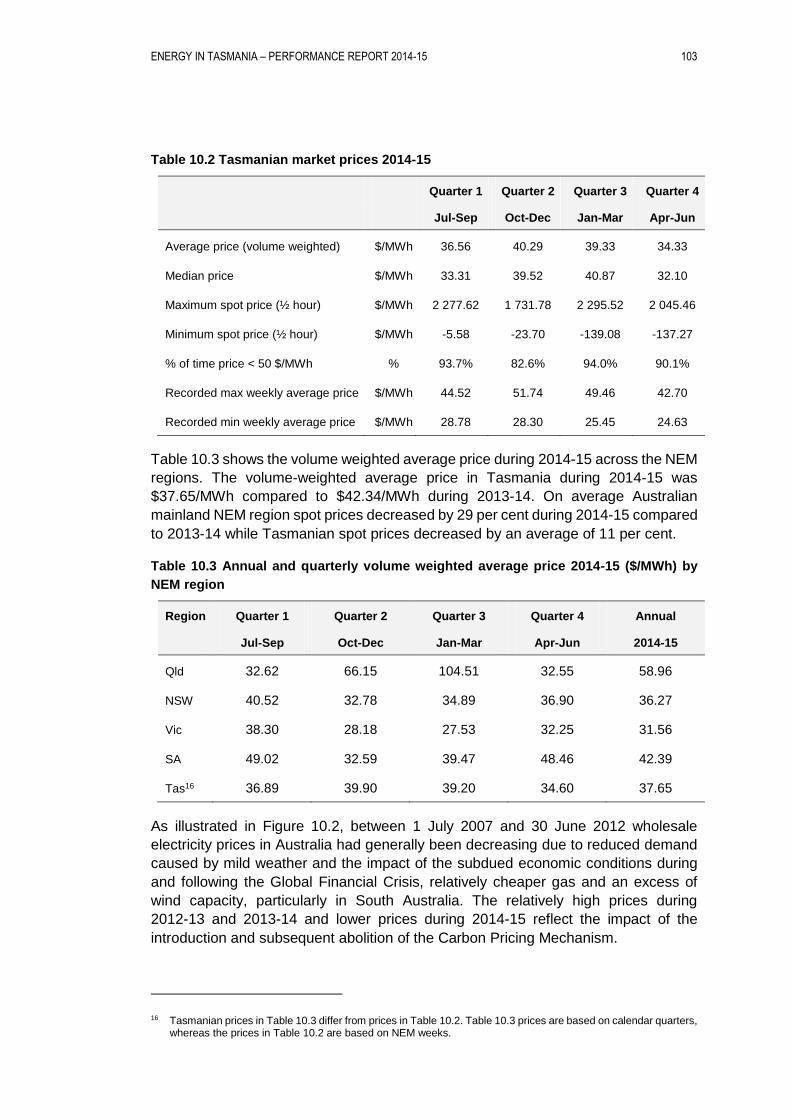
ENERGY IN TASMANIA – PERFORMANCE REPORT 2014-15 103
Table 10.2 Tasmanian market prices 2014-15
Quarter 1 Quarter 2 Quarter 3 Quarter 4
Jul-Sep Oct-Dec Jan-Mar Apr-Jun
Average price (volume weighted) $/MWh 36.56 40.29 39.33 34.33
Median price $/MWh 33.31 39.52 40.87 32.10
Maximum spot price (½ hour) $/MWh 2 277.62 1 731.78 2 295.52 2 045.46
Minimum spot price (½ hour) $/MWh -5.58 -23.70 -139.08 -137.27
% of time price < 50 $/MWh % 93.7% 82.6% 94.0% 90.1%
Recorded max weekly average price $/MWh 44.52 51.74 49.46 42.70
Recorded min weekly average price $/MWh 28.78 28.30 25.45 24.63
Table 10.3 shows the volume weighted average price during 2014-15 across the NEM
regions. The volume-weighted average price in Tasmania during 2014-15 was
$37.65/MWh compared to $42.34/MWh during 2013-14. On average Australian
mainland NEM region spot prices decreased by 29 per cent during 2014-15 compared
to 2013-14 while Tasmanian spot prices decreased by an average of 11 per cent.
Table 10.3 Annual and quarterly volume weighted average price 2014-15 ($/MWh) by
NEM region
Region Quarter 1 Quarter 2 Quarter 3 Quarter 4 Annual
Jul-Sep Oct-Dec Jan-Mar Apr-Jun 2014-15
Qld 32.62 66.15 104.51 32.55 58.96
NSW 40.52 32.78 34.89 36.90 36.27
Vic 38.30 28.18 27.53 32.25 31.56
SA 49.02 32.59 39.47 48.46 42.39
Tas16 36.89 39.90 39.20 34.60 37.65
As illustrated in Figure 10.2, between 1 July 2007 and 30 June 2012 wholesale
electricity prices in Australia had generally been decreasing due to reduced demand
caused by mild weather and the impact of the subdued economic conditions during
and following the Global Financial Crisis, relatively cheaper gas and an excess of
wind capacity, particularly in South Australia. The relatively high prices during
2012-13 and 2013-14 and lower prices during 2014-15 reflect the impact of the
introduction and subsequent abolition of the Carbon Pricing Mechanism.
16 Tasmanian prices in Table 10.3 differ from prices in Table 10.2. Table 10.3 prices are based on calendar quarters, whereas the prices in Table 10.2 are based on NEM weeks.
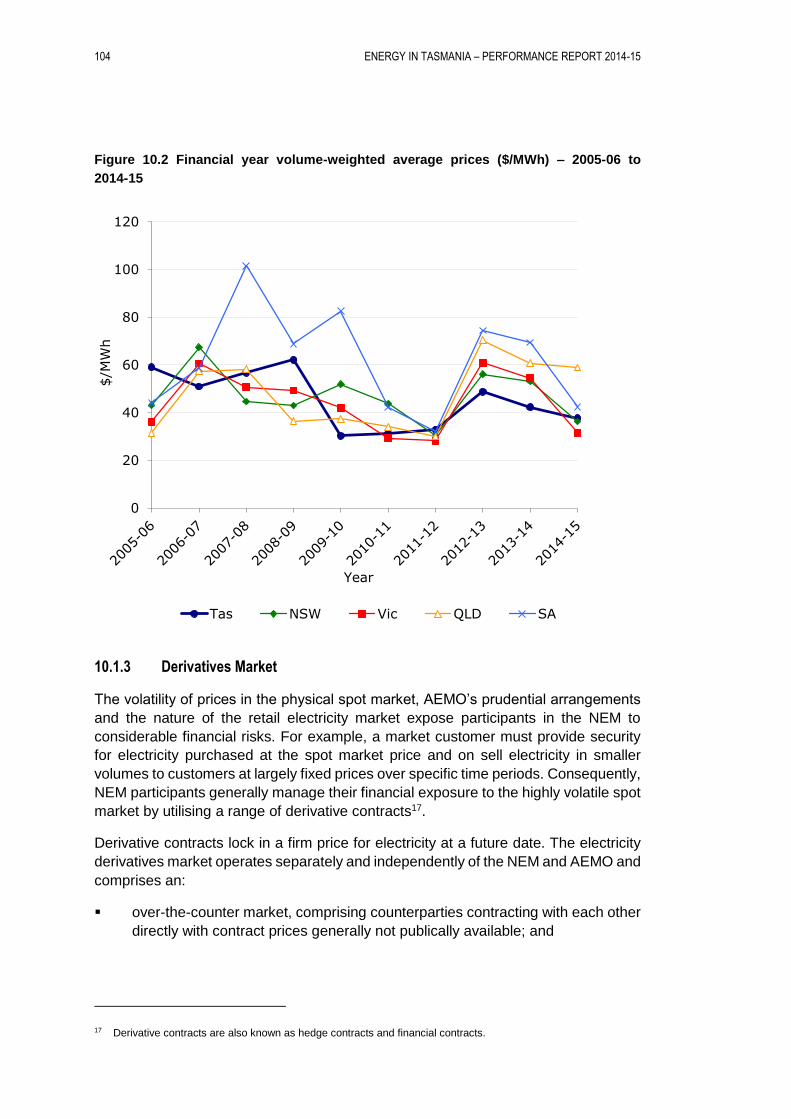
104 ENERGY IN TASMANIA – PERFORMANCE REPORT 2014-15
Figure 10.2 Financial year volume-weighted average prices ($/MWh) – 2005-06 to
2014-15
10.1.3 Derivatives Market
The volatility of prices in the physical spot market, AEMO’s prudential arrangements
and the nature of the retail electricity market expose participants in the NEM to
considerable financial risks. For example, a market customer must provide security
for electricity purchased at the spot market price and on sell electricity in smaller
volumes to customers at largely fixed prices over specific time periods. Consequently,
NEM participants generally manage their financial exposure to the highly volatile spot
market by utilising a range of derivative contracts17.
Derivative contracts lock in a firm price for electricity at a future date. The electricity
derivatives market operates separately and independently of the NEM and AEMO and
comprises an:
over-the-counter market, comprising counterparties contracting with each other
directly with contract prices generally not publically available; and
17 Derivative contracts are also known as hedge contracts and financial contracts.
0
20
40
60
80
100
120
$/M
Wh
Year
Tas NSW Vic QLD SA
ENERGY IN TASMANIA – PERFORMANCE REPORT 2014-15 105
exchange traded market with products such as futures and options traded
publically on ASX Energy (a subsidiary of the Australian Securities Exchange).18
The contracts are cash-settled contract for differences (CFDs) or variations of CFDs
with settlement based on the relevant NEM spot price.
Prices in derivative contracts depend on:
the period of the contract;
generators’ and retailers’ respective risk appetites; and
each party’s view on the likely spot market prices over the period of the contract.
Contract prices also include a premium for risk over the expected spot market price.
A NEM participant may therefore choose to retain some exposure to the spot market.
The level of exposure will depend on the entities’ appetite for risk and its expectation
of future market conditions.
10.1.3.1 Wholesale market competition
In addition to entering into derivative contracts with generators in Tasmania, retailers
operating in Tasmanian are, in principle, able to enter into contracts with generators
on mainland Australia but in doing so will need to manage inter-regional price risks
which are an important commercial consideration.
As at 30 June 2015 Aurora Energy was the dominant electricity retailer in Tasmania
and Hydro Tasmania the only significant generator in Tasmania therefore, generally
the only counterparty for derivative contracts for retailers wanting to manage the risks
of Tasmanian spot price volatility.
As discussed in section 6.5.1.1, to facilitate the introduction of Full Retail
Contestability (FRC)19 on mainland Tasmania from 1 July 2014 and to provide
certainty for retailers entering the Tasmanian electricity market, the Regulator became
responsible, from 1 January 2014, for regulating certain regulated derivative contracts
offered by Hydro Tasmania to act as a safety net for retailers20.
Under the Tasmanian wholesale contract regulatory framework Hydro Tasmania is
required to offer four regulated derivative contracts. This framework includes a
legislated derivatives instrument (known as the Wholesale Contract Regulatory
Instrument) which specifies the terms and conditions for the contracts and how prices
for the contracts are derived. The aim of providing regulated derivative contracts is to
reduce the risk faced by retailers operating in the Tasmanian market to a level
18 For more information on the wholesale price of electricity and the derivative market refer to: http://eex.gov.au/energy-management/energy-procurement/energy-pricing/the-wholesale-price-of-energy.
19 All electricity customers are able to choose their retailer. Also referred to as Full Retail Competition (FRC).
20 Additional information on the regulation of Hydro Tasmania’s derivative contracts is provided at: Wholesale price regulation
106 ENERGY IN TASMANIA – PERFORMANCE REPORT 2014-15
comparable to the risk facing retailers in other regions of the NEM and consequently
increase the likelihood of retailers entering the Tasmanian market.
10.1.4 Frequency control ancillary services
Frequency Control Ancillary Services (FCAS) maintain the frequency of the power
system within frequency operating bands. In general, these services are of two types:
Regulation FCAS are services that ensure that continual minor frequency
deviations during typical load and generation variations are maintained within the
normal operating band21; and
Contingency FCAS are fast, slow and delayed services used for recovering larger
frequency deviations that have arisen from contingent events such as the loss of
a generating unit, transmission line or the loss of a load.
As the frequency may need to be adjusted up or down, each of these FCAS services
can be further categorised as ‘raise’ or ‘lower’ services resulting in the following eight
separate FCAS requirements:
Regulation
Regulation Raise; and
Regulation Lower.
Contingency
Fast Raise (6 Second Raise)
Fast Lower (6 Second Lower)
Slow Raise (60 Second Raise)
Slow Lower (60 Second Lower)
Delayed Raise (5 Minute Raise)
Delayed Lower (5 Minute Lower)
Each type of FCAS has a separate market and FCAS are purchased by AEMO in
each of the eight FCAS markets. AEMO’s costs of procuring FCAS are recovered
from market participants according to a set of rules.
21 The normal operating band is the range in which frequency deviations, which occur during typical load and generation variations, are tolerated as it is not realistic to maintain a constant frequency of 50 Hz.
ENERGY IN TASMANIA – PERFORMANCE REPORT 2014-15 107
In Tasmania, sources of FCAS are:
Basslink22, where an increase or decrease in imports or exports will affect
frequency; and
Hydro Tasmania; both through its hydro generating units and Tamar Valley Power
Station (the Combined Cycle Gas Turbine provides lower contingency FCAS).
The cost of providing ‘lower’ services are reflected in charges to customers23. The
cost of providing ‘raise’ services are met by generators and will ultimately be
incorporated into energy prices.
Table 10.4 Ancillary services by quarter and by NEM region - 2014-15
Tasmanian NEM region Mainland Australian NEM regions
Q1 Q2 Q3 Q4 Q1 Q2 Q3 Q4
Jul-Sep Oct-Dec Jan-Mar Apr-Jun Jul-Sep Oct-Dec Jan-Mar Apr-Jun
Total turnover in energy market
($ Million)
95.4 91.2 88.3 89.0 1 840.1 1 921.9 2 602.9 1 668.3
Total FCAS costs
$’000s 2 186.5 4 001.1 5 054.0 938.9 5 223.8 4 548.7 7 289.3 5 066.5
% of total energy turnover
2.31% 4.35% 6.47% 1.20% 0.21% 0.18% 0.58% 0.40%
The cost of FCAS in Tasmania is significantly higher as a proportion of turnover in the
energy market than on mainland Australia where FCAS costs were 0.29 per cent of
total energy turnover for 2014-15 compared to 3.3 per cent in Tasmania. This is due
to the shortage of fast contingency FCAS which is an inherent characteristic of a hydro
generation dominated power system such as exists in Tasmania.
Figure 10.3 shows the weekly FCAS costs in Tasmania for 2014-15 and the proportion
of lower and raise contingency services each week.
FCAS costs in Tasmania were significantly higher between 14 December 2014 and
17 January 2015 (NEM weeks 51 – 3 inclusive).
A discussion of the factors contributing to the higher FCAS costs is provided by
AEMO at:
http://www.aemo.com.au/Electricity/Resources/Reports-and-Documents/Pricing-
Event-Reports/
and by the AER at: http://www.aer.gov.au/weekly electricity and gas analysis reports
22 Basslink is deemed to be unable to transfer FCAS services while flow is between approximately -50 MW and +50 MW (‘no-go’ zone).
23 For further explanation, refer to OTTER, 2007 Determination of Retail Tariffs on Mainland Tasmania – Information Paper, November 2006.
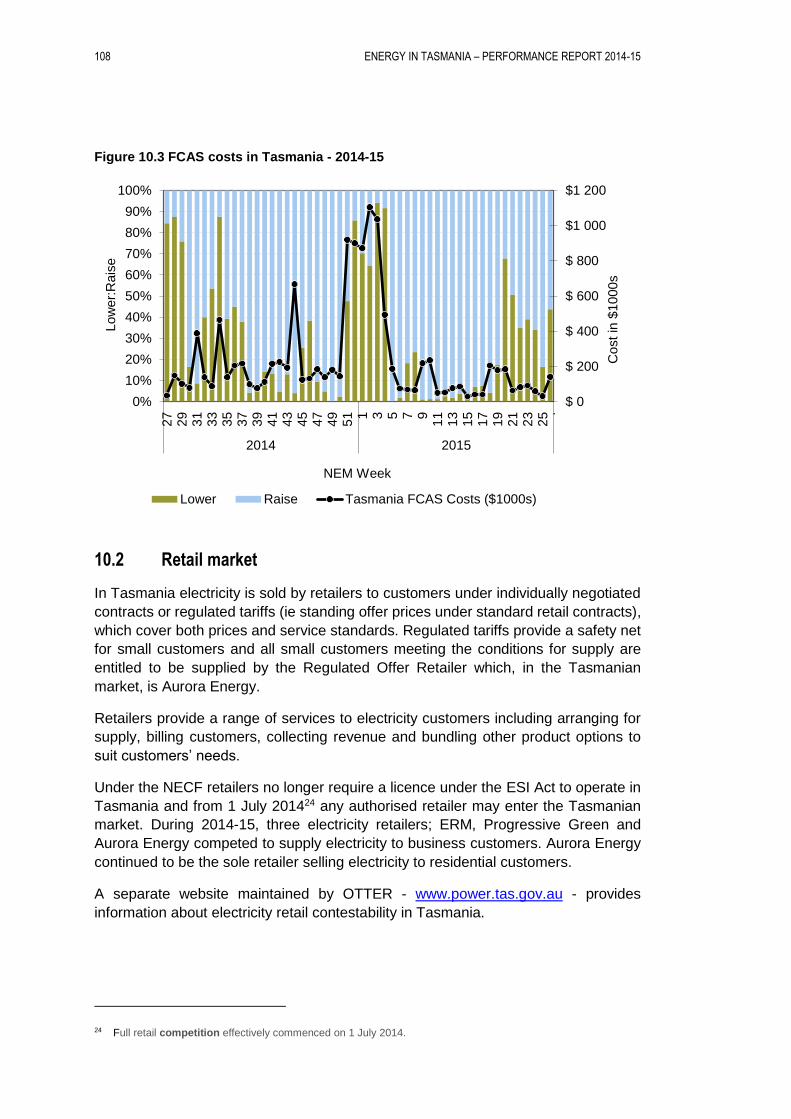
108 ENERGY IN TASMANIA – PERFORMANCE REPORT 2014-15
Figure 10.3 FCAS costs in Tasmania - 2014-15
10.2 Retail market
In Tasmania electricity is sold by retailers to customers under individually negotiated
contracts or regulated tariffs (ie standing offer prices under standard retail contracts),
which cover both prices and service standards. Regulated tariffs provide a safety net
for small customers and all small customers meeting the conditions for supply are
entitled to be supplied by the Regulated Offer Retailer which, in the Tasmanian
market, is Aurora Energy.
Retailers provide a range of services to electricity customers including arranging for
supply, billing customers, collecting revenue and bundling other product options to
suit customers’ needs.
Under the NECF retailers no longer require a licence under the ESI Act to operate in
Tasmania and from 1 July 201424 any authorised retailer may enter the Tasmanian
market. During 2014-15, three electricity retailers; ERM, Progressive Green and
Aurora Energy competed to supply electricity to business customers. Aurora Energy
continued to be the sole retailer selling electricity to residential customers.
A separate website maintained by OTTER - www.power.tas.gov.au - provides
information about electricity retail contestability in Tasmania.
24 Full retail competition effectively commenced on 1 July 2014.
$ 0
$ 200
$ 400
$ 600
$ 800
$1 000
$1 200
0%
10%
20%
30%
40%
50%
60%
70%
80%
90%
100%
27
29
31
33
35
37
39
41
43
45
47
49
51 1 3 5 7 9
11
13
15
17
19
21
23
25 .
2014 2015
Cost in
$1000s
Low
er:
Rais
e
NEM Week
Lower Raise Tasmania FCAS Costs ($1000s)
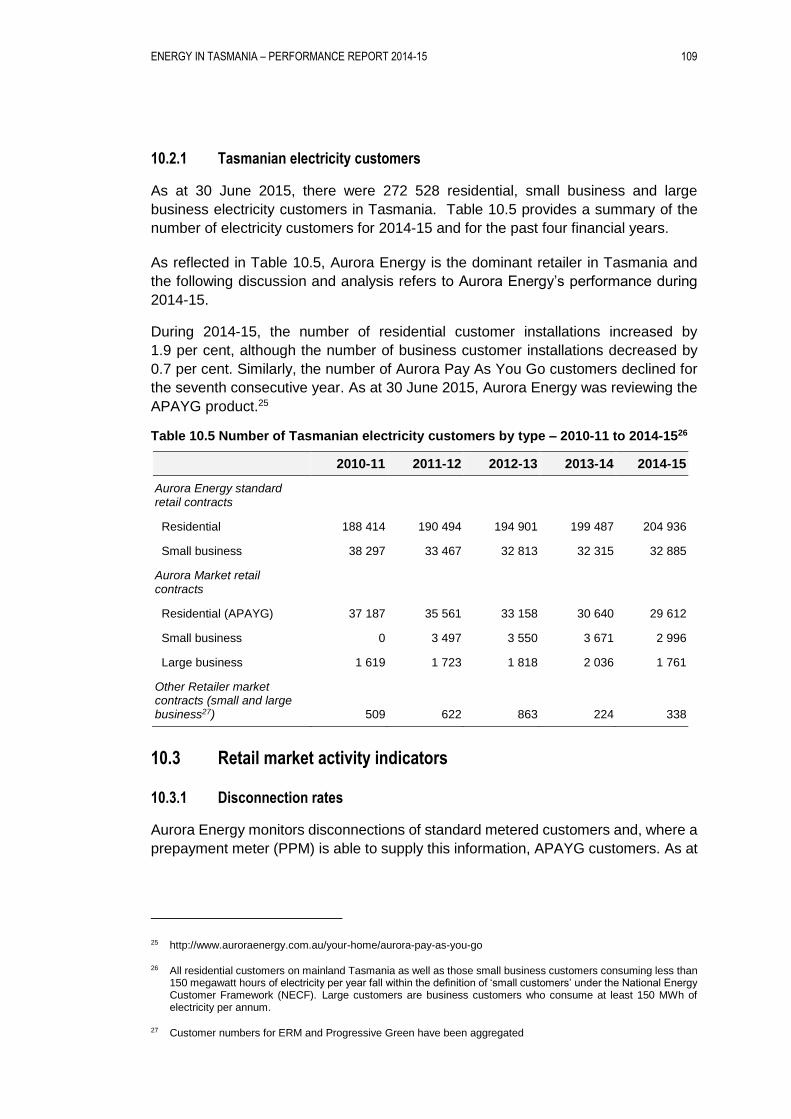
ENERGY IN TASMANIA – PERFORMANCE REPORT 2014-15 109
10.2.1 Tasmanian electricity customers
As at 30 June 2015, there were 272 528 residential, small business and large
business electricity customers in Tasmania. Table 10.5 provides a summary of the
number of electricity customers for 2014-15 and for the past four financial years.
As reflected in Table 10.5, Aurora Energy is the dominant retailer in Tasmania and
the following discussion and analysis refers to Aurora Energy’s performance during
2014-15.
During 2014-15, the number of residential customer installations increased by
1.9 per cent, although the number of business customer installations decreased by
0.7 per cent. Similarly, the number of Aurora Pay As You Go customers declined for
the seventh consecutive year. As at 30 June 2015, Aurora Energy was reviewing the
APAYG product.25
Table 10.5 Number of Tasmanian electricity customers by type – 2010-11 to 2014-1526
2010-11 2011-12 2012-13 2013-14 2014-15
Aurora Energy standard retail contracts
Residential 188 414 190 494 194 901 199 487 204 936
Small business 38 297 33 467 32 813 32 315 32 885
Aurora Market retail contracts
Residential (APAYG) 37 187 35 561 33 158 30 640 29 612
Small business 0 3 497 3 550 3 671 2 996
Large business 1 619 1 723 1 818 2 036 1 761
Other Retailer market contracts (small and large business27) 509 622 863 224 338
10.3 Retail market activity indicators
10.3.1 Disconnection rates
Aurora Energy monitors disconnections of standard metered customers and, where a
prepayment meter (PPM) is able to supply this information, APAYG customers. As at
25 http://www.auroraenergy.com.au/your-home/aurora-pay-as-you-go
26 All residential customers on mainland Tasmania as well as those small business customers consuming less than 150 megawatt hours of electricity per year fall within the definition of ‘small customers’ under the National Energy Customer Framework (NECF). Large customers are business customers who consume at least 150 MWh of electricity per annum.
27 Customer numbers for ERM and Progressive Green have been aggregated
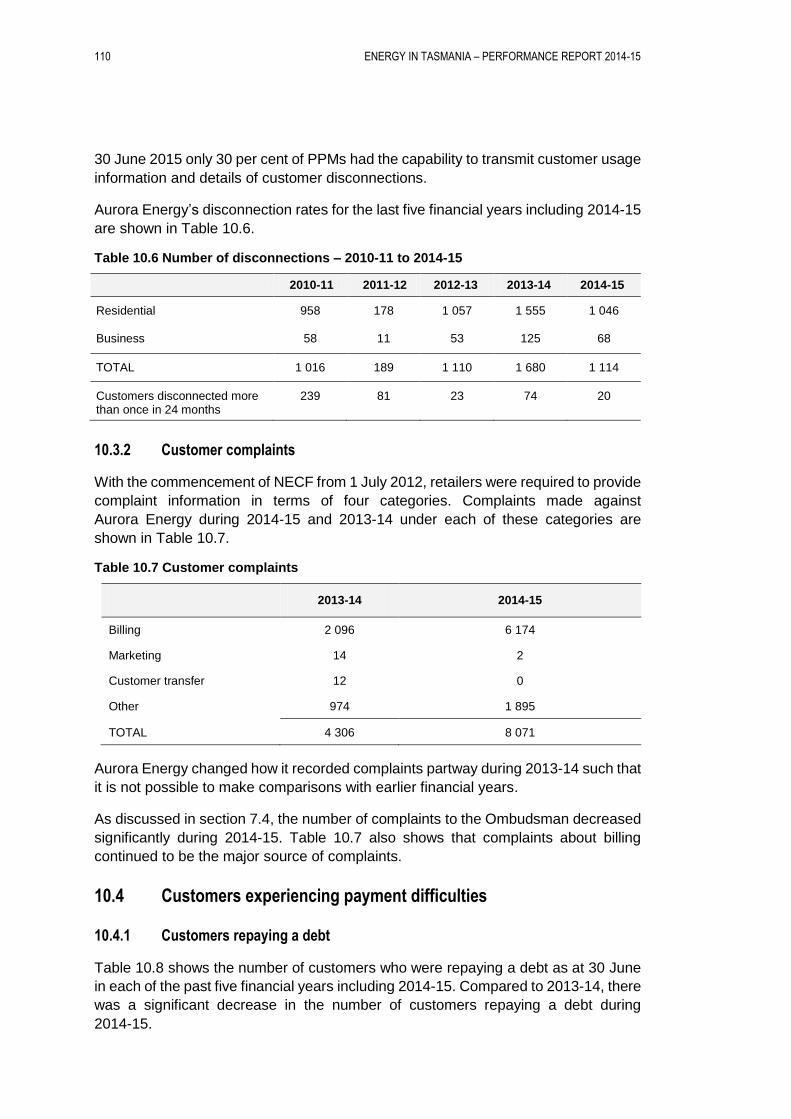
110 ENERGY IN TASMANIA – PERFORMANCE REPORT 2014-15
30 June 2015 only 30 per cent of PPMs had the capability to transmit customer usage
information and details of customer disconnections.
Aurora Energy’s disconnection rates for the last five financial years including 2014-15
are shown in Table 10.6.
Table 10.6 Number of disconnections – 2010-11 to 2014-15
2010-11 2011-12 2012-13 2013-14 2014-15
Residential 958 178 1 057 1 555 1 046
Business 58 11 53 125 68
TOTAL 1 016 189 1 110 1 680 1 114
Customers disconnected more than once in 24 months
239 81 23 74 20
10.3.2 Customer complaints
With the commencement of NECF from 1 July 2012, retailers were required to provide
complaint information in terms of four categories. Complaints made against
Aurora Energy during 2014-15 and 2013-14 under each of these categories are
shown in Table 10.7.
Table 10.7 Customer complaints
2013-14 2014-15
Billing 2 096 6 174
Marketing 14 2
Customer transfer 12 0
Other 974 1 895
TOTAL 4 306 8 071
Aurora Energy changed how it recorded complaints partway during 2013-14 such that
it is not possible to make comparisons with earlier financial years.
As discussed in section 7.4, the number of complaints to the Ombudsman decreased
significantly during 2014-15. Table 10.7 also shows that complaints about billing
continued to be the major source of complaints.
10.4 Customers experiencing payment difficulties
10.4.1 Customers repaying a debt
Table 10.8 shows the number of customers who were repaying a debt as at 30 June
in each of the past five financial years including 2014-15. Compared to 2013-14, there
was a significant decrease in the number of customers repaying a debt during
2014-15.
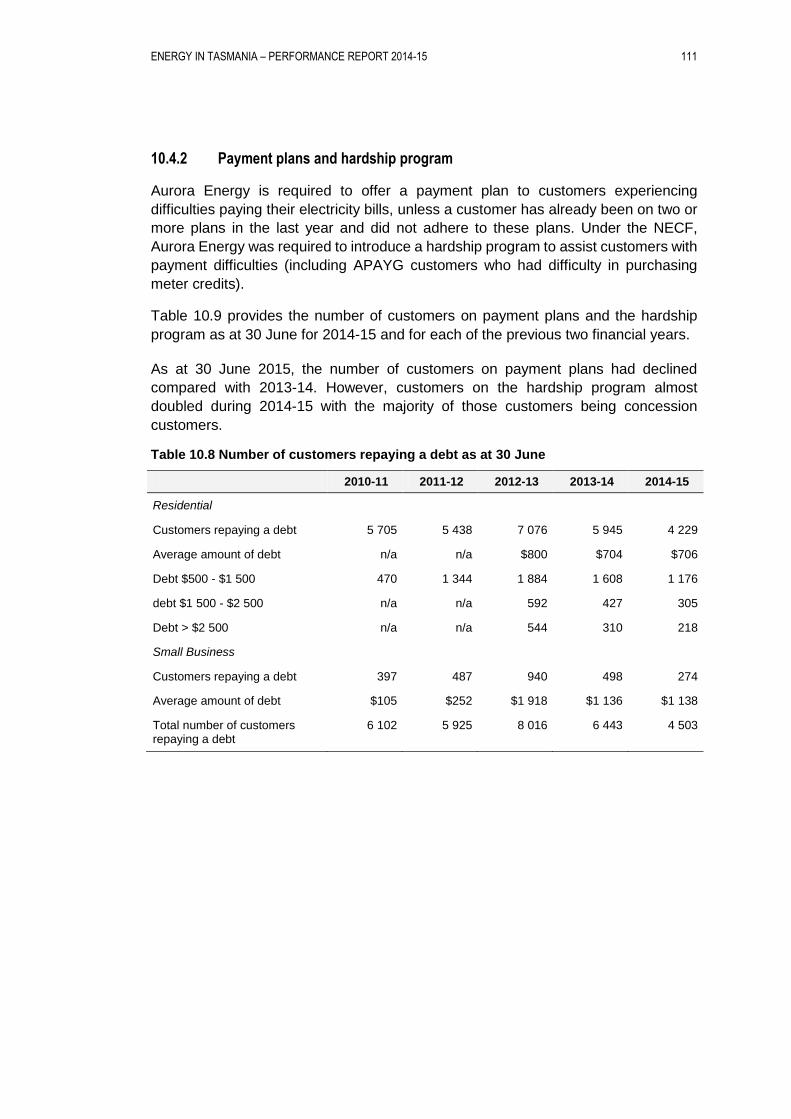
ENERGY IN TASMANIA – PERFORMANCE REPORT 2014-15 111
10.4.2 Payment plans and hardship program
Aurora Energy is required to offer a payment plan to customers experiencing
difficulties paying their electricity bills, unless a customer has already been on two or
more plans in the last year and did not adhere to these plans. Under the NECF,
Aurora Energy was required to introduce a hardship program to assist customers with
payment difficulties (including APAYG customers who had difficulty in purchasing
meter credits).
Table 10.9 provides the number of customers on payment plans and the hardship
program as at 30 June for 2014-15 and for each of the previous two financial years.
As at 30 June 2015, the number of customers on payment plans had declined
compared with 2013-14. However, customers on the hardship program almost
doubled during 2014-15 with the majority of those customers being concession
customers.
Table 10.8 Number of customers repaying a debt as at 30 June
2010-11 2011-12 2012-13 2013-14 2014-15
Residential
Customers repaying a debt 5 705 5 438 7 076 5 945 4 229
Average amount of debt n/a n/a $800 $704 $706
Debt $500 - $1 500 470 1 344 1 884 1 608 1 176
debt $1 500 - $2 500 n/a n/a 592 427 305
Debt > $2 500 n/a n/a 544 310 218
Small Business
Customers repaying a debt 397 487 940 498 274
Average amount of debt $105 $252 $1 918 $1 136 $1 138
Total number of customers repaying a debt
6 102 5 925 8 016 6 443 4 503
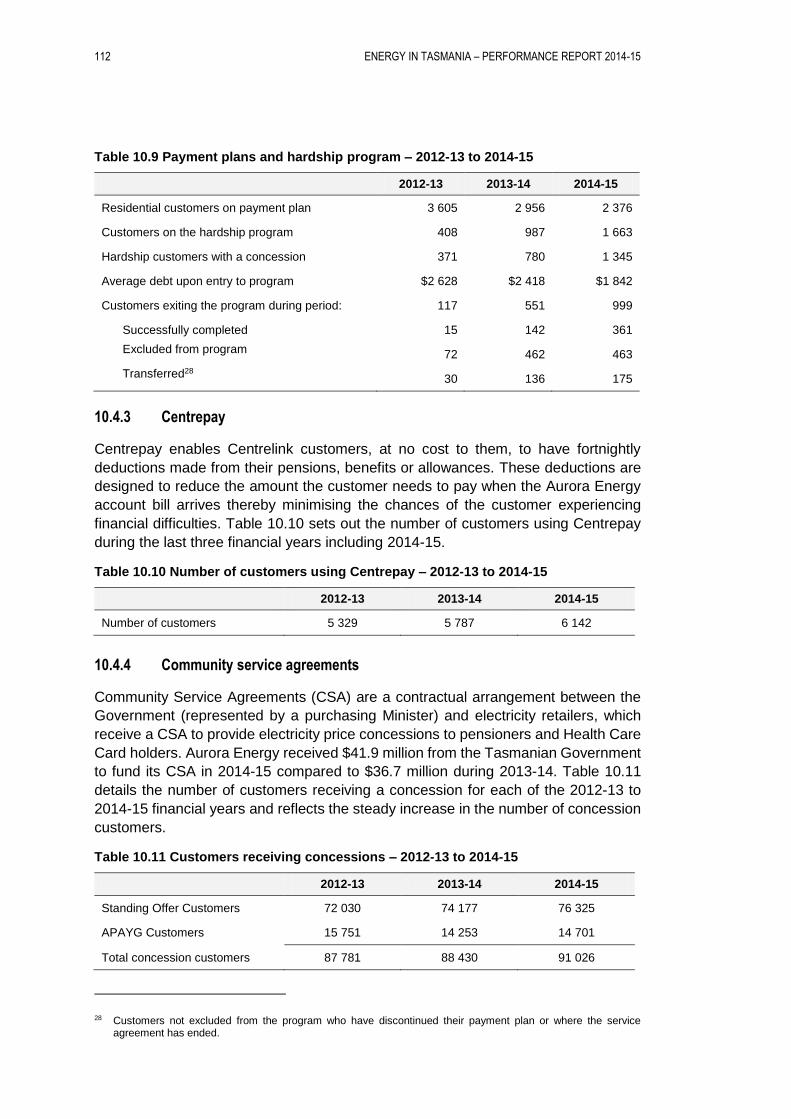
112 ENERGY IN TASMANIA – PERFORMANCE REPORT 2014-15
Table 10.9 Payment plans and hardship program – 2012-13 to 2014-15
2012-13 2013-14 2014-15
Residential customers on payment plan 3 605 2 956 2 376
Customers on the hardship program 408 987 1 663
Hardship customers with a concession 371 780 1 345
Average debt upon entry to program $2 628 $2 418 $1 842
Customers exiting the program during period: 117 551 999
Successfully completed 15 142 361
Excluded from program 72 462 463
Transferred28 30 136 175
10.4.3 Centrepay
Centrepay enables Centrelink customers, at no cost to them, to have fortnightly
deductions made from their pensions, benefits or allowances. These deductions are
designed to reduce the amount the customer needs to pay when the Aurora Energy
account bill arrives thereby minimising the chances of the customer experiencing
financial difficulties. Table 10.10 sets out the number of customers using Centrepay
during the last three financial years including 2014-15.
Table 10.10 Number of customers using Centrepay – 2012-13 to 2014-15
2012-13 2013-14 2014-15
Number of customers 5 329 5 787 6 142
10.4.4 Community service agreements
Community Service Agreements (CSA) are a contractual arrangement between the
Government (represented by a purchasing Minister) and electricity retailers, which
receive a CSA to provide electricity price concessions to pensioners and Health Care
Card holders. Aurora Energy received $41.9 million from the Tasmanian Government
to fund its CSA in 2014-15 compared to $36.7 million during 2013-14. Table 10.11
details the number of customers receiving a concession for each of the 2012-13 to
2014-15 financial years and reflects the steady increase in the number of concession
customers.
Table 10.11 Customers receiving concessions – 2012-13 to 2014-15
2012-13 2013-14 2014-15
Standing Offer Customers 72 030 74 177 76 325
APAYG Customers 15 751 14 253 14 701
Total concession customers 87 781 88 430 91 026
28 Customers not excluded from the program who have discontinued their payment plan or where the service agreement has ended.
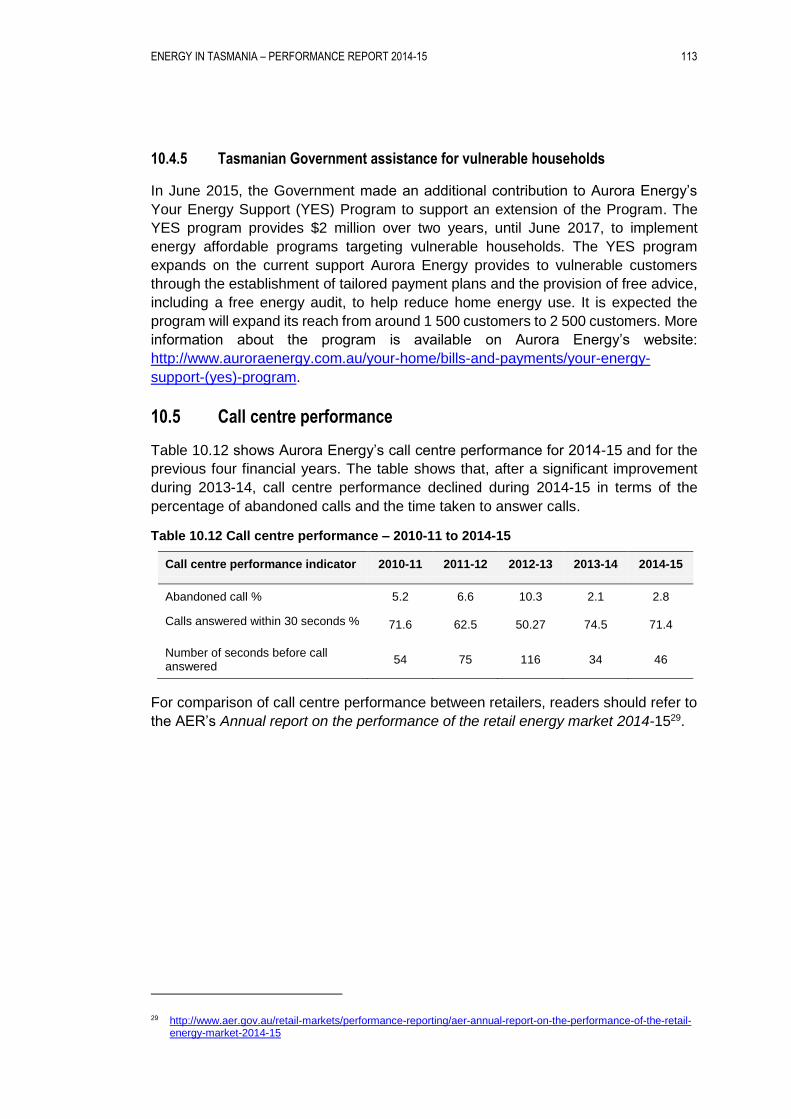
ENERGY IN TASMANIA – PERFORMANCE REPORT 2014-15 113
10.4.5 Tasmanian Government assistance for vulnerable households
In June 2015, the Government made an additional contribution to Aurora Energy’s
Your Energy Support (YES) Program to support an extension of the Program. The
YES program provides $2 million over two years, until June 2017, to implement
energy affordable programs targeting vulnerable households. The YES program
expands on the current support Aurora Energy provides to vulnerable customers
through the establishment of tailored payment plans and the provision of free advice,
including a free energy audit, to help reduce home energy use. It is expected the
program will expand its reach from around 1 500 customers to 2 500 customers. More
information about the program is available on Aurora Energy’s website:
http://www.auroraenergy.com.au/your-home/bills-and-payments/your-energy-
support-(yes)-program.
10.5 Call centre performance
Table 10.12 shows Aurora Energy’s call centre performance for 2014-15 and for the
previous four financial years. The table shows that, after a significant improvement
during 2013-14, call centre performance declined during 2014-15 in terms of the
percentage of abandoned calls and the time taken to answer calls.
Table 10.12 Call centre performance – 2010-11 to 2014-15
Call centre performance indicator 2010-11 2011-12 2012-13 2013-14 2014-15
Abandoned call % 5.2 6.6 10.3 2.1 2.8
Calls answered within 30 seconds % 71.6 62.5 50.27 74.5 71.4
Number of seconds before call answered
54 75 116 34 46
For comparison of call centre performance between retailers, readers should refer to
the AER’s Annual report on the performance of the retail energy market 2014-1529.
29 http://www.aer.gov.au/retail-markets/performance-reporting/aer-annual-report-on-the-performance-of-the-retail- energy-market-2014-15

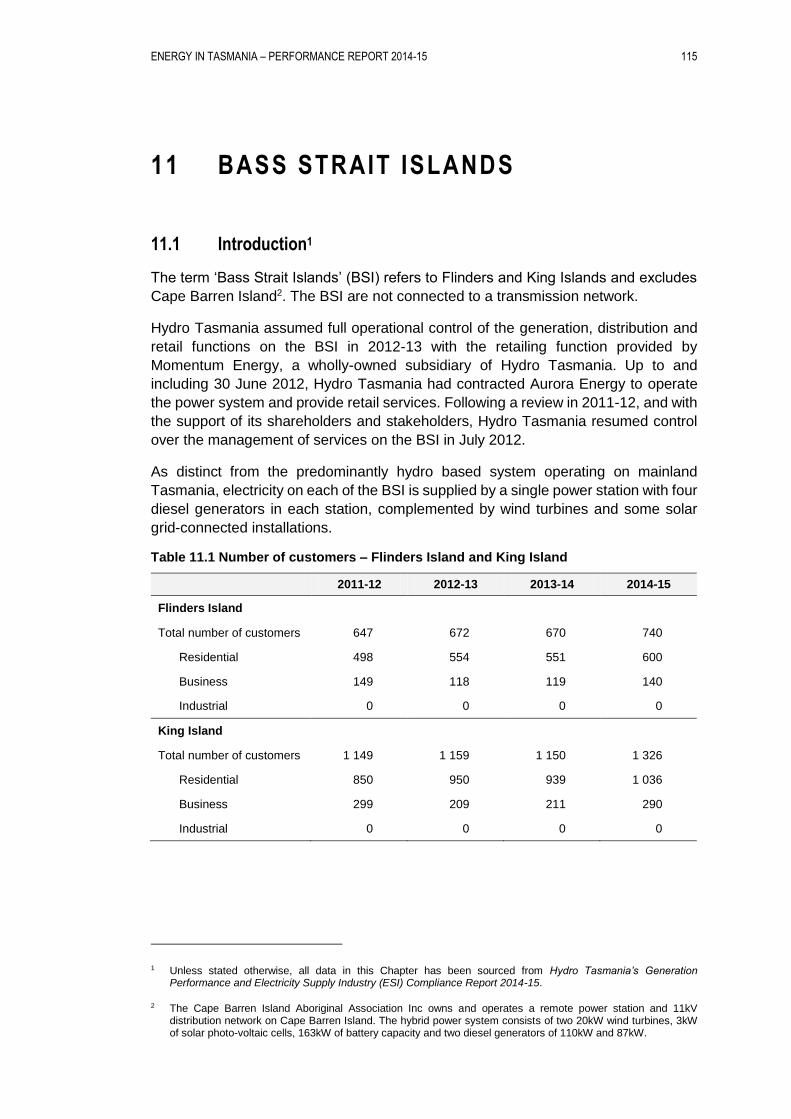
ENERGY IN TASMANIA – PERFORMANCE REPORT 2014-15 115
11 BASS STRAIT ISLANDS
11.1 Introduction1
The term ‘Bass Strait Islands’ (BSI) refers to Flinders and King Islands and excludes
Cape Barren Island2. The BSI are not connected to a transmission network.
Hydro Tasmania assumed full operational control of the generation, distribution and
retail functions on the BSI in 2012-13 with the retailing function provided by
Momentum Energy, a wholly-owned subsidiary of Hydro Tasmania. Up to and
including 30 June 2012, Hydro Tasmania had contracted Aurora Energy to operate
the power system and provide retail services. Following a review in 2011-12, and with
the support of its shareholders and stakeholders, Hydro Tasmania resumed control
over the management of services on the BSI in July 2012.
As distinct from the predominantly hydro based system operating on mainland
Tasmania, electricity on each of the BSI is supplied by a single power station with four
diesel generators in each station, complemented by wind turbines and some solar
grid-connected installations.
Table 11.1 Number of customers – Flinders Island and King Island
2011-12 2012-13 2013-14 2014-15
Flinders Island
Total number of customers 647 672 670 740
Residential 498 554 551 600
Business 149 118 119 140
Industrial 0 0 0 0
King Island
Total number of customers 1 149 1 159 1 150 1 326
Residential 850 950 939 1 036
Business 299 209 211 290
Industrial 0 0 0 0
1 Unless stated otherwise, all data in this Chapter has been sourced from Hydro Tasmania’s Generation Performance and Electricity Supply Industry (ESI) Compliance Report 2014-15.
2 The Cape Barren Island Aboriginal Association Inc owns and operates a remote power station and 11kV distribution network on Cape Barren Island. The hybrid power system consists of two 20kW wind turbines, 3kW of solar photo-voltaic cells, 163kW of battery capacity and two diesel generators of 110kW and 87kW.
116 ENERGY IN TASMANIA – PERFORMANCE REPORT 2014-15
11.2 Regulatory arrangements
Hydro Tasmania is authorised to carry out electricity generation, distribution and retail
operations on the BSI in accordance with the three electricity supply industry BSI
licences it holds. As a licensee, Hydro Tasmania is required to comply with the TEC
and report the performance of its BSI operations in accordance with the Economic
Regulator’s Electricity Supply Industry Information and Performance Reporting
Guideline (Version 2.3, September 2014).
11.3 Generation
11.3.1 Flinders Island
The Flinders Island Power Station is located just outside Whitemark and consists of
four diesel generators (one x 300kW, two x 720kW and one x 1 200kW) that generate
the majority of the electricity on Flinders Island. The total controllable generation
capacity on Flinders Island is approximately 2.94MW, with a firm capacity of 1.74MW.
There are also three privately owned wind turbines of 25kW, 60kW and 300kW
respectively and approximately 188kW of privately owned grid connected embedded
solar generation capacity that offsets Hydro Tasmania generation when operating.
The average daily loads on Flinders Island vary from 200kW overnight to 1MW during
the day.
Flinders Island is currently heavily reliant on diesel fuel to meet the island’s electricity
needs. To address this dependence, and as a means of increasing renewable energy
use, Hydro Tasmania is developing the Flinders Island Hybrid Energy Hub with
commissioning expected in to be complete in November 2016.
Once complete, the hybrid system will be capable of displacing up to 60 per cent of
the annual diesel fuel used on Flinders Island to generate electricity.
The project involves the construction of an additional single 900kW wind turbine
(located on the ridgeline above Lady Barron Road), 175kW of solar generation (built
at the existing diesel power station), and the installation of enabling technology, such
as a flywheel and battery energy storage.
11.3.2 King Island
On King Island, electricity is generated primarily by the King Island Advanced Hybrid
Power Station, located just outside Currie. It consists of one 1 200kW and three
1 600kW diesel generators, along with Hydro Tasmania’s Huxley Hill wind farm
comprising three 250kW and two 850Kw wind turbines directly connected to, and
controlled by, the power station. There is also 90kW of Hydro Tasmania controlled
solar connected at the station.
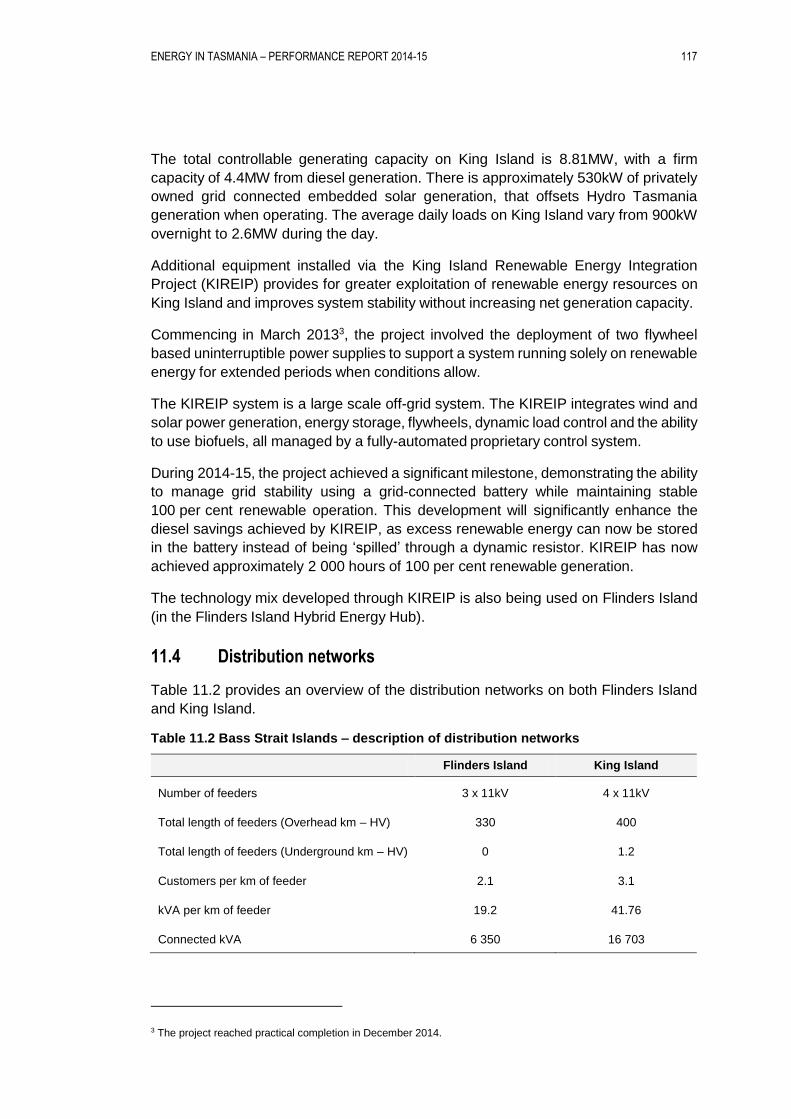
ENERGY IN TASMANIA – PERFORMANCE REPORT 2014-15 117
The total controllable generating capacity on King Island is 8.81MW, with a firm
capacity of 4.4MW from diesel generation. There is approximately 530kW of privately
owned grid connected embedded solar generation, that offsets Hydro Tasmania
generation when operating. The average daily loads on King Island vary from 900kW
overnight to 2.6MW during the day.
Additional equipment installed via the King Island Renewable Energy Integration
Project (KIREIP) provides for greater exploitation of renewable energy resources on
King Island and improves system stability without increasing net generation capacity.
Commencing in March 20133, the project involved the deployment of two flywheel
based uninterruptible power supplies to support a system running solely on renewable
energy for extended periods when conditions allow.
The KIREIP system is a large scale off-grid system. The KIREIP integrates wind and
solar power generation, energy storage, flywheels, dynamic load control and the ability
to use biofuels, all managed by a fully-automated proprietary control system.
During 2014-15, the project achieved a significant milestone, demonstrating the ability
to manage grid stability using a grid-connected battery while maintaining stable
100 per cent renewable operation. This development will significantly enhance the
diesel savings achieved by KIREIP, as excess renewable energy can now be stored
in the battery instead of being ‘spilled’ through a dynamic resistor. KIREIP has now
achieved approximately 2 000 hours of 100 per cent renewable generation.
The technology mix developed through KIREIP is also being used on Flinders Island
(in the Flinders Island Hybrid Energy Hub).
11.4 Distribution networks
Table 11.2 provides an overview of the distribution networks on both Flinders Island
and King Island.
Table 11.2 Bass Strait Islands – description of distribution networks
Flinders Island King Island
Number of feeders 3 x 11kV 4 x 11kV
Total length of feeders (Overhead km – HV) 330 400
Total length of feeders (Underground km – HV) 0 1.2
Customers per km of feeder 2.1 3.1
kVA per km of feeder 19.2 41.76
Connected kVA 6 350 16 703
3 The project reached practical completion in December 2014.
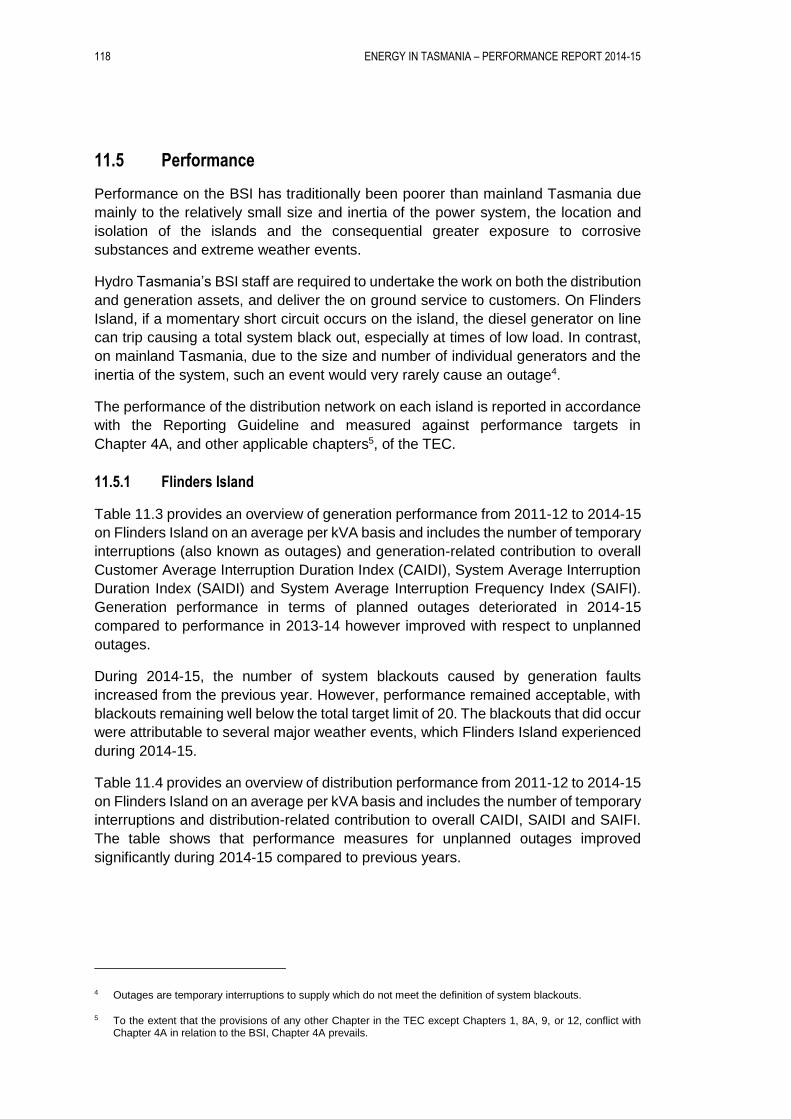
118 ENERGY IN TASMANIA – PERFORMANCE REPORT 2014-15
11.5 Performance
Performance on the BSI has traditionally been poorer than mainland Tasmania due
mainly to the relatively small size and inertia of the power system, the location and
isolation of the islands and the consequential greater exposure to corrosive
substances and extreme weather events.
Hydro Tasmania’s BSI staff are required to undertake the work on both the distribution
and generation assets, and deliver the on ground service to customers. On Flinders
Island, if a momentary short circuit occurs on the island, the diesel generator on line
can trip causing a total system black out, especially at times of low load. In contrast,
on mainland Tasmania, due to the size and number of individual generators and the
inertia of the system, such an event would very rarely cause an outage4.
The performance of the distribution network on each island is reported in accordance
with the Reporting Guideline and measured against performance targets in
Chapter 4A, and other applicable chapters5, of the TEC.
11.5.1 Flinders Island
Table 11.3 provides an overview of generation performance from 2011-12 to 2014-15
on Flinders Island on an average per kVA basis and includes the number of temporary
interruptions (also known as outages) and generation-related contribution to overall
Customer Average Interruption Duration Index (CAIDI), System Average Interruption
Duration Index (SAIDI) and System Average Interruption Frequency Index (SAIFI).
Generation performance in terms of planned outages deteriorated in 2014-15
compared to performance in 2013-14 however improved with respect to unplanned
outages.
During 2014-15, the number of system blackouts caused by generation faults
increased from the previous year. However, performance remained acceptable, with
blackouts remaining well below the total target limit of 20. The blackouts that did occur
were attributable to several major weather events, which Flinders Island experienced
during 2014-15.
Table 11.4 provides an overview of distribution performance from 2011-12 to 2014-15
on Flinders Island on an average per kVA basis and includes the number of temporary
interruptions and distribution-related contribution to overall CAIDI, SAIDI and SAIFI.
The table shows that performance measures for unplanned outages improved
significantly during 2014-15 compared to previous years.
4 Outages are temporary interruptions to supply which do not meet the definition of system blackouts.
5 To the extent that the provisions of any other Chapter in the TEC except Chapters 1, 8A, 9, or 12, conflict with Chapter 4A in relation to the BSI, Chapter 4A prevails.
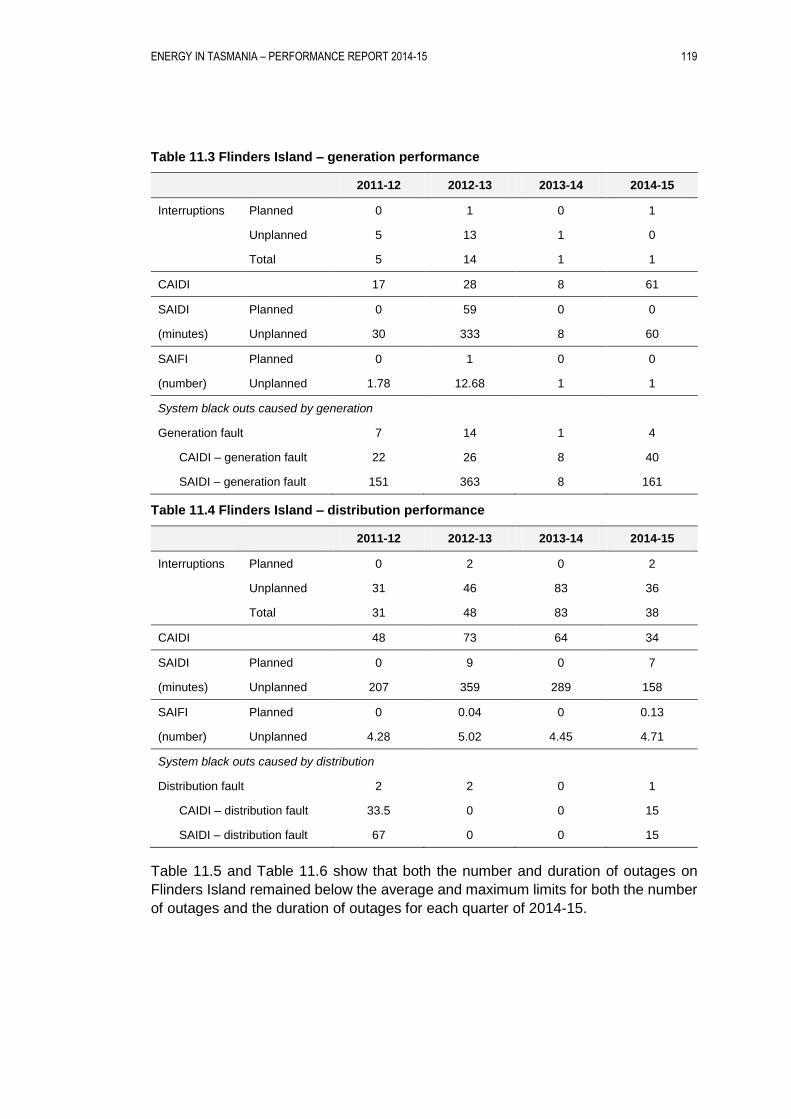
ENERGY IN TASMANIA – PERFORMANCE REPORT 2014-15 119
Table 11.3 Flinders Island – generation performance
2011-12 2012-13 2013-14 2014-15
Interruptions Planned 0 1 0 1
Unplanned 5 13 1 0
Total 5 14 1 1
CAIDI 17 28 8 61
SAIDI Planned 0 59 0 0
(minutes) Unplanned 30 333 8 60
SAIFI Planned 0 1 0 0
(number) Unplanned 1.78 12.68 1 1
System black outs caused by generation
Generation fault 7 14 1 4
CAIDI – generation fault 22 26 8 40
SAIDI – generation fault 151 363 8 161
Table 11.4 Flinders Island – distribution performance
2011-12 2012-13 2013-14 2014-15
Interruptions Planned 0 2 0 2
Unplanned 31 46 83 36
Total 31 48 83 38
CAIDI 48 73 64 34
SAIDI Planned 0 9 0 7
(minutes) Unplanned 207 359 289 158
SAIFI Planned 0 0.04 0 0.13
(number) Unplanned 4.28 5.02 4.45 4.71
System black outs caused by distribution
Distribution fault 2 2 0 1
CAIDI – distribution fault 33.5 0 0 15
SAIDI – distribution fault 67 0 0 15
Table 11.5 and Table 11.6 show that both the number and duration of outages on
Flinders Island remained below the average and maximum limits for both the number
of outages and the duration of outages for each quarter of 2014-15.
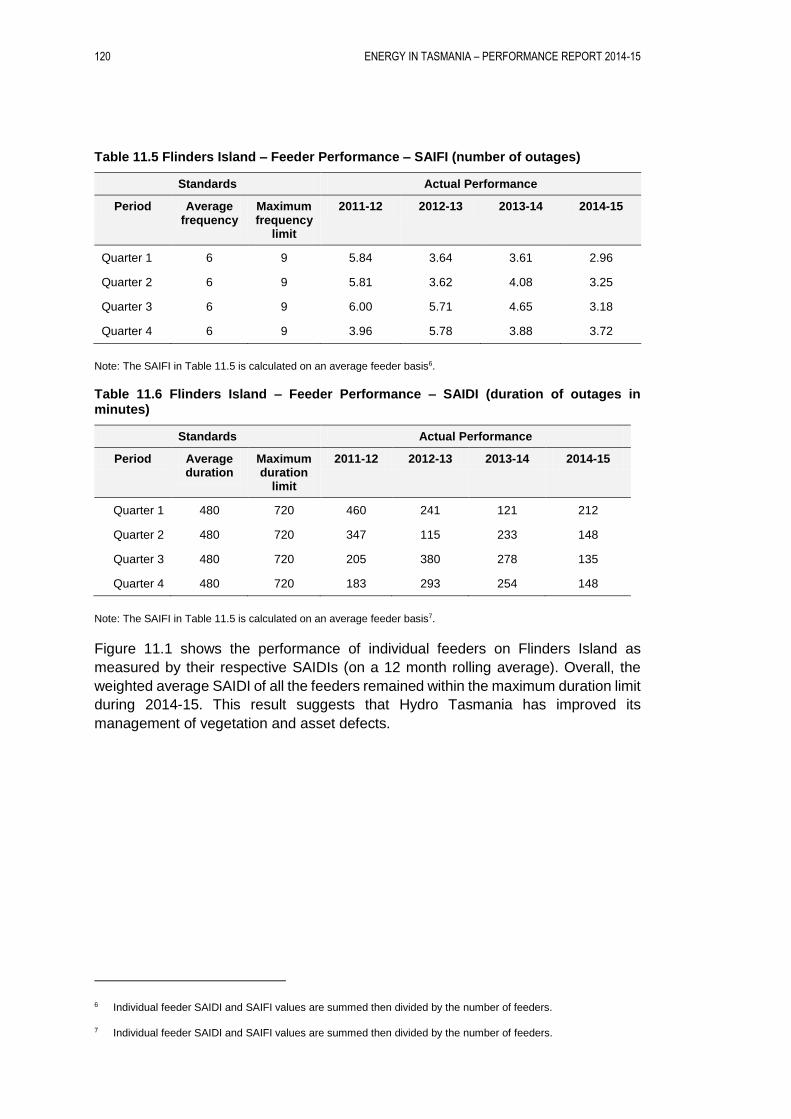
120 ENERGY IN TASMANIA – PERFORMANCE REPORT 2014-15
Table 11.5 Flinders Island – Feeder Performance – SAIFI (number of outages)
Standards Actual Performance
Period Average frequency
Maximum frequency
limit
2011-12 2012-13 2013-14 2014-15
Quarter 1 6 9 5.84 3.64 3.61 2.96
Quarter 2 6 9 5.81 3.62 4.08 3.25
Quarter 3 6 9 6.00 5.71 4.65 3.18
Quarter 4 6 9 3.96 5.78 3.88 3.72
Note: The SAIFI in Table 11.5 is calculated on an average feeder basis6.
Table 11.6 Flinders Island – Feeder Performance – SAIDI (duration of outages in minutes)
Standards Actual Performance
Period Average duration
Maximum duration
limit
2011-12 2012-13 2013-14 2014-15
Quarter 1 480 720 460 241 121 212
Quarter 2 480 720 347 115 233 148
Quarter 3 480 720 205 380 278 135
Quarter 4 480 720 183 293 254 148
Note: The SAIFI in Table 11.5 is calculated on an average feeder basis7.
Figure 11.1 shows the performance of individual feeders on Flinders Island as
measured by their respective SAIDIs (on a 12 month rolling average). Overall, the
weighted average SAIDI of all the feeders remained within the maximum duration limit
during 2014-15. This result suggests that Hydro Tasmania has improved its
management of vegetation and asset defects.
6 Individual feeder SAIDI and SAIFI values are summed then divided by the number of feeders.
7 Individual feeder SAIDI and SAIFI values are summed then divided by the number of feeders.
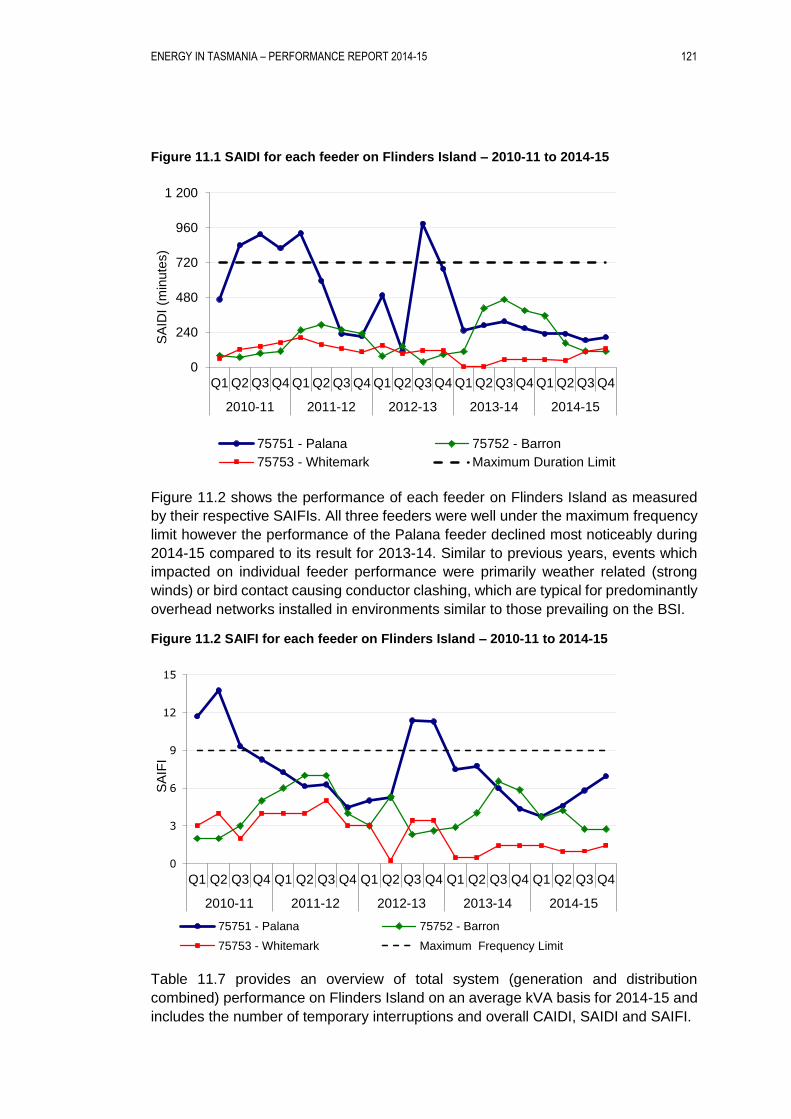
ENERGY IN TASMANIA – PERFORMANCE REPORT 2014-15 121
Figure 11.1 SAIDI for each feeder on Flinders Island – 2010-11 to 2014-15
Figure 11.2 shows the performance of each feeder on Flinders Island as measured
by their respective SAIFIs. All three feeders were well under the maximum frequency
limit however the performance of the Palana feeder declined most noticeably during
2014-15 compared to its result for 2013-14. Similar to previous years, events which
impacted on individual feeder performance were primarily weather related (strong
winds) or bird contact causing conductor clashing, which are typical for predominantly
overhead networks installed in environments similar to those prevailing on the BSI.
Figure 11.2 SAIFI for each feeder on Flinders Island – 2010-11 to 2014-15
Table 11.7 provides an overview of total system (generation and distribution
combined) performance on Flinders Island on an average kVA basis for 2014-15 and
includes the number of temporary interruptions and overall CAIDI, SAIDI and SAIFI.
0
240
480
720
960
1 200
Q1 Q2 Q3 Q4 Q1 Q2 Q3 Q4 Q1 Q2 Q3 Q4 Q1 Q2 Q3 Q4 Q1 Q2 Q3 Q4
2010-11 2011-12 2012-13 2013-14 2014-15
SA
IDI
(min
ute
s)
75751 - Palana 75752 - Barron
75753 - Whitemark Maximum Duration Limit
0
3
6
9
12
15
Q1 Q2 Q3 Q4 Q1 Q2 Q3 Q4 Q1 Q2 Q3 Q4 Q1 Q2 Q3 Q4 Q1 Q2 Q3 Q4
2010-11 2011-12 2012-13 2013-14 2014-15
SA
IFI
75751 - Palana 75752 - Barron
75753 - Whitemark Maximum Frequency Limit
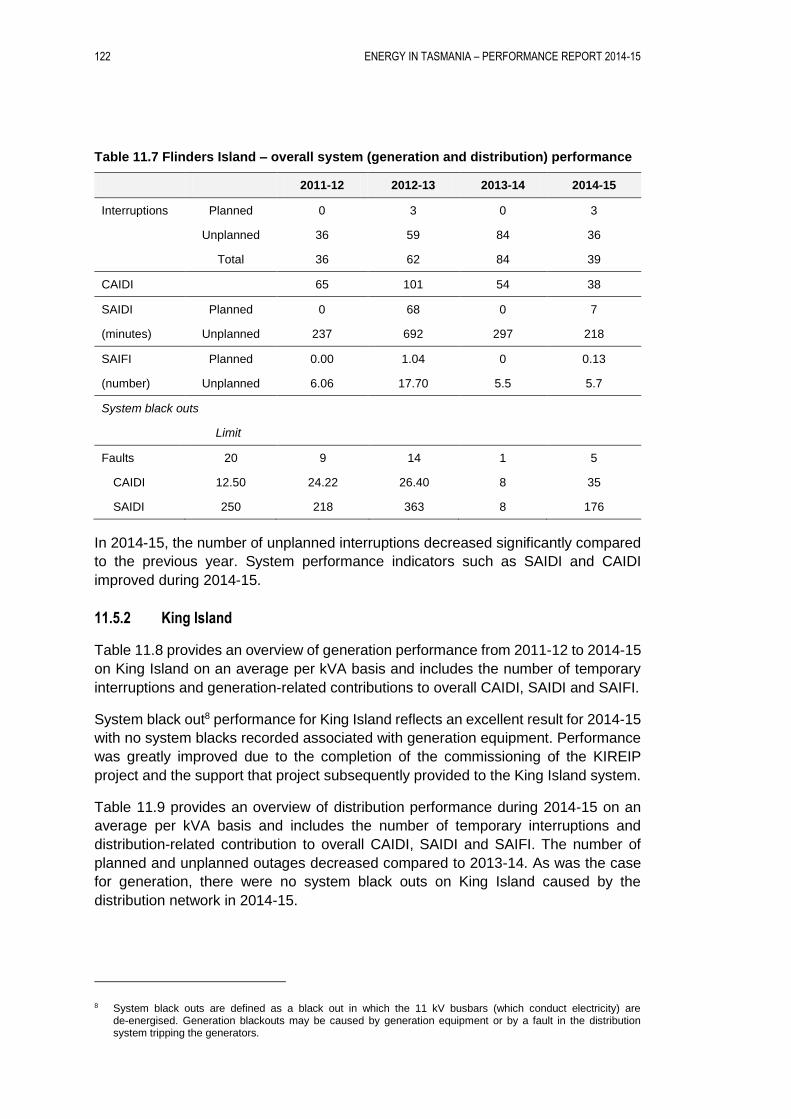
122 ENERGY IN TASMANIA – PERFORMANCE REPORT 2014-15
Table 11.7 Flinders Island – overall system (generation and distribution) performance
2011-12 2012-13 2013-14 2014-15
Interruptions Planned 0 3 0 3
Unplanned 36 59 84 36
Total 36 62 84 39
CAIDI 65 101 54 38
SAIDI Planned 0 68 0 7
(minutes) Unplanned 237 692 297 218
SAIFI Planned 0.00 1.04 0 0.13
(number) Unplanned 6.06 17.70 5.5 5.7
System black outs
Limit
Faults 20 9 14 1 5
CAIDI 12.50 24.22 26.40 8 35
SAIDI 250 218 363 8 176
In 2014-15, the number of unplanned interruptions decreased significantly compared
to the previous year. System performance indicators such as SAIDI and CAIDI
improved during 2014-15.
11.5.2 King Island
Table 11.8 provides an overview of generation performance from 2011-12 to 2014-15
on King Island on an average per kVA basis and includes the number of temporary
interruptions and generation-related contributions to overall CAIDI, SAIDI and SAIFI.
System black out8 performance for King Island reflects an excellent result for 2014-15
with no system blacks recorded associated with generation equipment. Performance
was greatly improved due to the completion of the commissioning of the KIREIP
project and the support that project subsequently provided to the King Island system.
Table 11.9 provides an overview of distribution performance during 2014-15 on an
average per kVA basis and includes the number of temporary interruptions and
distribution-related contribution to overall CAIDI, SAIDI and SAIFI. The number of
planned and unplanned outages decreased compared to 2013-14. As was the case
for generation, there were no system black outs on King Island caused by the
distribution network in 2014-15.
8 System black outs are defined as a black out in which the 11 kV busbars (which conduct electricity) are de-energised. Generation blackouts may be caused by generation equipment or by a fault in the distribution system tripping the generators.
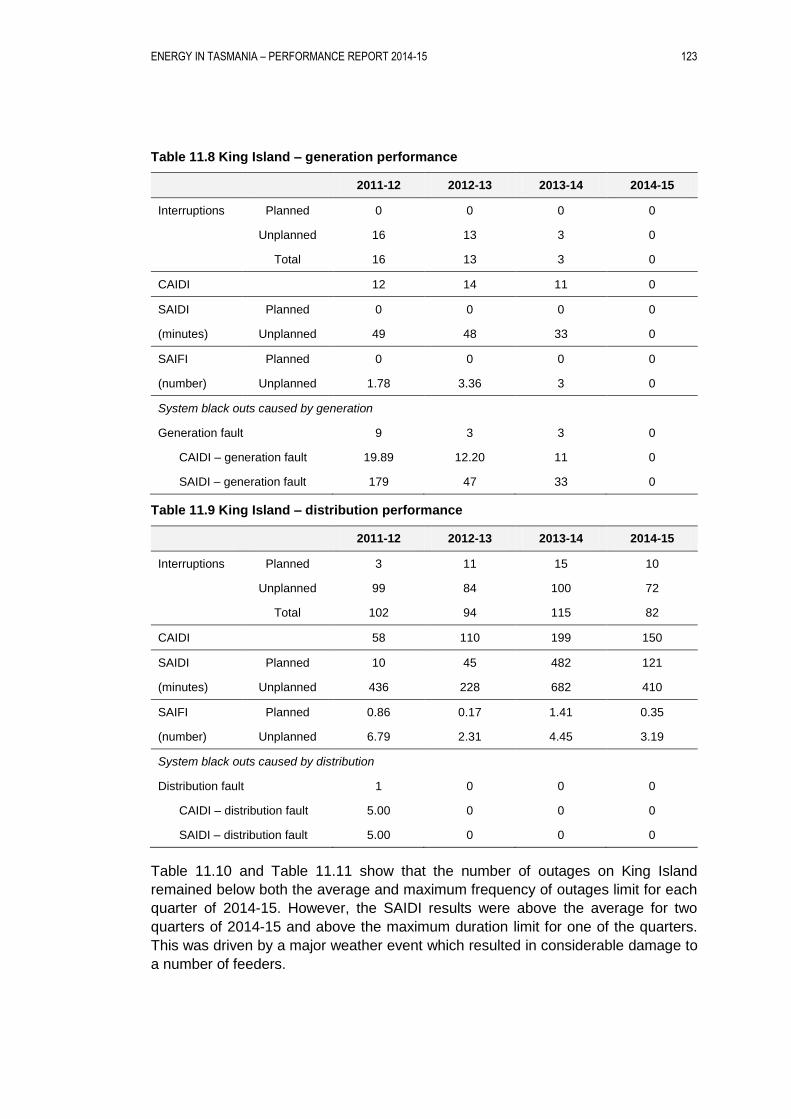
ENERGY IN TASMANIA – PERFORMANCE REPORT 2014-15 123
Table 11.8 King Island – generation performance
2011-12 2012-13 2013-14 2014-15
Interruptions Planned 0 0 0 0
Unplanned 16 13 3 0
Total 16 13 3 0
CAIDI 12 14 11 0
SAIDI Planned 0 0 0 0
(minutes) Unplanned 49 48 33 0
SAIFI Planned 0 0 0 0
(number) Unplanned 1.78 3.36 3 0
System black outs caused by generation
Generation fault 9 3 3 0
CAIDI – generation fault 19.89 12.20 11 0
SAIDI – generation fault 179 47 33 0
Table 11.9 King Island – distribution performance
2011-12 2012-13 2013-14 2014-15
Interruptions Planned 3 11 15 10
Unplanned 99 84 100 72
Total 102 94 115 82
CAIDI 58 110 199 150
SAIDI Planned 10 45 482 121
(minutes) Unplanned 436 228 682 410
SAIFI Planned 0.86 0.17 1.41 0.35
(number) Unplanned 6.79 2.31 4.45 3.19
System black outs caused by distribution
Distribution fault 1 0 0 0
CAIDI – distribution fault 5.00 0 0 0
SAIDI – distribution fault 5.00 0 0 0
Table 11.10 and Table 11.11 show that the number of outages on King Island
remained below both the average and maximum frequency of outages limit for each
quarter of 2014-15. However, the SAIDI results were above the average for two
quarters of 2014-15 and above the maximum duration limit for one of the quarters.
This was driven by a major weather event which resulted in considerable damage to
a number of feeders.
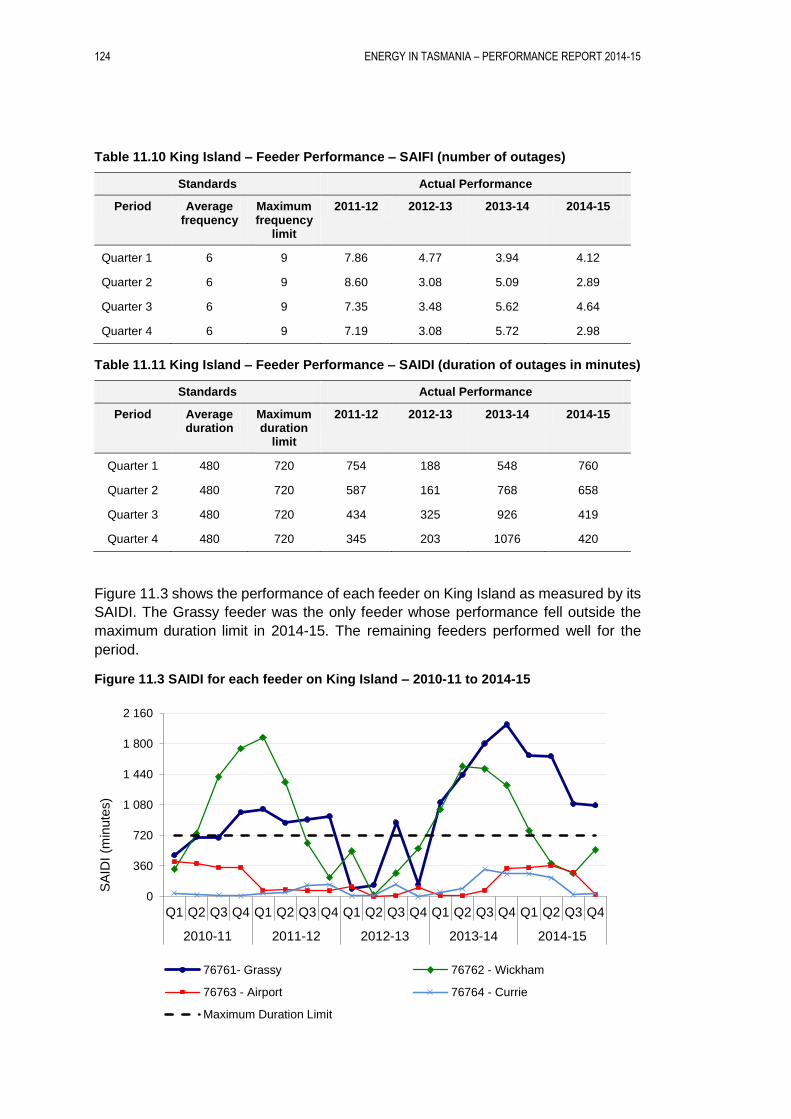
124 ENERGY IN TASMANIA – PERFORMANCE REPORT 2014-15
Table 11.10 King Island – Feeder Performance – SAIFI (number of outages)
Standards Actual Performance
Period Average frequency
Maximum frequency
limit
2011-12 2012-13 2013-14 2014-15
Quarter 1 6 9 7.86 4.77 3.94 4.12
Quarter 2 6 9 8.60 3.08 5.09 2.89
Quarter 3 6 9 7.35 3.48 5.62 4.64
Quarter 4 6 9 7.19 3.08 5.72 2.98
Table 11.11 King Island – Feeder Performance – SAIDI (duration of outages in minutes)
Standards Actual Performance
Period Average duration
Maximum duration
limit
2011-12 2012-13 2013-14 2014-15
Quarter 1 480 720 754 188 548 760
Quarter 2 480 720 587 161 768 658
Quarter 3 480 720 434 325 926 419
Quarter 4 480 720 345 203 1076 420
Figure 11.3 shows the performance of each feeder on King Island as measured by its
SAIDI. The Grassy feeder was the only feeder whose performance fell outside the
maximum duration limit in 2014-15. The remaining feeders performed well for the
period.
Figure 11.3 SAIDI for each feeder on King Island – 2010-11 to 2014-15
0
360
720
1 080
1 440
1 800
2 160
Q1 Q2 Q3 Q4 Q1 Q2 Q3 Q4 Q1 Q2 Q3 Q4 Q1 Q2 Q3 Q4 Q1 Q2 Q3 Q4
2010-11 2011-12 2012-13 2013-14 2014-15
SA
IDI
(min
ute
s)
76761- Grassy 76762 - Wickham
76763 - Airport 76764 - Currie
Maximum Duration Limit
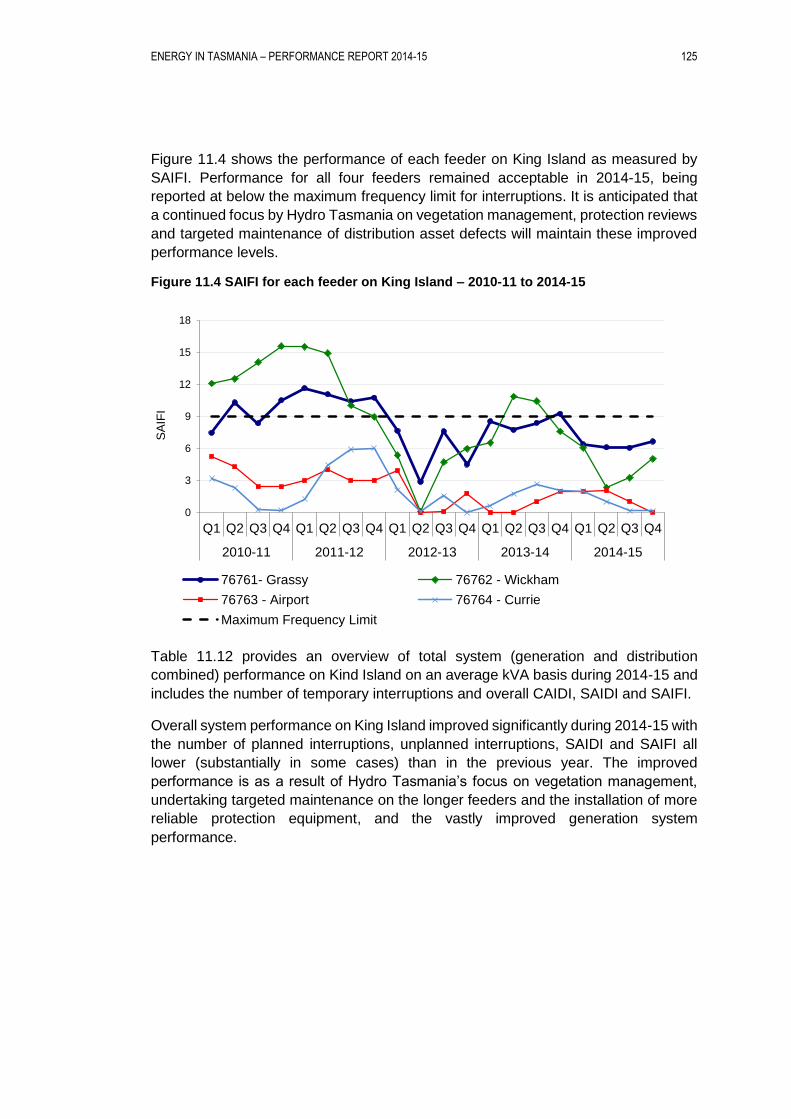
ENERGY IN TASMANIA – PERFORMANCE REPORT 2014-15 125
Figure 11.4 shows the performance of each feeder on King Island as measured by
SAIFI. Performance for all four feeders remained acceptable in 2014-15, being
reported at below the maximum frequency limit for interruptions. It is anticipated that
a continued focus by Hydro Tasmania on vegetation management, protection reviews
and targeted maintenance of distribution asset defects will maintain these improved
performance levels.
Figure 11.4 SAIFI for each feeder on King Island – 2010-11 to 2014-15
Table 11.12 provides an overview of total system (generation and distribution
combined) performance on Kind Island on an average kVA basis during 2014-15 and
includes the number of temporary interruptions and overall CAIDI, SAIDI and SAIFI.
Overall system performance on King Island improved significantly during 2014-15 with
the number of planned interruptions, unplanned interruptions, SAIDI and SAIFI all
lower (substantially in some cases) than in the previous year. The improved
performance is as a result of Hydro Tasmania’s focus on vegetation management,
undertaking targeted maintenance on the longer feeders and the installation of more
reliable protection equipment, and the vastly improved generation system
performance.
0
3
6
9
12
15
18
Q1 Q2 Q3 Q4 Q1 Q2 Q3 Q4 Q1 Q2 Q3 Q4 Q1 Q2 Q3 Q4 Q1 Q2 Q3 Q4
2010-11 2011-12 2012-13 2013-14 2014-15
SA
IFI
76761- Grassy 76762 - Wickham
76763 - Airport 76764 - Currie
Maximum Frequency Limit
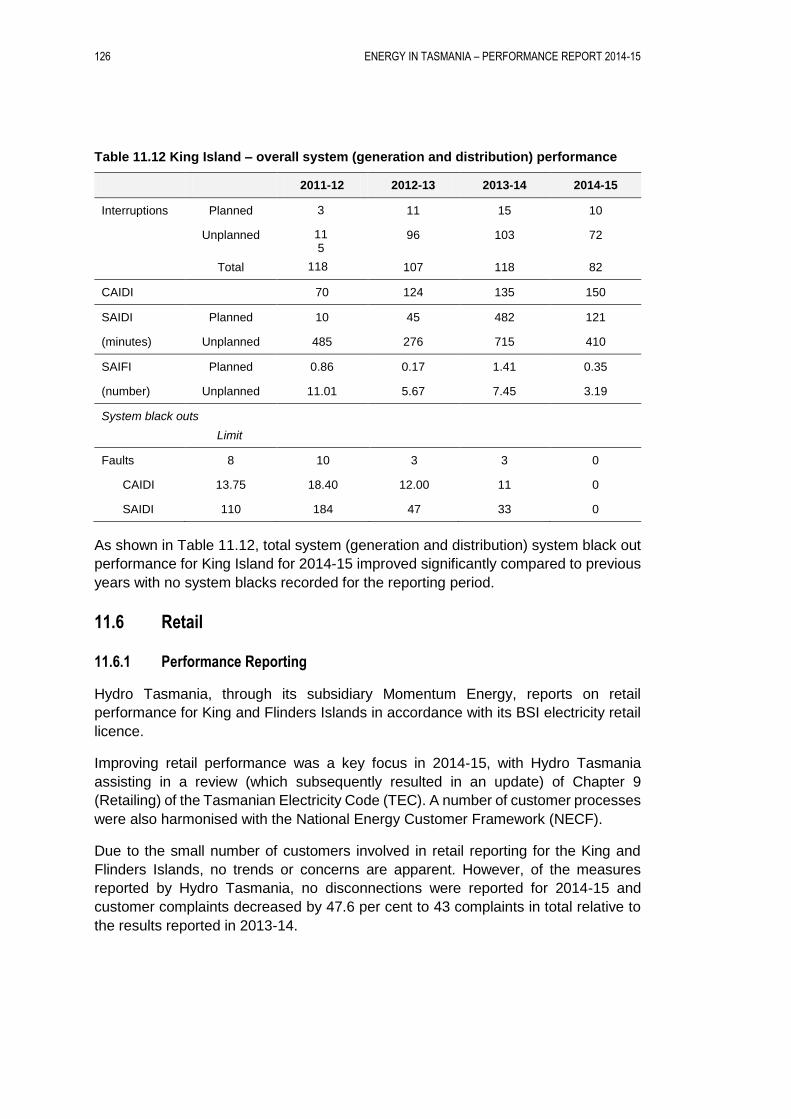
126 ENERGY IN TASMANIA – PERFORMANCE REPORT 2014-15
Table 11.12 King Island – overall system (generation and distribution) performance
2011-12 2012-13 2013-14 2014-15
Interruptions Planned 3 11 15 10
Unplanned 115
96 103 72
Total 118 107 118 82
CAIDI 70 124 135 150
SAIDI Planned 10 45 482 121
(minutes) Unplanned 485 276 715 410
SAIFI Planned 0.86 0.17 1.41 0.35
(number) Unplanned 11.01 5.67 7.45 3.19
System black outs
Limit
Faults 8 10 3 3 0
CAIDI 13.75 18.40 12.00 11 0
SAIDI 110 184 47 33 0
As shown in Table 11.12, total system (generation and distribution) system black out
performance for King Island for 2014-15 improved significantly compared to previous
years with no system blacks recorded for the reporting period.
11.6 Retail
11.6.1 Performance Reporting
Hydro Tasmania, through its subsidiary Momentum Energy, reports on retail
performance for King and Flinders Islands in accordance with its BSI electricity retail
licence.
Improving retail performance was a key focus in 2014-15, with Hydro Tasmania
assisting in a review (which subsequently resulted in an update) of Chapter 9
(Retailing) of the Tasmanian Electricity Code (TEC). A number of customer processes
were also harmonised with the National Energy Customer Framework (NECF).
Due to the small number of customers involved in retail reporting for the King and
Flinders Islands, no trends or concerns are apparent. However, of the measures
reported by Hydro Tasmania, no disconnections were reported for 2014-15 and
customer complaints decreased by 47.6 per cent to 43 complaints in total relative to
the results reported in 2013-14.
ENERGY IN TASMANIA – PERFORMANCE REPORT 2014-15 127
11.6.2 Price comparison
Table 11.13 and Table 11.14 compare prices paid by residential customers on the
BSI with prices paid by residential customers on mainland Tasmania during 2014-15
in terms of both supply charges (fixed/service) and energy (usage) charges.
Table 11.13 Hydro Tasmania – BSI tariffs for 2014-15
Charge Rate Unit
All customers – Tariff 51
Service charge 76.43 per day
Meter charge 7.49c per meter per day
Energy (all units) 25.99 per KWh
Table 11.14 Aurora Energy – standard residential rates for 2014-15
Charge Rate Unit
Light and Power – Tariff 51
Fixed charges 87.677c per day
Energy (all units) 24.717c per KWh
How Water – Tariff 41 & Tariff 42 (Heating Discount (hot water and space heating)
Fixed charges 16.981c per day
Energy (all units) 14.907c per KWh
11.7 Community Service Obligation (CSO)
The cost of supplying electricity on the BSI is significantly higher than on mainland
Tasmania due to the islands’ isolation and the associated reliance on diesel
generation. As a result, the State Government administers the BSI Community
Service Obligation (CSO) which provides direct concessions to BSI customers who
are pensioners. The CSO also subsidises Hydro Tasmania’s costs in supplying
electricity to BSI customers. The CSO is a contractual arrangement between the State
Government and Hydro Tasmania and is re-negotiated periodically. In 2014-15, the
net cost of the CSO to the State Government was $9.6 million9.
9 Hydro Tasmania 2015 Annual Report, page 18.

ENERGY IN TASMANIA – PERFORMANCE REPORT 2014-15 129
12 FUTURE DIRECTIONS
12.1 Introduction
This Chapter provides a brief overview of the issues that are likely to have a future impact on the Tasmanian electricity supply industry.
12.2 Issues
The Economic Regulator has identified the following issues as likely to impact on the future operations and performance of the Tasmanian electricity supply sector:
The absence of competition in the retail market as at 30 June 2015 and the consequential lack of choice for residential customers.
Implementation of the Energy Strategy as part of the Government’s vision for the State’s future economy. The Strategy has the key objectives of identifying ways in which energy can be used as an economic driver including by securing a stable and sustainable price path that provides relief to consumers and helps grow the economy and attract new investment.
Alignment of TasNetworks’ distribution and transmission regulatory control periods from 1 July 2019. According to the AEMC the rule change:
“…will lead to more efficient investment and operational decisions by
allowing both the transmission and distribution networks to be considered
together when TasNetworks plans its network and when the Australian
Energy Regulator (AER) makes the associated revenue determinations. It
will also result in an ongoing reduction in administrative costs for
TasNetworks and other stakeholders involved in TasNetworks’
transmission and distribution revenue determination processes.”1
Implementation of reforms to the structure of network tariffs which are designed to ensure distribution tariffs reflect the efficient cost of providing network services and provide price signals to all customers so as fully informed decisions about energy use and investment.
Introduction of contestability in relation to metering and related services.
The application of Mandatory Minimum Energy Performance Standards and Energy Rating Labels (ERLs) ensure that equipment below a certain standard is not available for sale, and ERLs allow consumers to make an informed choice when purchasing new appliances. These measures have been very successful, to date, in improving equipment energy efficiency and achieving energy cost savings and are expected to continue to do so into the future. It is estimated
1 http://www.aemc.gov.au/Rule-Changes/Aligning-TasNetworks’-Regulatory-Control-Periods#
130 ENERGY IN TASMANIA – PERFORMANCE REPORT 2014-15
that the Equipment Energy Efficiency (E3) Program will yield a cumulative economic benefit to Australia of between $3.3 billion and $7 billion by 20242. This reflects not only economic and environmental benefits, but also significant savings for households, businesses and industry.
Building energy efficiency is also of particular relevance in Tasmania because of the colder climate and consequentially a greater requirement for space heating. Tasmania has had a mandatory energy efficiency requirement for new housing in place since 2003, when Tasmania adopted a minimum four star requirement. Tasmania increased to a minimum five star requirement in 2010 and from May 2014 adopted the higher six star energy requirement for all new detached houses or units and any attached outbuildings such as garages. New extensions and additions to existing homes are also required to comply with the six star requirements.
Energy efficiency standards for new commercial buildings are incorporated into the Building Code of Australia. In addition, owners of large commercial buildings are required to obtain and disclose a building energy certificate when leasing or selling, which includes a National Australian Built Environment Rating Scheme (NABERS) energy star rating for the building. Other commercial and community buildings can voluntarily obtain star ratings from NABERS or other rating schemes such as Green Star. Tenants and landlords can also voluntarily negotiate green leases.3
Finally, issues that may impact on the reliability of the Tasmanian electricity network in the medium term will be outlined in the Economic Regulator’s 2015 Network Reliability Review report which is scheduled for release in early 2016.
2 http://www.energyrating.gov.au/news/gems-review-released
3 http://ee.ret.gov.au/energy-efficiency/non-residential-buildings/green-leases-private-sector
ENERGY IN TASMANIA – PERFORMANCE REPORT 2014-15 131
13 OVERVIEW OF THE NATURAL GAS INDUSTRY
13.1 Introduction
The Tasmanian natural gas supply industry comprises transmission, distribution and retail sectors.
In 1997 the Tasmanian Government called for expressions of interest from national and international parties with experience in the gas industry to investigate the feasibility of introducing natural gas on a commercial basis. As a result of this process Duke Energy Corporation was selected as the preferred proponent.
Duke Energy’s feasibility study was completed in February 1999 and found the Tasmanian Natural Gas Project was technically and economically feasible. In particular, Duke Energy’s market analysis indicated that there was sufficient demand for natural gas in Tasmania to develop a viable natural gas industry.
On 6 April 2001, Duke Energy entered into a development agreement with the State to bring natural gas to Tasmania. Construction of the transmission pipeline from Longford in Victoria to Bridgewater and Port Latta, via Bell Bay, commenced late in 2001 and was completed in 2002. It became known as the Tasmanian Gas Pipeline Pty Ltd. Powerco Tasmania Pty Ltd (now known as TasGas Networks Pty Ltd) then progressively rolled out a natural gas distribution network to domestic and small to medium sized commercial customers.
Detailed background on the development of the Natural Gas industry in Tasmania is provided in the Energy in Tasmania – Performance Report 2011-12.
13.2 Transmission
Constructed in 2003, the Tasmanian natural gas transmission pipeline runs between Longford (Victoria) and Bell Bay (Tasmania) and then to Port Latta and Hobart (Figure 13.1).
The pipeline transports highly pressurised gas and comprises of approximately 300 km of undersea pipeline from Victoria to Tasmania and 430 km of underground pipeline within Tasmania. Meter stations at several locations on the pipeline allow connection to the distribution network.
13.3 Distribution
The distribution network transports gas, at lower pressures compared to the transmission network, from meter stations to gas consumers. The network comprises approximately 712 km of gas pipe, constructed over two major stages from 2003 to
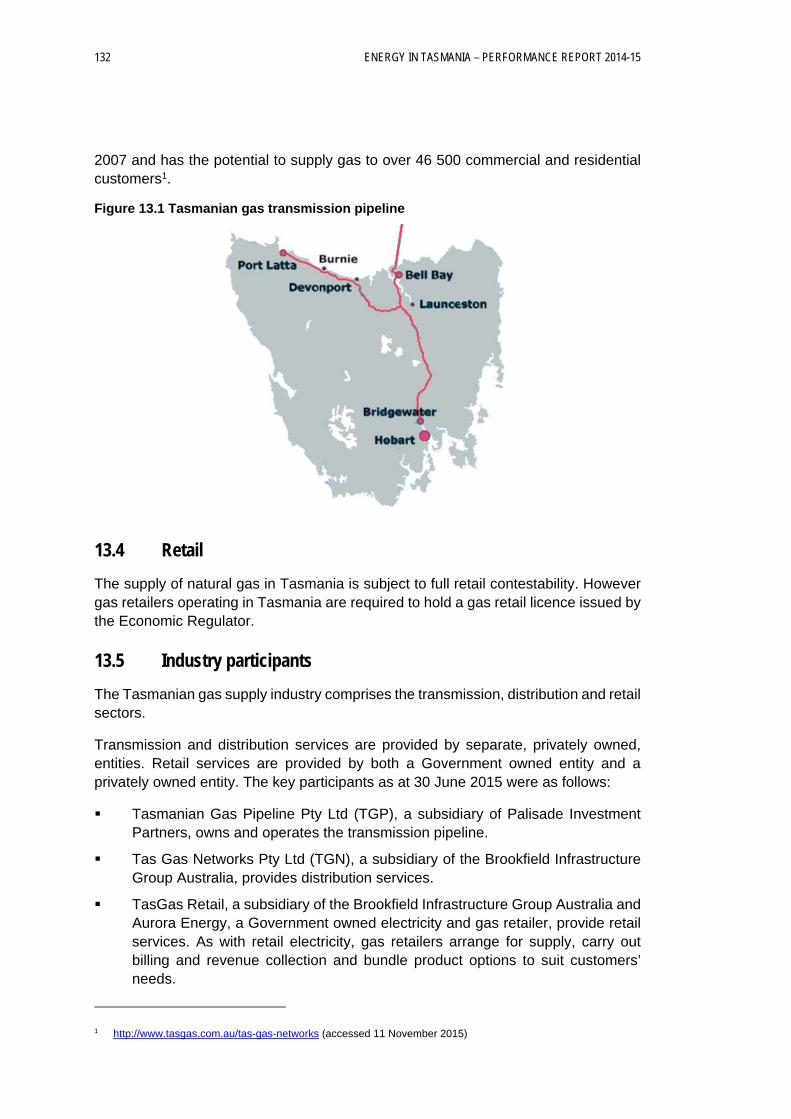
132 ENERGY IN TASMANIA – PERFORMANCE REPORT 2014-15
2007 and has the potential to supply gas to over 46 500 commercial and residential customers1.
Figure 13.1 Tasmanian gas transmission pipeline
13.4 Retail
The supply of natural gas in Tasmania is subject to full retail contestability. However gas retailers operating in Tasmania are required to hold a gas retail licence issued by the Economic Regulator.
13.5 Industry participants
The Tasmanian gas supply industry comprises the transmission, distribution and retail sectors.
Transmission and distribution services are provided by separate, privately owned, entities. Retail services are provided by both a Government owned entity and a privately owned entity. The key participants as at 30 June 2015 were as follows:
Tasmanian Gas Pipeline Pty Ltd (TGP), a subsidiary of Palisade Investment Partners, owns and operates the transmission pipeline.
Tas Gas Networks Pty Ltd (TGN), a subsidiary of the Brookfield Infrastructure Group Australia, provides distribution services.
TasGas Retail, a subsidiary of the Brookfield Infrastructure Group Australia and Aurora Energy, a Government owned electricity and gas retailer, provide retail services. As with retail electricity, gas retailers arrange for supply, carry out billing and revenue collection and bundle product options to suit customers’ needs.
1 http://www.tasgas.com.au/tas-gas-networks (accessed 11 November 2015)
ENERGY IN TASMANIA – PERFORMANCE REPORT 2014-15 133
14 GAS REGULATION
14.1 Introduction
This Chapter outlines the legislative and regulatory framework governing the Tasmanian natural gas supply industry and provides a description of each of the National and Tasmanian regulators involved in regulating the industry and outlines their respective roles and functions.
14.2 Legislative and regulatory framework
The national framework for gas market arrangements governs both the wholesale and retail gas markets of eastern and southern Australia with AEMO being the gas market operator. The AER is the economic regulator for regulated natural gas transmission and distribution pipelines in all states and territories, except those in Western Australia. Tasmania’s gas system is connected to the mainland Australian market through a transmission pipeline from Longford (Victoria) to Bell Bay as outlined in section 13.2.
The Tasmanian market is subject to the National Gas Law (NGL) and the National Gas Rules (NGR), which came into effect on 1 July 2008 in all jurisdictions except Western Australia 1, and provide the overarching national regulatory framework for the gas transmission sector. The NGL is applied in Tasmania through the National Gas (Tasmania) Act 2008. The main purpose of the Act is to establish a framework to enable third parties to gain access to natural gas pipeline services.
However, Tasmania’s gas system, including the transmission and distribution network, are not covered2 ie the NGL does not have any economic regulatory impact on Tasmania’s gas transmission and distribution pipelines.
The NGRs govern access to natural gas pipeline services and elements of broader natural gas markets. The Rules have the force of law and are made under the NGL.
The NGR requires the Australian Energy Market Commission (AEMC) to establish and maintain a register of all pipelines that are, or have been, subject to any form of regulation or exemption from regulation under the NGL or the National Third Party Access Code for Natural Gas Pipelines (the 'old scheme').
The Gas Act 2000 (Gas Act) and Gas Pipelines Act 2000 (Gas Pipelines Act) set out the terms and conditions under which gas licences are granted in Tasmania. In
1 On 1 January 2010, Western Australia became a participating jurisdiction in the National Gas Law (to the extent set out in the National Gas Access (WA) Act 2009).
2 The reference to network assets being ‘covered’ relates to whether those assets are subject to economic regulation.
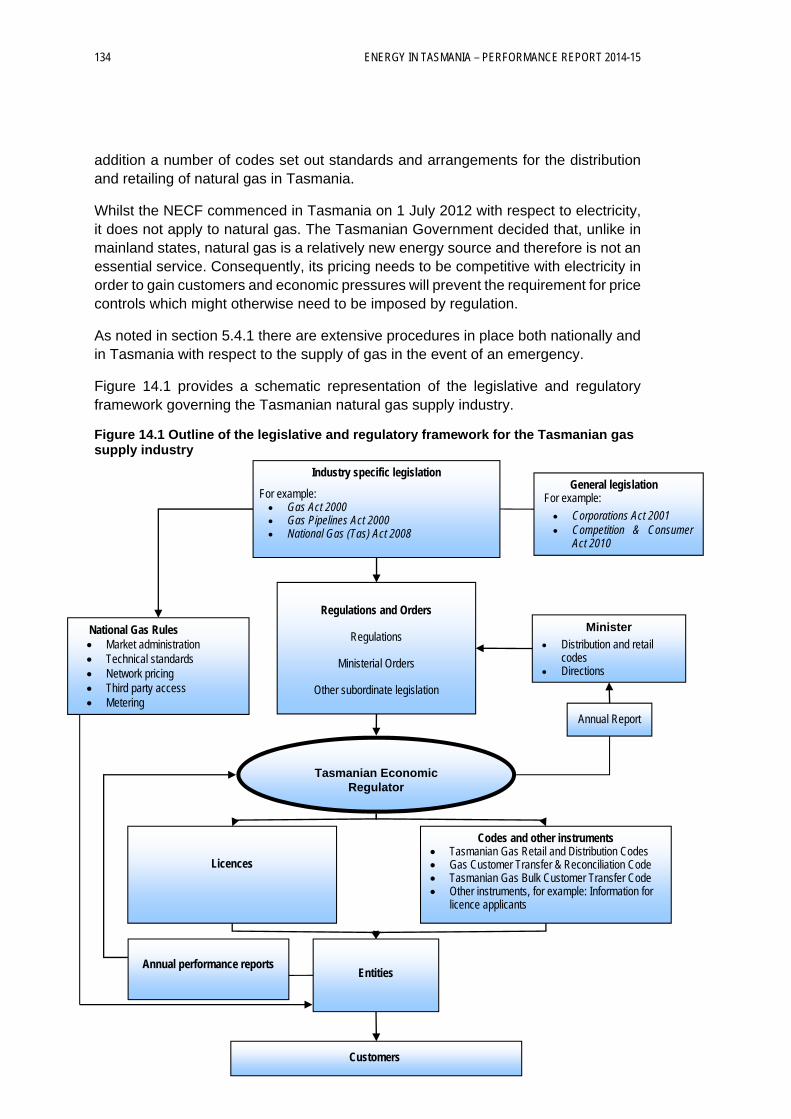
134 ENERGY IN TASMANIA – PERFORMANCE REPORT 2014-15
addition a number of codes set out standards and arrangements for the distribution and retailing of natural gas in Tasmania.
Whilst the NECF commenced in Tasmania on 1 July 2012 with respect to electricity, it does not apply to natural gas. The Tasmanian Government decided that, unlike in mainland states, natural gas is a relatively new energy source and therefore is not an essential service. Consequently, its pricing needs to be competitive with electricity in order to gain customers and economic pressures will prevent the requirement for price controls which might otherwise need to be imposed by regulation.
As noted in section 5.4.1 there are extensive procedures in place both nationally and in Tasmania with respect to the supply of gas in the event of an emergency.
Figure 14.1 provides a schematic representation of the legislative and regulatory framework governing the Tasmanian natural gas supply industry.
Figure 14.1 Outline of the legislative and regulatory framework for the Tasmanian gas supply industry
Industry specific legislation
For example: Gas Act 2000 Gas Pipelines Act 2000 National Gas (Tas) Act 2008
General legislation For example:
Corporations Act 2001 Competition & Consumer
Act 2010
Regulations and Orders
Regulations
Ministerial Orders
Other subordinate legislation
Minister
Distribution and retail codes
Directions
Annual Report
Licences
Codes and other instruments Tasmanian Gas Retail and Distribution Codes Gas Customer Transfer & Reconciliation Code Tasmanian Gas Bulk Customer Transfer Code Other instruments, for example: Information for
licence applicants
Tasmanian Economic Regulator
National Gas Rules Market administration Technical standards Network pricing Third party access Metering
Entities
Annual performance reports
Customers
ENERGY IN TASMANIA – PERFORMANCE REPORT 2014-15 135
14.3 Regulators
14.3.1 Tasmanian Economic Regulator
The Economic Regulator's responsibilities in relation to the regulation of the Tasmanian natural gas supply industry are outlined in the Gas Act and the Gas Pipelines Act and accompanying regulations.
The Gas Pipelines Act recognises the National Third Party Access Code for Natural Gas Pipeline Systems.
The Gas Act provides the Regulator with a number of responsibilities in relation to gas distribution and gas retailing. These responsibilities are supported by the:
Gas Distribution Code which sets the minimum standards for the operation of a distribution system and the terms and conditions under which distribution services are to be provided to gas retail customers.
Gas Retail Code which establishes the minimum terms on which a retailer must sell gas to small customers.
Gas Customer Transfer and Reconciliation Code which sets out obligations concerning the provision of information, the customer transfer process, standards for metering and process for the allocation and reconciliation of gas quantities between retailers.
Under the Gas Act and Gas Pipelines Act, and other related regulatory instruments, the Regulator has a number of functions including:
administering the licensing system for gas entities established by the two Gas Acts;
establishing, monitoring and publishing standards and codes in respect of services provided by gas entities;
reporting on the state of the gas industry; and
granting of gas distribution, retail and pipeline licences.
In carrying out these functions, the Regulator must have regard to the objectives of the legislation, which include to:
facilitating the development of a gas supply industry in Tasmania;
promoting efficiency and competition in the gas supply industry;
promoting the establishment and maintenance of a safe and efficient system of gas distribution and supply;
establishing and enforcing proper standards of safety, reliability and quality in the gas supply industry;
protecting the interests of consumers of gas;
136 ENERGY IN TASMANIA – PERFORMANCE REPORT 2014-15
creating an effective, efficient and flexible regulatory system for the construction and operation of pipeline facilities and of pipelines for transporting natural gas and other substances to which the Act applies;
ensuring as far as reasonably practicable security of supply for users of gas; and
protecting the public from risks inherent in regulated activities.
Additionally, as TGN and TasGas Retail are both owned by Brookfield Infrastructure Group Australia and are therefore related entities, the Economic Regulator has required TGN to develop, publish and implement a ring fencing policy to ensure that TasGas Retail does not:
obtain an unfair advantage over other retailers by having its costs subsidised by the distributor;
receive preferential treatment with respect to the price or terms of carriage of its gas;
receive an unfair advantage through the use of information, both strategic and customer-related belonging to the distributor; and
benefit unfairly from having a common brand name with the distributor.
TGN’s compliance with its ring fencing policy is periodically subject to an independent audit in accordance with the requirements of the Economic Regulator’s regulatory reporting arrangements.
Noting the Economic Regulator’s statutory responsibilities with respect to the natural gas industry, most of the responsibility for implementing and developing regulatory schemes rests with the licensed entities. Consistent with the Economic Regulator’s approach in dealing with other regulated industries the Economic Regulator is ‘light handed’ in its regulation of the gas supply industry and does not intervene in the day-to-day management of the licensed gas entities. Rather, the Regulator seeks to ensure that all stakeholders are provided with sufficient information to properly assess the extent to which the entities meet their respective regulatory obligations. The primary emphasis is on transparency and disclosure with investigations and both monetary and non-monetary sanctions applied as appropriate.
As part of its role, the Regulator is also responsible for issuing gas retail and distribution licences under the Gas Act and pipeline (transmission) licences under the Gas Pipelines Act.
14.3.1.1 Regulatory reporting
Under their respective licences, and/or in accordance with the relevant code, each gas licensee is required to develop compliance and management plans outlining the procedures, practices and strategies for managing and auditing the licensee’s compliance with the applicable legislation, regulations and codes. In accordance with
ENERGY IN TASMANIA – PERFORMANCE REPORT 2014-15 137
the Gas Distribution Code, gas distributors are also required to develop a service plan and to provide an annual report to the Economic Regulator.
These plans are periodically reviewed by an independent appraiser who then prepares a report for the Economic Regulator. These independent reviews are designed to confirm the veracity of the data reported by the entity and to provide an independent assessment of a licensee’s ability to meet its licence obligations.
At the conclusion of the review, the independent appraiser prepares a report for the Economic Regulator setting out its findings including providing an opinion on the level of compliance demonstrated and identifying areas for improvement. The Economic Regulator shares these findings with the Director of Gas Safety and monitors the entity’s progress in implementing the recommended improvements.
The timing and scope of these appraisals is determined by the Economic Regulator based on the outcomes of a risk assessment which considers the outcomes from previous appraisals and the likely impact of any changed circumstances on the entity’s operations and, therefore, compliance with obligations.
14.3.1.2 Performance reporting
Gas licensees are also required to report annually to the Economic Regulator on their performance against a range of measures detailed in the Tasmanian Gas Retail and Gas Distribution Codes.
14.3.2 Tasmanian Energy Ombudsman
Under the Energy Ombudsman Act 1998 (the Ombudsman Act), the Tasmanian Energy Ombudsman is authorised to receive, investigate and resolve complaints concerning any service relating to the sale and supply of gas by a gas entity. The Regulator has a Memorandum of Understanding with the Energy Ombudsman. The Memorandum provides for the sharing of information and the provision of relevant investigation reports.
14.3.3 Director of Gas Safety
The Director of Gas Safety3 and the Gas Standards and Safety (GSS) Unit of WST4 administer the safety and technical aspects of the Gas Act and Gas Pipelines Act.
The Director of Gas Safety ensures that pipelines, pipeline facilities, gas installations and gas appliances are constructed, maintained and operated in a manner that protects persons and property.
3 Delegated to the Director of BSOL.
4 Administration of the Gas Act and Gas Pipelines Act stayed within the Department of Justice but passed from WST to Building Standards and Occupational Licensing on 1 September 2014.
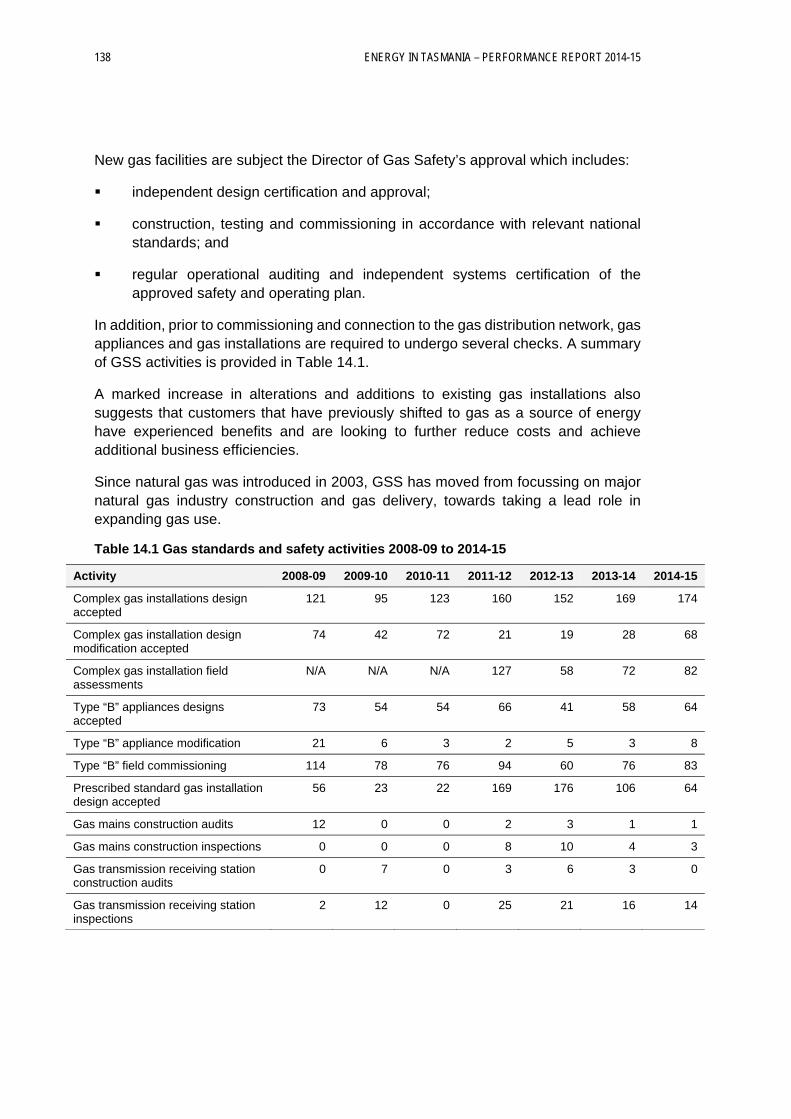
138 ENERGY IN TASMANIA – PERFORMANCE REPORT 2014-15
New gas facilities are subject the Director of Gas Safety’s approval which includes:
independent design certification and approval;
construction, testing and commissioning in accordance with relevant national standards; and
regular operational auditing and independent systems certification of the approved safety and operating plan.
In addition, prior to commissioning and connection to the gas distribution network, gas appliances and gas installations are required to undergo several checks. A summary of GSS activities is provided in Table 14.1.
A marked increase in alterations and additions to existing gas installations also suggests that customers that have previously shifted to gas as a source of energy have experienced benefits and are looking to further reduce costs and achieve additional business efficiencies.
Since natural gas was introduced in 2003, GSS has moved from focussing on major natural gas industry construction and gas delivery, towards taking a lead role in expanding gas use.
Table 14.1 Gas standards and safety activities 2008-09 to 2014-15
Activity 2008-09 2009-10 2010-11 2011-12 2012-13 2013-14 2014-15
Complex gas installations design accepted
121 95 123 160 152 169 174
Complex gas installation design modification accepted
74 42 72 21 19 28 68
Complex gas installation field assessments
N/A N/A N/A 127 58 72 82
Type “B” appliances designs accepted
73 54 54 66 41 58 64
Type “B” appliance modification 21 6 3 2 5 3 8
Type “B” field commissioning 114 78 76 94 60 76 83
Prescribed standard gas installation design accepted
56 23 22 169 176 106 64
Gas mains construction audits 12 0 0 2 3 1 1
Gas mains construction inspections 0 0 0 8 10 4 3
Gas transmission receiving station construction audits
0 7 0 3 6 3 0
Gas transmission receiving station inspections
2 12 0 25 21 16 14
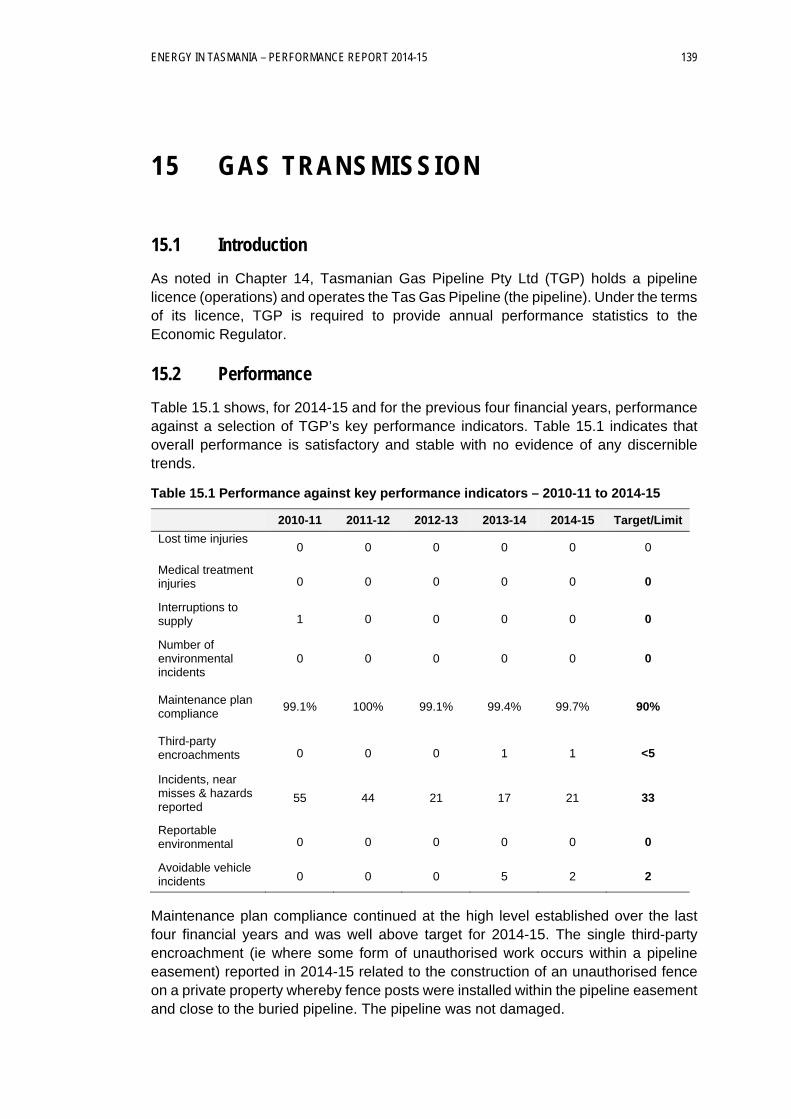
ENERGY IN TASMANIA – PERFORMANCE REPORT 2014-15 139
15 GAS TRANSMISSION
15.1 Introduction
As noted in Chapter 14, Tasmanian Gas Pipeline Pty Ltd (TGP) holds a pipeline licence (operations) and operates the Tas Gas Pipeline (the pipeline). Under the terms of its licence, TGP is required to provide annual performance statistics to the Economic Regulator.
15.2 Performance
Table 15.1 shows, for 2014-15 and for the previous four financial years, performance against a selection of TGP’s key performance indicators. Table 15.1 indicates that overall performance is satisfactory and stable with no evidence of any discernible trends.
Table 15.1 Performance against key performance indicators – 2010-11 to 2014-15
2010-11 2011-12 2012-13 2013-14 2014-15 Target/Limit
Lost time injuries 0 0 0 0 0 0
Medical treatment injuries 0 0 0 0 0 0
Interruptions to supply 1 0 0 0 0 0
Number of environmental incidents
0 0 0 0 0 0
Maintenance plan compliance
99.1% 100% 99.1% 99.4% 99.7% 90%
Third-party encroachments 0 0 0 1 1 <5
Incidents, near misses & hazards reported
55 44 21 17 21 33
Reportable environmental 0 0 0 0 0 0
Avoidable vehicle incidents 0 0 0 5 2 2
Maintenance plan compliance continued at the high level established over the last four financial years and was well above target for 2014-15. The single third-party encroachment (ie where some form of unauthorised work occurs within a pipeline easement) reported in 2014-15 related to the construction of an unauthorised fence on a private property whereby fence posts were installed within the pipeline easement and close to the buried pipeline. The pipeline was not damaged.

140 ENERGY IN TASMANIA – PERFORMANCE REPORT 2014-15
Unaccounted for gas losses increased from 1.0 per cent, in 2013-14, to 1.35 per cent in 2014-15 which was above TGP’s 2014-15 target of 1.0 per cent. This result was primarily due to low gas flows in the pipeline. The Economic Regulator understands that losses vary on a daily basis due to a range of factors.
Additionally, TGP reported that the pipeline is operating at less than 20 per cent of its design capacity due to Hydro Tasmania’s decision to cease using the combined cycle gas turbines at the Tamar Valley Power Station (TVPS) and to reduce usage of the peaker units at the TVPS.
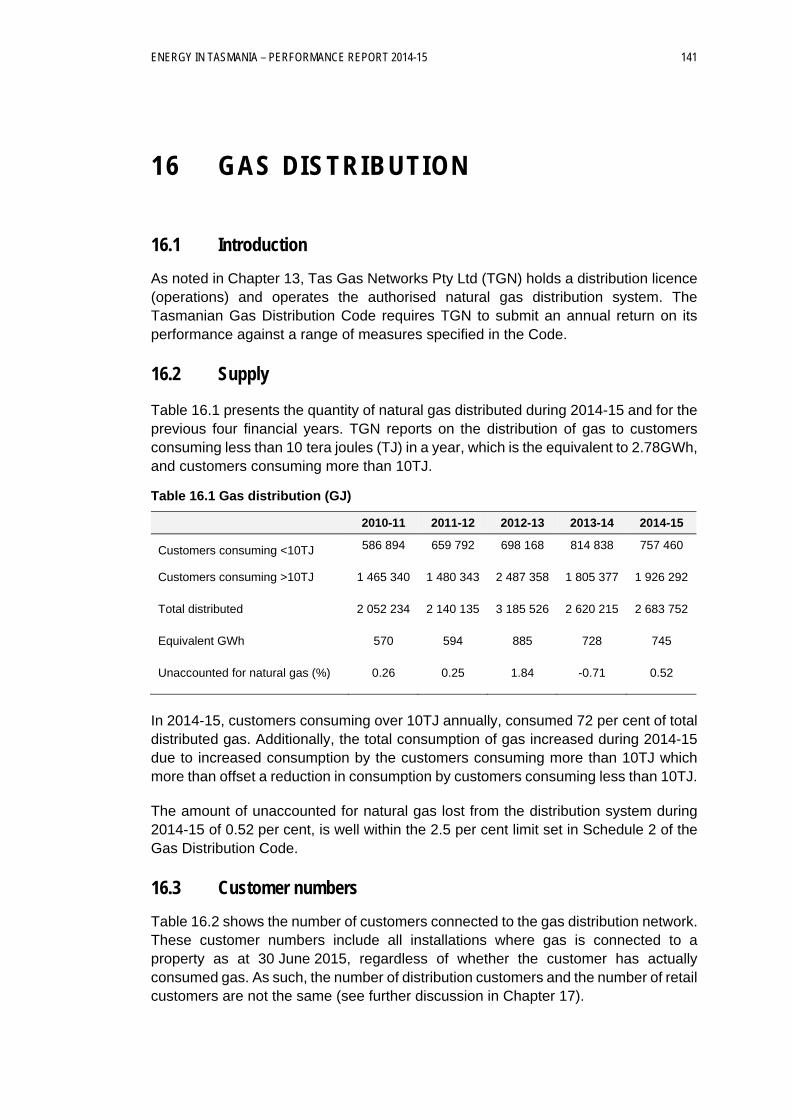
ENERGY IN TASMANIA – PERFORMANCE REPORT 2014-15 141
16 GAS DISTRIBUTION
16.1 Introduction
As noted in Chapter 13, Tas Gas Networks Pty Ltd (TGN) holds a distribution licence (operations) and operates the authorised natural gas distribution system. The Tasmanian Gas Distribution Code requires TGN to submit an annual return on its performance against a range of measures specified in the Code.
16.2 Supply
Table 16.1 presents the quantity of natural gas distributed during 2014-15 and for the previous four financial years. TGN reports on the distribution of gas to customers consuming less than 10 tera joules (TJ) in a year, which is the equivalent to 2.78GWh, and customers consuming more than 10TJ.
Table 16.1 Gas distribution (GJ)
2010-11 2011-12 2012-13 2013-14 2014-15
Customers consuming <10TJ 586 894 659 792 698 168 814 838 757 460
Customers consuming >10TJ 1 465 340 1 480 343 2 487 358 1 805 377 1 926 292
Total distributed 2 052 234 2 140 135 3 185 526 2 620 215 2 683 752
Equivalent GWh 570 594 885 728 745
Unaccounted for natural gas (%) 0.26 0.25 1.84 -0.71 0.52
In 2014-15, customers consuming over 10TJ annually, consumed 72 per cent of total distributed gas. Additionally, the total consumption of gas increased during 2014-15 due to increased consumption by the customers consuming more than 10TJ which more than offset a reduction in consumption by customers consuming less than 10TJ.
The amount of unaccounted for natural gas lost from the distribution system during 2014-15 of 0.52 per cent, is well within the 2.5 per cent limit set in Schedule 2 of the Gas Distribution Code.
16.3 Customer numbers
Table 16.2 shows the number of customers connected to the gas distribution network. These customer numbers include all installations where gas is connected to a property as at 30 June 2015, regardless of whether the customer has actually consumed gas. As such, the number of distribution customers and the number of retail customers are not the same (see further discussion in Chapter 17).
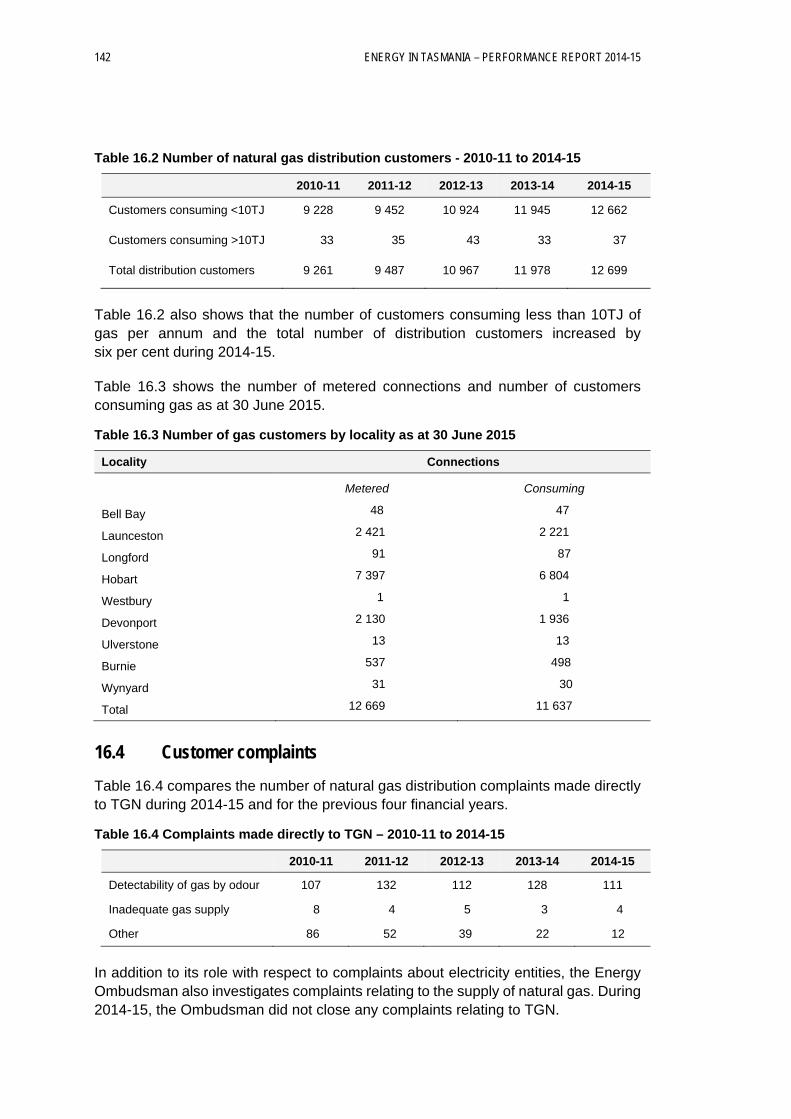
142 ENERGY IN TASMANIA – PERFORMANCE REPORT 2014-15
Table 16.2 Number of natural gas distribution customers - 2010-11 to 2014-15
2010-11 2011-12 2012-13 2013-14 2014-15
Customers consuming <10TJ 9 228 9 452 10 924 11 945 12 662
Customers consuming >10TJ 33 35 43 33 37
Total distribution customers 9 261 9 487 10 967 11 978 12 699
Table 16.2 also shows that the number of customers consuming less than 10TJ of gas per annum and the total number of distribution customers increased by six per cent during 2014-15.
Table 16.3 shows the number of metered connections and number of customers consuming gas as at 30 June 2015.
Table 16.3 Number of gas customers by locality as at 30 June 2015
Locality Connections
Metered Consuming
Bell Bay 48 47
Launceston 2 421 2 221
Longford 91 87
Hobart 7 397 6 804
Westbury 1 1
Devonport 2 130 1 936
Ulverstone 13 13
Burnie 537 498
Wynyard 31 30
Total 12 669 11 637
16.4 Customer complaints
Table 16.4 compares the number of natural gas distribution complaints made directly to TGN during 2014-15 and for the previous four financial years.
Table 16.4 Complaints made directly to TGN – 2010-11 to 2014-15
2010-11 2011-12 2012-13 2013-14 2014-15
Detectability of gas by odour 107 132 112 128 111
Inadequate gas supply 8 4 5 3 4
Other 86 52 39 22 12
In addition to its role with respect to complaints about electricity entities, the Energy Ombudsman also investigates complaints relating to the supply of natural gas. During 2014-15, the Ombudsman did not close any complaints relating to TGN.
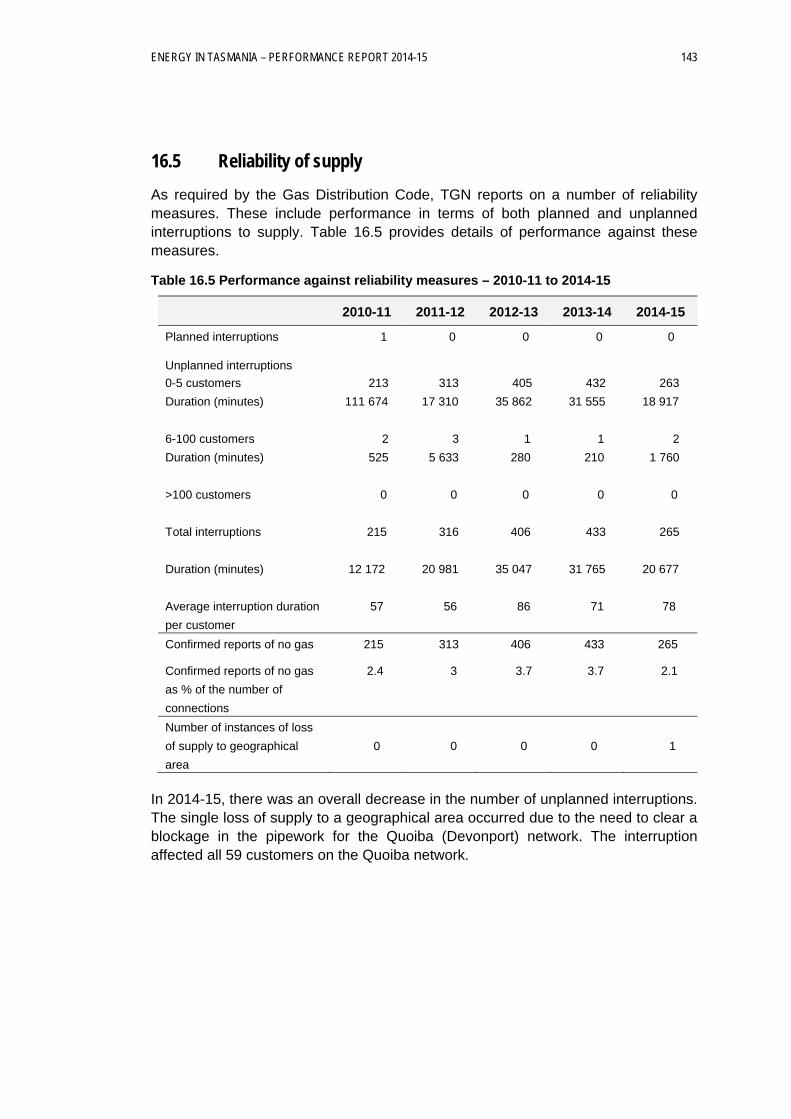
ENERGY IN TASMANIA – PERFORMANCE REPORT 2014-15 143
16.5 Reliability of supply
As required by the Gas Distribution Code, TGN reports on a number of reliability measures. These include performance in terms of both planned and unplanned interruptions to supply. Table 16.5 provides details of performance against these measures.
Table 16.5 Performance against reliability measures – 2010-11 to 2014-15
2010-11 2011-12 2012-13 2013-14 2014-15
Planned interruptions 1 0 0 0 0 Unplanned interruptions
0-5 customers 213 313 405 432 263
Duration (minutes) 111 674 17 310 35 862 31 555 18 917
6-100 customers 2 3 1 1 2
Duration (minutes) 525 5 633 280 210 1 760
>100 customers 0 0 0 0 0
Total interruptions 215 316 406 433 265
Duration (minutes)
12 172
20 981
35 047
31 765
20 677
Average interruption duration
per customer
57
56
86
71
78
Confirmed reports of no gas 215 313 406 433 265
Confirmed reports of no gas
as % of the number of
connections
2.4 3 3.7 3.7 2.1
Number of instances of loss
of supply to geographical
area
0 0 0 0 1
In 2014-15, there was an overall decrease in the number of unplanned interruptions. The single loss of supply to a geographical area occurred due to the need to clear a blockage in the pipework for the Quoiba (Devonport) network. The interruption affected all 59 customers on the Quoiba network.

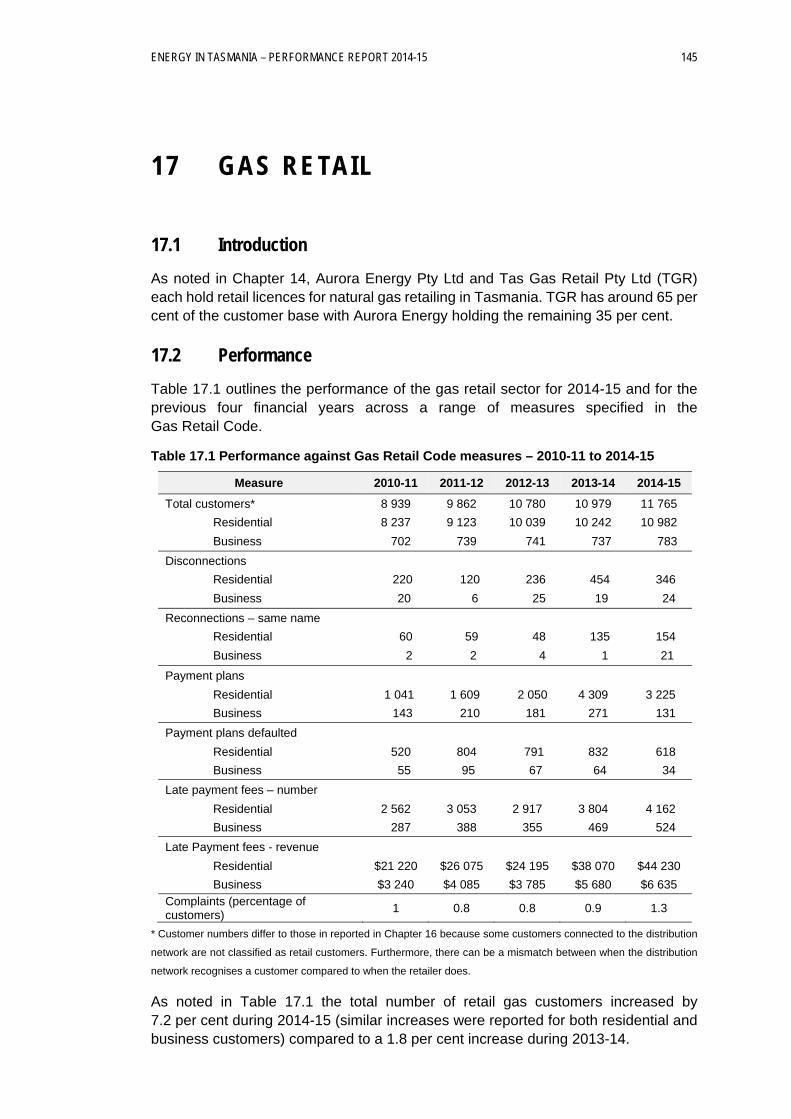
ENERGY IN TASMANIA – PERFORMANCE REPORT 2014-15 145
17 GAS RETAIL
17.1 Introduction
As noted in Chapter 14, Aurora Energy Pty Ltd and Tas Gas Retail Pty Ltd (TGR) each hold retail licences for natural gas retailing in Tasmania. TGR has around 65 per cent of the customer base with Aurora Energy holding the remaining 35 per cent.
17.2 Performance
Table 17.1 outlines the performance of the gas retail sector for 2014-15 and for the previous four financial years across a range of measures specified in the Gas Retail Code.
Table 17.1 Performance against Gas Retail Code measures – 2010-11 to 2014-15
Measure 2010-11 2011-12 2012-13 2013-14 2014-15
Total customers* 8 939 9 862 10 780 10 979 11 765
Residential 8 237 9 123 10 039 10 242 10 982
Business 702 739 741 737 783
Disconnections
Residential 220 120 236 454 346
Business 20 6 25 19 24
Reconnections – same name
Residential 60 59 48 135 154
Business 2 2 4 1 21
Payment plans
Residential 1 041 1 609 2 050 4 309 3 225
Business 143 210 181 271 131
Payment plans defaulted
Residential 520 804 791 832 618
Business 55 95 67 64 34
Late payment fees – number
Residential 2 562 3 053 2 917 3 804 4 162
Business 287 388 355 469 524
Late Payment fees - revenue
Residential $21 220 $26 075 $24 195 $38 070 $44 230
Business $3 240 $4 085 $3 785 $5 680 $6 635
Complaints (percentage of customers)
1 0.8 0.8 0.9 1.3
* Customer numbers differ to those in reported in Chapter 16 because some customers connected to the distribution
network are not classified as retail customers. Furthermore, there can be a mismatch between when the distribution
network recognises a customer compared to when the retailer does.
As noted in Table 17.1 the total number of retail gas customers increased by 7.2 per cent during 2014-15 (similar increases were reported for both residential and business customers) compared to a 1.8 per cent increase during 2013-14.
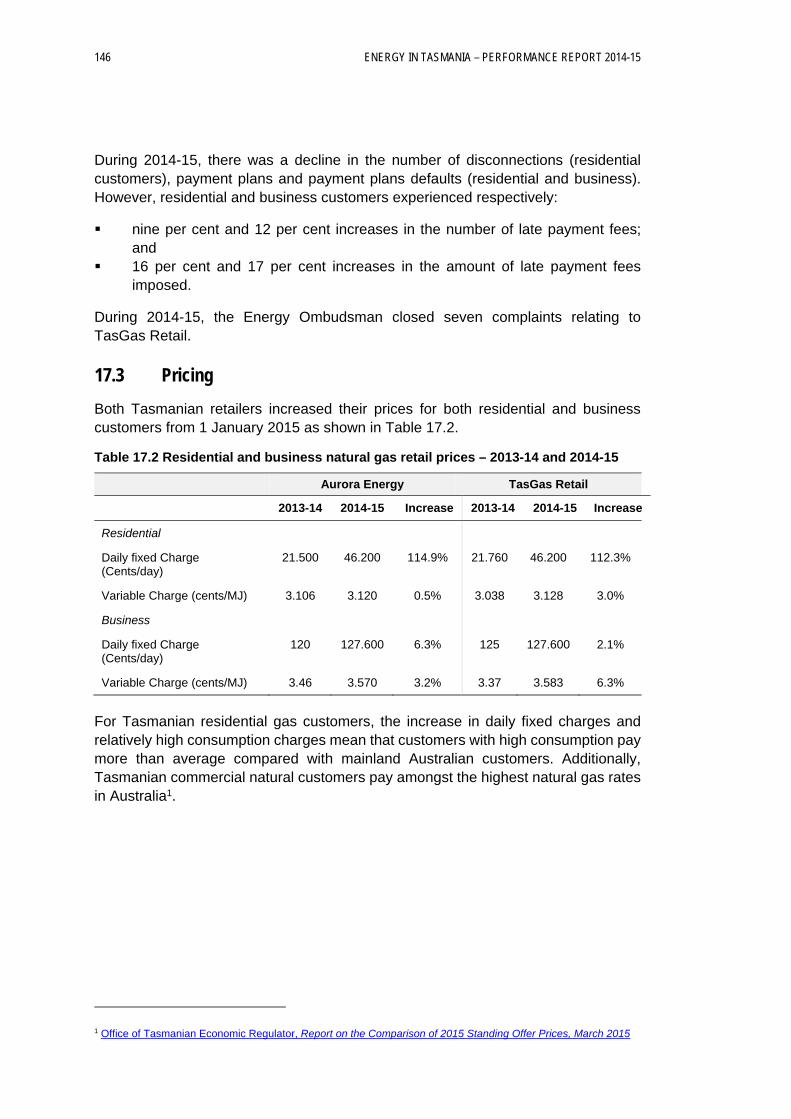
146 ENERGY IN TASMANIA – PERFORMANCE REPORT 2014-15
During 2014-15, there was a decline in the number of disconnections (residential customers), payment plans and payment plans defaults (residential and business). However, residential and business customers experienced respectively:
nine per cent and 12 per cent increases in the number of late payment fees; and
16 per cent and 17 per cent increases in the amount of late payment fees imposed.
During 2014-15, the Energy Ombudsman closed seven complaints relating to TasGas Retail.
17.3 Pricing
Both Tasmanian retailers increased their prices for both residential and business customers from 1 January 2015 as shown in Table 17.2.
Table 17.2 Residential and business natural gas retail prices – 2013-14 and 2014-15
Aurora Energy TasGas Retail
2013-14 2014-15 Increase 2013-14 2014-15 Increase
Residential
Daily fixed Charge (Cents/day)
21.500 46.200 114.9% 21.760 46.200 112.3%
Variable Charge (cents/MJ) 3.106 3.120 0.5% 3.038 3.128 3.0%
Business
Daily fixed Charge (Cents/day)
120 127.600 6.3% 125 127.600 2.1%
Variable Charge (cents/MJ) 3.46 3.570 3.2% 3.37 3.583 6.3%
For Tasmanian residential gas customers, the increase in daily fixed charges and relatively high consumption charges mean that customers with high consumption pay more than average compared with mainland Australian customers. Additionally, Tasmanian commercial natural customers pay amongst the highest natural gas rates in Australia1.
1 Office of Tasmanian Economic Regulator, Report on the Comparison of 2015 Standing Offer Prices, March 2015
ENERGY IN TASMANIA – PERFORMANCE REPORT 2014-15 147
18 FUTURE DIRECTIONS
18.1 Introduction
This Chapter provides a brief overview of the issues that are likely to have a future impact on the Tasmanian natural gas supply industry.
18.2 Issues
The Economic Regulator has identified the following issues as likely to impact on the future of the Tasmanian natural gas sector:
The expiry of the existing TVPS – TPG ‘Take or Pay’ gas supply contract in 2017 will potentially have a financial impact on the gas transmission sector which in turn could flow through to the gas retail sector in terms of price impacts.
While the existing gas network has the potential to supply around 46 000 customers, as of 30 June 2015 there were around 12 700 customers connected. It appears unlikely at the time of writing that the network will be extended without further Government financial support. The under-utilisation of the network may also have future price implications for customers in terms of asset owners’ costs being recovering from a relatively small customer base.

ENERGY IN TASMANIA – PERFORMANCE REPORT 2014-15 149
19 OVERVIEW OF OTHER FUEL SOURCES
Apart from electricity and gas, energy in Tasmania is sourced from other fuel sources including petroleum products, coal and wood. Other fuels account for around half of Tasmania’s total annual energy consumption. The Tasmanian Energy Flow diagram (Figure 1.2 in Chapter 1 of this Report) indicates the importance of these fuels, with petroleum products accounting for approximately 37 per cent of Tasmanian energy consumption in 2013-14, and coal and wood accounting for a further seven per cent and six per cent respectively.
As noted in the Introduction to this Report, information about these other fuel sources has been included in the Report to provide an overall view of the Tasmanian energy industry.
It should be noted that the Tasmanian Economic Regulator is not responsible for any aspect of the regulation of the supply and sale of petroleum, coal or wood in Tasmania and, as such, this Report does not contain any performance reporting in relation to these other fuel sources.

ENERGY IN TASMANIA – PERFORMANCE REPORT 2014-15 151
20 PETROLEUM
20.1 Introduction
Petroleum fuels are a major energy source in Tasmania, with consumption only slightly lower than electricity consumption as shown in the Tasmanian Energy Flow diagram (Figure 1.2 in Chapter 1 of this Report).
The majority of petroleum products are used in the transport sector and the combustion of petroleum fuels is a major contributor to Tasmanian greenhouse gas emissions.
20.2 Regulation
Australia’s liquid fuel markets are regulated through a framework of both national and state legislation covering competition policy, taxation, environmental, health and safety issues.
The Competition and Consumer (Industry Codes - Oilcode) Regulations 2006 (the Oilcode) is a mandatory industry code of conduct prescribed under the Competition and Consumer Act 2010. The Oilcode regulates the conduct of suppliers, distributors and retailers in the downstream petroleum retail industry. The Oilcode provides:
standard terms and conditions for fuel reselling agreements and for franchise and commission agency arrangements;
a consistent national approach to terminal gate pricing arrangements, and transparency in wholesale pricing; and
an independent dispute resolution scheme.
The Australian Competition and Consumer Commission (ACCC) is responsible for monitoring retail prices for petroleum products. The ACCC has powers under Part IV of the Competition and Consumer Act to investigate and take enforcement action where necessary.
As there is no obligation on petrol retailers to report sales there is very little Tasmanian data available to indicate the respective market shares held by different retailers in Tasmania.
As noted in section 5.4 there are extensive procedures in place both nationally and in Tasmania with respect to the supply of petroleum products in the event of an emergency.
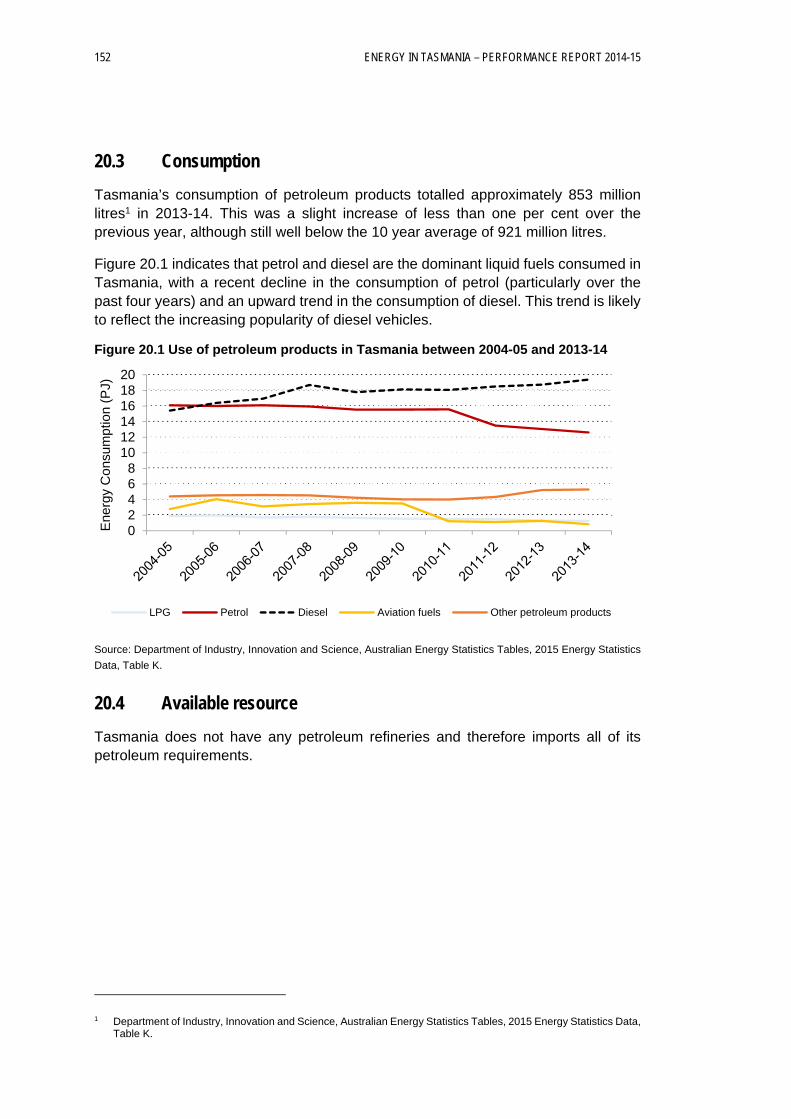
152 ENERGY IN TASMANIA – PERFORMANCE REPORT 2014-15
20.3 Consumption
Tasmania’s consumption of petroleum products totalled approximately 853 million litres1 in 2013-14. This was a slight increase of less than one per cent over the previous year, although still well below the 10 year average of 921 million litres.
Figure 20.1 indicates that petrol and diesel are the dominant liquid fuels consumed in Tasmania, with a recent decline in the consumption of petrol (particularly over the past four years) and an upward trend in the consumption of diesel. This trend is likely to reflect the increasing popularity of diesel vehicles.
Figure 20.1 Use of petroleum products in Tasmania between 2004-05 and 2013-14
Source: Department of Industry, Innovation and Science, Australian Energy Statistics Tables, 2015 Energy Statistics
Data, Table K.
20.4 Available resource
Tasmania does not have any petroleum refineries and therefore imports all of its petroleum requirements.
1 Department of Industry, Innovation and Science, Australian Energy Statistics Tables, 2015 Energy Statistics Data, Table K.
0 2 4 6 8
10 12 14 16 18 20
Ene
rgy
Con
sum
ptio
n (P
J)
LPG Petrol Diesel Aviation fuels Other petroleum products
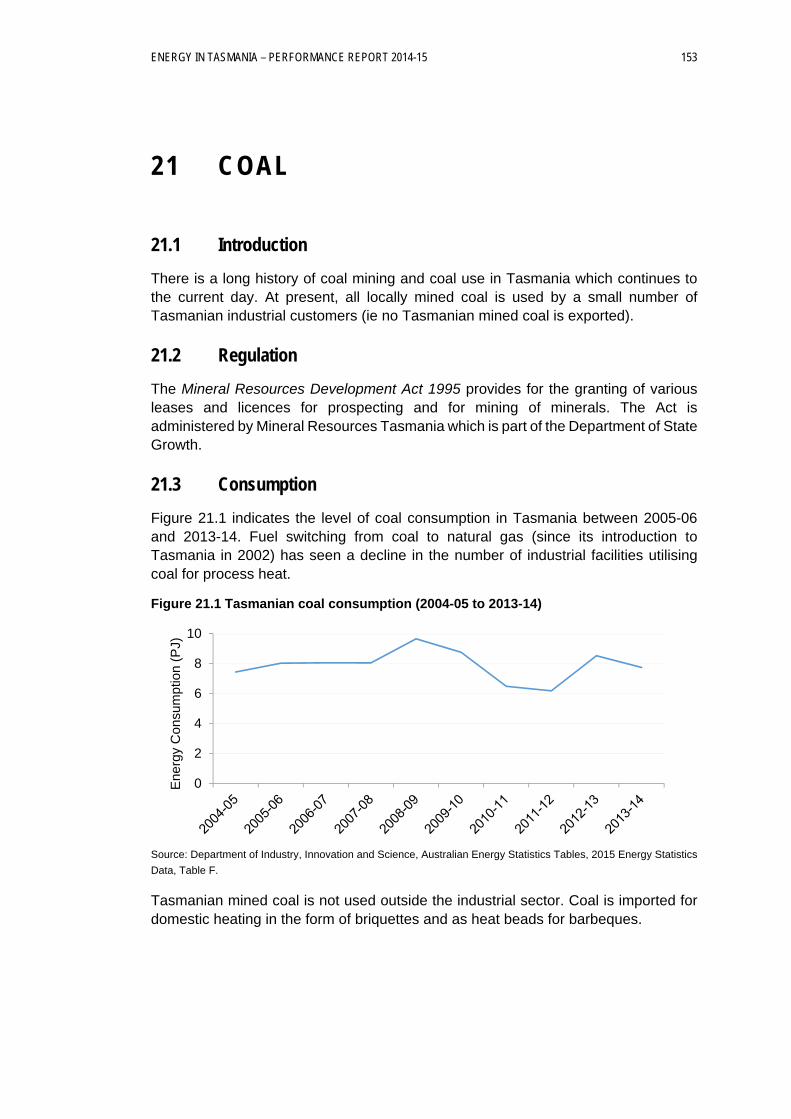
ENERGY IN TASMANIA – PERFORMANCE REPORT 2014-15 153
21 COAL
21.1 Introduction
There is a long history of coal mining and coal use in Tasmania which continues to the current day. At present, all locally mined coal is used by a small number of Tasmanian industrial customers (ie no Tasmanian mined coal is exported).
21.2 Regulation
The Mineral Resources Development Act 1995 provides for the granting of various leases and licences for prospecting and for mining of minerals. The Act is administered by Mineral Resources Tasmania which is part of the Department of State Growth.
21.3 Consumption
Figure 21.1 indicates the level of coal consumption in Tasmania between 2005-06 and 2013-14. Fuel switching from coal to natural gas (since its introduction to Tasmania in 2002) has seen a decline in the number of industrial facilities utilising coal for process heat.
Figure 21.1 Tasmanian coal consumption (2004-05 to 2013-14)
Source: Department of Industry, Innovation and Science, Australian Energy Statistics Tables, 2015 Energy Statistics
Data, Table F.
Tasmanian mined coal is not used outside the industrial sector. Coal is imported for domestic heating in the form of briquettes and as heat beads for barbeques.
0
2
4
6
8
10
Ene
rgy
Con
sum
ptio
n (P
J)
154 ENERGY IN TASMANIA – PERFORMANCE REPORT 2014-15
21.4 Available resource
In-ground known Tasmanian coal resources total approximately 578 million tonnes1 (although the economically extractable resource is significantly lower than this), concentrated mainly in the Fingal region in the State’s north east. This region produces 80-85 per cent of all coal mined in Tasmania with the balance sourced from the Kimbolton Mine near Hamilton.
During 2014 15 the Cornwall Coal Company was the only miner and supplier of coal in Tasmania. Cornwall Coal is a wholly owned subsidiary of Cement Australia and mines black bituminous coal from two underground mines and from two open cut mines. All coal mined in Tasmania is used by Cement Australia’s Railton cement manufacturing facility and Norske Skog’s paper manufacturing facility at Boyer.
21.5 Future directions
Hardrock Coal Mining Pty Ltd is developing a new underground mine in the Fingal Valley (Fingal Tier mine) adjacent to Cornwall Coal’s Duncan Mine lease. Site civil works have commenced and exploration continues to clearly define the economic resource. Once operational, extracted coal will be transported to Bell Bay via rail for export to Asia rather than used in Tasmania.
Energy Investments Pty Ltd has been developing an exploration project near Woodbury in Tasmania’s central midlands. Several drilling and sampling campaigns in 2010, 2012 and 2014 defined an inferred resource of 28.3 million tonnes of coal. The company intends to carry out further work with the aim of developing mining operations to extract the coal resource.
1 Mineral Resources Tasmania, Some Tasmanian coal statistics, 2009.
ENERGY IN TASMANIA – PERFORMANCE REPORT 2014-15 155
22 WOOD
22.1 Introduction
As noted in Figure 1.2 in Chapter 1 of this Report, wood accounts for around six per cent of Tasmania’s total energy supply1.
22.2 Regulation
The supply and sale of firewood is unregulated in Tasmania.
However, the amount of particulate emissions from domestic and commercial wood-heaters, fireplaces and barbeques is regulated under the Environmental Management and Pollution Control (Distributed Atmospheric Emissions) Regulations 2007.
22.3 Consumption
Figure 22.1 below shows that the residential sector was the dominant user of wood (responsible for 71 per cent of consumption in 2013-14), whilst 28 per cent was used in the industrial sector and the remaining one per cent was used in the commercial sector.
The combustion of wood represents just over one third of the total amount of energy supplied to the residential sector, where it is used for space heating and in smaller quantities for cooking and heating water.
The proportion of households utilising a wood heater as the main source of heating has decreased significantly over the past decade, from 38 per cent in 2005 to 26 per cent in 2014. Conversely, the use of electricity as the main source of heating has increased from 55 per cent in 2005 to 66 per cent in 2014. There was, however, a slight reversal of the declining trend in the use of wood in the period from 2008 to 2011, likely in response to significant increases in electricity prices during this period.2
Industrial use of wood as an energy source is predominantly associated with burning wood waste to heat kilns to dry timber in sawmills and timber yards.
Wood pellet heaters are more efficient and produce fewer smoke emissions than heaters burning firewood. A proof of concept pellet mill which was established in Glenorchy in 2013 utilising Tasmanian waste sawdust is now operating on a commercial basis, and supplies approximately 60 per cent of the Tasmanian domestic pellet demand.
1 Department of Industry and Science, Australian Energy Statistics 2015.
2 Australia Bureau of Statistics, Environmental Issues: Energy Use and Conservation, March 2014.
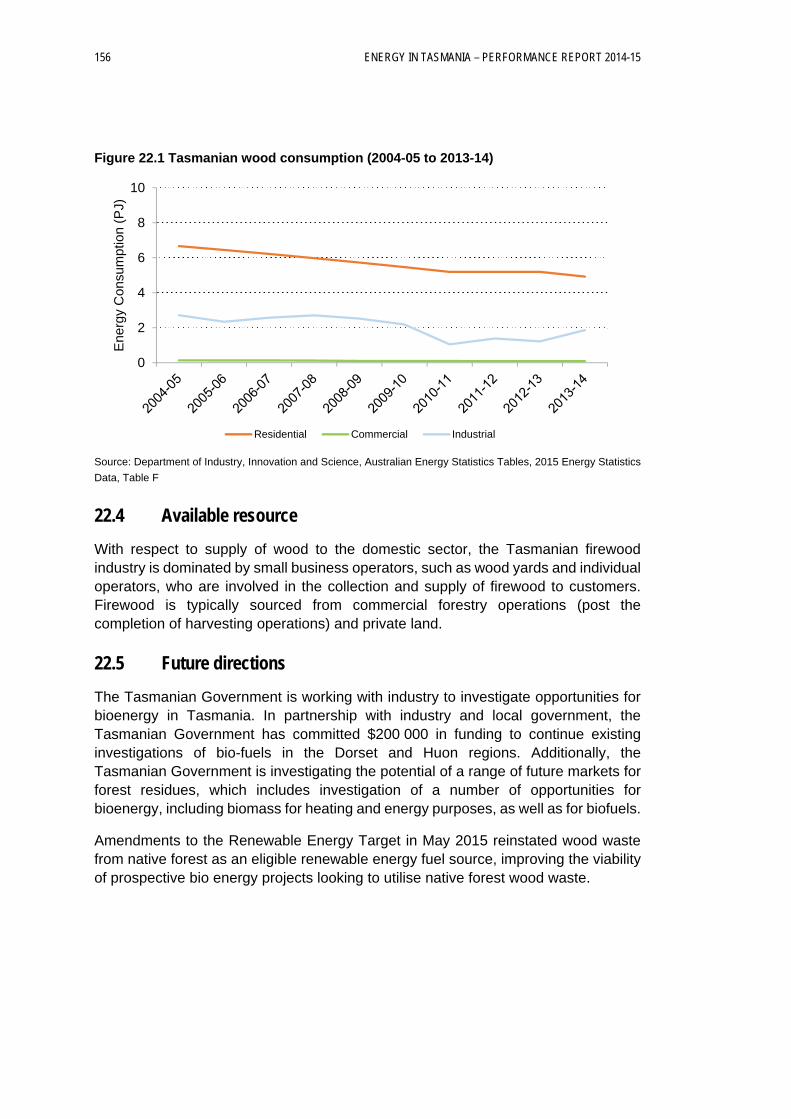
156 ENERGY IN TASMANIA – PERFORMANCE REPORT 2014-15
Figure 22.1 Tasmanian wood consumption (2004-05 to 2013-14)
Source: Department of Industry, Innovation and Science, Australian Energy Statistics Tables, 2015 Energy Statistics
Data, Table F
22.4 Available resource
With respect to supply of wood to the domestic sector, the Tasmanian firewood industry is dominated by small business operators, such as wood yards and individual operators, who are involved in the collection and supply of firewood to customers. Firewood is typically sourced from commercial forestry operations (post the completion of harvesting operations) and private land.
22.5 Future directions
The Tasmanian Government is working with industry to investigate opportunities for bioenergy in Tasmania. In partnership with industry and local government, the Tasmanian Government has committed $200 000 in funding to continue existing investigations of bio-fuels in the Dorset and Huon regions. Additionally, the Tasmanian Government is investigating the potential of a range of future markets for forest residues, which includes investigation of a number of opportunities for bioenergy, including biomass for heating and energy purposes, as well as for biofuels.
Amendments to the Renewable Energy Target in May 2015 reinstated wood waste from native forest as an eligible renewable energy fuel source, improving the viability of prospective bio energy projects looking to utilise native forest wood waste.
0
2
4
6
8
10
Ene
rgy
Con
sum
ptio
n (P
J)
Residential Commercial Industrial
ENERGY IN TASMANIA – PERFORMANCE REPORT 2014-15 A-1
APPENDIX 1 – CONTRIBUTIONS TO THE ECONOMY
Electricity
Table 1 compares employment and returns to the state for those GBEs and SOCs not
involved in the energy supply industry with the three publicly owned entities involved
in the Tasmanian energy supply industry: Hydro Tasmania, TasNetworks and
Aurora Energy. Figure 1 compares the relative returns to the state made by
Hydro Tasmania, Transend (until 30 June 2014), TasNetworks (from 1 July 2014) and
Aurora Energy (Retail and Distribution until 30 June 2014 and Retail only from
1 July 2014) over the past decade.
Returns to the State from GBEs and SOCs in the energy supply industry increased
significantly in 2014-15 compared to 2013-14 with a total of $392.3 million
($355.9 million during 2013-14) returned in the form of income tax equivalents,
dividends and guarantee fees.
Hydro Tasmania’s returns to the State were just under $25 million lower in 2014-15
compared to 2013-14 as a result of lower revenues and lower income tax equivalent
payments. Hydro Tasmania’s contribution as a proportion of the returns made by all
GBE’s was also lower than in previous years due to the Motor Accident Insurance
Board’s contribution of $205.8 million during 2014-15. Hydro Tasmania’s Annual
Report for 2014-15 noted that:
The business benefited in 2014-15 from revenue from renewable energy certificates
linked to higher than normal generation during the latter part of 2014. Compared with
2013–14, we received less revenue in 2014-15. Wholesale electricity prices, including
for small Tasmanian customers, were significantly lower ($10 to $20 per MWh)
without the carbon price. Hydro generation volumes were 31.5 per cent lower than for
2013–14 due partly to a return to more usual generation levels following the end of
the carbon price, but more as a result of significantly lower rainfall than expected1.
However, the reduction in returns from Hydro Tasmania was more than outweighed
by the combined contributions from Aurora Energy and the newly formed
TasNetworks’ of almost $185 million which was around 50 per cent more than the
combined $124 million contributed by Transend and Aurora Energy (Retail and
Distribution) during 2013-14. However, it should be noted that, of the total returns of
$185 million, dividends comprised $61 million and related to the activities of the
predecessor businesses, Aurora Energy (Retail and Distribution) and Transend,
during 2013-14.
1 Annual Report 2015, Hydro Tasmania, page 14.
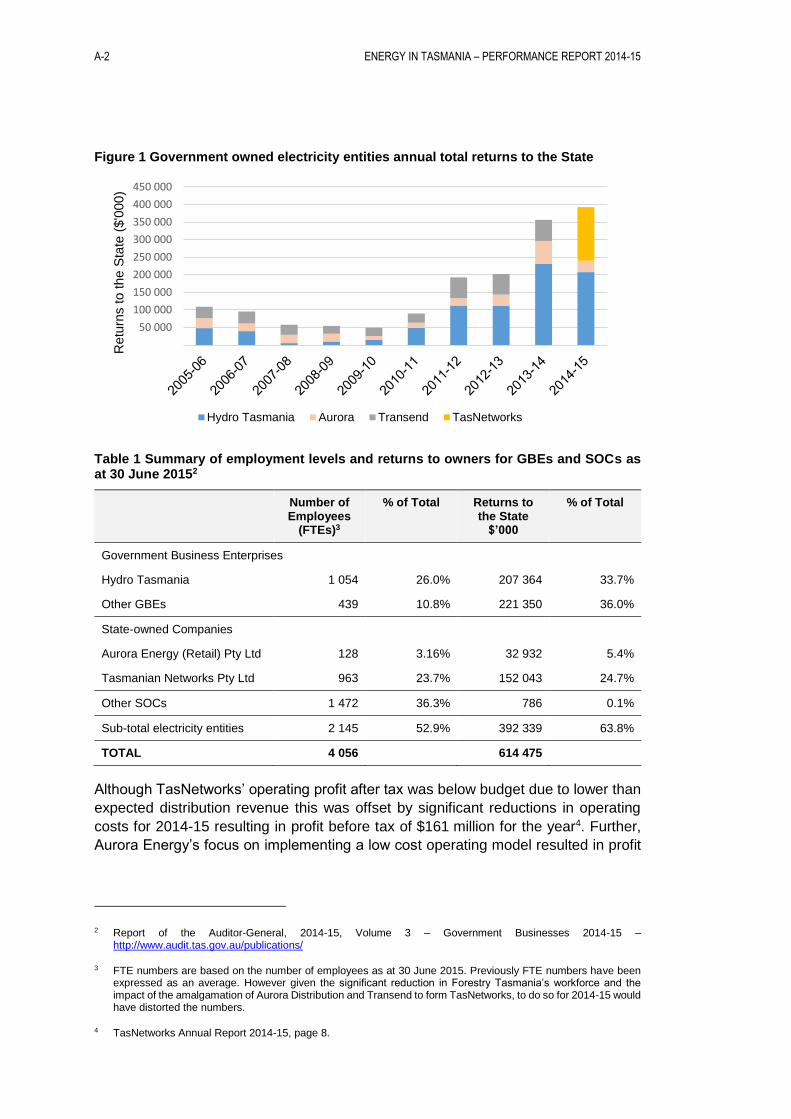
A-2 ENERGY IN TASMANIA – PERFORMANCE REPORT 2014-15
Figure 1 Government owned electricity entities annual total returns to the State
Table 1 Summary of employment levels and returns to owners for GBEs and SOCs as at 30 June 20152
Number of Employees
(FTEs)3
% of Total Returns to the State $’000
% of Total
Government Business Enterprises
Hydro Tasmania 1 054 26.0% 207 364 33.7%
Other GBEs 439 10.8% 221 350 36.0%
State-owned Companies
Aurora Energy (Retail) Pty Ltd 128 3.16% 32 932 5.4%
Tasmanian Networks Pty Ltd 963 23.7% 152 043 24.7%
Other SOCs 1 472 36.3% 786 0.1%
Sub-total electricity entities 2 145 52.9% 392 339 63.8%
TOTAL 4 056 614 475
Although TasNetworks’ operating profit after tax was below budget due to lower than
expected distribution revenue this was offset by significant reductions in operating
costs for 2014-15 resulting in profit before tax of $161 million for the year4. Further,
Aurora Energy’s focus on implementing a low cost operating model resulted in profit
2 Report of the Auditor-General, 2014-15, Volume 3 – Government Businesses 2014-15 – http://www.audit.tas.gov.au/publications/
3 FTE numbers are based on the number of employees as at 30 June 2015. Previously FTE numbers have been expressed as an average. However given the significant reduction in Forestry Tasmania’s workforce and the impact of the amalgamation of Aurora Distribution and Transend to form TasNetworks, to do so for 2014-15 would have distorted the numbers.
4 TasNetworks Annual Report 2014-15, page 8.
50 000
100 000
150 000
200 000
250 000
300 000
350 000
400 000
450 000
Retu
rns t
o t
he S
tate
($'0
00)
Hydro Tasmania Aurora Transend TasNetworks
ENERGY IN TASMANIA – PERFORMANCE REPORT 2014-15 A-3
before tax of $45 million which was more than four times the target of $11.1 million5.
In summary, the combined profit outcomes for the network and retail businesses
resulted in over $112 million being returned to the State in the form of income tax
equivalents during 2014-15.
Gas
With the exception of Aurora Energy in its capacity as a gas retailer, all other entities
involved in the Tasmanian natural gas supply industry are privately owned. Details
similar to those outlined above in relation to the publicly owned electricity entities are
therefore not available.
However, the Economic Regulator understands that as at 30 June 2015 the gas
transmission, gas distribution and gas retail sectors together employed around
100 employees. The natural gas industry is therefore also a significant contributor to
the Tasmanian economy in terms of providing employment. However, the natural gas
supply industry in Tasmania also provides significant indirect benefits through the
provision of an alternative energy source for customers.
Other fuel sources
In terms of employment in relation to other fuel sources, the Economic Regulator
notes that the:
Cornwall Coal Company currently employs around 50 workers;
the number of employees engaged in the wood supply industry is not known;
and
the number of employees involved directly in the distribution and retailing of
petroleum products is difficult to ascertain with any accuracy due to the breadth
of the roles undertaken within the sector and the associated broad nature of the
statistics about the industry.
5 2015 Annual Report, Aurora Energy, page 4.