ENERGY IN TASMANIA PERFORMANCE REPORT 2013 14
206
ENERGY IN TASMANIA – PERFORMANCE REPORT 2013–14 Office of the Tasmanian Economic Regulator
Transcript of ENERGY IN TASMANIA PERFORMANCE REPORT 2013 14

ENERGY IN TASMANIA – PERFORMANCE REPORT
2013–14
Office of the Tasmanian Economic Regulator

Printed January 2015
Office of the Tasmanian Economic Regulator
ISBN 978-0-7246-5354-6
Copyright
© Office of the Tasmanian Economic Regulator
CONTACT DETAILS
Office of the Tasmanian Economic Regulator
Office hours: 8.45am to 5.00pm, Monday to Friday
(except public holidays)
Street address: 5th Floor, 111 Macquarie Street, Hobart, Tasmania 7000
Postal address: GPO Box 770, Hobart, Tasmania 7001
Telephone: (03) 6166 4422 or international +61 3 6166 4422
Email: [email protected]
Website: www.economicregulator.tas.gov.au

ENERGY IN TASMANIA - PERFORMANCE REPORT 2013-14
TABLE OF CONTENTS
TABLE OF CONTENTS ....................................................................................................... 1
ACRONYMS .................................................................................................................................. I
EXECUTIVE SUMMARY ............................................................................................................. V
STATISTICAL SUMMARY ......................................................................................................... IX
1 INTRODUCTION ................................................................................................................ 1
1.1 Background ............................................................................................... 1
1.2 Industry structure ....................................................................................... 2
1.2.1 Electricity ..................................................................................................... 2 1.2.2 Natural Gas .................................................................................................. 5 1.2.3 Petroleum .................................................................................................... 6 1.2.4 Coal.............................................................................................................. 7 1.2.5 Wood ........................................................................................................... 7
1.3 Tasmanian Economy ................................................................................. 7
1.3.1 Introduction .................................................................................................. 7 1.4 Energy supply industry contribution to the Tasmanian economy ............... 7
2 ENERGY USAGE ............................................................................................................ 11
2.1 Energy consumption in Tasmania ........................................................... 11
2.2 Tasmanian energy flow ........................................................................... 12
2.3 Transport ................................................................................................. 12
2.4 Residential .............................................................................................. 14
2.5 Commercial ............................................................................................. 16
2.6 Industrial ................................................................................................. 17
2.7 Greenhouse gas emissions ..................................................................... 19
3 INDUSTRY REGULATION .............................................................................................. 23
3.1 Electricity Regulation ............................................................................... 23
3.1.1 Legislative and regulatory framework ........................................................ 23 3.1.2 NECF Implementation ............................................................................... 25 3.1.3 Participation in the National Electricity Market .......................................... 25

ENERGY IN TASMANIA - PERFORMANCE REPORT 2013-14
3.1.4 Electricity supply industry price controls .................................................... 26 3.1.5 Management and compliance plans .......................................................... 29 3.1.6 Performance reporting ............................................................................... 29
3.2 Gas regulation ......................................................................................... 29
3.2.1 Gas legislative framework ......................................................................... 29 3.2.2 Gas regulation ........................................................................................... 30 3.2.3 Compliance plans ...................................................................................... 32 3.2.4 Performance reporting ............................................................................... 32
3.3 Regulatory bodies ................................................................................... 32
3.3.1 Tasmanian Economic Regulator ............................................................... 32 3.3.2 Australian Energy Market Commission ..................................................... 33 3.3.3 Australian Energy Regulator ...................................................................... 33 3.3.4 Australian Energy Market Operator ........................................................... 34 3.3.5 Tasmanian Energy Ombudsman ............................................................... 34
3.4 Other Government bodies ....................................................................... 34
3.4.1 WorkSafe Tasmania .................................................................................. 34 3.4.2 Department of Treasury and Finance ........................................................ 35 3.4.3 Energy Policy Branch, Department of State Growth ................................. 35
3.5 Climate change policies and regulators ................................................... 36
3.5.1 Carbon pricing mechanism ........................................................................ 36 3.5.2 Renewable Energy Target ......................................................................... 36 3.5.3 Clean Energy Regulator ............................................................................ 37 3.5.4 Clean Energy Finance Corporation ........................................................... 37 3.5.5 Australian Renewable Energy Agency ...................................................... 37 3.5.6 The Climate Change Authority .................................................................. 37
4 INDUSTRY RELATED BODIES ...................................................................................... 39
4.1 Energy Ombudsman ............................................................................... 39
4.2 Electrical safety, standards and licensing ................................................ 40
4.3 Electrical Installation and Infrastructure Safety Compliance .................... 41
4.4 Director of Gas Safety ............................................................................. 41
4.5 OTTER Customer Consultative Committee ............................................. 43
4.6 Committee to Co-ordinate the Response to Energy Supply Emergencies ........................................................................................... 43
4.7 Electricity Technical Advisory Committee ................................................ 43
5 GENERATION ................................................................................................................. 45
5.1 Installed capacity ..................................................................................... 45
5.2 Reserve plant margin .............................................................................. 46
5.3 Hydro generation ..................................................................................... 46

ENERGY IN TASMANIA - PERFORMANCE REPORT 2013-14
5.3.1 Water storage ............................................................................................ 47 5.4 Thermal generation ................................................................................. 50
5.5 Wind generation ...................................................................................... 51
5.6 Embedded generation ............................................................................. 52
5.7 Generation performance .......................................................................... 53
5.7.1 Availability .................................................................................................. 53 5.7.2 Planned outage factor................................................................................ 55 5.7.3 Forced outage factor.................................................................................. 56 5.7.4 System adequacy ...................................................................................... 57 5.7.5 Basslink imports ......................................................................................... 59 5.7.6 Solar generation ........................................................................................ 60
6 TRANSMISSION .............................................................................................................. 61
6.1 Introduction ............................................................................................. 61
6.2 Availability ............................................................................................... 61
6.3 Reliability ................................................................................................. 62
6.4 Comparison with other jurisdictions ......................................................... 64
6.5 Average outage duration ......................................................................... 66
6.6 Connection site performance ................................................................... 66
6.6.1 Unplanned outages.................................................................................... 67 6.6.2 Planned outages ........................................................................................ 68
6.7 Connection site security for firm connection points .................................. 68
6.8 Constraints .............................................................................................. 69
6.8.1 Transmission system constraints .............................................................. 69 6.8.2 Transmission network capacity constraints ............................................... 70 6.8.3 Terminal substation capacity constraints................................................... 70
6.9 Transmission security and planning criteria ............................................. 70
6.10 Basslink Interconnector ........................................................................... 71
6.10.1 Basslink operation ..................................................................................... 72 6.11 Basslink technical performance ............................................................... 73
7 ELECTRICITY DISTRIBUTION ....................................................................................... 75
7.1 Introduction ............................................................................................. 75
7.2 The Distribution Network ......................................................................... 75
7.3 Performance measures ........................................................................... 76
7.3.1 Performance standards ............................................................................. 77 7.3.2 Communities .............................................................................................. 79
7.4 State level performance ........................................................................... 79

ENERGY IN TASMANIA - PERFORMANCE REPORT 2013-14
7.4.1 Major event days ....................................................................................... 80 7.4.2 Performance excluding Major Events Days .............................................. 81 7.4.3 Causes of supply interruptions .................................................................. 82
7.5 Response to interruptions ........................................................................ 85
7.6 Category performance ............................................................................. 85
7.6.1 Critical infrastructure .................................................................................. 86 7.6.2 High Density Commercial .......................................................................... 86 7.6.3 Urban and Regional Centres ..................................................................... 87 7.6.4 Higher Density Rural.................................................................................. 87 7.6.5 Lower Density Rural .................................................................................. 88
7.7 Individual community performance .......................................................... 88
7.7.1 High Density Commercial .......................................................................... 89 7.7.2 Urban and Regional Centres ..................................................................... 90 7.7.3 Higher Density Rural.................................................................................. 91 7.7.4 Lower Density Rural .................................................................................. 92
7.8 Interstate performance comparisons ....................................................... 93
7.8.1 International performance comparison ...................................................... 95 7.9 Guaranteed service levels ....................................................................... 96
7.10 Reliability improvement ........................................................................... 97
7.11 Quality ..................................................................................................... 98
7.12 Embedded Installations ........................................................................... 99
7.13 Customer service .................................................................................. 100
7.13.1 Call centre ................................................................................................ 100 7.13.2 Customer connections ............................................................................. 101 7.13.3 Customer charter ..................................................................................... 101
7.14 Energy Ombudsman ............................................................................. 102
7.15 Financial Performance........................................................................... 102
8 POWER SYSTEM .......................................................................................................... 103
8.1 Introduction ........................................................................................... 103
8.2 Ancillary services ................................................................................... 103
8.2.1 Frequency control ancillary services ....................................................... 103 8.3 Frequency ............................................................................................. 104
8.4 System security ..................................................................................... 105
8.4.1 Significant incidents and AEMO directions .............................................. 105 8.5 System reliability ................................................................................... 106
8.6 Reliability outlook .................................................................................. 107
8.6.1 Hydro generation ..................................................................................... 107 8.6.2 TVPS generation ..................................................................................... 107

ENERGY IN TASMANIA - PERFORMANCE REPORT 2013-14
8.6.3 Wind generation ....................................................................................... 108 8.6.4 System inertia and fault levels ................................................................. 108
8.7 Planning ................................................................................................ 108
8.8 System losses ....................................................................................... 110
8.8.1 Energy losses in the NEM ....................................................................... 110 8.9 Emergency management ...................................................................... 111
9 WHOLESALE MARKET ................................................................................................ 113
9.1 Wholesale market .................................................................................. 113
9.1.1 Spot Market ............................................................................................. 113 9.1.2 Spot market volatility................................................................................ 117 9.1.3 Derivatives Market ................................................................................... 117
9.2 Wholesale market competition ............................................................... 118
9.3 Market trends ........................................................................................ 119
9.3.1 Volume and price ..................................................................................... 119 9.3.2 Demand ................................................................................................... 122 9.3.3 Basslink ................................................................................................... 124
9.4 Frequency control ancillary services ...................................................... 126
9.5 Inter-regional revenues.......................................................................... 129
10 RETAIL .......................................................................................................................... 131
10.1 Introduction ........................................................................................... 131
10.2 Electricity retail market .......................................................................... 131
10.2.1 Residential customers ............................................................................. 131 10.2.2 Aurora Pay As You Go ............................................................................ 132
10.3 Retail market activity indicators ............................................................. 134
10.3.1 Disconnection rate ................................................................................... 134 10.3.2 Centrepay ................................................................................................ 135 10.3.3 Call centre performance .......................................................................... 135 10.3.4 Customer complaints ............................................................................... 135
10.4 Customers experiencing payment difficulties ......................................... 136
10.4.1 Customers repaying a debt ..................................................................... 136 10.4.2 Payment plans ......................................................................................... 137 10.4.3 Hardship program .................................................................................... 137 10.4.4 Community service arrangements ........................................................... 137 10.4.5 Private welfare arrangements .................................................................. 138 10.4.6 Financial performance ............................................................................. 138
10.5 Retail competition .................................................................................. 138
10.5.1 Retail market 2013-14 ............................................................................. 138 10.5.3 Retail tariffs for residential and small business customers ......... 138

ENERGY IN TASMANIA - PERFORMANCE REPORT 2013-14
10.6 Market transfers .................................................................................... 139
11 BASS STRAIT ISLANDS ............................................................................................... 141
11.1 Introduction ........................................................................................... 141
11.2 Regulatory arrangements ...................................................................... 141
11.3 Generation ............................................................................................ 142
11.3.1 Flinders Island ......................................................................................... 142 11.3.2 King Island ............................................................................................... 142
11.4 Distribution networks ............................................................................. 143
11.5 Performance .......................................................................................... 143
11.5.1 Flinders Island ......................................................................................... 143 11.5.2 King Island ............................................................................................... 148
11.6 Retail ..................................................................................................... 152
11.6.1 Performance reporting ............................................................................. 152 11.6.2 Price comparison ..................................................................................... 152
11.7 Community Service Obligation (CSO) ................................................... 153
11.8 Renewable Energy Fund ....................................................................... 153
12 DEMAND SIDE PARTICIPATION ................................................................................. 155
12.1 Embedded generation ........................................................................... 155
12.1.1 Solar Photovoltaic .................................................................................... 156 12.1.2 Tasmanian feed-in tariff arrangements .................................................... 157 12.1.3 Solar hot water ......................................................................................... 157 12.1.4 Large embedded generators ................................................................... 158
12.2 Energy efficiency and conservation ....................................................... 159
12.2.1 Equipment energy efficiency ................................................................... 160 12.2.2 Building energy efficiency ........................................................................ 160 12.2.3 Tasmanian Government assistance for vulnerable households ............. 161 12.2.4 Industry .................................................................................................... 162 12.2.5 Demand side participation and system security ...................................... 162
13 NATURAL GAS ............................................................................................................. 165
13.1 Regulation ............................................................................................. 165
13.2 Transmission ......................................................................................... 166
13.3 Distribution ............................................................................................ 167
13.3.1 Technical ................................................................................................. 167 13.3.2 Customers ............................................................................................... 167 13.3.3 Complaints ............................................................................................... 168 13.3.4 Reliability of supply .................................................................................. 168

ENERGY IN TASMANIA - PERFORMANCE REPORT 2013-14
13.4 Retail ..................................................................................................... 169
14 PETROLEUM ................................................................................................................. 171
14.1 Regulation ............................................................................................. 171
14.2 Supply and use ..................................................................................... 171
14.3 Future .................................................................................................... 173
14.3.1 Biodiesel .................................................................................................. 174
15 COAL ............................................................................................................................. 175
15.1 Available resource ................................................................................. 175
15.2 Supply and use ..................................................................................... 175
15.3 Regulation ............................................................................................. 177
15.4 Future .................................................................................................... 177
16 WOOD ........................................................................................................................... 179
16.1 Supply and use ..................................................................................... 179
16.2 Future trends ......................................................................................... 180
16.2.1 Energy Uses for Wood Waste ................................................................. 181
17 FUTURE DIRECTIONS.................................................................................................. 183
17.1 Industry outlook summary ..................................................................... 183


ENERGY IN TASMANIA – PERFORMANCE REPORT 2013-14 I
ACRONYMS
Term Meaning within the context of this report
ACCC Australian Competition and Consumer Commission
AEMC Australian Energy Market Commission
AEMO Australian Energy Market Operator
AER Australian Energy Regulator
AETV Aurora Energy Tamar Valley Pty Ltd
AGL The Australian Gas Light Company
APAYG Aurora Pay as You Go
BBPS Bell Bay Power Station
BPL Basslink Pty Ltd
BSI Bass Strait islands
CAIDI Customer average interruption duration index
CBD Central Business District
CCGT Combined Cycle Gas Turbine
CNG Compressed Natural Gas
COAG Council of Australian Governments
CPI Consumer Price Index
CCRESE Committee to Co-ordinate the Response to Energy Supply Emergencies
CSA Community Service Agreement
CSO Community Service Obligation
DSP Demand-side participation
ECAC Energy Coordination and Advisory Committee
ESAA Energy Supply Association of Australia
ESC Essential Services Commission of Victoria
ESI Energy Supply Industry
ESI Act Electricity Supply Industry Act 1995 (Tas)
ESIS Electrical Safety Inspection Service
ETAC Electricity Technical Advisory Committee
ETSA ETSA Utilities, a member of the Cheung Kong group of companies and the distribution entity in South Australia
FCAS Frequency Control Ancillary Service
GBE Government Business Enterprise
GJ Gigajoule

II ENERGY IN TASMANIA – PERFORMANCE REPORT 2013-14
Term Meaning within the context of this report
GSL Guaranteed Service Level
GWh Gigawatt hour (=1 thousand MWh or 1 million kWh)
HEC Hydro-Electric Corporation
HV High voltage: a voltage greater than 1 kV
kV Kilovolts (= 1 000 volts)
kVA Kilovolt ampere (measure of apparent power)
kWh Kilowatt hour (= 1 kW used continuously for 1 hour)
LGC Large-scale Generation Certificate
LOS Loss of Supply
LNG Liquefied natural gas
LPG Liquefied petroleum gas
LV Low voltage: a voltage less than 1 kV
MCE Ministerial Council on Energy
MED Major Event Day
MW Megawatt
MWh Megawatt hour (=1 thousand kWh)
N/A Not available or not applicable
NECF National Energy Customer Framework
NEM National Electricity Market
NEMMCO National Electricity Market Management Company (now AEMO)
NER National Electricity Rules
OCCC OTTER Customer Consultative Committee
OCGT Open Cycle Gas Turbine
OEPC Office of Energy Planning and Conservation
OLA Occupational Licensing under the Occupational Licensing Act 2005
O&M Operating and maintenance
OFGEM Office of Gas and Electricity Markets (United Kingdom)
ORER Office of the Renewable Energy Regulator
OTTER Office of the Tasmanian Energy Regulator
RECs Renewable Energy Certificates
PPM Retail Retail Code for Prepayment Meters
RoA Return on assets
RoLR Retailer of last resort
SAIDI System average interruption duration index
SAIFI System average interruption frequency index

ENERGY IN TASMANIA – PERFORMANCE REPORT 2013-14 III
Term Meaning within the context of this report
SOC State-owned Company
STCs Small-scale Technology Certificates
TasCOSS Tasmanian Council of Social Services
TEC Tasmanian Electricity Code
TGP Tasmanian Gas Pipeline
TJ Terajoule (= 1 thousand gigajoules)
TNSP Transmission Network Service Provider
TPA Trade Practices Act 1974
TVPS Tamar Valley Power Station
TWh Terawatt hour (= 1 million MWh)
WST Workplace Standards Tasmania


ENERGY IN TASMANIA – PERFORMANCE REPORT 2013-14 V
EXECUTIVE SUMMARY
The Tasmanian Economic Regulator is required, under the Electricity Supply Industry Act 1995 and Gas Act 2000, to establish and monitor proper standards of safety, reliability and quality in the supply of electricity and natural gas, with the important objective of protecting the interests of electricity and natural gas consumers.
This Report aims to keep the Tasmanian energy entities publicly accountable for their performance and provides a comprehensive independent review of the service standards, quality, reliability and pricing of the Tasmanian energy supply industry. In combination with a licensing system that ensures only competent participants deliver energy services and a robust planning system, this Report gives consumers confidence that the industry continues to operate with integrity.
In the Tasmanian electricity market, which is dominated by State owned entities, the Regulator, in conjunction with the Australian Energy Regulator, is responsible for ensuring that customers in the transmission, distribution and retail sectors receive an appropriate level of service at an efficient cost. The Regulator is also responsible for promoting efficiency and competition in both the electricity and natural gas markets. From 1 January 2014, the Regulator also commenced regulating Hydro Tasmania’s wholesale market activities as part of the former Government’s response to the Electricity Expert Panel’s findings from its review of the Tasmanian electricity sector.
In 2013-14, the three major electricity supply industry entities - Hydro Tasmania, Transend Networks and Aurora Energy - employed 2 234 people and returned around $355 million in dividends, taxes and guarantee fees to the State.
Generation
Hydro generation accounts for around 76 per cent of Tasmania’s installed generation capacity. During 2013-14, Hydro Tasmania generated approximately 86 per cent of electricity in Tasmania compared to 81 per cent in 2012-13. Hydro Tasmania’s water storage levels decreased to around 28.1 per cent of capacity as at 30 June 2014 compared to 33.6 per cent as at 30 June 2013. The increase in generation and reduction in storage levels was due to Hydro Tasmania taking advantage of its renewable energy generator status under the carbon pricing mechanism. There were consequential significant increases in Basslink exports during the year with around 26 per cent of the energy generated in Tasmania during 2013-14 exported via Basslink.
Due to the commissioning of the Musselroe Wind farm in October 2013, wind generation accounted for approximately 7.2 per cent of electricity generated in Tasmania for 2013-14, an increase from 3.6 per cent in 2012-13. Tasmania’s installed generation capacity for wind generation is 308 MW or around nine per cent of installed generation capacity.

VI ENERGY IN TASMANIA – PERFORMANCE REPORT 2013-14
Since the ownership of the Tamar Valley Power Station (TVPS) transferred to Hydro Tasmania on 1 June 2013, the use of TVPS has changed to periodic use rather than a baseload generator. That is, whilst installed capacity remains unchanged at 387MW the change of use resulted in TVPS generating 893MWh of energy during 2013-14 which is around half of the energy generated in 2012-13.
Transmission
During 2013-14, Transend performance improved with respect to the number of loss of supply (LOS) events. In the previous four years, the number of LOS events over one system minute has been over the annual limit of two events, whereas in 2013-14 there weren’t any LOS events of over one system minute.
Distribution
The distribution network performance declined in terms of the frequency and duration of interruptions during 2013-14.The distribution network was impacted by six major day events (MEDs) during 2013-14, with storms having a significant impact on network reliability. The number of communities where the network performance was classified as ‘poor performing’ increased in 2013-14 due to the duration or frequency of outages exceeding the limits set out in the Tasmanian Electricity Code (TEC). Due to the impact of the MEDs in 2013-14, guaranteed service level scheme payments made to customers totalled $2.9 million, a significant increase over the $1.4 million paid out in 2012-13.
Retail
As at 30 June 2014, there were 268 369 retail customers, an increase of 0.47 per cent from the previous period. The number of residential customer installations increased by 0.9 per cent, but the number of business customer installations decreased by 2.05 per cent. Similarly, the number of Aurora Pay As You Go (APAYG) customers declined for the sixth consecutive year with 30 640 customers as at 30 June 2014, or approximately 13.3 per cent of the residential customer base. After a significant increase in 2012-13, the number of customers on payment plans, the hardship program and repaying a debt decreased during 2013-14.
The Regulator completed two price comparisons in 2013-14, the 2013 APAYG comparison report (APAYG rates from 27 July 2013) August 2013 and the Comparison of 2014 Australian Standing Offer Energy Prices March 2014. The reports showed that electricity prices in Tasmania are in the low to mid range of prices available across Australia at typical household levels of consumption. The reports also noted that non-concession APAYG customers pay slightly more per year for electricity compared to those on standard regulated tariffs.
Due to changes in the way Aurora Energy recorded complaints, complaints data for 2013-14 cannot be compared to previous years’ complaint data. The Energy Ombudsman received 440 energy complaints, a five per cent decrease compared to 2013-14. Billing continued to be the major source of complaints accounting for 68 per cent of all complaints.

ENERGY IN TASMANIA – PERFORMANCE REPORT 2013-14 VII
Bass Strait Islands
Electricity supply performance on King Island and Flinders Island varied during 2013-14. For King Island, the duration of interruptions for two feeders exceeded the TEC limits for the period. For Flinders Island, generation reliability improved in 2013-14 compared to 2012-13 due to the replacement of the No.1 diesel generator unit.
Natural Gas
The number of customers connecting to the gas network continues to grow although at a slower rate compared to previous years. There were 10 979 gas customers as at 30 June 2014, an increase of 1.8 per cent from the previous year. In 2013-14, there was a substantial increase in the number of disconnections, the number of customers on payment plans and the number of customers subject to late payment fees.
Future directions
As of 1 July 2014, all customers on mainland Tasmania have the option of entering into a market retail contract with Aurora or a new entrant retailer.
Aurora Distribution and Transend Networks were amalgamated into a single network business, TasNetworks, on 1 July 2014.
With the abolition of the carbon pricing mechanism with retrospective effect from 1 July 2014, it is expected flows over Basslink will return to something closer to a balance between imports and exports. It is noted however that since 1 July 2014 low rainfall and the current level of storages has affected the flows over Basslink.
On 4 December 2014, the Government announced that it intended to sell TVPS’s combined cycle gas unit.
In conclusion, the Regulator trusts that this Report will be a useful reference document for those working in the energy supply industry and those with an interest in the industry.


ENERGY IN TASMANIA – PERFORMANCE REPORT 2013-14 IX
STATISTICAL SUMMARY
Electricity Industry 2011-12 2012-13 2013-14
Electricity supply industry GBE/SOC employees 2 300 2 239 2 234
Electricity GBE/SOC Total Returns to State (’000) $199 411 $201 936 $355,921
Total electricity generated 10 393 GWh 12 786 GWh 13 813 GWh
Peak electricity generated 1 705 MW 1 642 1 685
Total installed electricity generating capacity 2 798 MW 2 808 2 976
Aurora Pay As You Go connections 35 561 33 158 30 640
Renewable Electricity Certificates claimed 866 0541 1 665 7361 2 640 5651
Average Tasmanian region wholesale electricity price2 $32.82/MWh $48.76/MWh $42.34/MWh
Total electricity system SAIDI3 265 minutes 455 minutes 418 minutes
Total electricity system SAIFI2 2.43 2.31 2.82
Electricity distribution network SAIDI 214 minutes 243 minutes 399 minutes
Electricity distribution network SAIFI 1.90 1.82 2.61
Number of non-compliant4 communities 18/101 18/101 11/101
Transmission network minutes off supply 8.72 20.49 2.92
Transmission line circuit availability (critical) (%) 98.38 99.67 99.42
Transmission line circuit availability (non-critical) (%) 99.52 99.31 99.47
Customers receiving Guaranteed Service Level payments 8 680 15 940 26 665
Aurora Energy customer complaints (retail) 567 468 4 306
Residential electricity disconnections per ’000 customers 0.85 4.6 6.8
Natural Gas Industry
Total natural gas supplied 2 140 135 GJ 3 185 526 GJ 2 620 215 GJ
Total energy supplied as natural gas 594.5 GWh 884.9GWh 728 GWh
Total gas customers 9 487 10 967 11 978
Gas distribution network SAIDI 2.21 minutes 3.2 minutes 2.65 minutes
Gas distribution network SAIFI 0.033 0.037 0.036
1 Large-scale Generation Certificates only. 2 Annual volume weighted average price. 3 Including transmission, generation and third party events. 4 Against the TEC standards for frequency or duration of outages for each of the defined 101 communities. 5 Result was affected by the suspension of disconnections in 2011-12 whilst the new billing system was
introduced.


ENERGY IN TASMANIA – PERFORMANCE REPORT 2013-14 1
1 INTRODUCTION
1.1 Background The Electricity Supply Industry Act 1995 (ESI Act) gives the Tasmanian Economic Regulator (the Regulator) certain functions to protect the interests of electricity consumers through, among other things, establishing and enforcing appropriate standards of safety, security, reliability and quality. The Regulator is also responsible for gas regulation under the Gas Act 2000 (Gas Act), Gas Pipelines Act 2000 (Gas Pipelines Act), and Gas Pipelines Access (Tasmania) Act 2000.
Public reporting is an important tool to protect consumers and promote efficiency and competition. The Energy in Tasmania Performance Report 2013-14 (the Report) continues the established system of performance reporting which includes identifying trends and, where possible, includes interstate comparisons. In this report, the energy supply industry is predominantly a combination of the electricity and natural gas supply industries as illustrated in Figure 1.1, however it also includes sections, prepared by the Department of State Growth, on petroleum, coal and wood to present a whole of industry report.
Figure 1.1 Tasmania’s electricity and gas industry
Mainland retailers
Mainland generators
Longford, Victoria
Victorian NEM Region
Tasmanian Gas Pipeline
BASSLINK
Hydro generation
AETV Power
Tas Gas Networks
Gas retailers Other retailers Aurora Energy
Tasmanian NEM Region
ENERGY CUSTOMERS
Wind Other generation
Embedded generation

2 ENERGY IN TASMANIA – PERFORMANCE REPORT 2013-14
The Report, therefore, aims to provide consumers with a comprehensive review of the performance of the Tasmanian energy industry, covering all major energy sources used in Tasmania.
1.2 Industry structure
1.2.1 Electricity
The electricity supply industry comprises the generation, transmission, distribution and retail sectors. The generation sector is open to competition, while monopoly participants provide regulated transmission and distribution services. During 2013-14, business customers consuming more than 50 megawatt hours (MWh) per year at a specified site were contestable and therefore able to choose their electricity retailer while non-contestable1 customers remained on regulated tariffs with a single retailer. Retail competition for all customers was introduced on 1 July 2014.
Within this framework, the three main participants in the Tasmanian electricity supply industry in 2013-14 were:
Hydro-Electric Corporation (HEC), trading as Hydro Tasmania, is a Government Business Enterprise (GBE) that holds a licence for electricity generation on mainland Tasmania as well as responsibility for generation, distribution and retailing on King and Flinders Islands. Effective from 1 June 2013 Hydro Tasmania took over ownership and operation of the gas-fired Tamar Valley Power Station (TVPS) from Aurora Energy. Hydro Tasmania also operates and partly owns the wind farms at Studland Bay and Bluff Point (known together as Woolnorth) and the Musselroe wind farm.
Transend Networks Pty Ltd2 (Transend), a State-owned Company (SOC) operating under Corporations Law, held an exclusive licence for electricity transmission on mainland Tasmania until 30 June 2014.
Aurora Energy Pty Ltd (Aurora Energy), a SOC operating under Corporations Law, holds a retail authorisation for mainland Tasmania and is also the regulated offer retailer for Tasmania therefore had an exclusive franchise to sell electricity to non-contestable customers during 2013-14. Aurora Energy also held a distribution license until 30 June 20143.
1.2.1.1 Generation
In addition to the hydro-electric and gas generating units owned by Hydro Tasmania there are number of smaller generating schemes including mini-hydro, wind
1 All residential customers and business customers with annual electricity consumption of less than 50 MWh.
2 The network businesses of Aurora and Transend amalgamated to form Tasmanian Networks Pty Ltd on 1 July 2014.
3 See above.

ENERGY IN TASMANIA – PERFORMANCE REPORT 2013-14 3
turbines, distributed generation and cogeneration. Taking into account the Basslink Interconnector (Basslink) import capacity, Tasmania has access to approximately 3 278 megawatts (MW) of installed generating capacity.
1.2.1.2 Transmission (including Basslink)
Figure 1.2 shows Transend’s transmission network which comprises 2 334 route km and 3 494 circuit km of transmission lines in Tasmania.
Figure 1.2 Transend’s transmission network
A number of industrial customers are either supplied directly from Transend Networks’ transmission substations or via dedicated distribution high voltage (HV) feeders.
Basslink Pty Ltd (BPL) holds a transmission licence for the section of Basslink located within Tasmania’s jurisdiction. Basslink connects the Tasmanian power system to the Victorian power system via overhead transmission lines and a high-voltage direct current submarine cable. Interconnection allows Tasmanian generated power to be sold into the National Electricity Market (NEM) and power to be imported into Tasmania from mainland Australia.
1.2.1.3 Distribution
The distribution system supplies electricity to all but the largest customers. There are a small number of HV customers who have their own substations and take electricity supply directly at 22 kilovolts (kV) or 11 kV.
The distribution system comprises approximately 15 042 km of overhead high voltage (44 kV, 33 kV, 22 kV or 11 kV) powerlines and 1 183 km of underground high voltage powerlines. These HV powerlines, referred to as HV feeders, supply 32 146 distribution substations, which transform the electricity to 230/400 volts, and distribute electricity at low voltage (LV). There are 4 982 km of overhead low voltage powerlines and 1 196 km of underground low voltage powerlines.

4 ENERGY IN TASMANIA – PERFORMANCE REPORT 2013-14
The HV distribution network comprises predominantly rural overhead lines with underground cables located mostly within central business districts, and in subdivisions and commercial centres in urban/suburban areas.
Rural feeders tend to be longer than urban feeders at between 50 and 500 km, and of a radial nature with limited ability to interconnect with other adjacent rural feeders. Urban feeders have greater flexibility to source alternative supplies to the majority of customers on the feeder due to greater interconnection within the network in urban areas.
1.2.1.4 Retail
Electricity retailers on-sell electricity purchased from the NEM, and transported, from the generator via the transmission and distribution network, to electricity consumers. Retailers provide services to electricity customers such as arranging for supply, carrying out billing and revenue collection, and bundling product options to suit customers’ needs.
Tasmania has been progressively introducing competition in the retail market since 1 July 2006, when the largest industrial customers were first able to select their retailer. Retail competition has been rolled out to groups of customers (called ‘tranches’) based on their electricity consumption. As at 30 June 2014 there were three retailers operating in Tasmania (Aurora, ERM Power Pty Ltd and Progressive Green).
The history of the progressive introduction of retail competition in Tasmania is provided in Table 1.1.
Table 1.1 Retail contestability timetable
Introduction of contestability
Tranche Electricity consumption
Approximate number
Indicative customer type
1 July 2006 1 20 GWh/yr 19 Mineral processors
1 July 2007 2 4 GWh/yr 46 Large industrial facilities and commercial complexes
1 July 2008 3 0.75 GWh/yr 330 Medium factories and smaller commercial complexes
1 July 2009 4 0.15 GWh/yr 1 660 Small factories and large offices
1 July 2011 5a 0.05 GWh/yr 3 460 Small business and medium-sized offices
1 July 2014 5 Any 226 055 Residential and remaining business customers
1.2.1.5 Electricity consumption
Total electricity supplied by the Tasmanian power system (excluding losses) is around 10 670 gigawatt hours (GWh) per annum. System load is highly seasonal, with daily peaks varying from around 1 300 MW in mid-summer to almost 1 800 MW in mid-winter. An indication of the local concentration of system load is provided in Figure 1.3 which highlights the load centres around the State.

ENERGY IN TASMANIA – PERFORMANCE REPORT 2013-14 5
Figure 1.3 Tasmanian load centres
273
1.2.1.6 Large industrial customers
Large industrial customers, involved in industries such as metal smelting and mining, dominate Tasmanian electricity consumption. The average aggregate demand for these customers is around 700 MW per annum equating to about 40 per cent of the State’s maximum demand and 60 per cent of total energy consumption.
1.2.1.7 Bass Strait Islands
Regulation of the Tasmanian electricity industry is divided into two supply areas:
Tasmanian mainland and Bruny Island; and
Bass Strait Islands (BSI) comprising King Island and Flinders Island.
Due to the relative isolation of the BSI, operating conditions are different from those on mainland Tasmania and, as a consequence, a different regulatory regime applies.
1.2.2 Natural Gas
The natural gas supply industry comprises transmission, distribution and retail sectors. The provision of natural gas in Tasmania is not subject to price regulation however entities wanting to operate in any sector of the industry are required to be licensed by the Regulator.
1.2.2.1 Transmission
The Tasmanian natural gas transmission pipeline (Figure 1.4), runs between Longford (Victoria) and Bell Bay and then to Port Latta and Hobart and was constructed in 2003.

6 ENERGY IN TASMANIA – PERFORMANCE REPORT 2013-14
Figure 1.4 Tasmanian gas transmission pipeline
The pipeline, which transports highly pressurised gas, comprises approximately 300 km of undersea pipeline from Victoria to Tasmania and 430 km of underground pipeline within Tasmania. Meter stations at several locations on the pipeline allow connection of the distribution network.
1.2.2.2 Distribution
The distribution network transports gas, at lower pressures compared to the transmission network, from meter stations to gas consumers. The network comprises approximately 712 km of gas pipe, constructed over two major stages from 2003 to 2007, and supplies gas to over 43 000 of the State’s commercial and residential natural gas customers.
1.2.2.3 Retail
There was full retail contestability from the commencement of natural gas supply in Tasmania. While there is no price regulation, customer protection arrangements do apply. As at 30 June 2014 there were two gas retail licence holders – Aurora Energy and Tas Gas Retail Pty Ltd (Tas Gas). As occurs with retail electricity, gas retailers arrange for supply, carrying out billing and revenue collection and bundling product options to suit customers’ needs.
1.2.3 Petroleum
As Tasmania does not produce or refine petroleum, all petroleum products used in Tasmania are imported having been refined either overseas or in other states.
Terminals located at Hobart, Bell Bay, Burnie and Devonport have an annual throughput of 842 mega litres with all distribution between terminals and retail outlets occurring by road. As there is no obligation on petrol retailers to report sales there is very little Tasmanian data available to indicate the respective market shares held by different retailers in Tasmania.

ENERGY IN TASMANIA – PERFORMANCE REPORT 2013-14 7
1.2.4 Coal
The Cornwall Coal Company (a subsidiary of Cement Australia) is the only supplier of coal mined in Tasmania. Cornwall Coal mines black bituminous coal from two underground mines and from two open cut mines. All coal mined in Tasmania is used by Cement Australia’s Railton cement manufacturing facility and Norske Skog’s paper manufacturing facility at Boyer.
1.2.5 Wood
The firewood industry is unregulated in Tasmania. The industry is dominated by small business operators, such as wood-yards and individual operators, who are involved in the collection and supply of firewood to customers. Firewood is typically sourced from commercial forestry operations (post the completion of harvesting operations) and private land.
Wood is used primarily for space heating in Tasmania, predominantly in residential dwellings with minor usage in the commercial sector. Wood4 is also used in the timber industry to fuel kilns to dry timber.
1.3 Tasmanian Economy
1.3.1 Introduction
The energy supply industry is of fundamental importance to the Tasmanian economy through employment and investment, and contributes to the State Budget by way of taxes and dividends. In addition, the price and reliability of energy supplied impacts significantly on the economic performance of other sectors of the Tasmanian economy.
The energy supply industry in Tasmania is exposed to national and international economic developments. With the Basslink electricity interconnector, the gas transmission pipeline, and greater sea and air access, Tasmania's economy has become more closely integrated with the Australian mainland economy. State economic performance and, to a lesser degree, growth in population and household expenditure, also have an impact on aggregate energy usage and on the economic performance of the energy supply industry.
1.4 Energy supply industry contribution to the Tasmanian economy The energy supply industry is a significant sector in the Tasmanian economy providing direct employment, investment and revenue to the State.
Table 1.2 and Figure 1.5 compares employment and returns to the state for those GBEs and SOCs not involved in the energy supply industry with the three entities
4 Most of this fuel is a waste by-product of sawmilling

8 ENERGY IN TASMANIA – PERFORMANCE REPORT 2013-14
involved in the energy supply industry: Hydro Tasmania; Aurora Energy and Transend5.
Table 1.2 Summary of GBEs and SOCs as at 30 June 20146
Number of employees
% of total
Returns to the State
% of total
FTEs $’000
Government Business Enterprises
Hydro Tasmania 1 114 26.7% 231 488 58.4%
Other GBEs 501 12.0% 40 127 10.1%
State-owned Companies
Aurora Energy Pty Ltd 886 21.2% 64 560 16.3%
Transend Networks Pty Ltd 234 5.6% 59 873 15.1%
Other SOCs 1,437 34.4% 268 0.1%
Sub-total electricity entities 2 234 53.5% 355 921 89.8%
TOTAL 4 172 396 316
Figure 1.5 GBE and SOC returns to the State
Returns to the State from GBEs and SOCs in the energy supply industry increased significantly in 2013-14 compared to 2012-13 with a total of $355.9 million ($201.9 million during 2012-13) returned in the form of taxes, dividends and guarantee fees.
5 Tasmanian Networks Pty Ltd incorporated 4 February 2014 but did not commence trading until 1 July 2014.
6 Report of the Auditor – General, 2014-15 Volume 3 - Government Businesses 2013-14 - http://www.audit.tas.gov.au/publications/

ENERGY IN TASMANIA – PERFORMANCE REPORT 2013-14 9
Figure 1.6 illustrates Hydro Tasmania’s, Aurora Energy’s and Transend’s combined annual returns to the State since 2003-04. The price on carbon, increased generation and increased returns from Momentum Energy (Hydro Tasmania’s mainland retail business) is reflected in Hydro Tasmania’s returns to the State7 increasing substantially during 2013-14. The increase in Aurora Energy’s returns to the State is due to increased dividends and a significant increase in income tax equivalent payments.
Figure 1.6 Government owned electricity entities annual total returns to the State
7 Through significant increases in both dividends and income tax equivalent payments.


ENERGY IN TASMANIA – PERFORMANCE REPORT 2013-14 11
2 ENERGY USAGE
2.1 Energy consumption in Tasmania Most of Tasmania’s energy is consumed by the manufacturing (34 per cent) and transport sectors (27 per cent) with the residential sector consuming just 13 per cent of energy. Figure 2.1 and Figure 2.2 show the break-down of energy consumed in Tasmania by end use sector and fuel type respectively.
Figure 2.1 Tasmanian energy consumption by end use sector (2012-13)
Source: Bureau of Resources and Energy Economics, Australian Energy Statistics 2014.
Figure 2.2 Tasmanian energy consumption by fuel type (2012-13)
Source: Bureau of Resources and Energy Economics, Australian Energy Statistics 2014.
Agriculture 3%
Mining 3%
Manufacturing 34% Energy &
services 10%
Construction 1%
Transport 27%
Commercial 8%
Residential 13% Other
1%
Liquid fuels 38% Wood
6%
Coal 6%
Electricity 36%
Natural gas 14%

12 ENERGY IN TASMANIA – PERFORMANCE REPORT 2013-14
2.2 Tasmanian energy flow Figure 2.3 reflects Tasmanian energy flow from supply sectors to end use sectors. The relative contribution of each is indicated by the thickness of the line.
Figure 2.3 Tasmanian energy flows 2012-13
Source: All data derived from Bureau of Resources and Energy Economics, Australian Energy Statistics 2014 Energy Update, Table F, except electricity supply and Basslink data (from TasNetworks) and some gas data.
Notes: a) All residential and commercial vehicle use is included within the transport end use sector.
b) Electricity network losses are calculated based on an estimation of 8%.
c) Liquid Fuels includes 0.5 PJ of Biofuels
Total energy supply in Tasmania in 2012-13 was approximately 112 petajoule (PJ).1 As demonstrated in Figure 2.3, in Tasmania, residential wood use exceeds residential electricity use. This is despite the fact that wood is inefficient at converting energy (e.g into residential end use requirements such as heating) compared to electricity.
2.3 Transport Road transport is responsible for the majority of energy consumed in the Tasmanian transport sector. In contrast to the mainland, energy consumption per capita is significantly lower for Tasmanian rail, water and air transport sectors.
1 One petajoule is equivalent to approximately 278 GWh or 278 million KWh.
ThermalPower Station
Elec
tric
ity
Net
wor
k
Transport
Residential
Commercial
Industrial
Basslink Export
Network LossesThermal Losses
Liquid Fuels
Coal
Wood
Gas
Hydro
Wind
Basslink ImportEmbedded
Generation
SUPPLY END USE

ENERGY IN TASMANIA – PERFORMANCE REPORT 2013-14 13
This is largely due to the absence of a passenger rail network in Tasmania and international flights to and from Tasmania. A higher proportion of Tasmania’s land based freight is carried by road (87.5 per cent) compared to rail (12.5 per cent)2 relative to the Australian mainland average where a similar freight tonnage is carried by both rail and road.3 Figure 2.4 demonstrates the break-down of road transport energy consumption by vehicle type.
Figure 2.4 Tasmanian road transport energy consumption by vehicle type 2011-12
Source: Department of Climate Change and Energy Efficiency. Australian Greenhouse Emissions Information System. Accessed 4/11/14 and Department of Climate Change and Energy Efficiency. Australian National Greenhouse Accounts Factors. July 2013.
The majority of motor vehicles in the road transport sector are fuelled by petrol (see Figure 2.5). Diesel is the dominant fuel used to power heavy and medium duty trucks and buses. In Tasmania, the rail and water transport sectors use diesel only in comparison to mainland metropolitan passenger rail networks which are typically powered by electricity while coal and fuel oil are used in some parts of the mainland for water transport.
2 Tasmanian Department of Infrastructure, Energy and Resources, Tasmanian Freight Survey, 2008-09.
3 Australian Department of Infrastructure and Transport, Australian Infrastructure Statistics Yearbook 2012.
Cars 58.46% Light
Commercial Vehicles 16.78%
Buses and Trucks 24.40%
Motorcycles 0.37%

14 ENERGY IN TASMANIA – PERFORMANCE REPORT 2013-14
Figure 2.5 Tasmanian road transport energy consumption by fuel type 2012-13
Source: Bureau of Resources and Energy Economics, Australian Energy Statistics 2014.
2.4 Residential Figure 2.6 provides an indication of the overall residential energy consumption per capita for different Australian states and territories. There is a very clear correlation between climate and residential energy consumption, with the colder southernmost states (Tasmania and Victoria) having significantly higher (more than double) energy consumption than the warmer northern states and territories (Queensland and Northern Territory). Areas of New South Wales, South Australia and Western Australia have relatively moderate climates and energy consumption closer to the national average.
LPG 1%
Petrol 50%
Diesel 36%
Aviation fuels 12%
Fuel Oil 1%

ENERGY IN TASMANIA – PERFORMANCE REPORT 2013-14 15
Figure 2.6 Residential energy consumption per capita
Sources: Bureau of Resources and Energy Economics, Australian Energy Statistics 2014 and Australian Bureau of Statistics, Australian Demographic Statistics, March 2014.
On a per household basis, residential energy consumption is declining in most states and territories, a trend which is expected to continue over the coming decade.4
In Tasmania electricity is the dominant energy source for most residential end use categories including water heating, cooking and appliances. Wood use for heating is significant with a little over one third of residential energy consumption coming from wood. Natural gas consumption is very low, reflecting the low penetration of the natural gas distribution network into the residential market. Bottled liquefied petroleum gas (LPG) is used by some households to replace natural gas for space heating and cooking.
Compared to Tasmanian households, the average mainland household has a much higher consumption of natural gas which is the dominant energy source for space heating and accounts for half of water heating requirements. In contrast, the use of wood for residential space heating is much lower on the mainland than in Tasmania.
According to a survey carried out by the Australian Bureau of Statistics, Tasmanian households spent an average of $100 per week on energy in 2012, which is comparable to the national average of $99 per week. 5
4 Department of Environment, Water, Heritage and the Arts, Energy Use in the Australian Residential Sector
1986-2020, 2008.
5 Australian Bureau of Statistics, Household Energy Consumption Survey 2012, 2013.
0
10
20
30
40
02-03 03-04 04-05 05-06 06-07 07-08 08-09 09-10 10-11 11-12 12-13
Res
iden
tial E
nerg
y C
onsu
mpt
ion
per C
apita
(G
J/pe
rson
)
Year Tas NSW/ACT Vic Qld SA WA NT Aus

16 ENERGY IN TASMANIA – PERFORMANCE REPORT 2013-14
Figure 2.7 Average weekly expenditure on household energy 2012
Source: Australian Bureau of Statistics, Household Energy Consumption Survey 2012, 2013.
Figure 2.7 indicates that mainland households spent more on vehicle fuels ($60 per week) than on energy used within the home ($39 per week). In Tasmania, less was spent on vehicle fuels ($56 per week) and more on dwelling energy ($44 per week), reflecting the relatively shorter distances driven in Tasmania.
2.5 Commercial6 The commercial sector consumed approximately eight PJ of energy in Tasmania during 2012-13, representing around seven per cent of total consumption.7
Figure 2.8 shows the breakdown of energy consumption according to different types of commercial activity. This breakdown is similar to the national breakdown with the main difference being a greater consumption in the hotel sector, reflecting the importance of tourism in Tasmania.
6 The commercial sector is distinguished from the industrial sector in that the commercial sector excludes
agriculture, mining, manufacturing, utilities, and construction which form the industrial sector.
7 Bureau of Resources and Energy Economics, Australian Energy Statistics 2014.
0
20
40
60
80
100
120
NSW VIC QLD SA WA TAS NT ACT All households
Wee
kly
Cos
t ($)
Electricity Mains gas LPG/ bottled gas Other sources of energy Petrol Diesel LPG

ENERGY IN TASMANIA – PERFORMANCE REPORT 2013-14 17
Figure 2.8 Commercial building energy consumption in Tasmania, 20098
Source: Department of Climate Change and Energy Efficiency, Baseline Energy Consumption and Greenhouse Gas Emissions in Commercial Buildings in Australia, 2012
Electricity is the dominant fuel type for Tasmanian commercial buildings, with only minor consumption of natural gas, LPG and wood. Natural gas consumption is significantly higher in other jurisdictions, where it is used predominantly for space heating.
The dominant electricity end use in commercial buildings is heating, ventilation and air conditioning (HVAC), followed by lighting and equipment.
2.6 Industrial As indicated in the Tasmanian Energy Flow diagram (Figure 2.3), the industrial sector has the highest energy consumption of all end use sectors. For example, Rio Tinto Alcan’s Bell Bay facility consumes around 13 PJ of energy per year which is around 12 per cent of Tasmania’s total energy consumption and is nearly double the total amount of electricity consumed by all Tasmanian households.
Further Figure 2.9 and Figure 2.10 show that there is a significant difference in the type of fuels used by industry in Tasmania relative to Australia as a whole.
8 More up to date data is not yet available.
Stand Alone Offices 23%
Hotels 19%
Retail 27%
Hospitals 11%
Schools 8%
Tertiary Education
11% Public Buildings
1%

18 ENERGY IN TASMANIA – PERFORMANCE REPORT 2013-14
Figure 2.9 Fuel types used by Tasmanian industry 2011-12
Source: Australian Bureau of Statistics. Energy Account Australia 2011-12.
Figure 2.9 shows that electricity is the dominant energy source for Tasmanian industry, reflecting the hydro-industrialisation era when energy intensive industries such as aluminium, manganese and zinc smelting and paper and cement manufacturing were established in Tasmania. Collectively five major industrial facilities9 in Tasmania are responsible for more than half of Tasmania’s total electricity consumption.
In contrast, Figure 2.10 shows natural gas and liquid petroleum fuels are the dominant fuel types used by Australian mainland industries.10
9 Aluminium smelter at Bell Bay, Manganese smelter at Bell Bay, Zinc smelter at Lutana, paper manufacturing at
Boyer and cement manufacturing at Railton. 10 Australian Bureau of Statistics. Energy Account Australia, 2011-12.
Liquid Fuels 25%
Coal 14%
Natural Gas 7%
Wood 3%
Electricity 51%

ENERGY IN TASMANIA – PERFORMANCE REPORT 2013-14 19
Figure 2.10 Fuel types used by Australian industry 2011-12
Source: Australian Bureau of Statistics. Energy Account Australia 2011-12.
2.7 Greenhouse gas emissions Combustion of fossil fuels is the largest contributor to Tasmanian greenhouse gas emissions. As illustrated in Figure 2.11, energy use (transport, manufacturing, construction and energy industries) emissions are significantly higher than emissions from the agricultural, industrial processes (such as mineral processing and metal production) and waste (such as methane emissions from landfill) sectors.
Liquid Fuels 35%
Coal 6%
Natural Gas 31%
Wood & Bagasse
5% Electricity
23%

20 ENERGY IN TASMANIA – PERFORMANCE REPORT 2013-14
Figure 2.11 Tasmanian emissions by sector 2002-201211
Source: Department of Industry, Innovation, Climate Change, Science, Research and Tertiary Education, Australian Greenhouse Emissions Information System, accessed November 2014.
Figure 2.12 indicates Tasmania has the lowest energy related emissions per capita of any Australian State or Territory. This is largely due to the dominance of renewable hydro generation for electricity production.
11 Excludes land use, land use change and forestry.
0
1 000
2 000
3 000
4 000
5 000
6 000
2002 2003 2004 2005 2006 2007 2008 2009 2010 2011 2012
kilo
tonn
es C
O2-
e
Year
Energy Industrial Processes
Agriculture Waste

ENERGY IN TASMANIA – PERFORMANCE REPORT 2013-14 21
Figure 2.12 Energy sector emissions per capita – 2012
Sources: Department of Industry, Innovation, Climate Change, Science, Research and Tertiary Education, Australian Greenhouse Emissions Information System, accessed November 2014. Australian Bureau of Statistics, Australian Demographic Statistics, March 2014.
Data in Figure 2.11 to Figure 2.12 represent Tasmanian emissions. They do not include emissions associated with electricity imported via Basslink, which are accounted for in Victoria.
Figure 2.13 presents emissions data calculated using a different methodology, including all indirect emissions from the purchase of generated electricity ie including emissions associated with electricity imported via Basslink.
Tasmanian electricity emissions vary according to the level of hydro generation which in turn is dependent on rainfall in catchment areas. In drier years (such as from 2007 to 2009) energy industry electricity emissions were significantly higher due to a greater reliance on emissions intensive Basslink imports. Emissions associated with electricity use have declined steadily since 2009 with higher rainfall and consequently higher hydro generation and lower Basslink imports.
0
5 000
10 000
15 000
20 000
25 000
30 000
Tas Vic NSW/ACT Qld SA WA NT AUS
Emis
sion
s pe
r ca
pita
(kg
CO
2-e/
capi
ta)
State / Territory

22 ENERGY IN TASMANIA – PERFORMANCE REPORT 2013-14
Figure 2.13 Tasmania’s indirect emissions from the purchase of generated electricity 2002-2012
Source: Department of Industry, Innovation, Climate Change, Science, Research and Tertiary Education, Australian Greenhouse Emissions Information System, accessed November 2014.
0
1 000
2 000
3 000
4 000
5 000
2002 2003 2004 2005 2006 2007 2008 2009 2010 2011 2012
kilo
ton
nes
CO
2-e
Year

ENERGY IN TASMANIA – PERFORMANCE REPORT 2013-14 23
3 INDUSTRY REGULATION
This chapter provides an overview of the regulatory framework for the electricity and gas industry in Tasmania. The framework is a combination of national and jurisdictional arrangements.
The regulatory instruments that apply to the supply of petroleum, coal and wood in Tasmania are discussed in the relevant chapters.
All states and territories signed the Australian Energy Market Agreement1 (AEMA) in 2004, which outlined the intended functions and powers of the Australian Energy Regulator (AER) and the Australian Energy Market Commission (AEMC), as well as those functions that would remain with state and territory regulators.
In 2007, the Council of Australian Governments (COAG) agreed to establish a single, industry-funded national energy market operator for both electricity and gas, the Australian Energy Market Operator (AEMO)2, to provide energy market governance on a national basis. AEMO, in addition to taking over former NEMMCO functions, took over functions of a range of jurisdictional gas market operators including the operation of the gas bulletin board. AEMO is also the National Transmission Planner.3
COAG also established the Standing Council on Energy and Resources4 (SCER) which was replaced by the COAG Energy Council in December 2013. The COAG Energy Council’s focus is on developing an integrated and coherent national energy policy.
3.1 Electricity Regulation
3.1.1 Legislative and regulatory framework
The National Electricity Law (NEL) and National Electricity Rules (NER), which took effect on 1 July 2008, provide the overarching national regulatory framework for the electricity industry. However, many complementary state-based regulatory instruments remain.
The Economic Regulator Act 2009 (ER Act) established an independent three person board (the Tasmanian Economic Regulator) with responsibility under
1 Australian Energy Markets Agreement, June 2006.
2 For information on the history of AEMO, please see www.aemo.com.au .
3 As the National Transmission Planner, AEMO provides investment signals to the market by projecting electricity consumption and supply, and identifying transmission infrastructure requirements.
4 SCER replaced the Ministerial Council on Energy.

24 ENERGY IN TASMANIA – PERFORMANCE REPORT 2013-14
Regulations and Orders Regulations
Ministerial Orders Other subordinate legislation
Minister • NEM transitional
amendments to the Code • Directions
Regulator
National Electricity Rules • Market administration • Power system security • Technical standards • Network pricing • Metering
Licences
(excluding retailer authorisations)
Entities
Annual performance reports
Customers
Codes and other instruments • Tasmanian Electricity Code • Guidelines
General legislation For example: • Corporations Act 2001 • Competition and Consumer Law Act
2010
Industry specific legislation For example: • National Energy Retail Law (Tasmania) Act 2012 • Electricity Supply Industry Act 1995 • Energy Ombudsman Act 1998 • Electricity Wayleaves and Easements Act 2000 • Electricity – National Scheme (Tasmania)
Act 1999
Annual
the Electricity Supply Industry Act 1995 (ESI Act) for regulating the Tasmanian electricity supply industry. The Regulator’s functions under the ESI Act include the administration of the electricity licensing system and the regulation of Tasmanian standing offer and wholesale contract prices.
The ESI Act also requires the Regulator to issue the Tasmanian Electricity Code (TEC). The TEC was based largely on the then National Electricity Code (NEC) but has been edited significantly following subsequent reforms.
On 1 July 2012 the National Energy Customer Framework (NECF) was introduced, and the AER assumed responsibility for Tasmanian retailer authorisations and the economic regulation of Aurora Energy’s (now TasNetworks’) distribution network services.5
Figure 3.1 provides a schematic representation of the legislative and regulatory framework governing the Tasmanian electricity supply industry.
Figure 3.1 Outline of the legislative and regulatory framework for the Tasmanian electricity supply industry
5 Regulation of transmission services has been the responsibility of the AER since 2009.

ENERGY IN TASMANIA – PERFORMANCE REPORT 2013-14 25
3.1.2 NECF Implementation
The NECF is a legislative package, comprising the National Energy Retail Law (NERL) and the National Energy Retail Rules (NERR), that implements the remainder of the reform agreed to between jurisdictions. The NECF also facilitates the transition to the national regulation of energy markets. Specifically, the NECF transfers ‘non-economic’ regulatory functions such as minimum contract terms and conditions and customer protection from state jurisdictions to the AER. However, the Regulator continues to be responsible for price regulation of standing offer prices and declared electrical services. The NECF commenced in Tasmania on 1 July 2012 with respect to the electricity supply industry.
Further information on the NECF and retail market reforms can be found on the AER’s website at www.aer.gov.au and the AEMC’s website at www.aemc.gov.au.
3.1.3 Participation in the National Electricity Market
Tasmania joined the NEM in May 2005.
The central features of Tasmania’s participation in the NEM during 2013-14 were as follows:
Hydro Tasmania6, a State owned business, operates as the only significant hydro generator in Tasmania;
Hydro Tasmania’s Ministerial Charter is intended to ensure that the reliability and security of the State’s hydro system is maintained;
the NEM operates in accordance with the NER, which are administered by the AEMC while AEMO is responsible for market operations and system security;
the AER has responsibility for the economic regulation of transmission and distribution services;
the Regulator is responsible for standing offer price regulation for small customers (ie those consuming less than 150 MWh per annum);
retail competition for small customers commenced on 1 July 2014, thereby introducing retail competition for all Tasmanian customers other than those on the Bass Strait Islands;
the Energy Ombudsman continues to adjudicate disputes between customers and electricity businesses; and
the Regulator regulates the provision of raise contingency frequency control ancillary services (FCAS) supplied by Hydro Tasmania to meet the Tasmanian local requirement.
6 Hydro Tasmania also owns Momentum Energy, an energy retailer.

26 ENERGY IN TASMANIA – PERFORMANCE REPORT 2013-14
The Tasmanian “retailer of last resort” (RoLR) scheme that ensures ongoing supply to consumers in cases where a retailer unexpectedly exits the industry was part of a suite of responsibilities transferred to the AER through NECF implementation. The designated RoLR in Tasmania is Aurora Energy.
3.1.4 Electricity supply industry price controls
The Regulator is responsible for regulating standing offer prices and certain wholesale electricity contract prices as well as feed-in tariff (FiT) rates for standard FiT customers.
3.1.4.1 Standing offer prices
The framework under which the Regulator sets standing offer prices includes the:
ESI Act;
Electricity Supply Industry (Pricing and Related Matters) Regulations 2013; and
Electricity Guideline for the Approval of Standing Offer Prices in accordance with the 2013 Standing Offer Determination (April 2014).
The Regulator sets maximum standing offer prices by considering the costs retailers incur in supplying electricity to small customers7. These costs include:
costs in purchasing the electricity in the wholesale market;
transporting electricity over the network;
the costs of complying with mandatory renewable energy schemes,
the costs of providing services to customers including billing, collection and responding to enquiries (cost to serve); and
a margin to compensate the retailer for its investment in the business and the risks it assumes in providing those retail services.
In July 2013, the Regulator made two Determinations (together the 2013 Standing Offer Determinations) reflecting the intention at the time to sell Aurora Energy’s existing customers in two separate bundles. The Determinations covered the period 1 January 2014 to 30 June 2016.
In September 2013, the Regulator reviewed the 2013 Standing Offer Determinations in light of the then Government’s decision to defer the sale of Aurora Energy’s customer base. Following the review the Regulator revoked one Determination and amended the other Determination.
7 Customers who consume up to 150 MWh per annum.

ENERGY IN TASMANIA – PERFORMANCE REPORT 2013-14 27
The Regulator further reviewed the 2013 Standing Offer Determination in February 2014 after receiving a proposal from Aurora Energy seeking approval to amend the Determination to reinstate Aurora Energy’s ability to impose a late payment fee and interest on overdue accounts (this power had been unintentionally removed during changes made to the regulatory framework governing the approval of standing offer electricity prices and charges). The Regulator reviewed the Determination and reinstated Aurora Energy’s ability to impose the charges on the same basis as was previously approved under the former Electricity Supply Industry (Tariff Customers) Regulations 1998.
3.1.4.2 Wholesale prices
From 1 January 2014, the Regulator became responsible for regulating Hydro Tasmania’s wholesale contract activities.
As depicted in Figure 3.2 the framework governing the regulation of Hydro Tasmania’s wholesale prices includes the:
ESI Act;
Electricity Supply Industry (Pricing and Related Matters) Regulations 2013;
Wholesale Contract Regulatory Instrument;
Statement of Regulatory Intent - Wholesale Contract Regulation (April 2014); and
Electricity Wholesale Contract Guideline Version 1, December 2013.
Under this framework, Hydro Tasmania is required to offer regulated electricity contracts to authorised retailers operating in Tasmania.
The ESI Act provides for a range of approvals to be made in relation to the wholesale regulatory framework, including the types of regulated contracts that must be offered, the methodology for pricing these contracts and the volume that must be made available to retailers by Hydro Tasmania.

28 ENERGY IN TASMANIA – PERFORMANCE REPORT 2013-14
Electricity Supply Industry (Pricing
and Related Matters)
Regulations 2013 • Investigations by the
Regulator
• Cost recovery
Wholesale Contract Regulatory Instrument
• Regulated contract types
• Standard forms • Pricing methodology • Forward horizon • Volume release
Wholesale Guideline
Electricity Supply Industry Act 1995
• Approvals (section 43G) • Principles (section 43H) • Requirement to offer (section 43I) • Approval of credit requirements
(section 43J) • Monitoring by Regulator
(sections 43L to 43N) • Regulator fixing prices in certain
circumstances (section 43M)
Functions of the Regulator and
Hydro Tasmania’s licence
conditions • Information
disclosures to the Regulator
• Requirement to comply with guidelines (section 43L)
Figure 3.2 Outline of the legislative and regulatory framework governing the regulation of wholesale prices
3.1.4.3 Feed-in tariffs
Under the ESI Act the Regulator was required to investigate, and recommend to the Government, a price (known as a feed-in tariff (FiT)) to apply from 1 January 2014 for the net exported electricity that is fed into the Tasmanian electricity network by residential and small businesses customers.
In October 2013, the Regulator completed a regulated FiT investigation and recommended a FiT of 8.282 c/KwH to apply from 1 January 2014 to 30 June 2014.
In December 2013, the Regulator subsequently made a Regulated FiT Determination for Standard FiT Customers8, following an amendment to the ESI Act and Electricity Supply Industry (Pricing and Related Matters) Regulations 2013. For
8 See: Regulated Feed-in Tariff Determination for Standard Feed-in Tariff Customers, 6 December 2014
ENERGY IN TASMANIA – PERFORMANCE REPORT 2013-14 29
the period 1 July 2014 to 30 June 2015, the Regulator determined a regulated FiT of 5.551 c/KwH.
3.1.5 Management and compliance plans
Under their respective licences, electricity entities are required to develop a series of management plans in accordance with the TEC. Management plans include asset management, vegetation management and emergency management plans. Certain licensees are also required to produce a compliance plan which outlines the procedures, practices and strategies for managing and auditing the licensee’s compliance with the applicable legislation, regulations and codes.
Licensees’ management plans are periodically reviewed by an independent appraiser who then prepares a report for the Regulator. These independent reviews are designed to confirm the veracity of the data reported by the entity and to provide an independent assessment of a licensee’s ability to meet its licence obligations.
3.1.6 Performance reporting
Electricity Licensees are also required to report annually on their performance against a range of measures detailed in the Regulator’s Electricity Supply Industry Performance and Information Reporting Guideline Version 2.1 July 2011.9
Electricity Licensees are also required at least triennially (unless otherwise required by the Regulator) to undertake an independent appraisal of their compliance and management plans in accordance with the Regulator’s Regulatory Reporting Guideline Version 3, July 2014.
3.2 Gas regulation
3.2.1 Gas legislative framework
The Gas Act 2000 (Gas Act) and Gas Pipelines Act 2000 (Gas Pipelines Act) set out the terms and conditions under which gas licences are granted in Tasmania. In addition the Gas Distribution Code, Gas Retail Code and the Gas Customer Transfer and Reconciliation Code set out standards and arrangements for the distribution and retailing of natural gas in Tasmania.
The National Gas Law (NGL) and National Gas Rules (NGR), which took effect on 1 July 2008, provide the overarching national regulatory framework for the gas transmission sector (see section 3.2.2).
9 Guideline updated in September 2014.

30 ENERGY IN TASMANIA – PERFORMANCE REPORT 2013-14
3.2.2 Gas regulation
The Regulator is responsible for issuing gas retail and distribution licences under the Gas Act and pipeline (transmission) licences under the Gas Pipelines Act. The Director of Gas Safety, a separate statutory position attached to WorkSafe Tasmania, is responsible for monitoring and regulating safety and technical standards in the gas supply industry.
The Gas Act and Gas Pipelines Act set out the terms and conditions under which the licences are granted. As at 30 June 2014 the Regulator administered four codes; the Gas Distribution Code, the Gas Retail Code, the Gas Customer Transfer and Reconciliation Code and the Gas Bulk Customer Transfer Code. The Codes set out standards and arrangements for the distribution and retailing of natural gas in Tasmania.
The NGL and NGR provide the overarching national regulatory framework for gas transmission.
The NGL is applied in Tasmania through the National Gas (Tasmania) Act 2008. The main purpose of the Act is to establish a framework to enable third parties to gain access to natural gas pipeline services.
Tasmania's pipelines are not subject to economic regulation in the form of price and/or revenue controls. As such, the NGL does not have any economic regulatory impact on Tasmanian gas transmission and distribution pipelines.
While the NECF commenced in Tasmania on 1 July 2012 with respect to electricity, it does not apply to natural gas.
Figure 3.3 provides a schematic representation of the legislative and regulatory framework governing the Tasmanian gas supply industry.

ENERGY IN TASMANIA – PERFORMANCE REPORT 2013-14 31
Industry specific legislation For example: • Gas Act 2000 • Gas pipelines Act 2000 • National Gas Act 2008
General legislation For example: • Corporations Act 2001 • Competition & Consumer
Act 2010
Regulations and Orders
Regulations
Ministerial Orders
Other subordinate legislation
Minister • Distribution and retail
codes • Directions
Annual Report
Licences
Codes and other instruments • Tasmanian Gas Retail and Distribution Codes • Gas Customer Transfer & Reconciliation Code • Tasmanian Gas Bulk Customer Transfer Code • Other instruments, for example: Information for
licence applicants
Regulator
National Gas Rules • Market administration • Technical standards • Network pricing • Third party access • Metering
Entities
Annual performance reports
Customers
Figure 3.3 Outline of the legislative and regulatory framework for the Tasmanian gas supply industry

32 ENERGY IN TASMANIA – PERFORMANCE REPORT 2013-14
3.2.3 Compliance plans
Under their respective licences, and in accordance with the relevant code, each gas retail and distribution licensee is required to develop a compliance plan outlining the procedures, practices and strategies for managing and auditing the licensee’s compliance with the applicable legislation, regulations and codes. Gas distributors are also required to develop a service plan.
Licensees’ compliance and service plans are periodically reviewed by an independent appraiser who then prepares a report for the Regulator. These independent reviews are designed to confirm the veracity of the data reported by the entity and to provide an independent assessment of a licensee’s ability to meet its licence obligations.
3.2.4 Performance reporting
Gas licensees are required to report annually on their performance against a range of measures detailed in the Tasmanian Gas Retail and Gas Distribution Codes.
Gas licensees are also required at least triennially (unless otherwise required by the Regulator) to undertake an independent appraisal of their compliance and management plans in accordance with the Regulator’s Regulatory Reporting Guideline Version 3, July 2014.
3.3 Regulatory bodies
3.3.1 Tasmanian Economic Regulator
The ER Act provides for the appointment of a three-person board which together constitutes the Regulator. The board comprises Mr Glenn Appleyard (Chairman), Mr Peter Hoult and Mr Alan Smart. The Regulator is not subject to Ministerial direction and therefore operates independently from the Tasmanian Government.
In 2013-14 the Regulator had the following responsibilities in the energy sector:
administering the licensing system for gas and electricity entities (with the exception of retailer authorisations);
monitoring and regulating technical standards;
monitoring and enforcing compliance;
issuing, maintaining, administering and enforcing electricity and gas codes and guidelines;
determining regulated FiT rates;
determining standing offer retail electricity prices;
monitoring wholesale electricity financial contract prices; and

ENERGY IN TASMANIA – PERFORMANCE REPORT 2013-14 33
other functions under the electricity and gas legislative and regulatory frameworks.
3.3.2 Australian Energy Market Commission
The AEMC was established as a national independent body in 2005, in accordance with the AEMA. The AEMC is currently responsible for rule making in relation to:
electricity wholesale and transmission regulation in the NEM;
economic regulation of electricity distribution services;
economic regulation of gas transmission and distribution services and access to natural gas pipeline services; and
gas retail functions in certain jurisdictions.
The AEMC is also responsible for market development and providing advice to relevant organisations in relation to the NEM.
The AEMC does not have any regulatory enforcement responsibilities and is unable to initiate rule changes itself other than those of a minor administrative nature10.
The Regulator has a Memorandum of Understanding with the AEMC to facilitate the sharing of relevant information, cooperation and coordination between the organisations.
3.3.3 Australian Energy Regulator
The AER was also established in 2005, with the initial responsibility for the regulation of the electricity wholesale market and economic regulation of electricity and gas transmission and distribution networks. The AER exercises powers under a national energy legislative framework which includes the NEL, NGL, the NECF and associated rules, and sector-specific regulatory functions.
The AER is a statutory body funded by the Australian Government. The AER is part of the ACCC but operates as a separate legal entity. This means that the members that constitute the AER make the final decision with respect to the functions conferred upon the AER.
The AER operates within a framework of accountability to governments and market participants through consultation, reporting, transparent obligations and accessible avenues of appeal against regulatory decisions. Decisions of the AER are subject to judicial review by the Federal Court of Australia.
The AER is the economic regulator for electricity transmission services, as well as for Aurora Energy’s distribution determination, which commenced on 1 July 2012.
10 For further information on the AEMC, please see www.aemc.gov.au

34 ENERGY IN TASMANIA – PERFORMANCE REPORT 2013-14
The AER's determination specifies the revenues, prices and levels of service in respect of Aurora Energy's electricity distribution services11.
3.3.4 Australian Energy Market Operator
The AEMO was created by COAG to manage the NEM and gas markets from 2009. It is an independent, member-based organisation with membership split 60/40 between government and industry. Government members of AEMO include the state governments of Queensland, New South Wales, Victoria, South Australia and Tasmania, the Australian Capital Territory and the Commonwealth. Private members include Australia’s major energy generators, wholesalers and retailers.
The AEMO is responsible for:
electricity market - power system and market operations;
gas markets operations;
national transmission planning;
monitoring transmission services; and
facilitating energy market development.
AEMO’s functions are set out in the NEL. The NER prescribes all procedures and processes for market operations, power system security, network connection and access, pricing for network services in the NEM and national transmission planning.
3.3.5 Tasmanian Energy Ombudsman
Under the Energy Ombudsman Act 1998 (the Ombudsman Act), the Tasmanian Energy Ombudsman is authorised to receive, investigate and resolve complaints concerning any service relating to the sale and supply of electricity or gas by an electricity or gas entity. The Regulator has a Memorandum of Understanding with the Energy Ombudsman. The Memorandum provides for the sharing of information and the provision of relevant investigation reports.
3.4 Other Government bodies
3.4.1 WorkSafe Tasmania
WorkSafe Tasmania (WST) is an independent agency within the Department of Justice that administers the Electrical Safety and Administration Act 1997 (EISA Act) 12, which covers electrical licensing and technical safety.
11 TasNetworks was formed on 1 July 2014 following a merger between Aurora Energy’s distribution network and
Transend’s transmission network. As a result, while Aurora Energy (as a distributor) submitted the regulatory proposal to the AER for the distribution network, the AER’s subsequent determination applies to TasNetworks.

ENERGY IN TASMANIA – PERFORMANCE REPORT 2013-14 35
WST undertakes accident and incident investigations and audits to determine compliance with legislation. It also publishes information on product approvals/recalls and general electrical safety issues and produces a range of publications, guidelines and information for electricity entities, workers, contractors and consumers.
3.4.2 Department of Treasury and Finance
The Department of Treasury and Finance (Treasury) is responsible for managing the implementation of major energy initiatives and policies such as Tasmania’s entry to the NEM and the transition to retail competition.
The administration of the ESI Act is shared between Treasury and the Energy Policy Branch, a unit within the Department of State Growth.
Treasury is responsible for administering the following aspects of the ESI Act:
developing advice on electricity market arrangements in the State, particularly in relation to regulatory issues and the facilitation of competition at the wholesale and retail levels; and
progressing the roll out of electricity retail contestability.
3.4.3 Energy Policy Branch, Department of State Growth
The Energy Policy Branch supports the Director of Energy Planning whose functions include:
assisting the Minister for Energy in planning and co-ordinating the provision of energy in the State;
monitoring factors affecting the supply and demand for energy in Tasmania;
the development of commercial applications of renewable energy; and
producing and publishing information and reports on energy related matters.
In addition, the Energy Policy Branch represents Tasmania’s views and interests on energy matters to national policy and regulatory bodies and provides input into the development of the national regulatory framework that applies to Tasmania's energy industry.
12 This role stayed with the Department of Justice but passed to Building Standards and Occupational Licensing
on 1 September 2014.
36 ENERGY IN TASMANIA – PERFORMANCE REPORT 2013-14
3.5 Climate change policies and regulators The following climate change policies and associated climate change regulators were in place during 2013-14.
3.5.1 Carbon pricing mechanism
The carbon pricing mechanism commenced on 1 July 2012 and applied to Australia’s largest carbon emitters (ie with annual emissions greater than 25 000 tonnes of carbon dioxide equivalent). It covered approximately 60 per cent of Australia’s carbon emissions and included the electricity generation and stationary energy sectors. Emissions from households, on-road business use of light vehicles and the agriculture, forestry and fishery industries were not included.
Liable entities were required to acquire and surrender carbon units equivalent to the carbon emissions they produced or, alternatively, pay a shortfall charge. Emission reduction targets can be met through progressive reductions in the pollution cap. The carbon pricing legislation was repealed on 17 July 2014 with retrospective effect from 1 July 2014.
3.5.2 Renewable Energy Target
The Australian Government’s Renewable Energy Target (RET) scheme creates a guaranteed market for renewable energy, using a mechanism of tradable certificates created by large-scale renewable energy generators and owners of small-scale solar panel, wind, and hydro systems. The RET operates in two parts, as the Large Renewable Energy Target (LRET) and the Small-Scale Renewable Energy Scheme (SRES). The RET works by allowing both large renewable power stations and the owners of small-scale systems to create renewable energy certificates for every megawatt hour of power they generate. Each certificate represents one megawatt hour of renewable electricity.
Retailers are required to purchase and surrender certificates in accordance with the RET, in proportion to their total electrical energy sales.
Figure 3.4 shows the number of RECs generated in Tasmania in each calendar year by technology type and percentage contribution of Tasmanian renewable energy generation to national annual REC targets. Hydro output was significantly higher during 2012 and 2013, due to Hydro Tasmania maximising hydro generation and export across Basslink to take advantage of trading opportunities with the introduction of the price on carbon on 1 July 2012.
On 17 February 2014, the Government announced a review of the RET scheme by an Expert Panel. The review has since been finalised and the Panel’s report is available at: https://retreview.dpmc.gov.au/papers .

ENERGY IN TASMANIA – PERFORMANCE REPORT 2013-14 37
Figure 3.4 RECs generated in Tasmania and percentage contribution to national REC target (LGC)
Source: Clean Energy Regulator, REC Registry, 14 November 2013 Note: 1. Data for 2013 may not be complete as RECs generated in a particular year do not need to be created in the
REC Registry until the end of the following calendar year. 2. For 2011, 2012 and 2013, RECs are a combination of Large-scale Generation Certificates (LGCs) under the
LRET scheme and Small-scale Generation Certificates (STCs) under the SRES scheme 3. The percentage figure represents the Tasmanian contribution to the national annual REC (LGC) target.
3.5.3 Clean Energy Regulator
The federal Clean Energy Regulator (CER) was established in April 2012, and is an independent statutory authority whose responsibilities include administering the Carbon Pricing Mechanism, the National Greenhouse and Energy Reporting Scheme, the Carbon Farming Initiative and the RET scheme.
3.5.4 Clean Energy Finance Corporation
For information on the Clean Energy Finance Corporation refer to: http://www.cleanenergyfinancecorp.com.au .
3.5.5 Australian Renewable Energy Agency
For information on the Australian Renewable Energy Agency (ARENA) refer to: http://arena.gov.au/ .
3.5.6 The Climate Change Authority
For more information on the Climate Change Authority refer to: http://climatechangeauthority.gov.au/ .


ENERGY IN TASMANIA – PERFORMANCE REPORT 2013-14 39
4 INDUSTRY RELATED BODIES
4.1 Energy Ombudsman The Energy Ombudsman investigates complaints relating to the supply of natural gas and electricity and is funded through a levy imposed on the relevant energy supply industry licensees.
During 2013-14 the Energy Ombudsman received 440 new complaints which gave rise to 508 separate issues. This represents a decrease of 4.5 per cent and an increase of 0.79 per cent respectively over the previous year. Table 4.1 provides a summary of complaint activity over the last six years. 1
Table 4.1 Complaint activity 2008-09 to 2013-14
No. of complaints 2008-09 2009-10 2010-11 2011-12 2012-13 2013-14
Brought forward from previous year
69 43 35 46 30 22
Opened in period 279 414 465 499 461 440
Closed in period 305 422 454 515 469 474
Carried forward (still open)
43 35 46 30 22 8
No. of enquiries
Opened & closed in period
146 210 163 203 232 292
Table 4.2 shows the breakup of the 474 complaints closed during 2013-14.
Table 4.2 Breakup by entity of complaints closed during 2013-14.
Total no. of
complaints
Aurora Network
Aurora Retail
Hydro Tasmania
Tas Gas Networks
Tas Gas Retail
Out of jurisdiction
474 99 343 2 2 4 24
Table 4.3 shows a breakdown of complaints by type together with a summary of the main reasons for complaints in each category.
1 The Energy Ombudsman defines complaint issue categories consistent with those reported on by other
jurisdictions in the Australia and New Zealand Energy and Water Ombudsman Network (ANZEWON).

40 ENERGY IN TASMANIA – PERFORMANCE REPORT 2013-14
Table 4.3 Complaints by type: 2009-10 to 2013-14
Issue 2009-10 2010-11 2011-12 2012-13 2013-14 % Note 1 % Note 2
Billing 199 248 317 280 297 6.1 58.5
Credit 80 78 88 70 67 4.3 13.2
Customer service 40 54 71 54 42 -22 8.3
Land 26 22 18 19 16 -16 3.1
Provision 78 49 45 47 51 8.5 10
Supply 37 35 32 21 29 38 5.7
General 1 1 0 13 4 -69 0.8
TOTAL 461 487 572 504 508 0.8 Notes: 1. Percentage change from previous year. 2. Percentage of all complaints (does not sum to 100% due to rounding) Source: Energy Ombudsman’s annual reports.
For more information on complaints regarding the supply of natural gas and/or electricity in Tasmania please refer to the Ombudsman’s Annual Report 2013-14 available at:
http://www.energyombudsman.tas.gov.au/publications_and_media/annual_reports.
4.2 Electrical safety, standards and licensing The Secretary of the Department of Justice has delegated all of the Secretary’s functions under the Electricity Industry Safety and Administration Act 1997 to the General Manager - WorkSafe Tasmania (WST).2
The Administrator of Occupational Licensing under the Occupational Licensing Act 2005 (OLA) administers electrical licensing and electrical work obligations.
These obligations established under the OLA are monitored and enforced by “authorised officers” appointed under the OLA. These authorised officers inspect notified electrical work and issue any infringement notices against licence holders who breach the OLA. Breaches may also be dealt with by means of fines or legal and disciplinary proceedings. The Administrative processes related to licences are managed by WorkSafe Tasmania (this function has since been delegated to BSOL).
TechSafe Australia Pty Ltd is contracted to the Department of Justice to provide the Electrical Safety Inspection Service (ESIS). The ESIS includes the inspection of electrical work and the investigation of electrical incidents in relation to equipment or installation failure including those as a result of injury.
2 Administration of the Electricity Industry Safety and Administration Act stayed within the Department of Justice
but passed from WST to Building Standards and Occupational Licensing on 1 September 2014.

ENERGY IN TASMANIA – PERFORMANCE REPORT 2013-14 41
The ESIS contract is managed by Electricity Standards and Safety (ESS) and is funded by a levy on the network service provider (Aurora Energy for the 2013-14 financial year) under the ESI Act.
The National Occupational Licensing Law project (NOLS), developed in 2012-13 to review national licensing schemes, was abandoned by the Australian Government in 2013-14 and is now being addressed by the Council for the Australian Federation. As such, the licensing administration and monitoring functions under the OLA remain with the Administrator of Occupational Licensing.
4.3 Electrical Installation and Infrastructure Safety Compliance ESS continues to monitor the performance of the ESIS contractor as well as industry compliance statistics. General indications are that most electrical work is trending to be more compliant, however, photo-voltaic (solar) electrical installations continue to exceed the general defect rate. ESS has adopted strategies to address this anomaly.
During 2013-14:
there were no electrical fatalities recorded;
there were no serious electrical accidents (recorded by ESS), where recipients required medical attention;
eight audits of electrical contractors were conducted, with no major safety issues identified, however there were compliance concerns with recording and notification of electrical work;
42 infringement notices were issued for unlicensed and substandard electrical work (no incidents resulted in prosecution); and
1 767 defective electrical work notices were issued by the ESIS contractor (for defective electrical work).
4.4 Director of Gas Safety The Director of Gas Safety3 and the Gas Standards and Safety (GSS) Unit of WST4 administer the safety and technical aspects of the Gas Act 2000 and Gas Pipelines Act 2000.
The Director of Gas Safety facilitates the development of a natural gas supply industry to ensure that pipelines, pipeline facilities, gas installations and gas appliances are constructed maintained and operated to high standards of safety and in a manner that protects persons and property.
3 Delegated to the Director of BSOL.
4 Administration of the Gas Act and Gas Pipelines Act stayed within the Department of Justice but passed from WST to Building Standards and Occupational Licensing on 1 September 2014.

42 ENERGY IN TASMANIA – PERFORMANCE REPORT 2013-14
Prior to the operation of a gas network, a new facility is subject to approval by the Director of Gas Safety including:
independent design certification and approval;
construction, testing and commissioning in accordance with relevant national standards; and
regular operational auditing and independent systems certification of the approved safety and operating plan.
In addition, prior to commissioning and connection to the gas distribution network, gas appliances and gas installations are required to undergo several checks. A summary of GSS activities is provided in Table 4.4.
Increasingly, social and political factors are encouraging the owners of commercial and industrial buildings to retrofit energy-efficient appliances that use clean hydrocarbon fuel gases. Combined with the ongoing emergence of new technology for producing and storing CNG, LNG and biogas, this trend has seen GSS broaden its product programs and appliance technology projects.
Since natural gas was introduced in 2003, GSS has moved from focussing on major natural gas industry construction and gas delivery, towards taking a lead role in expanding gas use.
Table 4.4 Gas Standards and Safety activities: 2008-09 to 2013-14
Activity 2008-09 2009-10 2010-11 2011-12 2012-13 2013-14
Complex gas installations design accepted 121 95 123 160 152 169
Complex gas installation design modification accepted 74 42 72 21 19 28
Complex gas installation field assessments N/A N/A N/A 127 58 72
Type “B” appliances designs accepted 73 54 54 66 41 58
Type “B” appliance modification 21 6 3 2 5 3
Type “B” field commissioning 114 78 76 94 60 76
Prescribed standard gas installation design accepted 56 23 22 169 176 106
Gas mains construction audits 12 0 0 2 3 1
Gas mains construction inspections 0 0 0 8 10 4
Gas transmission receiving station construction audits 0 7 0 3 6 3
Gas transmission receiving station inspections 2 12 0 25 21 16
Source: Department of Justice, Annual Report 2013-14

ENERGY IN TASMANIA – PERFORMANCE REPORT 2013-14 43
4.5 OTTER Customer Consultative Committee The OTTER Customer Consultative Committee (OCCC) was created with the dual purpose of ensuring that groups representing customer interests are informed of developments in the industries regulated by the Regulator and the Regulator is made aware of issues impacting on customers and stakeholders.
For information on the OCCC and its activities during 2013-14 refer to the Tasmanian Economic Regulator’s Annual Report 2013-14 at:
http://www.economicregulator.tas.gov.au/domino/otter.nsf/LookupFiles/142862_TER_Annual_Report_2013-14.PDF/$file/142862_TER_Annual_Report_2013-14.PDF
4.6 Committee to Co-ordinate the Response to Energy Supply Emergencies
The Committee to Co-ordinate the Response to Energy Supply Emergencies (CCRESE) was established under section 12(1) of the Energy Co-ordination and Planning Act 1995 to advise the Minister for Energy on how to co-ordinate the response to electricity, natural gas and liquid fuel supply emergencies. The Department of State Growth co-ordinates CCRESE’s activities and for further information on the CCRESE please refer to: http://www.stategrowth.tas.gov.au/energy/emergency
4.7 Electricity Technical Advisory Committee The Electricity Technical Advisory Committee (ETAC), established under the Energy Co-ordination and Planning Act 1995, helps the Tasmanian industry to resolve, or develop a coordinated response to, technical electrical issues, such as the maintenance of standards for voltage control. It is also a forum for the dissemination of information relating to the technical operation and performance of the electricity supply system.
Transend Networks (now TasNetworks) provides a chairman and secretariat for the ETAC, with representatives from generation, distribution and retail electricity entities as well as the Department of State Growth.


ENERGY IN TASMANIA – PERFORMANCE REPORT 2013-14 45
5 GENERATION
The Tasmanian electricity generation system comprises hydroelectric, thermal, wind and embedded generators.
No single generator holds an exclusive licence for generation in Tasmania. All generators with capacity greater than five MW must hold a licence issued by the Regulator and be registered as a generator in the NEM unless exempted from registration by AEMO. As at 30 June 2014 the following entities held generation licences:
Hydro-Electric Corporation (Hydro Tasmania);
Woolnorth Bluff Point Wind Farm Pty Ltd (formerly Roaring 40’s Wind Pty Ltd);
Woolnorth Studland Bay Wind Farm Pty Ltd;
LMS Energy Pty Ltd;
AGL Energy Services Pty Ltd;
Cascade Renewable Energy Pty Ltd;
Aurora Energy (Tamar Valley) Pty Ltd;
Musselroe Wind Farm Pty Ltd;
Tasmanian Irrigation Pty Ltd; and
Simplot Australia Pty Ltd.
5.1 Installed capacity As at 30 June 2014 the total installed generating capacity on mainland Tasmania was 2 976 MW, comprising 2 281 MW of hydro-electric generation, 387 MW of thermal generation and 308 MW of wind generation. This generating capacity is supplemented by distributed (or embedded) generation i.e. small-scale generators connected to the distribution network.
Figure 5.1 shows the share of installed capacity for each generation source in Tasmania including Basslink’s capacity to supply electricity to Tasmania.

46 ENERGY IN TASMANIA – PERFORMANCE REPORT 2013-14
Figure 5.1 Installed capacity
5.2 Reserve plant margin Reserve plant margin is a measure of available installed capacity over and above the capacity needed to meet normal peak demand. Figure 5.2 shows the amount of reserve plant margin in Tasmania in comparison to mainland Australia1.
Figure 5.2 Reserve plant margin
Source: ESAA
Apart from the Northern Territory, Tasmania has the highest reserve plant margin in Australia. The reserve plant margin for Tasmania increased from 61.3 per cent in 2011-12 to be 83.5 per cent in 2012-13, (the latest data available for interstate comparison) due to the increase in capacity from the commissioning of Musselroe Wind Farm.
5.3 Hydro generation Hydro Tasmania is the major electricity generator in Tasmania owning and operating 30 hydro power stations. A unique characteristic of Tasmania’s hydro schemes is
1 Reserve plant margin excludes interconnectors.
66%
9%
14% 11% Hydroelectric Wind Basslink Thermal
-15 0
15 30 45 60 75 90
105 120 135
08-09 09-10 10-11 11-12 12-13
Res
erve
pla
nt m
argi
n (%
)
Year Tas NSW Vic QLD SA WA NT

ENERGY IN TASMANIA – PERFORMANCE REPORT 2013-14 47
the significant water storage capacity of the system. Hydro power stations are grouped into six separate catchment areas as shown in Figure 5.3 with total useable storage of 14.5 GWh of electricity. However, the bulk of the storage is contained in Great Lake and Lake Gordon/Lake Pedder.
Figure 5.3 Hydro Tasmania’s catchment areas and power stations
Figure 5.4 shows total weekly hydro generation during 2013-14 (excluding output from the embedded hydro generating units discussed in section 5.6).
Figure 5.4 Hydro generation (2013-14)
5.3.1 Water storage
Tasmania’s reliance on hydro generation leaves Tasmania exposed to hydrological risk. That is, risk associated with variations in rainfall. To some degree Hydro Tasmania has mitigated this risk by developing significant water storage
0
50
100
150
200
250
300
27 29 31 33 35 37 39 41 43 45 47 49 51 1 3 5 7 9 11 13 15 17 19 21 23 25
2013 2014
GW
h
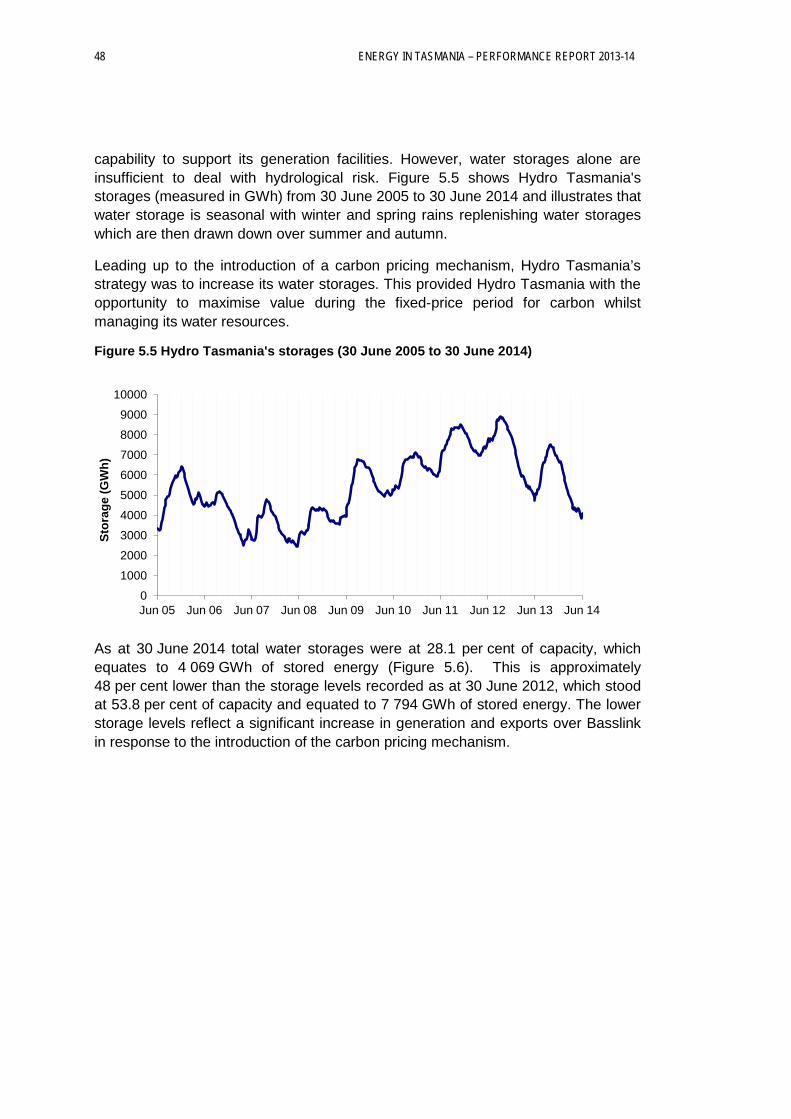
48 ENERGY IN TASMANIA – PERFORMANCE REPORT 2013-14
capability to support its generation facilities. However, water storages alone are insufficient to deal with hydrological risk. Figure 5.5 shows Hydro Tasmania's storages (measured in GWh) from 30 June 2005 to 30 June 2014 and illustrates that water storage is seasonal with winter and spring rains replenishing water storages which are then drawn down over summer and autumn.
Leading up to the introduction of a carbon pricing mechanism, Hydro Tasmania’s strategy was to increase its water storages. This provided Hydro Tasmania with the opportunity to maximise value during the fixed-price period for carbon whilst managing its water resources.
Figure 5.5 Hydro Tasmania's storages (30 June 2005 to 30 June 2014)
As at 30 June 2014 total water storages were at 28.1 per cent of capacity, which equates to 4 069 GWh of stored energy (Figure 5.6). This is approximately 48 per cent lower than the storage levels recorded as at 30 June 2012, which stood at 53.8 per cent of capacity and equated to 7 794 GWh of stored energy. The lower storage levels reflect a significant increase in generation and exports over Basslink in response to the introduction of the carbon pricing mechanism.
0
1000
2000
3000
4000
5000
6000
7000
8000
9000
10000
Jun 05 Jun 06 Jun 07 Jun 08 Jun 09 Jun 10 Jun 11 Jun 12 Jun 13 Jun 14
Stor
age
(GW
h)

ENERGY IN TASMANIA – PERFORMANCE REPORT 2013-14 49
Figure 5.6 Historical water storage- financial years
Table 5.1 shows that compared to 2012-13 demand in Tasmania increased by approximately 0.9 per cent during 2013-14. Due to the above average inflows during the year the replacement yield of hydro catchments is greater than the demand for electricity (System Load) for the first time in five years, consequently, without consistent increased inflows into water storages, alternative sources of supply will continue to be required to meet Tasmania’s electricity requirements.
Table 5.1 Water storage, Replaced hydro yield and system load from 30 June 2010 to 30 June 2014
Year 2010 2011 2012 2013 2014
Water Storages (% full) 36.3 45.9 53.8 32.8 28.0
Replaced Hydro Yield (GWh) 9 498 10 739 9 525 7 626 11 250
System Load (GWh) 10 834 11 127 10 617 10 622 10 720
2 000
3 000
4 000
5 000
6 000
7 000
8 000
9 000
10 000
27 32 37 42 47 52 5 10 15 20 25
Sto
rag
e (G
Wh
)
NEM Weeks 2008-09 2009-10 2010-11 2011-12 2012-13 2013-14

50 ENERGY IN TASMANIA – PERFORMANCE REPORT 2013-14
5.4 Thermal generation Figure 5.7 shows the amount of thermal energy generated in Tasmania for the period 1 July 2009 to 30 June 2014.
Figure 5.7 Thermal generation
Hydro Tasmania also owns and operates the TVPS at Bell Bay. TVPS is the only large thermal generator in Tasmania and is powered by gas supplied by the Tasmanian Gas Pipeline. TVPS has total installed capacity of 386.9 MW comprising:
four open cycle gas turbines (OCGT) with a combined capacity of 178 MW. These units operate as a peaking plant and provide backup to the combined cycle gas turbine, therefore their usage is intermittent and reflects peak prices; and
a 208.9 MW combined cycle gas turbine (CCGT) which in the past has operated as a base load generator.
TVPS generated 893 GWh of electricity during 2013-14, mostly produced by the CCGT (99 per cent), with the OCGT operating as backup.
Overall, thermal generation contributed 6.5 per cent of total electricity generated in Tasmania in 2013-14, compared to 13.3 per cent for 2012-13.
0
200
400
600
800
1 000
1 200
1 400
1 600
1 800
09-10 10-11 11-12 12-13 13-14
(G
Wh)
Year

ENERGY IN TASMANIA – PERFORMANCE REPORT 2013-14 51
Table 5.2 Thermal generation (2013-14)
Table 5.2 shows TVPS total weekly generation during 2013-14 and illustrates Hydro Tasmania’s changed operation of the TVPS. The combined cycle gas turbine will most likely only operate over summer and autumn when water storages are declining while the open cycle gas turbines will remain available at all times providing quick start generation capability. As noted in section 5.7.2 the open cycle gas turbines can also act as synchronous condensers providing voltage control.
5.5 Wind generation Figure 5.8 shows the amount of large scale wind generation in Tasmania for the period 1 July 2009 to 30 June 2014. Figure 5.8 Wind generation
0
5
10
15
20
25
30
35
40
27 29 31 33 35 37 39 41 43 45 47 49 51 1 3 5 7 9 11 13 15 17 19 21 23 25
2013 2014
GW
h
0
200
400
600
800
1000
1200
09-10 10-11 11-12 12-13 13-14
Gen
erat
ion
(GW
h)
Year

52 ENERGY IN TASMANIA – PERFORMANCE REPORT 2013-14
Large scale wind generations comprises the output from Woolnorth Bluff Point Wind Farm (65 MW), Woolnorth Studland Bay Wind Farm (75 MW) and the Musselroe Wind Farm(168 MW) all of which are managed and operated by Woolnorth Wind Farm Holdings a joint venture owned by Hydro Tasmania (25 per cent share) by Shenhua Clean Energy Holdings (75 per cent ).
Figure 5.9 shows weekly generation for the combined Woolnorth wind farms and Musselroe during 2013-14
Figure 5.9 Large scale wind generation (2013-14)
Large scale wind generation accounted for approximately 7.2 per cent of electricity generated in Tasmania for 2013-14, an increase from 3.6 per cent in 2012-13.
Hydro Tasmania also owns and operates the Huxley Hill Wind Farm on King Island with 2.5 MW of installed capacity.
5.6 Embedded generation Embedded generators are not connected to the transmission network but directly connected to the distribution network. Embedded generators in Tasmania with a minimum capacity of 0.225 MW are as follows:
Upper Lake Margaret (hydro 8.4 MW);
Tods Corner (hydro 1.6 MW);
Lower Lake Margaret (mini-hydro 3.2 MW);
Cascade Renewable (mini-hydro 1.32 MW);
Jackson Street, Glenorchy (land fill gas 1.6 MW);
Remount Road, Launceston (land fill gas 1.1 MW);
0
5
10
15
20
25
30
27 29 31 33 35 37 39 41 43 45 47 49 51 1 3 5 7 9 11 13 15 17 19 21 23 25
2013 2014
GM
Wh
Woolnorth
Musselroe

ENERGY IN TASMANIA – PERFORMANCE REPORT 2013-14 53
McRobies Gully, South Hobart (land fill gas 1.0 MW);
Meander Dam (mini-hydro 1.9 MW);
Nieterana (mini-hydro 2.2 MW);
Launceston General Hospital (co-generation gas 2.0 MW);
Fonterra, north west coast (co-generation gas 2.0 MW);
Simplot (co-generation gas 7.9 MW);
Wesley Vale (wind 0.225 MW);
Sisters Creek (wind 0.225 MW);
Sassafras (wind 0.225 MW); and
Parangana (mini-hydro 0.78 MW).
5.7 Generation performance All entities licensed under the ESI Act are required to report annually on their performance to the Regulator.
The key aspects of generation performance are:
availability;
reliability;
the adequacy of generating plant to meet generation requirements on an ongoing basis; and
in the case of Hydro Tasmania, the adequacy of water storages (or hydrology).
5.7.1 Availability
As with any electro-mechanical plant, generating plant cannot always be available. The availability factor reflects the combined effect of planned maintenance and forced (unplanned) outages and expresses the loss in generation capacity (MWh) due to all outage causes.
Availability factors have become less important since Tasmania joined the NEM as scheduling and planned outages are incorporated into market operations. Plant availability is reflected through wholesale market prices rather than technical indicators, with plant availability becoming a commercial consideration for the generating businesses involved.
As shown in Figure 5.10, in recent years, the availability of generation plant in Tasmania has increased steadily and is higher than all other jurisdictions. This is because hydroelectric power plants (the main source of generation on mainland

54 ENERGY IN TASMANIA – PERFORMANCE REPORT 2013-14
Tasmania) are inherently more reliable than coal-fired plants. In 2012-13 the overall availability of generating plant in Tasmania was 92.4 per cent, slightly higher than overall availability for 2011-12, and the highest in Australia.
Figure 5.10 Availability factors
Source: ESAA
5.7.1.1 Availability factors (hydro electric and thermal)
The availability factor is calculated as follows:
Availability factor:
�(𝑰𝒏𝒔𝒕𝒂𝒍𝒍𝒆𝒅 𝒑𝒍𝒂𝒏𝒕 𝒄𝒂𝒑𝒂𝒄𝒊𝒕𝒚 (𝑴𝑾) ∗ 𝟖 𝟕𝟔𝟎) − 𝑴𝑾𝒉 𝒍𝒐𝒔𝒔𝒆𝒔 𝒅𝒖𝒆 𝒕𝒐 𝒐𝒖𝒕𝒂𝒈𝒆𝒔� ∗ 𝟏𝟎𝟎𝑰𝒏𝒔𝒕𝒂𝒍𝒍𝒆𝒅 𝒑𝒍𝒂𝒏𝒕 𝒄𝒂𝒑𝒂𝒄𝒊𝒕𝒚 (𝑴𝑾) ∗ 𝟖 𝟕𝟔𝟎
Hydro Tasmania reported its availability as 91.04 per cent for 2013-14, which is below the reported availability for 2012-13 of 91.90 per cent, but consistent with Hydro Tasmania’s internal performance target of 91 per cent.
TVPS reported an overall availability of 60.3 per cent for 2013-14, compared to 92 per cent for 2012-013. The decrease is a result of Hydro Tasmania’s decision not to operate the Combined Cycle Gas Turbine (Unit 201) for part of the year.
5.7.1.2 Availability factors (wind)
As wind generation is intermittent the standard measure of availability is not appropriate. Specifically, the availability factor for wind generation takes into consideration wind availability and therefore records the percentage of time the plant is available for operation when wind conditions are suitable, rather than across an entire year.
75.0
80.0
85.0
90.0
95.0
100.0
08-09 09-10 10-11 11-12 12-13
Ava
ilabi
lity
fact
or (
%)
Year Tas NSW Vic QLD SA WA NT

ENERGY IN TASMANIA – PERFORMANCE REPORT 2013-14 55
Availability factor (wind):
�(𝐼𝑛𝑠𝑡𝑎𝑙𝑙𝑒𝑑 𝑝𝑙𝑎𝑛𝑡 𝑐𝑎𝑝𝑎𝑐𝑖𝑡𝑦 (𝑀𝑊) ∗ 8 760) −𝑀𝑊ℎ 𝑙𝑜𝑠𝑠𝑒𝑠 𝑑𝑢𝑒 𝑡𝑜 𝑜𝑢𝑡𝑎𝑔𝑒𝑠� ∗ 100𝐼𝑛𝑠𝑡𝑎𝑙𝑙𝑒𝑑 𝑝𝑙𝑎𝑛𝑡 𝑐𝑎𝑝𝑎𝑐𝑖𝑡𝑦 (𝑀𝑊) ∗ (8 760 – ℎ𝑜𝑢𝑟𝑠 𝑤𝑖𝑛𝑑 𝑢𝑛𝑎𝑣𝑎𝑖𝑙𝑎𝑏𝑙𝑒)
Woolnorth Bluff Point Wind Farm reported an availability factor of 97.39 per cent for 2013-14, which was just above its target of 97 per cent whilst Woolnorth Studland Bay Wind Farm reported an availability of 97.67 per cent, which is above its target of 97 per cent.
5.7.2 Planned outage factor
Outages are separated into two categories, planned or forced. Outages are reported in terms of an “equivalent outage factor”, where “equivalent” refers to the conversion of partial outages (including capacity constraints) to equivalent full plant outages assessed on an energy basis.
Planned outage factor:
𝑴𝑾𝒉 𝒐𝒖𝒕 𝒐𝒇 𝒔𝒆𝒓𝒗𝒊𝒄𝒆 𝒅𝒖𝒆 𝒕𝒐 𝒑𝒍𝒂𝒏𝒏𝒆𝒅 𝒐𝒖𝒕𝒂𝒈𝒆𝒔 ∗ 𝟏𝟎𝟎𝑰𝒏𝒔𝒕𝒂𝒍𝒍𝒆𝒅 𝒑𝒍𝒂𝒏𝒕 𝒄𝒂𝒑𝒂𝒄𝒊𝒕𝒚 (𝑴𝑾) ∗ 𝒑𝒆𝒓𝒊𝒐𝒅 𝒉𝒐𝒖𝒓𝒔 (𝟖 𝟕𝟔𝟎)
Hydro Tasmania’s planned outage factor increased from 7.5 per cent in 2012-13 to 8.2 per cent in 2013-14 but remains below Hydro Tasmania’s limit of eight to 10 per cent. TVPS’s planned outage factor also increased from 4.7 per cent in 2012-13 to 38.7 per cent in 2013-14, which is above TVPS’s limit of 10 per cent. The increase is attributed to the repairs on the Open Cycle Gas Turbine (Unit 104) and retrofitting the three remaining Open Cycle Gas Turbines (Units 101,102 and 103) to enable synchronous condenser operation and therefore provide voltage support to the grid.
Table 5.3 shows that the overall planned outage factor for Tasmania 2013-14 was 12.7 per cent, the increase reflects the increase in TVPS planned outage factor.
Table 5.3 Planned outage factor for Tasmania
2009-10 2010-11 2011-12 2012-13 2013-14
Planned Outage Factor % 8.4 10.4 11.0 7.1 12.7
As shown in Figure 5.11 over recent years, with the exception of South Australia and Western Australia, Tasmania’s results are generally comparable to the results reported in other states and territories.

56 ENERGY IN TASMANIA – PERFORMANCE REPORT 2013-14
Figure 5.11 Planned outage factors
5.7.3 Forced outage factor
The forced outage factor for Hydro Tasmania hydro generators increased from 0.6 per cent in 2012-13 to 0.7 per cent in 2013-14, but remains under Hydro Tasmania’s internal limit of two per cent. The forced outage factor is calculated as follows:
Forced outage factor:
𝑴𝑾𝒉 𝒐𝒖𝒕 𝒐𝒇 𝒔𝒆𝒓𝒗𝒊𝒄𝒆 𝒅𝒖𝒆 𝒕𝒐 𝒇𝒐𝒓𝒄𝒆𝒅 𝒐𝒖𝒕𝒂𝒈𝒆𝒔 ∗ 𝟏𝟎𝟎𝑰𝒏𝒔𝒕𝒂𝒍𝒍𝒆𝒅 𝒑𝒍𝒂𝒏𝒕 𝒄𝒂𝒑𝒂𝒄𝒊𝒕𝒚 (𝑴𝑾) ∗ 𝒑𝒆𝒓𝒊𝒐𝒅 𝒉𝒐𝒖𝒓𝒔 (𝟖 𝟕𝟔𝟎)
The forced outage factor for TVPS’s thermal generators decreased from 3.3 per cent in 2012-13 to one per cent in 2013-14 and is below TVPS’s forced outage factor limit of 2.2 per cent.
As shown in Figure 5.12 Tasmania’s overall forced outage rate of 0.99 per cent for 2012-13 is lower most other states and territories reflecting improvements in maintenance planning which seeks to refurbish aged plant components during planned outages. However, maintaining this level of performance will become increasingly difficult as Hydro Tasmania’s assets age.
0
5
10
15
20
25
08-09 09-10 10-11 11-12 12-13
Plan
ned
outa
ge (
%)
Year
Tas NSW Vic QLD SA WA NT

ENERGY IN TASMANIA – PERFORMANCE REPORT 2013-14 57
Figure 5.12 Forced outage factor
5.7.4 System adequacy
Generation adequacy is measured by the system load factor and the capacity factor.
5.7.4.1 System load factor
The system load factor provides an indication of how constant the load is on the system over the course of a year. The system load factor is calculated as follows:
System load factor:
𝑆𝑦𝑠𝑡𝑒𝑚 𝑒𝑛𝑒𝑟𝑔𝑦 (𝑀𝑊ℎ) ∗ 100𝐻𝑖𝑠𝑡𝑜𝑟𝑖𝑐𝑎𝑙 𝑠𝑦𝑠𝑡𝑒𝑚 𝑝𝑒𝑎𝑘 𝑙𝑜𝑎𝑑 (𝑀𝑊) ∗ 𝑝𝑒𝑟𝑖𝑜𝑑 ℎ𝑜𝑢𝑟𝑠 (8 760)
The system load factor in Tasmania has remained around 70 per cent since 1997. However, as shown in Figure 5.13, in 2012-13 the load factor increased to 76 per cent reflecting a reduction in peak demand i.e. demand is more constant and evenly spread
0
2
4
6
8
10
12
08-09 09-10 10-11 11-12 12-13
Forc
ed o
utag
e (%
)
Year
Tas NSW Vic QLD SA WA NT

58 ENERGY IN TASMANIA – PERFORMANCE REPORT 2013-14
Figure 5.13 System load factor
5.7.4.2 Capacity factor
The capacity factor is the ratio of the actual output of a power plant over a year and its potential output if it had operated at installed capacity over a year.
Capacity factor:
𝑇𝑜𝑡𝑎𝑙 𝑎𝑛𝑛𝑢𝑎𝑙 𝑔𝑒𝑛𝑒𝑟𝑎𝑡𝑖𝑜𝑛 (𝑀𝑊ℎ) ∗ 100𝑇𝑜𝑡𝑎𝑙 𝑖𝑛𝑠𝑡𝑎𝑙𝑙𝑒𝑑 𝑝𝑙𝑎𝑛𝑡 𝑐𝑎𝑝𝑎𝑐𝑖𝑡𝑦 (𝑀𝑊) ∗ 𝑝𝑒𝑟𝑖𝑜𝑑 ℎ𝑜𝑢𝑟𝑠 (8 760)
Figure 5.14 Capacity factor for each generation source (2013-14)
As shown in Figure 5.14, capacity factors for each generation source are substantially below 100 per cent and reflect environmental factors (wind and rainfall respectively for wind and hydroelectric generators) and market requirements i.e. whether a generating plant operated as a peak plant, base load plant or both. For
40
45
50
55
60
65
70
75
80
85
08-09 09-10 10-11 11-12 12-13
Load
fac
tor
(%)
Year
Tas NSW Vic QLD SA WA NT
0%
20%
40%
60%
80%
100%
Hydroelectric Wind Basslink Thermal
Cap
acity
Utilised capacity Installed capacity

ENERGY IN TASMANIA – PERFORMANCE REPORT 2013-14 59
example peaking plants, such as TVPS’s 178 MW of OCGTs, have relatively low capacity factors and therefore reduce the overall capacity factor for thermal generation. When importing electricity into Tasmania Basslink acts as a generator therefore the low capacity factor in Figure 5.8 reflects relatively low imports during 2013-14 as Hydro Tasmania maximised exports in response to the carbon pricing mechanism. The overall capacity factor for Tasmania increased to 66.5 per cent in 2013-14, from 53.2 per cent for 2012-13.
Tasmania is an energy-constrained system (ie the system is constrained by the amount of water in storage). Tasmania’s capacity factor has therefore been substantially lower than the capacity factor for the capacity-constrained mainland states and territories as shown in Figure 5.15.
In the last few years, increased generation in response to higher inflows of water resulted in a higher capacity factor in 2010-11. There was a decrease in 2011-12 as generation was reduced to enable water storages to increase in preparation for the introduction of the carbon pricing mechanism on 1 July 2012.
Figure 5.15 Capacity factors
5.7.5 Basslink imports
The Basslink interconnector ensures that Tasmania is significantly less exposed to shortfalls in generation as electricity can be imported from the Australian mainland to meet any supply shortages in Tasmania. This is highlighted in Figure 5.15, which shows imports of over 1 900 GWh per annum during the years of drought ie 2006-07 to 2008-09, with imports peaking at 2 635 GWh in 2008-09.
25
35
45
55
65
08-09 09-10 10-11 11-12 12-13
Cap
acity
fact
or (
%)
Year
Tas NSW Vic Qld SA WA NT

60 ENERGY IN TASMANIA – PERFORMANCE REPORT 2013-14
Figure 5.16 Basslink flows
5.7.6 Solar generation
Details about solar generation are presented in section 13.3.1 of this report.
-4 000
-3 000
-2 000
-1 000
0
1 000
2 000
3 000
05-06 06-07 07-08 08-09 09-10 10-11 11-12 12-13 13-14
(GW
h)
YearExports Imports

ENERGY IN TASMANIA – PERFORMANCE REPORT 2013-14 61
6 TRANSMISSION
6.1 Introduction The transmission network transmits electricity from generators to:
the distribution system;
major industrial customers in Tasmania; and
the national electricity grid via the Basslink interconnector.
TasNetworks, formally, is the owner and operator of the electricity transmission system in Tasmania and is a SOC. On 26 June 2014, both the electricity distribution licence held by Aurora Energy and the electricity transmission licence held by Transend were transferred to TasNetworks, with an effective date of 1 July 2014. As a result, TasNetworks, as the newly licensed entity, provided the annual performance report for Transend as the transmission system operator in 2013-14.
Basslink is a high voltage direct current (HVDC) electricity interconnector connecting the Tasmanian power system to the Victorian power system. Basslink is owned and operated by BPL.
Under their respective licences, both TasNetworks and BPL are required to report annually on their performance to the Regulator.
The key aspects of transmission performance are:
availability; reliability; quality; and security of electricity supply.
Information on these aspects was gathered from BPL’s and TasNetwork’s 2013-14 performance reports and the Transend Networks 2014 Annual Planning Report.
6.2 Availability The Regulator’s ESI Performance and Information Reporting Guideline requires TasNetworks to report on transmission circuit availability and system minutes off supply.
Transmission line circuit availability measures overall transmission line circuit availability and may be affected by both planned outages (maintenance and construction) and unplanned outages (fault and forced). Transmission line circuit availability is a performance indicator of the effectiveness of the transmission business’ asset management practices.

62 ENERGY IN TASMANIA – PERFORMANCE REPORT 2013-14
Figure 6.1 Transmission line circuit availability
𝑛𝑜. 𝑜𝑓 ℎ𝑜𝑢𝑟𝑠 𝑝𝑒𝑟 𝑎𝑛𝑛𝑢𝑚 𝑐𝑖𝑟𝑐𝑢𝑖𝑡𝑠 𝑎𝑟𝑒 𝑎𝑣𝑎𝑖𝑙𝑎𝑏𝑙𝑒𝑡𝑜𝑡𝑎𝑙 𝑝𝑜𝑠𝑠𝑖𝑏𝑙𝑒 𝑛𝑜. 𝑜𝑓 𝑑𝑒𝑓𝑖𝑛𝑒𝑑 𝑐𝑖𝑟𝑐𝑢𝑖𝑡 ℎ𝑜𝑢𝑟𝑠 𝑝𝑒𝑟 𝑎𝑛𝑛𝑢𝑚
∗ 100
As shown in Figure 6.1 the availability of transmission components is measured in terms of the time the components are available, divided by the product of the total possible time and the number of transmission circuits being considered.
The availability of transmission circuits is affected by capital and operational works both on the line itself, and at substations at either end of the transmission line. Availability may be affected by outages of transmission lines, switchgear, secondary protection and communication assets. In previous years, the major contributor to the circuit not being available was planned outages that were required for the implementation of the operating and capital works program.
Several major projects completed in 2013-14 affected transformer circuit availability. These included:
Palmerston Substation to Hadspen Substation to George Town Substation optical ground wire (OPGW) (completed in March 2014);
Creek Road Substation 110 kV redevelopment (completed in June 2014); and
Avoca Substation asset replacements (completed in April 2014).
Availability is expected to continue to be affected over the coming years by ongoing transmission line enhancement and transformer replacement programs. Transmission line circuit availability will also continue to be affected by the OPGW installation program. As shown in Table 6.1 Transend met the performance targets in 2013-14 for all availability measures.
Table 6.1 Transmission component availability
Measure 2009-10 2010-11 2011-12 2012-13 2013-14 Target
Transmission line circuit availability (critical) (%)
99.82 99.48 98.38 99.67 99.42 ≥99.13
Transmission line circuit availability (non-critical) (%)
99.40 98.91 99.52 99.31 99.47 ≥98.97
Transformer circuit (%) 99.19 99.10 98.95 99.22 99.39 ≥ 99.28
Capacitor bank (%) 97.63 99.78 99.80 99.51 99.31 ≥ 99.00
6.3 Reliability Reliability is generally measured by loss of supply where the loss of supply events are measured in system minutes off supply (system minutes).
Percentage unserved energy (Figure 6.2) is a reliability indicator for transmission businesses. Unserved energy is the amount of energy that a transmission entity fails to deliver to its transmission customers. The amount of unserved energy (MWh) is expressed as a percentage of the energy that would have been served by the

ENERGY IN TASMANIA – PERFORMANCE REPORT 2013-14 63
network over a defined period (financial year for this report) had the unserved energy events not occurred.
Figure 6.2 Percentage unserved energy
𝑢𝑛𝑠𝑒𝑟𝑣𝑒𝑑 𝑒𝑛𝑒𝑟𝑔𝑦 (𝑀𝑊ℎ)𝑢𝑛𝑠𝑒𝑟𝑣𝑒𝑑 𝑒𝑛𝑒𝑟𝑔𝑦 + 𝑑𝑒𝑙𝑖𝑣𝑒𝑟𝑒𝑑 𝑒𝑛𝑒𝑟𝑔𝑦 (𝑀𝑊ℎ)
∗ 100
System minutes off supply (Figure 6.3) measures the reliability of the transmission network in supplying energy to network customers. It includes energy not supplied to customers, during the period of supply interruption, as a result of forced outages and unplanned outages caused by faults. This indicator provides an overall measure of transmission system reliability, capturing the combined effectiveness of network planning, design, operation and maintenance.
Figure 6.3 System minutes off supply
𝑢𝑛𝑠𝑒𝑟𝑣𝑒𝑑 𝑒𝑛𝑒𝑟𝑔𝑦 (𝑀𝑊ℎ)𝑠𝑦𝑠𝑡𝑒𝑚𝑚𝑎𝑥𝑖𝑚𝑢𝑚𝑑𝑒𝑚𝑎𝑛𝑑 (𝑀𝑊)
∗ 60
The AER, through its Service Target Performance Incentive Scheme (STPIS), sets and administers service standards targets which provide incentives to the transmission system operator to maintain and improve transmission system performance. The STPIS includes the transmission line performance measures shown in Table 6.1 with the addition of percentage unserved energy and system minutes off supply. The STPIS targets, together with Transend’s actual performance for the financial year ending 30 June 2014 and a comparison with previous years, are provided in Table 6.2.
Table 6.2 STPIS targets and Transend’s actual performance
Measure 2009-10 2010-11 2011-12 2012-13 2013-14 STPIS Target
Transmission line circuit availability (critical) (%)
99.82 99.48 98.38 99.67 99.42 ≥99.13
Transmission line circuit availability (non-critical) (%)
99.40 98.91 99.52 99.31 99.47 ≥98.97
Percentage unserved energy (%)
0.0033 0.0025 0.0025 0.0062 0.0009 N/A
System minutes off supply (min)
10.95 8.28 8.72 20.49 2.92 N/A
Part of the AER’s review of Transend’s revenue cap1 involved determining revenue incentive payments, which included meeting specific system performance targets. One measure is the number of loss of supply (LOS) events. Transend’s reliability performance is shown in Table 6.3.
1 AER, Transend transmission determination 2008–09 to 2013–14: Final decision, April 2009.

64 ENERGY IN TASMANIA – PERFORMANCE REPORT 2013-14
Table 6.3 Loss of supply system events (system minutes)
Measure 2009-10 2010-11 2011-12 2012-13 2013-14 STPIS Target
> 0.1 system minute 8 10 11 11 7 ≤15
> 1.0 system minute 3 4 3 3 0 ≤2
There were seven LOS events greater than 0.1 system minutes in 2013-14, a decline from the previous few years. These LOS events were caused by adverse weather (three events), equipment failure (two events) and operational causes (two events). There were no LOS events more than 1.0 system minute in 2013-14.
Transmission system LOS events > 0.1 system minutes attributable to Transend during 2013‐14 are shown in Table 6.4.
Table 6.4 List of LOS events >0.1 system minutes
Date Duration (mins)
Description System Minutes
16 Jul 2013 30 Mornington Substation 33 kV D252 feeder circuit tripped due to equipment failure, with smoke causing the forced outage of 33 kV A and B busbars. There was loss of supply from Mornington Substation.
0.29
19 Aug 2013 104 Queenstown-Newton 110 kV transmission circuit tripped due to adverse weather, with loss of supply to Newton Substation.
0.28
24 Sep 2013 24 Rosebery Substation 110/44 kV T1 transformer circuit and Farrell-Rosebery-Queenstown 110 kV transmission circuit tripped following a human error during planned maintenance work, with loss of supply to Rosebery, Queenstown and Newton substations.
0.49
01 Oct 2013 220 Farrell-John Butters 220 kV and Farrell-Rosebery-Queenstown 110 kV transmission circuits tripped due to adverse weather with loss of supply to Queenstown and Newton substations.
0.56
11 Dec 2013 70 Boyer Substation 6.6 kV B bus circuit tripped due to a protection mal-operation following a feeder fault.
0.46
27 Feb 2014 161 Palmerston-Arthurs Lake and Tungatinah-Lake Echo 1 110 kV transmission circuits tripped due to a protection mal-operation following a feeder fault at Arthurs Lake Substation. There was loss of supply to Arthurs Lake Substation.
0.55
26 Jun 2014 24 Farrell-Rosebery-Queenstown 110 kV and Farrell-John Butters 220 kV transmission circuits tripped due to adverse weather with loss of supply to Queenstown and Newton substations.
0.15
6.4 Comparison with other jurisdictions Differences in topography and the physical characteristics of networks make comparisons between transmission entities problematical and any comparisons are indicative only.

ENERGY IN TASMANIA – PERFORMANCE REPORT 2013-14 65
Figure 6.4 shows the 2012-13 annual transmission circuit availability figures for Tasmania and other states and territories apart from Queensland. In this instance, 2012-13 data has been used as it was the most recent data available at the time of writing. Transend’s transmission circuit availability has generally been higher than circuit availability in most other jurisdictions.
Figure 6.4 Transmission circuit availability comparison 2008-09 to 2012-13
Source: Electricity Gas Australia 2014, ESAA
As shown in Figure 6.5, Transend’s system minutes have been generally higher than in other Australian transmission networks. This is due in part to less ‘meshing’2 in the Tasmanian transmission network compared with other jurisdictions making it susceptible to the impact of single significant incidents. For 2012-13 the Tasmanian minutes off supply increased considerably. However, as shown in Table 6.2, there were only 2.92 minutes off supply in 2013-14.
2 Meshing refers to the structure of the transmission grid where redundant lines run between the main radial lines.
The redundant lines allow line failures to occur with power rerouted on the redundant lines thereby enabling the damaged lines to be repaired without the need for an outage.
96.00
96.50
97.00
97.50
98.00
98.50
99.00
99.50
100.00
08-09 09-10 10-11 11-12 12-13
Cir
cuit h
ours
ava
ilabl
e %
NSW/ACT VIC SA WA TAS

66 ENERGY IN TASMANIA – PERFORMANCE REPORT 2013-14
Figure 6.5 System minutes off supply comparison 2008-09 to 2012-13
Source: Electricity Gas Australia 2014, ESAA
6.5 Average outage duration The average duration of unplanned outages for transmission lines and transformers is an important measure of management and operational response to unplanned outages. The AER included these parameters in Transend’s STPIS for the 2009-14 regulatory period. Transend’s performance against the AER’s transmission line and transformer unplanned outage duration limits is shown in Table 6.5.
Table 6.5 Average unplanned outage duration (minutes)
2009-10 2010-11 2011-12 2012-13 2013-14 Target
Transmission lines 209 62 177 142 174 ≤ 326
Transformers 327 1 004 1 660 277 279 ≤ 712
During 2013-14 the duration of unplanned outages of Transend’s transmission lines and transformers were well below the average unplanned outage duration target.
6.6 Connection site performance Transend measures and reports on the availability and security of supply at connection sites across the transmission system. Targets for availability and security are established by Transend and only used internally ie targets are not specified in connection agreements with customers or imposed by regulators.
Transend’s connection site performance data includes outages caused by third parties.
Connection sites are classified as either:
0
5
10
15
20
08-09 09-10 10-11 11-12 12-13
Min
utes
off
supp
ly
Year
NSW Vic SA WA Tas

ENERGY IN TASMANIA – PERFORMANCE REPORT 2013-14 67
FIRM connection sites - these have an “N-1” or “N-2” rating, meaning that they continue to be safely supplied if one or two network elements cease to work respectively; or
NON-FIRM connection sites – these have an “N” rating, meaning that they cease to be safely supplied if any network element ceases to work.
Transend sets limits for supply reliability for each type of connection site, which customers compared with calculating an average across the transmission network. Limits are set for the number and duration of unplanned and planned outages.
Distribution connection sites are sites where the transmission network connects with the distribution network. Direct connection sites are sites where customers connect directly to the transmission network. The outage occurrence and duration limits for outages for each type of connection site are given in Table 6.5.
Table 6.6 Connection site reliability limits
Type of connection
Number of sites
Unplanned Planned
Outage limit (no.)
Outage duration limit
(mins)
Outage limit (no.)
Outage duration
limit (mins)
Distribution Firm 29 ≤ 1 ≤ 150 ≤ 1 ≤ 200
Non-firm 14 ≤ 4 ≤ 300 ≤ 4 ≤ 3000
Direct connection
Firm 5 ≤ 1 ≤ 150 ≤ 1 ≤ 200
Non-firm 9 ≤ 4 ≤ 300 ≤ 4 ≤ 500
6.6.1 Unplanned outages
Connection site reliability due to unplanned outages is shown in Table 6.7.
Table 6.7 Connection site reliability due to unplanned outages 2013-14
Type of connection
Firm or Non-Firm
Ave. no of unplanned
outages
Connections exceeding
outage limit
Ave. duration of unplanned outages per
site (min)
Connections exceeding
duration limit
Distribution Firm 0.07 0 40 1
Non-firm 1.21 0 34 0
Direct connection
Firm 0.40 1 19 0
Non-firm 0.89 1 14 0
During 2013-14 the following sites exceeded either the unplanned outage or duration limit:
A distribution firm site at Mornington exceeded the outage duration limit of 150 minutes with an outage of over 19 hours due to equipment failure.
A direct connection non-firm site at Queenstown had six unplanned outages which exceeded the unplanned outage limit of four during 2013-14.

68 ENERGY IN TASMANIA – PERFORMANCE REPORT 2013-14
A direct connection firm site at Boyer had two outages during 2013-14, exceeding the limit of one outage in the period.
6.6.2 Planned outages
Connection site reliability due to planned outages is shown in Table 6.8.
Table 6.8 Connection site reliability due to planned outages 2013-14
Type of connection
Average no of planned
outages
Connections exceeding
outage limit
Average duration of
planned outages per
site (min)
Connections exceeding
duration limit
Distribution Firm 0.03 0 44.8 1
Non-firm 1.5 0 7 302 5
Direct connection
Firm 0 0 0 0
Non-firm 1.0 0 529 2
During 2013-14 the following sites exceeded either the planned outage or duration limit:
The distribution firm site at Palmerston exceeded the planned outage limit due to a substation redevelopment in 2013-14.
Five distribution non-firm sites exceeded the outage duration limit. These include sites at Arthur’s lake (substation redevelopment), Avoca (transformer upgrade), Derby (connection to Musselroe wind farm), Derwent Bridge (Tungatinah substation upgrade) and Meadowbank (maintenance and network operating requirements).
The two direct connection non-firm sites that exceeded the outage limit were the sites at Huon River (transmission line insulator string replacement) and at Starwood (circuit breaker maintenance).
6.7 Connection site security for firm connection points The frequency of occasions when connection sites become non-firm is primarily due to alternate sources of supply being made available while capital works are carried out, including protection equipment upgrades and substation redevelopments. The number and duration limits of times when firm connections sites become non-firm are provided in Table 6.9.
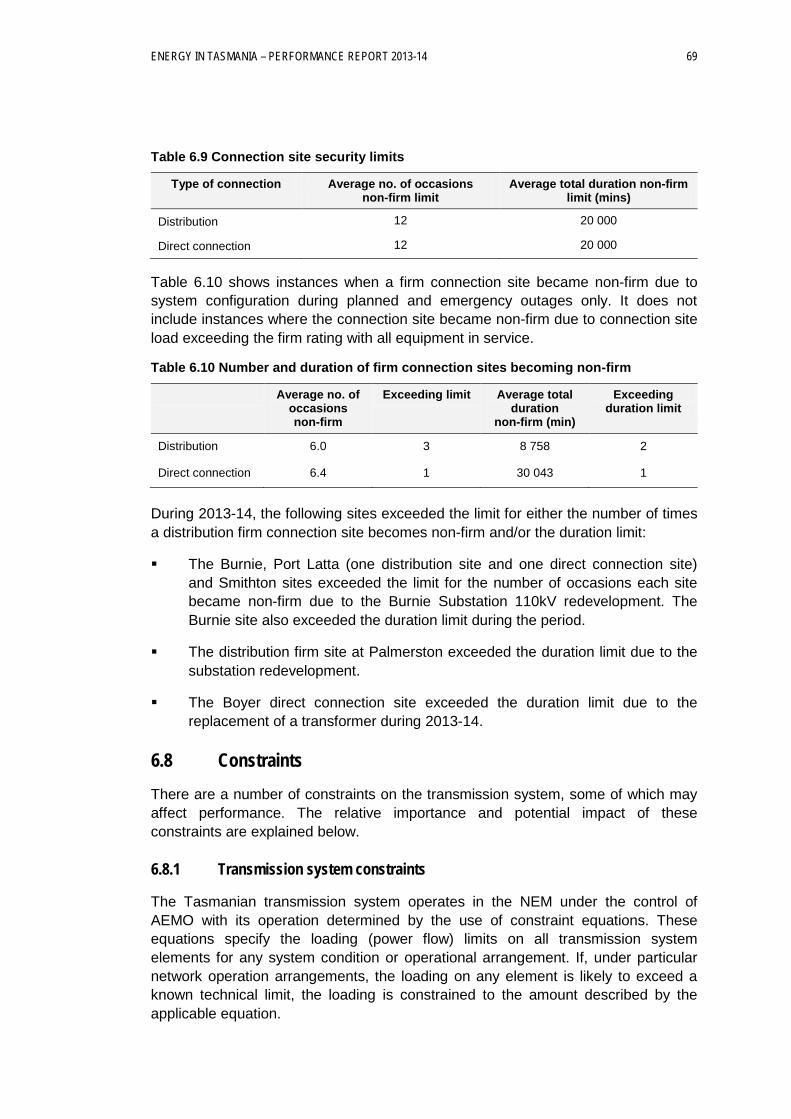
ENERGY IN TASMANIA – PERFORMANCE REPORT 2013-14 69
Table 6.9 Connection site security limits
Type of connection Average no. of occasions non-firm limit
Average total duration non-firm limit (mins)
Distribution 12 20 000
Direct connection 12 20 000
Table 6.10 shows instances when a firm connection site became non-firm due to system configuration during planned and emergency outages only. It does not include instances where the connection site became non-firm due to connection site load exceeding the firm rating with all equipment in service.
Table 6.10 Number and duration of firm connection sites becoming non-firm
Average no. of occasions non-firm
Exceeding limit Average total duration
non-firm (min)
Exceeding duration limit
Distribution 6.0 3 8 758 2
Direct connection 6.4 1 30 043 1
During 2013-14, the following sites exceeded the limit for either the number of times a distribution firm connection site becomes non-firm and/or the duration limit:
The Burnie, Port Latta (one distribution site and one direct connection site) and Smithton sites exceeded the limit for the number of occasions each site became non-firm due to the Burnie Substation 110kV redevelopment. The Burnie site also exceeded the duration limit during the period.
The distribution firm site at Palmerston exceeded the duration limit due to the substation redevelopment.
The Boyer direct connection site exceeded the duration limit due to the replacement of a transformer during 2013-14.
6.8 Constraints There are a number of constraints on the transmission system, some of which may affect performance. The relative importance and potential impact of these constraints are explained below.
6.8.1 Transmission system constraints
The Tasmanian transmission system operates in the NEM under the control of AEMO with its operation determined by the use of constraint equations. These equations specify the loading (power flow) limits on all transmission system elements for any system condition or operational arrangement. If, under particular network operation arrangements, the loading on any element is likely to exceed a known technical limit, the loading is constrained to the amount described by the applicable equation.

70 ENERGY IN TASMANIA – PERFORMANCE REPORT 2013-14
Some constraints exist under normal conditions when all transmission elements are in service. However, constraints are more likely to occur when some elements of the transmission system are out of service. Constraint equations are used to manage power flows both within a region and between regions.
6.8.2 Transmission network capacity constraints
There are a number of capacity constraints on the transmission network and they affect the power system in a number of ways, from restricting generation from some power stations to restricting supply to loads when certain contingencies occur. Network limits include equipment thermal ratings, network equipment protection settings, network stability limits and special operational requirements of Basslink.
More information on constraints is provided in Transend Networks Annual Planning Report 2014.
6.8.3 Terminal substation capacity constraints
The loading on each terminal substation on the transmission system and the impact of load growth for the next ten years are assessed every year. A number of substations are working at or above their firm capabilities, resulting in power system security issues in some areas, including the possibility of activating automatic load shedding schemes and radialising3 substation transformers.
Potential loss of key Transend terminal substations supplying the Burnie, Launceston, Devonport or Hobart’s Eastern Shore areas are a major concern. There is limited available supply for these load centres and, therefore, the loss of a substation would lead to significant load shedding or total loss of supply.
It is expected that infrastructure developments and subsequent load growth in these areas will increase the need to establish greater supply capacity and transfer capability.
6.9 Transmission security and planning criteria Under its licence Transend, now TasNetworks, is required to plan, procure and progress augmentations that are necessary to meet service obligations, including transmission planning and security criteria. These criteria are mandated through the Electricity Supply Industry (Network Planning Requirements) Regulations 2007.
The transmission security and planning criteria are ‘performance based’ ie limits to either the size of customer load that may lose supply in certain circumstances, or the length of the interruption, or both. The criteria are not prescriptive in that they do not require a particular solution to be utilised by Transend to meet the criteria, but
3‘ Radialising’ refers to dividing the load at a connection site effectively preventing the entire load being lost should
a transformer trip. If a transformer trips only the load on the tripped transformer is lost while the load on other transformers is not affected.

ENERGY IN TASMANIA – PERFORMANCE REPORT 2013-14 71
leave it to Transend to determine the least cost solution that meets the AER’s regulatory test for network augmentation.
The transmission security and planning criteria do not apply to the connection of energy intensive customers connected directly to the transmission network as TasNetworks negotiates the level of security of their connection to the network directly with them and specifies this in a power supply agreement or connection agreement.
To improve the reliability and capacity of the transmission network and meet the criteria, TasNetworks is committed to the following projects:
Burnie Substation 110 kV redevelopment (expected to be completed in August 2014);
Tungatinah Substation 110 kV redevelopment (expected to be completed by September 2014);
Meadowbank Substation110 kV redevelopment (scheduled to be completed by March 2015);
George Town Substation 110 kV redevelopment (scheduled to be completed by April 2015); and
Distribution system works supporting Avoca and St Marys substations.
6.10 Basslink Interconnector The business case for the construction of Basslink was based on trading opportunities created by the difference in prices between peak and off peak periods in the Victorian region of the NEM, coupled with Tasmania’s flexible hydro generating system4.
Basslink commenced transmitting power on 29 April 2006 and BPL is registered as a Market Network Service Provider as defined in the National Electricity Rules. Basslink consists of alternating current (AC) to direct current (DC) converter stations located in Victoria and Tasmania, linked by 400 kV DC overhead transmission lines and a 400 kV DC cable system, which connects to the respective AC networks via 220 kV AC and 500 kV AC overhead transmission lines. The high voltage DC transmission is via overhead lines, an underground cable and a submarine cable.
Basslink connects to the existing Victorian network at the Loy Yang 500 kV substation in Victoria and to the existing Tasmanian network at the George Town 220 kV substation in Tasmania. Figure 6.6 shows the route of the Basslink interconnector.
4 The energy constrained (rather than capacity constrained) nature of the hydro system is such that Tasmania
can produce significantly more electricity in the short run than it needs (therefore supply electricity in the Victorian peak periods), but depending on lake storage levels, it may not be able to do so without importing replacement electricity across the Basslink.

72 ENERGY IN TASMANIA – PERFORMANCE REPORT 2013-14
Figure 6.6 The Basslink interconnector
The main features of Basslink are:
it is rated to export (from Tasmania) 500 MW and import (to Tasmania) 478 MW on a continuous basis and export up to 630 MW from Tasmania for limited periods;5
power transfer at high levels on Basslink is supported in Tasmania by a Network Control System Protection Scheme (NCSPS) and a Frequency Control System Protection Scheme (FCSPS) that initiates tripping of contracted generators and loads in Tasmania following the occurrence of certain network contingencies or an outage on Basslink; and
the Basslink control system responds to variations in the Tasmanian system frequency through its frequency control function. Basslink is capable of varying power transfer in response to differences in frequency between the Australian mainland and Tasmania networks. Basslink therefore provides a means of transferring frequency control ancillary service (FCAS) between the networks thereby assisting in maintaining power system security in Tasmania.
6.10.1 Basslink operation
Generally electricity is exported during periods of peak Victorian prices and imported during periods of low Tasmanian price.
5 Exports and imports are measured at the Tasmanian connection point.

ENERGY IN TASMANIA – PERFORMANCE REPORT 2013-14 73
Basslink’s flow direction6 is determined in response to the differences in spot prices in the Tasmanian and Victorian NEM regions. Even in the situation where Tasmania has a general shortage of electricity (for example, a prolonged dry spell and Hydro Tasmania’s water storages are low), Basslink therefore may operate in both directions at any time. Only in exceptional circumstances will Basslink operate for a prolonged period in one direction.
Figure 6.7 Basslink flow from Victoria7 over a typical week (Sunday to Saturday), summer and winter
The operation of the link during normal hydrological situations displays a seasonal profile.
In summer there is southward flow on weekends, to take advantage of lower Victorian prices, and northward flows during the week to take advantage of higher priced Victorian peak summer demand. In winter electricity tends to flow northward during the day and southward at night, when prices are low in Victoria.
6.11 Basslink technical performance8 BPL is required to report annually on Basslink’s technical performance in accordance with the conditions of Basslink's transmission licence. Performance targets are set out in the Basslink Operations Agreement (BOA) between the State of Tasmania and the operators of Basslink, and in the Basslink Services Agreement (BSA) between Hydro Tasmania and BPL. Basslink’s technical performance for the 2009-10 to 2013-14 financial years inclusive is summarised in Table 6.11.
6 It takes 30 minutes to reverse the flow direction.
7 Export from Victoria is negative MW, import is positive MW.
8 Further detail on Basslink’s operational requirements can be found in the Electricity Supply Industry Expert Panel Report, An Independent Review of the Tasmanian Electricity Supply Industry Final Report Volume II, March 2012.
-500-400-300-200-100
0100200300400500600
0 24 48 72 96 120 144 168Hour
MW
Flo
w
Winter Summer

74 ENERGY IN TASMANIA – PERFORMANCE REPORT 2013-14
Table 6.11 Basslink technical performance
2009-10 2010-11 2011-12 2012-13 2013-14
Basslink availability (%) 97.39 99.62 98.67 99.89 98.77
Minutes unavailable 18 974 1 197 6 990 578 6 462
Total unplanned outages 5 1 3 5 4
Availability is measured as the amount of energy that has been transmitted over the HVDC system, except as limited by forced and scheduled outages. It is expressed as a percentage based on the maximum continuous capacity of the HVDC system.
With all interconnectors, particularly monopole9 links like Basslink that lack the redundancy provided by a second HVDC cable, availability can be affected by planned and unplanned outages.
Planned outages typically have less impact because they are usually undertaken during periods of reduced system load or when a reduction in availability can be managed by affected customers.
In 2013-14 Basslink availability was 98.77 per cent, which is above the 97 per cent availability target and above BPL’s average reliability target of around 97.5 per cent.
9 Monopole HVDC configuration where one of the terminals of the rectifier is connected to earth ground. The
other terminal is connected to a transmission line.

ENERGY IN TASMANIA – PERFORMANCE REPORT 2013-14 75
7 ELECTRICITY DISTRIBUTION
7.1 Introduction Aurora Energy held a licence under the ESI Act from 18 December 1998 to 26 June 2014 to operate the distribution network in Tasmania. On the latter date both the electricity distribution licence held by Aurora Energy and the electricity transmission licence held by Transend were transferred to TasNetworks, with an effective date of 1 July 2014. Therefore, TasNetworks1, as the newly licensed entity, provided the annual performance report for Aurora Energy as the distribution network operator in 2013-14. It is upon that annual performance data that the information in this chapter is based. Like the formerly licensed Aurora Energy distribution business TasNetworks is required, under the provisions of the TEC, to report on its performance to the Regulator on a quarterly and annual basis. The key criteria for assessing the regulatory performance of a distribution network business are:
reliability – measured in terms of interruptions to electricity supply;
quality - measured in terms of acceptable values of voltage and frequency; and
call centre performance.
7.2 The Distribution Network The distribution network comprises the system of poles, wires and underground cables which carry electricity at high and low voltage (44 kV and below), transformation equipment and the associated control, protection and maintenance equipment. The distribution network supplies electricity to 282 088 installations across 68 000 square kilometres in Tasmania. The distribution network is connected to the transmission system at 44 ‘terminal substations’ throughout Tasmania. The distribution connection points, and the asset boundary between the distribution and transmission networks, are on the customers’ side of the terminal substations’ feeder circuit breaker equipment. Due to historical infrastructure design there are two locations where the distribution network feeders are directly connected to Hydro Tasmania’s assets.
The HV distribution network distributes electricity at 44, 33, 22 or 11 kV. There are 391 high voltage distribution feeders which are categorised on the basis of the predominant supply area they service. The HV distribution network is best 1 TasNetworks is a State Owned Company (SOC).

76 ENERGY IN TASMANIA – PERFORMANCE REPORT 2013-14
characterised as a rural overhead network as most of the HV feeders and almost all the LV network are overhead cables, with underground cables restricted to the central business districts and subdivisions and commercial centres in the urban and suburban areas.
There are 33 771 distribution substations that reduce the voltage to 230/400 volts to supply the majority of customers through the low voltage network. There are a number of HV customers with their own distribution substations that take electricity supply directly at 22 kV and 11 kV and some energy intensive customers that are supplied via dedicated distribution feeders.
Rural distribution feeders2 are generally longer than urban feeders and of a radial nature with limited ability to interconnect with other adjacent rural distribution feeders. Urban distribution feeders, on the other hand, have a greater flexibility to provide alternate supplies to the majority of customers on a distribution feeder.
Whilst distribution system assets themselves are not overly complex, their management is difficult by virtue of:
the number of assets;
variations in the age and condition of those assets;
the geographic spread of assets throughout the State; and
the diverse nature of the environment in which those assets operate.
Due to the varying conditions they are exposed to rural feeders tend to have longer interruptions than urban feeders, which impacts on performance levels. Feeders in different areas are therefore expected to have different performance levels.
These differences, and the fact that customer numbers and density in urban areas is higher than in rural areas, are reflected in the supply reliability standards which are discussed in section 7.3.1.
7.3 Performance measures The reliability of supply of the distribution network is assessed using a range of measures. The three most common measures are SAIDI, SAIFI and CAIDI. SAIDI (system average interruption duration index)
SAIDI is generally reported over a one-year period and measures the average number of minutes a customer is without power from both planned and unplanned supply interruptions. A SAIDI of 150 minutes means that customers connected to the feeder or supply area being measured were without power for an average of 150 minutes during the past 12 months.
2 A feeder is a high voltage distribution circuit, of usually 11 kV or 22 kV that runs from a substation often with
many branches supplying a wide geographic area.

ENERGY IN TASMANIA – PERFORMANCE REPORT 2013-14 77
SAIFI (system average interruption frequency index)
SAIFI is a measure of how often a customer, on average, loses supply during one year. A SAIFI of two means that a customer connected to the feeder or supply area being measured lost, on average, supply twice during the past 12 months.
CAIDI (customer average interruption duration index)
CAIDI is normally associated with “average restoration time” and is generally reported over a one-year period. It is the average length of time in minutes a customer is without power due to both planned and unplanned interruptions during the year. A CAIDI of 60 minutes means the average interruption duration for the average customer was 60 minutes during the past 12 months.
7.3.1 Performance standards Distribution network performance is based on five supply reliability categories. The boundaries of four of these categories are defined on the basis of annual electricity consumption:
High Density Commercial (Hobart, Launceston, Burnie, Devonport, Rosny, Glenorchy, Kings Meadows and Kingston);
Urban and Regional Centres;
Higher Density Rural; and
Lower Density Rural.
The boundary of the fifth category - Critical Infrastructure (Hobart CBD emergency services) - is defined on the basis of its required level of network security rather than electricity consumption. Each of the five categories has a frequency of interruption limit and a cumulative interruption duration limit specified in the TEC.
In accordance with the TEC, Aurora Energy, as the distribution network service provider (DNSP) for the 2013-14 period, was required to use reasonable endeavours to ensure that the frequency of interruptions for a category, averaged over all communities in that category, and the cumulative duration of interruptions for a category, averaged over all communities in that category, was less than the appropriate limit set in the TEC.
The economic regulation of the distribution network transferred to the Australian Energy Regulator (AER) on 1 July 2012. Under the NER, the AER is responsible for developing a STPIS, applicable to licensed DNSPs on mainland Tasmania3, to provide financial incentive to maintain and improve distribution network service
3 This means Aurora Energy for the period up until 30 June 2014 and TasNetworks from 1 July 2014.

78 ENERGY IN TASMANIA – PERFORMANCE REPORT 2013-14
performance. For Aurora Energy, the STPIS was included in its distribution determination4 and commenced on 1 July 2012.
The STPIS that applied to Aurora Energy (and now applies to TasNetworks) includes a customer service component (telephone answering), but excludes the STPIS guaranteed service level (GSL) scheme as the DNSP is required to comply with the GSL scheme in the TEC and relevant guidelines.
With respect to setting reliability targets, the AER adopted the TEC supply reliability categories. However, unlike the mandated targets in the TEC, the AER’s reliability targets are based on an average of past performance. Furthermore the STPIS only applies to unplanned interruptions with reliability targets calculated on the basis of different excluded events5 and different methodology for calculating MEDs6 than in the TEC. Aurora Energy was required to report against both the TEC and STPIS performance measures.
Table 7.1 gives the minimum performance standards for each supply reliability category and community under both the TEC and the AER’s STPIS.7
Table 7.1 TEC and STPIS supply reliability standards
Supply reliability category
Frequency standard (average number of supply
interruptions per year)
Duration standard (average time without electricity in a year measured in minutes)
category (TEC)
community STPIS category (TEC)
community STPIS
Critical Infrastructure 0.2 0.2 0.22 30 30 20.79
High Density Commercial 1 2 0.49 60 120 38.34
Urban and Regional Centres 2 4 1.04 120 240 82.75
Higher Density Rural 4 6 2.79 480 600 259.48
Lower Density Rural 6 8 3.20 600 720 333.16
TasNetworks, as a newly licensed DNSP, is required to continue reporting against the TEC supply reliability standards for the purposes of year-on-year comparisons. References to reliability standards in this chapter refer to the TEC standards as determined by the Regulator. For performance against the AER’s STPIS refer to
4 TasNetworks was formed on 1 July 2014 following a merger between Aurora Energy’s distribution network and
Transend’s transmission network. As a result, while Aurora Energy (as a distributor) submitted the regulatory proposal to the AER for the distribution network, the AER’s subsequent distribution determination also applies to TasNetworks.
5 Excluded events are listed on pg 278 of AER's draft distribution determination, November 2011.
6 Major Event Day’s, discussed in section 7.4.1, are calculated using a different methodology under AER’s STPIS.

ENERGY IN TASMANIA – PERFORMANCE REPORT 2013-14 79
Aurora Energy’s Regulatory Information Notice available at: https://www.aer.gov.au/node/24384
7.3.2 Communities
The reliability of the distribution network is based on the performance of 101 geographical communities which are grouped into one of the five supply reliability categories (also referred to a ‘community categories’) specified in 7.3.1.
The five community categories allow reliability standards to be aligned more closely to the needs of the communities served by the network. Each community has its own duration and frequency standard based on its category. The standards have been set on the principle that it is equitable to have different reliability standards for distinctly different types of communities but similar communities should expect similar levels of supply reliability.
Dividing the distribution network into 101 communities allows for:
a better understanding of risks and influences in specific areas eg safety, vegetation, birds, weather and terrain;
the ability to target problem areas rather than taking a blanket approach;
smarter decisions with regard to development/maintenance activities for local areas;
greater awareness and understanding of customer issues and requirements in local areas; and
building better relationships between the distribution network provider and stakeholders (both internal and external) in an area, eg local service crews, community groups, councils and customers.
7.4 State level performance Figure 7.1 and Figure 7.2 show that, at a State-wide level, both the frequency (SAIFI) and duration (SAIDI) of interruptions increased during 2013-14 compared to previous years. SAIFI was the highest in 10 years and SAIDI the second highest in 10 years. The higher SAIFI and SAIDI were due to increased outages caused by bad weather, vegetation coming into contact with overhead powerlines and asset-related failures.8
8 http://www.auroraenergy.com.au/Aurora/media/pdf/about_aurora/annual_report/Aurora-Energy-Annual-Report-
2013-14.pdf

80 ENERGY IN TASMANIA – PERFORMANCE REPORT 2013-14
Figure 7.1 Distribution system performance - SAIFI
Figure 7.2 Distribution system performance - SAIDI
7.4.1 Major event days While distribution networks are built to cope with normal operating conditions it is impractical to build a network to withstand all extreme weather or other unexpected events. When they occur, these events can have a major impact on performance measures such as SAIDI and SAIFI. As a result, changes in SAIDI and SAIFI may reflect the impact of major events rather than provide a measure of how well the distribution network is being managed.
In an attempt to establish the underlying performance of the network, the Regulator has defined9 a major event day (MED) so that such days can be removed from the performance data (and be replaced by a statistically average day) to establish a less
9 The Regulator defined a major event day as that calculated according to the US Institute of Electrical and
Electronics Engineers (IEEE) Standard 1366-2003.
0.00
0.50
1.00
1.50
2.00
2.50
3.00
04-05 05-06 06-07 07-08 08-09 09-10 10-11 11-12 12-13 13-14
SAIF
I (in
terr
uptio
ns)
0 50
100 150 200 250 300 350 400 450
04-05 05-06 06-07 07-08 08-09 09-10 10-11 11-12 12-13 13-14
SAID
I (M
inut
es)

ENERGY IN TASMANIA – PERFORMANCE REPORT 2013-14 81
weather dependent measure. The threshold established for a MED in the 2013-14 period is any day in which the State-wide SAIDI exceeds 5.96 minutes.
In 2013-14 there were six MEDs, as outlined in Table 7.2. Collectively, MEDs contributed 150 minutes to total system SAIDI and 0.39 interruptions to total system SAIFI.10 This is a considerably larger impact than the previous year when were four events classified as a MED and contributed 51 minutes to system SAIDI.
Table 7.2 Major event days during 2013-14
Date SAIDI impact
minutes
Number of faults
Customers affected
(approximately)
Cause
18 August 2013 6 91 10 500 Storms in the north and north west of the State
2 October 2013 41 205 30 000 Storms in the north and north west of the State
3 November 2013
8 39 7 000 Storms in the north west and south of the State
2 January 2014 6 95 13 000 High winds in the south of the State
6 January 2014 8 95 10 000 Storms in the north and north west of the State
9 February 2014 70 163 54 000 Storms in the north and south of the State
7.4.2 Performance excluding Major Events Days Removing the impact of MEDs provides a better indication of network performance. As illustrated in Figure 7.3 and Figure 7.4 both the SAIDI and SAFI increased in 2013-14 and were above the ten year average and highest for ten years. SAIFI increased from 1.66 interruptions in 2012-13 to 2.21 interruptions in 2013-14. SAIDI increased from 192 minutes in 2012-13 to 260 minutes in 2013-14.
10 ‘System SAIDI’ and ‘system SAIFI’ includes MEDs.

82 ENERGY IN TASMANIA – PERFORMANCE REPORT 2013-14
Figure 7.3 Total system SAIFI including MEDs
Figure 7.4 Total system SAIDI including MEDs
7.4.3 Causes of supply interruptions
The causes of supply interruptions during 2013-14 and their specific contributions to SAIFI and SAIDI are presented in Figure 7.5 and Figure 7.6 respectively.
0.00
0.50
1.00
1.50
2.00
2.50
3.00
04-05 05-06 06-07 07-08 08-09 09-10 10-11 11-12 12-13 13-14
SA
IFI
(int
erru
ptio
ns)
SAIFI(without MED) MED 10 yr average without MED
0 50
100 150 200 250 300 350 400 450
04-05 05-06 06-07 07-08 08-09 09-10 10-11 11-12 12-13 13-14
SA
IDI
(Min
utes
)
SAIDI(without MED) MED 10 yr average without MED

ENERGY IN TASMANIA – PERFORMANCE REPORT 2013-14 83
Figure 7.5 Contributions to SAIFI by cause
Figure 7.6 Contributions to SAIDI by cause
7.4.3.1 Asset-related failures
Asset-related failures comprise faults on switches, transformers, insulators and conductors. Connectors, conductors and ‘conductor clashing’ in windy conditions have been identified as the most common causes for asset-related failures. Corrosion, wear, pollution such as salt, and environmental and weather influences are other causes of asset related failures.
There were 3 393 asset-related interruptions in 2013-14. This category had the second largest number of interruptions in the period (planned interruptions being the largest). The asset-related failures that had the greatest impact on SAIFI and SAIDI in the period were pole damage, underground cable failures and connection failures. Asset-related interruptions contributed 0.86 interruptions to SAIFI and 109 minutes to SAIDI and are above the levels in the previous few years.
0.0
0.5
1.0
1.5
2.0
2.5
3.0
09-10 10-11 11-12 12-13 13-14
SAIF
I (In
terr
uptio
ns)
Weather
Vegetation
Planned
Cause Unknown
Birds and Animals
Assets
Total System SAIFI (inc MEDs)
0
50
100
150
200
250
300
350
400
450
09-10 10-11 11-12 12-13 13-14
SAID
I (M
inut
es)
Weather
Vegetation
Planned
Cause unknown
Birds and animals
Assets
Total System SAIDI (inc MEDs)
84 ENERGY IN TASMANIA – PERFORMANCE REPORT 2013-14
7.4.3.2 Cause unknown
When field crew or line worker patrols cannot confidently identify the likely cause of an outage, it is categorised as ‘cause unknown’. In many cases the cause is suspected to be the result of animals, vegetation or windborne objects such as tree branches contacting powerlines before dropping to the ground, making it difficult to establish the cause with any certainty. Whilst these faults are officially reported as ‘cause unknown’, a probable cause of failure is also recorded.
7.4.3.3 Vegetation
The impact of vegetation-related interruptions on system availability in 2013-14 increased compared to the previous year, with 700 incidents attributed to vegetation. Their contribution to SAIDI also increased, from 41 minutes of SAIDI in 2012-13 to 95 minutes in 2013-14. Their contribution to SAIFI increased from 0.22 interruptions in 2012-13 to 0.44 interruptions in 2013-14. These increases can be largely attributed to bad weather experienced during the year.
Around 80 per cent of the vegetation related events were caused by vegetation outside the clearance zone. These events contributed 0.40 interruptions to SAIFI and 90 minutes to SAIDI.
7.4.3.4 Weather related
Weather-related causes include lightning strikes and windborne objects such as bark forming a ‘bridge’ between adjacent live wires. There were 1 341 weather related incidents in 2013-14, most of which were interruptions involving windborne material. This is a considerable increase from the 631 weather related incidents recorded in 2012-13. In 2013-14, weather-related incidents contributed 82 minutes to SAIDI and 0.35 to SAIFI.
Lightning strikes are also closely linked to weather related incidents and have, in the past, had a significant impact on the number of interruptions occurring on the system, particularly in rural areas. Reclosers on overhead distribution lines help minimise the impact of transient events such as lightning strikes by automatically reconnecting after the fault is cleared. Momentary interruptions that are successfully restored within one minute are not counted as interruptions.
7.4.3.5 Planned interruptions
The largest contributor to the number of interruptions in 2013-14 was planned interruptions. The frequency of planned interruptions in 2013-14 was 0.19 SAIFI, which is the same as 2012-13. However, the annual minutes off supply due to planned interruptions increased slightly, contributing 52 minutes to SAIDI in 2013-14, up from 46 minutes in 2012-13. Despite a slightly higher SAIDI in 2013-14, the contribution of planned interruptions to system SAIDI and SAIFI has generally been decreasing over the past five years.

ENERGY IN TASMANIA – PERFORMANCE REPORT 2013-14 85
7.5 Response to interruptions CAIDI measures the length of an average interruption experienced by a customer and is largely influenced by the response time of the distribution network operator to faults after they occur. The location of the incident is an important factor in CAIDI as the distance repair crews need to travel has a bearing on the time it takes to repair a fault. Figure 7.7 Historical CAIDI
Figure 7.7 shows total CAIDI, including the impact of MEDs. In 2013-14, CAIDI increased compared to the previous few years, with the average time taken to restore power following an interruption being just over two and a half hours.
The impact of MEDs on CAIDI in 2013-14 was relatively high compared to the previous three years, as reflected by an increasing gap between the average restoration times for MEDs and the average restoration time for other interruptions. Excluding the impact of the MEDs, the average restoration time in 2013-14 was just under two hours which is around the same restoration time as the past few years.
Figure 7.7 compares CAIDI for planned and unplanned interruptions. The interruption duration for planned interruptions is significantly higher than the figure for unplanned. This is partly due to the treatment of a number of planned interruptions as a single interruption, resulting in better utilisation of resources and minimising the frequency of interruptions to consumers. It is also partly due to the ‘live line first’11 concept which has seen the frequency of planned interruptions fall at a faster rate than their duration. This is due to the nature of those tasks that can be carried out via live line techniques.
7.6 Category performance The annual performance figures for each supply area category for 2013-14 against the TEC limits are shown in Table 7.3.
11 ‘live line first’ is assessing if work can be done without the need to disconnect customers first ie the work is done
while the system is ‘live’. This eliminates the need for a planned interruption.
0
30
60
90
120
150
180
09-10 10-11 11-12 12-13 13-14
CA
IDI
(min
ute
s)
Impact of MEDs Net CAIDI
0
50
100
150
200
250
300
09-10 10-11 11-12 12-13 13-14
CA
IDI
(min
ute
s)
planned unplanned

86 ENERGY IN TASMANIA – PERFORMANCE REPORT 2013-14
Table 7.3 Performance indices (1 July 2013 to 30 June 2014)
Supply reliability category Average number of interruptions
Average minutes off supply
Category frequency limit
Actual category frequency
Category duration limit
Actual category duration
Critical Infrastructure 0.20 0.21 30 16
High Density Commercial 1.00 0.47 60 43
Urban and Regional Centres 2.00 0.85 120 164
Higher Density Rural 4.00 2.18 480 521
Lower Density Rural 6.00 3.11 600 740
Of the five categories performance in 2013-14 only one was below both frequency and duration limits as set out in the TEC. Four categories exceeded either the frequency or duration limits, with three exceeding the duration limit and one exceeding the frequency limit.
7.6.1 Critical infrastructure The Critical Infrastructure category comprises one community - Hobart CBD emergency services - which is supplied by 17 feeders from North, East and West Hobart.
Despite the frequency of interruptions being higher than the SAIFI limit in 2013-14, the performance of the distribution network in the Critical Infrastructure category improved compared to the previous two years in terms of both frequency and duration of interruptions (Figure 7.8).
Figure 7.8 Critical Infrastructure SAIDI and SAIFI
7.6.2 High Density Commercial
The High Density Commercial category was the only category in 2013-14 where both frequency and duration of interruptions was well below the SAIFI and SAIDI limits (Figure 7.9).
0.0
0.1
0.2
0.3
09-10 10-11 11-12 12-13 13-14
SAIF
I (In
terr
uptio
ns)
SAIFI Limit
0 5
10 15 20 25 30 35
09-10 10-11 11-12 12-13 13-14
SAID
I (M
inut
es)
SAIDI Limit

ENERGY IN TASMANIA – PERFORMANCE REPORT 2013-14 87
Figure 7.9 High Density Commercial SAIDI and SAIFI
7.6.3 Urban and Regional Centres
In 2013-14, network performance in the Urban and Regional Centres category was well below the SAIFI limit in terms of the number of interruptions but, in contrast to the three previous years, was over the SAIDI limit for the duration of interruptions (Figure 7.10).
Figure 7.10 Urban and Regional Centres SAIDI and SAIFI
7.6.4 Higher Density Rural
In 2013-14, network performance in the Higher Density Rural category was well below the SAIFI limit in terms of the number of interruptions but, in contrast to the three previous years, was over the SAIDI limit for the duration of interruptions (Figure 7.11).
0.0
0.2
0.4
0.6
0.8
1.0
1.2
09-10 10-11 11-12 12-13 13-14
SAIF
I (In
terr
uptio
ns) SAIFI Limit
0
20
40
60
80
100
09-10 10-11 11-12 12-13 13-14
SAID
I (M
inut
es)
SAIDI Limit
0.0
0.5
1.0
1.5
2.0
2.5
09-10 10-11 11-12 12-13 13-14
SAIF
I (In
terr
uptio
ns) SAIFI Limit
0
40
80
120
160
200
240
09-10 10-11 11-12 12-13 13-14
SAID
I (M
inut
es)
SAIDI Limit

88 ENERGY IN TASMANIA – PERFORMANCE REPORT 2013-14
Figure 7.11 Higher Density Rural SAIDI and SAIFI
7.6.5 Lower Density Rural
In 2013-14, network performance in the Lower Density Rural category was well below the SAIFI limit in terms of the number of interruptions but, in contrast to the three previous years, was over the SAIDI limit for the duration of interruptions (Figure 7.12).
Figure 7.12 Lower Density Rural SAIDI and SAIFI
7.7 Individual community performance The aggregated performance of communities in each community category is shown in Table 7.4. There was a total of 38 communities classified as ‘poor-performing’ in 2013-14, ie these communities exceeded the TEC limits for frequency and/or duration of interruptions. The TEC requires that a distribution service provider makes reasonable endeavours to ensure that the average annual number and duration of interruptions in each community category does not exceed the relevant limit.
0.0
1.0
2.0
3.0
4.0
5.0
09-10 10-11 11-12 12-13 13-14
SAIF
I (In
terr
uptio
ns) SAIFI Limit
0
240
480
720
960
09-10 10-11 11-12 12-13 13-14
SAID
I (M
inut
es)
SAIDI Limit
0.0 1.0 2.0 3.0 4.0 5.0 6.0 7.0
09-10 10-11 11-12 12-13 13-14
SAIF
I (In
terr
uptio
ns) SAIFI Limit
0
200
400
600
800
1000
1200
09-10 10-11 11-12 12-13 13-14
SAID
I (M
inut
es)
SAIDI Limit

ENERGY IN TASMANIA – PERFORMANCE REPORT 2013-14 89
Table 7.4 Individual community performance indices (1 July 2013 to 30 June 2014)
Community category
Average number of interruptions
Average minutes off supply
Number of communities
non-complying in both
frequency and duration
TEC community
limit
Number of non-
complying communities
TEC community limit (mins)
Number of non-
complying communities
Critical Infrastructure 0.2 1/1 30 0/1 0/1
High Density Commercial 2.0 0/8 120 0/8 0/8
Urban and Regional Centres 4.0 3/32 240 12/32 3/32
Higher Density Rural 6.0 5/33 600 11/33 5/33
Lower Density Rural 8.0 2/27 720 14/27 2/27
Total 11/101 37/101 10/101
In 2013-14, the frequency of interruptions in 11 communities exceeded their respective SAIFI limits. Most of these communities were in the Urban and Regional Centres category and the High Density Rural category and experienced a high number of unplanned interruptions during the year. The duration of interruptions in 37 communities exceeded the SAIDI limits, while the frequency and duration of interruptions in ten communities exceeded both SAIFI and SAIFI limits.
7.7.1 High Density Commercial
There were eight communities within the High Density Commercial community category (Figure 7.13). In 2013-14, the network performance in the High Density Commercial category was well below the limit for both frequency and duration.

90 ENERGY IN TASMANIA – PERFORMANCE REPORT 2013-14
Figure 7.13 High Density Commercial community SAIDI and SAIFI
7.7.2 Urban and Regional Centres
There were 32 communities in the Urban and Regional Centres category. The distribution network performance for these communities is shown in Figure 7.14. In 2013-14, network performance for 20 communities was satisfactory as both duration and frequency of interruptions in these communities was either at or below the SAIDI and SAIFI limits. The duration of interruptions in the remaining 12 communities exceeded the SAIDI limit with the frequency of interruptions in three communities also exceeding the SAIFI limit. The frequency and duration of interruption in Deloraine, Port Sorell and St Helens was above both the SAIDI and SAIFI limits.
Strahan experienced the most minutes off supply in 2013-14 (around 1 095 minutes or over 18 hours without electricity). The network performance in Strahan consistently fails to stay below the TEC limits.
Figure 7.14 Urban and Regional Centres community SAIDI and SAIFI
0.0
0.5
1.0
1.5
2.0
2.5
3.0
Bur
nie
CBD
Dev
onpo
rt C
BD
Gle
norc
hy
Com
mer
cial
Hob
art
Kin
gs M
eado
ws
Kin
gsto
n Com
mer
cial
Laun
cest
on C
BD
Ros
ny C
omm
erci
al SA
IFI
(In
terr
up
tion
s)
SAIFI Limit
0
30
60
90
120
150
Bur
nie
CBD
Dev
onpo
rt C
BD
Gle
norc
hy
Com
mer
cial
Hob
art
Kin
gs M
eado
ws
Kin
gsto
n Com
mer
cial
Laun
cest
on C
BD
Ros
ny C
omm
erci
al S
AID
I (m
inu
tes)
SAIDI Limit
0.0
2.0
4.0
6.0
Bridp
ort
Brigh
ton
Bur
nie
- Pe
ngui
n D
elor
aine
D
evon
port
G
eorg
e To
wn
Had
spen
H
obar
t U
rban
H
uonv
ille
Kin
gsto
n - …
La
trob
e La
unce
ston
Urb
an
Lew
isha
m -
Dod
ges …
Lo
ngfo
rd
Mar
gate
- S
nug
Mid
way
Poi
nt
New
Nor
folk
Pe
rth
Port
Sor
ell
Que
enst
own
Ros
eber
y Sco
ttsd
ale
She
ffie
ld
Sm
ithto
n Som
erse
t -
Wyn
yard
Sor
ell
St
Hel
ens
Str
ahan
Ta
mar
Sou
th
Turn
ers
Bea
ch
Ulv
erst
one
Wes
tbur
y
SA
IFI(
Inte
rru
ptio
ns)
SAIFI Limit

ENERGY IN TASMANIA – PERFORMANCE REPORT 2013-14 91
7.7.3 Higher Density Rural
There were 33 communities in the Higher Density Rural category. Network performance for these communities is shown in Figure 7.15. In 2013-14, the duration and frequency of interruptions in 22 communities in the Higher Density Rural category was either at or below the SAIDI and SAIFI limits. The duration of interruptions in the remaining 11 communities exceeded the SAIDI limit with the frequency of interruptions in five communities also exceeding the SAIFI limit.
Zeehan experienced 3 513 minutes, or almost 2.4 days, off supply in 2013-14. According to TasNetworks, on 12 August 2013 an interruption caused by lightning damage contributed 644 minutes; a pole top fire on 9 November 2013 contributed 473 minutes and eight unplanned interruptions contributed 1 278 minutes to SAIDI. Other Higher Density rural communities that experienced high minutes off supply in 2013-14 included the Forestier Peninsular which experienced considerable interruptions due to asset failures and Copping-Dunalley due to storm damage on 9 February 2014 (a MED).
0
240
480
720
960
1 200
Bridp
ort
Brigh
ton
Bur
nie
- Pe
ngui
n D
elor
aine
D
evon
port
G
eorg
e To
wn
Had
spen
H
obar
t U
rban
H
uonv
ille
Kin
gsto
n - …
La
trob
e La
unce
ston
Urb
an
Lew
isha
m -
Dod
ges …
Lo
ngfo
rd
Mar
gate
- S
nug
Mid
way
Poi
nt
New
Nor
folk
Pe
rth
Port
Sor
ell
Que
enst
own
Ros
eber
y Sco
ttsd
ale
She
ffie
ld
Sm
ithto
n Som
erse
t -
Wyn
yard
Sor
ell
St
Hel
ens
Str
ahan
Ta
mar
Sou
th
Turn
ers
Bea
ch
Ulv
erst
one
Wes
tbur
y
SA
IDI
(min
ute
s)
SAIDI Limit

92 ENERGY IN TASMANIA – PERFORMANCE REPORT 2013-14
Figure 7.15 Higher Density Rural community SAIDI and SAIFI
7.7.4 Lower Density Rural
There were 27 communities in the Lower Density Rural category. Network performance for these communities is shown in Figure 7.16. In 2013-14, the duration and frequency of interruptions in 13 communities in the Lower Density Rural category was either at or below the SAIDI and SAIFI limits. The duration of interruptions in the remaining 14 communities exceeded the SAIDI limit with the frequency of interruptions in two communities also exceeding the SAIFI limit.
Bruny Island had almost 2 430 minutes (40 hours) off supply over the year. Channel, Highlands and North Esk also experienced notably high minutes off supply in 2013-14. Of the two communities that exceeded both limits, the Cressy-Blessington community had a SAIFI of over 11. The Tasman Peninsula had a SAIFI over 10 and also had notably high minutes off supply in 2013-14.
0.0
2.0
4.0
6.0
8.0
10.0 Bic
heno
Brigh
ton
Rur
al
Cam
pbel
l Tow
n Coa
l Riv
er V
alle
y Col
es B
ay
Cop
ping
- D
unal
ley
Cra
dle
Coa
st
Der
by -
Rin
garo
oma
Dev
on H
ills-
Evan
dale
D
ilsto
n -
Win
dem
ere
Forc
ett -
Dod
ges …
Fo
rest
ier
Peni
nsul
a G
rant
on-M
agra
H
uon-
Cha
nnel
H
uonv
ille
- Cyg
net
Long
ford
Rur
al
Mea
nder
Val
ley
Rur
al
Mid
-Tam
ar (
Exet
er …
O
atla
nds
Penn
a Pi
rate
s Bay
- …
Pr
imro
se S
ands
Sco
ttsd
ale
Rur
al
Sm
ithto
n Rur
al
Sou
th A
rm
St
Mar
ys
Sw
anse
a Tr
iabu
nna
- O
rfor
d U
pper
Tam
ar
Way
atin
ah
Wes
t H
uon
Riv
er
Win
nale
ah
Zee
han SA
IFI
(In
terr
up
tion
s)
SAIFI Limit
0
600
1 200
1 800
2 400
3 000
3 600
Bic
heno
Brigh
ton
Rur
al
Cam
pbel
l Tow
n Coa
l Riv
er V
alle
y Col
es B
ay
Cop
ping
- D
unal
ley
Cra
dle
Coa
st
Der
by -
Rin
garo
oma
Dev
on H
ills-
Evan
dale
D
ilsto
n -
Win
dem
ere
Forc
ett -
Dod
ges …
Fo
rest
ier
Peni
nsul
a G
rant
on-M
agra
H
uon-
Cha
nnel
H
uonv
ille
- Cyg
net
Long
ford
Rur
al
Mea
nder
Val
ley
Rur
al
Mid
-Tam
ar (
Exet
er …
O
atla
nds
Penn
a Pi
rate
s Bay
- …
Pr
imro
se S
ands
Sco
ttsd
ale
Rur
al
Sm
ithto
n Rur
al
Sou
th A
rm
St
Mar
ys
Sw
anse
a Tr
iabu
nna
- O
rfor
d U
pper
Tam
ar
Way
atin
ah
Wes
t H
uon
Riv
er
Win
nale
ah
Zee
han
SA
IDI
(min
ute
s)
SAIDI Limit
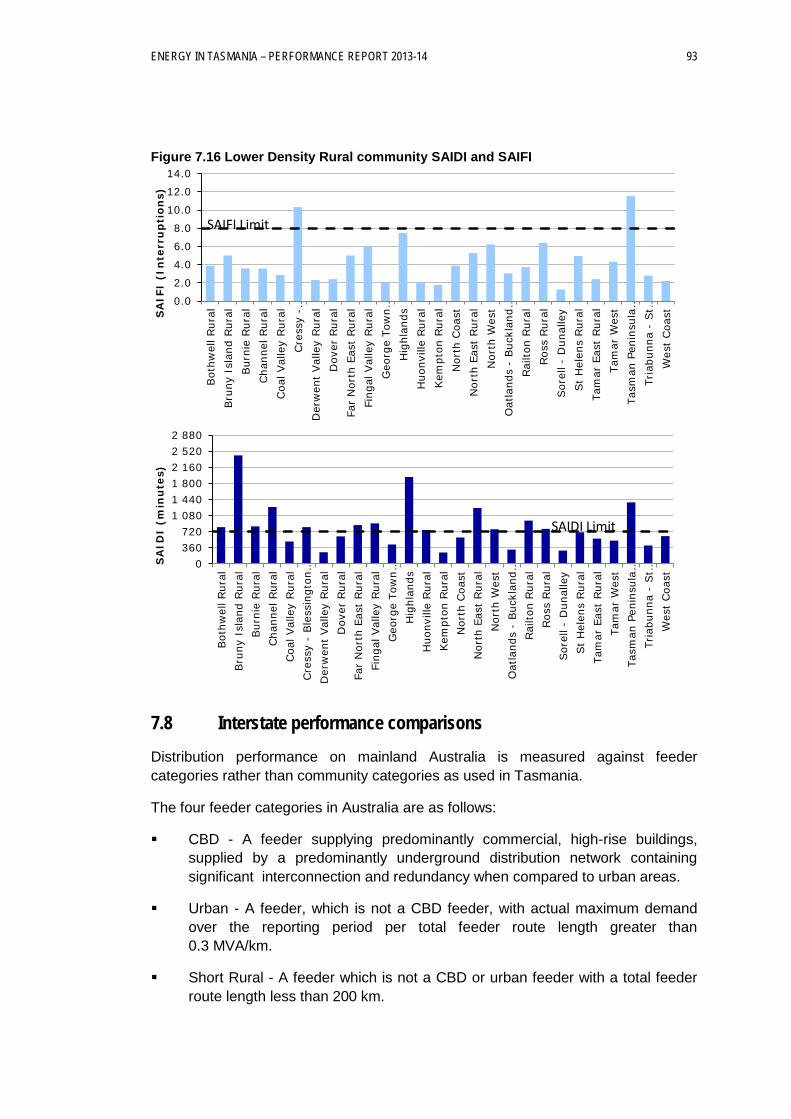
ENERGY IN TASMANIA – PERFORMANCE REPORT 2013-14 93
Figure 7.16 Lower Density Rural community SAIDI and SAIFI
7.8 Interstate performance comparisons Distribution performance on mainland Australia is measured against feeder categories rather than community categories as used in Tasmania.
The four feeder categories in Australia are as follows:
CBD - A feeder supplying predominantly commercial, high-rise buildings, supplied by a predominantly underground distribution network containing significant interconnection and redundancy when compared to urban areas.
Urban - A feeder, which is not a CBD feeder, with actual maximum demand over the reporting period per total feeder route length greater than 0.3 MVA/km.
Short Rural - A feeder which is not a CBD or urban feeder with a total feeder route length less than 200 km.
0.0
2.0
4.0
6.0
8.0
10.0
12.0
14.0
Bot
hwel
l Rur
al
Bru
ny I
slan
d Rur
al
Bur
nie
Rur
al
Cha
nnel
Rur
al
Coa
l Val
ley
Rur
al
Cre
ssy
- …
Der
wen
t Val
ley
Rur
al
Dov
er R
ural
Fa
r N
orth
Eas
t Rur
al
Fing
al V
alle
y Rur
al
Geo
rge
Tow
n …
Hig
hlan
ds
Huo
nvill
e Rur
al
Kem
pton
Rur
al
Nor
th C
oast
N
orth
Eas
t Rur
al
Nor
th W
est
Oat
land
s -
Buc
klan
d …
Rai
lton
Rur
al
Ros
s Rur
al
Sor
ell -
Dun
alle
y St
Hel
ens
Rur
al
Tam
ar E
ast
Rur
al
Tam
ar W
est
Tasm
an P
enin
sula
…
Tria
bunn
a -
St …
W
est
Coa
st
SA
IFI
(In
terr
up
tion
s)
SAIFI Limit
0 360 720
1 080 1 440 1 800 2 160 2 520 2 880
Bot
hwel
l Rur
al
Bru
ny I
slan
d Rur
al
Bur
nie
Rur
al
Cha
nnel
Rur
al
Coa
l Val
ley
Rur
al
Cre
ssy
- Ble
ssin
gton
…
Der
wen
t Val
ley
Rur
al
Dov
er R
ural
Fa
r N
orth
Eas
t Rur
al
Fing
al V
alle
y Rur
al
Geo
rge
Tow
n …
Hig
hlan
ds
Huo
nvill
e Rur
al
Kem
pton
Rur
al
Nor
th C
oast
N
orth
Eas
t Rur
al
Nor
th W
est
Oat
land
s -
Buc
klan
d …
Rai
lton
Rur
al
Ros
s Rur
al
Sor
ell -
Dun
alle
y St
Hel
ens
Rur
al
Tam
ar E
ast
Rur
al
Tam
ar W
est
Tasm
an P
enin
sula
…
Tria
bunn
a -
St …
W
est
Coa
st S
AID
I (m
inu
tes)
SAIDI Limit

94 ENERGY IN TASMANIA – PERFORMANCE REPORT 2013-14
Long Rural - A feeder which is not a CBD or urban feeder with a total feeder route length greater than 200 km.
For comparative purposes, Aurora Energy feeders were categorised using the supplied load value to calculate MVA (Mega Volt Ampere) per kilometre. The reliability indices provided are calculated in other jurisdictions as a weighted average by customer numbers. In contrast the weighting factor for Aurora Energy is ‘connected capacity (kVA)’.
Table 7.5 shows the 2012-13 annual performance figures, interruptions and minutes off supply for each supply area category for selected distribution networks across the country (2012-13 data has been used in this instance as it was the most recent data available at the time of writing).
The figures below reflect the performance of the distribution system only and do not include interruptions caused by third parties or transmission system faults. Tasmania and Queensland data excludes specific major events. Victorian network performance is not included since Victorian performance is reported on planned and unplanned SAIDI and SAIFI, which is not directly comparable to total network SAIDI and SAIFI.
In 2012-13, network reliability for Tasmania was generally within the specific limit set for SAIDI and SAIFI, apart from in the CBD category where the frequency of interruptions was above the acceptable limit. Most other networks had satisfactory performance in the period apart from South Australia.
Table 7.5 Distribution reliability interstate comparison, 2012-1312,
Category Distribution Network SAIDI Limit SAIDI actual
SAIFI Limit SAIFI actual
CBD Aurora Energy 60 36.0 0.2 0.28
Energex 15 1.4 0.2 0.00
Ausgrid 45 38.5 0.3 0.12
ETSA Utilities13 25 12.8 0.3 0.17
Urban Aurora Energy 120 90.0 2.0 0.90
Energex 102 71.9 1.2 0.79
Ergon Energy 147 135.1 1.9 1.49
Essential Energy 125 73.0 1.8 0.86
Ausgrid 80 57.0 1.2 0.65
Endeavour Energy 80 65.0 1.2 0.90
ETSA Utilities14 130 143.6 1.5 1.45
Actew AGL n/a 90.7 n/a n/a 0.90 n/a
12 Victorian data is for the 2012 calendar year. 13 Adelaide Business Area 14 Major Metropolitan Areas

ENERGY IN TASMANIA – PERFORMANCE REPORT 2013-14 95
Category Distribution Network SAIDI Limit SAIDI actual
SAIFI Limit SAIFI actual
Short Rural Aurora Energy 480 270.0 4.0 2.37
Energex 216 156.9 2.4 1.53
Ergon Energy 412 341.4 3.9 2.98
Essential Energy 300 237.0 3.0 1.94
Ausgrid 300 148.0 3.2 1.42
Endeavour Energy 300 200.5 2.8 2.20
ETSA Utilities15 260 299.6 1.8 1.58
Actew AGL n/a 96.3 n/a 0.86
Ergon Energy 932 951.5 7.2 6.25
Long Rural Aurora Energy 600 539.0 6.0 3.50
Ergon Energy 932 951.5 7.2 6.25
Essential Energy 700 450.0 4.5 2.94
Ausgrid 700 533.0 6.0 2.56
Endeavour Energy n/a 730.7 n/a n/a 13.50 n/a
ETSA Utilities16 295 316.8 2.8 2.28 Source: AEMC Reliability Panel 2013, Annual electricity market performance review, Final Report, March 2014.
At an interjurisdictional level, the measures of reliability for the Tasmanian network are better than the Australian weighted average (Table 7.6). However, the results do not factor in variances between the networks in each jurisdiction.
Table 7.6 SAIDI and SAIFI comparison, 2012-13
SAIDI SAIFI CAIDI
NSW 235.3 1.5 160.3
VIC 258.1 2.0 131.9
QLD 589.9 2.1 285.0
SA 277.4 2.0 136.7
WA 336.2 2.4 141.0
TAS 240.0 1.8 132.6
NT 251.5 6.7 37.4
AUS 331.0 1.9 173.8
Source: ESAA, Electricity Gas Australia 2014
7.8.1 International performance comparison
In the 2012-13 report, a comparison was made between New Zealand network performance and the Tasmanian network’s performance. This was based on the Commerce Commission of New Zealand’s Electricity Information Disclosure Summary Database - 2008 to 201217 that detailed the performance of all
15 Central 16 Eastern Hills/Fleurieu Peninsular 17 http://www.comcom.govt.nz/electricity-information-disclosure-summary-and-analysis/

96 ENERGY IN TASMANIA – PERFORMANCE REPORT 2013-14
29 electricity distributions businesses in New Zealand. This database has not been updated therefore no new comparison can be made.
7.9 Guaranteed service levels A GSL scheme has been in place since 1 January 2004. The scheme provides payments to customers who experience interruptions to their supply which exceed the limits set for duration or the number of interruptions. As mentioned in section 7.3.1, the current GSL scheme operates under the TEC and relevant guideline18. Aurora Energy's forecast of operating expenditure for the regulatory period 2012-17 includes a revenue allowance to cover Aurora Energy's forecast payments under the GSL scheme.
Minimum performance levels have been established for both frequency and duration of interruptions based on:
the location of the customers’ electrical installation; the number of power outages in a set time period that customers experience
at their electrical installation; and the length of time that the power to a customer’s electrical installation is
interrupted.
The current GSL scheme thresholds and payment amounts, shown in Table 7.7, are based the supply reliability categories in the TEC.
Table 7.7 Guaranteed service level thresholds19
Category Reliable supply
threshold (frequency) Timely restoration threshold (hours)
Critical Infrastructure, High Density Commercial and Urban
10 >8 >16
Higher Density Rural 13 >8 >16
Lower Density Rural 16 >12 >24
GSL Payment $80 $80 $160
The total number and value of GSL payments made to individual customers under the scheme in 2013-14 is provided in Table 7.8. There was a considerable increase in timely restoration payments compared to 2012-13. In 2013-14, 17 142 out of 26 665 payments were made to customers as a direct result of the six MEDS.
18 Tasmanian Economic Regulator, Guaranteed Service Level Scheme Guideline – Version 3, July 2012 19 Approved exemptions are contained in the Regulator’s Guideline – Guaranteed Service Level (GSL) Scheme,
Version 3, July 2012.

ENERGY IN TASMANIA – PERFORMANCE REPORT 2013-14 97
Table 7.8 Guaranteed service level payments
2012-13 2013-14
GSL No of payments Value of payments ($)
No of payments Value of payments ($)
Timely restoration 11 415 1 074 000 22 411 2 593 280
Reliability 4 525 363 600 4 254 340 320
Total 15 940 1 437 600 26 665 2 933 600
7.10 Reliability improvement As previously discussed, the distribution system performance in terms of reliability is monitored under the AER’s STPIS. The STPIS is a scheme to reward improved performance and penalise poor performance, where performance is defined according to:
reliability;
GSL;
customer service; and
power quality.
Specifically, TasNetworks, as the distribution network operator from 1 July 2014, will be financially penalised or financially rewarded based on its performance against targets for:
reliability (SAIDI, SAIFI and MAIFI20 of the five reliability categories); and
customer service (telephone call answering).
The Regulator notes that while the AER’s STPIS has adopted the five reliability categories, there are no financially based performance measures for the 101 communities defined in the TEC. However, the Regulator will continue to monitor performance against the TEC reliability standards to ensure reasonable endeavors are being made to meet the community reliability targets over the AER’s next regulatory period.
The Aurora Energy Distribution System Planning Report 2014 details planned activities for improving performance for individual communities. The report is available on the TasNetworks website.
20 MAIFI - Momentary Average Interruption Frequency Index

98 ENERGY IN TASMANIA – PERFORMANCE REPORT 2013-14
7.11 Quality Power quality refers to the quality of the electrical power supply so that the users of electric power can utilise electricity from the distribution system successfully, without interference or interruption.
It covers deviations from the standard 230/400 volt 50 Hertz supply including momentary voltage sags and swells, dips and spikes, harmonics, brownouts and other electrical noise or pollution.
Power quality has become more important in recent years as customers have become increasingly reliant on electronically sensitive equipment. There is already a difference between the electricity supply quality experienced and the standards for electricity supply to computer equipment set by such bodies as the Information Technology Industry Council (ITIC) and the Computer and Business Equipment Manufacturers Association (CBEMA).
These bodies set standards for voltage sags which computer equipment should be able to withstand. However, indications are that typical distribution networks regularly suffer from voltage sags of higher magnitude or duration, which could have a detrimental effect on computer hardware and cause data loss or equipment failure.
The distribution performance indicators for power quality that are required to be reported under the Regulator’s Performance and Information Reporting Guideline are shown in Table 7.9.

ENERGY IN TASMANIA – PERFORMANCE REPORT 2013-14 99
Table 7.9 Quality of supply performance indicators
Quality of supply issue 2009-10 2010-11 2011-12 2012-13 2013-14
Over-voltage events due to high voltage injection eventsa
18 17 10 23 0
Customers receiving over-voltage due to high voltage injectionb
0 0 0 0 0
Over-voltage events due to lightningc
1080 217 513 413 902
Customers receiving over-voltage due to lightningd
233 51 75 78 73
Over-voltage events due to voltage regulation or other causese
144 84 75 78 79
Customers receiving over voltage due to voltage regulation or other causese
144 84 75 78 79
a High voltage injection events relate to reported incidents involving contact between HV and LV lines and pass through of transmission over-voltage events.
b Number of customers receiving over-voltage due to high voltage injection is taken from the number of claims made by customers for damaged equipment relating to such events.
c Over-voltage events due to lightning relates to the number of reported interruptions where the reported cause was lightning.
d Number of customers receiving over-voltage due to lightning are taken from the number of claims made by customers for damaged equipment relating to those events.
e Over-voltage events due to voltage regulation and other causes and number of customers receiving over-voltage due to those events are taken from the number of complaints attended where a recording of the supply voltage has verified the over-voltage situation.
There were 712 complaints relating to quality and reliability of supply in 2013-14, compared to 586 in 2012-13. The increase is due to the number of over-voltage events caused by lightning.
7.12 Embedded Installations There are a number of different kinds of embedded generation installations connected to the distribution network including wind turbines, water turbines, landfill gas and solar photovoltaic (PV) systems. There has been a significant increase in installed generation capacity, primarily due to a hydro generating system installed as part of a large irrigation scheme in the Midlands area and the continued growth in the number of PV installations. As at 30 June 2014, there were 20 693 PV units connected to the network.
In 2013-14 there were 9 834 applications to connect PV systems (Table 7.10). This almost doubled the installed capacity of the PV systems connected to the network from 34.5MW to 62.9MW. Installations in the period have likely increased due to the availability of government rebates assisting customers with the associated costs and also the closing of the high feed-in tariff rate for small embedded generation systems.

100 ENERGY IN TASMANIA – PERFORMANCE REPORT 2013-14
Table 7.10 Number of PV connection applications21
Period 2010 2011 2012 2013 (6mths)
2013-14
Number of Applications 1 263 2 399 6 256 3 777 9 834
7.13 Customer service
7.13.1 Call centre
As operator of the distribution network during 2013-14, Aurora Energy gathered network performance information through its call centre and received information back from field crews regarding faults, repairs undertaken and restoration details.
The call response system posts information on interruptions directly on the Telstra exchange, reducing the need for customers to connect to the call centre. When the recorded information is not sufficient to meet a customer’s needs, or when a customer has a new fault to report, the customer is then transferred to the call centre for assistance. Customers only hear interruption messages relating to their specific geographical area, which effectively reduces queue times and shorter messaging for reported faults during large-scale interruptions.
The calls managed through Aurora Energy’s fault centre for the reporting period, including those answered by an automated response service, are collated in Table 7.11.
The number of calls received by the fault centre increased by approximately 41 per cent compared to 2012-13, with the number of calls as a percentage of customers increasing from 60 to 83 per cent.
Table 7.11 Number of calls to the fault centre
Year 09-10 10-11 11-12 12-13 13-14
Total number of calls 259 588 177 315 160 678 167 223 235 889
As % of total customers 95 64 58 60 83
A total of 235 889 calls were made to the fault centre in 2013-14, all of which received, in the first instance, recorded information from the Telstra exchange. Approximately 13 per cent of calls were abandoned before the recorded message, while 41 per cent of callers disconnected after receiving this information. Another 11 per cent of callers disconnected after hearing the message again. Around 30 per cent of callers spoke to an operator to report a new fault or to seek further information. Around three per cent of callers spoke to an operator to report a life threatening or dangerous situation. Around two per cent of calls were terminated for unknown reasons.
21 The number of PV connections applications was recorded in calendar years up June 2013.

ENERGY IN TASMANIA – PERFORMANCE REPORT 2013-14 101
7.13.2 Customer connections
The distribution network service provider is responsible for connecting new customers. The NECF requires that new customer connections are made in a timely manner and and in accordance with any relevant requirements of the energy laws22.
The Regulator requires information on the number of connections made relative to these targets. A breakdown of new connections and reconnections is shown in Table 7.12.
Table 7.12 New connections and reconnections
New Connections and Reconnections 2012-13 2013-14
Total new connections 2 206 2 124
Total new connections completed by scheduled date 1 436 1 845
Total Customer Charter Payments for new connections (number / $) 1 286 / $134 140 534 / $61 210
Total reconnections 33 302 33 337
Total reconnections completed by scheduled date 33 066 32 998
Total Customer Charter Payments for reconnections (number / $) 0 / $0 0 / $0
There were 2 124 new connections in 2013-14 (around four per cent less than in 2012-13) with 87 per cent completed by the scheduled date compared to 65 per cent in 2012-13. There was a 58 per cent decrease in the number of payments made for failure to establish new connections on time compared to 2012-13, with a 54 per cent decrease in the amount paid.
7.13.3 Customer charter
Some of Aurora Energy’s service standards were backed up by a guarantee, which enabled customers to claim a credit to their account within one month of an incident where Aurora Energy did not meet a specific service standard.
Aurora Energy had three guarantees:
quick connections – ensuring that new connections and reconnections are completed by the scheduled date;
keeping you connected – providing prior notice to customers of planned interruptions; and
prompt repairs – ensures that faulty street lights are repaired within a reasonable time frame.
22 National Energy Retail Rules, Part 4, Division 2, Rule 79.

102 ENERGY IN TASMANIA – PERFORMANCE REPORT 2013-14
In total, there were 577 payments made under the customer charter during 2013-14, a significant decrease from 2012-13. Most payments were made under the ‘quick connections’ guarantee. There were 30 payments made against the ‘keeping you connected’ guarantee relating to planned interruptions. Thirteen payments were made for delayed repair of street lighting. Figure 7.17 shows the total number of payments made under the Customer Charter over the past five years.
Figure 7.17 Number of customer charter payments
7.14 Energy Ombudsman The Energy Ombudsman deals with complaints regarding energy distribution services. For details about complaints for 2013-14, refer to table 4.3 in Chapter 4 (land, provision and supply).
7.15 Financial Performance The AER is responsible for the economic regulation of all electricity distribution services in the NEM. For financial performance information relating to Aurora Energy’s distribution activities refer to Aurora Energy’s Regulatory Information Notice available at: https://www.aer.gov.au.
0 200 400 600 800
1000 1200 1400 1600
09-10 10-11 11-12 12-13 13-14
Num
ber o
f pay
men
ts

ENERGY IN TASMANIA – PERFORMANCE REPORT 2013-14 103
8 POWER SYSTEM
8.1 Introduction The AEMO manages the power system in Tasmania using sophisticated control systems to monitor the power system and ensure it operates within its physical limits and operating standards.
Information in this Chapter is from published AEMO reports, as well as Transend and Aurora Energy’s Annual Planning Reports for 2013-14.
8.2 Ancillary services AEMO is responsible under the NER for ensuring that the power system is operated in a safe, secure and reliable manner. Consequently, AEMO maintains key technical characteristics of the power system such as frequency, network loading and voltage, within certain limits through the operation of an ancillary services market. Ancillary services in the NEM fall within one of three categories:
FCAS – used by AEMO to maintain the frequency of the power system within frequency operating standards by responding to fluctuations in frequency by altering generation or demand;
network control ancillary services – used to control the voltage at different points of the electrical network or control the power flow on network elements; and
system restart ancillary services – these are used when the power system must be ‘restarted’ after a partial or total blackout of the system.
8.2.1 Frequency control ancillary services
FCAS are services required to maintain the power system frequency within the bands stipulated by Tasmania’s Frequency Operating Standards. FCAS can be divided into two distinct categories:
Regulation FCAS continually provides for the correction of minor deviations in load1 or generation and are supplied by generators on Automatic Generation Control (AGC). Under the AGC, generators’ output is controlled to maintain the frequency within the standards; and
Contingency FCAS are used to correct large frequency variations which occur when a contingency event occurs, such as a generator disconnecting from the electricity grid, a network failure, or sudden loss of a customer’s load. Contingency FCAS are generally supplied by generators altering their output,
1 Load is defined as a consumer’s demand for electricity.

104 ENERGY IN TASMANIA – PERFORMANCE REPORT 2013-14
but may also be supplied by customers agreeing to alter their load or disconnect.
Generators and participating customers competitively bid to provide these services through FCAS markets and are paid by AEMO. AEMO recoups this cost from generators or customers in accordance with the NER.
8.3 Frequency Although Tasmania is a participating jurisdiction in the NEM, the Tasmanian power system is not synchronised with the mainland’s power system. This is due to the Basslink interconnector being an asynchronous direct current (DC) connection. As a result, the frequency operating standards adopted in Tasmania allow for wider variations than the NEM mainland equivalents. The significantly wider standards recognise that a large number of installed hydroelectric generators are unable to change their output rapidly therefore relatively large fluctuations in power can occur in Tasmania (compared to the mainland) from the operations of large industrial users, generator trips, transmission line trips and power transfers over Basslink.
The AEMC Reliability Panel has set Tasmanian frequency standards that specify the normal operating frequency band (49.85 to 50.15 Hz) that is acceptable for the system together with the duration and circumstances in which the frequency is allowed to deviate from that frequency band (eg if a contingency or load event occurs).
A system protection scheme (SPS) was constructed in conjunction with Basslink to manage network contingencies or an outage on Basslink. The SPS encompasses two parts; the FCSPS and the NCSPS.
The FCSPS is designed to ensure that, following the loss of Basslink, the Tasmanian frequency remains within the standards by initiating load shedding by contracted customers or increased or decreased output from contracted generators.
The NCSPS facilitates higher power transfers from Tasmania to Victoria via Basslink by allowing selected transmission lines in Tasmania to transfer power up to 95 per cent of their continuous ratings under normal system conditions, prior to the occurrence of a transmission contingency. For a more information on the NCSPS refer to pages 137-8 of the 2011-12 Energy in Tasmania report2.
In 2012-13 there were 13 events that did not meet the Frequency Operating Standards in Tasmania. Ten of these were low frequency events. Most were very short in duration and only just outside the Frequency Operating Standards.
2 http://www.economicregulator.tas.gov.au/domino/otter.nsf/LookupFiles/13252_2011-
12_Energy_in_Tasmania_Performance_Report_130123.pdf/$file/13252_2011-12_Energy_in_Tasmania_Performance_Report_130123.pdf

ENERGY IN TASMANIA – PERFORMANCE REPORT 2013-14 105
8.4 System security At some substations, a transformer malfunction during the winter peak demand may result in the remaining transformer(s) operating beyond their emergency rating making the power system non-secure.
To avoid overloading transformers during periods of high demand, Transend Networks installed automatic load shedding schemes such that if one transformer is lost the load at Norwood, St Marys, Kingston and Rokeby will be appropriately tripped to avoid overloading the remaining transformers and thereby preventing a more widespread outage.
Load shedding schemes are also in place at Boyer and Risdon to ensure security of supply to industrial customers in the event of a transformer tripping.
8.4.1 Significant incidents and AEMO directions
Table 8.1 describes the one significant incident that occurred during 2013-14 which was investigated by Transend Networks and AEMO.
Details of the incident investigated by AEMO are available on the AEMO website:
http://www.aemo.com.au/Electricity/Resources/Reports-and-Documents/Power-System-Operating-Incident-Reports
Table 8.1 System incident investigations - 1 July 2012 to 30 June 2013
Date Locality of asset(s)
Cause Investigator Incident description
1 Oct 2013
John Butters-Farrell 220 kV Line and Farrell-Rosebery-Queenstown-Newton 110 kV Line
Lightning strike
Transend & AEOMO
Transend investigated the incident and found that lightning caused the simultaneous trip of the two transmission lines - Farrell-John Butters 220 kV and Farrell-Rosebery-Queenstown 110 kV. The lightning strike was within the vicinity of shared transmission towers of the tripped lines. The protection and control schemes operated correctly in tripping the transmission lines by opening the relevant circuit breakers. As a result of this incident, there was a loss of approximately 10 MW of load and a loss of 16 MW of generation at John Butters Power Station.
AEMO is able to issue power system directions, as a power system security safety net mechanism, to maintain the power system in a secure operating state. AEMO did not issue any power system directions to Tasmanian NEM participants during 2013-14.

106 ENERGY IN TASMANIA – PERFORMANCE REPORT 2013-14
8.5 System reliability Whilst performance of the transmission and distribution networks is reported separately, it is relevant to review the overall system performance. Aurora Energy (now TasNetworks) reported total SAIDI and SAIFI (including all outages, regardless of cause or impact, including transmission and third party and customer installation faults) for customers connected to the distribution network. Whilst this does not account for large customers connected directly to the transmission system it does cover 99 per cent of all connected customers
Figure 8.1 Overall SAIDI
0
50
100
150
200
250
300
350
400
450
500
04-05 05-06 06-07 07-08 08-09 09-10 10-11 11-12 12-13 13-14
SA
IDI
(min
ute
s)
Financial Year
As shown in Figure 8.1 System SAIDI remained relatively high in 2013-14 with 418 minutes, compared to 455 minutes in 2012-13.
System SAIFI was 2.82 in 2013-14 compared to 2.31 in 2012-13, and as shown in Figure 8.2, the highest in eight years. The main causes of outages during 2013-14 were bad weather, vegetation and asset failures.
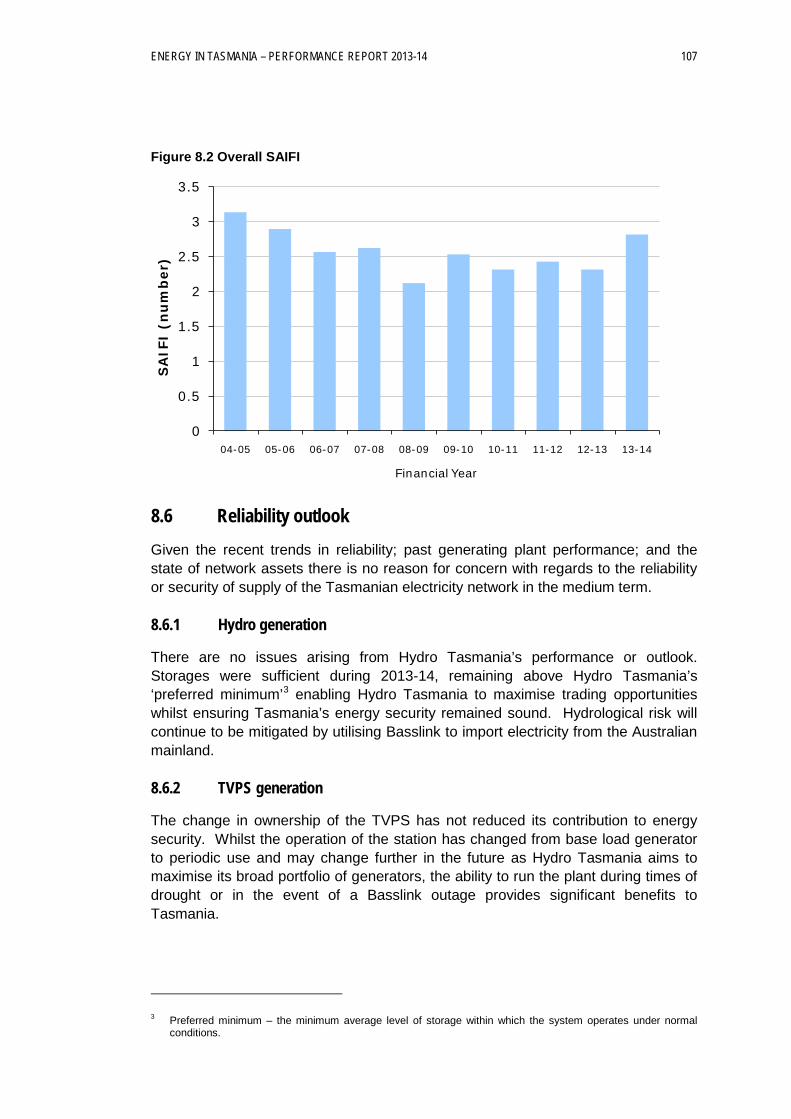
ENERGY IN TASMANIA – PERFORMANCE REPORT 2013-14 107
Figure 8.2 Overall SAIFI
0
0.5
1
1.5
2
2.5
3
3.5
04-05 05-06 06-07 07-08 08-09 09-10 10-11 11-12 12-13 13-14
SA
IFI
(nu
mb
er)
Financial Year
8.6 Reliability outlook Given the recent trends in reliability; past generating plant performance; and the state of network assets there is no reason for concern with regards to the reliability or security of supply of the Tasmanian electricity network in the medium term.
8.6.1 Hydro generation
There are no issues arising from Hydro Tasmania’s performance or outlook. Storages were sufficient during 2013-14, remaining above Hydro Tasmania’s ‘preferred minimum’3 enabling Hydro Tasmania to maximise trading opportunities whilst ensuring Tasmania’s energy security remained sound. Hydrological risk will continue to be mitigated by utilising Basslink to import electricity from the Australian mainland.
8.6.2 TVPS generation
The change in ownership of the TVPS has not reduced its contribution to energy security. Whilst the operation of the station has changed from base load generator to periodic use and may change further in the future as Hydro Tasmania aims to maximise its broad portfolio of generators, the ability to run the plant during times of drought or in the event of a Basslink outage provides significant benefits to Tasmania.
3 Preferred minimum – the minimum average level of storage within which the system operates under normal
conditions.

108 ENERGY IN TASMANIA – PERFORMANCE REPORT 2013-14
8.6.3 Wind generation
The Musselroe Wind Farm was completed and becoming fully operational during 2013-14, the amount of wind generation in Tasmania has almost doubled. This has an impact on the amount of inertia in the Tasmanian system and is discussed in section 8.6.4.
8.6.4 System inertia and fault levels
System inertia and fault levels continue to pose a possible threat to power system reliability and security. A reduction in generation in Tasmania, from lower demand, or increased imports over Basslink, could have a significant impact on system inertia and fault levels. This was demonstrated in late 2013 when TVPS had not been generating and changes were required to the Basslink filter switching controls to prevent operational issues.
System inertia and fault levels have the potential to significantly impact on both the technical and commercial viability of future wind farm developments. It is possible to manage the system inertia and fault level issues with auxiliary equipment, but the cost may not be economically justifiable. The alternative is for TasNetworks (through AEMO) to limit generation from wind farms under certain system conditions, which may adversely impact the wind farm’s viability.
At present there is no mechanism in the NEM to manage ‘bus bar’ fault levels and the NER only refers to fault levels in reference to ensuring equipment remains within its design parameters.
AEMO’s is required to ensure that system security is not compromised. AEMO’s general response to system constraints is therefore to issue instructions and/or directions to Network Service Providers and/or generators to reduce supply.
NEM participants in Tasmania have raised concerns that there is no market mechanism to manage system constraints and that AEMO will take the most expedient option. This concern is exacerbated by the fact that those commercially affected do not receive any financial compensation when directed to reduce generation.
8.7 Planning Detailed planning is required is ensure future supply and network capability is adequate to meet demand. The NER therefore requires both transmission and distribution service providers to produce Annual Planning Reports, outlining where network constraints are likely to impact on the reliability of supply (in the next 10 years for transmission and the next five years for distribution) and how each proposes to address the situation. This also gives time for other proponents to put forward non-network alternatives to manage the constraints.
AEMO is similarly required to develop a National Transmission Network Development Plan (NTNDP). The NTNDP provides an independent strategic plan

ENERGY IN TASMANIA – PERFORMANCE REPORT 2013-14 109
offering nationally consistent information about transmission capabilities, congestion and investment options for a range of plausible market development scenarios.
The 2014 NTNDP found there was no additional capacity required in the Tasmanian transmission network and the George Town voltage control issues reported in the 2013 NTNDP have been resolved following the commissioning of two voltage control schemes by TasNetworks in June 2014 and August 2014.
Transend’s 2014 Annual Planning Report continues the recent trend of forecasting low average annual growth in Tasmania’s electricity demand with forecast growth of just 0.76 per cent per annum. The forecast winter maximum demand is however expected to grow at 1.30 per cent per annum.
Over the last few years actual growth has been lower than forecast resulting in the deferral of the impacts of emerging network constraints and the need for associated transmission development plans. In response to low growth in demand for electricity TasNetworks is looking at optimising the use of the existing network and looking at alternatives to the traditional approach to network management. With these aims in mind TasNeworks proposes the creation of a self-healing electricity network serving the Tasmanian East Coast, and a micro-grid to provide a more economically viable power supply to customers at Derwent Bridge. TasNetworks is also seeking input from customers and service providers on new approaches to managing the electricity system.
Aurora Energy’s 2014 Distribution Annual Planning Report states that there is easing in the growth of peak demand in large parts of the distribution network. However there still is significant peak demand growth in the following areas: Avoca; Derby; Hobart; Launceston; Smithton; southern Highlands; Triabunna; and Ulverstone. Aurora Energy also identified emerging major constraints in the distribution network which are likely to require large scale investment. However, TasNetworks is providing third-parties with the opportunity to offer alternative proposals to alleviate these constraints. These proposals may include non-network alternatives such as demand management or embedded generation solutions. TasNetworks intends introducing “smarter” network technology that will enable the implementation of non-network solutions such as demand-side management and distributed generation and also improve the use and resilience of the distribution network.
While the number of PV installations continued to grow rapidly during 2013-14, the impact of PV on forecast demand reduction in the Tasmanian system has been minimal due to most substations being winter peaking (summer peaking substations are mainly associated with irrigation with peak load in the early evening). However areas of higher PV concentrations are associated with increases in non-compliance with power quality standards eg overvoltage.
In response to a decline in reliability performance during 2013-14 TasNetworks will deploy reliability maintenance programs in specific areas to address isolated areas that are below target performance.

110 ENERGY IN TASMANIA – PERFORMANCE REPORT 2013-14
TasNetworks plans to establish dedicated connection points in various locations so as to enable the rapid connection of mobile generation when required. The support provided through these connections includes:
peak shaving - construction of connection points at locations where peak shaving is required (typically during winter);
contingency support - mitigating the impact of critical asset failures; and
unplanned outage management - mitigating the impact prolonged unplanned outages.
The adequacy of generation to meet forecast demand is assessed by AEMO in its Electricity Statement of Opportunities (ESOO) and by Transend in its Annual Planning Report, with neither identifying a shortage of generation capacity in Tasmania before 2027. However, AEMO acknowledges Tasmania’s capacity for continuous generation may be affected under protracted drought conditions or if gas supplies are limited.
For more information on planning for the distribution and transmission networks please refer to the Transend Networks Annual Planning Report 2014 at: https://www.tasnetworks.com.au/Aurora/media/pdf/Transend-Annual-Planning-Report-2014.pdf and Aurora Energy’s Distribution Annual Planning Report 2014 https://www.tasnetworks.com.au/Aurora/media/pdf/Distribution_Annual_Planning_Report_-_2014.pdf
8.8 System losses Electrical losses in the power system occur between generation and end use customers. Prudent system design in the transmission, sub transmission and distribution networks can reduce losses to some extent and improve the overall technical efficiency of the power system, but losses are an unavoidable consequence of any electrical circuit.
8.8.1 Energy losses in the NEM
Electrical energy losses in the NEM are factored into the financial settlement calculation, so that customers pay for the electricity generated which equates to electricity consumed plus losses. Loss factors that ‘scale up’ consumption for financial settlement are applied to different points in the network to represent the amount of electricity that would need to be generated to supply consumption at that point.
Two types of loss factors are used. Marginal loss factors apply to generators and the transmission network while distribution loss factors apply to the distribution network.
Marginal loss factors and distribution loss factors are published by AEMO in April each year. Further details can be found on AEMO’s web site.

ENERGY IN TASMANIA – PERFORMANCE REPORT 2013-14 111
8.9 Emergency management AEMO is responsible for maintaining power system security in Tasmania and coordinates responses to power system emergencies. AEMO exercises this responsibility under an agreed framework in all NEM jurisdictions (Tasmania, Victoria, South Australia, Australian Capital Territory, New South Wales and Queensland) known as the Power System Emergency Management Plan (PSEMP). In an emergency situation AEMO co-ordinates its activities with Tasmania through direct contact with the Responsible Officer, Jurisdictional System Security Coordinator and local energy entities.
In September 2005, the Jurisdictional System Security Coordinator issued an Emergency Management Planning Guideline (last updated in May 2010) that details the responsibilities and obligations of electricity supply industry entities for emergency management planning. The Guideline applies to generating facilities with an installed capacity greater than 15 MW (excluding wind farms), network service providers and large retailers.
The objectives of the Guideline are to ensure:
that plans, facilities and personnel are in place for entities to manage emergency situations that impact on the normal supply of electricity; and
a co-operative and timely response from all industry stakeholders to minimise the impact of an electricity supply emergency.
Those entities required to maintain emergency management plans (EMPs) are audited periodically using a risk based approach with the most recent audit being in 2012. Since the review, significant progress has been undertaken to improve the overall state emergency management framework. The establishment of an Energy Supply Emergency Management Plan which includes an Electricity Supply Emergency Management plan has meant that entities have been able to enhance individual EMPs with an improved ‘whole of government’ approach.
Leading up to the merger of Aurora Energy’s distribution division and Transend into TasNetworks, Aurora Energy, Transend and Hydro Tasmania aligned their internal Emergency Management Plans as much as possible to assist in the merger process. All three entities cooperated to ensure the major entities in the electricity supply chain had similar processes and would use the same terminology in emergency situations.
The Department of State Growth (formerly the Department of Infrastructure, Energy and Resources (DIER)) supports the relevant Minister in meeting the Minister’s responsibilities for electricity, natural gas and petroleum emergency management in Tasmania.
Further information about energy emergency management in Tasmania is provided in DIER’s 2012-13 Annual Report which is available at: http://www.stategrowth.tas.gov.au/__data/assets/pdf_file/0017/94121/DIER_Annual_Report_2013-14.pdf


ENERGY IN TASMANIA – PERFORMANCE REPORT 2013-14 113
9 WHOLESALE MARKET
This chapter discusses the dynamics and operation of the wholesale electricity market and includes ancillary services markets.
This report covers the period from 1 July 2013 to 30 June 2014 and is based primarily on data provided by NEM-ReviewTM software.1
9.1 Wholesale market The wholesale electricity market comprises a physical market for electricity and an associated derivatives market.2
9.1.1 Spot Market
The NEM3 comprises five regional market jurisdictions (Queensland, New South Wales, Victoria, South Australia and Tasmania) connected by a number of interconnectors into a single alternating current system and associated synchronous electricity transmission grid. The NEM is a wholesale electricity spot market where supply and demand is met simultaneously in real-time through a centrally-coordinated dispatch process.
All generation is aggregated and scheduled at five minute intervals during every hour of every day. Generators enter bids for each of their generating units comprising the amount of electricity the generator is willing to sell at each price for each generating unit. The bids are stacked from lowest to highest price with respective quantities offered aggregated. The price bid of the last generator to be dispatched to equalise supply and demand sets the regional dispatch price and the average of the six dispatch prices in each half hour (ie trading interval) sets the spot price4 which is paid to all generators within that region for that trading interval irrespective of each generating unit’s bid price.
There are parallel markets in ancillary services such as FCAS and System Restart Ancillary Services (SRAS) and co-optimisation of the energy and ancillary services markets determines which generators are dispatched in each time interval to meet demand across all NEM regions at least cost.
AEMO is the national electricity market and system operator. AEMO’s functions are prescribed in the NEL whilst the NER prescribe procedures and processes for
1 NEM–Review provides data on Australia's National Electricity Market (NEM).
2 Derivatives are financial contracts which allow risk related to the price of the underlying asset to be transferred from one party to another.
3 For more information on the NEM, please see http://www.aemo.com.au/About-the-Industry/Energy-Markets/National-Electricity-Market.
4 The spot price is also referred to as the ‘pool price’ or ‘Regional Reference Price’ (RRP).

114 ENERGY IN TASMANIA – PERFORMANCE REPORT 2013-14
market operations, power system security, network connection and access pricing for network services in the NEM and national transmission planning.
The AEMC and the AER are responsible for overseeing and regulating the NEM. The AEMC is responsible for rule making in response to requests for rule changes, usually from NEM participants. The AER is responsible for enforcing and monitoring compliance with the NER, as well as for economic regulation of electricity transmission.
Entities participating in the NEM are required to be registered5 with AEMO and are categorised as:
Customers (usually retailers) who submit bids to purchase electricity through the central dispatch process. A customer’s load must be controllable according to dispatch instructions issued by AEMO.
Generators6 - any person who owns controls or operates a generating system connected to a transmission or distribution network must register as a Generator unless they meet the criteria for exemption from registration. Depending on how they have classified their generating units, non-exempt generators will register in one of the following categories:
- Market Scheduled Generator;
- Market Semi-scheduled Generator;
- Market Non-scheduled Generator;
- Non-Market Scheduled Generator;
- Non-Market Semi-scheduled Generator; or
- Non-market Non-scheduled Generator.
Generation categories are defined as follows:
- a market generating unit sells its output through the spot market;
- a non-market generating unit which sells its entire output directly to a local retailer or customer at the same connection point under a power purchase agreement;
- a generating unit that is not scheduled by AEMO as part of central dispatch;
- a generator scheduled by AEMO as part of central dispatch; and
5 The National Electricity Rules allow exemption from registration to be granted by either AEMO or the AER. For
more information refer to: http://www.aemo.com.au/Electricity/Registration.
6 http://www.aemo.com.au/Electricity/Registration/Participant-Categories/Generator

ENERGY IN TASMANIA – PERFORMANCE REPORT 2013-14 115
- a semi-scheduled generating unit has intermittent output and a nameplate rating of 30 MW or greater (or is part of a group of generating units connected at a common connection point with a combined nameplate rating of 30 MW or greater), unless AEMO approves its classification as a scheduled generating unit or a non-scheduled generating unit.
Network Service Provider (NSP)7 - any person who owns, controls or operates a transmission or distribution network must register as a Network Service Provider unless the AER provides an exemption. An NSP may have a network service dispatched and settled through the market by classifying the service as a market network service and a scheduled network service and registering as a Market NSP.
Other participants8 include Traders and Reallocators, and Special Participants (a System Operator or Distribution System Operator who carries out certain functions under the NER must be registered with AEMO).
9.1.1.1 Participants in the Tasmanian Region of the NEM
9.1.1.1.1 Customers Three registered market customers (retailers) operate in the Tasmanian NEM region - Progressive Green, Aurora Energy and ERM.
9.1.1.1.2 Generators Ownership of the Tamar Valley Power Station was transferred from Aurora Energy to Hydro Tasmania on 1 June 2013. Consequently, as at 1 July 2013, Hydro Tasmania controlled all NEM participating generating units in Tasmania.
Hydro Tasmania is registered as:
a market scheduled generator (22 hydroelectric generating units9 and five thermal generating units10);
a market non-scheduled generator (5 hydroelectric generating units and two wind generating units)11; and
7 http://www.aemo.com.au/Electricity/Registration/Participant-Categories/Network-Service-Provider
8 http://www.aemo.com.au/Electricity/Registration/Participant-Categories/Other-Participants
9 Bastyan Power Station, Catagunya / Liapootah / Wayatinah Power Station x 3, Cethana Power Station, Devils Gate Power Station, Fisher Power Station, Gordon Power Station, John Butters Power Station, Lake Echo Power Station, Lemonthyme / Wilmot Power Station x 2, Mackintosh Power Station, Meadowbank Power Station, Poatina Power Station, Poatina Power Station, Reece Power Station x2, Tarraleah Power Station, Trevallyn Power Station, Tribute Power Station, Tungatinah Power Station.
10 208 MW Mitsubishi combined cycle unit (CCGT); a 58 MW Rolls Royce open cycle gas turbine (OCGT); and three Pratt and Whitney 40 MW gas turbines.

116 ENERGY IN TASMANIA – PERFORMANCE REPORT 2013-14
a market semi-scheduled generator (one wind generating unit).12
9.1.1.1.3 Other generators Generators with installed capacity13 of less than 5 MW have a standing exemption from AEMO registration. Generating systems with an installed capacity of greater than 5 MW but less than 30 MWs can apply for an exemption from registration. In Tasmania there are a number of smaller generators with a combined installed capacity of around 30 MW which are excluded from the central dispatch process but whose output can feed into the power system. These include:
landfill gas-fired turbines (eg Launceston Renewable Energy Facility (LMS Energy Pty Ltd));
mini-hydro developments (eg Meander and Midlands mini-hydro schemes operated by Tasmanian Irrigation Pty Ltd);
co-generation plants (eg Launceston General Hospital); and
wind turbines (eg Nichols Poultry (Blowing in the Wind Pty Ltd)).
9.1.1.1.4 Network Service Provider. There were three registered NSPs in the Tasmanian NEM region during 2013-14. Transend (transmission) and Aurora Energy (distribution) are both regulated NSPs while BPL is a Market NSP as its network service is dispatched and settled through the market. Hydro Tasmania effectively controls Basslink flows through the Basslink Services Agreement (BSA)14 in place between Hydro Tasmania and BPL.
9.1.1.1.5 Other Participants. In the Tasmanian NEM region Transend and Aurora Energy were also registered during 2013-14 as ‘Special Participant System Operator’ and ‘Special Participant Distribution Operator’ respectively.
11 Butlers Gorge Power Station, Cluny Power Station, Paloona Power Station, Repulse Power Station, Rowallan
Power Station, Woolnorth Studland Bay / Bluff Point Wind Farm, Woolnorth Studland Bay / Bluff Point Wind Farm.
12 The Musselroe Wind Farm.
13 Installed capacity is the normal maximum operating rating, also known as nameplate rating.
14 The BSA specifies a range of operational requirements between Hydro Tasmania and BPL establishing the rights and obligations of both parties with respect to the operation of Basslink.

ENERGY IN TASMANIA – PERFORMANCE REPORT 2013-14 117
9.1.2 Spot market volatility
The electricity spot market is extremely volatile due to a number of factors including:
the need to continuously and instantaneously match supply with demand. In times of high demand, more expensive electricity generation is used because generally, electricity cannot be stored economically;
available capacity and demand ie regions with capacity constraints and high demand will tend to have higher prices;
fluctuations in demand ie regions with large variations in demand will require quicker response and generally more expensive generation to be used at times of peak demand;
unexpected generator outages and network constraints can lead to more expensive generating units being dispatched to ensure supply is met; and
weather, in the long term prolonged drought can constrain the availability of hydro generation and in the short term extreme hot weather will significantly increase the demand for electricity and storms may initiate network constraints.
9.1.3 Derivatives Market
The volatility of the spot market, AEMO’s prudential arrangements and the nature of the retail electricity market expose participants in the NEM to considerable financial risks. For example, a market customer must provide security for electricity purchased at the spot market price and on sell electricity in smaller volumes to customers at largely fixed prices over specific time periods. Consequently, NEM participants generally manage their financial exposure to the highly volatile spot market by utilising a range of derivative contracts.15
Derivative contracts lock in a firm price for electricity at a future date. The electricity derivatives market operates independently of the NEM and AEMO and comprises an:
over-the-counter market, comprising counterparties contracting with each other directly with contract prices generally not publically available; and
exchange traded market with products such as futures and options traded publically on ASX Energy (a subsidiary of the Australian Securities Exchange).16
15 Derivative contracts are also known as hedge contracts and financial contracts.
16 For more information on the wholesale price of electricity and the derivative market refer to: http://eex.gov.au/energy-management/energy-procurement/energy-pricing/the-wholesale-price-of-energy.

118 ENERGY IN TASMANIA – PERFORMANCE REPORT 2013-14
Prices in derivative contracts depend on:
the period of the contract;
generators’ and retailers’ appetite for risk; and
each party’s view on the likely spot market prices over the period of the contract.
Contract prices also include a premium for risk over the expected spot market price. A NEM participant may therefore choose to retain some exposure to the spot market. The level of exposure will depend on the entities’ appetite for risk and its expectation of future market conditions.
9.2 Wholesale market competition Tasmanian retailers are, in principle, able to enter into derivative contracts with generators on the Australian mainland in addition to contracting with generators in Tasmania. However, the ability to manage inter-regional price risks is an important commercial consideration.
As at 30 June 2014 Hydro Tasmania was the only significant generator in Tasmania and Aurora Energy the dominant electricity retailer in Tasmania and is generally the only counterparty for derivative contracts for retailers wanting to manage the risks of Tasmanian spot price volatility.
To facilitate the introduction of Full Retail Contestability (FRC)17 on mainland Tasmania from 1 July 2014 and to provide certainty for retailers entering the Tasmanian electricity market, the Regulator became responsible, from 1 January 2014, for regulating certain regulated derivative contracts offered by Hydro Tasmania.18
Hydro Tasmania is required to offer four regulated derivative contracts under the Tasmanian Wholesale Contract Regulatory Framework. This framework includes a legislated derivatives instrument (known as the Wholesale Contract Regulatory Instrument) which specifies the terms and conditions for the contracts and how prices for the contracts are derived. The aim of providing regulated derivative contracts is to reduce the risk faced by retailers and other NEM participants entering the Tasmanian market to a level comparable to the risk facing retailers in other regions of the NEM and consequently increase the likelihood of retailers entering the Tasmanian market.
17 All electricity customers are able to choose their retailer. Also referred to as Full Retail Competition (FRC).
18 Additional information on the regulation of Hydro Tasmania’s derivative contracts is provided at: http://www.economicregulator.tas.gov.au/domino/otter.nsf/elect-v/06R

ENERGY IN TASMANIA – PERFORMANCE REPORT 2013-14 119
9.3 Market trends
9.3.1 Volume and price
Table 9.1 shows market turnover in Tasmania was higher in the first and fourth quarters of 2013-14 reflecting the increase in electricity usage in winter. In contrast the market turnover on mainland Australia is highest in the third quarter ie during summer.
Table 9.1 Energy market turnover 2013-14 ($ millions)
Region Total turnover
Quarter 1 Quarter 2 Quarter 3 Quarter 4
Jul-Sep Oct-Dec Jan-Mar Apr-Jun
Whole NEM 2 722.99 2 530.23 2 950.65 2 314.90
Mainland (NEM) 2 599.60 2 432.18 2 857.87 2 214.41
Tasmania 123.39 98.05 92.78 100.49
Tas share in the NEM 4.53% 3.88% 3.14% 4.34%
Tas market energy supplied (GWh) 2 609.90 2 362.00 2 276.83 2 546.05
Total turnover (spot price multiplied by volume sold) in the NEM was approximately $10.52 billion in 2013-14 compared to $11.94 billion in 2012-13, with turnover in the Tasmanian market $414.7 million in 2013-14 (3.94 per cent of total market turnover) compared to $477.49 million in 2012-13.
Tasmanian annual market turnover decreased 13.2 per cent in 2013-14 compared to 2012-13 (Figure 9.1). The reduction in market turnover in 2013-14 reflects lower spot prices in the Tasmanian region.
Figure 9.1 Annual market turnover in Tasmania
0
100
200
300
400
500
600
700
08-09 09-10 10-11 11-12 12-13 13-14
Turn
over
($m
illio
ns)
Table 9.2 shows market prices during 2013-14. During the first, third and fourth quarters the average price is higher than the median price reflecting price spikes in

120 ENERGY IN TASMANIA – PERFORMANCE REPORT 2013-14
those quarters. The relatively high percentage of time the price was below $50/MWh during the third quarter, coupled with the average price being significantly higher than the median price, illustrates the volatility of spot prices during this quarter.
The 30-minute spot price reached a maximum price of $2 288.47/MWh in the third quarter, when a network constraint19 caused the five minute dispatch interval price to reach the market price cap of $13 100/MWh.20
Table 9.2 Tasmanian market prices 2013-14
Quarter 1 Quarter 2 Quarter 3 Quarter 4
Jul-Sep Oct-Dec Jan-Mar Apr-Jun
Average price (volume weighted) $/MWh 47.27 41.51 40.75 39.48
Median price $/MWh 42.30 40.32 41.72 38.16
Maximum spot price (½ hour) $/MWh 2 521.89 4 017.07 2 288.47 2 235.23
Minimum spot price (½ hour) $/MWh -20.58 -49.67 -579.67 -142.31
% of time price < 50 $/MWh % 64.1% 66.6% 83.3% 75.1%
Recorded max weekly average price $/MWh 73.68 56.97 69.42 66.37
Recorded min weekly average price $/MWh 37.22 37.50 42.89 39.32
The volume-weighted average price in Tasmania during 2013-14 was $42.34/MWh (Table 9.3), the lowest across the NEM regions, and around 33 per cent lower than the average of the remaining NEM regions ($59.43/MWh). On average Australian mainland NEM region spot prices decreased by nine per cent during 2013-14 compared to 2012-13 while Tasmanian spot prices decreased by an average of 13 per cent.
19 For more information refer to http://www.aemo.com.au/Electricity/Resources/Reports-and-Documents/Pricing-
Event-Reports/January-2013.
20 The Market Price Cap (MPC) is specified in the National Electricity Rules as the maximum price generators can bid into the market. The MPC is automatically triggered when AEMO directs network service providers to interrupt customer supply in order to keep supply and demand in the system. The MPC was $13,100/MWh during 2013-2014 and is indexed each year by the AEMC. http://www.aemc.gov.au/electricity/guidelines-and-standards.html.

ENERGY IN TASMANIA – PERFORMANCE REPORT 2013-14 121
Table 9.3 Volume weighted average price 2013-14 ($/MWh) - across NEM regions
Quarter 1 Quarter 2 Quarter 3 Quarter 4 Annual
Jul-Sep Oct-Dec Jan-Mar Apr-Jun 2013-14
Qld 60.64 58.13 71.81 51.36 60.68
NSW 55.70 55.51 51.15 50.43 53.20
Vic 55.13 50.56 63.88 47.93 54.46
SA 70.87 73.46 79.62 53.06 69.37
Tas 47.27 41.51 40.75 39.47 42.34
As illustrated in Figure 9.2, between 1 July 2007 and 30 June 2012 wholesale electricity prices in Australia had generally been decreasing due to reduced demand caused by mild weather and the impact of the subdued economic conditions during and following the Global Financial Crisis, relatively cheaper gas and an excess of wind capacity, particularly in South Australia. The relatively high prices during 2012-13 and 2013-14 reflects the impact of the introduction of the carbon pricing mechanism and long periods of hot weather leading to higher peak usage of electricity.
Figure 9.2 Financial year volume-weighted average prices ($/MWh)
0
20
40
60
80
100
120
05-06 06-07 07-08 08-09 09-10 10-11 11-12 12-13 13-14
$/M
Wh
YearTas NSW Vic QLD SA
Table 9.4 shows the number of occurrences where the half-hour spot price exceeded $100/MWh in the Tasmanian region during 2013-14.
Wholesale spot prices in Tasmania remained volatile during 2013-14 with 14 instances where the price exceeded $500/MWh (the same number of instances as during 2012-13). Most of the high price occurrences relate to the activation of network constraints in relation to the NCSPS.21 Details of high price occurrences are available at: http://www.aer.gov.au/taxonomy/term/324
21 NCSPS – Network Control System Protection Scheme

122 ENERGY IN TASMANIA – PERFORMANCE REPORT 2013-14
Table 9.4 Price occurrences over $100/MWh during 2013-14
Price range Quarter 1 Quarter 2 Quarter 3 Quarter 4
($/MWh) Jul-Sep Oct-Dec Jan-Mar Apr-Jun
101-150 23 6 14 1
151-200 1 0 6 0
201-500 2 2 8 1
501-5000 8 2 3 1
>5000 0 0 0 0
Total 34 10 31 3
Table 9.5 shows the number of instances of negative prices22 during 2013-14. The minimum spot price during 2013-14 was negative $579.67 compared to negative $334.24 during 2012-13.
Table 9.5 Negative price occurrences
Price range Quarter 1 Quarter 2 Quarter 3 Quarter 4
($/MWh) Jul-Sep Oct-Dec Jan-Mar Apr-Jun
<-300 0 0 3 0
<-30 0 3 78 1
<-0 5 5 14 0
Total 5 8 95 1
9.3.2 Demand
Table 9.6 provides details of Tasmanian demand during 2013-14. Maximum demand occurs in quarters one and four which include the winter months when space heating increases demand.
22 Negative prices occur when generators are unable to reduce their output when demand declines.

ENERGY IN TASMANIA – PERFORMANCE REPORT 2013-14 123
Table 9.6 Tasmanian demand 2013-14
Table 9.7 shows that the maximum Tasmanian demand during 2013-14 was 1 650 MW which is 8 MW higher than the maximum demand recorded during 2012-13 and 110 MW lower than the maximum demand recorded to date of 1 760 MW (August 2008). The demand for energy peaked in 2008-09 before trending down over the following five financial years.
Table 9.7 Tasmanian demand: 2007-08 to 2013-14
2007-08 2008-09 2009-10 2010-11 2011-12 2012-13 2013-14
Maximum demand (MW) 1 753 1 760 1 679 1 694 1 705 1 642 1650
Minimum demand (MW) 691 751 769 776 704 659 771
Average demand (MW) 1 177 1 157 1 144 1 158 1 144 1 121 1 121
Load factor 67.3% 65.8% 67.9% 68.2% 66.4% 68.1% 67.8%
Energy demand (GWh) 10 339 10 142 9 993 10 115 9 919 9 793 9 795
Table 9.8 shows the sources of electricity during 2012-13 and 2013-14 and reflects:
the greater contribution of wind generation due to the Musselroe Wind Farm commencing commercial operations during 2013-14;
operational changes with respect to the use of the Tamar Valley Power Station;
increased inflows into Hydro Tasmania’s storages during 2013-14; and
focus on Basslink exports to maximise trading opportunities associated with the carbon pricing mechanism.
Quarter 1 Quarter 2 Quarter 3 Quarter 4
Jul-Sep Oct-Dec Jan-Mar Apr-Jun
Maximum demand during the period MW 1 650 1 421 1 311 1 548
Minimum demand during the period MW 817 831 771 844
Average demand during the period MW 1 195 1 082 1 043 1 166
System load factor % 72.4% 76.1% 79.5% 75.3%
Recorded maximum peak for 2013-14 MW 1650 21 Aug 2013
Recorded maximum peak to 30 June 2014 MW 1760 11 Aug 2008
Energy demand GWh 2 610 2 362 2 277 2 546
Percentage imported via Basslink % 0.2% 0.1% 0.4% 0.3%

124 ENERGY IN TASMANIA – PERFORMANCE REPORT 2013-14
Table 9.8 Sources of electricity consumed in Tasmania*
2012-13 2013-14
Hydro 81% 86%
Thermal 13% 6%
Wind 4% 7%
Basslink imports 2% 0%
* Percentages do not sum to 100% due to rounding.
Figure 9.3 illustrates the source of electricity supplied to meet Tasmanian demand during 2013-14.
Figure 9.3 Electricity supply sources 2013-14
0.00
50.00
100.00
150.00
200.00
250.00
27 29 31 33 35 37 39 41 43 45 47 49 51 1 3 5 7 9 11 13 15 17 19 21 23 25
GW
h
NEM weeks Hydro Wind Thermal Basslink imports
9.3.3 Basslink
During 2013-14 imported electricity supplied 0.2 per cent of Tasmanian demand compared to five per cent during 2012-13. The decrease in Basslink imports (Table 9.9) is mainly due to Hydro Tasmania maximising trading opportunities associated with the carbon pricing mechanism and the availability of greater hydro water storages.
Table 9.9 Basslink flows (GWh)
2007-08 2008-09 2009-10 2010-11 2011-12 2012-13 2013-14
Export 238 71 648 1 316 1 000 2 290 3 107
Import -2 504 -2 635 -1 793 -1 107 -1 276 - 249 -22
Net Export/Import -2 266 -2 564 -1 145 209 - 276 2 041 3 085
As shown in Figure 9.4 and Table 9.10, Basslink flows during 2013-14 did not follow the pattern set in years prior to the introduction of the carbon pricing mechanism where imports peaked during the summer months and declined during winter.

ENERGY IN TASMANIA – PERFORMANCE REPORT 2013-14 125
Figure 9.4 Basslink flows (GWh) and hydro storages (% full) during 2013-14
0%
10%
20%
30%
40%
50%
60%
70%
80%
90%
0
0
0
0
0
0
0
27 28 29 30 31 32 33 34 35 36 37 38 39 40 41 42 43 44 45 46 47 48 49 50 51 52 1 2 3 4 5 6 7 8 9 10 11 12 13 14 15 16 17 18 19 20 21 22 23 24 25 26
GWh
NEM Weeks
Export Import % full
Table 9.10 Basslink flows 2013-14
Quarter 1 Quarter 2 Quarter 3 Quarter 4
Jul-Sep Oct-Dec Jan-Mar Apr-Jun
Total export (GWh) 798.1 779.8 623.7 905.5
Total import (GWh) 4.7 1.4 8.8 6.8
Net export/import23 (GWh) 793.4 778.3 614.9 898.7
Max flow during export (MW) 571 571 594 594
Max flow during import (MW) 399 161 300 273
Max +ve price differential 24observed ($/MWh) 128.0 3 665.7 5 846.2 201.4
Max -ve price differential observed ($/MWh) -2 471.5 -3 968.5 -1 325.9 -2 177.2
No. of intervals of counter price flow 123 252 674 259
% time of counter price flow 2.8% 5.8% 15.4% 5.9%
Negative price differences arise because of the co-optimisation process of the NEMDE.25 In the NEM the energy and eight frequency control ancillary services (FCAS) spot markets are co-optimised in real time to ensure that demand across all regions of the NEM is met at least cost whilst maintaining the power system in a reliable operating state. The interaction therefore between the requirements of the FCAS and energy markets will impact on the direction of the energy flow across Basslink. The co-optimisation of the energy and ancillary services markets can lead
23 By convention flows to Victoria (exports) are considered positive and flows to Tasmania (imports) are negative.
24 This is the difference between Victorian and Tasmanian spot prices.
25 NEMDE - NEM Dispatch Engine is the linear program which dispatches the bids from generators in the entire NEM.

126 ENERGY IN TASMANIA – PERFORMANCE REPORT 2013-14
to counter-price flows. Counter-price flows are where Basslink exports from a region with a higher energy spot price flow into a region with a lower energy spot price.
9.4 Frequency control ancillary services Frequency control ancillary services (FCAS) maintain the frequency of the power system within frequency operating bands. FCAS are purchased by AEMO in each of eight exclusive FCAS markets. In general, these services are of two types:
Regulation FCAS are services that ensure that continual minor frequency deviations during typical load and generation variations are maintained within the normal operating band26; and
Contingency FCAS are fast, slow and delayed services used for recovering larger frequency deviations that have arisen from contingent events such as the loss of a generating unit, transmission line or the loss of a load.
As the frequency may need to be adjusted up or down, each of these FCAS services can be further categorised as ‘raise’ or ‘lower’ services.
In Tasmania, sources of FCAS are:
Basslink27, where an increase or decrease in imports or exports will affect frequency; and
Hydro Tasmania; both through its hydro generating units and Tamar Valley Power Station (the Combined Cycle Gas Turbine provides lower contingency FCAS).
Following a period of very high FCAS raise prices, the Regulator declared, in February 2010, raise FCAS services to be ‘declared electrical services’ under Regulation 19(2) of the Electricity Supply Industry (Price Control) Regulations 2003.
The Regulator considered Hydro Tasmania had substantial market power in respect of these services and the promotion of competition, efficiency and the public interest required the making of the declaration. For more information refer to the Regulator’s FCAS Final Report.28
The Regulator also determined that the price of the FCAS ‘safety net’ contract would be calculated on 15 January and 15 July of each year of the Determination. The Determination commenced on 28 January 2011 and expires on 31 January 2016.
26 The normal operating band is the range in which frequency deviations, which occur during typical load and
generation variations, are tolerated as it is not realistic to maintain a constant frequency of 50 Hz.
27 Basslink is deemed to be unable to transfer FCAS services while flow is between approximately -50 MW and +50 MW (‘no-go’ zone).
28 Tasmanian Economic Regulator, FCAS Pricing Investigation Final Report, December 2010.

ENERGY IN TASMANIA – PERFORMANCE REPORT 2013-14 127
Table 9.10 shows the relatively high cost of ancillary services in Tasmania compared with Australian mainland NEM jurisdictions. The cost of providing ‘lower’ services are reflected in charges to customers.29 The cost of providing ‘raise’ services are met by generators and will ultimately be incorporated into energy prices.
Table 9.10 Ancillary services 2013-14
Tasmania Mainland
Q1 Q2 Q3 Q4 Q1 Q2 Q3 Q4
Jul-Sep Oct-Dec Jan-Mar Apr-Jun Jul-Sep Oct-Dec Jan-Mar Apr-Jun
Total turnover in energy market $ Million 123.4 98.0 92.8 100.5 2 599.6 2 432.2 2 857.9 2 214.4
Total FCAS costs $ 000s 1 045.0 2 129.1 3 516.8 875.5 4 366.7 4 177.8 2 652.5 7 268.0
% of total energy turnover % 0.85% 2.17% 3.79% 0.87% 0.17% 0.17% 0.09% 0.33%
Cost of raise services $ ‘000s 239.7 544.0 630.3 432.6 3 151.8 2 361.0 1 980.6 5 965.8
% of total energy turnover % 0.19% 0.55% 0.68% 0.43% 0.12% 0.10% 0.07% 0.27%
Cost of lower services $ ‘000s 805.3 1 585.1 2 886.5 442.9 1 214.9 1 816.8 671.8 1 302.2
% of total energy turnover % 0.65% 1.62% 3.11% 0.44% 0.05% 0.07% 0.02% 0.06%
Cost of lower 6 services30 $ ‘000s 448.4 967.2 1 529.3 101.8 168.4 466.4 12.8 141.0
% of total energy turnover % 0.36% 0.99% 1.65% 0.10% 0.006% 0.019% 0.0004% 0.0064%
The cost of FCAS in Tasmania is significantly higher as a proportion of turnover in the energy market. On mainland Australia FCAS costs were just over 0.18 per cent of total energy turnover for 2013-14 whilst in Tasmania, FCAS costs were 1.82 per cent of energy turnover.
The proportion of the FCAS costs in Tasmania associated with the cost of providing six second lower services remains significant (0.735 per cent of total energy turnover) compared to the Australian mainland (0.008 per cent of total energy turnover). This is due to certain inherent characteristics of the hydro generation dominated Tasmanian power system, such as a shortage of fast contingency FCAS.
Figure 9.5 shows the weekly FCAS costs in Tasmania for 2013-14 and the proportion of lower and raise contingency services each week.
29 For further explanation, refer to OTTER, 2007 Determination of Retail Tariffs on Mainland Tasmania –
Information Paper, November 2006.
30 Fast contingency FCAS (6 second) lower services.

128 ENERGY IN TASMANIA – PERFORMANCE REPORT 2013-14
Figure 9.5 FCAS costs in Tasmania 2013-14
$ 0
$ 500
$1 000
$1 500
$2 000
$2 500
0%
10%
20%
30%
40%
50%
60%
70%
80%
90%
100%
27 28 29 30 31 32 33 34 35 36 37 38 39 40 41 42 43 44 45 46 47 48 49 50 51 52 1 2 3 4 5 6 7 8 9 10 11 12 13 14 15 16 17 18 19 20 21 22 23 24 25 26
Cos
t in
$100
0s
Low
er:R
aise
Week
FCAS Costs in Tasmania 2013-14
Lower Raise Tasmania FCAS Costs ($1000s)
FCAS costs in Tasmania were significantly higher during NEM week 3 (12-18 January 2014).
A discussion of the factors contributing to the higher FCAS costs is provided by AEMO at:
http://www.aemo.com.au/Electricity/Resources/Reports-and-Documents/Pricing-Event-Reports
and by the AER at:
http://www.aer.gov.au/taxonomy/term/324?page=2

ENERGY IN TASMANIA – PERFORMANCE REPORT 2013-14 129
Total annual FCAS costs in Tasmania for 2013-14 and the previous seven financial years are shown in Figure 9.1.
Figure 9.6 Annual FCAS costs in Tasmania, 2006-07 to 2013-14
10.1811.83
45.68
12.41
5.367.45
5.077.57
0
5
10
15
20
25
30
35
40
45
50
2006-07 2007-08 2008-09 2009-10 2010-11 2011-12 2012-13 2013-14
FCA
S c
ost
($
mil
lio
ns)
R 6 sec R 60 sec R 5 min R RegL 6 sec L 60 sec L 5 min L Reg
Raise Lower
9.5 Inter-regional revenues Inter-regional revenues (IRRs)31 arise from the difference between Tasmanian and Victorian spot prices and can be used to hedge inter-regional price risks. In the process leading to the ACCC’s authorisation of Tasmania’s NEM entry arrangements, the Tasmanian Government agreed that Hydro Tasmania would make the southward IRRs available for commercial sale and would conduct a semi-annual auction of unsold IRRs.
As there was little market interest in the southward IRR auctions the Treasurer agreed to discontinue the auctions in May 2008. However, during 2013-14 Hydro Tasmania was still obliged to make the IRRs available for commercial sale and was also required to:
provide a semi-annual confidential report to the Minister on contract market activity and the development of the inter-regional market; and
31 Additional information on IRRs is provided at;http://www.hydro.com.au/energy/inter-regional-products-and-
pricing

130 ENERGY IN TASMANIA – PERFORMANCE REPORT 2013-14
publish on its website a semi-annual public report on inter-regional trading.32
Hydro Tasmania provides standard prices for Tasmanian derivative products on a weekly basis to customers, as well as offering prices for non-standard products on request.
During 2013-14, 69 transactions of Tasmanian standard and non-standard products (60 transactions during 2012-13) were made. Transactions included 58 swaps and ten caps and FCAS hedge products. Of the swaps, seven were at the standard, regulated price, 39 at the unregulated price and 12 were load following swaps.
Inter-regional swaps and caps also provide a mechanism for Hydro Tasmania to make offers in Tasmania to buy in Victoria. Inter-regional structures were not transacted during 2013-14 as Hydro Tasmania instead used Tasmanian capacity to make all offers (one transaction occurred during 2012-13).
There weren’t any requests for southward IRRs pricing which suggests a preference for retailers to contract directly with the incumbent generators (primarily Hydro Tasmania).
32 http://www.hydro.com.au/energy/esi-enhancement-compliance-plans

ENERGY IN TASMANIA – PERFORMANCE REPORT 2013-14 131
10 RETAIL
10.1 Introduction In Tasmania electricity is sold by retailers to customers under individually negotiated contracts or regulated tariffs, which cover both prices and service standards. Regulated tariffs provide a safety net for small customers. Any small customer meeting the conditions for supply is entitled to be supplied under the relevant regulated tariff.
The NECF commenced in Tasmania on 1 July 2012 introducing a new set of national laws, rules, and regulations governing the retail sale of energy to consumers. Due to changed reporting requirements for retailers under the NECF the Regulator will no longer be reporting on retail electricity consumption.
Under the NECF the AER assumed responsibility for regulating energy retailers. However, energy retailers authorised to sell electricity under the NERL who operate in Tasmania also have obligations under the following Tasmanian legislation in addition to those under the National Energy Retail Law (Tasmania) Act:
Electricity Supply Industry Regulations 2008;
Electricity Supply Industry (Customer) Regulations 2012; and
Electricity Supply Industry (Price Control and Related Matters) Regulations 2012.
Full retail contestability for residential and business customers was introduced on 1 July 2014.
10.2 Electricity retail market Retailers provide a range of services to electricity customers including arranging for supply, carrying out billing and revenue collection and bundling other product options to suit customers’ needs.
10.2.1 Residential customers
Table 10.1 and Figure 10.1 show customer installations for each customer category for each financial year between 2008-09 and 2013-14. There was a 0.9 per cent increase in the number of residential customers in 2013-14 which is the same as the increase in 2012-13. Approximately 45 per cent of all residential customers receive a pensioner or health care card discount.

132 ENERGY IN TASMANIA – PERFORMANCE REPORT 2013-14
Figure 10.1 Residential customer numbers
220 000
222 000
224 000
226 000
228 000
230 000
232 000
2009 2010 2011 2012 2013 2014
Table 10.1 Customer installations as at 30 June 2014
Installation numbers 2009 2010 20111 2012 20132 20143
Residential 224 983 226 977 225 601 226 055 228 059 230 127
Business 44 553 45 003 40 413 39 278
Major Industrial4 20 20 15 14
Small Business Customers 36 363 35 990
Large Customers 2 680 2 252
TOTAL 269 556 272 000 266 029 265 347 267 102 268 369
The number of business customers fell by 2.05 per cent in 2013-14, following a 0.63 per cent decrease in 2012-13.
10.2.2 Aurora Pay As You Go
The Aurora Pay As You Go (APAYG)5 system is a pre-payment retail option offered to Aurora Energy’s residential customers as an alternative to the standard tariff 31 (Light and Power), tariff 41 (Hot Water), tariff 42 (HydroHeat) and tariffs 61 and 62 (Off-peak). The APAYG product allows customers to pay in advance for their
1 Aurora Energy changed the way it counts customer numbers. Consequently, there was a downwards revision of
customer installation numbers following the exclusion of inactive meters (previously all National Meter Identifiers were counted).
2 Under the NECF customers are classified as either residential or small business or large customers. Large customers consume a minimum of 100 MWh per year.
3 Under the NECF customers are classified as either residential or small business or large customers. Large customers consume a minimum of 100 MWh per year.
4 In this table, the term Major Industrial refers to Tranche 1 customers (customers consuming over 20 GWh per year).
5 APAYG prices are not regulated by the Regulator or by the AER.

ENERGY IN TASMANIA – PERFORMANCE REPORT 2013-14 133
electricity through the use of an electronic card known as a ‘Smart Card’ and a pre-payment meter (PPM).
The APAYG payment method removes the necessity for customers to be provided with a quarterly bill for their electricity consumption and also offers prices that vary according to time-of-year and time-of-use.
As at 30 June 2014 there were 30 640 customers (approximately 13.3 per cent of the residential customer base) using APAYG. This is a 7.6 per cent decrease compared to 2012-13 and continues a six year downward trend as shown in Figure 10.2.
Approximately 47 per cent of APAYG customers receive a pensioner or health care card discount.
Figure 10.2 Residential tariff and APAYG customer numbers
170
175
180
185
190
195
200
205
0
5
10
15
20
25
30
35
40
45
50
Resi
dent
ial t
ariff
cus
tom
ers
('000
)
PAYG
cus
tom
ers
('000
)
APAYG Residential tariff
2009 2010 2011 2012 2013 2014
As customers have the ability to switch between APAYG and standard tariffs, the Regulator concluded in its “Review of Aurora Energy Pty Ltd’s Aurora Pay As You Go Final Report”6 that the costs associated with the more intrusive forms of price regulation would exceed any efficiency benefits achieved. The Regulator also concluded that a formal performance monitoring regime be implemented, similar to that used for monitoring standard tariff supply.
6 Following public concern regarding Aurora’s July 2009 adjustment to the Aurora Pay As You Go (APAYG)
prices, the Government requested the Regulator to conduct a review into a number of aspects of the APAYG offering by Aurora. The final report was issued in November 2009 and is available here: http://www.economicregulator.tas.gov.au/domino/otter.nsf/LookupFiles/APAYG%20Review%20Consolidated%20Final%20Report%2009.5431.pdf/$file/APAYG%20Review%20Consolidated%20Final%20Report%2009.5431.pdf

134 ENERGY IN TASMANIA – PERFORMANCE REPORT 2013-14
Consequently, the Regulator does not regulate APAYG prices but, to assist customers to make an informed choice between the products, the Regulator publishes an annual comparison between prices paid by APAYG and standard tariff customers. The Regulator also reviews the terms and conditions of supply to ensure they are comparable to those provided to standard tariff customers and ensure APAYG customers are able to revert to standard tariffs on reasonable terms.
In September 2013 the Regulator published its eighth price comparison report which compared the 1 July 2013 APAYG rates with the standard regulated tariffs available for residential customers as at 1 July 2013. The Report included a comparison of APAYG and regulated tariff prices for concession card holders. This and previous price comparison reports are available on the Regulator’s website:
http://www.economicregulator.tas.gov.au/domino/otter.nsf/8f46477f11c891c7ca256c4b001b41f2/db69ef3e7e82500fca2575d60007ebb9?OpenDocument
10.3 Retail market activity indicators
10.3.1 Disconnection rate
Aurora Energy currently monitors disconnections of standard metered customers and, where a prepayment meter (PPM) is able to supply this information, APAYG customers.
Chapter 9A of the TEC (Tasmanian Electricity Code), Retailing - Prepayment Meters, requires that all new and replacement PPMs installed after 1 January 2008 are capable of recording self-disconnection. As at 30 June 2014 just 23 per cent of APAYG meters transmit customer usage information, such as customer disconnections, and it will be some time before all PPMs have this capability. In line with the national reporting framework, Aurora Energy disconnection rates are calculated using total residential (APAYG and non-APAYG) customer numbers and total number of disconnections is shown in Table 10.2.
Table 10.2 Number of disconnections
2008-09 2009-10 2010-11 2011-12 2012-13 2013-14
Residential 1 012 1 396 958 178 1 057 1 555
Business 6 66 58 11 53 125
TOTAL 1 038 1 462 1 016 189 1 110 1 680
Due to the implementation of its new customer care and billing system, Aurora Energy suspended disconnections during 2011-12. Therefore, although the number of disconnections decreased markedly in 2011-12, the numbers are misleading and should not be used for comparative purposes. Disconnections for residential customers recommenced in September 2012 and in April 2013 for business customers.
Table 10.3 shows the number of residential customers who were disconnected more than once (during a 24 month rolling period) as at the end of June each year.

ENERGY IN TASMANIA – PERFORMANCE REPORT 2013-14 135
Table 10.3 Number of residential customers disconnected more than once
2009-10 2010-11 2011-12 2012-13 2013-14
Number of customers 593 1,199 569 50 130
For a comparison of disconnection rates between retailers, readers should refer to the AER’s Annual report on the performance of the retail energy market 2013-14 at: http://www.aer.gov.au/node/28517.
10.3.2 Centrepay
Centrepay enables Centrelink customers, at no cost to them, to have fortnightly deductions made from their pensions, benefits or allowances. Payments by Centrepay on behalf of a customer will reduce the amount the customer needs to pay when the Aurora Energy account bill arrives. There were 5 787 customers using Centrepay as at 30 June 2014 compared to 5 329 in 2012-13, an increase of 7.9 per cent.
10.3.3 Call centre performance
In terms of the three indicators listed in Table 10.4, Aurora Energy’s call centre performance improved considerably in 2013-14, having deteriorated between 2010-11 and 2012-13.
Table 10.4 Call centre performance
Call centre performance indicator
2010-11 2011-12 2012-13 2013-14
Abandoned call % 5.2 6.6 10.3 2.1
Calls answered within 30 seconds %
71.6 62.5 50.27 74.5
No of seconds before call answered
54 75 116 34
For comparison of call centre performance between retailers, readers should refer to the AER’s Annual report on the performance of the retail energy market 2013-14 at: http://www.aer.gov.au/node/28517.
10.3.4 Customer complaints
The following tables present details about the numbers and types of customer complaints over the last six financial years.

136 ENERGY IN TASMANIA – PERFORMANCE REPORT 2013-14
Table 10.5 Customer complaints
2008-09 2009-10 2010-11 2011-12 2012-13 2013-14
Number of complaints
838 957 810 567 468 4 306
Complaints about billing %
31.3 35.1 29.5 64.6 87.4 76.7
Table 10.5 shows that the total number of complaints has increased very significantly. However a direct comparison of 2013-14 with 2012-13 is not possible due to major changes in how Aurora Energy recorded complaints during 2013-14.
With the commencement of NECF from 1 July 2012, retailers were required to provide complaint information in terms of four categories. Complaints made against Aurora Energy under the new categories are shown in Table 10.6 which provides a breakdown of complaints to 30 June 2014.
Table 10.6 Customer complaints by category post 1 July 2012
Complaint 2012-13 2013-14
Billing 409 3 306
Marketing 51 14
Customer Transfer 0 12
Other 8 974
TOTAL 468 4 306
More information about customer complaints is provided in the Tasmanian Ombudsman’s Annual Report at: http://www.ombudsman.tas.gov.au/__data/assets/pdf_file/0007/273499/Ombudsman_Annual_Report_2012-13.pdf.
10.4 Customers experiencing payment difficulties
10.4.1 Customers repaying a debt
Table 10.7 shows the number of customers who were repaying a debt as at 30 June in each financial year between 2009-10 and 2013-14.
Table 10.7 Number of customers repaying a debt as at the end of each year.
Grouping 2009-10 2010-11 2011-12 2012-13 2013-14
Residential 5 685 5 705 5 438 7 076 5 945
Business 532 397 487 940 498
TOTAL 6 217 6 102 5 925 8 016 6 443
Compared to 2012-13, there was a significant decrease in customers repaying a debt during 2013-14 with a 16 per cent decrease in residential customers and a

ENERGY IN TASMANIA – PERFORMANCE REPORT 2013-14 137
47 per cent decrease in business customers (quarter four on quarter four percentage change). At 30 June 2014 the average debt was $704 and $1 136 for residential customers and business customers respectively.
Table 10.8 shows a breakdown of residential customer debt as at 30 June 2014.
Table 10.8 Disaggregation of residential customer debt by amount
Debt amount % of residential customers with debt
2013 2014
Under $500 57 61
$500-$1 500 27 27
$1 500-$2 500 8 7
Over $2 500 8 5
10.4.2 Payment plans
Aurora Energy is required to offer a payment plan to customers experiencing difficulties paying their electricity bills, unless a customer has already been on two or more plans in the last year and did not keep to them.
On average 3 282 residential customers were on a payment plan during 2013-14 compared to 3 007 during 2012-13 (an 8 per cent increase). Approximately 34 per cent of customers on payment plans had their plans cancelled for non-payment, during 2013-14, compared to 31 per cent during 2012-13. On average 606 residential customers had two or more payment plans cancelled during 2013-14, compared to 451 in 2012-13, a 25.5 per cent increase.
10.4.3 Hardship program
Under the NECF Aurora Energy was required to introduce a hardship program to assist customers with payment difficulties (including APAYG customers who have difficulty in purchasing meter credits). As at 30 June 2014 there were 987 customers on this program. Customers commencing the program during 2013-14 had an average debt of $2 517. As at 30 June 2014, approximately 79 per cent of customers on the program were customers with a concession. 142 customers completed the program whilst 551 customers exited the program during 2013-14.
10.4.4 Community service arrangements
Community Service Agreements (CSA) are a contractual arrangement between the Government (represented by a purchasing Minister) and entities such as Aurora Energy, which receives a CSA to provide electricity price concessions to pensioners and Health Care Card holders.
Aurora Energy received $36.7 million from the Tasmanian Government to fund its CSA in 2013-14 compared to $35.4 million the previous year.

138 ENERGY IN TASMANIA – PERFORMANCE REPORT 2013-14
10.4.5 Private welfare arrangements
In May 2005 Aurora Energy, in consultation with Anglicare, the Tasmanian Council of Social Services (TasCOSS) and the Salvation Army, introduced a Hardship Policy to assist customers experiencing financial difficulty via a Hardship Fund. Having assisted 2 608 customers to a total value of $360 590 in 2012-13, Aurora Energy committed a further $203 770 for the six months leading up to 1 January 2014. As of 1 January 2014, the Tasmanian Government has been responsible for the fund with the Salvation Army continuing to administer the fund.
10.4.6 Financial performance
The Regulator has chosen not to monitor and report on the financial performance of Aurora Energy’s retail business activities as only the retail prices for Aurora Energy’s tariff customers are regulated. Aurora Energy negotiates retail prices with non-tariff customers in competition with other authorised retailers.
10.5 Retail competition
10.5.1 Retail market 2013-14
Under the NECF retailers no longer require a licence under the ESI Act 1995 to operate in Tasmania ie any authorised retailer may enter the Tasmanian market. However during 2013-14, residential and small business customers consuming less than 50 MWh of electricity per year were not yet classified as contestable and were supplied by Aurora Energy under regulated tariffs.
As at 30 June 2014 there were two electricity retailers (ERM and Progressive Green) competing with Aurora Energy to supply electricity to non-residential contestable customers in Tasmania.
Although business customers consuming between 50 MWh and 150MWh of electricity per year (ie an electricity bill of between approximately $10 000 and $30 000) became contestable in July 2011, they are still able to choose whether to remain on a regulated tariff or enter into an individual contract with a retailer.
Business customers who consume more than 150 MWh of electricity per year (ie an annual electricity bill greater than approximately $30 000) cannot choose to stay on a regulated tariff and must enter into an individual contract with a retailer.
A separate website maintained by OTTER - www.power.tas.gov.au - provides information about electricity retail contestability in Tasmania.
10.5.3 Retail tariffs for residential and small business customers
The tariffs paid by small customers for the supply of electricity are determined by the Regulator after undertaking a price investigation. The resulting determination7 sets 7 A determination is the legal document that specifies how the prices are calculated during each year of the
regulatory period.

ENERGY IN TASMANIA – PERFORMANCE REPORT 2013-14 139
out a formula which calculates a notional maximum revenue (NMR) which is then used to determine the maximum retail tariffs. The tariffs determined apply to small customers on mainland Tasmania (including Bruny Island). The NMR is comprised of the following variables:
network charges;
wholesale energy cost;
market charges;
renewable energy scheme costs;
cost to serve; and
retail margin.
Network charges, market charges and renewable energy scheme costs, are outside the Regulator’s control. Therefore annual adjustments are allowed for each of these items to cater for variations between the original forecasts of these variables made in the Determination and the actual figures. Adjustments are also allowed where the forecast rate of inflation has changed from that adopted in the Determination.
The wholesale energy cost does not take into account Aurora Energy’s actual costs in purchasing electricity to supply contestable customers. For the 2013 Determination that applied from 1 July 2013 to 30 December 2013, the wholesale energy cost was determined in accordance with the Electricity Supply Industry (Price Control and Related Matters) Regulations 2012 which required the Regulator to inflate the energy cost adopted in the Regulator’s 2012-13 retail tariff approval by the relevant Consumer Price Index. For period one of the 2013 Standing Offer Determination that applied from 1 January 2014 to 30 June 2014 the wholesale energy cost was derived from the regulated wholesale pricing model8 using a point-in-time estimate of forward contract prices.
On 21 June 2013 the Regulator approved a 1.79 per cent increase in Aurora Energy's electricity charges to apply from 1 July 2013 to 30 December 2013. On 20 December 2013 the Regulator approved a 5.22 per cent decrease in Aurora Energy's electricity charges to apply from 1 January 2014 to 30 June 2014. The price changes apply to all residential customers and small business customers on regulated tariffs.
10.6 Market transfers The number of customers that have switched between electricity retailers indicates both the extent of competition in the Tasmanian energy market and the level of customer awareness of choices in the market. 8 The wholesale pricing model effectively takes forward contract prices from Victoria, adjusts these for differences
in the Tasmanian market including hydrological risk and load profiles and converts the result into the regulated price for regulated products that Hydro Tasmania must offer authorised retailers operating on mainland Tasmania.

140 ENERGY IN TASMANIA – PERFORMANCE REPORT 2013-14
To enable the Regulator to monitor and report on the number of completed electricity transfers, AEMO, on a monthly basis, provides the Regulator with transfer data from its Market Settlement and Transfer Solution (MSATS) system.
Figure 10.3 sets out three years of monthly switching data for Tasmania up to 30 June 2014. The data shows the number of NMIs9 transferred between retailers. A total of 547 NMI’s were transferred between retailers during 2013-14 compared to 345 during 2012-13. The large number of transfers during July and January each year reflects that most contracts mature on 31 December or 30 June and that the Electricity Supply Industry (Contestable Customer) Regulations 2005 specifies that customers become contestable in respect of a site from July.
Figure 10.3 Monthly NMI transfers: 1 July 2011- 30 June 2014
0
50
100
150
200
250
300
350
400
Jul-
11Au
g…Se
p-…
Oct
-…N
ov…
Dec
-…Ja
n-…
Feb-
…M
ar-…
Apr-
…M
ay…
Jun-
…Ju
l-12
Aug…
Sep-
…O
ct-…
Nov
…D
ec-…
Jan-
…Fe
b-…
Mar
-…Ap
r-…
May
…Ju
n-…
Jul-
13Au
g…Se
p-…
Oct
-…N
ov…
Dec
-…Ja
n-…
Feb-
…M
ar-…
Apr-
…M
ay…
Jun-
…
No.
of
NM
Is
Transfers include transfers from the host retailer to a new entrant, from new entrants back to the host retailer and switches from one new entrant to another new entrant. If a NMI is transferred more than once in the period then each move counts as a separate transfer.
9 National Meter Identifier (NMI) is a unique number assigned to the electricity meter at an address.

ENERGY IN TASMANIA – PERFORMANCE REPORT 2013-14 141
11 BASS STRAIT ISLANDS
11.1 Introduction1 The term ‘Bass Strait Islands’ or BSI refers to Flinders and King Islands and excludes Cape Barren Island2). Neither island has a transmission network.
Hydro Tasmania assumed full operational control of the generation, distribution and retail functions on the Bass Strait Islands in 2012-133 with the retailing function provided by Momentum Energy, a wholly-owned subsidiary of Hydro Tasmania.
As distinct from the predominantly hydro based system operating on mainland Tasmania, electricity on each island is supplied by a single power station with four diesel generators in each station, complemented by wind turbines and some solar grid-connected installations.
Table 11.1 Number of customers - Flinders Island and King Island
2011-12 2012-13 2013-14
Flinders Island
Total number of customers 647 672 670
Residential 498 554 551
Business 149 118 119
Industrial 0 0 0
King Island
Total number of customers 1 149 1 159 1150
Residential 850 950 939
Business 299 209 211
Industrial 0 0 0
11.2 Regulatory arrangements Hydro Tasmania is authorised to carry out electricity generation, distribution and retail operations on the BSI in accordance with the three electricity supply industry BSI licences it holds. As a licensee, Hydro Tasmania is required to comply with the 1 Unless stated otherwise, all data in this Chapter 12 is sourced from Hydro Tasmania’s Generation Performance
and Electricity Supply Industry (ESI) Compliance Report 2013-14.
2 The Cape Barren Island Aboriginal Association Inc owns and operates a remote power station and 11 kV distribution network on Cape Barren Island. The power station is powered by two 20 kW wind turbines, 3 kW of solar photo-voltaic cells, 240 volt 120 cell battery bank and two 72kW diesel generators.
3 Up to and including 30 June 2012, Hydro Tasmania had contracted Aurora Energy to operate the power system and provide retail services. Following a review in 2011-12, and with the support of its shareholders and stakeholders, Hydro Tasmania resumed control over the management of services on the BSI in July 2012.

142 ENERGY IN TASMANIA – PERFORMANCE REPORT 2013-14
TEC and report the performance of its BSI operations in accordance with the Reporting Guideline.
11.3 Generation
11.3.1 Flinders Island
The Whitemark Power Station consisting of four diesel generators (1 x 300 kW, 2 x 720 kW and 1 x 1 200 kW) generates the majority of the electricity on Flinders Island. There are also three privately owned wind turbines of 25kW, 60kW and 300kW respectively and an additional 188 kW of privately owned grid connected embedded solar generation capacity. This brings total generation capacity on the Island to approximately 3.5MW, with a firm capacity of 1.74MW from diesel generation.
11.3.2 King Island
On King Island, electricity is generated primarily by the Currie Power Station, consisting of one 1 200kW and three 1 600kW diesel generators, along with Hydro Tasmania’s Huxley Hill wind farm comprising three 250kW and two 850kW wind turbines directly connected to, and controlled by, the power station.
Together with privately owned solar generators, which provide 361kW, the total generating capacity on King Island is 8.81MW. Currie Power Station has a firm capacity of 4.4MW from diesel generation.
Additional equipment installed via the King Island Renewable Energy Integration Project (KIREIP) provides for greater exploitation of renewable energy resources on King Island and improves system stability without increasing net generation capacity.
Commencing in March 20134, the project involved the deployment of two flywheel based uninterruptible power supplies to support a system running solely on renewable energy for extended periods when conditions allow.
The KIREIP system is a large scale off-grid system. Over 500 hours of diesel off (100% renewable) operation has been achieved to date. Australia's largest battery, incorporating three MW of power contribution and storing 1.6 MWh of useable energy assists in extending diesel off operation. Also contributing is a smart grid that incorporates a real-time demand response that reduces certain customer loads for short periods when renewable conditions rapidly degrade. Successful biodiesel trials have also resulted in the development of an in-line biodiesel blending plant to allow the station to operate on biodiesel blends from 5% to 100% biodiesel, depending on biofuel availability.
4 The project reached practical completion in December 2014.

ENERGY IN TASMANIA – PERFORMANCE REPORT 2013-14 143
11.4 Distribution networks Table 11.2 provides an overview of the distribution networks on both Flinders Island and King Island.
Table 11.2 Bass Strait Islands – description of distribution networks
Flinders Island King Island
Number of feeders 3 x 11 kV 4 x 11kV
Total length of feeders (Overhead km – HV) 330 400 Total length of feeders (Underground km – HV) 0 1.2
Customers per km of feeder 2.0 2.9
kVA per km of feeder 17.7 41.4 Connected kVA 6 245 16 443
11.5 Performance Performance on the BSI has traditionally been poorer compared to mainland Tasmania due mainly to the relatively small size of the power system, the location and isolation of the islands and the consequential greater exposure to corrosive substances and extreme weather events.
Hydro Tasmania’s BSI staff are required to undertake work on the distribution and generation assets and deliver the on ground service to customers. If a momentary short circuit occurs on the islands, the diesel generator on line can trip causing a total system black out, especially at times of low load. In contrast, on mainland Tasmania, due to the size and number of individual generators and the inertia of the system, such an event would very rarely cause an outage.5
The performance of the distribution network on each island is reported in accordance with the Reporting Guideline and measured against performance targets in Chapter 4A, and other applicable chapters6, of the TEC.
11.5.1 Flinders Island
Table 11.3 provides an overview of generation performance from 2011-14 on Flinders Island on an average per kVA basis and includes the number of temporary interruptions (also known as outages) and generation-related contribution to overall Customer Average Interruption Duration Index (CAIDI), System Average Interruption Duration Index (SAIDI) and System Average Interruption Frequency Index (SAIFI). Generation performance in terms of planned and unplanned outages improved in 2013-14 compared to previous years.
5 Outages are temporary interruptions to supply which do not meet the definition of system blackouts.
6 To the extent that the provisions of any other Chapter in the TEC except Chapter 1, 8A, 9, or 12, conflict with Chapter 4A in relation to the BSI, Chapter 4A prevails.

144 ENERGY IN TASMANIA – PERFORMANCE REPORT 2013-14
Table 11.3 Flinders Island - generation performance:
2011-12 2012-13 2013-14
Interruptions Planned 0 1 0
Unplanned 5 13 1
Total 5 14 1
CAIDI 17 28 8
SAIDI Planned 0 59 0
(minutes) Unplanned 30 333 8
SAIFI Planned 0 1 0
(number) Unplanned 1.78 12.68 1
System black outs caused by generation
Generation fault 7 14 1
CAIDI - generation fault 21.57 26.40 8
SAIDI - generation fault 151 363 8
In 2013-14 the number of system black outs caused by generation faults improved dramatically from the previous year. In 2012-13, almost half of the system black outs due to generation equipment faults were caused by frequency control faults on the main diesel generator unit which was replaced during 2012-13.
Table 11.4 provides an overview of distribution performance from 2011-14 on Flinders Island on an average per kVA basis and includes the number of temporary interruptions and distribution-related contribution to overall CAIDI, SAIDI and SAIFI. The table shows that performance measures for unplanned outages deteriorated during 2013-14 compared to previous years.
Table 11.4 Flinders Island - distribution performance
2011-12 2012-13 2013-14
Interruptions Planned 0 2 0
Unplanned 31 46 83
Total 31 48 83
CAIDI 48 73 64
SAIDI Planned 0 9 0
(minutes) Unplanned 207 359 289
SAIFI Planned 0 0.04 0
(number) Unplanned 4.28 5.02 4.45
System black outs caused by distribution
Distribution fault 2 2 0
CAIDI - distribution fault 33.5 0 0
SAIDI - distribution fault 67 0 0

ENERGY IN TASMANIA – PERFORMANCE REPORT 2013-14 145
Table 11.5 and Table 11.6 show that both the number and duration of outages on Finders Island remained below both the average and lower bound limits for number of outages and duration of outages for each quarter of 2013-14.
Table 11.5 Flinders Island - Feeder Performance – SAIFI (number of outages)
Standards Actual Performance
Period Average Lower Bound
2011-12 2012-13 2013-14
Quarter 1 6 9 5.84 3.64 3.61
Quarter 2 6 9 5.81 3.62 4.08
Quarter 3 6 9 6.00 5.71 4.65
Quarter 4 6 9 3.96 5.78 3.88
Note: The SAIFI in Table 11.5 is calculated on an average feeder basis.7
Table 11.6 Flinders Island - Feeder Performance – SAIDI (duration of outages in minutes)
Standards Actual Performance
Period Average Lower Bound
2011-12 2012-13 2013-14
Quarter 1 480 720 460 241 121
Quarter 2 480 720 347 115 233
Quarter 3 480 720 205 380 278
Quarter 4 480 720 183 293 254
Note: The SAIDI in Table 11.6 is calculated on an average feeder basis7.
Figure 11.1 shows the performance of individual feeders on Flinders Island as measured by their respective SAIDIs (on a 12 month rolling average). Overall, the weighted average SAIDI of all the feeders remained within the maximum duration limit during 2013-14.
7 Individual feeder SAIDI and SAIFI values are summed then divided by the number of feeders.

146 ENERGY IN TASMANIA – PERFORMANCE REPORT 2013-14
Figure 11.1 SAIDI for each feeder on Flinders Island: June 2008 to June 2014
Figure 11.2 shows the performance of each feeder on Flinders Island as measured by their respective SAIFIs. The performance of the Barron feeder declined during 2013-14, but was below the maximum frequency limit.
Figure 11.2 SAIFI for each feeder on Flinders Island: June 2008 to June 2014
0
240
480
720
960
1 200
1 440
1 680
1 920
2 160
2 400
Jun-08 Jun-09 Jun-10 Jun-11 Jun-12 Jun-13 Jun-14
SAID
I (m
inut
es)
75751 - Palana 75752 - Barron 75753 - Whitemark Weighted Average Maximum Duration Limit
0
3
6
9
12
15
18
21
24
Jun-08 Jun-09 Jun-10 Jun-11 Jun-12 Jun-13 Jun-14
SAIF
I
75751 - Palana 75752 - Barron 75753 - Whitemark Weighted Average Maximum Frequency Limit

ENERGY IN TASMANIA – PERFORMANCE REPORT 2013-14 147
Table 11.7 provides an overview of total system (generation and distribution combined) performance on Flinders Island on an average kVA basis for 2013-14 and includes the number of temporary interruptions and overall CAIDI, SAIDI and SAIFI.
Table 11.7 Flinders Island – overall system (generation and distribution) performance
2011-12 2012-13 2013-14
Interruptions Planned 0 3 0
Unplanned 36 59 84
Total 36 62 84
CAIDI 65 101 54
SAIDI Planned 0 68 0
(minutes) Unplanned 237 692 297
SAIFI Planned 0.00 1.04 0
(number) Unplanned 6.06 17.70 5.5
System black outs caused by distribution
Limit
Faults 20 9 14 1
CAIDI 12.50 24.22 26.40 8
SAIDI 250 218 363 8
In 2013-14, the number of unplanned interruptions increased compared to the previous year. System performance indicators such as SAIDI and CAIDI improved during 2013-14 since the previous year. Total system (generation and distribution) black out data also improved compared to the previous two years.

148 ENERGY IN TASMANIA – PERFORMANCE REPORT 2013-14
11.5.2 King Island
Table 11.8 provides an overview of generation performance from 2011-14 on King Island on an average per kVA basis and includes the number of temporary interruptions and generation-related contributions to overall CAIDI, SAIDI and SAIFI.
Table 11.8 King Island - generation performance
2011-12 2012-13 2013-14
Interruptions Planned 0 0 0
Unplanned 16 13 3
Total 16 13 3
CAIDI 12 14 11
SAIDI Planned 0 0 0
(minutes) Unplanned 49 48 33
SAIFI Planned 0 0 0
(number) Unplanned 1.78 3.36 3
System black outs caused by generation
Generation fault 9 3 3
CAIDI - generation fault 19.89 12.20 11
SAIDI - generation fault 179 47 33
The performance of the generation system in terms of unplanned outages has improved compared to previous years. In 2013-14, there were three system black outs8 on King Island.
Table 11.9 provides an overview of distribution performance during 2013-14 on an average per kVA basis and includes the number of temporary interruptions and distribution-related contribution to overall CAIDI, SAIDI and SAIFI. The number of planned and unplanned outages increased compared to previous years. There were no system black outs on King Island caused by the distribution network in 2013-14.
8 System black outs are defined as a black out in which the 11 kV busbars (which conduct electricity) are de
energised. Generation blackouts may be caused by generation equipment or by a fault in the distribution system.

ENERGY IN TASMANIA – PERFORMANCE REPORT 2013-14 149
Table 11.9 King Island - distribution performance
2011-12 2012-13 2013-14
Interruptions Planned 3 11 15
Unplanned 99 84 100
Total 102 94 115
CAIDI 58 110 199
SAIDI Planned 10 45 482
(minutes) Unplanned 436 228 682
SAIFI Planned 0.86 0.17 1.41
(number) Unplanned 6.79 6.79 4.45
System black outs
Distribution fault 1 0 0
CAIDI - distribution fault 5.00 0 0
SAIDI - distribution fault 5.00 0 0
Table 11.10 and Table 11.11 show that both the number of outages on King Island remained below both the average and lower bound limits for each quarter of 2013-14. However, the SAIDI results were above the average for each quarter of 2013-14 and above the limit for three of the quarters.
Table 11.10 King Island - Feeder Performance – SAIFI (number of outages)
Standards Actual Performance
Period Average Lower Bound
2011-12 2012-13 2013-14
Quarter 1 6 9 7.86 4.77 3.94
Quarter 2 6 9 8.60 3.08 5.09
Quarter 3 6 9 7.35 3.48 5.62
Quarter 4 6 9 7.19 3.08 5.72
Table 11.11 King Island - Feeder Performance – SAIDI (duration of outages in minutes)
Standards Actual Performance
Period Average Lower Bound
2011-12 2012-13 2013-14
Quarter 1 480 720 754 188 548
Quarter 2 480 720 587 161 768
Quarter 3 480 720 434 325 926
Quarter 4 480 720 345 203 1076

150 ENERGY IN TASMANIA – PERFORMANCE REPORT 2013-14
Figure 11.3 shows the performance of each feeder on King Island as measured by its SAIDI. Overall, the feeder performance did not meet the standard for the period. The Wickham and Grassy feeders were the feeders that performed poorly in the period, while the Currie and Airport feeders had acceptable performance.
Figure 11.3 SAIDI for each feeder on King Island: June 2008 to June 2014
Figure 11.4 shows the performance of each feeder on King Island as measured by SAIFI. The frequency of interruptions varied between the feeders on King Island. The Wickham and Grassy feeders had more interruptions than the other feeders due to an increase in the number of planned outages for vegetation management activities and storm events which had contributed to faults primarily caused by vegetation in and outside the clearance zone coming into contact with infrastructure.
Figure 11.4 SAIFI for each feeder on King Island: June 2008 to June 2014
0
360
720
1 080
1 440
1 800
2 160
Jun-08 Jun-09 Jun-10 Jun-11 Jun-12 Jun-13 Jun-14
SAID
I (m
inut
es)
76761- Grassy 76762 - Wickham 76763 - Airport 76764 - Currie Weighted Average Maximum Duration Limit
0
3
6
9
12
15
18
21
Jun-08 Jun-09 Jun-10 Jun-11 Jun-12 Jun-13 Jun-14
SAIF
I
76761- Grassy 76762 - Wickham 76763 - Airport 76764 - Currie Weighted Average Maximum Frequency Limit

ENERGY IN TASMANIA – PERFORMANCE REPORT 2013-14 151
Table 11.12 provides an overview of total system (generation and distribution combined) performance on Kind Island on an average kVA basis during 2013-14 and includes the number of temporary interruptions and overall CAIDI, SAIDI and SAIFI.
Overall system performance on King Island declined during 2013-14 with the number of unplanned interruptions, SAIDI, and SAIFI higher than in the previous year. As a result, Hydro Tasmania has identified a need to refocus on vegetation management and to undertake targeted maintenance on the longer feeders. Hydro Tasmania has also indicated that the incidence of feeder trips should reduce in the future following the installation of more reliable protection equipment.
Table 11.12 King Island - overall system (generation and distribution) performance
2011-12 2012-13 2013-14
Interruptions Planned 118 11 15
Unplanned 115 96 103
Total 3 107 118
CAIDI 70 124 135
SAIDI Planned 10 45 482
(minutes) Unplanned 485 276 715
SAIFI Planned 0.86 0.17 1.41
(number) Unplanned 11.01 5.67 7.45
System black outs Limit
Faults 8 10 3 3
CAIDI 13.75 18.40 12.00 11
SAIDI 110 184 47 33
Total system (generation and distribution) system black out data for King Island is also provided in Table 11.12 which demonstrates that overall performance improved compared to previous years with all measures under the specified limits in 2013-14.

152 ENERGY IN TASMANIA – PERFORMANCE REPORT 2013-14
11.6 Retail
11.6.1 Performance reporting
Hydro Tasmania, through its subsidiary Momentum Energy, reports on retail performance for King and Flinders Islands in accordance with its BSI electricity retail licence.
For 2013-14 there was an increase in the number of reminder notices issued for business customers. However there were no disconnection notices issued for either residential or business customers. Whilst there was a slight increase in the number of payment plans entered into by residential customers, the total debt relating to payment plans declined for residential customers from $41 728 in 2012-13 to $8 355 in 2013-14 and for business customers from $172 677 to zero.
11.6.2 Price comparison
Figure 11.5 shows that the energy component of electricity bills for BSI customers (ie the usage charges) has remained relatively constant between 2008 and 2014 with nominal prices increasing by around 2.9 per cent per annum over this period. The Australian Government’s introduction of a carbon price on 1 July 2012 resulted in charges for electricity usage on the BSI increasing by more than the rate of inflation during 2012-13. In 2013-14, the real price returned to the relatively constant path, albeit with the additional carbon price.
Figure 11.5 Average electricity prices (energy component) on the Bass Strait Islands since 2008
The real average non-energy9 components of electricity bills for BSI customers remain relatively constant with nominal prices, increasing by around 2.5 per cent over this period.
9 Non-energy charges include service charges and meter charges.
19 20 21 22 23 24 25 26 27 28 29
2008 2009 2010 2011 2012 2013 2014
Ener
gy c
/kW
h
Nominal Real (2013)

ENERGY IN TASMANIA – PERFORMANCE REPORT 2013-14 153
Table 11.13 and Table 11.14 compare prices paid by residential customers on the BSI with prices paid by residential customers on mainland Tasmania during 2013-14 in terms of both supply charges (fixed/service) and energy (usage) charges.
Table 11.13 Hydro Tasmania - BSI tariffs for 2013-14
Charge Rate Unit
All customers - Tariff 51
Service charge 74.25c per day
Meter charge 7.28c per meter per day
Energy (all units) 26.82c per KWh
Table 11.14 Aurora Energy - standard residential rates as at 1 July 2014
Charge Rate Unit
Light and Power – Tariff 31
Fixed Charges 87.6776c per day
Energy (all units) 24.717c per KWh
Hot Water – Tariff 41 & Heating Discount (hot water and space heating)– Tariff 42
Fixed Charges 16.981c per day
Energy (all units) 14.907c per KWh
11.7 Community Service Obligation (CSO) The cost of supplying electricity on the BSI is significantly higher than on mainland Tasmania due to the islands’ isolation and the associated reliance on diesel generation. As a result, the State Government administers the BSI Community Service Obligation (CSO) which provides direct concessions to BSI customers who are pensioners. The CSO also subsidises Hydro Tasmania’s costs in supplying electricity to BSI customers. The CSO is a contractual arrangement between the Government and Hydro Tasmania and is re-negotiated periodically. In 2013-14, Hydro Tasmania received $9.2 million from the State Government10.
11.8 Renewable Energy Fund The 2010-11 State Budget allocated $1 million over four years to the then portfolio of Sustainable Transport and Alternative Energy to support renewable energy initiatives on the Bass Strait Islands.
The Fund was designed to reduce the cost of living on the Bass Strait Islands, while at the same time reducing the Tasmanian taxpayer’s spend on the Community
10 Hydro Tasmania 2014 Annual Report, pg 94.

154 ENERGY IN TASMANIA – PERFORMANCE REPORT 2013-14
Service Obligation. The fund also sought to provide wider community benefit from renewable energy, as well as to help reduce carbon emissions.
The program was implemented as a contestable grant fund run over two rounds of contestable grant programs run in 2011 and 2013. A Selection Panel recommended funding for twelve projects, to the value of almost $700 000 across both rounds.
The largest single project from both rounds was for $202 000 granted to DairyTas to roll out evacuated tube solar hot water systems to nine dairies on King Island. The DairyTas project was completed in September 2014.
The Department of State Growth is still awaiting final reports for other Round Two projects, yet to be completed. The Department of State Growth expects that all projects will be complete by the end of March 2015.
The funding for the Renewable Energy Fund expired on 30 June 2014, and this 2010-11 budget initiative has therefore ended.

ENERGY IN TASMANIA – PERFORMANCE REPORT 2013-14 155
12 DEMAND SIDE PARTICIPATION
Historically, Australian electricity markets have been supply side focussed, with little or no consideration of the impacts of end user consumption patterns on the efficiency of the market, or the opportunities presented by demand side participation (DSP) to improve efficiency. DSP involves consumers (or intermediaries acting on behalf of consumers) acting to reduce or manage their electricity use by engaging in activities such as:
peak shifting1; embedded generation;2 energy efficiency; energy conservation; and fuel switching.
The level of interest in DSP has increased in recent years, driven by:
the recognition that the level of DSP in the NEM is considered to be less than optimal;
increasing electricity prices, which are in part due to increased peak demand driving supply side investment in generation and network capacity (although falling demand since 2010 has tempered investment requirements); and
cost reductions and improvements in DSP technologies, such as solar PV and home energy management systems.
A number of reforms to NEM arrangements are currently being considered which are aimed at ensuring that electricity needs are met through the lowest cost combination of supply and demand side options.
Background information on DSP issues can be found in the 2012-13 Energy in Tasmania Report.
12.1 Embedded generation Historically, virtually all electricity supplied was generated by large power stations and transported by the transmission and distribution network to customers.
However, in recent years, there has been an increasing trend toward greater utilisation of small scale embedded generation (connected to the distribution network). Output from these embedded generators is typically reported as reduced demand. 1 Where load is shifted away from the peak time. For example, setting an electric hot water storage cylinder so
that it only switches on outside of peak periods.
2 Also known as distributed generation.

156 ENERGY IN TASMANIA – PERFORMANCE REPORT 2013-14
Embedded generators can provide significant benefits which include reduced network losses, improved energy security through diversified electricity generation and the potential to defer localised network augmentation. However, there is a growing realisation that there are some negative side effects of embedded generation such as impacts on voltage control and fault levels in the network. These issues can generally be overcome with the adoption of appropriate standards and technologies (eg in relation to power factor and voltage level limits for inverters). However, adopting these standards and technologies may increase the cost of embedded generator connections.
12.1.1 Solar Photovoltaic
Tasmania has experienced a large increase in the uptake of grid-connect solar PV systems by householders since 2009 as shown in Figure 12.1.
Figure 12.1 Total number of solar PV installations in Tasmania
Source: Clean Energy Regulator. REC Registry accessed 4 November 2014. Note: The number of PV installations for 2014 will continue to rise as there is a 12 month creation period for
registering installations.
Average output from a 1 kW grid-connect solar PV system in Tasmania is 3.5 kWh/day. Allowing for losses due to shading and sub-optimal positioning, output from an average sized (2.9 kW) solar PV system is predicted to be 9.1 kWh/day, or around 3 300 kWh/year. Total Tasmanian grid-connect PV system output is around 79 GWh/year or approximately 1.9 per cent of Tasmania’s non-industrial electricity demand.
0 2 000 4 000 6 000 8 000
10 000 12 000 14 000 16 000 18 000 20 000 22 000 24 000
2009 2010 2011 2012 2013 2014
Cum
ulat
ive
num
ber
of P
V in
stal
latio
ns
Year ending June

ENERGY IN TASMANIA – PERFORMANCE REPORT 2013-14 157
12.1.2 Tasmanian feed-in tariff arrangements
In December 2012 the COAG agreed on revised National Principles for FiT Arrangements. These revised principles outline, among other things, that all premium FiT arrangements were to be closed to new participants by 2014.
Up until 30 August 2013, a FiT was offered by Aurora Energy on a voluntary basis and was called the net metering buyback scheme (NMBS). The NMBS offered customers a ‘one-for-one’ (1:1) FiT at the regulated light-and-power tariff (Tariff 31 for residential customers) or general supply tariff (Tariff 22 for small business customers) for their net exported electricity.
Consistent with the COAG reforms, and as part of the 2013 Tasmanian electricity reforms, the FiT rate applying in Tasmania was reviewed.
The Tasmanian Government announced on 18 August 2013 that:
the then current 1:1 FiT arrangement would be closed at midnight on 30 August 2013 and would be grandfathered for existing (or contracted) installations until 1 January 2019;
customers applying to install eligible micro distributed generation systems on or after 31 August 2013 were entitled to a ‘transitional FiT’ of 8 c/kWh from 31 August 2013 until 31 December 2013;
the Regulator would determine the FiT rate to apply from 1 January 2014 for all new installations occurring on or after 31 August 2013; and
the Regulator would review the FiT rate on an annual basis.
The Regulator was required by the Minister of Finance to prepare a report recommending a minimum FiT rate to apply from 1 January 2014, for net exported electricity. The report was completed in October 2013 and in November 2013 legislation was passed which, among other things, provided legal power for the first FiT determination to be made incorporating the recommended FiT as specified in the Regulator’s report.
The Regulator subsequently made its Regulated FiT Determination for Standard FiT Customers on 6 December 2013, following an amendment to the ESI Act and Electricity Supply Industry (Pricing and Related Matters) Regulations 2013.
12.1.3 Solar hot water
Solar hot water is not technically a form of embedded generation as it does not generate electricity. However, it can be considered as an equivalent to an embedded generator in that it also displaces the need to generate electricity to heat water.
A typical solar hot water system in Tasmania is estimated to reduce demand by approximately 1 800 kWh per year based on an average Tasmanian household consuming 9 MWh of electricity per year (approximate 10 year average) with hot

158 ENERGY IN TASMANIA – PERFORMANCE REPORT 2013-14
water accounting for one third of electricity consumption and solar hot water contributing 60 per cent of total hot water requirements.
With a total of 9 150 solar hot water systems installed as at 31 December 2013, total demand reduction is estimated at 16.5 GWh per year.
Figure 12.2 indicates that, while there is still an increase in the number of solar hot water installations in Tasmania, the rate of growth is declining. The rapid uptake in 2009 was associated with the availability of Commonwealth Government rebates. The closure of these programs has seen a gradual easing off in the uptake of solar hot water systems.
Figure 12.2 Total numbers of installed solar hot water systems in Tasmania
Source: Clean Energy Council, Clean Energy Australia Report 2013
Comparing Figure 12.1 and 12.2, it is evident that the decline in the cost of solar hot water systems has not matched the reduction in the cost of solar PV systems. This has resulted in the solar technology favoured by the majority of households switching to solar PV.
Solar hot water can act as a form of renewable energy storage due to the ability of water to retain its heat for long periods. With the adoption of appropriate incentives such as time of use tariffs, solar hot water could see a return to favour as peak demand is reduced by decreasing or avoiding the need for electric hot water heating during peak times. Another benefit is that solar hot water does not cause any network control issues, unlike some embedded generators.
12.1.4 Large embedded generators
There are a number of significant embedded generators in Tasmania (refer to Chapter 5 for a list of large embedded generators connected to the distribution network). The Tasmanian Government’s Renewable Energy Loans Scheme (RELS) provides loans and grants on a competitive basis to businesses to assist with the
0 1 000 2 000 3 000 4 000 5 000 6 000 7 000 8 000 9 000
10 000
Num
ber
of in
stal
led
syst
ems
Year

ENERGY IN TASMANIA – PERFORMANCE REPORT 2013-14 159
commercial viability of eligible projects and help make better use of renewable energy sources and opportunities for embedded generation. Since its commencement in 2010-11, the RELS has contributed to the establishment of renewable energy projects with a total project cost of $9.7 million (with private equity accounting for $4.5 million of total project costs). The 12 projects funded so far have contributed an embedded generation capacity of 4 172 kW.
12.2 Energy efficiency and conservation Energy efficiency is a measure of useful output relative to energy input. It is applicable to all forms of energy conversion across the supply chain, including for example, the efficiency with which fuel is converted to electricity in a power station.
Improved energy efficiency can be defined as using less energy to achieve the same level of outcomes or performance, or improving the level of outcomes or performance from the same amount of energy. For example, replacing a 100 W incandescent light bulb with a 10 W LED light bulb will provide the same level of light output using 90 per cent less energy.
Similar to other DSP activities, due to the relatively low cost of energy, there has been little focus on energy conservation and energy efficiency in the past. For example:
building design and construction were not required to consider efficiency principles such as orientation and insulation;
appliances were not required to meet minimum energy efficiency standards; and
businesses, even those consuming large amounts of energy, typically made little attempt to improve the energy efficiency of their processes and operations.
However, with rising energy costs and growing concerns about climate change, there has been an increased focus on improving energy efficiency and conservation. Energy conservation refers to reducing the actual amount of energy used.
The potential benefits of improved energy efficiency and conservation are substantial in terms of reducing energy consumption and therefore energy costs and greenhouse gas emissions. In addition, many energy efficiency measures can be implemented at relatively low-cost, with the value of savings typically outweighing upfront costs, delivering net financial benefits to the consumer within a short period of time.
For example, the Tasmanian Wedges Report3 identified energy efficiency as one of the sectors with high green house gas abatement potential (alongside renewable energy, cogeneration and fuel substitution away from coal) at a relatively low cost
3 http://www.dpac.tas.gov.au/divisions/climatechange/wedges_report 2009

160 ENERGY IN TASMANIA – PERFORMANCE REPORT 2013-14
(minus $114 per tonne CO2-e)4. This is particularly significant given the low emissions intensity of electricity generation in Tasmania due to the dominance of hydro generation.
The uptake of energy efficiency activities and their effectiveness in a few key sectors is discussed in the following sections.
12.2.1 Equipment energy efficiency
Mandatory Minimum Energy Performance Standards (MEPS) and Energy Rating Labels (ERLs) apply in Australia to a broad range of electrical appliances used in the residential, commercial and industrial sectors. MEPS and ERLs are regulated under the Commonwealth Greenhouse and Energy Minimum Standards (GEMS) Act 2012.
MEPS ensure that equipment below a certain standard is not available for sale and ERLs allow consumers to make an informed choice when purchasing new appliances. Together, these measures have been very successful in improving equipment energy efficiency. For example, the net economic benefits of the Australian Government’s Equipment Energy Efficiency program are estimated to be more than $22 billion by 2024 with an estimated reduction in household electricity consumption of around 30 per cent by 2020 compared to the situation if the initiatives had not been introduced5. Emissions reductions of 250 million tonnes of equivalent carbon dioxide are expected over the period 2000 to 2020 with a saving of $566 for every tonne of greenhouse gas emission avoided.
12.2.2 Building energy efficiency
A building’s energy efficiency indicates the amount of heating and cooling required to maintain thermal comfort. A building’s energy efficiency is the result of many factors including the level of insulation, location of windows, building materials, shape, size, orientation and local climate.
Houses are rated on a scale of 1 to 10 stars using the Nationwide House Energy Rating Scheme (NatHERS) which assesses the potential thermal comfort of homes.
One star means the house provides only minimal moderation of hot and cold weather, and high levels of heating and cooling will be required to maintain thermal comfort.
Five stars indicate good thermal performance; however some heating and cooling will usually be required to maintain comfort.
4 McLennan Magasanik Associates’ report to the Tasmanian Climate Change Office, Tasmanian greenhouse gas
emission reduction project – understanding the potential for reducing Tasmania’s greenhouse gas emissions, page 4, November 2009.
5 George Wilkenfeld & Associates, Prevention is cheaper than cure – avoiding carbon emissions through energy efficiency – projected impacts of the Equipment Energy Efficiency program to 2020, 2009.
6 Equipment Energy Efficiency, Achievements 2010/2011, 2013.

ENERGY IN TASMANIA – PERFORMANCE REPORT 2013-14 161
Ten stars indicate outstanding thermal performance, with the need for heating and cooling unlikely.
Building energy efficiency is of particular relevance in Tasmania because of the colder climate and consequentially a greater requirement for space heating. Tasmania adopted a minimum four star requirement for new houses in 2003, which was increased to a minimum five star requirement in 2010. A minimum six star requirement was adopted in May 2013 for sole occupancy units in apartments (type two buildings), which was subsequently extended to single houses and units (type one buildings) from May 2014. Other Australian states and territories (other than the Northern Territory) adopted a minimum six star requirement in 2011.
Existing rating schemes are normalised by location so that a building that performs to a specified level relative to its climate generally scores the same as a similar performing building in other climatic regions, even though they may use different amounts of energy. For example in NatHERS a six star house in a hot or cold climate is allowed to use more energy per square metre for heating and cooling than a six star house in a mild climate.
Energy efficiency standards for new commercial buildings are incorporated into the Building Code of Australia (BCA)7. In addition, large commercial buildings are required to obtain and disclose a building energy certificate when leasing or selling, which includes a National Australian Built Environment Rating Scheme (NABERS) energy star rating for the building. Other commercial and community buildings can voluntarily obtain star ratings from NABERS or other rating schemes such as Green Star. Tenants and landlords can also voluntarily negotiate green leases8.
12.2.3 Tasmanian Government assistance for vulnerable households
A number of programs have assisted vulnerable households to improve their energy efficiency. From 2012 to 2014, $1.3 million was allocated through the Stay Warm, Save Money Housewarming Program to provide 1 161 low income households with similar energy saving advice and practical measures including help with the purchase of heat pumps and other energy efficient heaters.
Housing Tasmania’s Energy Champions also provided energy efficiency advice and upgrades. Minor retrofit upgrades included replacement of incandescent globes with compact fluorescent globes, draught proofing doors and windows, temperature check of hot water systems, insulating hot water pipes and installing energy and water efficient showerheads. Around 1 000 homes were provided with more substantial energy upgrades including providing new heat pumps or gas heaters in around 200 homes. Three hundred participating households were monitored and evaluated quarterly for 12 months after completion of the energy efficiency intervention to determine the success of the program and establish savings made by 7 Tasmania adopted the commercial energy efficiency provisions included in the 2013 BCA on 1 May 2013.
These requirements are more stringent than those that applied in Tasmania under the 2009 BCA. Mandatory energy efficiency requirements for all types of commercial buildings were first introduced in Tasmania in 2005.
8 http://ee.ret.gov.au/energy-efficiency/non-residential-buildings/green-leases-private-sector

162 ENERGY IN TASMANIA – PERFORMANCE REPORT 2013-14
the households. Over the course of the project, 25 000 lights were changed, 4 800 doors replaced and 2 000 showerheads replaced. These upgrades contributed to estimated water savings valued at over $120 000 and combined energy savings of $550 000 per annum.
12.2.4 Industry
As the industrial sector is responsible for approximately half of Tasmania’s energy consumption, it presents the greatest opportunities for reduced energy consumption through implementation of energy efficiency measures.
A survey in 2013 identified that:
rising fuel prices; the Australian Government’s Energy Efficiency Opportunities (EEO) program; the carbon price; and organisational change
were the key drivers of increases in energy efficiency activity by the industrial sector9.
The EEO program is an Australian Government initiative which places a legislated obligation on large corporations who consume more than 0.5 PJ of energy per year to report on energy efficiency opportunities that have been identified through an assessment process. Adoption of opportunities identified is a business decision for the corporation, but measures adopted are required to be reported.
An independent evaluation concluded that the EEO program provided a strong net economic benefit, and that significant additional energy savings (beyond those that would have been achieved in its absence) had been realised10. The Australian Government agreed with the recommendation that the EEO program be continued until 30 June 2016, and then re-evaluated11.
12.2.5 Demand side participation and system security
A vital feature of the electricity supply industry is that supply and demand must be balanced at all times. This is usually achieved by having a number of generators providing the ability to rapidly raise or lower their output to match changes in demand (known as FCAS). There is a separate market in the NEM for these services.
9 Climate Works Australia, Tracking Progress Towards a Low Carbon Economy – Special Report on factors
influencing large industrial energy efficiency, July 2013.
10 A conservative estimate is that the EEO program is responsible for approximately 40 per cent of energy savings reported by corporations (http://energyefficiencyopportunities.gov.au/about-the-eeo-program/program-review/full-cycle-review/).
11 Australian Government Department of Resources, Energy and Tourism, Discussion Paper – Proposed changes to the Energy Efficiency Opportunities Regulations, May 2013.

ENERGY IN TASMANIA – PERFORMANCE REPORT 2013-14 163
To manage the sudden loss of generation from a power station, the AEMO has set a capacity reserve margin in each region of the NEM. This is usually set around the size of the largest generating unit (turbine) and in Tasmania it is set at 144 MW (ie the size of one of the four Gordon Power Station generating units). AEMO is therefore required to ensure there is always at least 144 MW of spare capacity sitting idle but ready to generate at short notice.
With the connection of Tasmania to the mainland through Basslink, an issue arose in that Basslink would appear to the Tasmanian network as a generator when importing. The Basslink cable is capable of carrying up to 600 MW, much larger than any pre-existing generating unit in Tasmania. After technical analysis of the situation the decision was made to allow Basslink imports over 144 MW, but introduce a System Protection Scheme (SPS). The SPS was designed to allow Basslink to import over 144 MW by linking loads around the state to Basslink. When Basslink trips, the loads trip instantaneously, resulting in the net change to the Tasmanian grid never being more than the loss of 144 MW.
Many larger industrial consumers agreed to have their demand ‘armed’ as part of the Basslink SPS. That is, in return for a price reduction, these customers’ accept the risk of having their electricity supply reduced or stopped whenever Basslink trips when importing energy.
The same commercial arrangements were made when the TVPS was constructed, with the combined cycle generator being rated at 204 MW, in excess of the 144 MW ‘limit’. Again, a number of large industrial consumers entered a commercial agreement to have their electricity supply reduced or stopped should the combined cycle plant trip.


ENERGY IN TASMANIA – PERFORMANCE REPORT 2013-14 165
13 NATURAL GAS
This chapter presents summary information on the service performance of the Tasmanian natural gas industry. Detailed background on the development of the Natural Gas industry in Tasmania is provided in the Energy in Tasmania – Performance Report 2011-12.
13.1 Regulation The Tasmanian market is subject to the NGL1 and the NGR2 which came into effect on 1 July 2008 and applies in Tasmania through section 7 of the National Gas (Tasmania) Act 2008 which contains detailed provisions concerning natural gas pipeline access arrangements.
Tasmania’s gas pipelines are not subject to economic regulation by the AER under the NGL. Likewise, the price of natural gas in Tasmania is not regulated. The Government decided that, unlike in mainland states, natural gas is a relatively new energy source and therefore is not an essential service. Consequently, its pricing needs to be competitive with electricity in order to gain customers and economic pressures will prevent the requirement for price controls which might otherwise need to be imposed by regulation.
The Regulator's responsibilities in relation to the regulation of the gas supply industry are articulated in the Gas Act and the Gas Pipelines Act and accompanying regulations. The Gas Pipelines Act recognises the National Third Party Access Code for Natural Gas Pipeline Systems. The Regulator’s responsibilities in relation to gas distribution and retailing are set out in the Gas Act. In particular, the Regulator administers the:
Gas Distribution Code which sets the minimum standards for the operation of a distribution system and the terms and conditions under which distribution services are to be provided to gas retail customers;
Gas Retail Code which establishes the minimum terms on which a retailer must sell gas to small customers; and
Gas Customer Transfer and Reconciliation Code which sets out obligations concerning the provision of information, the customer transfer process, standards for metering and process for the allocation and reconciliation of gas quantities between retailers.
Under the Gas Pipelines Act and Gas Act the Regulator is also responsible for administering the licensing system for gas entities.
1 For more information on the NGL refer to: http://www.ncc.gov.au/index.php/making-an-
application/national_gas_law 2 For more information on the NGR refer to: http://www.aemc.gov.au/Gas/National-Gas-Rules/Current-Rules.html

166 ENERGY IN TASMANIA – PERFORMANCE REPORT 2013-14
While the Regulator has certain statutory responsibilities with respect to the natural gas industry, most of the responsibility for implementing and developing regulatory schemes rests with the licensed entities. Consistent with the Regulator’s approach in dealing with other regulated industries the Regulator is ‘light handed’ in its regulation of the gas supply industry and does not intervene in the day-to-day management of the licensed gas entities. Rather, the Regulator seeks to ensure that all stakeholders are provided with sufficient information to properly assess the extent to which the entities meet their respective regulatory obligations. The primary emphasis is on transparency and disclosure with investigations and sanctions used when and if appropriate.
As a part of their respective licence conditions, natural gas entities in Tasmania are to report a number of performance statistics to the Regulator. These are summarised in the following sections.
13.2 Transmission Tasmanian Gas Pipeline Pty Ltd (TGP) holds a pipeline licence (operations) and operates the Tas Gas Pipeline. As a part of its licence conditions TGP is required to provide annual performance statistics to the Regulator.
Table 13.1 shows the key performance indicators for the year ended 30 June 2014 and the previous three years. Table 13.1 indicates that overall performance is stable.
Table 13.1 Incidents reported: 2010-11 to 2013-14
2010-11 2011-12 2012-13 2013-14 Target/Limit
Lost time injuries 0 0 0 0 0
Medical treatment injuries
0 0 0 0 0
Interruptions to supply
1 0 0 0 2
Third-party encroachments
0 0 0 1 0
Incidents, near misses & hazards reported
55 44 21 17 54
Reportable environmental
0 0 0 0 0
Vehicle incident 0 0 0 5 2
There was one third-party encroachment reported in 2013-14. A third-party encroachment is where some form of unauthorised work in a pipeline easement. The encroachment which was reported in 2013-14 occurred when a new gate and access track were installed in the pipeline easement. The gate and access track have been removed and the pipeline easement reinstated back to its original state.

ENERGY IN TASMANIA – PERFORMANCE REPORT 2013-14 167
The third party has been requested to attend a pipeline safety awareness presentation.
There were five vehicle incidents in 2013-14 which is well above TGP’s annual target. TGP does, however, report that in four of these incidences the other party was at fault.
Unaccounted for gas losses decreased from 1.1 per cent in 2012-13 to 1.0 per cent in 2013-14 which is equal to TGP’s annual limit. The Regulator understands that losses vary on a daily basis due to a range of factors. Generally losses average between 0.6 per cent and 1.1 per cent.
13.3 Distribution Tas Gas Networks Pty Ltd (TGN) holds a distribution licence (operations) and operates the authorised natural gas distribution system. The Tasmanian Gas Distribution Code requires TGN to submit an annual return on its performance against a range of measures specified in the Code. Performance against these measures is summarised in this section.
13.3.1 Technical
Table 13.2 presents the quantity of natural gas distributed by TGN in 2013-14 compared to previous years. The amount of gas distributed decreased by almost 18 per cent in 2013-14 compared to the previous year. Distribution to customers consuming less than 10TJ per annum increased in the period but distribution to customers consuming more than 10TJ declined due to the number of business customers consuming more than 10TJ declining from 15 to 10.
Table 13.2 Natural gas distribution consumption: 2010-11 to 2013-14
2010-11 2011-12 2012-13 2013-14
Distributed to consumers (GJ) 2 052 234 2 140 135 3 185 526 2 620 215
Equivalent GWh3 570 594 885 728
Unaccounted for natural gas (%) 0.26 0.25 1.84 -0.71
The total unaccounted for natural gas lost from the system of -0.71 per cent, within the 2.5 per cent limit set in schedule 2 of the Gas Distribution Code. The unaccounted for gas was due to a timing difference between the natural gas being injected into the distribution system and the meters being read. These meters are read on a rolling quarterly cycle in arrears.
13.3.2 Customers
Table 13.3 shows the number of customers connected to the gas distribution network and the percentage change in those customers from year to year. This data
3 1 GWh is equivalent to 3 600 GJ.

168 ENERGY IN TASMANIA – PERFORMANCE REPORT 2013-14
reflects all installations where gas is connected to a property as at 30 June 2014, regardless of whether the customer has actually consumed gas.
Table 13.3 Natural gas distribution customers: 2010-11 to 2013-14
2010-11 2011-12 2012-13 2013-14
Distribution customers (number)
9 261 9 487 10 967 11 978
Change from previous year (%)
14.3 2.4 15.6 9.2
13.3.3 Complaints
Table 13.4 compares the number of natural gas distribution complaints for the period 2010-11 to 2013-14. The majority of complaints in the ‘other’ category relate to issues concerning:
the placement of the meter;
frozen regulators;
noise; and
reinstatement works.
Table 13.4 Natural gas distribution complaints by category: 2010-11 to 2013-14
2010-11 2011-12 2012-13 13-14
Delectability of gas by odour 107 132 112 128
Inadequate gas supply 8 4 5 3
Other 86 52 39 22
Construction activities
68 42 33 17
Distribution activities
18 10 6 5
13.3.4 Reliability of supply
As required by the Gas Distribution Code, TGN reports on a number of reliability measures. These include frequency and duration of both planned and unplanned interruptions to supply. Table 13.5 presents the number of unplanned interruptions including statistics on distribution reliability as measured in terms of SAIDI and SAIFI.
SAIDI measures the duration of the outage in minutes per distribution customer and SAIFI measures the number of interruptions per distribution customer. Despite an increase in the number of unplanned interruptions in 2013-14, SAIFI was slightly below the index level of the previous year. The duration of interruptions improved compared to last year resulting in SAIDI being lower than the previous year.

ENERGY IN TASMANIA – PERFORMANCE REPORT 2013-14 169
Table 13.5 Natural gas distribution performance: 2010-11 to 2013-14
2010-11 2011-12 2012-13 2013-14
Unplanned interruptions (number) 215 316 406 433
Duration of unplanned interruptions (minutes)
12 172 20 981 35 047 31 765
SAIDI 1.31 2.21 3.20 2.65
SAIFI 0.023 0.033 0.037 0.036
13.4 Retail Aurora Energy and Tas Gas Retail Pty Ltd (TGR) hold retail licences for natural gas retailing in Tasmania. TGR has around 65 per cent of the customer base with Aurora Energy holding the remaining 35 per cent.
Gas retailing is governed by the Gas Act and the Tasmanian Gas Retail Code. The Tasmanian Gas Retail Code requires gas retailers in Tasmania to provide an annual return on their performance against a range of measures specified in the Gas Retail Code. Performance against these measures is summarised in this section.
Table 13.6 shows summary statistics for natural gas retailing in Tasmania with the number of customers increasing by 1.8 per cent in 2013-14 compared to a 9.3 per cent customer increase in the previous year. The performance indicators show that in 2013-14, the number of disconnections, payment plans and late payment fees increased significantly in the residential sector. This resulted in a jump in the late payment fee revenue.

170 ENERGY IN TASMANIA – PERFORMANCE REPORT 2013-14
Table 13.6 Natural gas retail activity: 2010-11 to 2013-14 2010-11 2011-12 2012-13 2013-14
Total customers* 8 939 9 862 10 780 10 979 Residential 8 237 9 123 10 039 10 242 Business 702 739 741 737
Disconnections Residential 220 120 236 454 Business 20 6 25 19
Reconnections – same name Residential 60 59 48 135 Business 2 2 4 1
Payment plans Residential 1 041 1 609 2 050 4 309 Business 143 210 181 271
Payment plans defaulted Residential 520 804 791 832 Business 55 95 67 64
Late payment fees – number Residential 2 562 3 053 2 917 3 804 Business 287 388 355 469
Late Payment fees - revenue Residential $21 220 $26 075 $24 195 $38 070 Business $3 240 $4 085 $3 785 $5 680
Complaints (percent of customers) 1 0.8 0.8 0.9
* Customer numbers differ to those in Table 13.3 because some customers connected to the distribution network
are not classified as retail customers e.g. Customer connected but consuming gas or connection is disconnected.
Furthermore, there can be a mismatch in timing between when the distribution network recognises a customer
compared to when the retailer does.

ENERGY IN TASMANIA – PERFORMANCE REPORT 2013-14 171
14 PETROLEUM
This chapter discusses the supply and use of petroleum and petroleum related products including automotive petrol, diesel, aviation fuel and liquefied petroleum gas (LPG) in Tasmania. The chapter also discusses the future of petroleum supply and use in Australia.
Tasmania does not have any petroleum refineries and therefore imports all of its petroleum requirements. The majority of petroleum products are used in the transport sector.
14.1 Regulation Australia’s liquid fuel markets are regulated through a framework of both national and state legislation covering competition policy, taxation, environmental, health and safety issues.
The Competition and Consumer (Industry Codes Oilcode) Regulation 2006 is a mandatory industry code under the Competition and Consumer Act 2010 which regulates the conduct of suppliers, distributors and retailers in the downstream petroleum retail industry. The Code provides:
standard terms and conditions for fuel reselling agreements and for franchise and commission agency arrangements;
a consistent national approach to terminal gate pricing arrangements, and transparency in wholesale pricing; and
an independent dispute resolution scheme.
The ACCC is responsible for monitoring retail prices for petroleum products. The ACCC has powers under Part IV of the Competition and Consumer Act to investigate and take enforcement action where necessary.
14.2 Supply and use Tasmania’s consumption of petroleum products totalled approximately 854 million litres in 2013-14. This was a slight (less than one per cent) increase over the previous year, although still well below the 10 year average of 921 million litres1. It was also the first rise in annual usage since 2007-08, which was the peak consumption year of the last 10 years, in which 985 million litres were consumed.
Figure 14.1 indicates that petrol and diesel were the dominant liquid fuels consumed in Tasmania during 2013-14, with consumption of diesel slightly higher than that of
1 Source: BREE 2014, 2014 Australian energy statistics, BREE, Canberra, July - Table K.

172 ENERGY IN TASMANIA – PERFORMANCE REPORT 2013-14
petrol (by volume). Sales of LPG and aviation fuel as a percentage of all Tasmanian petroleum sales remained small, at eight and three per cent respectively.
Figure 14.1 Tasmanian sales of liquid fuels by fuel type 2013-14
Source: Bureau of Resource and Energy Economics, Australian Petroleum Statistics, July 2014
Figure 14.2 reflects a small, gradual decline in the consumption of petrol over the past nine years and an upward trend in the consumption of diesel, which may be due to the resource sector’s requirements and, in the last few years, the increasing popularity of diesel vehicles. Consumption of aviation turbine fuel has steadily increased, while LPG consumption has declined slightly as reticulated natural gas has become more accessible. Fuel oil consumption has declined over the past decade, but returned to 2004-05 consumption levels in 2012-13.

ENERGY IN TASMANIA – PERFORMANCE REPORT 2013-14 173
Figure 14.2 Tasmanian liquid fuel consumption by fuel type 2003-04 to 2012-13
Source: BREE 2014, 2014 Australian energy statistics, BREE, Canberra, July – Table 3C.
Diesel continues to be used to generate electricity on the Bass Strait Islands, however, the King Island Renewable Energy Integration Project (KIREIP) has significantly reduced the consumption of diesel on the island by integrating solar PV, wind turbines, battery storage, a diesel UPS with flywheel, and a smart grid with customer demand response.
Portable diesel powered generators and substations are also used throughout the state to managed planned and unplanned outages. In late 2013 Aurora Energy placed a number of diesel powered generators in Strahan as a contingency for power outages.
14.3 Future Australia’s domestic crude oil production and petroleum refining capability is declining while the demand for liquid fuels is increasing leading to Australia becoming increasingly reliant on imports of crude oil and refined petroleum products. These changes have not reduced Australia’s liquid fuel security, which is assessed as high trending to moderate over the longer term2 due to Australia’s access to diverse and well established supply chains, and the planned replacement of lost refining capacity with import facilities to maintain supply. In the longer term the commercial development of alternative fuels could also help Australia meet its liquid fuel needs.
Tasmania’s liquid fuel security is reliant on the continuing availability of a functioning maritime supply chain.
2 Australian Government, National Energy Security Assessment, 2011.

174 ENERGY IN TASMANIA – PERFORMANCE REPORT 2013-14
14.3.1 Biodiesel
Biodiesel can be produced from agricultural and food industry waste. The production of biodiesel from these ‘waste stream’ sources has significant potential in Tasmania, which is already being realised by some innovative companies. For example, Macquarie Oil Company in Northern Tasmania produces biodiesel from poppy seed which is a by-product of the alkaloid extraction process. The Macquarie Oil Company also produces biodiesel from waste vegetable oil and potentially from tallow, and has a production capability of 15 million litres per year. A significant benefit of locally produced fuel is improved energy security through a reduced reliance on imported fuels.

ENERGY IN TASMANIA – PERFORMANCE REPORT 2013-14 175
15 COAL
There is a long history of coal mining and use in Tasmania which continues to the current day. In 2013-14 there were no Tasmanian coal exports with all coal mined used by a small number of Tasmanian industrial customers.
15.1 Available resource
In-ground known Tasmanian coal resources total approximately 578 million tonnes1, concentrated mainly in the Fingal region in the State’s north east. However, the quantity of economically mineable coal in Tasmania is significantly lower due to extraction difficulties.
Table 15.1 Annual Tasmanian coal production (2003-14)
Year Production (‘000 tonnes) Saleable (‘000 tonnes)
2003-04 482 349
2004-05 578 381
2005-06 652 446
2006-07 640 410
2007-08 725 469
2008-09 579 439
2009-10 622 379
2010-11 540 343
2011-12 466 305
2012-13 432 235
2013-14 452 283 Source: Mineral Resources Tasmania, Annual Reviews ‘Value of Tasmanian Mineral Industry’ tables. Note: Production refers to total amount of mined coal whereas saleable refers to coal that has been processed/cleaned for sale.
15.2 Supply and use
During 2013-14 the Cornwall Coal Company was the only miner and supplier of coal in Tasmania (Cornwall Coal is a wholly owned subsidiary of Cement Australia Pty Ltd).
Bituminous coal is mined at two underground mines:
1 Mineral Resources Tasmania, Some Tasmanian coal statistics, 2009.

176 ENERGY IN TASMANIA – PERFORMANCE REPORT 2013-14
Duncan Colliery (near Fingal); and
Blackwood Colliery (near St Marys);
and from two open cut mines:
Cullenswood Mine (near St Marys); and
Kimbolton Mine (near Hamilton).
The raw coal from these mines is transported to the Fingal Washery where it is washed to produce a saleable product.
The Fingal Valley region (including the St Mary’s mines) produces 80-85 per cent of all coal mined in Tasmania with the balance sourced from the Kimbolton Mine near Hamilton.
The coal currently mined in Tasmania is a high ash, low thermal value coal, ideally suited to cement manufacture with the main customer being Cement Australia’s cement manufacturing plant at Railton. The only other significant user of coal in Tasmania is Norske Skog, a paper producer, at Boyer, which uses around two petajoules per year (approximately 90 000 tonnes2 ). The Boyer Mill uses a fuel-efficient coal-fired boiler to create steam for use in the pulping process. Both Cement Australia and Norske Skog burn coal to provide process heat (that is, heat used to produce materials, such as cement and paper).
Figure 15.1 Tasmanian coal consumption
Source: Bureau of Resources and Energy Economics, Australian Energy Statistics 2014,
With the availability of natural gas as an alternative fuel source the consumption of coal in Tasmania is likely to decline. However mining and processing of coal may not decline due to proposed developments including the export of coal from a new mining operation and the processing of coal into a refined product (char) for use as feedstock in metals manufacturing. 2 Norske Skog, Submission to Productivity Commission Inquiry into Tasmania’s Shipping Costs December 2013.
0 1 2 3 4 5 6 7 8 9
2006-07 2007-08 2008-09 2009-10 2010-11 2011-12 2012-13
Consumption (PJ)

ENERGY IN TASMANIA – PERFORMANCE REPORT 2013-14 177
Better production output from the Fingal Valley operations and a higher demand from the Cement Australia Railton facility are the likely reasons for Tasmania seeing an increase in coal production during 2013-14 (see Figure 15.1). Tasmanian mined coal is not used outside the industrial sector.
Coal is imported for domestic heating in the form of briquettes and as heat beads for barbeques.
15.3 Regulation
The Mineral Resources Development Act 1995 provides for the granting of various leases and licences for prospecting and for mining of minerals. The Act is administered by Mineral Resources Tasmania which is part of the Department of State Growth.
15.4 Future
Hardrock Coal Mining Pty Ltd has obtained Government approval for a new underground mine (Fingal Tier mine) adjacent to Cornwall Coal’s Duncan Mine lease. Some site clearance and pre-construction activities have taken place with underground construction of the mine expected to commence in early 2015. The coal produced will be transported to Bell Bay via rail for export to Asia rather than used in Tasmania.
In addition, Indicola Mining Australia Pty Ltd has lodged a notice of intent with the Tasmanian Environmental Protection Agency for a coal mine project in Langloh (the Langloh Coal Project). The proposed open cut coal mine would be adjacent to the existing Kimbolton Mine near Hamilton. The mine is yet to obtain the necessary approvals.


ENERGY IN TASMANIA – PERFORMANCE REPORT 2013-14 179
16 WOOD
Wood is used in Tasmania for a variety of domestic, commercial and industrial purposes.
The supply and sale of wood is not regulated in Tasmania. However, the amount of particulate emissions from domestic and commercial wood-heaters, fireplaces and barbeques is regulated under the Environmental Management and Pollution Control (Distributed Atmospheric Emissions) Regulations 2007.
16.1 Supply and use Wood accounts for around six per cent of the state’s total energy supply1. Figure 16.1 shows that the residential sector is the dominant user of wood (responsible for 74 per cent of consumption in 2012-13), while 24 per cent is used in the industrial sector and two per cent used in the commercial sector.
Figure 16.1 Wood consumption in Tasmania
Source: Bureau of Resources and Energy Economics 2014 – Table F
The combustion of wood represents half of the total amount of energy supplied to the residential sector, followed by electricity (around seven PJ). Wood is used domestically for space heating and in smaller quantities for cooking and heating water. It is important to note that wood is converted into useful energy (i.e heat energy) less efficiently than the conversion of electrical energy to useful energy in most appliances, particularly reverse cycle space heaters.
1 Bureau of Resources and Energy Economics 2014 - Table D7.

180 ENERGY IN TASMANIA – PERFORMANCE REPORT 2013-14
Anecdotal evidence from a number of Tasmanian wood suppliers indicates that commercial businesses in Tasmania are likely to use between 12 tonnes and 40 tonnes of wood per year. Commercial businesses use wood mainly for heating during cooler periods of the year whilst the demand for businesses using wood for cooking (for example, restaurants with pizza ovens) is less seasonal.
Industrial use of wood as an energy source is predominantly associated with burning wood waste to heat kilns to dry timber in sawmills and timber yards.
16.2 Future trends Figure 16.1 shows a long term decline in wood use across all sectors, although there have been two consecutive years of growth in wood consumption in the industrial sector since 2011. Figure 16.2 indicates, between 2008 and 2011, household use of electricity as the main energy source for heating has remained largely constant, while there has been a modest increase in the number for households using wood. The Australian Bureau of Statistics has ceased collecting data for the main source of energy for household heating, so it is difficult to be confident about a continuing trend. Based on the Bureau of Resources and Energy Economics statistics for residential wood use (as depicted in Figure 16.1), it may be reasonable to assume that the rate of fuel switching to wood has fallen or ceased since 2011. It is also worth noting that the main motivation to fuel switch comes from rising electricity prices, and with recent declines in electricity prices the rate of switching may fall further.
Figure 16.2 Main source of household heating 2005-11
Source: Australian Bureau of Statistics, Environmental Issues: Energy Use and Conservation, March 2011. However, it is still true to say that due to increases in the cost of electricity over the past decade, and the unavailability of natural gas to much of the domestic market in Tasmania, wood provides an attractive alternative for space heating. Anecdotal
0
10
20
30
40
50
60
70
2005 2008 2011
Perc
enta
ge o
f hou
ses
(%)
Electricity Wood

ENERGY IN TASMANIA – PERFORMANCE REPORT 2013-14 181
evidence from Tasmanian wood-yards supports this assumption with reports of increased sales due to higher electricity prices and a lack of alternative fuels for space heating.
16.2.1 Energy Uses for Wood Waste
The use of wood for energy generation is very limited. There is, however, considerable interest in the future potential of bioenergy industries such as the production of liquid fuels, and also wood pellets for domestic heaters, which is an emerging industry in Tasmania.
Bioenergy generally falls into two main sectors. The first sector is burning of solid biomass for energy production, including heating and electricity, which generally involves processing of biomass into more concentrated forms, such as wood pellets or torrefied pellets.
A wood pellet heater combusts small wood pellets which are made from compressed sawdust. The pellets burn more efficiently than wood, or wood chips due to their density and lack of moisture and they produce little residue.
In addition, heat output from pellet heaters can be controlled without compromising efficiency or smoke emission. A combination of increased energy density and greater combustion efficiency means significantly less fuel is required. One tonne of wood pellets has been reported as being equivalent to four tonnes of firewood.
Island Bio-Energy Pty Ltd, a joint venture between Pellet Fires Tasmania, Trans Trade and Forestry Tasmania, intends building a small pellet mill in Glenorchy. At the time of writing; the mill was close to being completed and had already produced small quantities of pellets for use locally. Once fully operational, the mill will be capable of producing up to four tonnes of pellets per day. This would exceed current Tasmanian demand and eliminate the existing requirement for the importation of pellets.
The second sector is the rapidly expanding sector of bio-fuels, which produces liquid fuels from biomass. There are a number of technologies currently available, producing a range of bio-fuels, including bio-diesel, ethanol and pyrolysis oil. One particular emerging technology is fast pyrolysis, which is capable of producing hydrocarbon fuels substitutable for existing petrol or other transport fuels.
The Tasmanian Government is working with industry to investigate a number of opportunities for bioenergy in Tasmania. In partnership with industry and local government, the Tasmanian Government has committed $200 000 in funding to continue existing investigations of bio-fuels in the Dorset and Huon regions. Additionally, the Tasmanian Government is investigating the potential of a range of future markets for forest residues, which includes investigation of a number of opportunities for bioenergy, including biomass for heating and energy purposes, as well as for biofuels.


ENERGY IN TASMANIA – PERFORMANCE REPORT 2013-14 183
17 FUTURE DIRECTIONS
During 2013-14, the most significant developments in the energy supply industry were as follows:
FRC commenced on 1 July 2014 with the Tasmanian Economic Regulator administering regulation of specific wholesale electricity hedge contracts offered by Hydro Tasmania. The transmission and distribution network businesses were also amalgamated into a single network entity, TasNetworks, on 1 July 2014.
Strengthening of the national regulatory framework to better protect the long term interests of Australian energy consumers.
Commencing the development of a Whole-of-State Energy Strategy for the new Government, including the establishment of the Energy Working Group. The key objective of the Strategy will be to identify ways in which energy can be used as an economic driver including by securing a stable and sustainable price path that can provide relief to consumers and help grow the economy and attract new investment.
17.1 Industry outlook summary There were several significant developments in 2013-14 which are expected to have long lasting impacts on the Tasmanian energy industry.
In May 2012 the previous Government announced plans to introduce FRC for residential electricity customers from 1 January 2014. It also announced plans to sell the customer base of Aurora Energy to new entrant retailers, to regulate Hydro Tasmania’s wholesale contract activities and to merge Aurora Distribution with Transend to create a new network business, TasNetworks.
In September 2013 the then Government deferred the sale of Aurora Energy but continued with plans for FRC, delaying full implementation until 1 July 2014.
With the election of a new Government in March 2014 a new agenda for energy policy was established. Energy has been identified as one of the Five Pillars of the State’s future economy. The development of a new Energy Strategy for Tasmania has commenced. The aim of the Energy Strategy is to identify and implement ways of using energy to drive economic growth.
Another major focus in the past year has been to complete several reforms aimed at strengthening the national regulatory framework in the long term interests of Australian energy consumers. The AER introduced a number of major reforms focussing on two initiatives. The first is a reform of the process for allowing regulated entities to appeal against specific elements of their regulatory allowances. In the future, such appeals “on merits” will only be allowed if the regulated entity can

184 ENERGY IN TASMANIA – PERFORMANCE REPORT 2013-14
demonstrate that the determination as a whole will be improved. This change has now been incorporated into the National Energy Laws.
The second initiative is the creation of a new body to strengthen consumers’ voice in the process of regulation, appeals, reviews and reforms generally. The new body, Energy Consumers Australia, is expected to commence operating in early 2015.
At a national level theCOAG), is pursuing an ongoing reform agenda through the COAG Energy Council to introduce greater efficiency into energy markets and prevent unnecessary price rises. The COAG Energy Council includes the Tasmanian Minister for Energy.
With the abolition of the carbon pricing mechanism with retrospective effect from 1 July 2014, it is expected flows over Basslink will return to something closer to a balance between imports and exports (depending on the level of inflows to Hydro Tasmania’s dams).
The abolition of the carbon pricing mechanism, the proposed changes to the Renewable Energy Target scheme and the flattening of demand are also expected to have long term implications for renewable energy generation in Australia. It is likely that investment in renewable energy will be less than it has been in the past few years which will impact on the likelihood of further large scale wind farms in Tasmania.
Electricity generation from natural gas declined with a change in the operation of TVPS since its transfer of ownership to Hydro Tasmania. Hydro Tasmania is reviewing the future operational profile for the TVPS now it forms part of Hydro Tasmania’s generation assets. Any change in its operation will impact on the natural gas industry in Tasmania.