Energy Implications of Retrofitting Retail Sector Rooftop
70
NREL is a national laboratory of the U.S. Department of Energy, Office of Energy Efficiency & Renewable Energy, operated by the Alliance for Sustainable Energy, LLC. Contract No. DE-AC36-08GO28308 Energy Implications of Retrofitting Retail Sector Rooftop Units with Stepped- Speed and Variable-Speed Functionality Daniel Studer, Rachel Romero, Lesley Herrmann, and Kyle Benne Technical Report NREL/TP-5500-51102 April 2012
Transcript of Energy Implications of Retrofitting Retail Sector Rooftop

NREL is a national laboratory of the U.S. Department of Energy, Office of Energy Efficiency & Renewable Energy, operated by the Alliance for Sustainable Energy, LLC.
Contract No. DE-AC36-08GO28308
Energy Implications of Retrofitting Retail Sector Rooftop Units with Stepped-Speed and Variable-Speed Functionality Daniel Studer, Rachel Romero, Lesley Herrmann, and Kyle Benne
Technical Report NREL/TP-5500-51102 April 2012

NREL is a national laboratory of the U.S. Department of Energy, Office of Energy Efficiency & Renewable Energy, operated by the Alliance for Sustainable Energy, LLC.
National Renewable Energy Laboratory 15013 Denver West Parkway Golden, Colorado 80401 303-275-3000 • www.nrel.gov
Contract No. DE-AC36-08GO28308
Energy Implications of Retrofitting Retail Sector Rooftop Units With Stepped-Speed and Variable-Speed Functionality Daniel Studer, Rachel Romero, Lesley Herrmann, Kyle Benne
Prepared under Task No. BEC7.1311
Technical Report NREL/TP-5500-51102 April 2012

NOTICE
This report was prepared as an account of work sponsored by an agency of the United States government. Neither the United States government nor any agency thereof, nor any of their employees, makes any warranty, express or implied, or assumes any legal liability or responsibility for the accuracy, completeness, or usefulness of any information, apparatus, product, or process disclosed, or represents that its use would not infringe privately owned rights. Reference herein to any specific commercial product, process, or service by trade name, trademark, manufacturer, or otherwise does not necessarily constitute or imply its endorsement, recommendation, or favoring by the United States government or any agency thereof. The views and opinions of authors expressed herein do not necessarily state or reflect those of the United States government or any agency thereof.
Available electronically at http://www.osti.gov/bridge
Available for a processing fee to U.S. Department of Energy and its contractors, in paper, from:
U.S. Department of Energy Office of Scientific and Technical Information P.O. Box 62 Oak Ridge, TN 37831-0062 phone: 865.576.8401 fax: 865.576.5728 email: mailto:[email protected]
Available for sale to the public, in paper, from:
U.S. Department of Commerce National Technical Information Service 5285 Port Royal Road Springfield, VA 22161 phone: 800.553.6847 fax: 703.605.6900 email: [email protected] online ordering: http://www.ntis.gov/help/ordermethods.aspx
Cover Photos: (left to right) PIX 16416, PIX 17423, PIX 16560, PIX 17613, PIX 17436, PIX 17721
Printed on paper containing at least 50% wastepaper, including 10% post consumer waste.

iii
Acknowledgments The authors would like to thank the U.S. Department of Energy (DOE) Building Technologies Program for its support. This report was prepared by the National Renewable Energy Laboratory (NREL) Center for Electricity, Resources, and Building Systems Integration.
Many NREL colleagues provided valuable input and support. We are indebted to Eric Bonnema for his model development assistance and contributions to the post-processing of simulation results, to Ian Doebber for his insights on rooftop unit (RTU) design and fan flow controls, and to Brent Griffith for his extensive EnergyPlus support. We also thank Matt Leach, who provided information about energy management system controls for EnergyPlus and reviewed this report, as well as Michael Deru, Feitau Kung, William Livingood, Paul Torcellini, and Ron Judkoff who also reviewed this document.
This project would not have been possible without the contributions of the 2011 Retailer Energy Alliance Heating, Ventilating, and Air-Conditioning (HVAC) Project Team. Thank you to the project team members, particularly Scott Williams from Target, David Sheets from Walmart, Paul Holliday from Lowe’s, and Kyle Wilkes from JCPenney. Their contributions improved the representation of systems and controls.

iv
Executive Summary Background According to the 2003 Commercial Buildings Energy Consumption Survey (EIA 2008), approximately 2.7 billion ft2 of commercial retail floor space is served by packaged air-conditioning units. Often, these rooftop units (RTUs) are oversized to meet extreme and infrequent thermal loads (Felts et al. 2000). Thus, RTU supply fans may provide air at rates that are much higher than those needed to meet most thermal loads, wasting the energy needed to move and heat or cool the excess air.
To address this issue, some U.S. retailers have started to upgrade existing RTUs, retrofitting their constant-speed motors with stepped- or variable-speed functionality. Such retrofits may be more cost effective than replacing an entire RTU, particularly if the unit is in the middle of its lifespan. Other U.S. retailers, however, are uncomfortable pursuing this measure, as there is a lack of supporting data detailing the climate zone-specific energy savings potential associated with this upgrade. Building and portfolio energy managers have thus been unable to present a compelling business case for RTU fan motor upgrades.
This study uses whole-building energy simulation to estimate the energy impact of stepped- and variable-speed RTU fan motor retrofits in the retail environment, across 16 locations in all 15 U.S. climate zones. The results allow retailers to estimate the building-level energy savings associated with this retrofit measure. This is a critical step in enabling retailers to determine whether a compelling business case can be made.
Development Process EnergyPlus Version 6.0 (DOE 2010) was used to evaluate the whole-building energy savings associated with stepped- and variable-speed RTU fan motor retrofits as follows:
1. Two prototype big-box retail EnergyPlus models were created: one with refrigeration systems and one without.
2. Each prototype model was replicated across 16 locations, which encompassed all 15 U.S. climate zones, as defined by DOE (2005).
3. Standard 90.1-2004 (ASHRAE 2004a) was applied to the building envelope to create climate-specific baseline models.
4. Custom sizing and control logic was used to modify a subset of the baseline models with stepped- and variable-speed RTU fan motor controls.
5. EnergyPlus was used to simulate the energy performance of all models to determine the energy savings associated with these retrofits.

v
Results Table ES–1 through Table ES–3 present an overview of the simulation results1. Annual whole-building and electric energy savings were seen in all climate zones when switching to stepped- or variable-speed fan motor operation. Whole-building energy savings ranged from 0.7%–8.4%.
Normalized annual electricity savings ranged from 0.50–1.67 kWh/ft2 (1.70–5.70 kBtu/ft2). Average electricity savings across all locations were 1.17 kWh/ft2 (3.98 kBtu/ft2) for the stepped-speed cases and 1.23 kWh/ft2 (4.40 kBtu/ft2) for the variable-speed cases. The results suggest that for certain building types, annual whole-building electricity savings of 200,000 kWh may be realized.
Heating energy increased in all climates, because less fan energy was imparted to the supply airstream during the heating season. On average, this increase was 0.0149 therm/ft2 for the stepped-speed cases and 0.0162 therm/ft2 for the variable-speed cases. (This increase was always more than offset by the electricity use reduction.)
Based on the average energy savings, if variable-speed retrofits were implemented across 10% of the 2.7 billion ft2 of retail space served by packaged RTUs (EIA 2008), retailers would save approximately 332 GWh/yr (1.13 × 10¹² Btu/yr) of electricity and increase natural gas use by 4.4 million therm/yr (4.34 × 10¹¹ Btu/yr). Assuming typical utility rates of $0.10/kWh and $1.00/therm, this would equate to annual utility cost savings of $28.8 million.
This measure requires that a relatively small number of RTU fan motors be upgraded per building. Therefore, this report makes a case that such retrofits should be investigated in all climate zones to address the oftentimes dispersed energy loads in commercial buildings.
The energy savings values presented here depend on a number of assumptions, including the cooling coil and fan flow rate sizing methodology, sequence of operations, space set points, and hours of operation. In order to provide broadly applicable findings, values were used that reflect common practice. Appendix C provides instructions about how to use the results of this study to estimate high-level utility cost savings. A retailer can use such results to justify site-specific assessments of retrofit feasibility and determine if a compelling business case can be made.
1 Note that additional differences between the models with and without refrigeration, such as zoning layout and the fan flow rate sizing methodology, affect the energy consumption and savings values. Readers should exercise caution when comparing results between model types.

vi
Table ES–1 Annual Whole-Building Energy Savings for All Models (%)
Climate Zone Location
Models With Refrigeration Models Without Refrigeration
Stepped-Speed Variable-Speed Stepped-Speed Variable-Speed
1A Miami, FL 2.5 3.5 2.3 2.3 2A Houston, TX 3.2 4.0 3.6 3.6 2B Phoenix, AZ 3.5 4.7 4.1 5.2 3A Atlanta, GA 3.2 3.9 3.7 3.7 3B Los Angeles, CA 6.1 6.5 8.1 8.3 3B Las Vegas, NV 3.4 4.6 4.1 5.5 3C San Francisco, CA 5.8 5.9 8.3 8.4 4A Baltimore, MD 2.2 2.6 2.5 2.4 4B Albuquerque, NM 3.1 3.8 3.6 4.1 4C Seattle, WA 3.1 3.2 4.0 4.0 5A Chicago, IL 1.8 2.1 2.1 2.0 5B Boulder, CO 2.6 3.1 3.2 3.5 6A Minneapolis, MN 1.5 1.8 1.7 1.7 6B Helena, MT 1.8 2.1 2.3 2.4 7 Duluth, MN 1.1 1.2 1.4 1.3 8 Fairbanks, AK 0.7 0.7 0.9 0.9
Table ES–2 Annual Electricity Savings for All Models (kWh/ft2)
Climate Zone Location
Models With Refrigeration Models Without Refrigeration
Stepped-Speed Variable-Speed Stepped-Speed Variable-Speed
1A Miami, FL 0.66 0.94 0.50 0.51 2A Houston, TX 0.95 1.13 0.89 0.91 2B Phoenix, AZ 1.00 1.30 0.98 1.22 3A Atlanta, GA 1.14 1.30 1.11 1.13 3B Los Angeles, CA 1.31 1.40 1.38 1.41 3B Las Vegas, NV 1.11 1.39 1.13 1.41 3C San Francisco, CA 1.47 1.50 1.66 1.67 4A Baltimore, MD 1.19 1.31 1.16 1.24 4B Albuquerque, NM 1.24 1.43 1.23 1.40 4C Seattle, WA 1.41 1.44 1.55 1.57 5A Chicago, IL 1.22 1.32 1.14 1.27 5B Boulder, CO 1.30 1.42 1.29 1.44 6A Minneapolis, MN 1.18 1.28 1.06 1.20 6B Helena, MT 1.30 1.39 1.27 1.43 7 Duluth, MN 1.24 1.29 1.13 1.29 8 Fairbanks, AK 1.12 1.18 1.00 1.14

vii
Table ES–3 Annual Natural Gas Savings* for All Models (therm/ft2)
Climate Zone Location
Models With Refrigeration Models Without Refrigeration
Stepped-Speed Variable-Speed Stepped-Speed Variable-Speed
1A Miami, FL 0.000 0.000 0.000 0.000 2A Houston, TX –0.005 –0.005 –0.005 –0.005 2B Phoenix, AZ –0.004 –0.004 –0.005 –0.005 3A Atlanta, GA –0.012 –0.012 –0.012 –0.013 3B Los Angeles, CA –0.002 –0.002 –0.002 –0.002 3B Las Vegas, NV –0.009 –0.009 –0.010 –0.010 3C San Francisco, CA –0.009 –0.010 –0.011 –0.011 4A Baltimore, MD –0.020 –0.020 –0.020 –0.023 4B Albuquerque, NM –0.017 –0.017 –0.017 –0.019 4C Seattle, WA –0.023 –0.023 –0.025 –0.026 5A Chicago, IL –0.023 –0.024 –0.020 –0.025 5B Boulder, CO –0.021 –0.021 –0.019 –0.023 6A Minneapolis, MN –0.023 –0.023 –0.018 –0.023 6B Helena, MT –0.026 –0.026 –0.023 –0.027 7 Duluth, MN –0.029 –0.029 –0.023 –0.029 8 Fairbanks, AK –0.026 –0.028 –0.021 –0.025
*Negative values indicate that natural gas use increased.

viii
Nomenclature ACH air changes per hour ASHRAE American Society of Heating, Refrigerating and Air-Conditioning
Engineers c.i. continuous insulation cfm cubic feet per minute COP coefficient of performance DOE U.S. Department of Energy EPD equipment power density EUI energy use intensity ft foot, feet ft2 square foot, square feet HVAC heating, ventilating, and air conditioning in. inch, inches kBtu kilo-Btu kW kilowatt, kilowatts kWh kilowatt-hour, kilowatt-hours LPD lighting power density m meter, meters m2 square meter, square meters MJ megajoule, megajoules NREL National Renewable Energy Laboratory OA outside air RH relative humidity RTU rooftop unit SAT supply air temperature therm unit of heat energy equal to 100 kBtu VAV variable air volume w.c. water column

ix
Contents Acknowledgments.......................................................................................................................... iii
Executive Summary ....................................................................................................................... iv
Background ................................................................................................................................ iv
Development Process ................................................................................................................. iv
Results ......................................................................................................................................... v
Nomenclature ............................................................................................................................... viii
Figures and Tables ......................................................................................................................... xi
Figures ........................................................................................................................................ xi
Tables ......................................................................................................................................... xi
1.0 Introduction .......................................................................................................................... 1
1.1 Objective .......................................................................................................................... 1
1.2 Scope ................................................................................................................................ 1
2.0 Building Energy Modeling Methodology ............................................................................ 2
2.1 EnergyPlus ....................................................................................................................... 2
2.2 Climate Zones .................................................................................................................. 2
2.3 Modeling Process ............................................................................................................. 3
3.0 Model Development............................................................................................................. 4
3.1 Form ................................................................................................................................. 4
3.2 Fabric ................................................................................................................................ 6
3.2.1 Opaque Envelope .......................................................................................................... 6
3.2.2 Vertical Fenestration ..................................................................................................... 7
3.3 Infiltration......................................................................................................................... 7
3.4 Internal Load Densities .................................................................................................... 8
3.4.1 Occupancy .................................................................................................................... 8
3.4.2 Plug and Process Loads ................................................................................................ 9
3.4.3 Refrigeration Loads .................................................................................................... 10
3.5 Schedules ........................................................................................................................ 10
3.6 Lighting .......................................................................................................................... 10
3.7 Heating, Ventilating, and Air Conditioning ................................................................... 11
3.7.1 System Type ............................................................................................................... 11
3.7.2 Rooftop Unit Performance Properties ........................................................................ 11

x
3.7.3 Economizer ................................................................................................................. 12
3.7.4 Sizing .......................................................................................................................... 12
3.7.5 Outdoor Air................................................................................................................. 13
3.7.6 Supply Fan .................................................................................................................. 13
3.7.7 Control Logic .............................................................................................................. 14
4.0 Results ................................................................................................................................ 20
4.1 Fan Energy Savings ........................................................................................................ 20
4.2 Whole-Building Energy Savings .................................................................................... 21
4.3 Electricity Consumption Savings ................................................................................... 27
4.4 Natural Gas Consumption Savings ................................................................................ 28
4.5 Utility Cost Savings ....................................................................................................... 29
4.6 Relative Humidity .......................................................................................................... 30
5.0 Conclusions ........................................................................................................................ 32
6.0 Next Steps .......................................................................................................................... 33
7.0 References .......................................................................................................................... 34
Appendix A Schedules ............................................................................................................. 35
A.1 Occupancy, Lighting, and Equipment Schedules........................................................... 35
A.2 Heating and Cooling Set Point Schedules ...................................................................... 36
Appendix B Additional Results Tables ................................................................................... 38
B.1 Detailed Whole-Building Results .................................................................................. 38
B.2 Sizing .............................................................................................................................. 46
B.3 Fan Energy Savings (SI Units) ....................................................................................... 52
B.4 Electricity Consumption Savings (SI Units) .................................................................. 53
B.5 Natural Gas Consumption Savings (SI Units)................................................................ 54
Appendix C How to Calculate Preliminary Utility Cost Savings............................................ 56

xi
Figures and Tables Figures Figure 2–1 DOE climate zones and representative cities ............................................................. 2
Figure 3–1 Rendering of models with refrigeration: view from the southeast ........................... 4
Figure 3–2 Floor plan for models with refrigeration .................................................................... 4
Figure 3–3 Rendering of models without refrigeration: view from the southeast ...................... 5
Figure 3–4 Floor plan for models without refrigeration............................................................... 5
Figure 4–1 Models with refrigeration: annual whole-building EUI by end use for stepped-speed cases .............................................................................................................. 23
Figure 4–2 Models with refrigeration: annual whole-building EUI by end use for variable-speed cases .............................................................................................................. 24
Figure 4–3 Models without refrigeration: annual whole-building EUI by end use for stepped-speed cases ................................................................................................. 25
Figure 4–4 Models without refrigeration: annual whole-building EUI by end use for variable-speed cases ................................................................................................ 26
Figure A–1 Occupancy, lighting, and equipment schedules ....................................................... 36
Figure A–2 Heating and cooling set points ................................................................................. 36
Tables Table ES–1 Annual Whole-Building Energy Savings for All Models (%) .................................. vi
Table ES–2 Annual Electricity Savings for All Models (kWh/ft2) .............................................. vi
Table ES–3 Annual Natural Gas Savings* for All Models (therm/ft2) ....................................... vii
Table 3–1 Space Type Details for Models With Refrigeration .................................................. 6
Table 3–2 Space Type Details for Models Without Refrigeration ............................................. 6
Table 3–3 Envelope Details ........................................................................................................ 7
Table 3–4 Fenestration Details ................................................................................................... 7
Table 3–5 Peak Occupant Density for Models With Refrigeration ............................................ 8
Table 3–6 Peak Occupant Density for Models Without Refrigeration ....................................... 9
Table 3–7 EPDs for Models With Refrigeration ........................................................................ 9
Table 3–8 EPDs for Models Without Refrigeration ................................................................. 10
Table 3–9 LPDs for Models With Refrigeration ...................................................................... 11
Table 3–10 LPDs for Models Without Refrigeration ................................................................. 11
Table 3–11 HVAC System Performance Values ........................................................................ 12

xii
Table 3–12 OA Rates for Models With Refrigeration ................................................................ 13
Table 3–13 OA Rates for Models Without Refrigeration ........................................................... 13
Table 4–1 Normalized Annual Fan Energy Consumption for Models With Refrigeration ...... 20
Table 4–2 Normalized Annual Fan Energy Consumption for Models Without Refrigeration . 21
Table 4–3 Annual Whole-Building Energy Savings for All Models (%) ................................. 22
Table 4–4 Normalized Annual Whole-Building Electricity Consumption for Models With Refrigeration ............................................................................................................ 27
Table 4–5 Normalized Annual Whole-Building Electricity Consumption for Models Without Refrigeration ............................................................................................. 28
Table 4–6 Normalized Annual Whole-Building Natural Gas Consumption* for Models With Refrigeration ................................................................................................... 29
Table 4–7 Normalized Annual Whole-Building Natural Gas Consumption* for Models Without Refrigeration ............................................................................................. 29
Table 4–8 Models With Refrigeration: 95th Percentile RH Values ......................................... 31
Table 4–9 Models Without Refrigeration: 95th Percentile RH Values .................................... 31
Table A–1 Occupancy, Lighting, and Equipment Schedules .................................................... 35
Table A–2 Heating and Cooling Set Points ............................................................................... 37
Table B–1 Energy End Use Breakdown for Models With Refrigeration – IP Units ................. 38
Table B–1 Energy End Use Breakdown for Models With Refrigeration – IP Units (Continued) .............................................................................................................. 39
Table B–2 Energy End Use Breakdown for Models Without Refrigeration – IP Units............ 40
Table B–2 Energy End Use Breakdown for Models Without Refrigeration – IP Units (Continued) .............................................................................................................. 41
Table B–3 Energy End Use Breakdown for Models With Refrigeration – SI Units ................. 42
Table B–3 Energy End Use Breakdown for Models With Refrigeration – SI Units (Continued) .............................................................................................................. 43
Table B–4 Energy End Use Breakdown for Models Without Refrigeration – SI Units............ 44
Table B–4 Energy End Use Breakdown for Models Without Refrigeration – SI Units (Continued) .............................................................................................................. 45
Table B–5 Cooling Coil Sizing Results by Zone for Models With Refrigeration – tons .......... 46
Table B–6 Cooling Coil Sizing Results by Zone for Models With Refrigeration – ft2/ton....... 46
Table B–7 Cooling Coil Sizing Results by Zone for Models With Refrigeration – kW ........... 47
Table B–8 Cooling Coil Sizing Results by Zone for Models Without Refrigeration – tons ..... 47
Table B–9 Cooling Coil Sizing Results by Zone for Models Without Refrigeration – ft2/ton . 48
Table B–10 Cooling Coil Sizing Results by Zone for Models Without Refrigeration – kW ...... 48

xiii
Table B–11 Heating Coil Sizing Results by Zone for Models With Refrigeration – kBtu/h ...... 49
Table B–12 Heating Coil Sizing Results by Zone for Models With Refrigeration – Btu/h∙ft2 ... 49
Table B–13 Heating Coil Sizing Results by Zone for Models With Refrigeration – kW ........... 50
Table B–14 Heating Coil Sizing Results by Zone for Models Without Refrigeration – kBtu/h . 50
Table B–15 Heating Coil Sizing Results by Zone for Models Without Refrigeration – Btu/h∙ft2 ................................................................................................................... 51
Table B–16 Heating Coil Sizing Results by Zone for Models Without Refrigeration – kW ...... 51
Table B–17 Normalized Annual Fan Energy Consumption for Models With Refrigeration ...... 52
Table B–18 Normalized Annual Fan Energy Consumption for Models Without Refrigeration . 52
Table B–19 Normalized Annual Whole-Building Electricity Consumption for Models With Refrigeration ............................................................................................................ 53
Table B–20 Normalized Annual Whole-Building Electricity Consumption for Models Without Refrigeration ............................................................................................. 53
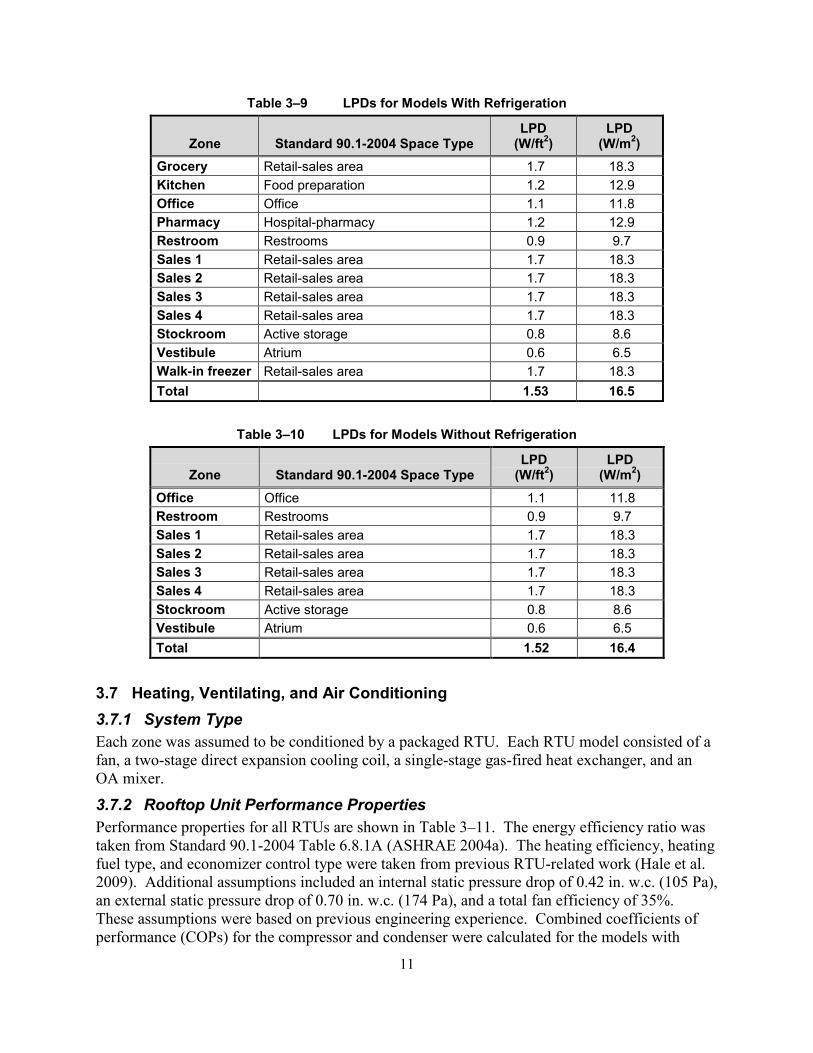
Table B–21 Normalized Annual Whole-Building Natural Gas Consumption* for Models With Refrigeration ................................................................................................... 54
Table B–22 Normalized Annual Whole-Building Natural Gas Consumption* for Models Without Refrigeration ............................................................................................. 55
Table C–1 Annual Whole Building Energy Savings (%) for All Models ................................. 56
Table C–2 High-Level Calculation Methodology ..................................................................... 56

1
1.0 Introduction According to the 2003 Commercial Buildings Energy Consumption Survey (EIA 2008), approximately 2.7 billion ft2 of commercial retail floor space is served by packaged air-conditioning units. Often, these rooftop units (RTUs) are oversized to meet extreme and infrequent thermal loads (Felts et al. 2000). Thus, RTU supply fans may provide air at rates that are much higher than those needed to meet most thermal loads, wasting the energy needed to move and heat or cool the excess air.
To enable more efficient RTU operation during normal operating conditions, some U.S. retailers have started to upgrade existing RTUs, retrofitting their constant-speed motors with stepped- or variable-speed functionality. Such retrofits may be more cost effective than replacing an entire RTU, particularly if the unit is in the middle of its lifespan. Other U.S. retailers, however, are uncomfortable pursuing this measure, as there is a lack of supporting data detailing the climate zone-specific energy savings potential associated with this upgrade. Building and portfolio energy managers have thus been unable to present a compelling business case for RTU fan motor upgrades.
This study uses whole-building energy simulation to estimate the energy impact of stepped- and variable-speed RTU fan motor retrofits in the retail environment, across 16 locations in all 15 U.S. climate zones. The results allow retailers to estimate the building-level energy savings associated with this retrofit measure. This is a critical step in enabling retailers to determine whether a compelling business case can be made.
1.1 Objective Our objective was to use whole-building energy simulation to quantify the energy savings associated with stepped- and variable-speed RTU fan motor retrofits in a typical big-box retail environment.
1.2 Scope This report provides normalized, simulation-based energy savings estimates for RTU fan motor retrofits. Because the big-box retail environment is diverse, we examined buildings with and without refrigeration systems (walk-in coolers and refrigerated cases).

2
2.0 Building Energy Modeling Methodology 2.1 EnergyPlus EnergyPlus Version 6.0 (DOE 2010), a publicly available building energy simulation engine, was used for all analyses. EnergyPlus was selected because it is a detailed U.S. Department of Energy (DOE) simulation tool that computes building energy use based on the interactions between climate; building form and fabric; internal gains; heating, ventilating, and air conditioning (HVAC) systems; and renewable energy systems. All simulations were run on desktop computers at the National Renewable Energy Laboratory (NREL).
2.2 Climate Zones The models used for this study were simulated in 16 locations, which represent all 15 U.S. climate zones. The eight climate zones and three subzones used to determine these locations are depicted in Figure 2–1. The zones are defined primarily by heating degree days and cooling degree days (Briggs et al. 2003). The climate zones range from hot (zone 1) to cold (zone 8). Subzones indicate varying moisture conditions. Humid subzones are designated by the letter A, dry subzones by B, and marine subzones by C.
Figure 2–1 DOE climate zones and representative cities
(Credit: DOE 2005)
Models were simulated for large cities only, as the weather data for such locations were directly applicable to a large fraction of the total U.S. building floor area. Energy savings were determined by running the baseline and all retrofit simulations with the same Typical
3
Meteorological Year 3 weather file (one set of simulations for each city) (Deru et al. 2011). The 16 specific locations for which analyses were performed are listed below, are marked in Figure 2–1, and are designated as being representative of their respective climate zones.2
• Zone 1A Miami, Florida (hot, humid) • Zone 2A Houston, Texas (hot, humid) • Zone 2B Phoenix, Arizona (hot, dry) • Zone 3A Atlanta, Georgia (hot, humid) • Zone 3B Las Vegas, Nevada (hot, dry) and Los Angeles, California (warm, dry) • Zone 3C San Francisco, California (marine) • Zone 4A Baltimore, Maryland (mild, humid) • Zone 4B Albuquerque, New Mexico (mild, dry) • Zone 4C Seattle, Washington (marine) • Zone 5A Chicago, Illinois (cold, humid) • Zone 5B Boulder, Colorado (cold, dry) • Zone 6A Minneapolis, Minnesota (cold, humid) • Zone 6B Helena, Montana (cold, dry) • Zone 7 Duluth, Minnesota (very cold) • Zone 8 Fairbanks, Alaska (extremely cold)
2.3 Modeling Process Two prototype big-box retail EnergyPlus models were created: one with refrigeration systems (for food sales) and one without. Each prototype model was then replicated across 16 locations, and Standard 90.1-2004 (ASHRAE 2004a) was applied to the building envelope to create climate-specific baseline models. Each of the 32 baseline models was then modified with stepped- and variable-speed RTU fan motor functionality, and the energy performance of all 96 models (32 constant-speed, 32 stepped-speed, and 32 variable-speed) was simulated using EnergyPlus to determine energy savings.
2 This report contains numerous climate zone tables in which the states will be designated with their respective two-letter postal codes: Florida (FL), Texas (TX), Arizona (AZ), Georgia (GA), Nevada (NV), California (CA), Maryland (MD), New Mexico (NM), Washington (WA), Illinois (IL), Colorado (CO), Minnesota (MN), Montana (MT), and Alaska (AK).

4
3.0 Model Development 3.1 Form The building form for each prototype model was based on floor plans supplied by a major U.S. retailer. The models with refrigeration included all space types in the models without refrigeration, plus a pharmacy, a grocery area, a walk-in freezer area, and a kitchen. The total floor area for the models with refrigeration was 133,275 ft2 (12,382 m2). The total floor area for the models without refrigeration was 111,825 ft2 (10,389 m2). Figure 3–1 through Figure 3–4 and Table 3–1 and Table 3–2 provide additional details about the zone layout and space types assumed for both prototype models.
Figure 3–1 Rendering of models with refrigeration: view from the southeast
(Credit: Rachel Romero/NREL)
Figure 3–2 Floor plan for models with refrigeration
(Credit: Rachel Romero/NREL)

5
Figure 3–3 Rendering of models without refrigeration: view from the southeast (Credit: Rachel Romero/NREL)
Figure 3–4 Floor plan for models without refrigeration
(Credit: Rachel Romero/NREL)

6
Table 3–1 Space Type Details for Models With Refrigeration
Zone Floor Area (ft2) Floor Area (m2) Total (%) Grocery 16,250 1,510 12.2 Kitchen 1,800 167 1.4 Office 4,500 418 3.4 Pharmacy 1,950 181 1.5 Restroom 900 84 0.7 Sales 1 21,875 2,032 16.4 Sales 2 21,875 2,032 16.4 Sales 3 21,875 2,032 16.4 Sales 4 21,875 2,032 16.4 Stockroom 16,400 1,524 12.3 Vestibule 2,025 188 1.5 Walk-in freezer 1,950 181 1.5 Total 133,275 12,382 100.0
Table 3–2 Space Type Details for Models Without Refrigeration
Zone Floor Area (ft2) Floor Area (m2) Total (%) Office 8,250 766 7.4 Restroom 900 84 0.8 Sales 1 21,875 2,032 19.6 Sales 2 21,875 2,032 19.6 Sales 3 21,875 2,032 19.6 Sales 4 21,875 2,032 19.6 Stockroom 13,150 1,222 11.8 Vestibule 2,025 188 1.8 Total 111,825 10,389 100.0
3.2 Fabric 3.2.1 Opaque Envelope The thermal properties for opaque exterior surfaces in all models were taken from Standard 90.1-2004 (ASHRAE 2004a). Wall insulation values were chosen assuming steel-framed construction. The roof insulation was assumed to be entirely above deck. Table 3–3 details the thermal resistance of the exterior walls and roofs for all models by climate zone.

7
Table 3–3 Envelope Details
Climate Zone Location
Exterior Wall Insulation (ft2∙h∙°F/Btu)
Roof Insulation (ft2∙h∙°F/Btu)
1A Miami, FL R-13 R-15 c.i. 2A Houston, TX R-13 R-15 c.i. 2B Phoenix, AZ R-13 R-15 c.i. 3A Atlanta, GA R-13 R-15 c.i. 3B Los Angeles, CA R-13 R-15 c.i. 3B Las Vegas, NV R-13 R-15 c.i. 3C San Francisco, CA R-13 R-15 c.i. 4A Baltimore, MD R-13 R-15 c.i. 4B Albuquerque, NM R-13 R-15 c.i. 4C Seattle, WA R-13 R-15 c.i. 5A Chicago, IL R-13 + R-3.8 c.i. R-15 c.i. 5B Boulder, CO R-13 + R-3.8 c.i. R-15 c.i. 6A Minneapolis, MN R-13 + R-3.8 c.i. R-15 c.i. 6B Helena, MT R-13 + R-3.8 c.i. R-15 c.i. 7 Duluth, MN R-13 + R-7.5 c.i. R-15 c.i. 8 Fairbanks, AK R-13 + R-7.5 c.i. R-20 c.i.
3.2.2 Vertical Fenestration Window properties for all models were determined according to Standard 90.1-2004 (ASHRAE 2004a) and are detailed in Table 3–4.
Table 3–4 Fenestration Details
Climate Zone U-Factor
(Btu/h∙ft2∙°F) Solar Heat Gain
Coefficient Visible Light
Transmittance 1A U-1.22 0.25 0.25
2 (A,B) U-1.22 0.25 0.25 3 (A,B) U-0.57 0.39 0.50
3C U-1.22 0.61 0.61 4 (A,B,C) U-0.57 0.39 0.50 5 (A,B) U-0.57 0.49 0.62 6 (A,B) U-0.57 0.49 0.62
7 U-0.57 0.49 0.49 8 U-0.46 0.45 0.45
3.3 Infiltration The infiltration rate for all zones in all models was assumed to be 0.15 cfm/ft2 at 0.016 in. w.c. (0.76 L/s∙m2 at 4 Pa) of above-grade envelope area (walls and roof). This value was chosen as it represented an acceptable middle ground between the infiltration rates used by Deru et al. (2011) for new construction and existing buildings. During occupied hours, when outdoor air (OA) was being brought in by the HVAC system, the building was assumed to be pressurized, and the

8
infiltration rate was set to 50% of this design value. During unoccupied hours, the infiltration rate was reset to the design value.
Additional infiltration was added to the vestibule zone at a maximum flow rate of 2.22 cfm/ft2 (11.30 L/s∙m2) of floor area to account for infiltration associated with opening and closing of the main entry doors. This value was calculated using Equation 52 from Chapter 16 of the 2009 ASHRAE Handbook—Fundamentals (ASHRAE 2009):
Q = CA × A × Rp (3-1)
Where: Q = airflow rate (cfm) CA = airflow coefficient [cfm/ft2/(in. of water)0.5] A = area of the door opening (ft2) Rp = pressure factor [(in. of water)0.5]
The airflow coefficient and pressure factor were calculated using methodology presented by Yuill (1996). To determine the airflow coefficient, a maximum occupancy flow rate through the entry of 159 people per hour was assumed, a value based on measured data presented by Yuill (1996). The door opening was assumed to be equal to 42 ft2 (3.9 m2). Daily variations in vestibule infiltration were assumed to follow the occupancy schedule.
3.4 Internal Load Densities 3.4.1 Occupancy Peak occupant density values were taken from Standard 62.1-2004 (ASHRAE 2004b). For the models with refrigeration, the average floor area per person was 76.5 ft2 (7.1 m2); for those without refrigeration, it was 74.6 ft2 (6.9 m2). Table 3–5 and Table 3–6 detail the peak occupant density by zone for both model types.
Table 3–5 Peak Occupant Density for Models With Refrigeration
Zone Standard 62.1-2004
Equivalent Zone Occupancy Density
(people/100 m2) Area per Person
(ft2/person) Area per Person
(m2/person) Grocery Supermarket 8.0 134.5 12.5 Kitchen Sales 15.0 71.8 6.7 Office Office 5.0 215.3 20.0 Pharmacy Pharmacy 10.0 107.6 10.0 Restroom Sales 15.0 71.8 6.7 Sales 1 Sales 15.0 71.8 6.7 Sales 2 Sales 15.0 71.8 6.7 Sales 3 Sales 15.0 71.8 6.7 Sales 4 Sales 15.0 71.8 6.7 Stockroom Shipping/receiving 0.0 0.0 0.0 Vestibule Main entry lobbies 10.0 107.6 10.0 Walk-in freezer Sales 15.0 71.8 6.7 Total 11.8 76.5 7.1

9
Table 3–6 Peak Occupant Density for Models Without Refrigeration
Zone Standard 62.1-2004
Equivalent Zone Occupancy Density
(people/100 m2) Area per Person
(ft2/person) Area per Person
(m2/person) Office Office 5.0 215.3 20.0 Restroom Sales 15.0 71.8 6.7 Sales 1 Sales 15.0 71.8 6.7 Sales 2 Sales 15.0 71.8 6.7 Sales 3 Sales 15.0 71.8 6.7 Sales 4 Sales 15.0 71.8 6.7 Stockroom Shipping/receiving 0.0 0.0 0.0 Vestibule Main entry lobbies 10.0 107.6 10.0 Total 12.4 74.6 6.9
3.4.2 Plug and Process Loads The equipment data detailed in Table 3–7 and Table 3–8 were adapted from metered values obtained from a big-box retailer. The total equipment power density (EPD) for the models with refrigeration was 0.65 W/ft2 (7.0 W/m2); those without refrigeration had an EPD of 0.56 W/ft2
(6.0 W/m2). This difference is due mainly to the lack of a “kitchen” zone in the models without refrigeration.
Table 3–7 EPDs for Models With Refrigeration
Zone EPD
(W/ft2) EPD
(W/m2) Grocery 0.00 0.00 Kitchen 14.08 151.59 Office 1.00 10.72 Pharmacy 0.35 3.75 Restroom 0.00 0.00 Sales 1 0.55 5.91 Sales 2 0.55 5.91 Sales 3 0.55 5.91 Sales 4 0.55 5.91 Stockroom 0.50 5.34 Vestibule 0.00 0.00 Walk-in freezer 0.00 0.00 Total 0.65 7.00

10
Table 3–8 EPDs for Models Without Refrigeration
Zone EPD
(W/ft2) EPD
(W/m2) Office 1.00 10.72 Restroom 0.00 0.00 Sales 1 0.55 5.91 Sales 2 0.55 5.91 Sales 3 0.55 5.91 Sales 4 0.55 5.91 Stockroom 0.50 5.34 Vestibule 0.00 0.00 Total 0.56 6.04
3.4.3 Refrigeration Loads For the models with refrigeration, refrigerated cases were assumed to be present in the grocery, kitchen, and walk-in freezer zones. The grocery zone contained single-deck ice cream cases, vertical door freezer cases for frozen foods, and multideck cases for dairy and deli items, for a total of 415 linear feet (126.5 m) of refrigerated cases. The kitchen zone contained 20 linear feet (6.1 m) of multideck cases for dairy and deli items. The walk-in freezer zone contained 1,779 ft2 (165.3 m2) of walk-in freezers.
3.5 Schedules All models assumed that the buildings were open to customers from 8:00 a.m. to 10:00 p.m., seven days per week; however, because store employees had to be in the space before and after sales hours, occupied hours were assumed to be from 7:00 a.m. to 11:00 p.m., seven days per week. Occupancy, lighting, equipment, and set point schedules are presented in Appendix A.
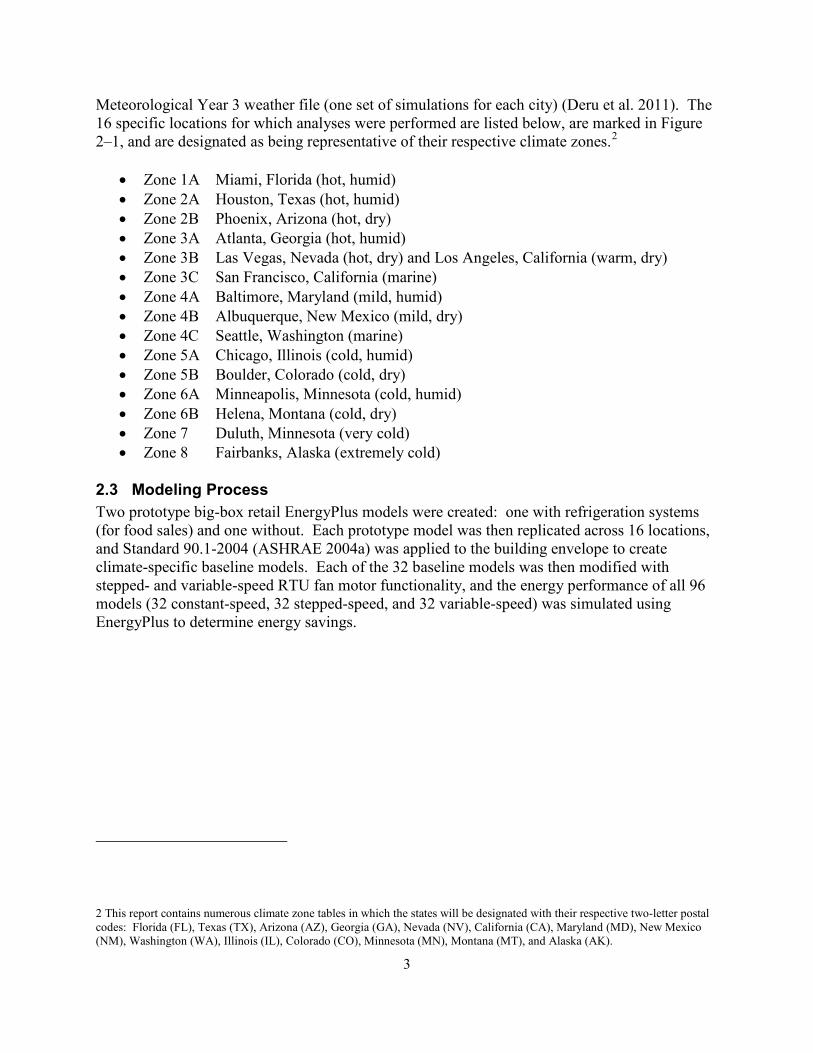
3.6 Lighting Lighting power density (LPD) values for all models were taken from Standard 90.1-2004 Table 9.6.1 (ASHRAE 2004a). The total building LPD for the models with refrigeration was 1.53 W/ft2 (16.5 W/m2). The building LPD for the models without refrigeration was 1.52 W/ft2 (16.4 W/m2). The LPDs for each model type and zone and the associated Standard 90.1-2004 (ASHRAE 2004a) space type are listed in Table 3–9 and Table 3–10.
All models were assumed to have 3,014 W of exterior lighting. This value was adapted from data obtained from a big-box retailer. The exterior lighting system was controlled by an ambient light sensor, ensuring that the lights were on from dusk until dawn. Exterior lighting was modeled to more accurately determine building peak electrical demand. It had no impact on the results of this study.
11
Table 3–9 LPDs for Models With Refrigeration
Zone Standard 90.1-2004 Space Type LPD
(W/ft2) LPD
(W/m2) Grocery Retail-sales area 1.7 18.3 Kitchen Food preparation 1.2 12.9 Office Office 1.1 11.8 Pharmacy Hospital-pharmacy 1.2 12.9 Restroom Restrooms 0.9 9.7 Sales 1 Retail-sales area 1.7 18.3 Sales 2 Retail-sales area 1.7 18.3 Sales 3 Retail-sales area 1.7 18.3 Sales 4 Retail-sales area 1.7 18.3 Stockroom Active storage 0.8 8.6 Vestibule Atrium 0.6 6.5 Walk-in freezer Retail-sales area 1.7 18.3 Total 1.53 16.5
Table 3–10 LPDs for Models Without Refrigeration
Zone Standard 90.1-2004 Space Type LPD
(W/ft2) LPD
(W/m2) Office Office 1.1 11.8 Restroom Restrooms 0.9 9.7 Sales 1 Retail-sales area 1.7 18.3 Sales 2 Retail-sales area 1.7 18.3 Sales 3 Retail-sales area 1.7 18.3 Sales 4 Retail-sales area 1.7 18.3 Stockroom Active storage 0.8 8.6 Vestibule Atrium 0.6 6.5 Total 1.52 16.4
3.7 Heating, Ventilating, and Air Conditioning 3.7.1 System Type Each zone was assumed to be conditioned by a packaged RTU. Each RTU model consisted of a fan, a two-stage direct expansion cooling coil, a single-stage gas-fired heat exchanger, and an OA mixer.
3.7.2 Rooftop Unit Performance Properties Performance properties for all RTUs are shown in Table 3–11. The energy efficiency ratio was taken from Standard 90.1-2004 Table 6.8.1A (ASHRAE 2004a). The heating efficiency, heating fuel type, and economizer control type were taken from previous RTU-related work (Hale et al. 2009). Additional assumptions included an internal static pressure drop of 0.42 in. w.c. (105 Pa), an external static pressure drop of 0.70 in. w.c. (174 Pa), and a total fan efficiency of 35%. These assumptions were based on previous engineering experience. Combined coefficients of performance (COPs) for the compressor and condenser were calculated for the models with

12
refrigeration and the models without refrigeration based on their respective design fan flow rates (see Section 3.7.4) and the above values for energy efficiency ratio, fan efficiency, and fan static pressure drop. Because of the differences in design fan flow rate (see Section 3.7.4) between the models with and without refrigeration, separate COP values for each model type were calculated and used to ensure that the overall RTU energy efficiency ratio met that specified by Standard 90.1-2004 Table 6.8.1A (ASHRAE 2004a). For further information, see the methodology detailed in Hale et al.
Table 3–11 HVAC System Performance Values
HVAC Input Modeled Value RTU energy efficiency ratio 10.1 Compressor/condenser combined COP for models with refrigeration 3.45 Compressor/condenser combined COP for models without refrigeration 3.36 Heating efficiency 80% Heating fuel Natural gas Fan static pressure 1.12 in. w.c. (279 Pa) Fan mechanical efficiency: power gained by the air/power input to the fan motor 35%
Combined fan motor and belt efficiency 77% Economizer control Differential dry-bulb
Five empirically derived curve fits were used to model the performance map of the direct expansion equipment. These described the unit’s cooling capacity and efficiency as functions of the cooling coil inlet air conditions, cooling coil airflow rate, and the condenser inlet air dry-bulb temperature. The specific performance curves used for this study were derived from measured values obtained through laboratory testing of a 10-ton RTU (Kozubal et al. 2010).
3.7.3 Economizer Differential dry-bulb economizers were included in all models and across all climate zones. The OA damper was modeled as having full modulating capability.
3.7.4 Sizing EnergyPlus Runtime Language was used to size the cooling coil capacity and fan flow rate for each RTU. Cooling coil capacities for all models were sized to provide one ton of cooling for every 375 ft2 served (100.9 W/m2). Fan sizes, in terms of maximum volumetric flow rate, were set to 1.2 cfm/ft2 (6.1 L/s∙m2) of zone floor area for the models with refrigeration and to 1.0 cfm/ft2 (5.1 L/s∙m2) of zone floor area for the models without refrigeration. These values were based on engineering judgment and are meant to represent the typical RTU fan over sizing observed in the retail sector. The heating coils were “autosized” using EnergyPlus’ built-in sizing algorithms. We assumed that only 10-ton RTUs were used to condition the building. For example, if a zone required 20 tons of cooling, a single 20-ton RTU was simulated using 10-ton unit performance properties, thereby mimicking the performance of two, 10-ton units operating together to serve that zone.

13
3.7.5 Outdoor Air OA supply flow rates for each zone were calculated in accordance with Standard 62.1-2004 (ASHRAE 2004b). Table 3–12 and Table 3–13 detail the OA design flow rates for both prototype models.
Table 3–12 OA Rates for Models With Refrigeration
Zone Standard 62.1-2004
Equivalent Zone
OA per Area
(cfm/ft2)
OA per Area
(L/s∙m2)
OA per Person
(cfm/person)
OA per Person
(L/s∙person)
Total OA
(cfm)
Total OA
(L/s) Grocery Supermarket 0.06 0.305 7.5 3.540 1,881 888 Kitchen Sales 0.12 0.610 7.5 3.540 404 191 Office Office 0.06 0.305 5.0 2.360 375 177 Pharmacy Pharmacy 0.18 0.914 5.0 2.360 442 208 Restroom Sales 0.12 0.610 7.5 3.540 202 95 Sales 1 Sales 0.12 0.610 7.5 3.540 4,911 2,318 Sales 2 Sales 0.12 0.610 7.5 3.540 4,911 2,318 Sales 3 Sales 0.12 0.610 7.5 3.540 4,911 2,318 Sales 4 Sales 0.12 0.610 7.5 3.540 4,911 2,318 Stockroom Shipping/receiving 0.12 0.610 0.0 0.000 1,968 929 Vestibule Main entry lobbies 0.06 0.305 5.0 2.360 216 102 Walk-in freezer Sales 0.12 0.610 7.5 3.540 438 207 Total 0.11 0.562 6.4 3.029 25,569 12,068
Table 3–13 OA Rates for Models Without Refrigeration
Zone Standard 62.1-2004
Equivalent Zone
OA per Area
(cfm/ft2)
OA per Area
(L/s∙m2)
OA per Person
(cfm/person)
OA per Person
(L/s∙person)
Total OA
(cfm)
Total OA
(L/s) Office Office 0.06 0.305 5.0 2.360 375 177 Restroom Sales 0.12 0.610 7.5 3.540 202 95 Sales 1 Sales 0.12 0.610 7.5 3.540 4,911 2,318 Sales 2 Sales 0.12 0.610 7.5 3.540 4,911 2,318 Sales 3 Sales 0.12 0.610 7.5 3.540 4,911 2,318 Sales 4 Sales 0.12 0.610 7.5 3.540 4,911 2,318 Stockroom Shipping/receiving 0.12 0.610 0.0 0.000 1,968 929 Vestibule Main entry lobbies 0.06 0.305 5.0 2.360 216 102 Total 0.11 0.582 6.4 3.015 22,405 10,574
3.7.6 Supply Fan Each RTU supply fan was hard-sized to provide a maximum volumetric flow rate of 1.2 cfm/ft2 (6.1 L/s∙m2) of zone floor area for the models with refrigeration and 1.0 cfm/ft2 (5.1 L/s∙m2) of zone floor area for the models without refrigeration. The fan power at part-load was modeled according to ASHRAE 90.1-2004 Appendix G Table G3.1.3.15 Method 2 for the Part-Load Fan Power Equation (ASHRAE 2004a):
Pfan = 0.0013 + 0.1470 × PLRfan + 0.9506 × (PLRfan)2 - 0.0998 × (PLRfan)3 (3-2)

14
Where: Pfan = fraction of full-load fan power PLRfan = fan part-load ratio (current cfm/design cfm)
For all models with refrigeration, the RTU fan minimum flow rate was 0.7 cfm/ft2 (3.7 L/s∙m2) of zone floor area, a value equivalent to 60% of the design flow rate. The minimum RTU fan flow rate for the models without refrigeration was 0.4 cfm/ft2 (2.0 L/s∙m2) of zone floor area, a value equivalent to 40% of the design flow rate. The RTU fan minimum flow rate was kept higher in the models with refrigeration to prevent microclimates that the refrigerated cases would otherwise have created.
3.7.7 Control Logic Typically, EnergyPlus models are run with simulation time steps set between 10 and 15 minutes, which is longer than the time the HVAC system normally takes to respond to changing building conditions. At the beginning of each time step, EnergyPlus’ traditional controls predict the exact amount of heating or cooling that will be needed for each thermal zone to reach the space set point. EnergyPlus then compares this value to the HVAC system capacity and runs the system at an artificial heating or cooling part-load ratio—taking into account coil cycling losses—to ensure that at the end of the time step, the zone temperature meets the space set point.
The downside to this type of control is that the fan is locked into a single, average operational flow rate during each 10- to 15-minute time step. Although this control scheme will accurately predict annual fan energy use, it cannot be used to compare the effects of certain dynamic fan operation strategies, as EnergyPlus limits the types of available fan control schemes.
To resolve this issue, custom EnergyPlus Runtime Language code was written to control RTU fan motor and coil operation, which enabled the study of stepped- and variable-speed RTU operation. The simulation time steps used for this study were set equal to 1 minute. Smaller time steps allowed us to more realistically reflect real-world stepped- and variable-speed RTU operation, where fan flow rates are adjusted on minute timescales in response to changing indoor, outdoor, and coil conditions.
The following subsections describe the EnergyPlus Runtime Language code that was used to control each RTU fan motor type. This code was adapted from real-world control logic to characterize the energy performance of the investigated strategies across a broad array of building types and climates. As such, the control logic provided here was not tailored to a particular application; changes to the control logic for a particular installation may provide even greater energy savings than those presented in this report. 3.7.7.1 Constant-Speed Case For the baseline case (constant-speed), the RTU fan speed was fixed at the design fan speed during occupied hours for all operating modes. The control logic narrative for the constant-speed fan motor case follows.
1. Deadband a. During occupied hours, when the system was not in heating, economizing, or
cooling mode, deadband mode was active. i. The OA dampers were set to the minimum ventilation position.
ii. The heating and cooling coils were turned off.

15
b. During unoccupied hours, when the system was not in heating, economizing, or cooling mode, the RTU fan was turned off.
2. Heating a. The heating coil was engaged when the zone temperature was below the heating
set point (Tzone < Tset,heat). i. During occupied hours, the OA dampers were set to the minimum
ventilation position. ii. During unoccupied hours, the OA dampers were closed.
iii. The RTU continued to heat the zone until the zone temperature was at least 1°F above the heating set point [Tzone ≥ (Tset,heat + 1°F)].
3. Economizing a. If (1) the OA temperature was less than 65°F and greater than 50°F (50°F < TOA <
65°F), and (2) the zone temperature was above the cooling set point by no more than 1°F [Tset,cool < Tzone ≤ (Tset,cool + 1°F)], economizing was engaged.
i. The OA dampers were set to 100% open. ii. The cooling coils remained off.
iii. The RTU operated in economizer mode until either: 1. The OA temperature was less than or equal to 50°F (TOA ≤ 50°F),
at which point the RTU entered Stage 1 cooling mode. 2. The OA temperature was greater than or equal to 65°F (TOA ≥
65°F), at which point the RTU entered Stage 1 cooling mode. 3. The zone temperature was at least 1°F below the cooling set point
[Tzone ≤ (Tset,cool – 1°F)], at which point the RTU entered deadband mode.
4. The zone temperature was greater than 1°F above the cooling set point [Tzone > (Tset,cool + 1°F)], at which point the RTU entered Stage 2 cooling mode.
4. Cooling a. Stage 1 cooling was engaged when the zone temperature rose above the cooling
set point by no more than 1°F [Tset,cool < Tzone ≤ (Tset,cool + 1°F)] and the OA temperature was not between 50°F and 65°F (economizing condition).
i. The first compressor was engaged. ii. The RTU remained in Stage 1 cooling until either:
1. The zone temperature was at least 1°F below the cooling set point [Tzone ≤ (Tset,cool – 1°F)], at which point the RTU entered deadband mode.
2. The zone temperature was greater than 1°F above the cooling set point [Tzone > (Tset,cool + 1°F)], at which point the RTU entered Stage 2 cooling mode.
iii. During unoccupied hours, the OA dampers were closed. b. Stage 2 cooling was engaged when the zone temperature was greater than 1°F
above the cooling set point [Tzone > (Tset,cool + 1°F)]. i. Both compressors were engaged.
ii. The RTU remained in Stage 2 cooling until the zone temperature was at least 1°F below the cooling set point [Tzone ≤ (Tset,cool – 1°F)], at which point the RTU entered deadband mode.

16
iii. During unoccupied hours, the OA dampers were closed, unless the OA temperature was less than 65°F and greater than 50°F (50°F < TOA < 65°F), in which case the OA dampers were set to the minimum ventilation position.
c. During occupied hours, the OA dampers were set to the minimum ventilation position.
3.7.7.2 Stepped-Speed Case For the stepped-speed case, the RTU fan was modeled with four fan speed steps: off, minimum flow rate, reduced flow rate, and full flow rate. Minimum flow rate was used when the zone was in deadband operation, meaning that its HVAC system was not heating, cooling, or economizing. The minimum flow rates for both prototype models are detailed in Section 3.7.6. During Stage 1 cooling, the fan operated at a reduced flow rate equal to 80% of the design fan flow rate. This equated to 1.0 cfm/ft2 (4.9 L/s∙m2) for the models with refrigeration and 0.8 cfm/ft2 (4.1 L/s∙m2) for those without refrigeration. Full flow rate was used when the RTU was in heating, economizing, or Stage 2 cooling mode. The control logic narrative for the stepped-speed fan motor case follows.
1. Deadband a. During occupied hours, when the system was not in heating, economizing, or
cooling mode, deadband mode was active. i. The fan flow rate was set to minimum. If this flow rate proved
insufficient to maintain a supply air temperature (SAT) of at least 50°F, the fan flow rate was increased to 80% of the design fan flow rate. If this flow rate was still insufficient, the fan flow rate was increased to 100% of the design fan flow rate.
ii. The OA dampers were modulated as appropriate to supply minimum ventilation.
iii. The heating and cooling coils were turned off. b. During unoccupied hours, when the system was not in heating, economizing, or
cooling mode, the RTU fan was turned off. 2. Heating
a. The heating coil was engaged when the zone temperature was below the heating set point [Tzone < Tset,heat].
i. The RTU fan flow rate was set equal to the design fan flow rate. ii. During occupied hours, the OA dampers were set to the minimum
ventilation position. iii. During unoccupied hours, the OA dampers were closed. iv. The RTU continued to heat the zone until the zone temperature was at
least 1°F above the heating set point [Tzone ≥ (Tset,heat + 1°F)]. 3. Economizing
a. If (1) the OA temperature was less than 65°F and greater than 50°F (50°F < TOA < 65°F), and (2) the zone temperature was above the cooling set point by no more than 1°F [Tset,cool < Tzone ≤ (Tset,cool + 1°F)], economizing was engaged.
i. The RTU fan flow rate was set equal to the design fan flow rate. ii. The OA dampers were set to 100% open.
iii. The cooling coils remained off.

17
iv. The RTU operated in economizer mode until either: 1. The OA temperature was less than or equal to 50°F (TOA ≤ 50°F),
at which point the RTU entered Stage 1 cooling mode. 2. The OA temperature was greater than or equal to 65°F (TOA ≥
65°F), at which point the RTU entered Stage 1 cooling mode. 3. The zone temperature was at least 1°F below the cooling set point
[Tzone ≤ (Tset,cool – 1°F)], at which point the RTU entered deadband mode.
4. The zone temperature was greater than 1°F above the cooling set point [Tzone > (Tset,cool + 1°F)], at which point the RTU entered Stage 2 cooling mode.
4. Cooling a. Stage 1 cooling was engaged when the zone temperature rose above the cooling
set point by no more than 1°F [Tset,cool < Tzone ≤ (Tset,cool + 1°F)] and the OA temperature was not between 50°F and 65°F (economizing condition).
i. The RTU fan flow rate was set equal to 80% of the design fan flow rate. ii. The first compressor was engaged.
iii. The RTU remained in Stage 1 cooling until either: 1. The zone temperature was at least 1°F below the cooling set point
[Tzone ≤ (Tset,cool – 1°F)], at which point the RTU entered deadband mode.
2. The zone temperature was greater than 1°F above the cooling set point [Tzone > (Tset,cool + 1°F)], at which point the RTU entered Stage 2 cooling mode.
iv. During unoccupied hours, the OA dampers were closed. b. Stage 2 cooling was engaged when the zone temperature was greater than 1°F
above the cooling set point [Tzone > (Tset,cool + 1°F)]. i. The RTU fan flow rate was set equal to the design fan flow rate.
ii. Both compressors were engaged. iii. The RTU remained in Stage 2 cooling until the zone temperature was at
least 1°F below the cooling set point [Tzone ≤ (Tset,cool – 1°F)], at which point the RTU entered deadband mode.
iv. During unoccupied hours, the OA dampers were closed, unless the OA temperature was less than 65°F and greater than 50°F (50°F < TOA < 65°F), in which case the OA dampers were set to the minimum ventilation position.
c. During occupied hours, the OA dampers were modulated to supply minimum ventilation.
3.7.7.3 Variable-Speed Case For the variable-speed case, the fan flow rate was continuously varied, as opposed to being operated in discrete steps. Minimum flow rate was used when the zone was in deadband operation, meaning that its HVAC system was not heating, cooling, or economizing. The minimum flow rates for both model types are detailed in Section 3.7.6. During Stage 1 cooling, the fan flow rate was varied in order to hold the SAT at 55°F. Full flow rate was used when the RTU was in heating, economizing, or Stage 2 cooling mode. The control logic narrative for the variable-speed case follows.

18
1. Deadband a. During occupied hours, when the system was not in heating, economizing, or
cooling mode, deadband mode was active. i. The fan flow rate was set to minimum. If this flow rate proved
insufficient to maintain a SAT of at least 50°F, the RTU fan flow rate was varied between minimum and maximum flow to raise the SAT to 50°F.
ii. The OA dampers were modulated as appropriate to supply minimum ventilation.
iii. The heating and cooling coils were turned off. b. During unoccupied hours, when the system was not in heating, economizing, or
cooling mode, the RTU fan was turned off. 2. Heating
a. The heating coil was engaged when the zone temperature was below the heating set point [Tzone < Tset,heat].
i. The RTU fan flow rate was set equal to the design fan flow rate. ii. During occupied hours, the OA dampers were set to the minimum
ventilation position. iii. During unoccupied hours, the OA dampers were closed. iv. The RTU continued to heat the zone until the zone temperature was at
least 1°F above the heating set point [Tzone ≥ (Tset,heat + 1°F)]. 3. Economizing
a. If (1) the OA temperature was less than 65°F and greater than 50°F (50°F < TOA < 65°F), and (2) the zone temperature was above the cooling set point by no more than 1°F [Tset,cool < Tzone ≤ (Tset,cool + 1°F)], economizing was engaged.
i. The RTU fan flow rate was set equal to the design fan flow rate. ii. The OA dampers were set to 100% open.
iii. The cooling coils remained off. iv. The RTU operated in economizer mode until either:
1. The OA temperature was less than or equal to 50°F (TOA ≤ 50°F), at which point the RTU entered Stage 1 cooling mode.
2. The OA temperature was greater than or equal to 65°F (TOA ≥ 65°F), at which point the RTU entered Stage 1 cooling mode.
3. The zone temperature was at least 1°F below the cooling set point [Tzone ≤ (Tset,cool – 1°F)], at which point the RTU entered deadband mode.
4. The zone temperature was greater than 1°F above the cooling set point [Tzone > (Tset,cool + 1°F)], at which point the RTU entered Stage 2 cooling mode.
4. Cooling a. Stage 1 cooling was engaged when the zone temperature rose above the cooling
set point by no more than 1°F [Tset,cool < Tzone ≤ (Tset,cool + 1°F)] and the OA temperature was not between 50°F and 65°F (economizing condition).
i. The RTU fan flow rate was modulated between minimum and maximum flow, such that the SAT was equal to 55°F.
ii. The first compressor was engaged. iii. The RTU remained in Stage 1 cooling until either:

19
1. The zone temperature was at least 1°F below the cooling set point [Tzone ≤ (Tset,cool – 1°F)], at which point the RTU entered deadband mode.
2. The zone temperature was greater than 1°F above the cooling set point [Tzone > (Tset,cool + 1°F)], at which point the RTU entered Stage 2 cooling mode.
iv. During unoccupied hours, the OA dampers were closed. b. Stage 2 cooling was engaged when the zone temperature was greater than 1°F
above the cooling set point [Tzone > (Tset,cool + 1°F)]. i. The RTU fan flow rate was set equal to the design fan flow rate.
ii. Both compressors were engaged. iii. The RTU remained in Stage 2 cooling until the zone temperature was at
least 1°F below the cooling set point [Tzone ≤ (Tset,cool – 1°F)], at which point the RTU entered deadband mode.
iv. During unoccupied hours, the OA dampers were closed, unless the OA temperature was less than 65°F and greater than 50°F (50°F < TOA < 65°F), in which case the OA dampers were set to the minimum ventilation position.
c. During occupied hours, the OA dampers were modulated to supply minimum ventilation.

20
4.0 Results This section describes the simulation results3, including fan energy use, whole-building energy use, electricity consumption, natural gas consumption, utility cost savings, and observed relative humidity (RH) values.
4.1 Fan Energy Savings Table 4–1 and Table 4–2 detail the predicted fan energy savings by climate zone, using total fan energy use intensity (EUI) as the basis for the savings calculations. As expected, the stepped-speed cases show significant energy savings over the constant-speed cases; the variable-speed cases show even greater savings in all climates.
Baseline fan energy use is constant across climate zones, because the supply fans were hard-sized using a climate-independent methodology to represent typical RTU fan over sizing (see Section 3.7.4).
Table 4–1 Normalized Annual Fan Energy Consumption for Models With Refrigeration
Climate Zone Location
Constant-Speed Fan Stepped-Speed Fan Variable-Speed Fan Fan EUI (kBtu/ft2)
Fan EUI (kBtu/ft2)
Savings (%)
Fan EUI (kBtu/ft2)
Savings (%)
1A Miami, FL 9.0 6.4 28.9 5.0 44.3 2A Houston, TX 9.0 5.6 37.3 4.7 47.7 2B Phoenix, AZ 9.0 5.6 37.5 4.7 48.0 3A Atlanta, GA 9.0 5.0 44.4 4.2 53.1 3B Los Angeles, CA 9.0 4.6 49.0 4.1 54.6 3B Las Vegas, NV 9.0 5.3 41.4 4.5 50.4 3C San Francisco, CA 9.0 4.0 55.1 3.9 56.2 4A Baltimore, MD 9.0 4.9 45.7 4.3 51.9 4B Albuquerque, NM 9.0 4.8 46.6 4.2 53.7 4C Seattle, WA 9.0 4.2 52.9 4.1 54.5 5A Chicago, IL 9.0 4.8 46.6 4.3 51.9 5B Boulder, CO 9.0 4.6 48.3 4.2 52.7 6A Minneapolis, MN 9.0 4.9 44.9 4.5 49.9 6B Helena, MT 9.0 4.6 48.4 4.4 51.4 7 Duluth, MN 9.0 4.8 46.7 4.6 48.9 8 Fairbanks, AK 9.0 5.3 41.6 5.1 43.8
3 Note that additional differences between the models with and without refrigeration, such as zoning layout and the fan flow rate sizing methodology, affect the energy consumption and savings values. Readers should exercise caution when comparing results between model types.

21
Table 4–2 Normalized Annual Fan Energy Consumption for Models Without Refrigeration
Climate Zone Location
Constant-Speed Fan Stepped-Speed Fan Variable-Speed Fan
Fan EUI (kBtu/ft2)
Fan EUI (kBtu/ft2)
Savings (%)
Fan EUI (kBtu/ft2)
Savings (%)
1A Miami, FL 7.5 5.2 31.0 3.6 52.2 2A Houston, TX 7.5 4.1 44.6 3.0 59.7 2B Phoenix, AZ 7.5 4.1 45.6 3.1 58.8 3A Atlanta, GA 7.5 3.4 54.1 2.5 66.7 3B Los Angeles, CA 7.5 2.7 63.2 2.3 69.4 3B Las Vegas, NV 7.5 3.6 51.5 2.8 63.1 3C San Francisco, CA 7.5 1.9 74.3 1.9 75.0 4A Baltimore, MD 7.5 3.4 54.6 2.5 65.9 4B Albuquerque, NM 7.5 3.3 56.3 2.7 64.1 4C Seattle, WA 7.5 2.3 69.7 2.1 71.7 5A Chicago, IL 7.5 3.5 53.0 2.6 65.0 5B Boulder, CO 7.5 3.2 57.6 2.6 64.7 6A Minneapolis, MN 7.5 3.8 49.3 3.0 60.4 6B Helena, MT 7.5 3.2 56.7 2.7 63.7 7 Duluth, MN 7.5 3.7 51.2 3.0 59.9 8 Fairbanks, AK 7.5 4.2 44.5 3.7 50.7
4.2 Whole-Building Energy Savings Figure 4–1 through Figure 4–4 provide whole-building energy consumption comparisons for the stepped- and variable-speed cases, using total building EUI as the basis for the savings calculations. The figures also provide a breakdown of EUI by end use. Appendix B.1 includes tables detailing these data. Annual whole-building energy savings ranged from 0.7%–8.4% and were seen in all climate zones when switching to stepped- or variable-speed fan motor functionality.
Stepped- or variable-speed fan motor functionality decreased fan energy use in all climates, but also increased heating energy use. This outcome is attributed to the need to make up for beneficial fan heat that is no longer imparted to the supply airstream during the heating season. For the stepped- and variable-speed cases, the fans are operated at full flow rate during heating mode, so this heat is lost primarily when the systems are in deadband operation and the fans are operating at their minimum flow rate.
Cooling energy does not uniformly increase or decrease as a result of switching to stepped- or variable-speed fan motor functionality; however, there is a strong correlation between an increase in cooling energy and a decrease in average space RH (see Section 4.6). This is to be expected. As the cooling coil face velocity is decreased because of a reduction in flow rate during Stage 1 cooling for the stepped- and variable-speed cases, the cooling coils have more time to remove moisture from the airstream. This improvement in moisture removal effectiveness means more latent heat is removed from the airstream and subsequently more cooling energy is required to meet the zone temperature set point. For all locations, however, any increase in heating and cooling energy is always more than offset by the reduction in fan energy.

22
As shown in Table 4–3, whole-building energy savings vary from climate zone to climate zone when switching to stepped- or variable-speed fan motor functionality. Table 4–3 also shows that, when comparing the stepped- and the variable-speed cases, whole-building energy savings do not vary in a similar manner. For example, the whole-building energy savings observed in Seattle, WA, for the stepped- and variable speed models without refrigeration are almost identical, whereas there is a very large energy savings difference between these two models in Phoenix, AZ.
These trends are attributable to two factors: (1) climatic differences and (2) differences in the fan control logic implemented in each case. For example, in Seattle, WA, both models would be expected to operate in deadband or economizing mode the majority of the year. In deadband mode, the RTU supply fans operate at their minimum flow rates in both the stepped- and variable-speed cases. In economizing mode, the fans in both cases operate at their design flow rates. Because the fans in both models would be expected to operate in an identical manner for the majority of the year, the magnitude of the whole-building energy savings would be expected to be similar.
In contrast, for Phoenix, AZ, the models would likely spend much of their time in Stage 1 cooling. Because the fan flow rates are reduced in both the stepped- and variable-speed cases during Stage 1 cooling, energy savings would be expected in both cases. However, because the variable-speed control logic allows a greater possible reduction in fan flow rate, the whole-building energy savings for the variable-speed model would be expected to be greater than the savings for the stepped-speed model.
Examination of climate and associated impacts on RTU fan operation, as dictated by the case-specific control logic, can be used to explain the energy savings differences observed between the stepped- and variable-speed cases for the remaining climate zones.
Table 4–3 Annual Whole-Building Energy Savings for All Models (%)
Climate Zone Location
Models With Refrigeration Models Without Refrigeration
Stepped-Speed Variable-Speed Stepped-Speed Variable-Speed
1A Miami, FL 2.5 3.5 2.3 2.3 2A Houston, TX 3.2 4.0 3.6 3.6 2B Phoenix, AZ 3.5 4.7 4.1 5.2 3A Atlanta, GA 3.2 3.9 3.7 3.7 3B Los Angeles, CA 6.1 6.5 8.1 8.3 3B Las Vegas, NV 3.4 4.6 4.1 5.5 3C San Francisco, CA 5.8 5.9 8.3 8.4 4A Baltimore, MD 2.2 2.6 2.5 2.4 4B Albuquerque, NM 3.1 3.8 3.6 4.1 4C Seattle, WA 3.1 3.2 4.0 4.0 5A Chicago, IL 1.8 2.1 2.1 2.0 5B Boulder, CO 2.6 3.1 3.2 3.5 6A Minneapolis, MN 1.5 1.8 1.7 1.7 6B Helena, MT 1.8 2.1 2.3 2.4 7 Duluth, MN 1.1 1.2 1.4 1.3 8 Fairbanks, AK 0.7 0.7 0.9 0.9

23
Figure 4–1 Models with refrigeration: annual whole-building EUI by end use for stepped-speed cases
(Credit: Lesley Herrmann/NREL)
2.5%
3.2%
3.5%
3.2%
6.1%
3.4%
5.8%
2.2%
3.1%
3.1%
1.8%
2.6%
1.5%
1.8%
1.1%
0.7%
1A
2A
2B
3A
3B:CA
3B
3C
4A
4B
4C
5A
5B
6A
6B
7
8
0.0 20.0 40.0 60.0 80.0 100.0 120.0 140.0 160.0 180.0
BaselineSteppedBaselineSteppedBaselineSteppedBaselineSteppedBaselineSteppedBaselineSteppedBaselineSteppedBaselineSteppedBaselineSteppedBaselineSteppedBaselineSteppedBaselineSteppedBaselineSteppedBaselineSteppedBaselineSteppedBaselineStepped
Clim
ate Zone
Annual Energy End Use Intensity (kBtu/ft2)
Cas
e
Int Equip (elec) Int Light (elec) Ext Light (elec) Refrig (elec) Cooling (elec) Heating (gas) Fans (elec) Savings

24
Figure 4–2 Models with refrigeration: annual whole-building EUI by end use for variable-speed cases
(Credit: Lesley Herrmann/NREL)
3.5%
4.0%
4.7%
3.9%
6.5%
4.6%
5.9%
2.6%
3.8%
3.2%
2.1%
3.1%
1.8%
2.1%
1.2%
0.7%
1A
2A
2B
3A
3B:CA
3B
3C
4A
4B
4C
5A
5B
6A
6B
7
8
0.0 20.0 40.0 60.0 80.0 100.0 120.0 140.0 160.0 180.0
BaselineVariableBaselineVariableBaselineVariableBaselineVariableBaselineVariableBaselineVariableBaselineVariableBaselineVariableBaselineVariableBaselineVariableBaselineVariableBaselineVariableBaselineVariableBaselineVariableBaselineVariableBaselineVariable
Clim
ate Zone
Annual Energy End Use Intensity (kBtu/ft2)
Cas
e
Int Equip (elec) Int Light (elec) Ext Light (elec) Refrig (elec) Cooling (elec) Heating (gas) Fans (elec) Savings

25
Figure 4–3 Models without refrigeration: annual whole-building EUI by end use for stepped-speed cases
(Credit: Lesley Herrmann/NREL)
2.3%
3.6%
4.1%
3.7%
8.1%
4.1%
8.3%
2.5%
3.6%
4.0%
2.1%
3.2%
1.7%
2.3%
1.4%
0.9%
1A
2A
2B
3A
3B:CA
3B
3C
4A
4B
4C
5A
5B
6A
6B
7
8
0.0 20.0 40.0 60.0 80.0 100.0 120.0 140.0 160.0 180.0
BaselineSteppedBaselineSteppedBaselineSteppedBaselineSteppedBaselineSteppedBaselineSteppedBaselineSteppedBaselineSteppedBaselineSteppedBaselineSteppedBaselineSteppedBaselineSteppedBaselineSteppedBaselineSteppedBaselineSteppedBaselineStepped
Clim
ate Zone
Annual Energy End Use Intensity (kBtu/ft2)
Cas
e
Int Equip (elec) Int Light (elec) Ext Light (elec) Cooling (elec) Heating (gas) Fans (elec) Savings

26
Figure 4–4 Models without refrigeration: annual whole-building EUI by end use for variable-speed cases
(Credit: Lesley Herrmann/NREL)
2.3%
3.6%
5.2%
3.7%
8.3%
5.5%
8.4%
2.4%
4.1%
4.0%
2.0%
3.5%
1.7%
2.4%
1.3%
0.9%
1A
2A
2B
3A
3B:CA
3B
3C
4A
4B
4C
5A
5B
6A
6B
7
8
0.0 20.0 40.0 60.0 80.0 100.0 120.0 140.0 160.0 180.0
BaselineVariableBaselineVariableBaselineVariableBaselineVariableBaselineVariableBaselineVariableBaselineVariableBaselineVariableBaselineVariableBaselineVariableBaselineVariableBaselineVariableBaselineVariableBaselineVariableBaselineVariableBaselineVariable
Clim
ate Zone
Annual Energy End Use Intensity (kBtu/ft2)
Cas
e
Int Equip (elec) Int Light (elec) Ext Light (elec) Cooling (elec) Heating (gas) Fans (elec) Savings

27
4.3 Electricity Consumption Savings Table 4–4 and Table 4–5 detail annual whole-building electricity consumption, normalized by floor area, for all models. The stepped- and variable-speed cases show less electricity consumption than do the constant-speed fan motor cases; the variable-speed cases outperform the stepped-speed cases in every location.
The electricity savings presented in Table 4–4 and Table 4–5 appear to be small when normalized by area, but whole-building electricity savings may be substantial given the size of commercial buildings. Annual electricity savings can be estimated for a specific building by multiplying the normalized electricity savings by the building floor area. Annual electricity savings of up to 200,000 kWh are predicted for the models used in this study.
Sector-wide savings potential can be approximated by averaging the savings estimates from the 16 locations. For stepped-speed retrofits, the average savings was 1.17 kWh/ft2; for variable-speed retrofits, it was 1.23 kWh/ft2. If these savings were realized across 10% of the 2.7 billion ft2 of retail space served by packaged RTUs (EIA 2008), retailers would save 316–332 GWh/yr (1.08–1.13 × 10¹² Btu/yr).
Table 4–4 Normalized Annual Whole-Building Electricity Consumption for Models With Refrigeration
Climate Zone Location
Constant-Speed Fan Stepped-Speed Fan Variable-Speed Fan
Use (kWh/ft2)
Use (kWh/ft2)
Savings (kWh/ft2)
Use (kWh/ft2)
Savings (kWh/ft2)
1A Miami, FL 26.51 25.85 0.66 25.57 0.94 2A Houston, TX 24.28 23.33 0.95 23.15 1.13 2B Phoenix, AZ 24.62 23.62 1.00 23.32 1.30 3A Atlanta, GA 21.96 20.82 1.14 20.66 1.30 3B Los Angeles, CA 20.55 19.24 1.31 19.15 1.40 3B Las Vegas, NV 23.08 21.97 1.11 21.69 1.39 3C San Francisco, CA 19.35 17.87 1.47 17.85 1.50 4A Baltimore, MD 21.10 19.90 1.19 19.79 1.31 4B Albuquerque, NM 20.86 19.62 1.24 19.43 1.43 4C Seattle, WA 19.35 17.94 1.41 17.91 1.44 5A Chicago, IL 20.38 19.16 1.22 19.06 1.32 5B Boulder, CO 19.98 18.67 1.30 18.55 1.42 6A Minneapolis, MN 20.13 18.95 1.18 18.85 1.28 6B Helena, MT 19.41 18.11 1.30 18.03 1.39 7 Duluth, MN 19.12 17.88 1.24 17.84 1.29 8 Fairbanks, AK 18.73 17.61 1.12 17.55 1.18

28
Table 4–5 Normalized Annual Whole-Building Electricity Consumption for Models Without Refrigeration
Climate Zone Location
Constant-Speed Fan Stepped-Speed Fan Variable-Speed Fan
Use (kWh/ft2)
Use (kWh/ft2)
Savings (kWh/ft2)
Use (kWh/ft2)
Savings (kWh/ft2)
1A Miami, FL 21.95 21.45 0.50 21.44 0.51 2A Houston, TX 19.83 18.94 0.89 18.93 0.91 2B Phoenix, AZ 20.49 19.51 0.98 19.28 1.22 3A Atlanta, GA 17.65 16.53 1.11 16.51 1.13 3B Los Angeles, CA 16.13 14.74 1.38 14.72 1.41 3B Las Vegas, NV 19.16 18.03 1.13 17.75 1.41 3C San Francisco, CA 15.09 13.43 1.66 13.42 1.67 4A Baltimore, MD 16.95 15.79 1.16 15.71 1.24 4B Albuquerque, NM 16.91 15.68 1.23 15.51 1.40 4C Seattle, WA 15.23 13.68 1.55 13.66 1.57 5A Chicago, IL 16.31 15.18 1.14 15.04 1.27 5B Boulder, CO 16.08 14.79 1.29 14.64 1.44 6A Minneapolis, MN 16.11 15.05 1.06 14.91 1.20 6B Helena, MT 15.57 14.30 1.27 14.15 1.43 7 Duluth, MN 15.23 14.10 1.13 13.95 1.29 8 Fairbanks, AK 14.98 13.97 1.00 13.84 1.14
4.4 Natural Gas Consumption Savings Table 4–6 and Table 4–7 detail whole-building natural gas consumption, normalized by floor area, for all models. Negative values indicate an increase in natural gas use. Because of the decrease in fan energy in the stepped- and variable-speed cases, the heating energy requirement increased, leading to an increase in natural gas use in all models.
Annual natural gas savings can be estimated for a specific building by multiplying the normalized natural gas savings contained in Table 4–6 and Table 4–7 by the building floor area. We performed this calculation and predict that the worst-case increase in natural gas use would be 3,900 therm/yr for the models used in this study.
On average, annual natural gas use increased by 0.0149 therm/ft2 for the stepped-speed cases and by 0.0162 therm/ft2 for the variable-speed cases. If these savings were realized across 10% of the 2.7 billion ft2 of retail space served by packaged RTUs (EIA 2008), retailers would increase natural gas use by 4.0–4.4 million therm/yr (4.02–4.34 × 10¹¹ Btu/yr).

29
Table 4–6 Normalized Annual Whole-Building Natural Gas Consumption* for Models With Refrigeration
Climate Zone Location
Constant-Speed Fan Stepped-Speed Fan Variable-Speed Fan Use
(therm/ft2) Use
(therm/ft2) Savings
(therm/ft2) Use
(therm/ft2) Savings
(therm/ft2) 1A Miami, FL 0.000 0.000 0.000 0.000 0.000 2A Houston, TX 0.030 0.034 –0.005 0.034 –0.005 2B Phoenix, AZ 0.018 0.022 –0.004 0.022 –0.004 3A Atlanta, GA 0.094 0.105 –0.012 0.105 –0.012 3B Los Angeles, CA 0.005 0.006 –0.002 0.006 –0.002 3B Las Vegas, NV 0.046 0.055 –0.009 0.055 –0.009 3C San Francisco, CA 0.040 0.049 –0.009 0.049 –0.010 4A Baltimore, MD 0.222 0.241 –0.020 0.242 –0.020 4B Albuquerque, NM 0.128 0.145 –0.017 0.145 –0.017 4C Seattle, WA 0.161 0.184 –0.023 0.184 –0.023 5A Chicago, IL 0.331 0.355 –0.023 0.355 –0.024 5B Boulder, CO 0.213 0.234 –0.021 0.234 –0.021 6A Minneapolis, MN 0.473 0.496 –0.023 0.496 –0.023 6B Helena, MT 0.361 0.387 –0.026 0.388 –0.026 7 Duluth, MN 0.591 0.620 –0.029 0.621 –0.029 8 Fairbanks, AK 1.017 1.043 –0.026 1.045 –0.028
*Negative values indicate that natural gas use increased.
Table 4–7 Normalized Annual Whole-Building Natural Gas Consumption* for Models Without Refrigeration
Climate Zone Location
Constant-Speed Fan Stepped-Speed Fan Variable-Speed Fan Use
(therm/ft2) Use
(therm/ft2) Savings
(therm/ft2) Use
(therm/ft2) Savings
(therm/ft2) 1A Miami, FL 0.000 0.000 0.000 0.000 0.000 2A Houston, TX 0.031 0.036 -0.005 0.037 -0.005 2B Phoenix, AZ 0.018 0.022 -0.005 0.022 -0.005 3A Atlanta, GA 0.097 0.109 -0.012 0.110 -0.013 3B Los Angeles, CA 0.006 0.007 -0.002 0.007 -0.002 3B Las Vegas, NV 0.045 0.055 -0.010 0.055 -0.010 3C San Francisco, CA 0.041 0.052 -0.011 0.052 -0.011 4A Baltimore, MD 0.229 0.249 -0.020 0.252 -0.023 4B Albuquerque, NM 0.130 0.147 -0.017 0.149 -0.019 4C Seattle, WA 0.167 0.193 -0.025 0.193 -0.026 5A Chicago, IL 0.344 0.364 -0.020 0.369 -0.025 5B Boulder, CO 0.218 0.237 -0.019 0.240 -0.023 6A Minneapolis, MN 0.491 0.509 -0.018 0.514 -0.023 6B Helena, MT 0.373 0.396 -0.023 0.400 -0.027 7 Duluth, MN 0.614 0.637 -0.023 0.643 -0.029 8 Fairbanks, AK 1.056 1.077 -0.021 1.081 -0.025
*Negative values indicate that natural gas use increased.
4.5 Utility Cost Savings The energy savings values presented here depend on a number of assumptions, including the cooling coil and fan flow rate sizing methodology, sequence of operations, space set points, and

30
hours of operation. In order to provide broadly applicable findings, values were used that reflect common practice.
Appendix C provides instructions about how to use the results of this study to estimate high-level utility cost savings. A retailer can use such results to justify site-specific assessments of retrofit feasibility and determine if a compelling business case can be made.
Assuming typical utility rates of $0.10/kWh and $1.00/therm, if average savings were realized across 10% of the 2.7 billion ft2 of retail space served by packaged RTUs (EIA 2008), retailers would save $27.6 million annually with stepped-speed retrofits, or $28.8 million with variable-speed retrofits.
4.6 Relative Humidity Table 4–8 and Table 4–9 detail the 95th percentile RH values for all models. These values were chosen to exclude extreme outliers, but still provide an understanding of space maximum RH. RH values are reported for the “grocery” zone for the models with refrigeration and for the “sales 1” zone for the models without refrigeration, as these represented the critical zones for each building type.
Active zone RH control was outside the scope of this study, and the lack of such control explains the high RH values observed in most models, particularly those seen in the humid “A” climate subzones. The models captured the effect on space RH caused by moisture condensing on the cooling coil surface as the coil met the zone sensible load. The models did not, however, account for the re-entrainment of moisture into the airstream, which would have occurred in practice when the cooling coil was shut off and condensation on the cooling coil evaporated back into the airstream. Thus, the negative impact on space RH caused by frequent cooling coil cycling (and conversely, the RH benefit of switching to stepped- or variable-speed fan motor functionality) was not fully captured. Therefore, RH improvements observed in most climate zones would likely be even greater in practice.
The reported RH values for the stepped- and variable-speed cases increase minimally in climate zones 3C and 8. These increases are negligible and are due to very slight differences in the zone dry-bulb temperatures between cases.

31
Table 4–8 Models With Refrigeration: 95th Percentile RH Values
Climate Zone Location
Constant-Speed Fan RH (%)
Stepped-Speed Fan RH (%)
Variable-Speed Fan RH (%)
1A Miami, FL 72.5 71.9 70.2 2A Houston, TX 71.8 71.2 69.9 2B Phoenix, AZ 56.2 55.5 53.8 3A Atlanta, GA 66.7 66.2 64.5 3B Los Angeles, CA 59.2 58.9 58.0 3B Las Vegas, NV 42.2 42.0 42.0 3C San Francisco, CA 49.4 49.6 49.5 4A Baltimore, MD 67.8 67.3 65.6 4B Albuquerque, NM 48.3 47.9 46.7 4C Seattle, WA 50.8 50.9 50.3 5A Chicago, IL 63.1 62.7 61.1 5B Boulder, CO 46.8 46.5 45.8 6A Minneapolis, MN 63.0 62.7 61.0 6B Helena, MT 40.1 40.1 40.1 7 Duluth, MN 56.9 56.5 55.8 8 Fairbanks, AK 45.5 45.8 45.8
Table 4–9 Models Without Refrigeration: 95th Percentile RH Values
Climate Zone Location
Constant-Speed Fan RH (%)
Stepped-Speed Fan RH (%)
Variable-Speed Fan RH (%)
1A Miami, FL 73.2 72.4 69.5 2A Houston, TX 72.9 72.4 69.7 2B Phoenix, AZ 56.3 55.4 53.1 3A Atlanta, GA 69.2 68.0 63.7 3B Los Angeles, CA 63.2 62.6 60.7 3B Las Vegas, NV 45.8 45.7 45.3 3C San Francisco, CA 54.2 54.5 54.2 4A Baltimore, MD 70.1 69.2 65.5 4B Albuquerque, NM 51.7 51.0 49.7 4C Seattle, WA 55.6 55.5 54.8 5A Chicago, IL 66.4 65.5 61.3 5B Boulder, CO 49.8 49.3 48.7 6A Minneapolis, MN 67.1 65.9 62.0 6B Helena, MT 44.3 44.2 44.2 7 Duluth, MN 62.1 61.7 59.0 8 Fairbanks, AK 50.2 50.4 50.3

32
5.0 Conclusions Our simulations showed annual whole-building and electric energy savings in all climate zones when constant-speed RTU fan motors were upgraded with stepped- or variable-speed functionality. Whole-building energy savings ranged from 0.7%–8.4%.
Normalized electricity savings ranged from 0.50–1.67 kWh/ft2 (1.70–5.70 kBtu/ft2). Average annual electricity savings across all locations were 1.17 kWh/ft2 (3.98 kBtu/ft2) for the stepped-speed cases and 1.23 kWh/ft2 (4.40 kBtu/ft2) for the variable-speed cases. The results suggest that for certain building types, annual whole-building electricity savings of 200,000 kWh may be realized.
Heating energy increased in all climates, because less fan energy was imparted to the supply airstream during the heating season. On average, this increase was 0.0149 therm/ft2 for the stepped-speed cases and 0.0162 therm/ft2 for the variable-speed cases. (This increase was always more than offset by the electricity use reduction.)
Based on the average energy savings, if variable-speed retrofits were implemented across 10% of the 2.7 billion ft2 of retail space served by packaged RTUs (EIA 2008), retailers would save approximately 332 GWh/yr (1.13 × 10¹² Btu/yr) of electricity and increase natural gas use by 4.4 million therm/yr (4.34 × 10¹¹ Btu/yr). Assuming typical utility rates of $0.10/kWh and $1.00/therm, this would equate to annual utility cost savings of $28.8 million.
This measure requires that a relatively small number of RTU fan motors be upgraded per building. Therefore, this report makes a case that such retrofits should be investigated in all climate zones to address the oftentimes dispersed energy loads in commercial buildings.

33
6.0 Next Steps The energy savings values presented here depend on a number of assumptions, including the cooling coil and fan flow rate sizing methodology, sequence of operations, space set points, and hours of operation. In order to provide broadly applicable findings, values were used that reflect common practice.
Appendix C provides instructions about how to use the results of this study to estimate high-level utility cost savings. A retailer can use such results to justify site-specific assessments of retrofit feasibility and determine if a compelling business case can be made.
Indirect benefits may be sufficient to motivate retailers to pursue constant-speed RTU fan motor retrofits, especially for those who own or operate buildings in humid regions. Because moisture problems are largely attributed to short-cycling of oversized HVAC equipment, future work could focus on enhancing the EnergyPlus whole-building energy models to predict the effects of stepped- and variable-speed fan motor retrofits on moisture re-entrainment. For a retail building with moisture control issues, such modeling could yield recommendations about whether fan motor retrofits would significantly improve moisture control. Simulation would enable this analysis to span a range of climates and building types.
Physical testing could also improve the assessment of associated benefits. Whereas simulation can examine retrofit impacts over a wide range of conditions, carefully designed experimental testing could uncover important real-world considerations. Testing results could also be used to validate and improve the numerical models used for this study. By retrofitting a constant-speed RTU with variable-speed functionality, stepped- and variable-speed performance could be determined empirically to complement or refine this analysis. Using such techniques to capture moisture control advantages, component-specific impacts, and other drivers may accelerate large-scale retailer investment in energy-saving RTU fan motor retrofits.
The development of an application guide to help retailers effectively execute stepped- and variable-speed RTU fan motor retrofits would also help to accelerate adoption of this technology. Ideally, such a guide would provide high-level implementation advice and be paired with manufacturer-created retrofit packages that would facilitate retrofit installation while maintaining the original equipment warranty. The development of such a solution would require involvement from RTU manufacturers, private sector retailers, and research and development organizations. While the level of collaboration required to successfully execute these tasks is significant, the potential benefits associated with this kind of a documentation/product solution pair warrant a closer examination of this path.

34
7.0 References ASHRAE. (2004a). ANSI/ASHRAE/IESNA Standard 90.1-2004 Energy Standard for Buildings Except Low-Rise Residential Buildings. Atlanta, GA: American Society of Heating, Refrigerating and Air-Conditioning Engineers, Inc.
ASHRAE. (2004b). ASHRAE Standard 62.1-2004 Ventilation for Acceptable Indoor Air Quality. Atlanta, GA: American Society of Heating, Refrigerating and Air-Conditioning Engineers, Inc.
ASHRAE. (2009). 2009 ASHRAE Handbook—Fundamentals. Atlanta, GA: American Society of Heating, Refrigerating and Air-Conditioning Engineers, Inc.
Briggs, R.S.; Lucas, R.G.; Taylor, Z.T. (2003). Climate Classification for Building Energy Codes and Standards: Part 1- Development Process. Richland, WA.
Deru, M.; Field, K.; Studer, D.; Benne, K.; Griffith, B.; Torcellini, P.; Liu, B.; Halverson, M.; Winiarski, D.; Rosenberg, M.; Yazdanian, M.; Huang, J.; Crawley, D. (2011). U.S. Department of Energy Commercial Reference Building Models of the National Building Stock. Golden, CO: National Renewable Energy Laboratory. NREL/TP-5500-46861.
DOE (2005). Map of DOE’s Proposed Climate Zones. Available at www.energycodes.gov/ implement/pdfs/color_map_climate_zones_Mar03. Last accessed July 2010.
DOE (2010). EnergyPlus Energy Simulation Software, Version 6.0. www.eere.energy.gov/buildings/energyplus/. Washington, D.C.: U.S. Department of Energy.
EIA. (2008). 2003 Commercial Buildings Energy Consumption Survey Table B41. Washington, DC: Energy Information Administration. Available at www.eia.gov/emeu/cbecs/ cbecs2003/detailed_tables_2003/detailed_tables_2003.html. Last accessed September 2011.
Felts, Don R., Bailey, Patrick. (2000). The State of Affairs – Packaged Cooling Equipment in California. 2000 American Council for an Energy Efficient Economy Summer Study on Energy Efficiency in Buildings. Available at http://eec.ucdavis.edu/ACEEE/2000/PDFS/ PANEL03/233.pdf. Last accessed November 15, 2011.
Hale, E.; Leach, M.; Hirsch, A.; Torcellini, P. (2009). General Merchandise 50% Energy Savings: Technical Support Document. Golden, CO, National Renewable Energy Laboratory. NREL/TP-550-46100.
Kozubal, E.; Doebber, I.; Deru, M.; Page, J. (2010). Performance Mapping of Commercial Rooftop Units. Presentation given at the ASHRAE Winter Conference, January 24, 2010, Orlando, FL.
Yuill, G.K. (1996). Impact of High Use Automatic Doors on Infiltration. Project 763-TRP. Atlanta, GA: American Society of Heating, Refrigerating and Air-Conditioning Engineers, Inc.

35
Appendix A Schedules A.1 Occupancy, Lighting, and Equipment Schedules Occupancy, lighting, and equipment schedules are presented in Table A–1 and Figure A–1.
Table A–1 Occupancy, Lighting, and Equipment Schedules
Hour Occupancy
(Percent of Peak) Lighting
(Percent of Peak) Plug Loads
(Percent of Peak) 1 0 5 40 2 0 5 40 3 0 5 40 4 0 5 40 5 0 5 40 6 0 5 40 7 0 5 40 8 30 25 95 9 50 100 95
10 70 100 95 11 90 100 95 12 90 100 95 13 90 100 95 14 70 100 95 15 70 100 95 16 70 100 95 17 90 100 95 18 90 100 95 19 70 100 95 20 70 100 95 21 50 100 95 22 50 100 95 23 30 100 95 24 0 25 40

36
Figure A–1 Occupancy, lighting, and equipment schedules
(Credit: Rachel Romero/NREL)
A.2 Heating and Cooling Set Point Schedules Figure A–2 and Table A–2 detail the heating and cooling set point values for each hour of the day. Set point temperatures during occupied hours were 68°F (heating) and 74°F (cooling). During unoccupied hours, the set point temperatures were 59°F (heating) and 81°F (cooling). These set point schedules were applied seven days per week, year-round.
Figure A–2 Heating and cooling set points
(Credit: Rachel Romero/NREL)
0%
20%
40%
60%
80%
100%
0 2 4 6 8 10 12 14 16 18 20 22 24
Perc
ent o
f Pea
k Va
lue
Hour
Occupancy
Lighting
Equipment
5055606570758085
0 2 4 6 8 10 12 14 16 18 20 22 24
Tem
pera
ture
(°F)
Hour
Heating
Cooling

37
Table A–2 Heating and Cooling Set Points
Hour Heating
(°F) Heating
(°C) Cooling
(°F) Cooling
(°C) 1 59.0 15.0 81.0 27.2 2 59.0 15.0 81.0 27.2 3 59.0 15.0 81.0 27.2 4 59.0 15.0 81.0 27.2 5 59.0 15.0 81.0 27.2 6 59.0 15.0 81.0 27.2 7 59.0 15.0 81.0 27.2 8 68.0 20.0 74.0 23.3 9 68.0 20.0 74.0 23.3
10 68.0 20.0 74.0 23.3 11 68.0 20.0 74.0 23.3 12 68.0 20.0 74.0 23.3 13 68.0 20.0 74.0 23.3 14 68.0 20.0 74.0 23.3 15 68.0 20.0 74.0 23.3 16 68.0 20.0 74.0 23.3 17 68.0 20.0 74.0 23.3 18 68.0 20.0 74.0 23.3 19 68.0 20.0 74.0 23.3 20 68.0 20.0 74.0 23.3 21 68.0 20.0 74.0 23.3 22 68.0 20.0 74.0 23.3 23 59.0 15.0 81.0 27.2 24 59.0 15.0 81.0 27.2

38
Appendix B Additional Results Tables B.1 Detailed Whole-Building Results
Table B–1 Energy End Use Breakdown for Models With Refrigeration – IP Units
Climate Zone Location Model
Gas (kBtu/ft2∙yr) Electricity (kBtu/ft2∙yr)
Total (kBtu/ft2∙yr)
Savings (%) Heating Cooling Fans
Interior Lights
Exterior Lights Equipment Refrigeration
1A Miami, FL
Constant 0.0 23.7 9.0 30.2 0.1 14.9 12.6 90.5 – Stepped 0.0 24.0 6.4 30.2 0.1 14.9 12.6 88.2 2.5 Variable 0.0 24.5 5.0 30.2 0.1 14.9 12.6 87.3 3.5
2A Houston, TX
Constant 3.0 16.8 9.0 30.2 0.1 14.9 11.9 85.8 – Stepped 3.4 16.9 5.6 30.2 0.1 14.9 11.9 83.1 3.2 Variable 3.4 17.2 4.7 30.2 0.1 14.9 11.9 82.4 4.0
2B Phoenix, AZ
Constant 1.8 18.9 9.0 30.2 0.1 14.9 10.9 85.8 – Stepped 2.2 18.9 5.6 30.2 0.1 14.9 10.9 82.7 3.5 Variable 2.2 18.8 4.7 30.2 0.1 14.9 10.9 81.7 4.7
3A Atlanta, GA
Constant 9.4 9.8 9.0 30.2 0.1 14.9 11.0 84.3 – Stepped 10.5 9.9 5.0 30.2 0.1 14.9 11.0 81.6 3.2 Variable 10.5 10.2 4.2 30.2 0.1 14.9 10.9 81.0 3.9
3B Los Angeles, CA
Constant 0.5 4.8 9.0 30.2 0.1 14.9 11.1 70.6 – Stepped 0.6 4.8 4.6 30.2 0.1 14.9 11.1 66.3 6.1 Variable 0.6 5.0 4.1 30.2 0.1 14.9 11.1 66.0 6.5
3B Las Vegas, NV
Constant 4.6 14.5 9.0 30.2 0.1 14.9 10.1 83.3 – Stepped 5.5 14.5 5.3 30.2 0.1 14.9 10.1 80.5 3.4 Variable 5.5 14.3 4.5 30.2 0.1 14.9 10.1 79.5 4.6
3C San Francisco, CA
Constant 4.0 1.5 9.0 30.2 0.1 14.9 10.4 70.0 – Stepped 4.9 1.4 4.0 30.2 0.1 14.9 10.4 65.9 5.8 Variable 4.9 1.4 3.9 30.2 0.1 14.9 10.4 65.8 5.9
4A Baltimore, MD
Constant 22.2 7.5 9.0 30.2 0.1 14.9 10.4 94.2 – Stepped 24.1 7.5 4.9 30.2 0.1 14.9 10.4 92.1 2.2 Variable 24.2 7.7 4.3 30.2 0.1 14.9 10.4 91.7 2.6

39
Table B–1 Energy End Use Breakdown for Models With Refrigeration – IP Units (Continued)
Climate Zone Location Model
Gas (kBtu/ft2∙yr) Electricity (kBtu/ft2∙yr)
Total (kBtu/ft2∙yr)
Savings (%) Heating Cooling Fans
Interior Lights
Exterior Lights Equipment Refrigeration
4B Albuquerque, NM
Constant 12.8 7.3 9.0 30.2 0.1 14.9 9.7 84.0 – Stepped 14.5 7.3 4.8 30.2 0.1 14.9 9.7 81.4 3.1 Variable 14.5 7.3 4.2 30.2 0.1 14.9 9.7 80.8 3.8
4C Seattle, WA
Constant 16.1 1.9 9.0 30.2 0.1 14.9 10.0 82.1 – Stepped 18.4 1.8 4.2 30.2 0.1 14.9 10.0 79.6 3.1 Variable 18.4 1.9 4.1 30.2 0.1 14.9 10.0 79.5 3.2
5A Chicago, IL
Constant 33.1 5.4 9.0 30.2 0.1 14.9 10.0 102.7 – Stepped 35.5 5.4 4.8 30.2 0.1 14.9 10.0 100.8 1.8 Variable 35.5 5.5 4.3 30.2 0.1 14.9 10.0 100.5 2.1
5B Boulder, CO
Constant 21.3 4.6 9.0 30.2 0.1 14.9 9.4 89.5 – Stepped 23.4 4.5 4.6 30.2 0.1 14.9 9.4 87.2 2.6 Variable 23.4 4.5 4.2 30.2 0.1 14.9 9.4 86.7 3.1
6A Minneapolis, MN
Constant 47.3 4.7 9.0 30.2 0.1 14.9 9.9 116.0 – Stepped 49.6 4.7 4.9 30.2 0.1 14.9 9.9 114.2 1.5 Variable 49.6 4.8 4.5 30.2 0.1 14.9 9.9 113.9 1.8
6B Helena, MT
Constant 36.1 2.9 9.0 30.2 0.1 14.9 9.2 102.4 – Stepped 38.7 2.8 4.6 30.2 0.1 14.9 9.2 100.5 1.8 Variable 38.8 2.8 4.4 30.2 0.1 14.9 9.2 100.3 2.1
7A Duluth, MN
Constant 59.1 1.8 9.0 30.2 0.1 14.9 9.3 124.4 – Stepped 62.0 1.7 4.8 30.2 0.1 14.9 9.3 123.0 1.1 Variable 62.1 1.8 4.6 30.2 0.1 14.9 9.3 122.9 1.2
8A Fairbanks, AK
Constant 101.7 0.8 9.0 30.2 0.1 14.9 8.9 165.6 – Stepped 104.3 0.8 5.3 30.2 0.1 14.9 8.9 164.4 0.7 Variable 104.5 0.8 5.1 30.2 0.1 14.9 8.9 164.4 0.7

40
Table B–2 Energy End Use Breakdown for Models Without Refrigeration – IP Units
Climate Zone Location Model
Gas (kBtu/ft2∙yr) Electricity (kBtu/ft2∙yr)
Total (kBtu/ft2∙yr)
Savings (%) Heating Cooling Fans
Interior Lights
Exterior Lights Equipment
1A Miami, FL
Constant 0.0 24.5 7.5 30.0 0.2 12.8 74.9 – Stepped 0.0 25.1 5.2 30.0 0.2 12.8 73.2 2.3 Variable 0.0 26.6 3.6 30.0 0.2 12.8 73.2 2.3
2A Houston, TX
Constant 3.1 17.3 7.5 30.0 0.2 12.8 70.8 – Stepped 3.6 17.5 4.1 30.0 0.2 12.8 68.2 3.6 Variable 3.7 18.6 3.0 30.0 0.2 12.8 68.3 3.6
2B Phoenix, AZ
Constant 1.8 19.5 7.5 30.0 0.2 12.8 71.7 – Stepped 2.2 19.6 4.1 30.0 0.2 12.8 68.8 4.1 Variable 2.2 19.8 3.1 30.0 0.2 12.8 68.0 5.2
3A Atlanta, GA
Constant 9.7 9.8 7.5 30.0 0.2 12.8 69.9 – Stepped 10.9 10.0 3.4 30.0 0.2 12.8 67.3 3.7 Variable 11.0 10.9 2.5 30.0 0.2 12.8 67.3 3.7
3B Los Angeles, CA
Constant 0.6 4.6 7.5 30.0 0.2 12.8 55.6 – Stepped 0.7 4.6 2.7 30.0 0.2 12.8 51.1 8.1 Variable 0.7 5.0 2.3 30.0 0.2 12.8 51.0 8.3
3B Las Vegas, NV
Constant 4.5 14.9 7.5 30.0 0.2 12.8 69.9 – Stepped 5.5 14.9 3.6 30.0 0.2 12.8 67.1 4.1 Variable 5.5 14.8 2.8 30.0 0.2 12.8 66.1 5.5
3C San Francisco, CA
Constant 4.1 1.1 7.5 30.0 0.2 12.8 55.6 – Stepped 5.2 0.9 1.9 30.0 0.2 12.8 51.0 8.3 Variable 5.2 1.0 1.9 30.0 0.2 12.8 51.0 8.4
4A Baltimore, MD
Constant 22.9 7.4 7.5 30.0 0.2 12.8 80.7 – Stepped 24.9 7.5 3.4 30.0 0.2 12.8 78.8 2.5 Variable 25.2 8.1 2.5 30.0 0.2 12.8 78.8 2.4

41
Table B–2 Energy End Use Breakdown for Models Without Refrigeration – IP Units (Continued)
Climate Zone Location Model
Gas (kBtu/ft2·yr) Electricity (kBtu/ft2·yr)
Total (kBtu/ft2·yr)
Savings (%) Heating Cooling Fans
Interior Lights
Exterior Lights Equipment
4B Albuquerque, NM
Constant 13.0 7.3 7.5 30.0 0.2 12.8 70.7 – Stepped 14.7 7.3 3.3 30.0 0.2 12.8 68.1 3.6 Variable 14.9 7.3 2.7 30.0 0.2 12.8 67.8 4.1
4C Seattle, WA
Constant 16.7 1.5 7.5 30.0 0.2 12.8 68.7 – Stepped 19.3 1.5 2.3 30.0 0.2 12.8 66.0 4.0 Variable 19.3 1.5 2.1 30.0 0.2 12.8 65.9 4.0
5A Chicago, IL
Constant 34.4 5.2 7.5 30.0 0.2 12.8 90.0 – Stepped 36.4 5.3 3.5 30.0 0.2 12.8 88.2 2.1 Variable 36.9 5.7 2.6 30.0 0.2 12.8 88.2 2.0
5B Boulder, CO
Constant 21.8 4.4 7.5 30.0 0.2 12.8 76.6 – Stepped 23.7 4.3 3.2 30.0 0.2 12.8 74.2 3.2 Variable 24.0 4.3 2.6 30.0 0.2 12.8 74.0 3.5
6A Minneapolis, MN
Constant 49.1 4.5 7.5 30.0 0.2 12.8 104.0 – Stepped 50.9 4.6 3.8 30.0 0.2 12.8 102.2 1.7 Variable 51.4 5.0 3.0 30.0 0.2 12.8 102.3 1.7
6B Helena, MT
Constant 37.3 2.7 7.5 30.0 0.2 12.8 90.4 – Stepped 39.6 2.6 3.2 30.0 0.2 12.8 88.4 2.3 Variable 40.0 2.6 2.7 30.0 0.2 12.8 88.3 2.4
7A Duluth, MN
Constant 61.4 1.5 7.5 30.0 0.2 12.8 113.4 – Stepped 63.7 1.5 3.7 30.0 0.2 12.8 111.8 1.4 Variable 64.3 1.6 3.0 30.0 0.2 12.8 111.8 1.3
8A Fairbanks, AK
Constant 105.6 0.6 7.5 30.0 0.2 12.8 156.7 – Stepped 107.7 0.5 4.2 30.0 0.2 12.8 155.3 0.9 Variable 108.1 0.6 3.7 30.0 0.2 12.8 155.3 0.9

42
Table B–3 Energy End Use Breakdown for Models With Refrigeration – SI Units
Climate Zone Location Model
Gas (MJ/m2∙yr) Electricity (MJ/m2∙yr)
Total (MJ/m2∙yr)
Savings (%) Heating Cooling Fans
Interior Lights
Exterior Lights Equipment Refrigeration
1A Miami, FL
Constant 0.2 269.7 102.7 343.6 1.5 169.3 143.9 1,031.0 – Stepped 0.3 273.6 73.1 343.6 1.5 169.3 143.9 1,005.2 2.5 Variable 0.3 279.0 57.2 343.6 1.5 169.3 143.6 994.5 3.5
2A Houston, TX
Constant 33.9 191.6 102.5 343.6 1.5 169.3 135.5 977.9 – Stepped 39.1 193.0 64.3 343.6 1.5 169.3 135.5 946.3 3.2 Variable 39.2 196.5 53.7 343.6 1.5 169.3 135.4 939.1 4.0
2B Phoenix, AZ
Constant 20.0 215.8 102.5 343.6 1.5 169.3 124.3 977.1 – Stepped 24.5 215.4 64.1 343.6 1.5 169.3 124.3 942.8 3.5 Variable 24.6 214.6 53.3 343.6 1.5 169.3 124.2 931.1 4.7
3A Atlanta, GA
Constant 106.7 111.9 102.4 343.6 1.4 169.3 124.9 960.3 – Stepped 120.0 113.1 57.0 343.6 1.4 169.3 124.9 929.3 3.2 Variable 120.1 115.9 48.1 343.6 1.4 169.3 124.7 923.2 3.9
3B Los Angeles, CA
Constant 5.4 55.2 102.3 343.6 1.6 169.3 126.7 804.2 – Stepped 7.3 54.5 52.2 343.6 1.6 169.3 126.7 755.3 6.1 Variable 7.3 56.8 46.5 343.6 1.6 169.3 126.6 751.7 6.5
3B Las Vegas, NV
Constant 52.1 165.4 102.5 343.6 1.7 169.3 114.6 949.2 – Stepped 62.8 164.8 60.0 343.6 1.7 169.3 114.6 916.7 3.4 Variable 62.7 163.2 50.9 343.6 1.7 169.3 114.6 905.9 4.6
3C San Francisco, CA
Constant 45.2 16.8 102.1 343.6 1.6 169.3 118.8 797.4 – Stepped 56.0 15.6 45.9 343.6 1.6 169.3 118.9 750.9 5.8 Variable 56.0 15.9 44.8 343.6 1.6 169.3 118.9 750.1 5.9
4A Baltimore, MD
Constant 252.5 84.9 102.3 343.6 1.6 169.3 118.5 1,072.7 – Stepped 275.1 85.3 55.6 343.6 1.6 169.3 118.5 1,048.9 2.2 Variable 275.5 87.2 49.2 343.6 1.6 169.3 118.3 1,044.7 2.6

43
Table B–3 Energy End Use Breakdown for Models With Refrigeration – SI Units (Continued)
Climate Zone Location Model
Gas (MJ/m2∙yr) Electricity (MJ/m2∙yr)
Total (MJ/m2∙yr)
Savings (%) Heating Cooling Fans
Interior Lights
Exterior Lights Equipment Refrigeration
4B Albuquerque, NM
Constant 145.8 83.4 102.3 343.6 1.6 169.3 110.7 956.7 – Stepped 164.8 82.8 54.6 343.6 1.6 169.3 110.7 927.4 3.1 Variable 165.1 82.9 47.3 343.6 1.6 169.3 110.6 920.4 3.8
4C Seattle, WA
Constant 183.4 21.6 102.1 343.6 1.6 169.3 114.0 935.6 – Stepped 209.3 20.7 48.2 343.6 1.6 169.3 114.0 906.7 3.1 Variable 209.5 21.2 46.4 343.6 1.6 169.3 114.0 905.6 3.2
5A Chicago, IL
Constant 377.4 61.1 102.3 343.6 1.6 169.3 114.5 1,169.9 – Stepped 404.1 61.2 54.7 343.6 1.6 169.3 114.5 1,149.0 1.8 Variable 404.4 62.9 49.2 343.6 1.6 169.3 114.4 1,145.4 2.1
5B Boulder, CO
Constant 243.0 52.5 102.3 343.6 1.6 169.3 107.4 1,019.6 – Stepped 267.0 51.3 52.9 343.6 1.6 169.3 107.4 993.1 2.6 Variable 266.6 51.2 48.3 343.6 1.6 169.3 107.3 988.0 3.1
6A Minneapolis, MN
Constant 538.8 53.3 102.4 343.6 1.5 169.3 112.5 1,321.4 – Stepped 564.9 53.2 56.4 343.6 1.5 169.3 112.5 1,301.5 1.5 Variable 565.1 54.8 51.3 343.6 1.5 169.3 112.4 1,298.0 1.8
6B Helena, MT
Constant 411.7 33.4 102.3 343.6 1.5 169.3 104.7 1,166.5 – Stepped 441.1 32.4 52.8 343.6 1.5 169.3 104.7 1,145.4 1.8 Variable 441.6 32.1 49.7 343.6 1.5 169.3 104.7 1,142.5 2.1
7A Duluth, MN
Constant 673.8 20.3 102.3 343.6 1.6 169.3 106.3 1,417.3 – Stepped 706.3 19.8 54.6 343.6 1.6 169.3 106.3 1,401.5 1.1 Variable 707.3 20.4 52.2 343.6 1.6 169.3 106.3 1,400.7 1.2
8A Fairbanks, AK
Constant 1,158.9 9.6 102.6 343.6 1.5 169.3 101.5 1,887.0 – Stepped 1,188.3 8.8 59.9 343.6 1.5 169.3 101.5 1,873.0 0.7 Variable 1,191.2 8.8 57.7 343.6 1.5 169.3 101.5 1,873.6 0.7

44
Table B–4 Energy End Use Breakdown for Models Without Refrigeration – SI Units
Climate Zone Location Model
Gas (MJ/m2∙yr) Electricity (MJ/m2∙yr)
Total (MJ/m2∙yr)
Savings (%) Heating Cooling Fans
Interior Lights
Exterior Lights Equipment
1A Miami, FL
Constant 0.3 278.8 85.1 341.6 1.8 146.1 853.7 – Stepped 0.4 285.9 58.7 341.6 1.8 146.1 834.4 2.3 Variable 0.4 303.4 40.6 341.6 1.8 146.1 833.8 2.3
2A Houston, TX
Constant 35.7 196.6 85.1 341.6 1.8 146.1 806.8 – Stepped 41.2 199.8 47.1 341.6 1.8 146.1 777.6 3.6 Variable 41.7 212.2 34.3 341.6 1.8 146.1 777.6 3.6
2B Phoenix, AZ
Constant 20.1 222.2 85.1 341.6 1.8 146.1 816.9 – Stepped 25.3 222.8 46.3 341.6 1.8 146.1 783.8 4.1 Variable 25.3 225.0 35.1 341.6 1.8 146.1 774.8 5.2
3A Atlanta, GA
Constant 110.2 111.5 85.1 341.6 1.7 146.1 796.2 – Stepped 123.6 114.4 39.1 341.6 1.7 146.1 766.5 3.7 Variable 124.9 124.2 28.3 341.6 1.7 146.1 766.9 3.7
3B Los Angeles, CA
Constant 6.3 52.3 85.1 341.6 1.9 146.1 633.3 – Stepped 8.4 52.3 31.3 341.6 1.9 146.1 581.7 8.1 Variable 8.4 56.6 26.0 341.6 1.9 146.1 580.7 8.3
3B Las Vegas, NV
Constant 51.7 170.3 85.1 341.6 2.0 146.1 796.7 – Stepped 63.0 170.1 41.2 341.6 2.0 146.1 764.0 4.1 Variable 63.2 168.9 31.4 341.6 2.0 146.1 753.3 5.5
3C San Francisco, CA
Constant 47.1 12.1 85.1 341.6 1.9 146.1 633.8 – Stepped 59.1 10.7 21.9 341.6 1.9 146.1 581.2 8.3 Variable 59.1 10.9 21.2 341.6 1.9 146.1 580.8 8.4
4A Baltimore, MD
Constant 261.1 84.3 85.1 341.6 1.9 146.1 920.0 – Stepped 283.4 85.8 38.7 341.6 1.9 146.1 897.4 2.5 Variable 286.8 92.2 29.1 341.6 1.9 146.1 897.7 2.4

45
Table B–4 Energy End Use Breakdown for Models Without Refrigeration – SI Units (Continued)
Climate Zone Location Model
Gas (MJ/m2∙yr) Electricity (MJ/m2∙yr)
Total (MJ/m2∙yr)
Savings (%) Heating Cooling Fans
Interior Lights
Exterior Lights Equipment
4B Albuquerque, NM
Constant 147.9 82.8 85.1 341.6 1.9 146.1 805.3 – Stepped 167.0 82.8 37.1 341.6 1.9 146.1 776.5 3.6 Variable 169.3 83.0 30.6 341.6 1.9 146.1 772.5 4.1
4C Seattle, WA
Constant 190.7 17.5 85.1 341.6 1.9 146.1 782.8 – Stepped 219.7 16.6 25.8 341.6 1.9 146.1 751.6 4.0 Variable 220.4 17.4 24.1 341.6 1.9 146.1 751.4 4.0
5A Chicago, IL
Constant 391.7 59.5 85.1 341.6 1.9 146.1 1,025.9 – Stepped 414.7 60.4 40.0 341.6 1.9 146.1 1,004.7 2.1 Variable 420.1 65.4 29.8 341.6 1.9 146.1 1,004.9 2.0
5B Boulder, CO
Constant 248.1 50.4 85.1 341.6 1.9 146.1 873.2 – Stepped 270.0 49.4 36.1 341.6 1.9 146.1 845.1 3.2 Variable 273.9 49.5 30.0 341.6 1.9 146.1 843.0 3.5
6A Minneapolis, MN
Constant 559.2 51.6 85.2 341.6 1.8 146.1 1,185.5 – Stepped 579.8 52.3 43.2 341.6 1.8 146.1 1,164.8 1.7 Variable 585.6 56.5 33.7 341.6 1.8 146.1 1,165.3 1.7
6B Helena, MT
Constant 425.1 30.8 85.2 341.6 1.8 146.1 1,030.5 – Stepped 450.9 29.7 36.9 341.6 1.8 146.1 1,007.0 2.3 Variable 456.1 29.6 30.9 341.6 1.8 146.1 1,006.1 2.4
7A Duluth, MN
Constant 699.5 17.5 85.3 341.6 1.9 146.1 1,291.8 – Stepped 725.5 17.0 41.6 341.6 1.9 146.1 1,273.7 1.4 Variable 732.2 18.5 34.2 341.6 1.9 146.1 1,274.4 1.3
8A Fairbanks, AK
Constant 1,203.1 7.2 85.6 341.6 1.8 146.1 1,785.4 – Stepped 1,226.6 6.2 47.5 341.6 1.8 146.1 1,769.9 0.9 Variable 1,232.0 6.3 42.2 341.6 1.8 146.1 1,770.0 0.9

46
B.2 Sizing Table B–5 Cooling Coil Sizing Results by Zone for Models With Refrigeration – tons
Zone Climate Zone
1A 2A 2B 3A 3BCA 3BNV 3C 4A 4B 4C 5A 5B 6A 6B 7 8 Grocery 43.3 43.3 43.3 43.3 43.3 43.3 43.3 43.3 43.3 43.3 43.3 43.3 43.3 43.3 43.3 43.3 Kitchen 4.8 4.8 4.8 4.8 4.8 4.8 4.8 4.8 4.8 4.8 4.8 4.8 4.8 4.8 4.8 4.8 Office 12.0 12.0 12.0 12.0 12.0 12.0 12.0 12.0 12.0 12.0 12.0 12.0 12.0 12.0 12.0 12.0 Pharmacy 5.2 5.2 5.2 5.2 5.2 5.2 5.2 5.2 5.2 5.2 5.2 5.2 5.2 5.2 5.2 5.2 Restroom 2.4 2.4 2.4 2.4 2.4 2.4 2.4 2.4 2.4 2.4 2.4 2.4 2.4 2.4 2.4 2.4 Sales 1 58.3 58.3 58.3 58.3 58.3 58.3 58.3 58.3 58.3 58.3 58.3 58.3 58.3 58.3 58.3 58.3 Sales 2 58.3 58.3 58.3 58.3 58.3 58.3 58.3 58.3 58.3 58.3 58.3 58.3 58.3 58.3 58.3 58.3 Sales 3 58.3 58.3 58.3 58.3 58.3 58.3 58.3 58.3 58.3 58.3 58.3 58.3 58.3 58.3 58.3 58.3 Sales 4 58.3 58.3 58.3 58.3 58.3 58.3 58.3 58.3 58.3 58.3 58.3 58.3 58.3 58.3 58.3 58.3 Stockroom 43.7 43.7 43.7 43.7 43.7 43.7 43.7 43.7 43.7 43.7 43.7 43.7 43.7 43.7 43.7 43.7 Vestibule 5.4 5.4 5.4 5.4 5.4 5.4 5.4 5.4 5.4 5.4 5.4 5.4 5.4 5.4 5.4 5.4 Walk-in freezer 5.2 5.2 5.2 5.2 5.2 5.2 5.2 5.2 5.2 5.2 5.2 5.2 5.2 5.2 5.2 5.2
Table B–6 Cooling Coil Sizing Results by Zone for Models With Refrigeration – ft2/ton
Zone Climate Zone
1A 2A 2B 3A 3BCA 3BNV 3C 4A 4B 4C 5A 5B 6A 6B 7 8 Grocery 375 375 375 375 375 375 375 375 375 375 375 375 375 375 375 375 Kitchen 375 375 375 375 375 375 375 375 375 375 375 375 375 375 375 375 Office 375 375 375 375 375 375 375 375 375 375 375 375 375 375 375 375 Pharmacy 375 375 375 375 375 375 375 375 375 375 375 375 375 375 375 375 Restroom 375 375 375 375 375 375 375 375 375 375 375 375 375 375 375 375 Sales 1 375 375 375 375 375 375 375 375 375 375 375 375 375 375 375 375 Sales 2 375 375 375 375 375 375 375 375 375 375 375 375 375 375 375 375 Sales 3 375 375 375 375 375 375 375 375 375 375 375 375 375 375 375 375 Sales 4 375 375 375 375 375 375 375 375 375 375 375 375 375 375 375 375 Stockroom 375 375 375 375 375 375 375 375 375 375 375 375 375 375 375 375 Vestibule 375 375 375 375 375 375 375 375 375 375 375 375 375 375 375 375 Walk-in freezer 375 375 375 375 375 375 375 375 375 375 375 375 375 375 375 375

47
Table B–7 Cooling Coil Sizing Results by Zone for Models With Refrigeration – kW
Zone Climate Zone
1A 2A 2B 3A 3BCA 3BNV 3C 4A 4B 4C 5A 5B 6A 6B 7 8 Grocery 152 152 152 152 152 152 152 152 152 152 152 152 152 152 152 152 Kitchen 17 17 17 17 17 17 17 17 17 17 17 17 17 17 17 17 Office 42 42 42 42 42 42 42 42 42 42 42 42 42 42 42 42 Pharmacy 18 18 18 18 18 18 18 18 18 18 18 18 18 18 18 18 Restroom 8 8 8 8 8 8 8 8 8 8 8 8 8 8 8 8 Sales 1 205 205 205 205 205 205 205 205 205 205 205 205 205 205 205 205 Sales 2 205 205 205 205 205 205 205 205 205 205 205 205 205 205 205 205 Sales 3 205 205 205 205 205 205 205 205 205 205 205 205 205 205 205 205 Sales 4 205 205 205 205 205 205 205 205 205 205 205 205 205 205 205 205 Stockroom 154 154 154 154 154 154 154 154 154 154 154 154 154 154 154 154 Vestibule 19 19 19 19 19 19 19 19 19 19 19 19 19 19 19 19 Walk-in freezer 18 18 18 18 18 18 18 18 18 18 18 18 18 18 18 18
Table B–8 Cooling Coil Sizing Results by Zone for Models Without Refrigeration – tons
Zone Climate Zone
1A 2A 2B 3A 3BCA 3BNV 3C 4A 4B 4C 5A 5B 6A 6B 7 8 Office 22.0 22.0 22.0 22.0 22.0 22.0 22.0 22.0 22.0 22.0 22.0 22.0 22.0 22.0 22.0 22.0 Restroom 2.4 2.4 2.4 2.4 2.4 2.4 2.4 2.4 2.4 2.4 2.4 2.4 2.4 2.4 2.4 2.4 Sales 1 58.3 58.3 58.3 58.3 58.3 58.3 58.3 58.3 58.3 58.3 58.3 58.3 58.3 58.3 58.3 58.3 Sales 2 58.3 58.3 58.3 58.3 58.3 58.3 58.3 58.3 58.3 58.3 58.3 58.3 58.3 58.3 58.3 58.3 Sales 3 58.3 58.3 58.3 58.3 58.3 58.3 58.3 58.3 58.3 58.3 58.3 58.3 58.3 58.3 58.3 58.3 Sales 4 58.3 58.3 58.3 58.3 58.3 58.3 58.3 58.3 58.3 58.3 58.3 58.3 58.3 58.3 58.3 58.3 Stockroom 35.1 35.1 35.1 35.1 35.1 35.1 35.1 35.1 35.1 35.1 35.1 35.1 35.1 35.1 35.1 35.1 Vestibule 5.4 5.4 5.4 5.4 5.4 5.4 5.4 5.4 5.4 5.4 5.4 5.4 5.4 5.4 5.4 5.4

48
Table B–9 Cooling Coil Sizing Results by Zone for Models Without Refrigeration – ft2/ton
Zone Climate Zone
1A 2A 2B 3A 3BCA 3BNV 3C 4A 4B 4C 5A 5B 6A 6B 7 8 Office 375 375 375 375 375 375 375 375 375 375 375 375 375 375 375 375 Restroom 375 375 375 375 375 375 375 375 375 375 375 375 375 375 375 375 Sales 1 375 375 375 375 375 375 375 375 375 375 375 375 375 375 375 375 Sales 2 375 375 375 375 375 375 375 375 375 375 375 375 375 375 375 375 Sales 3 375 375 375 375 375 375 375 375 375 375 375 375 375 375 375 375 Sales 4 375 375 375 375 375 375 375 375 375 375 375 375 375 375 375 375 Stockroom 375 375 375 375 375 375 375 375 375 375 375 375 375 375 375 375 Vestibule 375 375 375 375 375 375 375 375 375 375 375 375 375 375 375 375
Table B–10 Cooling Coil Sizing Results by Zone for Models Without Refrigeration – kW
Zone Climate Zone
1A 2A 2B 3A 3BCA 3BNV 3C 4A 4B 4C 5A 5B 6A 6B 7 8 Office 77 77 77 77 77 77 77 77 77 77 77 77 77 77 77 77 Restroom 8 8 8 8 8 8 8 8 8 8 8 8 8 8 8 8 Sales 1 205 205 205 205 205 205 205 205 205 205 205 205 205 205 205 205 Sales 2 205 205 205 205 205 205 205 205 205 205 205 205 205 205 205 205 Sales 3 205 205 205 205 205 205 205 205 205 205 205 205 205 205 205 205 Sales 4 205 205 205 205 205 205 205 205 205 205 205 205 205 205 205 205 Stockroom 123 123 123 123 123 123 123 123 123 123 123 123 123 123 123 123 Vestibule 19 19 19 19 19 19 19 19 19 19 19 19 19 19 19 19

49
Table B–11 Heating Coil Sizing Results by Zone for Models With Refrigeration – kBtu/h
Zone Climate Zone
1A 2A 2B 3A 3BCA 3BNV 3C 4A 4B 4C 5A 5B 6A 6B 7 8 Grocery 804 839 790 828 806 776 821 869 712 838 889 740 901 809 893 973 Kitchen 94 101 94 102 94 94 97 108 88 102 114 94 117 105 117 131 Office 219 226 214 222 219 209 223 232 191 225 235 196 237 212 234 252 Pharmacy 101 110 102 110 102 101 106 117 96 111 123 102 127 114 127 143 Restroom 47 51 47 51 47 47 49 54 44 51 57 47 58 53 58 66 Sales 1 1,138 1,233 1,140 1,237 1,147 1,137 1,183 1,313 1,070 1,240 1,380 1,143 1,420 1,280 1,417 1,595 Sales 2 1,138 1,233 1,140 1,237 1,147 1,137 1,183 1,313 1,070 1,240 1,380 1,143 1,420 1,280 1,417 1,595 Sales 3 1,138 1,233 1,140 1,237 1,147 1,137 1,183 1,313 1,070 1,240 1,380 1,143 1,420 1,280 1,417 1,595 Sales 4 1,138 1,233 1,140 1,237 1,147 1,137 1,183 1,313 1,070 1,240 1,380 1,143 1,420 1,280 1,417 1,595 Stockroom 813 850 800 840 815 785 831 881 722 849 902 751 915 822 907 991 Vestibule 100 104 98 102 100 96 102 107 88 104 109 91 111 99 110 119 Walk-in freezer 101 110 102 110 102 101 105 117 95 111 123 102 127 114 126 142
Table B–12 Heating Coil Sizing Results by Zone for Models With Refrigeration – Btu/h∙ft2
Zone Climate Zone
1A 2A 2B 3A 3BCA 3BNV 3C 4A 4B 4C 5A 5B 6A 6B 7 8 Grocery 49.5 51.6 48.6 51.0 49.6 47.7 50.5 53.5 43.8 51.5 54.7 45.5 55.4 49.8 54.9 59.9 Kitchen 52.0 56.4 52.1 56.6 52.4 52.0 54.1 60.0 48.9 56.7 63.1 52.3 64.9 58.5 64.8 72.9 Office 48.7 50.2 47.6 49.3 48.8 46.5 49.5 51.5 42.3 50.0 52.2 43.5 52.6 47.2 52.0 56.0 Pharmacy 52.1 56.4 52.2 56.7 52.5 52.0 54.1 60.1 49.0 56.8 63.2 52.4 65.1 58.6 65.0 73.1 Restroom 52.0 56.4 52.1 56.6 52.4 52.0 54.1 60.0 48.9 56.7 63.1 52.3 64.9 58.5 64.8 72.9 Sales 1 52.0 56.4 52.1 56.6 52.4 52.0 54.1 60.0 48.9 56.7 63.1 52.3 64.9 58.5 64.8 72.9 Sales 2 52.0 56.4 52.1 56.6 52.4 52.0 54.1 60.0 48.9 56.7 63.1 52.3 64.9 58.5 64.8 72.9 Sales 3 52.0 56.4 52.1 56.6 52.4 52.0 54.1 60.0 48.9 56.7 63.1 52.3 64.9 58.5 64.8 72.9 Sales 4 52.0 56.4 52.1 56.6 52.4 52.0 54.1 60.0 48.9 56.7 63.1 52.3 64.9 58.5 64.8 72.9 Stockroom 49.6 51.8 48.8 51.2 49.7 47.9 50.7 53.7 44.0 51.7 55.0 45.8 55.8 50.1 55.3 60.4 Vestibule 49.3 51.2 48.3 50.5 49.4 47.4 50.2 52.9 43.4 51.1 54.0 45.0 54.7 49.1 54.1 58.8 Walk-in freezer 52.0 56.4 52.1 56.6 52.4 52.0 54.1 60.0 48.9 56.7 63.1 52.3 64.9 58.5 64.8 72.9

50
Table B–13 Heating Coil Sizing Results by Zone for Models With Refrigeration – kW
Zone Climate Zone
1A 2A 2B 3A 3BCA 3BNV 3C 4A 4B 4C 5A 5B 6A 6B 7 8 Grocery 236 246 232 243 236 227 241 255 209 245 260 217 264 237 262 285 Kitchen 27 30 27 30 28 27 29 32 26 30 33 28 34 31 34 38 Office 64 66 63 65 64 61 65 68 56 66 69 57 69 62 69 74 Pharmacy 30 32 30 32 30 30 31 34 28 32 36 30 37 34 37 42 Restroom 14 15 14 15 14 14 14 16 13 15 17 14 17 15 17 19 Sales 1 333 361 334 363 336 333 347 385 314 363 405 335 416 375 415 468 Sales 2 333 361 334 363 336 333 347 385 314 363 405 335 416 375 415 468 Sales 3 333 361 334 363 336 333 347 385 314 363 405 335 416 375 415 468 Sales 4 333 361 334 363 336 333 347 385 314 363 405 335 416 375 415 468 Stockroom 238 249 234 246 239 230 244 258 212 249 264 220 268 241 266 290 Vestibule 29 30 29 30 29 28 30 31 26 30 32 27 32 29 32 35 Walk-in freezer 30 32 30 32 30 30 31 34 28 32 36 30 37 33 37 42
Table B–14 Heating Coil Sizing Results by Zone for Models Without Refrigeration – kBtu/h
Zone Climate Zone
1A 2A 2B 3A 3BCA 3BNV 3C 4A 4B 4C 5A 5B 6A 6B 7 8 Office 338 350 331 345 338 324 344 361 296 349 368 306 372 334 368 399 Restroom 40 44 40 44 40 40 42 47 38 44 50 41 52 47 52 59 Sales 1 967 1063 976 1073 977 979 1013 1143 929 1072 1214 1003 1254 1132 1255 1427 Sales 2 967 1063 976 1073 977 979 1013 1143 929 1072 1214 1003 1254 1132 1255 1427 Sales 3 967 1063 976 1073 977 979 1013 1143 929 1072 1214 1003 1254 1132 1255 1427 Sales 4 967 1063 976 1073 977 979 1013 1143 929 1072 1214 1003 1254 1132 1255 1427 Stockroom 549 579 543 575 552 535 564 605 495 579 623 518 635 571 630 693 Vestibule 84 88 83 87 84 81 86 91 75 88 94 78 95 86 95 104

51
Table B–15 Heating Coil Sizing Results by Zone for Models Without Refrigeration – Btu/h∙ft2
Zone Climate Zone
1A 2A 2B 3A 3BCA 3BNV 3C 4A 4B 4C 5A 5B 6A 6B 7 8 Office 40.9 42.4 40.1 41.8 41.0 39.3 41.7 43.8 35.9 42.3 44.5 37.1 45.1 40.4 44.6 48.3 Restroom 44.2 48.6 44.6 49.1 44.7 44.8 46.3 52.3 42.5 49.0 55.5 45.9 57.3 51.7 57.4 65.3 Sales 1 44.2 48.6 44.6 49.1 44.7 44.8 46.3 52.3 42.5 49.0 55.5 45.9 57.3 51.7 57.4 65.3 Sales 2 44.2 48.6 44.6 49.1 44.7 44.8 46.3 52.3 42.5 49.0 55.5 45.9 57.3 51.7 57.4 65.3 Sales 3 44.2 48.6 44.6 49.1 44.7 44.8 46.3 52.3 42.5 49.0 55.5 45.9 57.3 51.7 57.4 65.3 Sales 4 44.2 48.6 44.6 49.1 44.7 44.8 46.3 52.3 42.5 49.0 55.5 45.9 57.3 51.7 57.4 65.3 Stockroom 41.8 44.0 41.3 43.7 42.0 40.7 42.9 46.0 37.6 44.1 47.4 39.4 48.3 43.4 47.9 52.7 Vestibule 41.5 43.5 40.8 43.0 41.6 40.2 42.4 45.2 37.0 43.4 46.4 38.6 47.1 42.3 46.7 51.1
Table B–16 Heating Coil Sizing Results by Zone for Models Without Refrigeration – kW
Zone Climate Zone
1A 2A 2B 3A 3BCA 3BNV 3C 4A 4B 4C 5A 5B 6A 6B 7 8 Office 99 103 97 101 99 95 101 106 87 102 108 90 109 98 108 117 Restroom 12 13 12 13 12 12 12 14 11 13 15 12 15 14 15 17 Sales 1 283 312 286 314 286 287 297 335 272 314 356 294 368 332 368 418 Sales 2 283 312 286 314 286 287 297 335 272 314 356 294 368 332 368 418 Sales 3 283 312 286 314 286 287 297 335 272 314 356 294 368 332 368 418 Sales 4 283 312 286 314 286 287 297 335 272 314 356 294 368 332 368 418 Stockroom 161 170 159 168 162 157 165 177 145 170 183 152 186 167 185 203 Vestibule 25 26 24 26 25 24 25 27 22 26 28 23 28 25 28 30

52
B.3 Fan Energy Savings (SI Units) Table B–17 Normalized Annual Fan Energy Consumption for Models With Refrigeration
Climate Zones Cities
Constant-Speed Fan Stepped-Speed Fan Variable-Speed Fan
Fan EUI (MJ/m2)
Fan EUI (MJ/m2)
Savings (%)
Fan EUI (MJ/m2)
Savings (%)
1A Miami, FL 102.3 72.8 28.9 57.0 44.3 2A Houston, TX 102.1 64.0 37.3 53.5 47.7 2B Phoenix, AZ 102.2 63.9 37.5 53.1 48.0 3A Atlanta, GA 102.0 56.8 44.4 47.9 53.1 3B Los Angeles, CA 102.0 52.0 49.0 46.3 54.6 3B Las Vegas, NV 102.1 59.8 41.4 50.7 50.4 3C San Francisco, CA 101.8 45.8 55.1 44.6 56.2 4A Baltimore, MD 101.9 55.4 45.7 49.0 51.9 4B Albuquerque, NM 102.0 54.4 46.6 47.2 53.7 4C Seattle, WA 101.8 48.0 52.9 46.3 54.5 5A Chicago, IL 101.9 54.5 46.6 49.0 51.9 5B Boulder, CO 101.9 52.7 48.3 48.2 52.7 6A Minneapolis, MN 102.0 56.2 44.9 51.1 49.9 6B Helena, MT 101.9 52.6 48.4 49.5 51.4 7 Duluth, MN 101.9 54.4 46.7 52.1 48.9 8 Fairbanks, AK 102.2 59.7 41.6 57.5 43.8
Table B–18 Normalized Annual Fan Energy Consumption for Models Without Refrigeration
Climate Zones Cities
Constant-Speed Fan Stepped-Speed Fan Variable-Speed Fan
Fan EUI (MJ/m2)
Fan EUI (MJ/m2)
Savings (%)
Fan EUI (MJ/m2)
Savings (%)
1A Miami, FL 84.8 58.5 31.0 40.5 52.2 2A Houston, TX 84.8 46.9 44.6 34.2 59.7 2B Phoenix, AZ 84.8 46.1 45.6 34.9 58.8 3A Atlanta, GA 84.8 38.9 54.1 28.2 66.7 3B Los Angeles, CA 84.8 31.2 63.2 25.9 69.4 3B Las Vegas, NV 84.8 41.1 51.5 31.3 63.1 3C San Francisco, CA 84.8 21.8 74.3 21.2 75.0 4A Baltimore, MD 84.8 38.5 54.6 29.0 65.9 4B Albuquerque, NM 84.8 37.0 56.3 30.5 64.1 4C Seattle, WA 84.8 25.7 69.7 24.0 71.7 5A Chicago, IL 84.8 39.9 53.0 29.7 65.0 5B Boulder, CO 84.8 36.0 57.6 29.9 64.7 6A Minneapolis, MN 84.9 43.1 49.3 33.6 60.4 6B Helena, MT 84.9 36.8 56.7 30.8 63.7 7 Duluth, MN 85.0 41.5 51.2 34.1 59.9 8 Fairbanks, AK 85.3 47.3 44.5 42.1 50.7

53
B.4 Electricity Consumption Savings (SI Units) Table B–19 Normalized Annual Whole-Building Electricity Consumption for Models With
Refrigeration
Climate Zones Cities
Constant-Speed Fan Stepped-Speed Fan Variable-Speed Fan
Use (kWh/m2)
Use (kWh/m2)
Savings (kWh/m2)
Use (kWh/m2)
Savings (kWh/m2)
1A Miami, FL 285.4 278.2 7.1 275.3 10.1 2A Houston, TX 261.4 251.2 10.2 249.2 12.2 2B Phoenix, AZ 265.0 254.2 10.7 251.0 14.0 3A Atlanta, GA 236.3 224.1 12.3 222.3 14.0 3B Los Angeles, CA 221.2 207.1 14.1 206.1 15.1 3B Las Vegas, NV 248.4 236.4 11.9 233.5 14.9 3C San Francisco, CA 208.3 192.4 15.9 192.2 16.1 4A Baltimore, MD 227.1 214.2 12.8 213.0 14.1 4B Albuquerque, NM 224.5 211.1 13.4 209.1 15.4 4C Seattle, WA 208.3 193.1 15.2 192.7 15.5 5A Chicago, IL 219.4 206.2 13.2 205.2 14.2 5B Boulder, CO 215.0 201.0 14.0 199.7 15.3 6A Minneapolis, MN 216.7 203.9 12.7 202.9 13.7 6B Helena, MT 209.0 195.0 14.0 194.1 14.9 7 Duluth, MN 205.8 192.5 13.4 192.0 13.9 8 Fairbanks, AK 201.6 189.6 12.0 189.0 12.6
Table B–20 Normalized Annual Whole-Building Electricity Consumption for Models Without
Refrigeration
Climate Zones Cities
Constant-Speed Fan Stepped-Speed Fan Variable-Speed Fan
Use (kWh/m2)
Use (kWh/m2)
Savings (kWh/m2)
Use (kWh/m2)
Savings (kWh/m2)
1A Miami, FL 236.3 230.9 5.4 230.8 5.5 2A Houston, TX 213.5 203.9 9.6 203.7 9.8 2B Phoenix, AZ 220.6 210.0 10.6 207.5 13.1 3A Atlanta, GA 189.9 178.0 12.0 177.7 12.2 3B Los Angeles, CA 173.6 158.7 14.9 158.4 15.2 3B Las Vegas, NV 206.3 194.1 12.2 191.0 15.2 3C San Francisco, CA 162.4 144.5 17.9 144.4 18.0 4A Baltimore, MD 182.4 170.0 12.5 169.1 13.3 4B Albuquerque, NM 182.0 168.7 13.3 167.0 15.0 4C Seattle, WA 163.9 147.3 16.6 147.0 16.9 5A Chicago, IL 175.6 163.4 12.2 161.9 13.7 5B Boulder, CO 173.1 159.2 13.8 157.6 15.5 6A Minneapolis, MN 173.4 162.0 11.4 160.5 12.9 6B Helena, MT 167.6 154.0 13.7 152.3 15.3 7 Duluth, MN 164.0 151.8 12.2 150.1 13.9 8 Fairbanks, AK 161.2 150.4 10.8 148.9 12.3
54
B.5 Natural Gas Consumption Savings (SI Units) Table B–21 Normalized Annual Whole-Building Natural Gas Consumption* for Models With
Refrigeration
Climate Zones Cities
Constant-Speed Fan Stepped-Speed Fan Variable-Speed Fan
Use (MJ/m2)
Use (MJ/m2)
Savings (MJ/m2) Use (MJ/m2)
Savings (MJ/m2)
1A Miami, FL 0.2 0.3 0.0 0.3 0.0 2A Houston, TX 33.9 39.1 –5.3 39.2 –5.3 2B Phoenix, AZ 20.0 24.5 –4.6 24.6 –4.6 3A Atlanta, GA 106.7 120.0 –13.3 120.1 –13.4 3B Los Angeles, CA 5.4 7.3 –2.0 7.3 –2.0 3B Las Vegas, NV 52.1 62.8 –10.7 62.7 –10.7 3C San Francisco, CA 45.2 56.0 –10.8 56.0 –10.8 4A Baltimore, MD 252.5 275.1 –22.5 275.5 –22.9 4B Albuquerque, NM 145.8 164.8 –19.0 165.1 –19.3 4C Seattle, WA 183.4 209.3 –26.0 209.5 –26.1 5A Chicago, IL 377.4 404.1 –26.7 404.4 –26.9 5B Boulder, CO 243.0 267.0 –24.1 266.6 –23.7 6A Minneapolis, MN 538.8 564.9 –26.1 565.1 –26.3 6B Helena, MT 411.7 441.1 –29.5 441.6 –29.9 7 Duluth, MN 673.8 706.3 –32.5 707.3 –33.5 8 Fairbanks, AK 1,158.9 1,188.3 –29.4 1,191.2 –32.3
*Negative values indicate that natural gas use increased.

55
Table B–22 Normalized Annual Whole-Building Natural Gas Consumption* for Models Without Refrigeration
Climate Zones Cities
Constant-Speed Fan Stepped-Speed Fan Variable-Speed Fan
Use (MJ/m2)
Use (MJ/m2)
Savings (MJ/m2)
Use (MJ/m2)
Savings (MJ/m2)
1A Miami, FL 0.3 0.4 0.0 0.4 0.0 2A Houston, TX 35.7 41.2 –5.5 41.7 –6.0 2B Phoenix, AZ 20.1 25.3 –5.1 25.3 –5.2 3A Atlanta, GA 110.2 123.6 –13.4 124.9 –14.8 3B Los Angeles, CA 6.3 8.4 –2.1 8.4 –2.1 3B Las Vegas, NV 51.7 63.0 –11.3 63.2 –11.5 3C San Francisco, CA 47.1 59.1 –12.0 59.1 –12.0 4A Baltimore, MD 261.1 283.4 –22.3 286.8 –25.8 4B Albuquerque, NM 147.9 167.0 –19.1 169.3 –21.4 4C Seattle, WA 190.7 219.7 –29.0 220.4 –29.7 5A Chicago, IL 391.7 414.7 –22.9 420.1 –28.4 5B Boulder, CO 248.1 270.0 –21.8 273.9 –25.8 6A Minneapolis, MN 559.2 579.8 –20.7 585.6 –26.5 6B Helena, MT 425.1 450.9 –25.8 456.1 –31.0 7 Duluth, MN 699.5 725.5 –26.0 732.2 –32.7 8 Fairbanks, AK 1,203.1 1,226.6 –23.5 1,232.0 –28.9
*Negative values indicate that natural gas use increased.
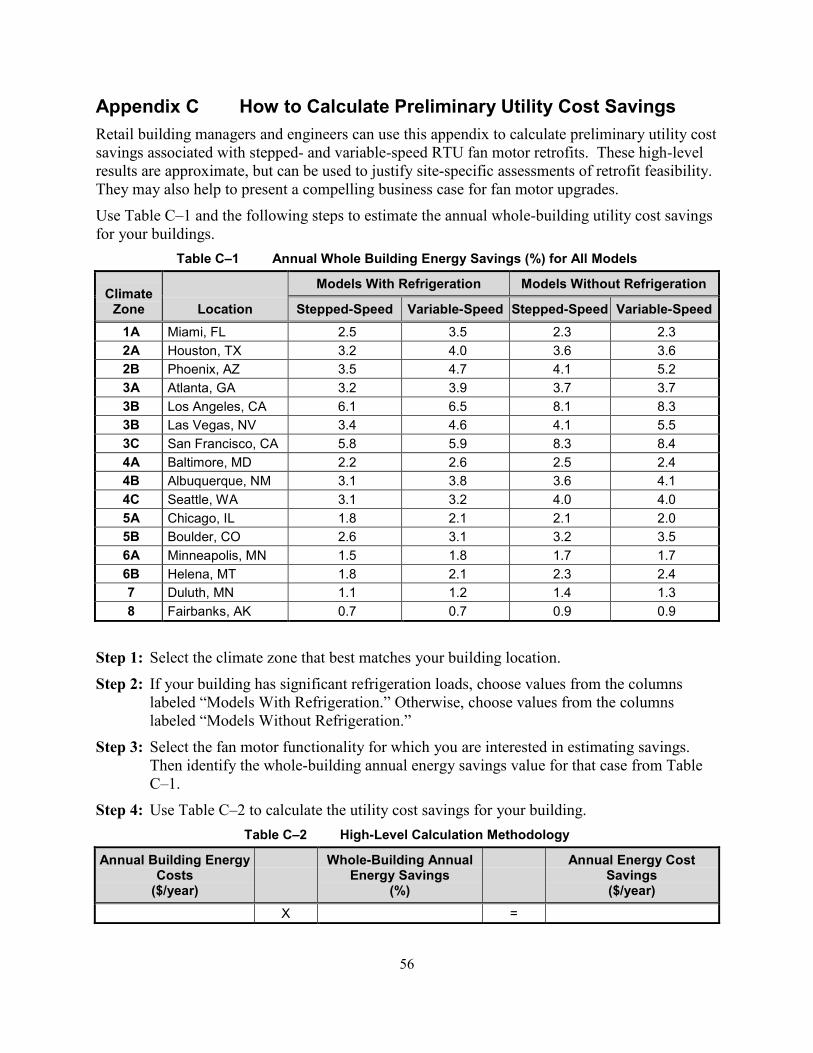
56
Appendix C How to Calculate Preliminary Utility Cost Savings Retail building managers and engineers can use this appendix to calculate preliminary utility cost savings associated with stepped- and variable-speed RTU fan motor retrofits. These high-level results are approximate, but can be used to justify site-specific assessments of retrofit feasibility. They may also help to present a compelling business case for fan motor upgrades.
Use Table C–1 and the following steps to estimate the annual whole-building utility cost savings for your buildings.
Table C–1 Annual Whole Building Energy Savings (%) for All Models
Climate Zone Location
Models With Refrigeration Models Without Refrigeration
Stepped-Speed Variable-Speed Stepped-Speed Variable-Speed 1A Miami, FL 2.5 3.5 2.3 2.3 2A Houston, TX 3.2 4.0 3.6 3.6 2B Phoenix, AZ 3.5 4.7 4.1 5.2 3A Atlanta, GA 3.2 3.9 3.7 3.7 3B Los Angeles, CA 6.1 6.5 8.1 8.3 3B Las Vegas, NV 3.4 4.6 4.1 5.5 3C San Francisco, CA 5.8 5.9 8.3 8.4 4A Baltimore, MD 2.2 2.6 2.5 2.4 4B Albuquerque, NM 3.1 3.8 3.6 4.1 4C Seattle, WA 3.1 3.2 4.0 4.0 5A Chicago, IL 1.8 2.1 2.1 2.0 5B Boulder, CO 2.6 3.1 3.2 3.5 6A Minneapolis, MN 1.5 1.8 1.7 1.7 6B Helena, MT 1.8 2.1 2.3 2.4 7 Duluth, MN 1.1 1.2 1.4 1.3 8 Fairbanks, AK 0.7 0.7 0.9 0.9
Step 1: Select the climate zone that best matches your building location.
Step 2: If your building has significant refrigeration loads, choose values from the columns labeled “Models With Refrigeration.” Otherwise, choose values from the columns labeled “Models Without Refrigeration.”
Step 3: Select the fan motor functionality for which you are interested in estimating savings. Then identify the whole-building annual energy savings value for that case from Table C–1.
Step 4: Use Table C–2 to calculate the utility cost savings for your building. Table C–2 High-Level Calculation Methodology
Annual Building Energy Costs
($/year)
Whole-Building Annual Energy Savings
(%)
Annual Energy Cost Savings ($/year)
X =