Energy Generation in Wales
36
Energy Generation in Wales 2019
Transcript of Energy Generation in Wales

Energy Generation in Wales2019

Cover illustration: Regen
Written and produced by Regen for the Welsh Government
Produced October 2020, version 1
ISBN: 978-1-80082-366-2
Contents
Introduction pages
Introduction ............................................... 1
Ministerial foreword ................................... 2
Electricity generation in WalesRenewable energy in Wales ....................... 5
Progress towards targets ............................ 7
The local picture ........................................ 9
Locally owned renewable energy ............... 11
Low carbon technologiesAnaerobic digestion ................................... 14
Biomass heat ............................................. 15
Heat pumps ............................................... 16
Hydropower ............................................... 17
Offshore wind ............................................ 18
Onshore wind ............................................ 19
Solar PV ..................................................... 20
Fossil fuels
Fossil fuel electricity generation .................. 22
StorageBattery storage .......................................... 24
Reference pages
Data tables ................................................ 27
Methodology ............................................. 30
Assumptions and references ...................... 31
Abbreviations and definitions ..................... 32

1 2019 | Energy Generation in Wales
Introduction
The Energy Generation in Wales 2019 report sets out the current energy generation capacity in Wales and analyses how it has changed over time.
The aim of the report is to support the Welsh Government with the development of energy policy, helping to evidence the economic, community and environmental benefits from the development of Welsh energy projects.
The report brings together a wide range of data sources to analyse the total capacity of renewable, nuclear and fossil fuel electricity generation as well as renewable heat and energy storage in Wales. It also looks at the growth of renewable energy in 2019, reviewing the growth prospects of each technology. The analysis builds on prior publications:
• Previous Energy Generation in Wales reports.
• The Energy Use in Wales report, published in 2020, which set out how energy is used in Wales and how energy use has changed over time.
Energy generation deployment is broken down into the 22 local authority areas in Wales. This allows analysis of the local factors, including natural resources, local policies and other demographic elements, which may influence the deployment of different technologies.
Case studies of recently commissioned significant energy projects are included to illustrate the range of different technologies and scales of deployment in Wales.
The value of local ownership of energy assets has been recognised by the Welsh Government, and is a key part of Wales’ energy strategy. The current ownership of energy generation assets in Wales has also been examined, providing a measure against Wales’ target of 1 GW of locally owned renewable energy capacity by 2030.
This report• Breaks down Welsh electricity and renewable heat generation by technology, capacity
and local authority area to the end of 2019.
• Estimates 51% of electricity consumption comes from renewable sources.
• Estimates 825 MW of installed renewable energy capacity is locally owned.
Technologies analysed• Renewable electricity and heat technologies.
• Nuclear power stations.
• Electricity storage technologies.
• Fossil fuel electricity generation (coal power stations, closed and open cycle gas turbines, reciprocating engines, diesel generators and combined heat and power plants).
xxx
2 2019 | Energy Generation in Wales
xxx
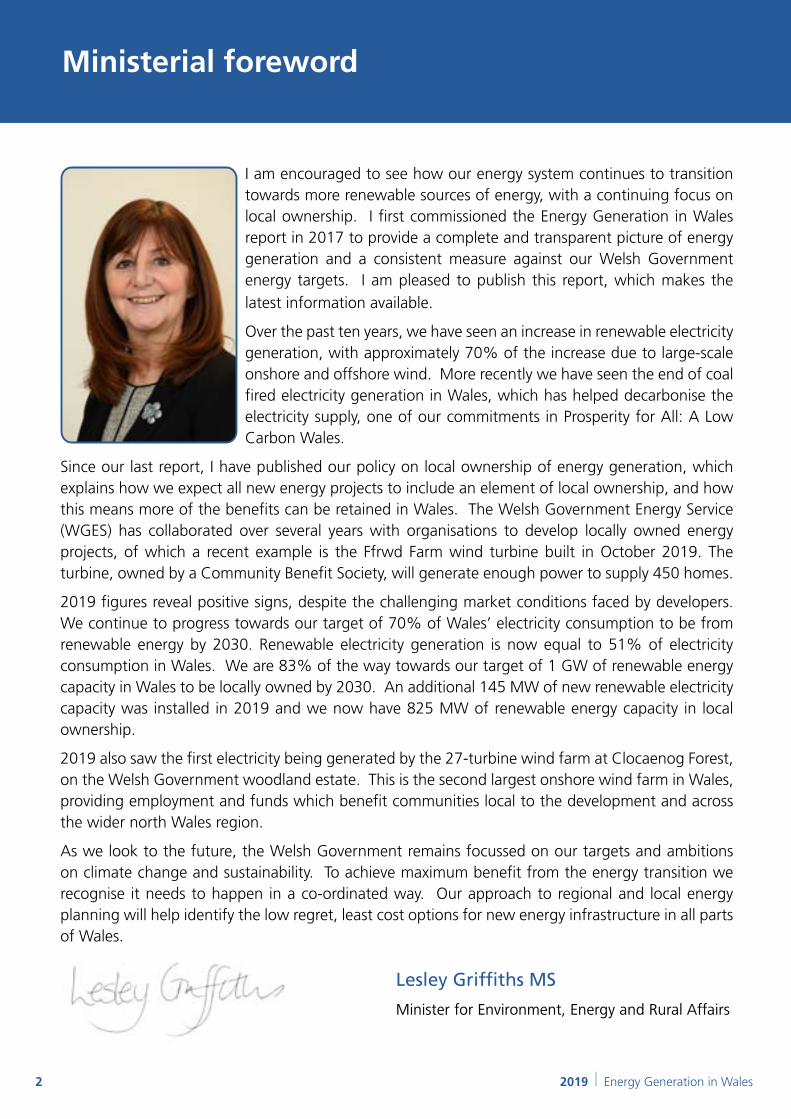
I am encouraged to see how our energy system continues to transition towards more renewable sources of energy, with a continuing focus on local ownership. I first commissioned the Energy Generation in Wales report in 2017 to provide a complete and transparent picture of energy generation and a consistent measure against our Welsh Government energy targets. I am pleased to publish this report, which makes the
latest information available.
Over the past ten years, we have seen an increase in renewable electricity generation, with approximately 70% of the increase due to large-scale onshore and offshore wind. More recently we have seen the end of coal fired electricity generation in Wales, which has helped decarbonise the electricity supply, one of our commitments in Prosperity for All: A Low Carbon Wales.
Since our last report, I have published our policy on local ownership of energy generation, which explains how we expect all new energy projects to include an element of local ownership, and how this means more of the benefits can be retained in Wales. The Welsh Government Energy Service (WGES) has collaborated over several years with organisations to develop locally owned energy projects, of which a recent example is the Ffrwd Farm wind turbine built in October 2019. The turbine, owned by a Community Benefit Society, will generate enough power to supply 450 homes.
2019 figures reveal positive signs, despite the challenging market conditions faced by developers. We continue to progress towards our target of 70% of Wales’ electricity consumption to be from renewable energy by 2030. Renewable electricity generation is now equal to 51% of electricity consumption in Wales. We are 83% of the way towards our target of 1 GW of renewable energy capacity in Wales to be locally owned by 2030. An additional 145 MW of new renewable electricity capacity was installed in 2019 and we now have 825 MW of renewable energy capacity in local ownership.
2019 also saw the first electricity being generated by the 27-turbine wind farm at Clocaenog Forest, on the Welsh Government woodland estate. This is the second largest onshore wind farm in Wales, providing employment and funds which benefit communities local to the development and across the wider north Wales region.
As we look to the future, the Welsh Government remains focussed on our targets and ambitions on climate change and sustainability. To achieve maximum benefit from the energy transition we recognise it needs to happen in a co-ordinated way. Our approach to regional and local energy planning will help identify the low regret, least cost options for new energy infrastructure in all parts of Wales.
Ministerial foreword
Lesley Griffiths MS
Minister for Environment, Energy and Rural Affairs
3 2019 | Energy Generation in Wales
Electricity generation in Wales
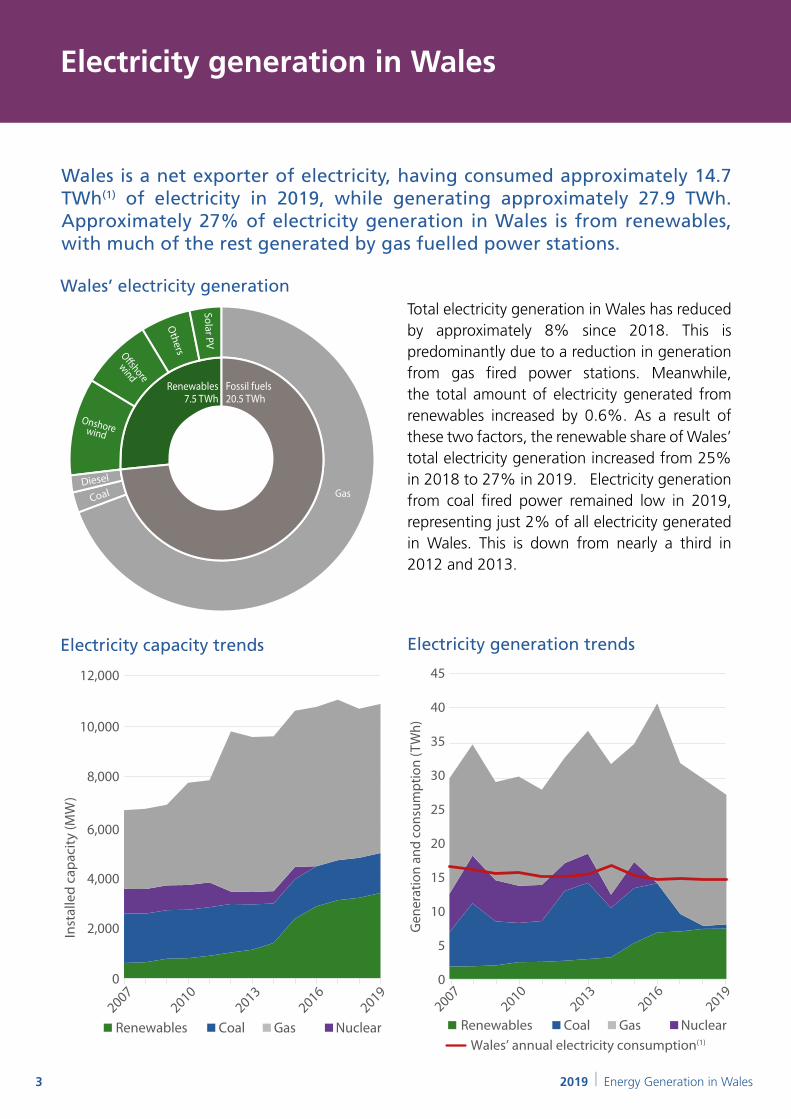
Wales is a net exporter of electricity, having consumed approximately 14.7 TWh(1) of electricity in 2019, while generating approximately 27.9 TWh. Approximately 27% of electricity generation in Wales is from renewables, with much of the rest generated by gas fuelled power stations.
Total electricity generation in Wales has reduced by approximately 8% since 2018. This is predominantly due to a reduction in generation from gas fired power stations. Meanwhile, the total amount of electricity generated from renewables increased by 0.6%. As a result of these two factors, the renewable share of Wales’ total electricity generation increased from 25% in 2018 to 27% in 2019. Electricity generation from coal fired power remained low in 2019, representing just 2% of all electricity generated in Wales. This is down from nearly a third in 2012 and 2013.
Gas
Renewables7.5 TWh
Fossil fuels20.5 TWh
Others
Onshorewind
O�shore
wind
Solar PV
Diesel
Coal
Wales’ electricity generation
Electricity capacity trends Electricity generation trends
0
2,000
4,000
6,000
8,000
10,000
20072010
20132016
2019
Inst
alle
d ca
paci
ty (M
W)
Renewables Coal Gas Nuclear
12,000
0
5
10
15
20
25
30
35
20072010
20132016
2019
40
45
Renewables Coal Gas Nuclear
Gen
erat
ion
and
cons
umpt
ion
(TW
h)
Wales’ annual electricity consumption(1)

4 2019 | Energy Generation in Wales
Electricity generation in Wales
• Aberthaw power station was the last
operational coal-fired power station in Wales,
closing in March 2020. Coal fired electricity
generation is not expected to contribute to
Wales’ electricity mix in the future.
• There are no nuclear power stations
currently operating in Wales. Plans for a
new nuclear plant on the existing Wylfa
site were suspended in January 2019 and
Hitachi formally ended its involvement in
the project in September 2020. The Wylfa
Newydd site however, is still regarded as one
of the best in the UK for large new nuclear
development and discussions continue as
to future opportunities. Opportunities also
exist at Trawsfynydd for small modular or
advanced modular reactors and work is now
underway by Welsh Government to create
a site development company to help unlock
the site’s potential.
• An estimated 7.5 TWh of renewable electricity
was generated in Wales in 2019, up from 7.4
TWh the previous year. This represents 27%
of all electricity generation in Wales.
• An additional 143 MW of new renewable
electricity capacity was installed in 2019. This
is a small increase from 2018 when 133 MW
was installed. However, this is significantly
below the deployment levels seen in 2015
and 2016.
• In 2019, there were 56,860 renewable
electricity projects in Wales, 1,076 more
than in 2018.
Electricity generation projects in Wales
Technologies Number of projectsElectrical capacity
(MW)Estimated electricity generation (GWh)
Fossil fuels 102 7,419 20,461
Coal 1 1,586 631
Diesel 13 184 643
Gas 88 5,650 19,187
Storage 209 2,088 -
Battery storage 207 29 -
Pumped hydro 2 2,088 -
Renewables 56,860 3,372 7,470
CASE STUDY – CLOCAENOG FOREST WIND FARM
Construction of the 27-turbine wind farm at Clocaenog Forest started in March 2018 and electricity was first generated in July 2019. With a maximum capacity of 96 MW, it is the second largest onshore wind farm in Wales and the 18th largest in the UK. It is situated on the Welsh Government woodland estate, which is managed by Natural Resources Wales. There is an associated community benefit fund, worth up to £768,000 per year over the 25-year operating lifetime of the project, which will be directed to benefit communities local to the development and across the wider north Wales region. Credit: Innogy via ReNews

5 2019 | Energy Generation in Wales
Renewable energy in Wales
145 MW of new renewable electrical capacity was commissioned in Wales in 2019. This brings the total electrical capacity to 3,372 MW from 56,807 installations. An additional 14 MW of renewable heat capacity was commissioned in Wales in 2019. This brings the total renewable heat capacity in Wales to 686 MW.
Wales’ renewable energy capacity installation rate
Renewable electricity and heat generation
• Clocaenog Forest wind farm was the largest renewable electricity project commissioned in 2019. This 27-turbine development, sited on the border between Denbighshire and Conwy, has a capacity of 96 MW, making it the second largest onshore wind farm in Wales after Pen y Cymoedd.
• There were two further projects with a capacity over 1 MW which were commissioned in 2019. Both were onshore wind developments: the 33 MW Mynydd Y Gwair wind farm near Swansea and the 2 MW Kingspan project in Flintshire.
• Offshore and onshore wind continue to play a major role in Welsh renewable electricity generation, accounting for 29% and 38% of renewable generation respectively in 2019.
• An additional 7 MW of solar PV capacity was commissioned in Wales in 2019. Solar PV now accounts for 12% of all renewable electricity generation in Wales. The two largest solar PV projects commissioned in 2019 both had a capacity of 0.5MW and were both installed in Powys.
Capa
city
inst
alle
d by
yea
r (M
W)
0
200
400
600
800
1,200
1,000
20072011
20132015
20172019
2009
Heat capacityElectrical capacity
Heat2.3 TWh
Electricity7.5 TWh
O�shore
wind
Onshore
windBiomass heat
Biomass
electricity
and CHP
Biomass
electricity
and CHP
Others
Others
Sola
rPV
Renewable electricity in Wales
6 2019 | Energy Generation in Wales
Renewable heat in Wales
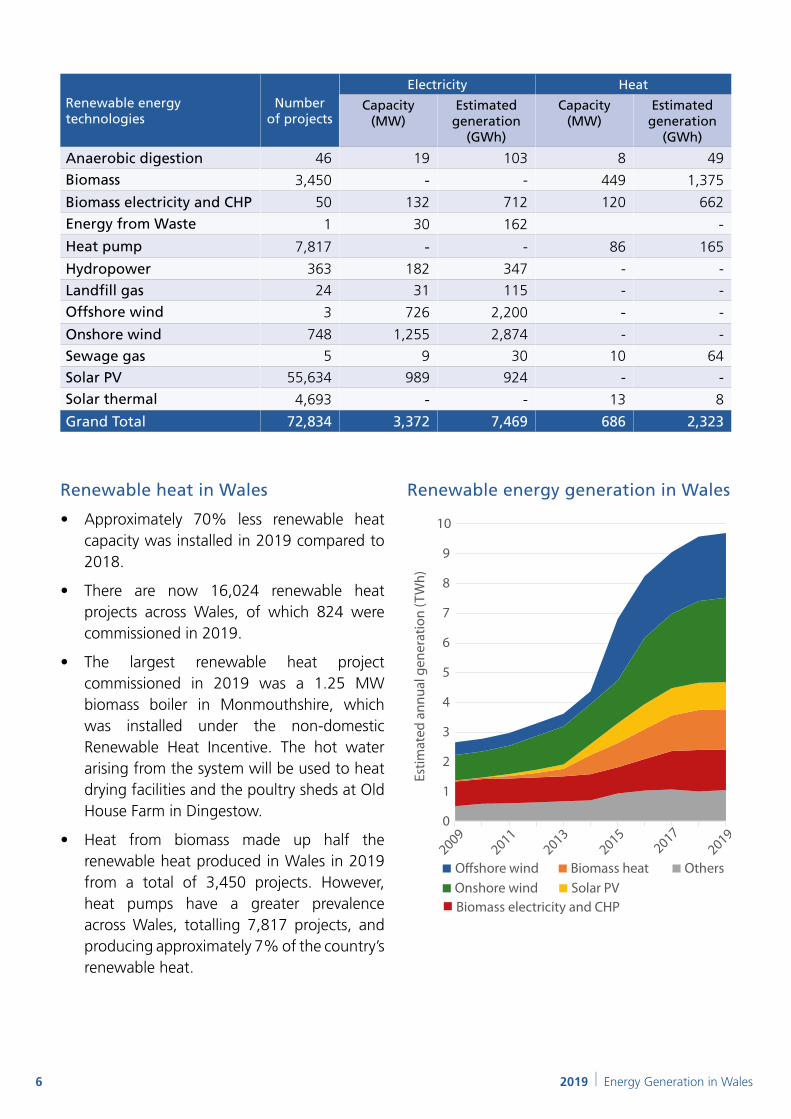
• Approximately 70% less renewable heat capacity was installed in 2019 compared to 2018.
• There are now 16,024 renewable heat projects across Wales, of which 824 were commissioned in 2019.
• The largest renewable heat project commissioned in 2019 was a 1.25 MW biomass boiler in Monmouthshire, which was installed under the non-domestic Renewable Heat Incentive. The hot water arising from the system will be used to heat drying facilities and the poultry sheds at Old House Farm in Dingestow.
• Heat from biomass made up half the renewable heat produced in Wales in 2019 from a total of 3,450 projects. However, heat pumps have a greater prevalence across Wales, totalling 7,817 projects, and producing approximately 7% of the country’s renewable heat.
Renewable energy technologies
Number of projects
Electricity Heat
Capacity (MW)
Estimated generation
(GWh)
Capacity (MW)
Estimated generation
(GWh)
Anaerobic digestion 46 19 103 8 49
Biomass 3,450 - - 449 1,375
Biomass electricity and CHP 50 132 712 120 662
Energy from Waste 1 30 162 - Heat pump 7,817 - - 86 165
Hydropower 363 182 347 - -
Landfill gas 24 31 115 - -
Offshore wind 3 726 2,200 - -
Onshore wind 748 1,255 2,874 - -
Sewage gas 5 9 30 10 64
Solar PV 55,634 989 924 - -
Solar thermal 4,693 - - 13 8
Grand Total 72,834 3,372 7,469 686 2,323
0
1
2
3
4
5
6
7
8
9
10
Estim
ated
ann
ual g
ener
atio
n (T
Wh)
OthersOnshore wind
Biomass heatO�shore wind2009
20112013
20152019
2017
Biomass electricity and CHPSolar PV
Renewable energy generation in Wales
xxx
7 2019 | Energy Generation in Wales
Progress towards targets
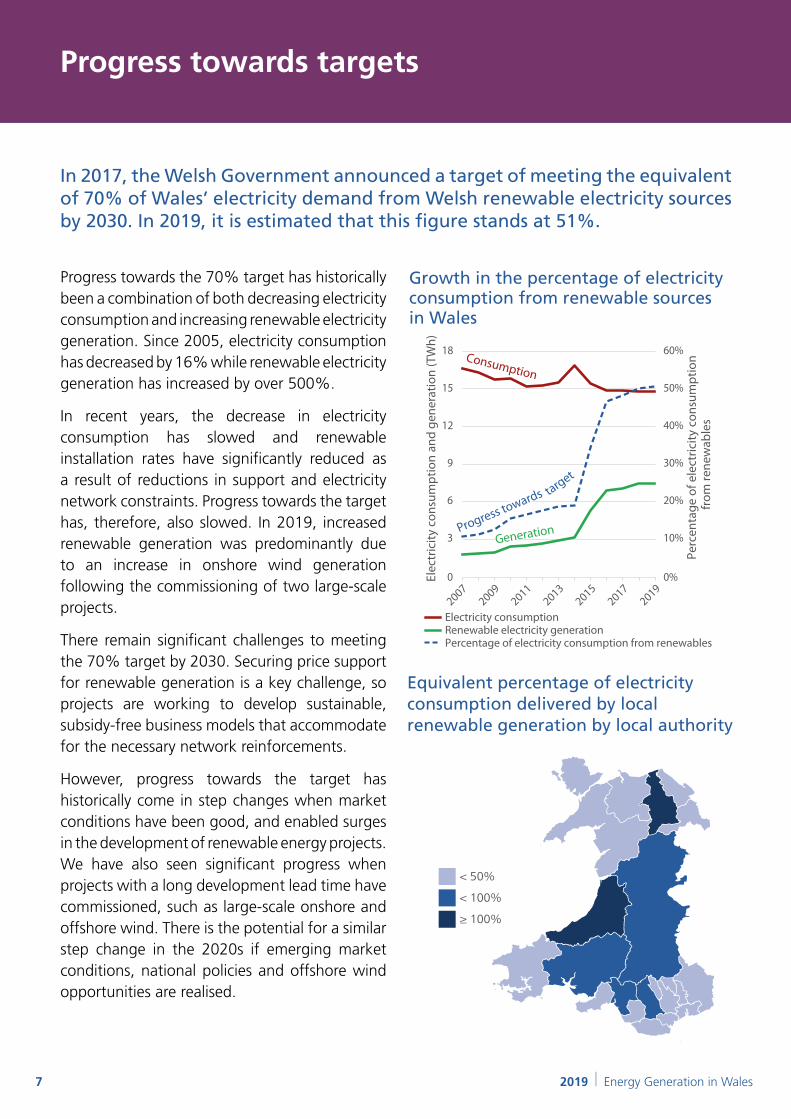
In 2017, the Welsh Government announced a target of meeting the equivalent of 70% of Wales’ electricity demand from Welsh renewable electricity sources by 2030. In 2019, it is estimated that this figure stands at 51%.
Progress towards the 70% target has historically been a combination of both decreasing electricity consumption and increasing renewable electricity generation. Since 2005, electricity consumption has decreased by 16% while renewable electricity generation has increased by over 500%.
In recent years, the decrease in electricity consumption has slowed and renewable installation rates have significantly reduced as a result of reductions in support and electricity network constraints. Progress towards the target has, therefore, also slowed. In 2019, increased renewable generation was predominantly due to an increase in onshore wind generation following the commissioning of two large-scale projects.
There remain significant challenges to meeting the 70% target by 2030. Securing price support for renewable generation is a key challenge, so projects are working to develop sustainable, subsidy-free business models that accommodate for the necessary network reinforcements.
However, progress towards the target has historically come in step changes when market conditions have been good, and enabled surges in the development of renewable energy projects. We have also seen significant progress when projects with a long development lead time have commissioned, such as large-scale onshore and offshore wind. There is the potential for a similar step change in the 2020s if emerging market conditions, national policies and offshore wind opportunities are realised.
Growth in the percentage of electricity consumption from renewable sources in Wales
Equivalent percentage of electricity consumption delivered by local renewable generation by local authority
0%
10%
20%
30%
40%
50%
60%
0
3
6
9
12
15
18
Perc
enta
ge o
f ele
ctric
ity c
onsu
mpt
ion
from
rene
wab
les
Elec
tric
ity c
onsu
mpt
ion
and
gene
ratio
n (T
Wh)
20072009
20132015
20172019
2011
Electricity consumptionRenewable electricity generationPercentage of electricity consumption from renewables
Consumption
target
Progress towards
Generation
< 50%
< 100%
≥ 100%
Renewable Consumption

8 2019 | Energy Generation in Wales
In March 2019, the Welsh Government published ‘Prosperity for All: a Low Carbon Wales’(2). The plan details how Wales intends to meet the first carbon budget (2016-20) and sets the foundations for future action. In April 2019, the Welsh Government declared a Climate Emergency, followed on 1 May by the Senedd becoming the first parliament in the world to pass a Climate Emergency resolution. The Welsh Government has accepted the Committee on Climate Change’s (CCC) 2019 recommendation to increase Wales’ 2050 emissions reduction target to 95%. It is now seeking the advice from the CCC on how this revised target affects Wales’ interim targets for 2030 and 2040, as well as the second carbon budget (2021-25), which were set in legislation in 2018. The Welsh Government has also asked the CCC how Wales might go beyond 95% in 2050. After considering this advice, it will ask the Senedd to amend Wales’ emissions reduction pathway early in 2021.
Growth in the percentage of electricity from renewable sources in Wales
0 %
10 %
20 %
30 %
40 %
50 %
60 %
70 %
80 %
Equi
vale
nt p
erce
ntag
e of
ele
ctric
ity
cons
umpt
ion
from
rene
wab
les
20072010
20112016
2019
Wales’ 2030 70% renewables target
• Since 2005, electricity consumption has fallen by 16% and renewable electricity generation has increased by over 500%.
• Approximately 70% of the increase in renewable electricity generation in the last ten years has been due to large-scale onshore and offshore wind.
• The decommissioning of some biomass electricity and energy from waste plants has affected the total installed capacity of renewable electricity in Wales.
Transforming our energy system whilst building a resilient economy following COVID-19
The world is facing a health and economic crisis as a result of COVID-19. Welsh Government aims to rebuild a stronger economy which supports a fairer, greener and more prosperous society more resilient to economic shock. A creative and comprehensive green recovery will accelerate progress towards a low carbon economy and a healthier, more equal Wales.
The path to reconstruction builds on the foundations in Prosperity for all: the Economic Action Plan (EAP). This shapes an economic development programme investing in people and businesses to drive prosperity, spreading wealth and reducing inequality across all regions of Wales. It builds on Prosperity for All: A Low Carbon Wales, and the wider framework set out in the Well-being of Future Generations (WFG) Act.
The aim is to create a green economy where investment is encouraged in low-carbon, climate resilient infrastructure, renewable energy projects and sustainable homes, where high levels of resources are re-used and waste is avoided. The recovery will focus on developing the potential of regional investment, such as City and Growth Deals, and considering local and regional stimulus packages. Through increased efficiency and displacing fossil fuels with low carbon sources, Wales will create the industries and jobs of the future.
9 2019 | Energy Generation in Wales
The local picture
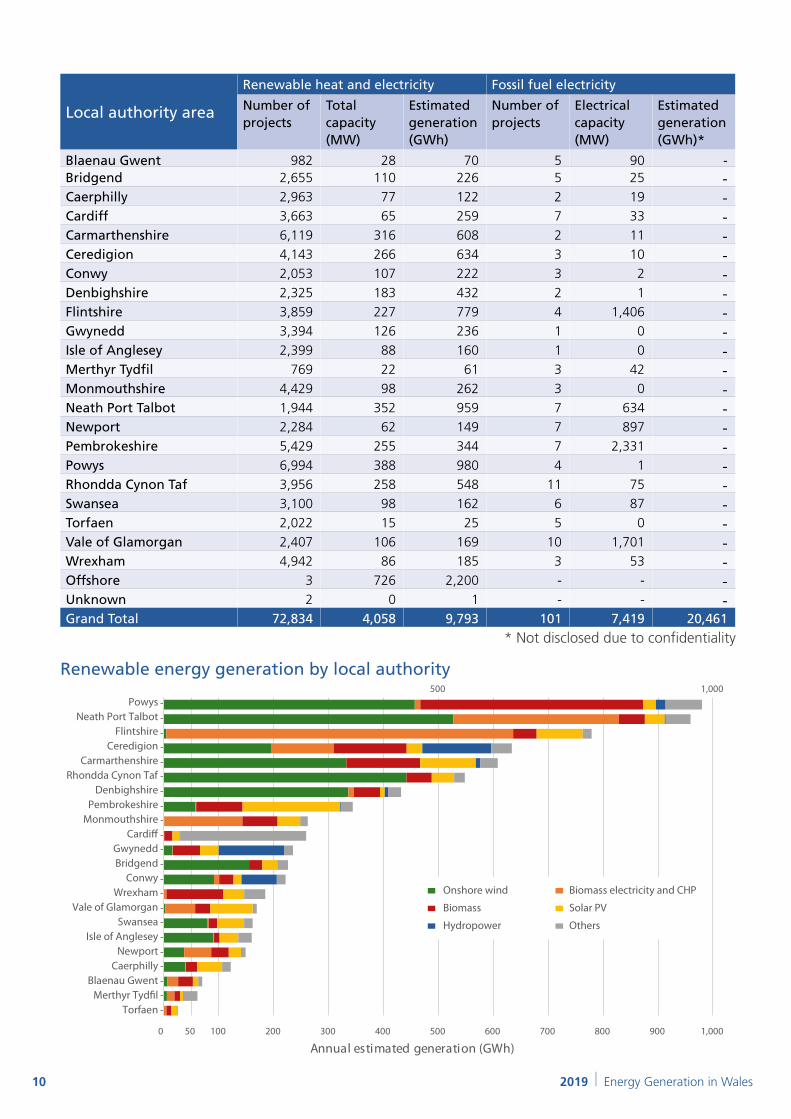
Powys is the local authority area with the greatest installed renewable energy capacity, with a total of 388 MW. Powys also generated the most energy from renewable technologies in 2019, at an estimated 980 GWh.
The remaining local authority areas saw increases in their renewable energy capacity of less than 1% from 2018.
Local authority areaIncrease in renewable
energy capacity
Denbighshire 87%
Swansea 60%
Conwy 30%
Merthyr Tydfil 6%
Gwynedd 2%
Local authority area
Equivalent percentage of electricity consumption
delivered by local renewable generation
Ceredigion 110%
Denbighshire 100%
Powys 91%
Rhondda Cynon Taf 66%
Neath Port Talbot 65%
In 2019, only four local authorities saw an increase greater than 2% in their renewable energy capacity . The vast majority of this increase in these areas can be attributed to new onshore wind projects. The Clocaenog Forest wind farm was largely responsible for the capacity increase for both Denbighshire and Conwy, whilst Swansea’s increase was largely due to the commissioning of the Mynydd y Gwair onshore wind farm. A single turbine commissioned in Methyr Tydfil and another in Flintshire drove the growth in their renewable energy capacity.
Ceredigion is the area with the highest equivalent percentage of its electricity consumption delivered by local renewable electricity generation. This is due to a combination of comparatively low electricity consumption and its diverse and relatively high amount of renewable energy generation.
Local capacity growth
Local consumption and generation
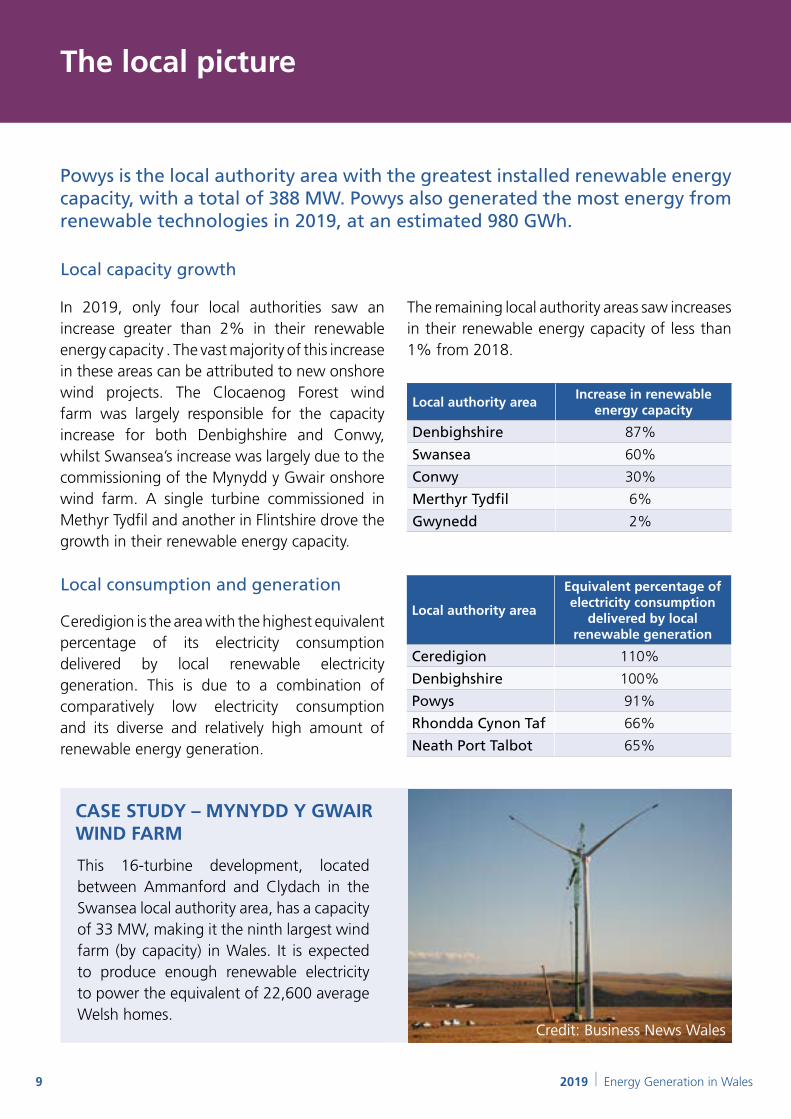
CASE STUDY – MYNYDD Y GWAIR WIND FARM
This 16-turbine development, located between Ammanford and Clydach in the Swansea local authority area, has a capacity of 33 MW, making it the ninth largest wind farm (by capacity) in Wales. It is expected to produce enough renewable electricity to power the equivalent of 22,600 average Welsh homes.
Credit: Business News Wales
10 2019 | Energy Generation in Wales
Local authority area
Renewable heat and electricity Fossil fuel electricity
Number of projects
Total capacity (MW)
Estimated generation (GWh)
Number of projects
Electrical capacity (MW)
Estimated generation (GWh)*
Blaenau Gwent 982 28 70 5 90 - Bridgend 2,655 110 226 5 25 - Caerphilly 2,963 77 122 2 19 - Cardiff 3,663 65 259 7 33 - Carmarthenshire 6,119 316 608 2 11 - Ceredigion 4,143 266 634 3 10 - Conwy 2,053 107 222 3 2 - Denbighshire 2,325 183 432 2 1 - Flintshire 3,859 227 779 4 1,406 - Gwynedd 3,394 126 236 1 0 - Isle of Anglesey 2,399 88 160 1 0 - Merthyr Tydfil 769 22 61 3 42 - Monmouthshire 4,429 98 262 3 0 - Neath Port Talbot 1,944 352 959 7 634 - Newport 2,284 62 149 7 897 - Pembrokeshire 5,429 255 344 7 2,331 - Powys 6,994 388 980 4 1 - Rhondda Cynon Taf 3,956 258 548 11 75 - Swansea 3,100 98 162 6 87 - Torfaen 2,022 15 25 5 0 - Vale of Glamorgan 2,407 106 169 10 1,701 - Wrexham 4,942 86 185 3 53 - Offshore 3 726 2,200 - - - Unknown 2 0 1 - - - Grand Total 72,834 4,058 9,793 101 7,419 20,461
* Not disclosed due to confidentiality2019
0 10050 200 300 400 500
500
600 700 800 900 1,000
1,000
TorfaenMerthyr Tyd�l
Blaenau GwentCaerphilly
NewportIsle of Anglesey
SwanseaVale of Glamorgan
WrexhamConwy
BridgendGwynedd
Cardi�Monmouthshire
PembrokeshireDenbighshire
Rhondda Cynon TafCarmarthenshire
CeredigionFlintshire
Neath Port TalbotPowys
Annual estimated generation (GWh)
Onshore wind Biomass electricity and CHP
Biomass Solar PV
Hydropower Others
Renewable energy generation by local authority

11 2019 | Energy Generation in Wales
Locally owned renewable energy
The Welsh Government has set a target for at least 1 GW of renewable energy capacity to be locally owned by 2030. There is also an expectation for all new energy projects in Wales to have at least an element of local ownership from 2020.
An additional 9 MW of locally owned renewable electricity capacity was commissioned in Wales in 2019, bringing the total to 549 MW. There was also an increase in the capacity of locally owned renewable heat, which rose by 11 MW in 2019 to 276 MW. There is now 825 MW of locally owned renewable energy capacity in Wales, 83% of the way towards the 1 GW target.
Biomass projects make up nearly two thirds of the locally owned heat capacity in Wales, with 95 projects commissioned in 2019. Nearly half of the locally owned renewable electricity capacity is from solar PV, with 936 new installations in 2019, and just over one third is from onshore wind. There were two new locally owned onshore wind projects commissioned in 2019, the 0.7 MW CAREWT1 turbine in Pembrokeshire and the 0.5 MW turbine installed at Ffwrd Farm in Ceredigion.
In 2019, 1,729 new locally owned renewable energy projects were installed; 54% of these were solar PV projects, 38% were heat pumps, 5% were biomass projects and the remaining 2% was a mix of other renewable technologies.
Locally owned renewable electricity and heat capacity by ownership type
Locally owned renewable energy generation by technology
Onshore
wind
Biomass
Heatpump
Biomasselectricity and CHP
Others
Other
s
SolarPV
Heat Electrical
Heat capacityElectrical capacity
0
50
100
150
200
250
300
Inst
alle
d ca
paci
ty (M
W)
Housing asso
ciation
Local Auth
ority
Other p
ublic se
ctor a
nd charity
Community
Farms a
nd Estates
Local busin
ess
Domestic
12 2019 | Energy Generation in Wales
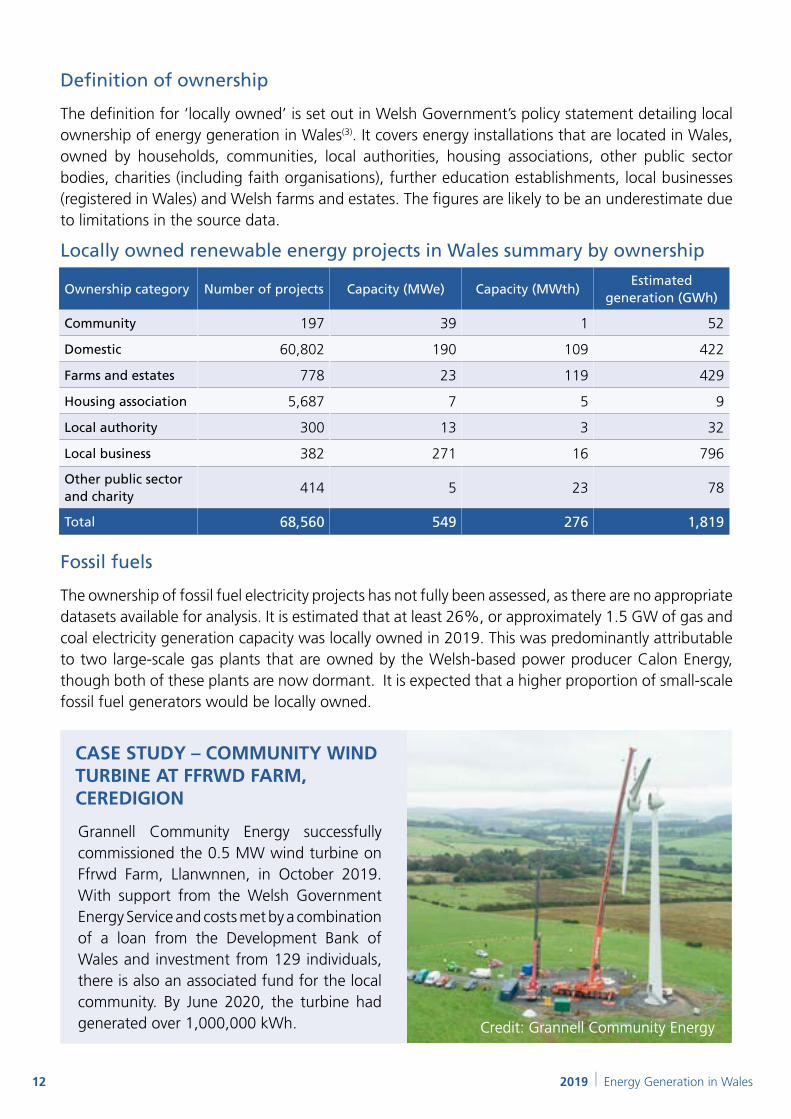
Definition of ownership
The definition for ‘locally owned’ is set out in Welsh Government’s policy statement detailing local ownership of energy generation in Wales(3). It covers energy installations that are located in Wales, owned by households, communities, local authorities, housing associations, other public sector bodies, charities (including faith organisations), further education establishments, local businesses (registered in Wales) and Welsh farms and estates. The figures are likely to be an underestimate due to limitations in the source data.
Locally owned renewable energy projects in Wales summary by ownership
Ownership category Number of projects Capacity (MWe) Capacity (MWth)Estimated
generation (GWh)
Community 197 39 1 52
Domestic 60,802 190 109 422
Farms and estates 778 23 119 429
Housing association 5,687 7 5 9
Local authority 300 13 3 32
Local business 382 271 16 796
Other public sector and charity
414 5 23 78
Total 68,560 549 276 1,819
Fossil fuels
The ownership of fossil fuel electricity projects has not fully been assessed, as there are no appropriate datasets available for analysis. It is estimated that at least 26%, or approximately 1.5 GW of gas and coal electricity generation capacity was locally owned in 2019. This was predominantly attributable to two large-scale gas plants that are owned by the Welsh-based power producer Calon Energy, though both of these plants are now dormant. It is expected that a higher proportion of small-scale fossil fuel generators would be locally owned.
CASE STUDY – COMMUNITY WIND TURBINE AT FFRWD FARM, CEREDIGION
Grannell Community Energy successfully commissioned the 0.5 MW wind turbine on Ffrwd Farm, Llanwnnen, in October 2019. With support from the Welsh Government Energy Service and costs met by a combination of a loan from the Development Bank of Wales and investment from 129 individuals, there is also an associated fund for the local community. By June 2020, the turbine had generated over 1,000,000 kWh. Credit: Grannell Community Energy

13 2019 | Energy Generation in Wales
Low carbon technologies
2019 | Energy Generation in Wales13
14 2019 | Energy Generation in Wales
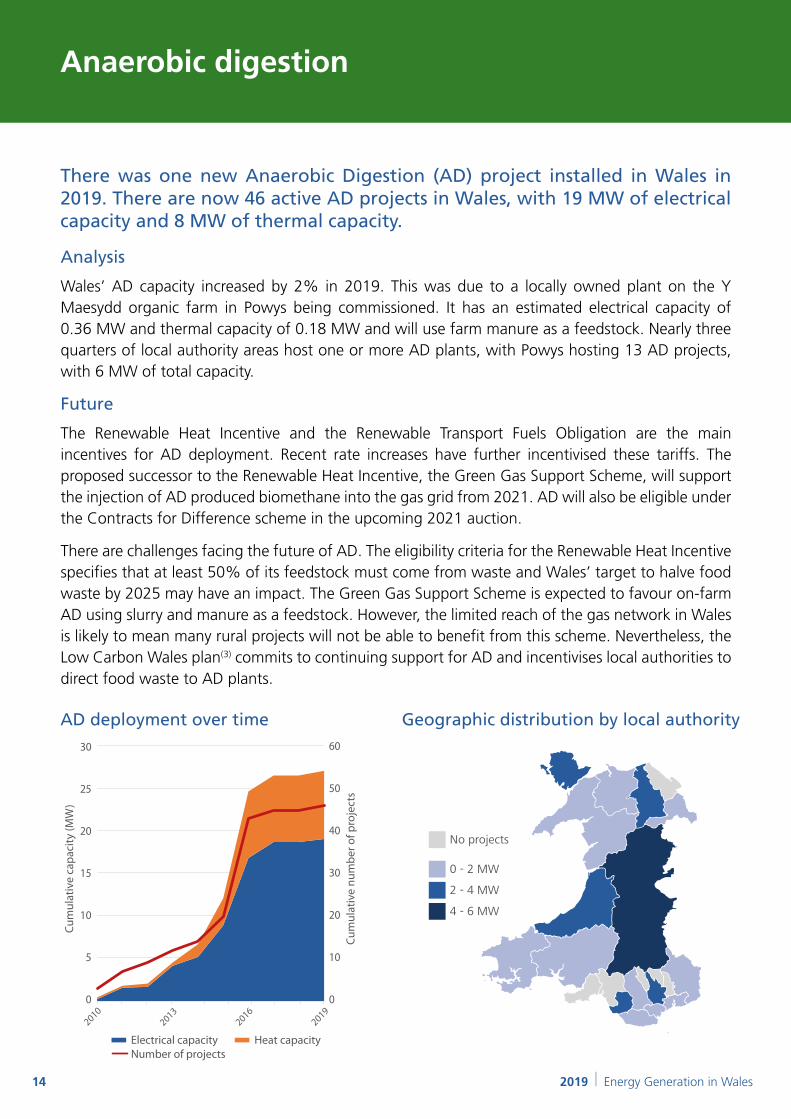
Anaerobic digestion
Analysis
Wales’ AD capacity increased by 2% in 2019. This was due to a locally owned plant on the Y Maesydd organic farm in Powys being commissioned. It has an estimated electrical capacity of 0.36 MW and thermal capacity of 0.18 MW and will use farm manure as a feedstock. Nearly three quarters of local authority areas host one or more AD plants, with Powys hosting 13 AD projects, with 6 MW of total capacity.
There was one new Anaerobic Digestion (AD) project installed in Wales in 2019. There are now 46 active AD projects in Wales, with 19 MW of electrical capacity and 8 MW of thermal capacity.
AD deployment over time
0
10
20
30
40
50
60
0
5
10
15
20
25
Cum
ulat
ive
capa
city
(MW
)
Cum
ulat
ive
num
ber o
f pro
ject
s
20132016
Electrical capacityNumber of projects
Heat capacity
30
20192010
Future
The Renewable Heat Incentive and the Renewable Transport Fuels Obligation are the main incentives for AD deployment. Recent rate increases have further incentivised these tariffs. The proposed successor to the Renewable Heat Incentive, the Green Gas Support Scheme, will support the injection of AD produced biomethane into the gas grid from 2021. AD will also be eligible under the Contracts for Difference scheme in the upcoming 2021 auction.
There are challenges facing the future of AD. The eligibility criteria for the Renewable Heat Incentive specifies that at least 50% of its feedstock must come from waste and Wales’ target to halve food waste by 2025 may have an impact. The Green Gas Support Scheme is expected to favour on-farm AD using slurry and manure as a feedstock. However, the limited reach of the gas network in Wales is likely to mean many rural projects will not be able to benefit from this scheme. Nevertheless, the Low Carbon Wales plan(3) commits to continuing support for AD and incentivises local authorities to direct food waste to AD plants.
No projects
0 - 2 MW
2 - 4 MW
4 - 6 MW
Anerobic DigestionGeographic distribution by local authority
15 2019 | Energy Generation in Wales
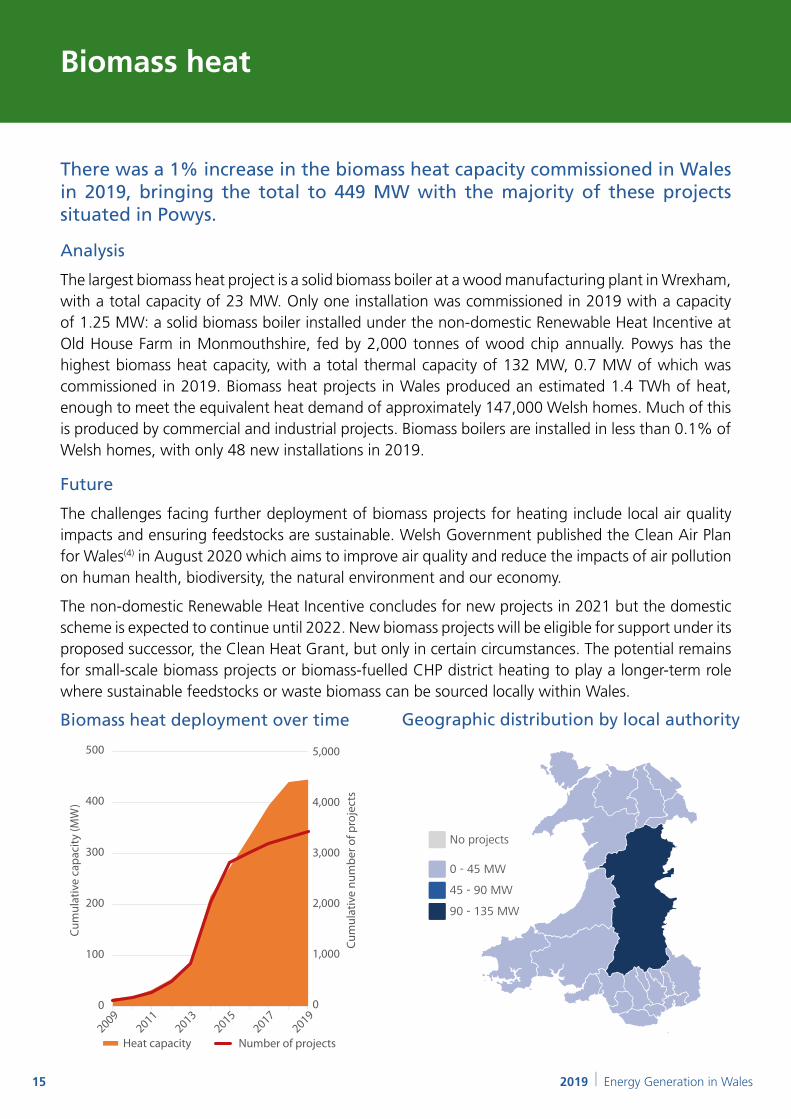
Biomass heat
There was a 1% increase in the biomass heat capacity commissioned in Wales in 2019, bringing the total to 449 MW with the majority of these projects situated in Powys.
Biomass heat deployment over time
Analysis
The largest biomass heat project is a solid biomass boiler at a wood manufacturing plant in Wrexham, with a total capacity of 23 MW. Only one installation was commissioned in 2019 with a capacity of 1.25 MW: a solid biomass boiler installed under the non-domestic Renewable Heat Incentive at Old House Farm in Monmouthshire, fed by 2,000 tonnes of wood chip annually. Powys has the highest biomass heat capacity, with a total thermal capacity of 132 MW, 0.7 MW of which was commissioned in 2019. Biomass heat projects in Wales produced an estimated 1.4 TWh of heat, enough to meet the equivalent heat demand of approximately 147,000 Welsh homes. Much of this is produced by commercial and industrial projects. Biomass boilers are installed in less than 0.1% of Welsh homes, with only 48 new installations in 2019.
Cum
ulat
ive
capa
city
(MW
)
Cum
ulat
ive
num
ber o
f pro
ject
s
Heat capacity
1,000
2,000
3,000
4,000
5,000
0
100
200
300
400
500
0
20092011
20152017
20192013
Number of projects
Future
The challenges facing further deployment of biomass projects for heating include local air quality impacts and ensuring feedstocks are sustainable. Welsh Government published the Clean Air Plan for Wales(4) in August 2020 which aims to improve air quality and reduce the impacts of air pollution on human health, biodiversity, the natural environment and our economy.
The non-domestic Renewable Heat Incentive concludes for new projects in 2021 but the domestic scheme is expected to continue until 2022. New biomass projects will be eligible for support under its proposed successor, the Clean Heat Grant, but only in certain circumstances. The potential remains for small-scale biomass projects or biomass-fuelled CHP district heating to play a longer-term role where sustainable feedstocks or waste biomass can be sourced locally within Wales.
Geographic distribution by local authority
No projects
0 - 45 MW
45 - 90 MW
90 - 135 MW
Biomass
16 2019 | Energy Generation in Wales
Heat pumps
Analysis
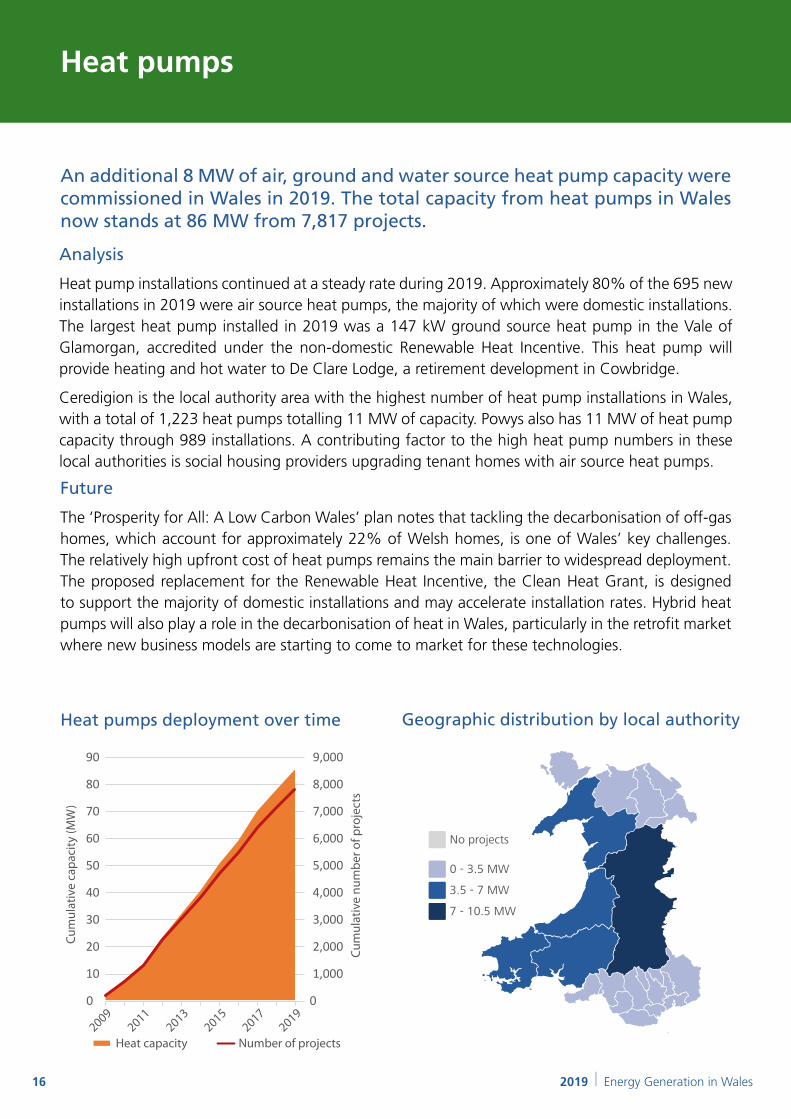
Heat pump installations continued at a steady rate during 2019. Approximately 80% of the 695 new installations in 2019 were air source heat pumps, the majority of which were domestic installations. The largest heat pump installed in 2019 was a 147 kW ground source heat pump in the Vale of Glamorgan, accredited under the non-domestic Renewable Heat Incentive. This heat pump will provide heating and hot water to De Clare Lodge, a retirement development in Cowbridge.
Ceredigion is the local authority area with the highest number of heat pump installations in Wales, with a total of 1,223 heat pumps totalling 11 MW of capacity. Powys also has 11 MW of heat pump capacity through 989 installations. A contributing factor to the high heat pump numbers in these local authorities is social housing providers upgrading tenant homes with air source heat pumps.
An additional 8 MW of air, ground and water source heat pump capacity were commissioned in Wales in 2019. The total capacity from heat pumps in Wales now stands at 86 MW from 7,817 projects.
0
1,000
2,000
3,000
4,000
5,000
6,000
7,000
8,000
9,000
0
10
20
30
40
50
60
70
80
90
Heat capacity
Cum
ulat
ive
capa
city
(MW
)
Cum
ulat
ive
num
ber o
f pro
ject
s
Number of projects2009
20112015
20172019
2013
Future
The ‘Prosperity for All: A Low Carbon Wales’ plan notes that tackling the decarbonisation of off-gas homes, which account for approximately 22% of Welsh homes, is one of Wales’ key challenges. The relatively high upfront cost of heat pumps remains the main barrier to widespread deployment. The proposed replacement for the Renewable Heat Incentive, the Clean Heat Grant, is designed to support the majority of domestic installations and may accelerate installation rates. Hybrid heat pumps will also play a role in the decarbonisation of heat in Wales, particularly in the retrofit market where new business models are starting to come to market for these technologies.
No projects
0 - 3.5 MW
3.5 - 7 MW
7 - 10.5 MW
Heat PumpHeat pumps deployment over time Geographic distribution by local authority

17 2019 | Energy Generation in Wales
Hydropower
AnalysisThere were only five new projects commissioned in 2019, compared to six in 2018. These new projects increased the total hydropower capacity by less than 0.2% between 2018 and 2019.
Gwynedd remains the local authority area with the greatest number of hydropower projects in Wales, with 144 projects totalling 59 MW. However, due to hosting Wales’ largest hydropower project, Rheidol Power Station, Ceredigion has the greatest hydropower capacity with just under 71 MW across 26 projects. Rheidol Power Station was commissioned in 1964 and has a capacity of approximately 56 MW.
Hydropower capacity in Wales increased by 264 kW in 2019, to a total of 182 MW from 363(5) projects. It’s estimated that over 347 GWh is generated annually from Welsh hydropower projects, over half of which is generated by the three largest projects. The largest project commissioned in 2019 was the 85 kW Ffridd Uchaf project in Gwynedd.
Electrical capacity Number of projects2001
20072009
20112013
20152017
20192005
2003 0
50
100
150
200
250
300
350
400
0
20
40
60
80
100
120
140
160
180
200
Cum
ulat
ive
num
ber o
f pro
ject
s
Cum
ulat
ive
capa
city
(MW
)
Future
Hydropower is a mature and proven technology that can provide a predictable source of energy. However, the relatively high upfront cost and a lack of cost reduction potential is likely to limit future growth without support.
With the closure of the Feed-in Tariff, the Renewables Obligation in 2017, and hydropower not presently being eligible for Contracts for Difference, there is now no existing or planned tariff support for hydropower. The 2017 revaluation of business rates also impacted the sector, with many schemes seeing a large increase in their rateable value. The Welsh Government has provided some grant support to the sector for payment of business rates.
No projects
0 - 25 MW
25 - 50 MW
50 - 75 MW
HydroDeployment of hydropower over time Geographic distribution by local authority

18 2019 | Energy Generation in Wales
Future
Offshore wind has been a success story across the UK and the reduction in price has accelerated as the technology has matured.
There are strong prospects for offshore wind in Wales and significant potential to deploy both fixed and floating offshore wind. Currently, the majority of the UK’s offshore wind farms are located in the North Sea and unlocking sites off the Welsh coast will be essential to security of supply by taking advantage of the different weather patterns around the UK coast. The fourth round of seabed leasing was recently confirmed with the opportunity for an additional 7 GW of new projects in English and Welsh waters and includes a development area focusing on the North Wales region. This round is due to conclude by spring 2022.
The Crown Estate has recently granted seabed rights for a 576 MW extension to the Gywnt y Môr wind farm. Due to be operational in 2030 this will be known as Awel y Môr. The Crown Estate has also recently awarded the rights for a 96 MW floating wind demonstration project 45 km off the south Pembrokeshire Coast to Blue Gem Wind Ltd. This will be the first floating wind farm in Welsh waters and construction is expected to conclude by 2027. This could be the first in a series of projects in the Celtic Sea aimed at maximising local supply chain content. The key challenge to unlock the potential of Welsh
offshore wind sites is ensuring the associated infrastructure, including grid availability, is capable of supporting this technology and a suitable seabed leasing process is in place. Ports will play a significant role in capturing supply chain benefits and investment in Welsh ports will maximise the potential scale of floating wind in the Celtic Sea. Wave and tidal stream technologies are being tested in Wales, with the long term aspiration that our two demonstration zones, the West Anglesey Demonstration Zone and the South Pembrokeshire Demonstration Zone, will enable developers to test prototype and proven technologies.
Offshore wind
Analysis
The Crown Estate’s first leasing round led to the development of the North Hoyle and Rhyl Flats projects in 2003 and 2009 respectively, which have a combined capacity of 150 MW. Gywnt y Môr was developed in the second leasing round and commissioned in 2015. With a capacity of 576 MW from 160 turbines, Gywnt y Môr is one of the world’s top ten largest offshore wind farms.
There are three offshore wind projects in Wales, all in Liverpool Bay off the North Wales coast, with a total capacity of 726 MW.
Geographic distribution
Gwynt y Mor
Rhyl FlatsNorth Hoyle
Gwynt y Mor extension

19 2019 | Energy Generation in Wales
Onshore wind
Welsh onshore wind capacity continued to increase in 2019, with an additional 133 MW deployed across 7 local authority areas. This brings the total onshore wind capacity in Wales to 1.25 GW, a 12% increase from 2018.
Electrical capacity Number of projects
20092011
20152017
20192013
20012003
20072005
0
100
200
300
400
500
600
700
800
0
200
400
600
800
1,000
1,200
1,400
1,600
Cum
ula�
ve n
umbe
r of p
roje
cts
Cum
ula�
ve c
apac
ity (M
W)
Analysis
Two new large-scale projects accounted for the majority of the capacity increase in 2019: the 96 MW Clocaenog Forest Wind Farm situated on the Welsh Government Woodland Estate on the border of Denbighshire and Conwy, and the 32.8 MW Mynydd Y Gwair Wind Farm in Swansea. Five further projects delivered the remaining 3.9 MW, two of which are community owned; the CAREWT1 development in Pembrokeshire and the Ffrwd Farm turbine in Ceredigion. Approximately 10 MW of the 187 MW of locally owned onshore wind in Wales is community owned. Neath Port Talbot has the highest capacity of onshore wind, with a total of 230 MW. Nearly two thirds of this capacity is from the Pen y Cymoedd wind farm which is situated on the border of Neath Port Talbot and Rhondda Cynon Taf.
Future
With a supportive planning environment and strong wind resources, Wales has significant potential for further onshore wind development. The major barrier continues to be the geographical disparity between developable areas and suitable network infrastructure. The future of onshore wind will be influenced by the Welsh Government’s planning policy and spatial guidance. Some projects may bid under the Contracts for Difference auctions. However, there is increasing developer confidence about the feasibility of subsidy-free projects. The draft National Development Framework sets out the future planning framework and identifies areas for onshore wind. It was laid for scrutiny in the Senedd in September and is due for publication in Spring 2021. There is the potential for subsidy-free projects and it is likely that Wales will be one of the first areas to see these developments.
No projects
0 - 80 MW
80 - 160 MW
160 - 240 MW
Onshore WindOnshore wind deployment over time Geographic distribution by local authority
20 2019 | Energy Generation in Wales
Solar PV
Analysis
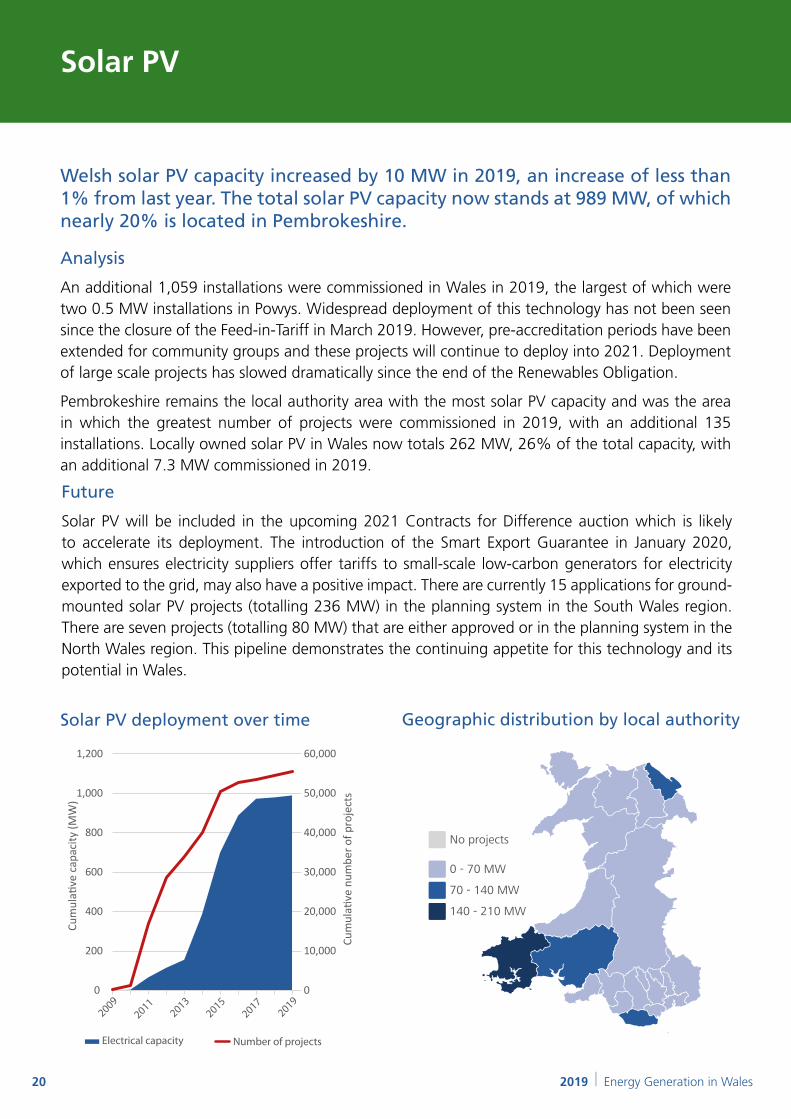
An additional 1,059 installations were commissioned in Wales in 2019, the largest of which were two 0.5 MW installations in Powys. Widespread deployment of this technology has not been seen since the closure of the Feed-in-Tariff in March 2019. However, pre-accreditation periods have been extended for community groups and these projects will continue to deploy into 2021. Deployment of large scale projects has slowed dramatically since the end of the Renewables Obligation.
Pembrokeshire remains the local authority area with the most solar PV capacity and was the area in which the greatest number of projects were commissioned in 2019, with an additional 135 installations. Locally owned solar PV in Wales now totals 262 MW, 26% of the total capacity, with an additional 7.3 MW commissioned in 2019.
Welsh solar PV capacity increased by 10 MW in 2019, an increase of less than 1% from last year. The total solar PV capacity now stands at 989 MW, of which nearly 20% is located in Pembrokeshire.
Number of projectsElectrical capacity
20092013
20152017
20192011
0
10,000
20,000
30,000
40,000
50,000
60,000
0
200
400
600
800
1,000
1,200
Cum
ula�
ve n
umbe
r of p
roje
cts
Cum
ula�
ve c
apac
ity (M
W)
Future
Solar PV will be included in the upcoming 2021 Contracts for Difference auction which is likely to accelerate its deployment. The introduction of the Smart Export Guarantee in January 2020, which ensures electricity suppliers offer tariffs to small-scale low-carbon generators for electricity exported to the grid, may also have a positive impact. There are currently 15 applications for ground-mounted solar PV projects (totalling 236 MW) in the planning system in the South Wales region. There are seven projects (totalling 80 MW) that are either approved or in the planning system in the North Wales region. This pipeline demonstrates the continuing appetite for this technology and its potential in Wales.
No projects
0 - 70 MW
70 - 140 MW
140 - 210 MW
Solar PVSolar PV deployment over time Geographic distribution by local authority

xxx
21 2019 | Energy Generation in Wales2019 | Energy Generation in Wales21
Fossil fuels

22 2019 | Energy Generation in Wales
Future
The closure of Aberthaw Power Station in March 2020 means that energy generation in Wales is coal-free five years ahead of the UK-wide target of 2025. In July 2020, the Minister for Environment, Energy and Rural Affairs launched a consultation on Welsh Government’s draft coal policy to inform decisions taken on coal in Wales, to support action towards climate change and broader wellbeing aims.
Gas generation in Wales is increasingly changing from providing a steady, baseload supply to a more flexible peaking and backup role. There may be a role to play for small, reciprocating CHP plants which can respond quickly to market signals and provide flexibility to the network .
The key challenge facing diesel generation is the Medium Combustion Plant Directive which prevents unabated large-scale diesel generators being developed and operated. However, small-scale diesel plant may still have a role for backup generation to critical infrastructure in Wales.
The role of fossil fuels in the future energy mix of Wales should be considered in light of the Welsh Government’s policy objective to avoid the continued extraction and consumption of fossil fuels.
Fossil fuel electricity generation
Analysis
Electricity generation capacity from fossil fuels remained the same in 2019 as it was in 2018. The largest of the gas power plants is situated in Pembrokeshire, the diesel generators are geographically spread across Wales and there was a single coal power station, Aberthaw, in the Vale of Glamorgan, which has now closed.
Following the decommissioning of the Barry Combined Cycle Gas Turbine (CCGT) power station in March 2019, the four remaining gas plants made up 85% of total gas power capacity in 2019; Pembroke, Connah’s Quay, Severn Power (now dormant) and Baglan Bay. Wales also has approximately 814 MW of small-scale (<100 MW) fossil fuel electrical capacity, which includes diesel generators, CHP projects, open cycle gas turbines and gas reciprocating engine sites.
Fossil fuel electricity generation
Fossil fuel generation in Wales in 2019 had a total capacity of 7.4 GW from three fuel sources: 1.6 GW of coal, 0.2 GW of diesel generation and 5.6 GW of gas power.
20092011
20132019
Coal Gas
20152017
0
5
10
15
20
25
30
35
Cum
ulat
ive
gene
ratio
n (T
Wh)

23 2019 | Energy Generation in Wales
Storage
2019 | Energy Generation in Wales23

24 2019 | Energy Generation in Wales
Battery Storage
Analysis
Although no large-scale projects were commissioned in 2019, a survey of leading small-scale battery installers in Wales suggests that, to date, there have been a total of at least 290 domestic and small-scale commercial battery storage installations in Wales, comprising nearly 3.3 MWh of storage. This represents an increase of 0.6 MWh since 2018.
No large-scale battery storage projects were developed in Wales in 2019. The two existing large-scale battery storage projects were developed in 2018: the 4.3 MW Cenin Renewables’ Parc Stormy storage project in Bridgend and the 22 MW Pen y Cymoedd Energy Storage project in Neath Port Talbot.
Future
Electricity storage solutions, and batteries in particular, will become increasingly important as renewable energy generation proliferates. They provide an economical solution to address the issues of flexibility and balancing. The cost of lithium ion batteries has decreased significantly, meaning they are now comparative to gas peaking plants for short duration network services. However, there are a number of challenges facing further deployment which include saturated markets, reducing market values and regulatory changes.
The limited deployment in Wales to date is partially due to a constraint on the National Grid transmission network in South Wales, which prevents new battery storage projects above 1 MW from connecting until 2026. However, batteries can provide mitigation against network constraints when co-located and co-operated alongside renewable energy generation. The UK Government’s proposed extension to the negative pricing rule in the upcoming 2021 Contracts for Difference auction may encourage this.
There is currently a pipeline of 355 MW(6) of battery storage projects applying for a grid connection in Wales.
Battery@PyC
Parc Stormy
Geographical distribution of large-scale battery storage projects

25 2019 | Energy Generation in Wales25 2019 | Energy Generation in Wales
26 2019 | Energy Generation in Wales
Reference pages
26 2019 | Energy Generation in Wales
Data tables ............................................ 28
Methodology ......................................... 31
Assumptions and references .................. 32
Abbreviations and definitions ................. 33
xxx
27 2019 | Energy Generation in Wales
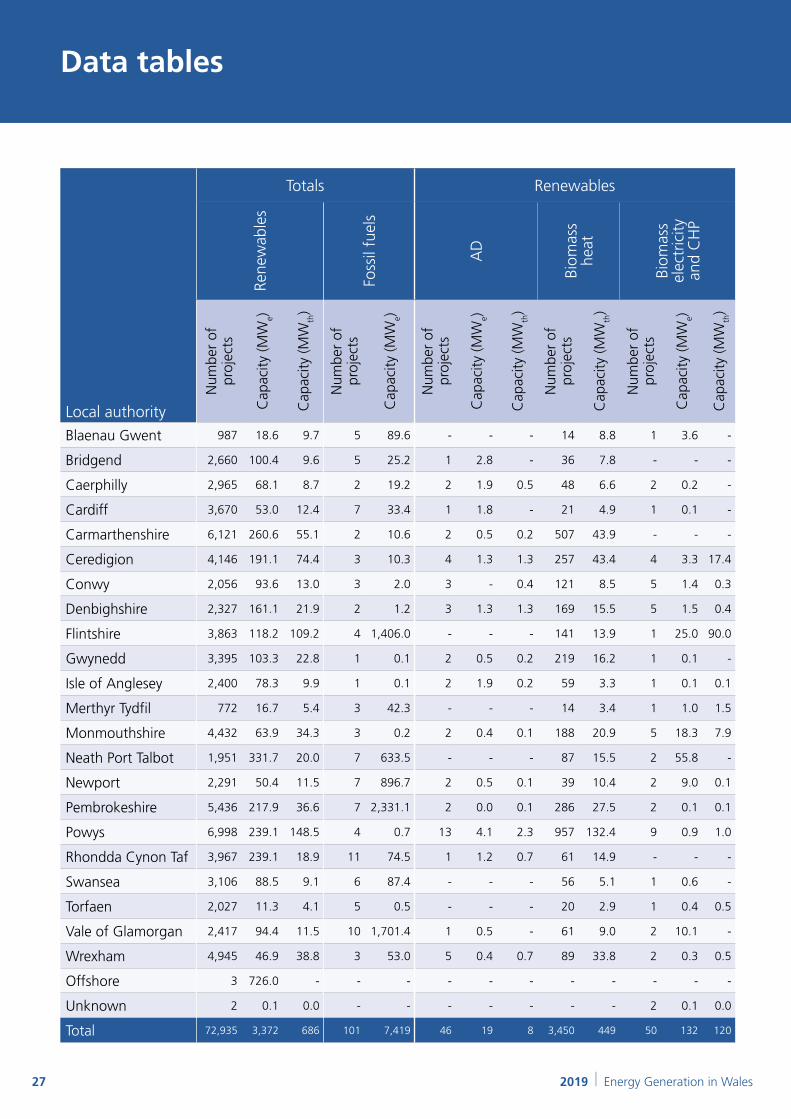
Data tables
Local authority
Totals Renewables
Rene
wab
les
Foss
il fu
els
AD
Biom
ass
heat
Biom
ass
elec
tric
ity
and
CH
P
Num
ber
of
proj
ects
Cap
acity
(MW
e)
Cap
acity
(MW
th)
Num
ber
of
proj
ects
Cap
acity
(MW
e)
Num
ber
of
proj
ects
Cap
acity
(MW
e)
Cap
acity
(MW
th)
Num
ber
of
proj
ects
Cap
acity
(MW
th)
Num
ber
of
proj
ects
Cap
acity
(MW
e)
Cap
acity
(MW
th)
Blaenau Gwent 987 18.6 9.7 5 89.6 - - - 14 8.8 1 3.6 -
Bridgend 2,660 100.4 9.6 5 25.2 1 2.8 - 36 7.8 - - -
Caerphilly 2,965 68.1 8.7 2 19.2 2 1.9 0.5 48 6.6 2 0.2 -
Cardiff 3,670 53.0 12.4 7 33.4 1 1.8 - 21 4.9 1 0.1 -
Carmarthenshire 6,121 260.6 55.1 2 10.6 2 0.5 0.2 507 43.9 - - -
Ceredigion 4,146 191.1 74.4 3 10.3 4 1.3 1.3 257 43.4 4 3.3 17.4
Conwy 2,056 93.6 13.0 3 2.0 3 - 0.4 121 8.5 5 1.4 0.3
Denbighshire 2,327 161.1 21.9 2 1.2 3 1.3 1.3 169 15.5 5 1.5 0.4
Flintshire 3,863 118.2 109.2 4 1,406.0 - - - 141 13.9 1 25.0 90.0
Gwynedd 3,395 103.3 22.8 1 0.1 2 0.5 0.2 219 16.2 1 0.1 -
Isle of Anglesey 2,400 78.3 9.9 1 0.1 2 1.9 0.2 59 3.3 1 0.1 0.1
Merthyr Tydfil 772 16.7 5.4 3 42.3 - - - 14 3.4 1 1.0 1.5
Monmouthshire 4,432 63.9 34.3 3 0.2 2 0.4 0.1 188 20.9 5 18.3 7.9
Neath Port Talbot 1,951 331.7 20.0 7 633.5 - - - 87 15.5 2 55.8 -
Newport 2,291 50.4 11.5 7 896.7 2 0.5 0.1 39 10.4 2 9.0 0.1
Pembrokeshire 5,436 217.9 36.6 7 2,331.1 2 0.0 0.1 286 27.5 2 0.1 0.1
Powys 6,998 239.1 148.5 4 0.7 13 4.1 2.3 957 132.4 9 0.9 1.0
Rhondda Cynon Taf 3,967 239.1 18.9 11 74.5 1 1.2 0.7 61 14.9 - - -
Swansea 3,106 88.5 9.1 6 87.4 - - - 56 5.1 1 0.6 -
Torfaen 2,027 11.3 4.1 5 0.5 - - - 20 2.9 1 0.4 0.5
Vale of Glamorgan 2,417 94.4 11.5 10 1,701.4 1 0.5 - 61 9.0 2 10.1 -
Wrexham 4,945 46.9 38.8 3 53.0 5 0.4 0.7 89 33.8 2 0.3 0.5
Offshore 3 726.0 - - - - - - - - - - -
Unknown 2 0.1 0.0 - - - - - - - 2 0.1 0.0
Total 72,935 3,372 686 101 7,419 46 19 8 3,450 449 50 132 120

Data tables
28
Local authority
Renewables
Ener
gy f
rom
w
aste
Hea
t pu
mps
Hyd
ropo
wer
Land
fill g
as
Off
shor
e w
ind
Ons
hore
w
ind
Num
ber
of
proj
ects
Cap
acity
(MW
e)
Num
ber
of
proj
ects
Cap
acity
(MW
th)
Num
ber
of
proj
ects
Cap
acity
(MW
e)
Num
ber
of
proj
ects
Cap
acity
(MW
e)
Num
ber
of
proj
ects
Cap
acity
(MW
e)
Num
ber
of
proj
ects
Cap
acity
(MW
e)
Blaenau Gwent - - 45 0.4 1 0.0 1 1.6 - - 7 2.9
Bridgend - - 149 1.3 3 0.0 1 0.3 - - 15 67.7
Caerphilly - - 85 0.9 - - - - - - 21 17.2
Cardiff 1 30.0 179 2.1 1 0.4 2 2.3 - - 3 0.1
Carmarthenshire - - 899 10.1 13 4.7 1 2.0 - - 113 145.1
Ceredigion - - 1,223 11.3 26 70.8 - - - - 78 85.2
Conwy - - 223 2.8 30 34.9 1 2.0 - - 40 39.9
Denbighshire - - 325 4.3 20 2.3 - - - - 39 146.7
Flintshire - - 470 4.8 - - 2 1.3 - - 17 1.9
Gwynedd - - 553 6.0 144 59.4 2 0.2 - - 36 6.9
Isle of Anglesey - - 501 5.8 - - 1 0.3 - - 49 39.4
Merthyr Tydfil - - 36 0.5 4 0.2 2 6.3 - - 5 2.4
Monmouthshire - - 468 5.2 11 0.2 - - - - 10 0.3
Neath Port Talbot - - 110 1.1 10 0.5 2 3.4 - - 12 230.1
Newport - - 58 0.8 - - 1 1.0 - - 11 16.1
Pembrokeshire - - 653 7.2 14 0.5 1 1.5 - - 149 25.2
Powys - - 989 11.0 79 7.9 1 2.0 - - 118 199.4
Rhondda Cynon Taf - - 149 1.7 4 0.2 2 1.1 - - 12 193.0
Swansea - - 225 2.8 2 0.1 1 0.8 - - 5 34.2
Torfaen - - 60 0.7 1 0.0 - - - - 3 0.0
Vale of Glamorgan - - 195 2.3 - - - - - - 6 1.1
Wrexham - - 222 2.3 - - 3 4.4 - - 1 0.0
Offshore - - - - - - - - 3 726.0 - -
Unknown - - - - - - - - - - - -
Total 1 30 7,817 86 363 182 24 31 3 726 748 1,255
2019 | Energy Generation in Wales
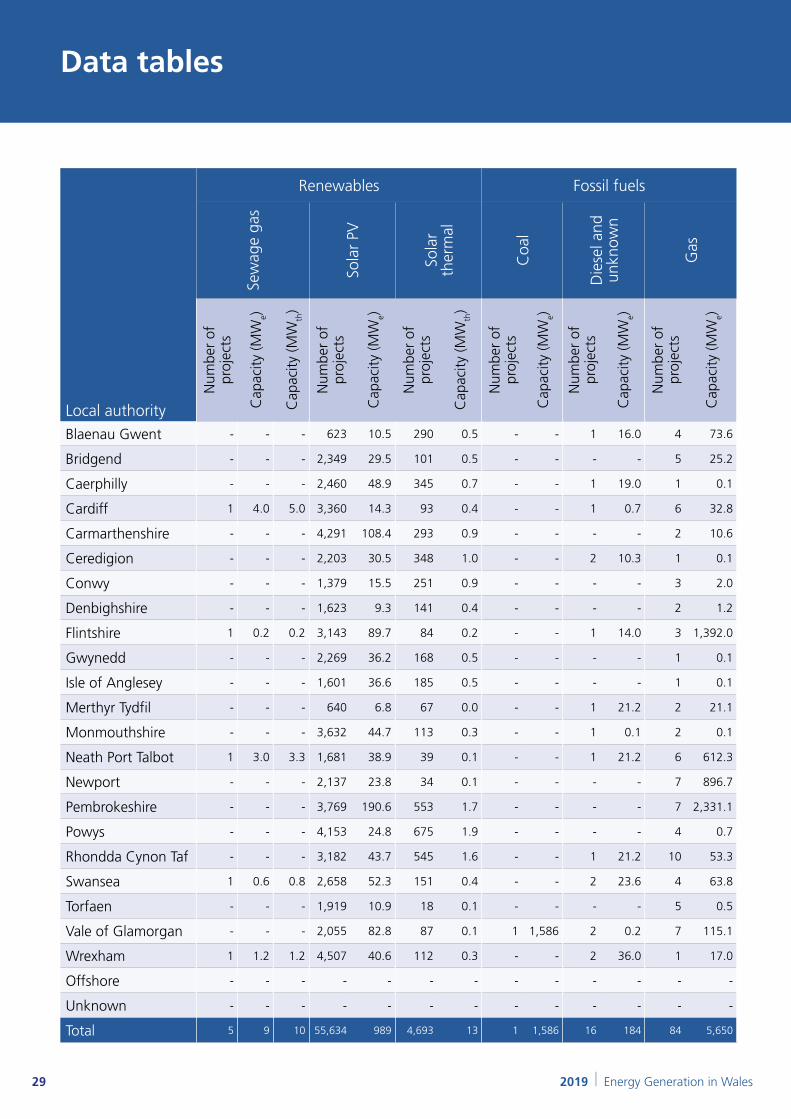
Data tables
29
Local authority
Renewables Fossil fuels
Sew
age
gas
Sola
r PV
Sola
r th
erm
al
Coa
l
Die
sel a
nd
unkn
own
Gas
Num
ber
of
proj
ects
Cap
acity
(MW
e)
Cap
acity
(MW
th)
Num
ber
of
proj
ects
Cap
acity
(MW
e)
Num
ber
of
proj
ects
Cap
acity
(MW
th)
Num
ber
of
proj
ects
Cap
acity
(MW
e)
Num
ber
of
proj
ects
Cap
acity
(MW
e)
Num
ber
of
proj
ects
Cap
acity
(MW
e)
Blaenau Gwent - - - 623 10.5 290 0.5 - - 1 16.0 4 73.6
Bridgend - - - 2,349 29.5 101 0.5 - - - - 5 25.2
Caerphilly - - - 2,460 48.9 345 0.7 - - 1 19.0 1 0.1
Cardiff 1 4.0 5.0 3,360 14.3 93 0.4 - - 1 0.7 6 32.8
Carmarthenshire - - - 4,291 108.4 293 0.9 - - - - 2 10.6
Ceredigion - - - 2,203 30.5 348 1.0 - - 2 10.3 1 0.1
Conwy - - - 1,379 15.5 251 0.9 - - - - 3 2.0
Denbighshire - - - 1,623 9.3 141 0.4 - - - - 2 1.2
Flintshire 1 0.2 0.2 3,143 89.7 84 0.2 - - 1 14.0 3 1,392.0
Gwynedd - - - 2,269 36.2 168 0.5 - - - - 1 0.1
Isle of Anglesey - - - 1,601 36.6 185 0.5 - - - - 1 0.1
Merthyr Tydfil - - - 640 6.8 67 0.0 - - 1 21.2 2 21.1
Monmouthshire - - - 3,632 44.7 113 0.3 - - 1 0.1 2 0.1
Neath Port Talbot 1 3.0 3.3 1,681 38.9 39 0.1 - - 1 21.2 6 612.3
Newport - - - 2,137 23.8 34 0.1 - - - - 7 896.7
Pembrokeshire - - - 3,769 190.6 553 1.7 - - - - 7 2,331.1
Powys - - - 4,153 24.8 675 1.9 - - - - 4 0.7
Rhondda Cynon Taf - - - 3,182 43.7 545 1.6 - - 1 21.2 10 53.3
Swansea 1 0.6 0.8 2,658 52.3 151 0.4 - - 2 23.6 4 63.8
Torfaen - - - 1,919 10.9 18 0.1 - - - - 5 0.5
Vale of Glamorgan - - - 2,055 82.8 87 0.1 1 1,586 2 0.2 7 115.1
Wrexham 1 1.2 1.2 4,507 40.6 112 0.3 - - 2 36.0 1 17.0
Offshore - - - - - - - - - - - - -
Unknown - - - - - - - - - - - - -
Total 5 9 10 55,634 989 4,693 13 1 1,586 16 184 84 5,650
2019 | Energy Generation in Wales

Methodology
30
Regen was commissioned by the Welsh Government to produce a database of energy generation
projects in Wales; identify the extent to which projects are owned by Welsh individuals, organisations
and communities; and analyse the data to produce a report on progress.
The research method developed by Regen to produce a detailed picture of energy generation across
Wales includes:
• Identifying, collating, cleansing and cross-referencing records from existing datasets
• Verifying and analysing the data to ensure a robust national overview and locally specific data where it is available
• Verifying the data with stakeholders and industry where appropriate
• Researching ownership details, including referencing to Companies House to identify projects with local ownership
The key sources of data used in the study include:
• Ofgem Feed-in Tariff data
• Renewable Energy Guarantees of Origin data
• Renewables Obligation register
• Renewable Heat Incentive and Renewable Heat Premium Payment data
• Western Power Distribution connections data
• SP Energy Networks connections data
• Gemserv MCS data
• Renewable Energy Planning Database
• Contact with utilities, installers and industry organisations
• A survey of small-scale storage installers
• BEIS energy statistics
Regen
Regen is a not-for-profit centre of energy expertise and market insight whose mission is to transform the world’s energy systems for a zero carbon future.
For more information, visit www.regen.co.uk
2019 | Energy Generation in Wales

31 2019 | Energy Generation in Wales
Assumption Source
Estimated Welsh domestic heat demand
Evaluated using BEIS Regional and Local Authority Gas Consumption Statistics (2018).
Local authority and Welsh electricity consumption
BEIS Regional and Local Authority Electricity Consumption Statistics (2018). See Note 1 for more information.
Fossil fuel electricity generation
Researched by Regen through a survey of major power plants. Actual generation from plants was collected from plants representing 95% of the major electricity generating fossil fuel capacity in Wales.
Number of homes StatsWales Dwelling stock estimates.
Capacity factors Evaluated from a 5 year average of DUKES regional capacity factors and other industry established values.
Notes
(1) The 2019 electricity consumption figure for Wales is not yet published. The published figure for
Wales’ 2018 electricity consumption is used for this report’s 2019 calculations, with the knowledge
that the 2018 and 2019 UK total electricity consumption that have been published by DUKES
remains approximately constant (2% variance).
(2) Prosperity for All: A Low Carbon Wales, 2019.
(3) Policy Statement: local ownership of energy generation in Wales – benefitting Wales today and
for future generation, 2020.
(4) The Clean Air Plan for Wales: Healthy Air, Healthy Wales, 2020.
(5) It is known that the number of hydropower projects in this report is higher than Natural Resources
Wales’ abstraction licence database. It remains an ongoing activity to validate this study’s database
of predominantly Renewable Obligation, Feed-in Tariff and Renewable Energy Guarantees Origin
hydropower projects against Natural Resource Wales’ database of hydropower projects.
(6) WPD and SPEN System Wide Resource Registers, 2020.
As part of the analysis for this report, the data for prior years is reviewed and revised data in
included to increase accuracy. As a result, some of the figures published in the Energy Generation
in Wales 2018 report may have since been superseded. Therefore, year-on-year comparisons made
in this report are calculated against the latest available data rather than against previous Energy
Generation in Wales reports.
We have not reported on some technologies this year as there has been little or no material change
from 2018. These include biomass electricity and CHP, energy from waste, landfill gas, nuclear, solar
thermal, sewage gas and pumped hydropower storage.
Assumptions and references
xxx
32 2019 | Energy Generation in Wales
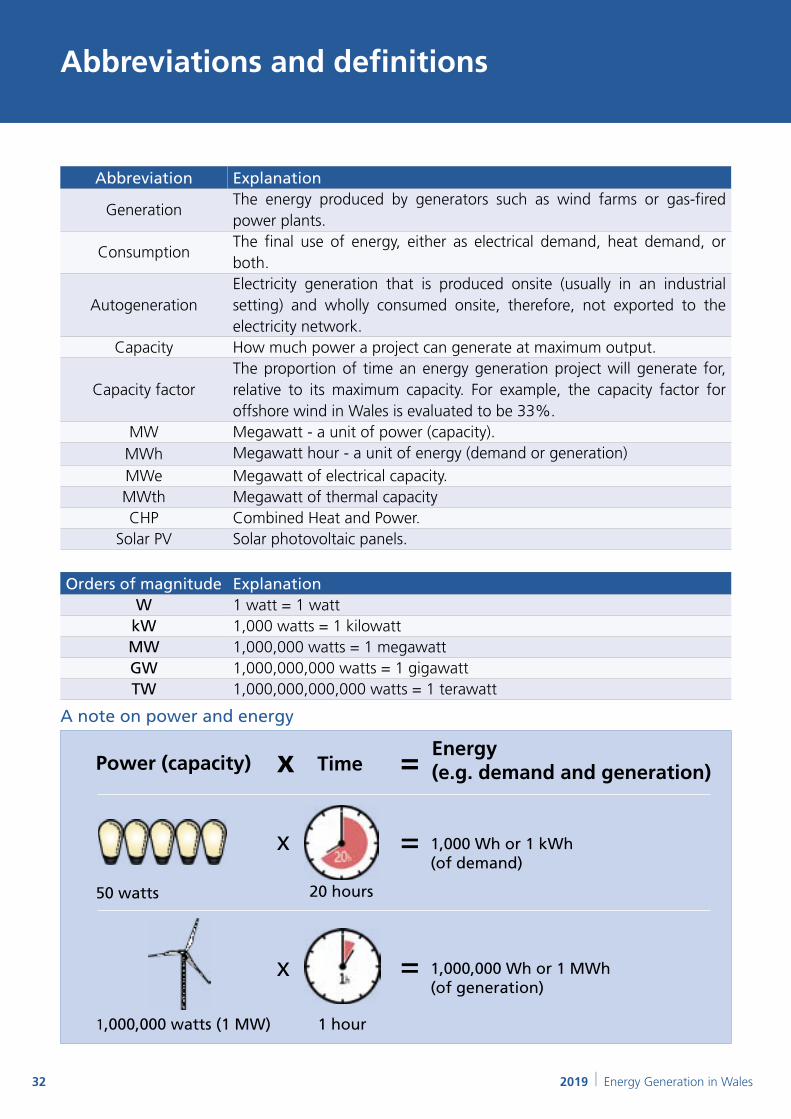
Abbreviations and definitions
50 watts
1,000,000 watts (1 MW)
20 hours
1,000 Wh or 1 kWh(of demand)
1,000,000 Wh or 1 MWh(of generation)
1 hour
x
x =
=
Power (capacity) x =TimeEnergy (e.g. demand and generation)
A note on power and energy
Abbreviation Explanation
GenerationThe energy produced by generators such as wind farms or gas-fired power plants.
ConsumptionThe final use of energy, either as electrical demand, heat demand, or both.
AutogenerationElectricity generation that is produced onsite (usually in an industrial setting) and wholly consumed onsite, therefore, not exported to the electricity network.
Capacity How much power a project can generate at maximum output.
Capacity factorThe proportion of time an energy generation project will generate for, relative to its maximum capacity. For example, the capacity factor for offshore wind in Wales is evaluated to be 33%.
MW Megawatt - a unit of power (capacity).MWh Megawatt hour - a unit of energy (demand or generation)
MWe Megawatt of electrical capacity.MWth Megawatt of thermal capacityCHP Combined Heat and Power.
Solar PV Solar photovoltaic panels.
Orders of magnitude ExplanationW 1 watt = 1 wattkW 1,000 watts = 1 kilowattMW 1,000,000 watts = 1 megawattGW 1,000,000,000 watts = 1 gigawattTW 1,000,000,000,000 watts = 1 terawatt

33 2019 | Energy Generation in Wales