ENERGY EFFICIENT SHIPPING
63
ENERGY EFFICIENT SHIPPING Western Joint Branch Lecture 7 th December 2020, On-line John Buckingham, Chief Mechanical Engineer BMT
Transcript of ENERGY EFFICIENT SHIPPING

ENERGY EFFICIENT SHIPPINGWestern Joint Branch Lecture7th December 2020, On-lineJohn Buckingham, Chief Mechanical EngineerBMT

Presenter
John BuckinghamVTAS Chief Technologist
BMT Chief Mechanical Engineer
Other principal contributors to this work: David Pearson, (Engineering)
Jeremy Atkins & Cathy Ingram (Hullform CFD) &
Beth Storey & Will Hopes (TS CFD) (All BMT)
John Buckingham CEng FIMechE, is the Chief Mechanical Engineer of BMT Defence & Security UK Limited, Bath, UK. John was the Chief Technologist for the ETI-funded Vessel Technology Assessment System project. John leads studies into marine power and propulsion, air-conditioning and hydraulics within the company and has published several papers on these subjects. Since 1999, John has been involved in a range of studies to assess the utility of EST for the commercial and military marine.
VTAS Team
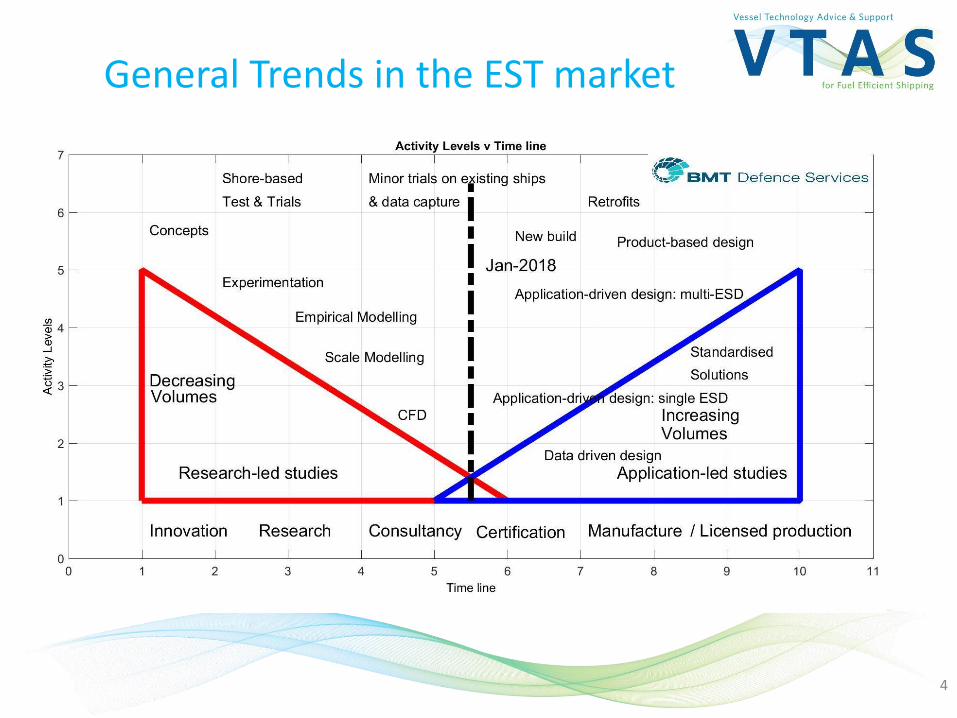
General Trends in the EST market
4
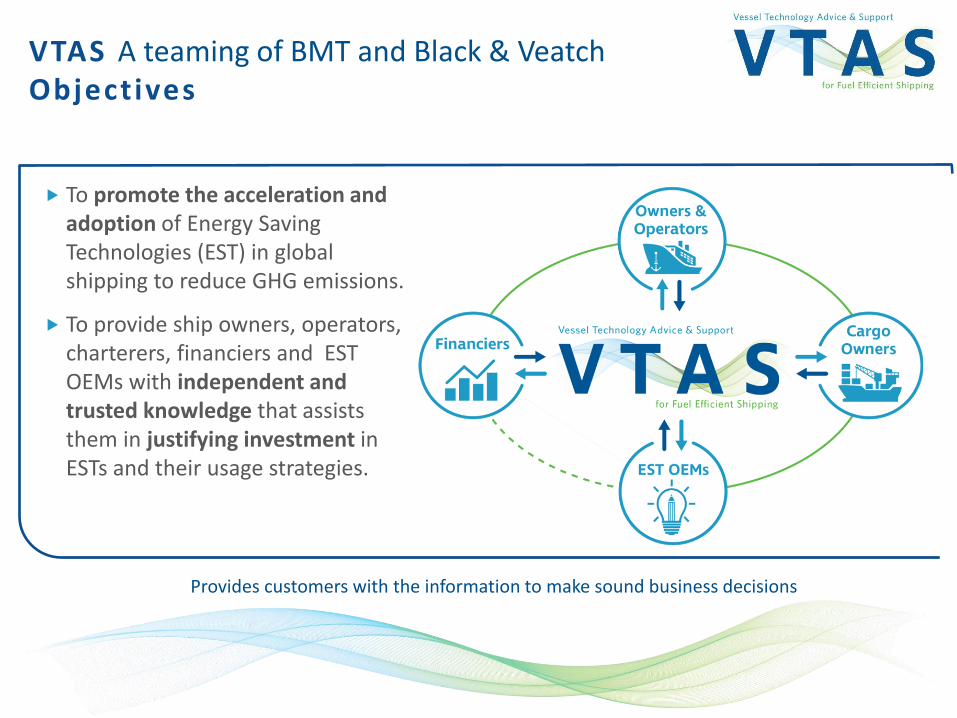
VTAS A teaming of BMT and Black & VeatchObjectives
Provides customers with the information to make sound business decisions
To promote the acceleration and adoption of Energy Saving Technologies (EST) in global shipping to reduce GHG emissions.
To provide ship owners, operators, charterers, financiers and EST OEMs with independent and trusted knowledge that assists them in justifying investment in ESTs and their usage strategies.
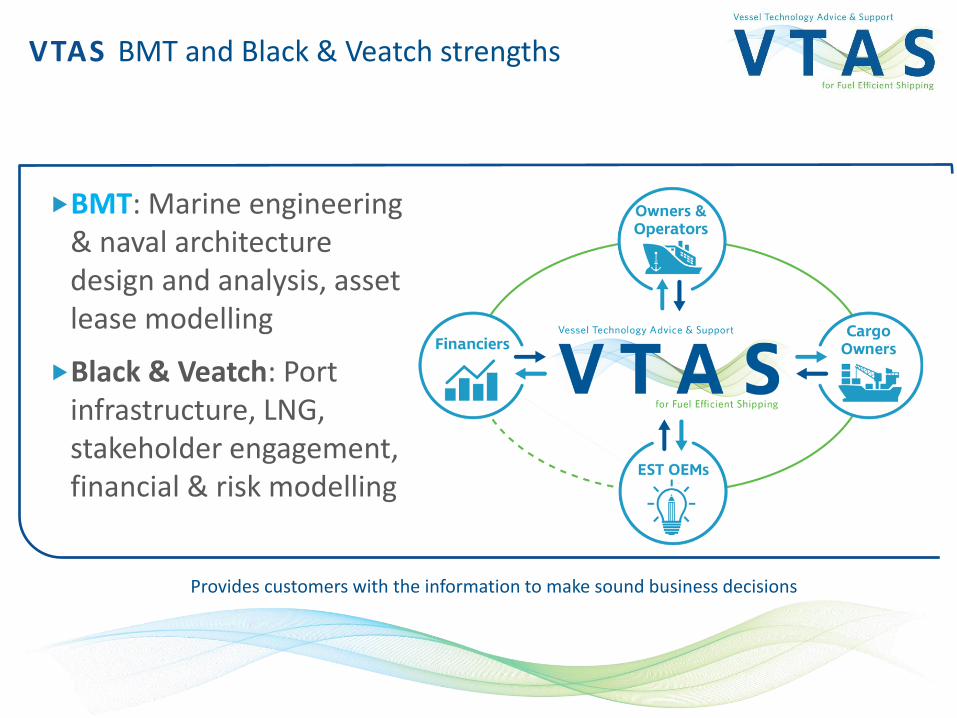
VTAS BMT and Black & Veatch strengths
Provides customers with the information to make sound business decisions
BMT: Marine engineering & naval architecture design and analysis, asset lease modelling
Black & Veatch: Port infrastructure, LNG, stakeholder engagement, financial & risk modelling
Energy Saving TechnologiesThe challenge - 1
• Ship owners want to save money & reduce their environmentalfootprint.
• The focus is on operational efficiency: spending scarce capitalfunds to save fuel is always subject to high scrutiny. Thereforeuptake to date has been slow, due to the perceived technical andfinancial risks of implementing these technologies.
• To show an EST is right for a specific ship on a specific route at aspecific time requires corroborated evidence.
• Few can offer reliable evidence to indicate the extent of the fuelsavings. Therefore it is challenging to quantify the benefits andsubsequently, high margins & contingencies are applied whichmake the EST project look non-viable.
Energy Saving TechnologiesThe challenge - 2
• We provide a means to provide firmer fuel consumptionestimates which will de-risk the EST investment and justifythe potentially high upfront cost (CAPEX).
• Modelling and analysis is to be undertaken for ships on anindividual basis, what's right for one may not be right foranother. We seek to use real ship data to baseline ourmodels.
• We ensure that ships are not just installing thesetechnologies, but installing the RIGHT technologies thatmatch their operational usage profile: speeds, routes andloadings.

BackgroundVTAS project approach
• The Vessel Technology Advice & Support (VTAS) team uses methods, data and their in-house tools to facilitate the informed report which support the uptake of EST.
• The study methods and tools are the development of an original tool set which was funded by the UK Energy Technologies Institute (ETI).
• The UK’s ETI, which closed down in Dec 2019, sought to bring clarity to stakeholders such as financiers about the real-world costs and fuel consumption benefits in marine vessels, from the deployment of new and existing fuel efficient technologies.

BackgroundVTAS project approach
In summary, the VTAS team seeks to help the marine industry save fuel, lower their operating costs, and reduce greenhouse gas (GHG) emissions. There are a number of ways this can be done:
• Ship operations – change the way the vessel is operated and how the environmental conditions affect fuel consumption;
• Alternative Fuels – switch to fuels which emit less GHG on an good LCA basis; Use waste-derived fuels from wood, plastic & domestic household refuse.
• Energy Saving Technologies (EST’s) – introduce waste heat recovery, hydrodynamic efficiency devices/methods and wind propulsion devices.
Buckingham, J E. “Future Fuels for Commercial Shipping”. RINA
Alternative Fuels conference, London, Jan 2020

Energy saving technology modelsOptions
• Marine EST generally fall into 3 categories, euphemistically referred to as “wet, warm and windy”:
Wet: Hydrodynamic efficiency technologies, primarily consisting of specialist hull paints, propeller pre/post swirl devices, and other water-side technologies such as micro air-bubble lubrication drag reduction.
Warm: Refers to Waste Heat Recovery (WHR) technologies such as Organic Rankine Cycles (ORC), and Turbo-Generator (TG), utilising heat from HT line (jacket water & CAC) or exhaust gas.
Windy: Wind-based auxiliary propulsion such as Wingsails, Flettner rotors or Turbosails, etc.

Marine Energy Saving Technologies

Marine Energy Saving TechnologiesBow optimisation Pre-swirl/Mewis ducts Post-swirl ducts
Hull coating Grim vane wheels Twisted rudders
Air lubrication Propeller boss cap fins Propeller for slow speed steaming
WHR: Absorption Chillers Engine sfc tuning & upgrades
Hybrid: shaft generator/motor
Alternative fuels: Low-carbon synthetic fuels
Solar reflective paint & photo-voltaic panels
Cold ironing/shore supplies
WHR: Organic Rankine Cycle
LED Lighting Podded contra-rotating propellers
Flettner Rotors Turbosails Wing Sails
Batteries Variable speed drives Variable speed DG sets
Hull coatings Kappel & comparable propellers
Bigger ships
Lighter materials

Energy Saving TechnologiesWhat do we do:
• We model the ship’s resistance & propulsion system and align the modelwith ship-data from real ships
• We model wind-based & other EST using first principles and empiricaldata to capture their performance onboard
• Here we consider Flettner Rotors, Wingsails & Turbosails
• We undertake retrospective assessments of past ship voyages with &without the EST to identify the fuel savings
• We provide independent technical evidence that stakeholders can trustwhen considering the suitability of the fitting of an EST to their vessel(s)
• Our assessments consider wind, wave and other conditions whenassessing the EST performance

Study Data & Information - I
• “Good” ship hullform, machinery & EST information which is seldomforthcoming.
‒ Ship: the ships particulars, principal dimensions, cargo loads &weights, draft, main and auxiliary engine specifications.
‒ Assumed and declared where data & information from ship owneror other sources is not possible. Ship’s power & propulsion (P&P)behaviour model is modelled from first principles so details fromhullform testing are invaluable.
‒ EST behaviour is based on first principles using CFD and othermethods or from supplier information.

Study Data & Information – IIStatic Models
• We make “Static” models & then “dynamic” models whendoing actual ship-data analysis.
• Static: Knot-by-knot assessment of ship with & without EST
― Consider ship speed at integer knots for a givenconditions: draft, sea state (added resistance due towaves) & fouling;
― Derive hullform resistance, propeller performance &engine power & fuel rates at each speed.
Study Data & Information – IIIDynamic Models
• Dynamic:
‒ Ship speed & position for a range of voyages from AIS orship-borne data capture
‒ Add wave & weather data from meteo sources
‒ Use static mode for each time step to predictperformance parameters or derive actual effectiveresistance from shaftline speed and power data
‒ Consider hull fouling parameters & likely added-resistance in waves models to achieve alignmentbetween ship-data & model

Study Data & Information - IVFPM, Public datasets, ship definition data
GOOD DATA IS KEY
• Fleet Performance Management (FPM) data – machineryand operating data captured onboard used for theperformance analysis and diagnosis of degenerativeconditions. This data is used to ascertain the baselineperformance of a ship, particularly hull and propulsionperformance characteristics, location and meteo data whereavailable.
• Data sampling from 1s to 5s to 1min to 5min in ourexperience. All such data can be used providing it isinterpreted correctly.

Study Data & Information - IVFPM, Public datasets, ship definition data
• Meteo data – Meteo data is gathered from dedicatedproviders (often built into FPM) or public datasets, e.g. BMTsometimes use weather data from the European Centre forMedium range Weather Forecasting (ECMWF).
• So that wind-based EST estimates and hull resistance can becalculated Meteo data is used to inform the model of:
o Air and sea temperatures
o Wind speed/direction, current,
o Significant wave height etc.

Wind-based ESTVector Diagram
• All wind-based EST models wind & ship speed vectors from which force vectors are derived.
Example Case Study from a ProjectTurbosail EST
• We will go through a few main points of a project to consider a relatively novel EST, a Turbosail, on a 61,000 dwt bulker.
• Main points of interest are identified & explained.
• Savings for a given route are demonstrated.

Project Flowchart - 1
CFD on hullform
Pre-processing of ship-data
Ship model definitionAdd resistance
information to ship model
Align model to ship dataAdd wave & weather
data to ship-data
Run model & identify estimated parameters Develop EST model
CFD or 1st princicples
Add EST model to ship model
Run ship & EST model to identify full range of
behaviours
Run ship & ship-EST models for a set of days
at sea
Compare & review results
Run ship & ship-EST models for a given
sea state

Project Flowchart - 2
CFD on hullform
Pre-processing of ship-data
Ship model definitionAdd resistance
information to ship model
Align model to ship dataAdd wave & weather
data to ship-data
Run model & identify estimated parameters Develop EST model
CFD or 1st princicples
Add EST model to ship model
Run ship & EST model to identify full range of
behaviours
Run ship & ship-EST models for a set of days
at sea
Compare & review results
Run ship & ship-EST models for a given
sea state
Case Study: Baseline ShipModelling
• The Study ship is a 61,000 dwt Handymax bulker with the followingprincipal particulars:
• Length overall - 199.9m• Length waterline - 197.0m• Beam - 32.24m• Scantling Draught - 13.04m• Standard draught - 11.5m• Single shaft, two-stroke, fixed pitch propeller
• Such a ship definition is given at the Design Point (DP), the point wherethe working displacement and hence the in-service draught is greatest.
• In service, the ship will be usually more lightly loaded with a lower draughtand will also probably be out of trim.
• CFD gives the resistance at the DP with Holtrop & Mennen used to capturechanges to ship draft and trim. Resistance is also derived from power andshaft speed data.
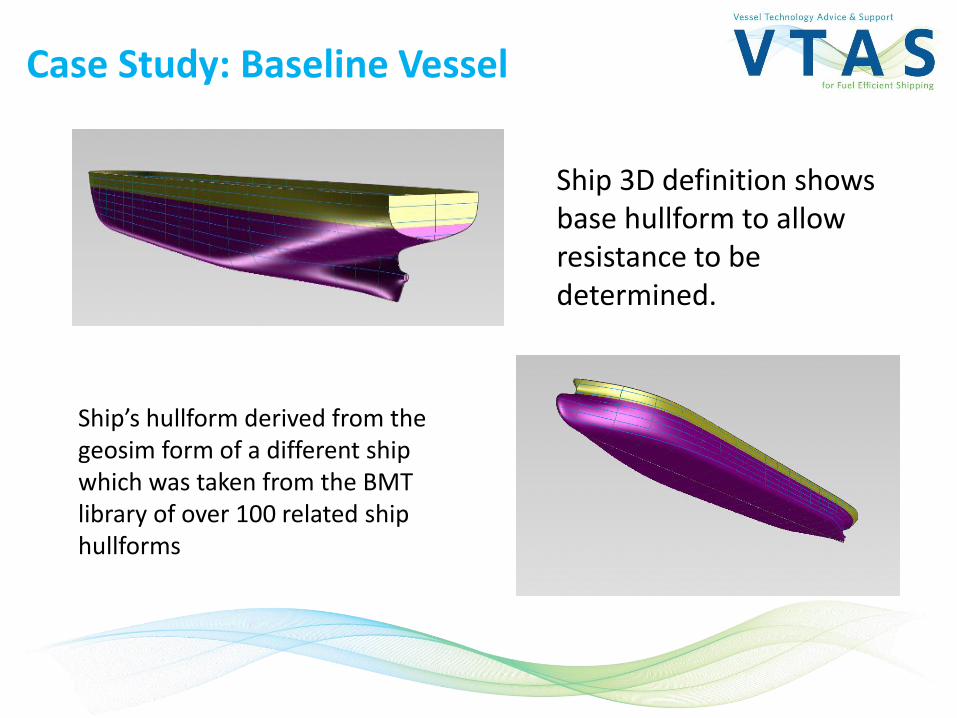
Case Study: Baseline Vessel
Ship 3D definition shows base hullform to allow resistance to be determined.
Ship’s hullform derived from the geosim form of a different ship which was taken from the BMT library of over 100 related ship hullforms

International WindShip AssociationISWA
http://wind-ship.org/en/grid-homepage/
ISWA MissionPromote the use of wind propulsion in commercial
shipping to reduce fuel consumption and decrease climate change related emissions.
IWSA Secretary: Gavin Allwright
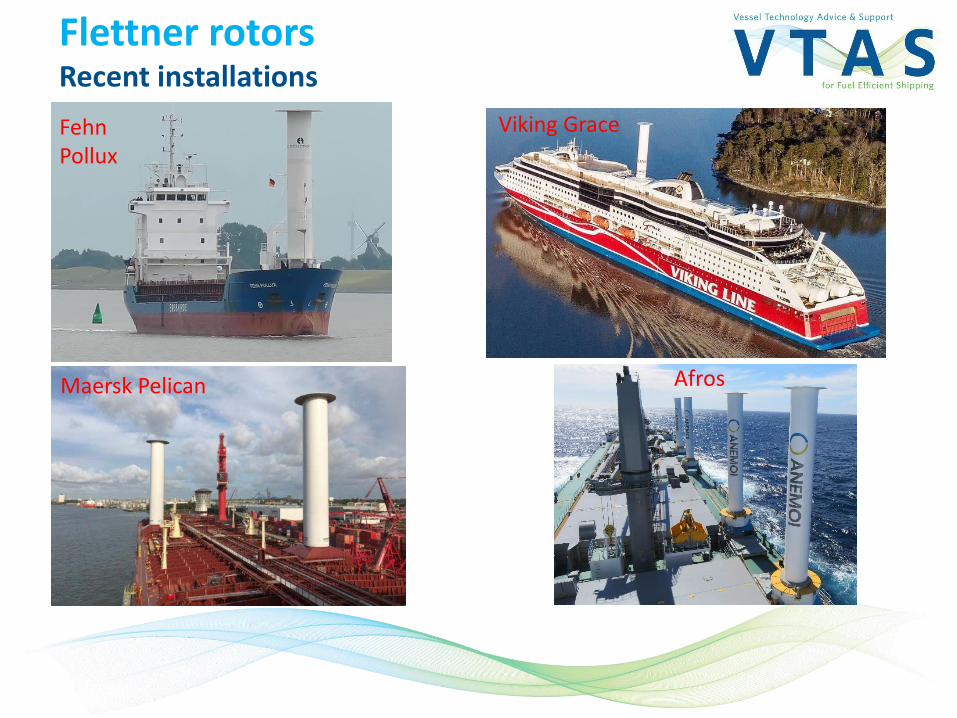
Flettner rotorsRecent installations
Fehn Pollux
Maersk Pelican Afros
Viking Grace
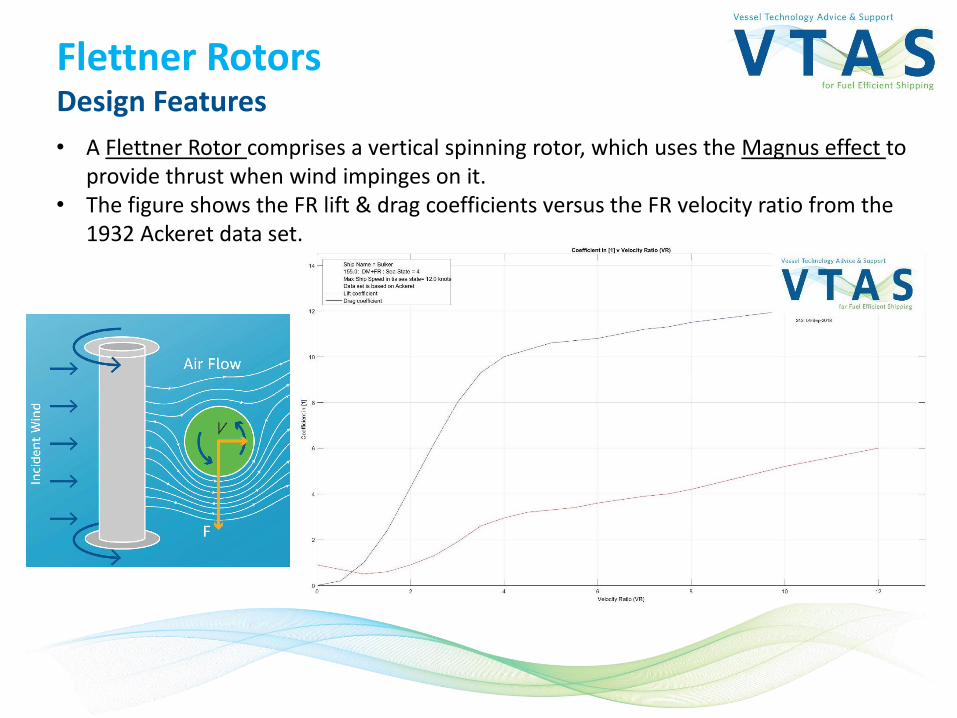
Flettner RotorsDesign Features
• A Flettner Rotor comprises a vertical spinning rotor, which uses the Magnus effect to provide thrust when wind impinges on it.
• The figure shows the FR lift & drag coefficients versus the FR velocity ratio from the 1932 Ackeret data set.

Flettner RotorsStudy Approach
Pearson, D R. “The use of Flettner Rotors in Efficient Ship Design”. Influence of EEDI on Ship Design, 24-25 September 2014, London, UK
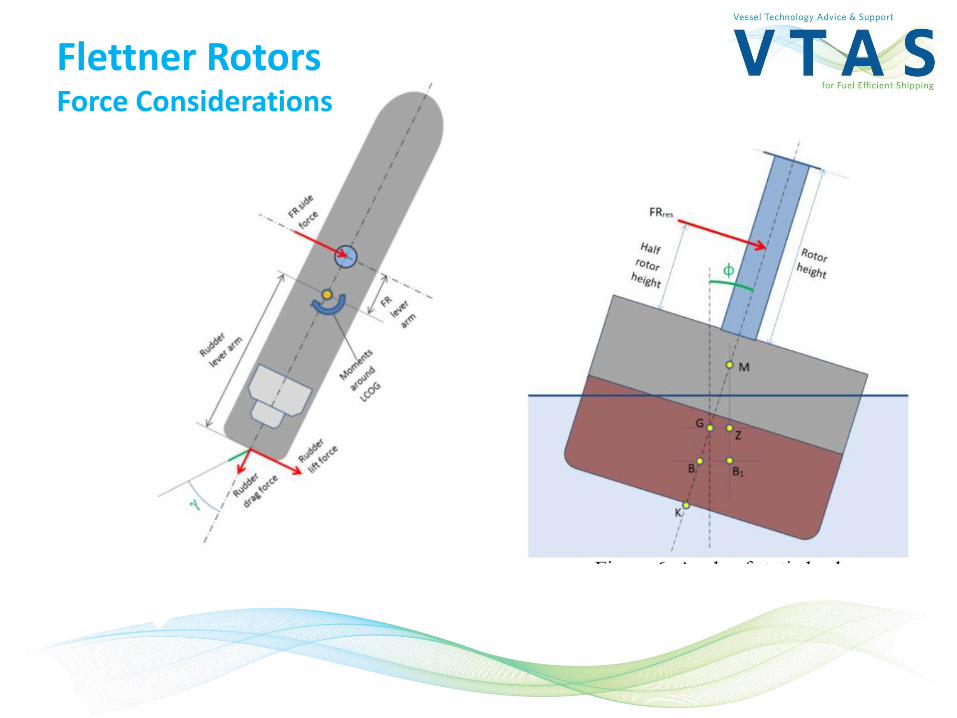
Flettner RotorsForce Considerations
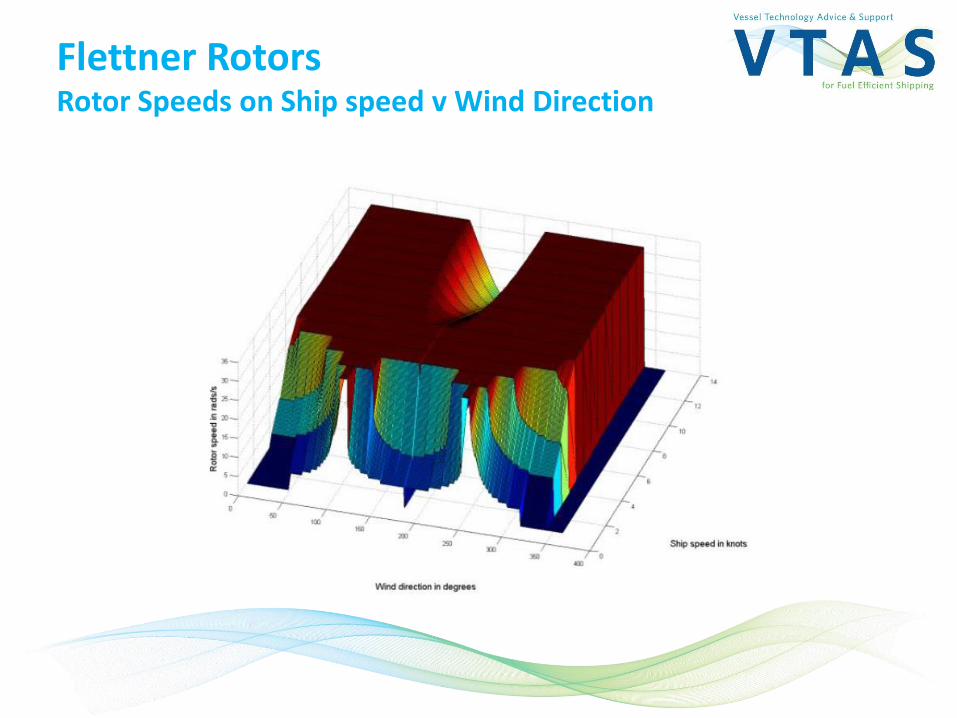
Flettner RotorsRotor Speeds on Ship speed v Wind Direction
Wing Sails - IDesign Features
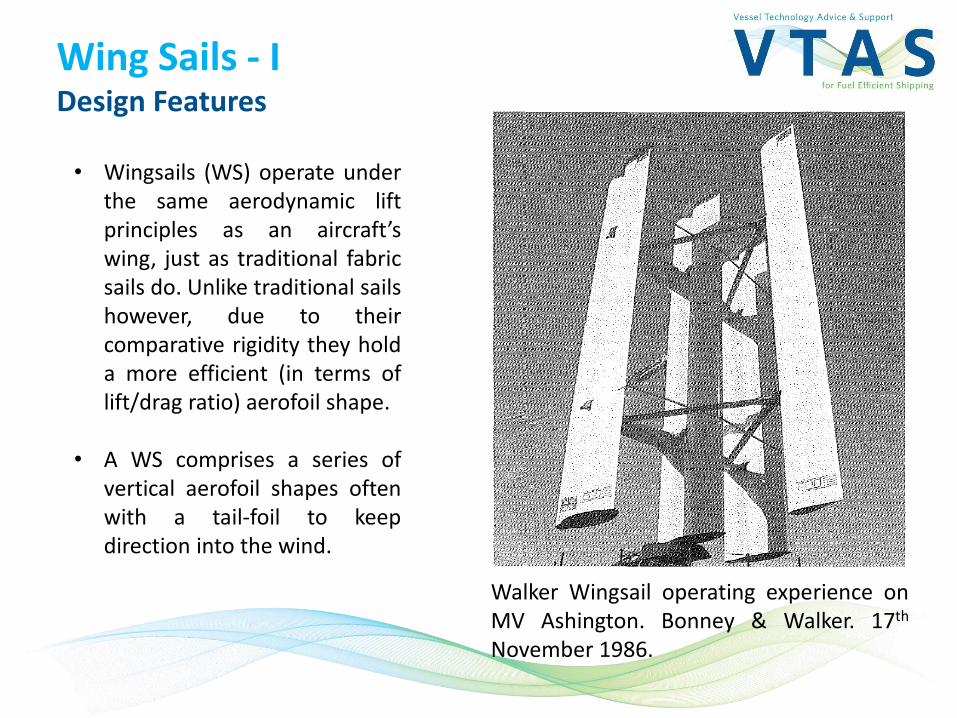
• Wingsails (WS) operate underthe same aerodynamic liftprinciples as an aircraft’swing, just as traditional fabricsails do. Unlike traditional sailshowever, due to theircomparative rigidity they holda more efficient (in terms oflift/drag ratio) aerofoil shape.
• A WS comprises a series ofvertical aerofoil shapes oftenwith a tail-foil to keepdirection into the wind.
Walker Wingsail operating experience onMV Ashington. Bonney & Walker. 17th
November 1986.

Wing Sails - IIDesign Features
• The WS modelled in this study arebased on the “Walker wingsail” 3bladed type, and for this study aship set of four 19.5 metre sailswith an aspect ratio of 3.5 waschosen.
• The lift coefficient (Cl) given byWalker is 3.0 with a dragcoefficient (Cd) of 0.3.
• These values have been used byBMT in these studies.

Wing Sails - IIIDesign Features
• Today’s UK version of the WingSail design is provided by Windship

EST Model: Turbosail Principle
• The Turbosail comprises a vertical cylinder, with an elliptic cross-section. Inventedby Jacques Cousteau they are oriented towards the wind, offset by an angle ofattack. When operating there is an area of low pressure on the leeward side anda movable flap on the lower side of the trailing edge which aids with thedevelopment of a high pressure. Air is drawn in on the low pressure side toenhance the overall aerodynamic effect and prevent boundary layer separation.They are then stationary once they are facing the wind.
Cousteau designed a specificexperimental ship, “Alcyone” fittedwith two 10.25m Turbosails.Cousteau never realised a viablecommercial design and onlyrecently has its performance beenanalysed and published by Hciniand others.
The Econowind design, named Ventifoil, is a variant on the Turbosail design. It is currently being trialled on the Lady Christina.

EST Model: Turbosail Principle
• Turbosails (TS) are orientedtowards the wind with anrotational offset, an angle ofattack, shown here as 12°.BMT are researching variationsto several parameters includingthe angles of attack to identifythe best value for a given windspeed.
• The location & the volume ofair drawn in on the lowpressure side is also a studyvariable as is the aspect ratioof the profile as we seek toenhance the overallaerodynamic effect.

EST Model: Turbosail Application
• The Econowind design, named Ventifoil, is a variant on the Turbosail design. The Lady Christina was one of the first ships to use it as a containerised unit.

EST Model: Turbosail Application
• The current listing is:- Lady Christina:2. Ventifoils as a containerised unit- MV Ankie: 2. permanent Ventifoils on bow- MV Frisian Sea due to be fitted with 2x Ventifoils
mounted on a Flatrack unit, “Ventifoils can be handled/moved around with the hatch crane” – build is nearly complete
- Tharsis (diesel-electric) to be fitted with 2x folding Ventifoils, also mounted on a Flatrack unit (announced recently)

EST Model: Turbosail Analysis
• The performance of a turbosail design was determined using Numeca CFD software.
Figure right shows flow round ends of TS. Current studies now use ground-based design.
Figure left shows low pressure area (red) due to flow velocity but without suction.

EST Model: Turbosail Analysis
• The performance of a turbosail design was determined using Numeca CFD software. Suction coefficient, Cq, Cq = Q/(U*A), i.e. Suction Coefficient = Volumetric Flow Rate / (Wind Speed * Area of Turbosail)
Figure left is with no suction (Cq of 0), figure bottom is with suction (Cq of 0.023). Applying the suction more than doubled the lift coefficient, and increased the lift to drag ratio by 88% by keeping the fast streamlines closer to the surface of the TS.

Wind-based EST locations
• Wind-based EST locations are checked to ensure conformance with IMO SOLAS & COLREG regulations.
EST Model: Turbosail Vector Analysis
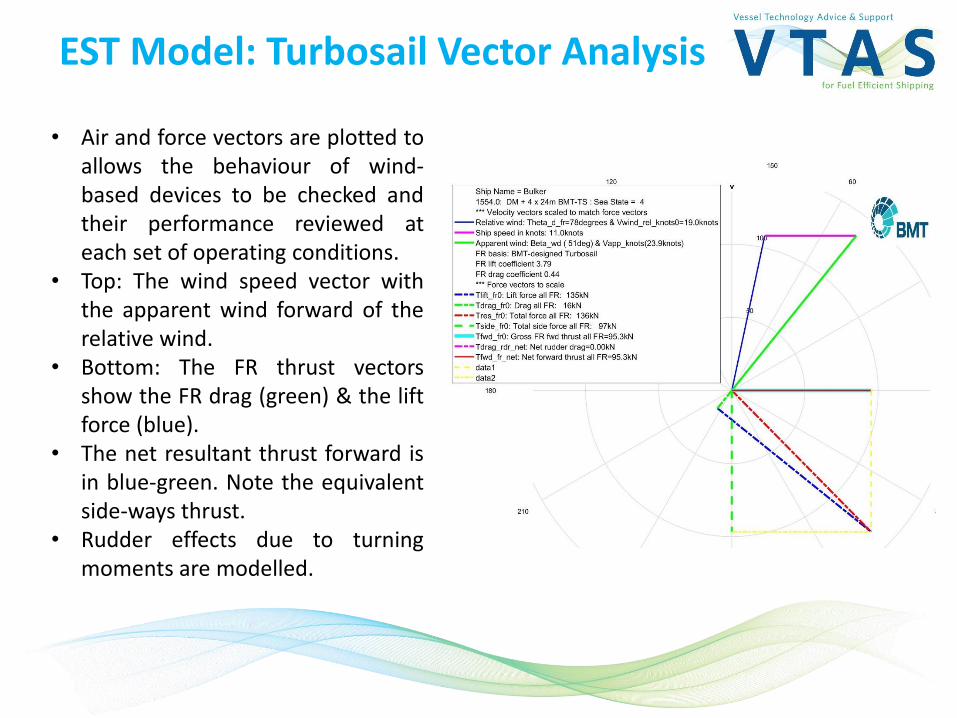
• Air and force vectors are plotted toallows the behaviour of wind-based devices to be checked andtheir performance reviewed ateach set of operating conditions.
• Top: The wind speed vector withthe apparent wind forward of therelative wind.
• Bottom: The FR thrust vectorsshow the FR drag (green) & the liftforce (blue).
• The net resultant thrust forward isin blue-green. Note the equivalentside-ways thrust.
• Rudder effects due to turningmoments are modelled.
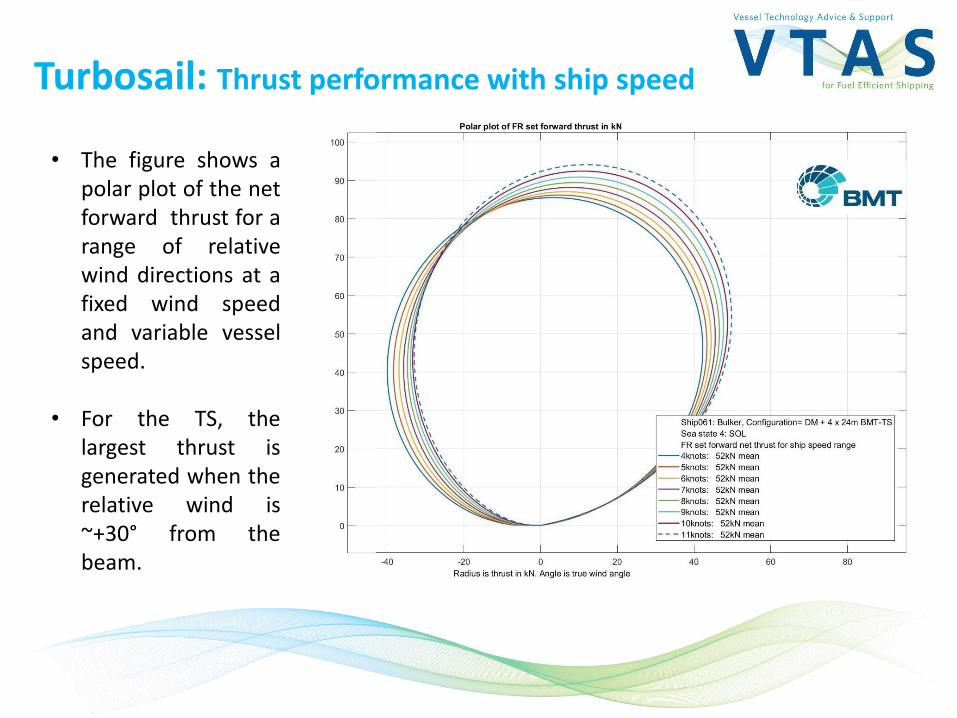
Turbosail: Thrust performance with ship speed
• The figure shows apolar plot of the netforward thrust for arange of relativewind directions at afixed wind speedand variable vesselspeed.
• For the TS, thelargest thrust isgenerated when therelative wind is~+30° from thebeam.

Av wind speed & direction: August 2017

Meteo Data: World Wind Speed Average September

Meteo Data: IMO MEPC 62/5/12
• Note speed withpeak probabilityis at 7m/s or ~14knots.
• Medianprobability is justabout 7m/s.
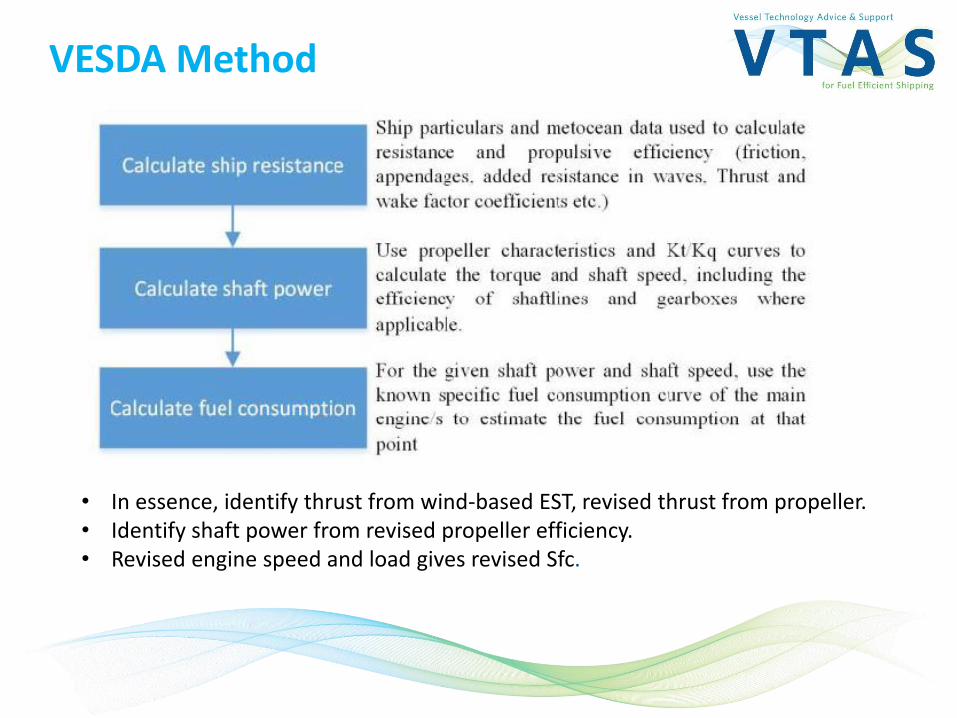
VESDA Method
• In essence, identify thrust from wind-based EST, revised thrust from propeller.• Identify shaft power from revised propeller efficiency.• Revised engine speed and load gives revised Sfc.

Design Options
• The set of designs seeks to allow a valid comparison of the three EST technologies.
• Specific designs will be affected by EST cost to procure and install.

Design Options; Engine Loadings
• Top lines are variation to DG set loadings. • Bottom are main engine loading changes.

Design Options: Effective Ship Resistance
• Red is baseline.• Three options give comparable thrust at upper speeds.

Design Options: Propeller Efficiency
• Bottom is baseline• Three options give comparable propeller efficiency at upper speeds
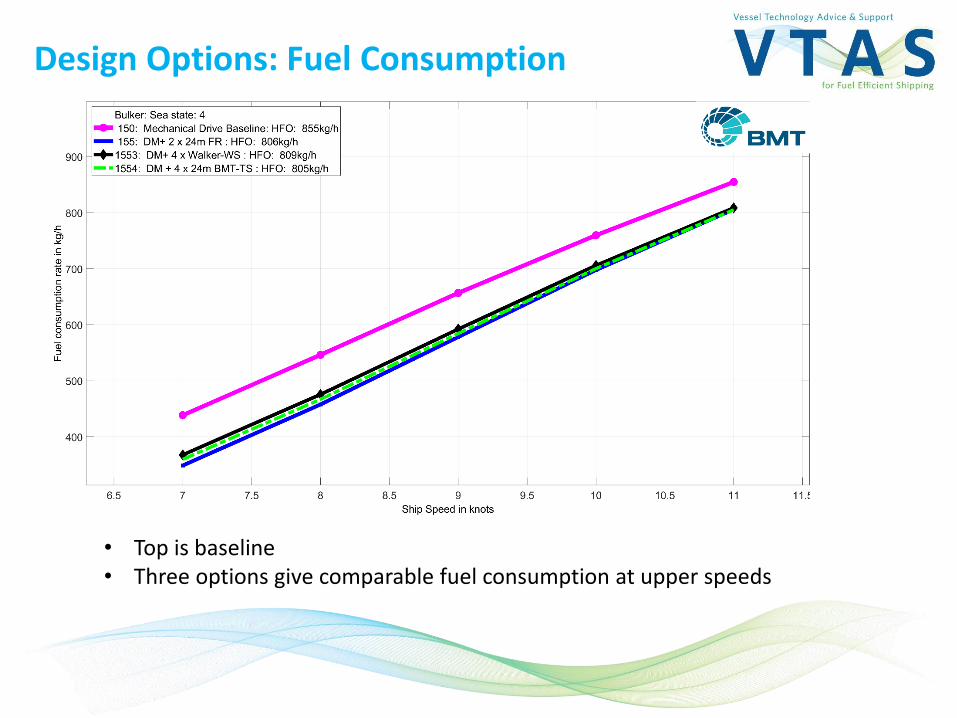
Design Options: Fuel Consumption
• Top is baseline• Three options give comparable fuel consumption at upper speeds

Design Options: Relative Fuel Consumption
• Baseline design is zero difference.• Three options give comparable fuel consumption of ~ 5% at upper speeds

Ship-data: Relative Fuel Consumption
• High sea state, windy conditions, Ship-data, 5-min data, in red, base mode in green,
• EST wind-propulsion solution in blue.• More at RINA Full Scale Ship Performance Conference, BMT paper, 2019
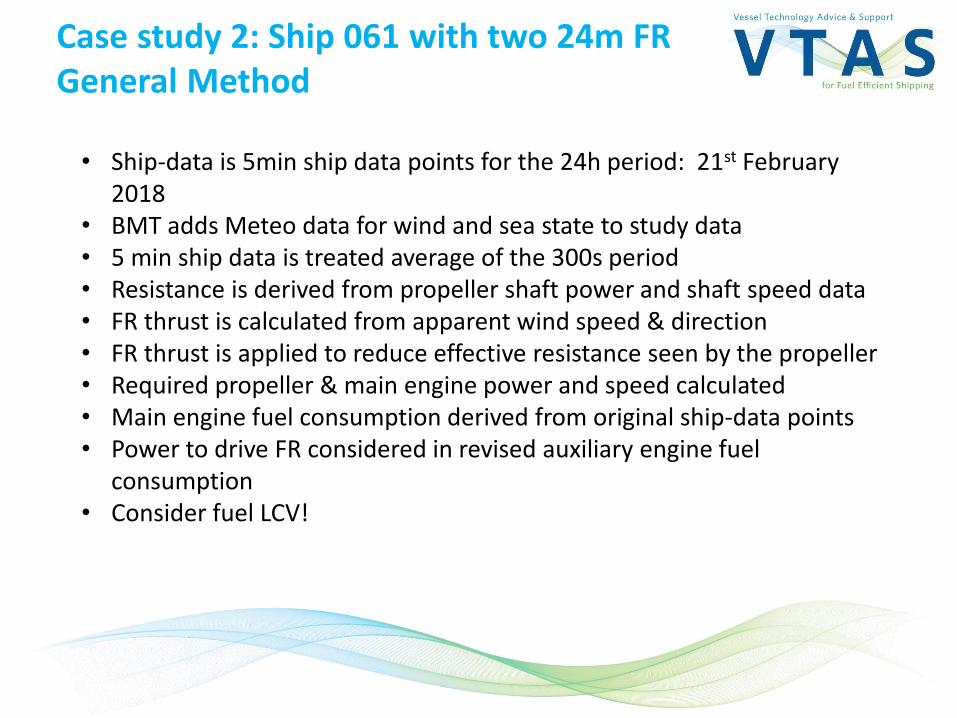
Case study 2: Ship 061 with two 24m FRGeneral Method
• Ship-data is 5min ship data points for the 24h period: 21st February 2018
• BMT adds Meteo data for wind and sea state to study data • 5 min ship data is treated average of the 300s period• Resistance is derived from propeller shaft power and shaft speed data• FR thrust is calculated from apparent wind speed & direction• FR thrust is applied to reduce effective resistance seen by the propeller• Required propeller & main engine power and speed calculated• Main engine fuel consumption derived from original ship-data points• Power to drive FR considered in revised auxiliary engine fuel
consumption • Consider fuel LCV!

Main engine Sfc v Shaft power

Ship speed & shaft power with & without FR
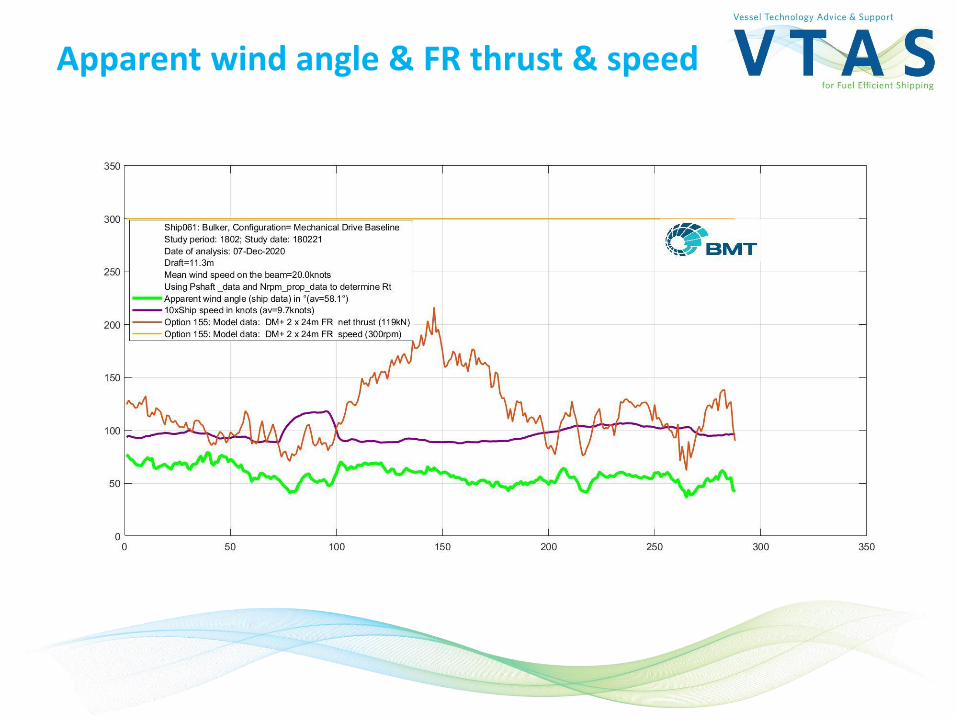
Apparent wind angle & FR thrust & speed

Propeller shaft speed: With & without FR

Total fuel consumption: with & without FR

Study Technical Conclusions
• This study shows the individual application of our study toolsto determine the performance of three wind-based EST.
• Each EST solution configuration has been chosen to give acomparable performance
• Each EST’s behaviour is determined with its lift and dragcoefficients. These allow the EST forces & the resultantforward thrust to be determined.
• The reduced propeller load is found & main engine load withthe consequential reduction in fuel consumption.
• Power to drive the EST is accounted for from the additionalDG set loading
Study Conclusions
• As more operating information on the performance ofvarious ESTs in different operating conditions becomesavailable, the individual EST models are being refined tomore accurately capture these effects and provide anincreasingly reliable estimate of their future performance.
• Studies continue to refine the Turbosail behaviour for specificdesign changes. This will allow its performance to be betterunderstood.
• These three models will be used with ship-data to validatetheir performance with real ships.

Study Conclusions
• Thank you for your kind attention.
• For more information on our project, please contactme:
• or see our website:
https://vtas-fes.com/