Energy-Efficient Adaptive Cruise Control for Electric Connected …€¦ · Energy-Efficient...
32
Energy-Efficient Adaptive Cruise Control for Electric Connected and Autonomous Vehicles USDOT T3e Webinar Hosted by Dr. Jing Dong Presented by Liang Hu and Chaoru Lu
Transcript of Energy-Efficient Adaptive Cruise Control for Electric Connected …€¦ · Energy-Efficient...
Energy-Efficient Adaptive Cruise Control for Electric Connected and Autonomous Vehicles
USDOT T3e Webinar
Hosted by Dr. Jing DongPresented by Liang Hu and Chaoru Lu
Focal point for transportation research
49 faculty, 257 students from 11 departments across ISU
Collaborative culture and structure
Innovation in streaming data, analytics, and decision support tools 2
Outline
Introduction
Fuel and Energy consumption model
Adaptive cruise control
Simulation
Conclusion
3
Introduction
In the United States, the fuel economy of personal vehicles is estimated as 24.7 miles per gallon (mpg) in 2016 and is projected to be 54.5 mpg in 2025.
Battery electric vehicle• High energy efficiency• Zero tailpipe emissions
Driver behavior could also affect the fuel economy of vehicles by 10~40%
4
Introduction
For ICEV Smoother deceleration and acceleration rate leads
to better fuel efficiency (Wu et al. 2015). ACC-equipped vehicle decreased the emissions
(Ioannou and Stefanovic 2005)
For BEV Ability to recover energy while braking using a
regenerative braking system (Fiori et al. 2016)
5
Introduction
6
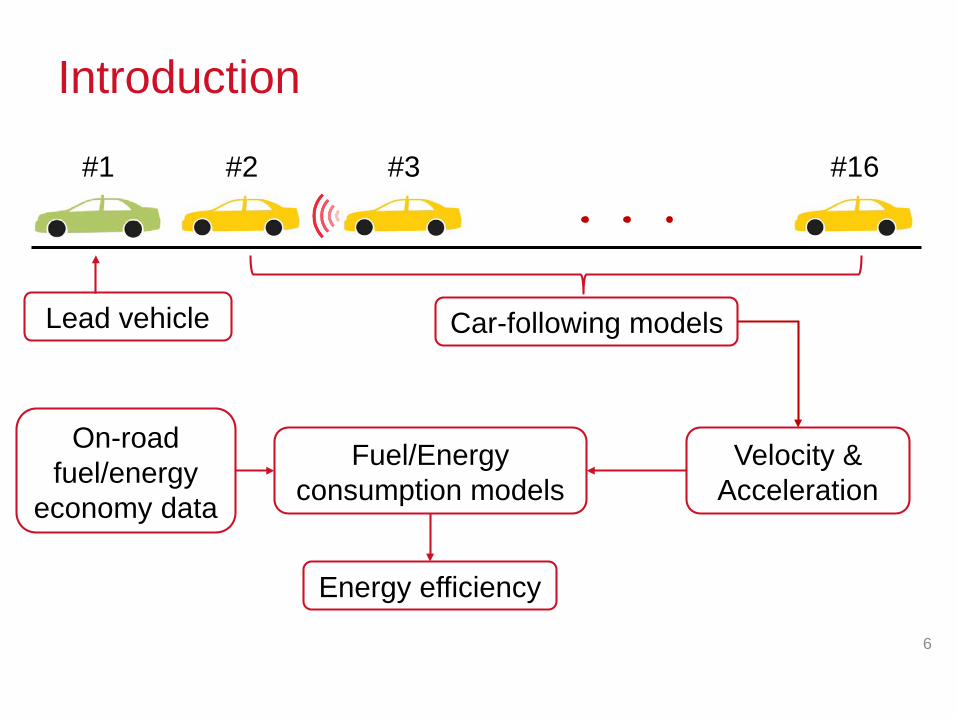
Car-following modelsLead vehicle
Velocity & Acceleration
Fuel/Energy consumption models
On-road fuel/energy
economy data
Energy efficiency
#1 #2 #3 #16
Energy Consumption Models
ICEV fuel consumption model• a linear regression model, taking speed &
acceleration as predictors• there is an optimal speed range for fuel consumption
BEV energy consumption model• braking regenerates electricity• energy consumption increases with speed
Different ACCs for ICEVs and BEVs are needed
7
ICEV Fuel Consumption Model
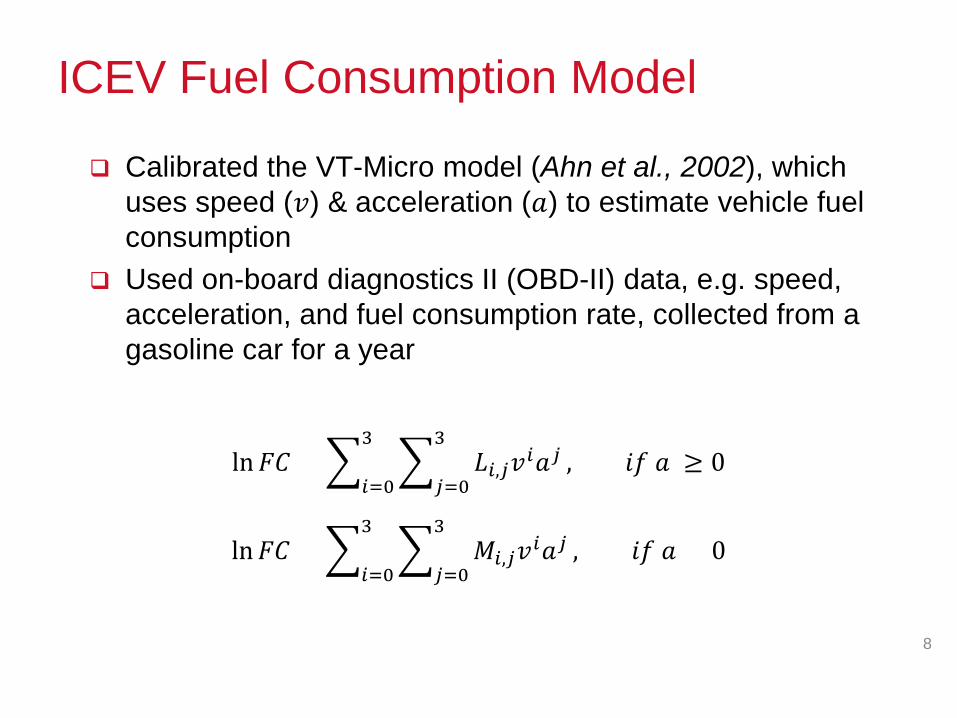
Calibrated the VT-Micro model (Ahn et al., 2002), which uses speed (𝑣𝑣) & acceleration (𝑎𝑎) to estimate vehicle fuel consumption
Used on-board diagnostics II (OBD-II) data, e.g. speed, acceleration, and fuel consumption rate, collected from a gasoline car for a year
8
ln𝐹𝐹𝐹𝐹 = �𝑖𝑖=0
3�
𝑗𝑗=0
3𝐿𝐿𝑖𝑖,𝑗𝑗𝑣𝑣𝑖𝑖𝑎𝑎𝑗𝑗 , 𝑖𝑖𝑖𝑖 𝑎𝑎 ≥ 0
ln𝐹𝐹𝐹𝐹 = �𝑖𝑖=0
3�
𝑗𝑗=0
3𝑀𝑀𝑖𝑖,𝑗𝑗𝑣𝑣𝑖𝑖𝑎𝑎𝑗𝑗 , 𝑖𝑖𝑖𝑖 𝑎𝑎 < 0
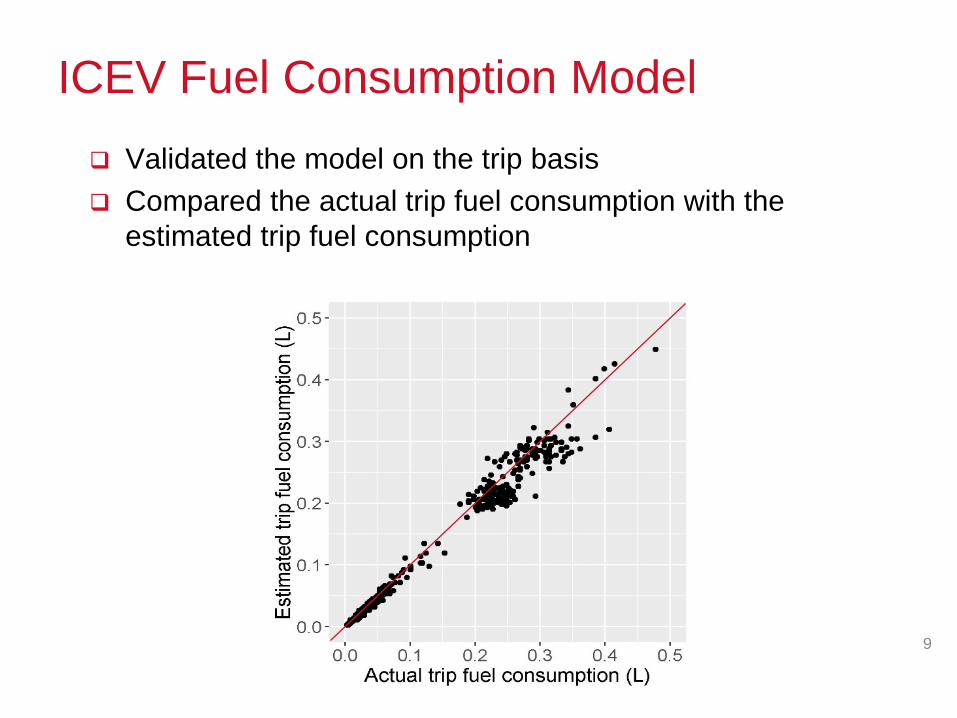
ICEV Fuel Consumption Model Validated the model on the trip basis Compared the actual trip fuel consumption with the
estimated trip fuel consumption
9
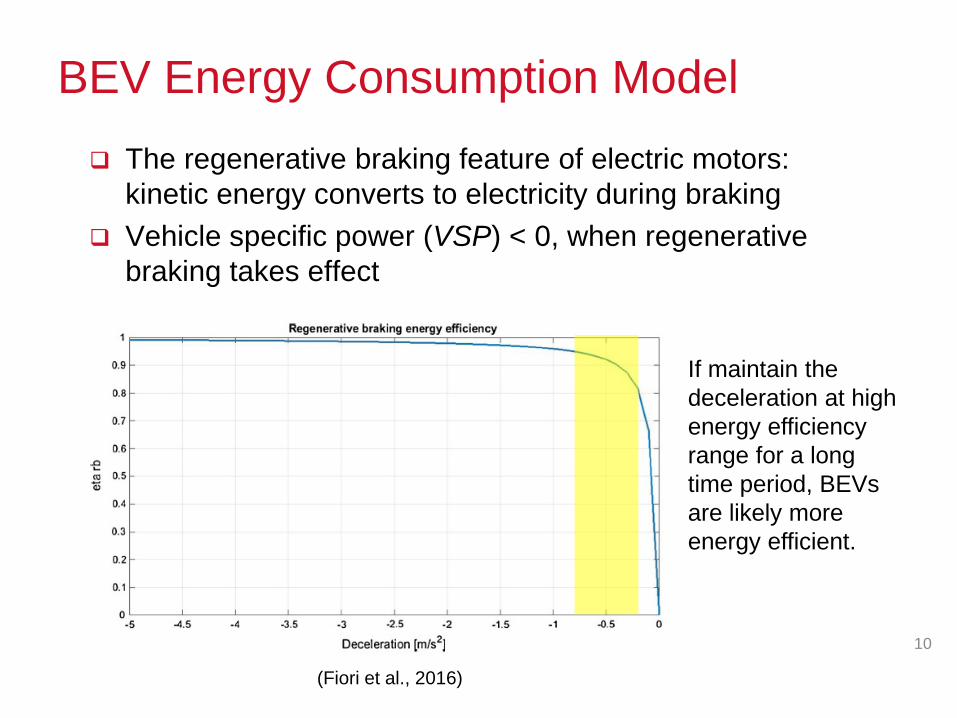
BEV Energy Consumption Model The regenerative braking feature of electric motors:
kinetic energy converts to electricity during braking Vehicle specific power (VSP) < 0, when regenerative
braking takes effect
10
(Fiori et al., 2016)
If maintain the deceleration at high energy efficiency range for a long time period, BEVs are likely more energy efficient.
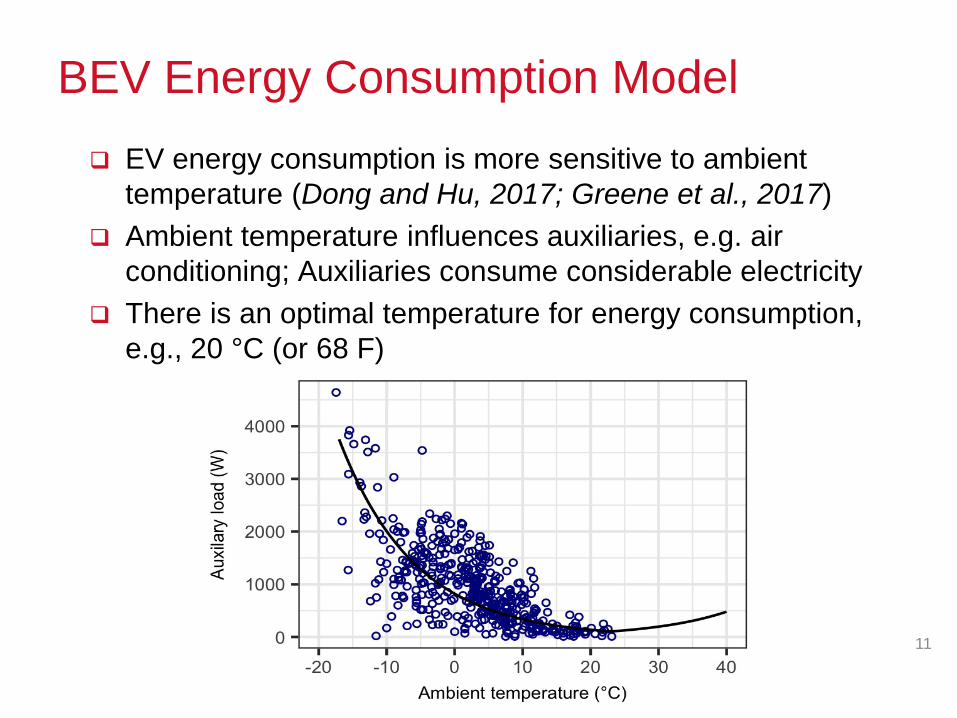
BEV Energy Consumption Model EV energy consumption is more sensitive to ambient
temperature (Dong and Hu, 2017; Greene et al., 2017) Ambient temperature influences auxiliaries, e.g. air
conditioning; Auxiliaries consume considerable electricity There is an optimal temperature for energy consumption,
e.g., 20 °C (or 68 F)
11
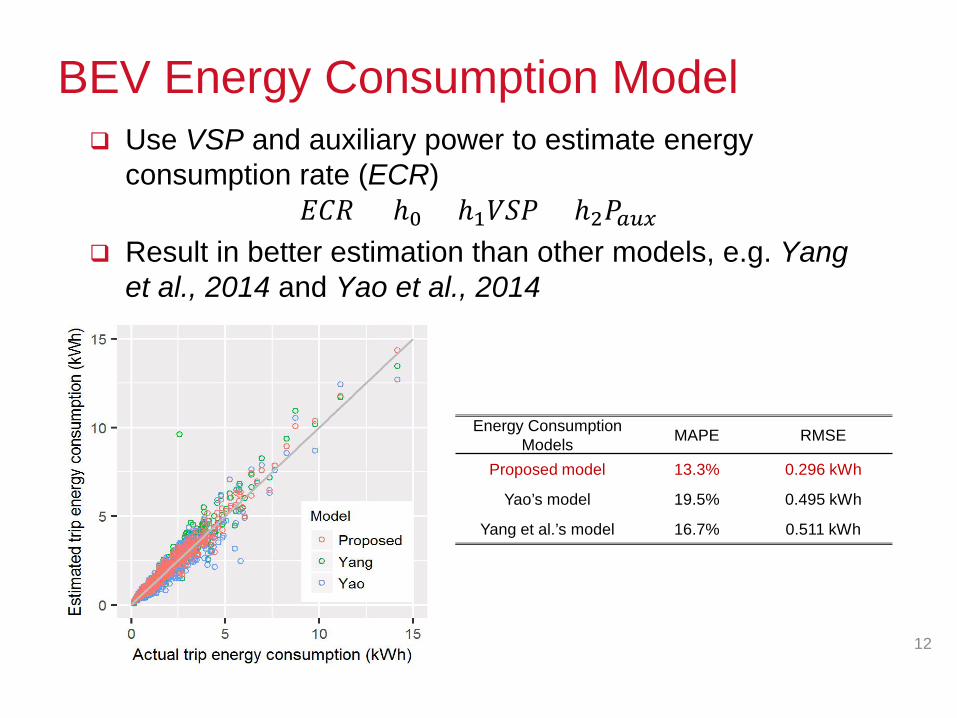
BEV Energy Consumption Model Use VSP and auxiliary power to estimate energy
consumption rate (ECR)𝐸𝐸𝐹𝐹𝐸𝐸 = ℎ0 + ℎ1𝑉𝑉𝑉𝑉𝑉𝑉 + ℎ2𝑉𝑉𝑎𝑎𝑎𝑎𝑎𝑎
Result in better estimation than other models, e.g. Yang et al., 2014 and Yao et al., 2014
12
Energy Consumption Models MAPE RMSE
Proposed model 13.3% 0.296 kWh
Yao’s model 19.5% 0.495 kWh
Yang et al.’s model 16.7% 0.511 kWh
Car-Following Models
Human-driver models• Newell Model• Gipps Model• Optimal Velocity Model• Intelligent Driver Model
Adaptive cruise control• Adaptive cruise control based on IDM (IDM-
ACC)• Nissan Model
13
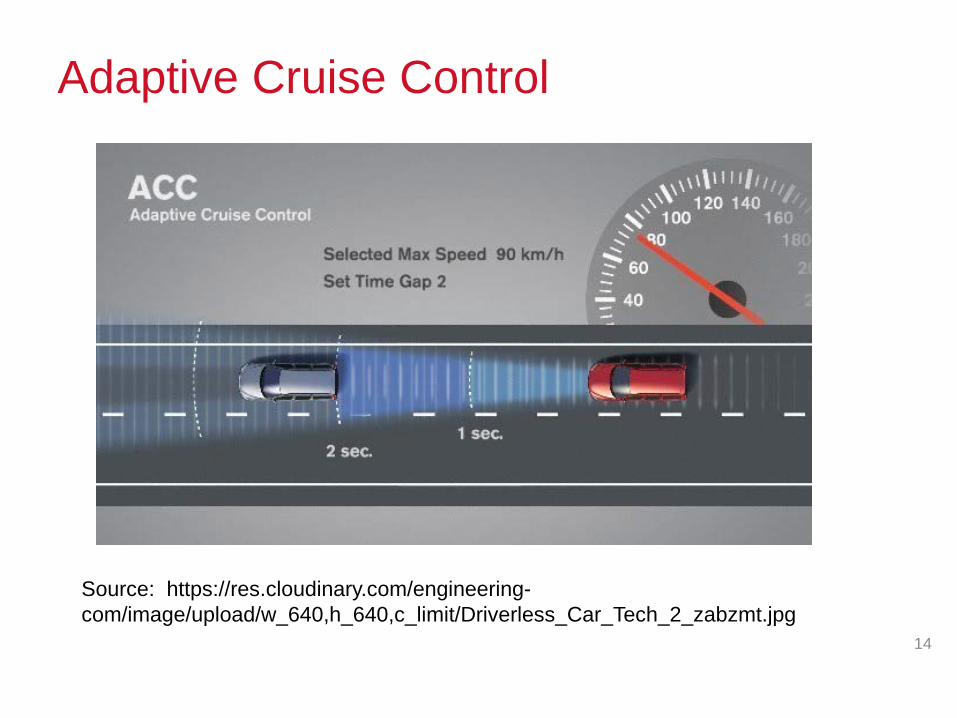
Adaptive Cruise Control
14
Source: https://res.cloudinary.com/engineering-com/image/upload/w_640,h_640,c_limit/Driverless_Car_Tech_2_zabzmt.jpg
Proposed Adaptive Cruise Control
Assumptions:
Only CAVs are capable of communicating with other CAVs through V2V communication
Ignore computational, sensor, and communication delays for CAVs
15
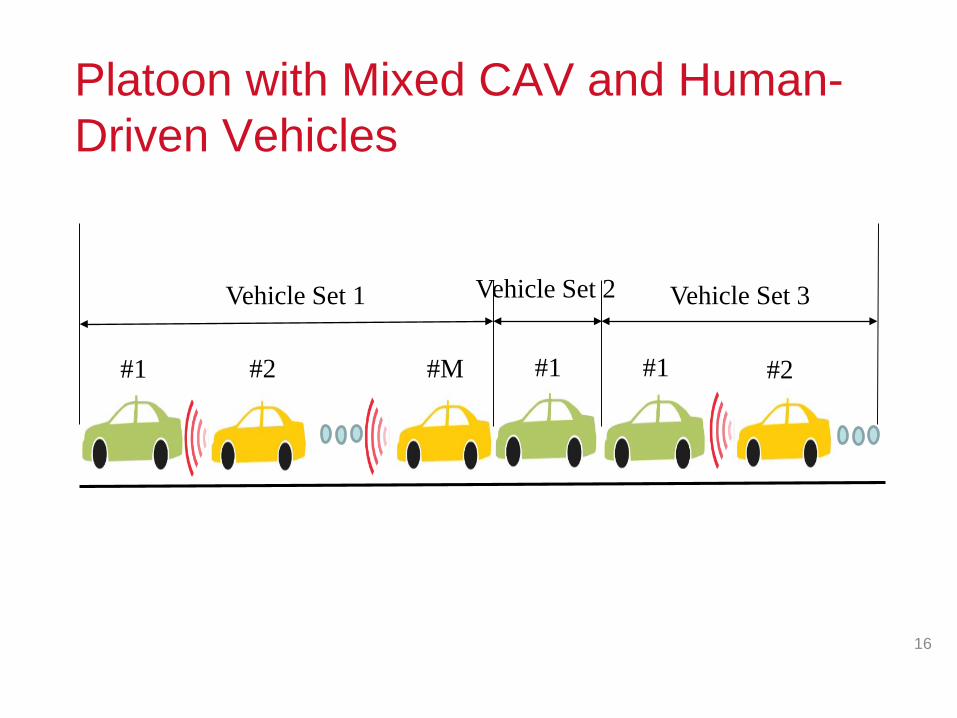
Platoon with Mixed CAV and Human-Driven Vehicles
16
#1 #2 #M #2#1 #1
Vehicle Set 3Vehicle Set 1 Vehicle Set 2
Adaptive Cruise Control
Gasoline-CAVEcological Smart Driver Model (Eco-SDM)
e-CAVEnergy-Efficient Electric Driving Model (E3DM)
17
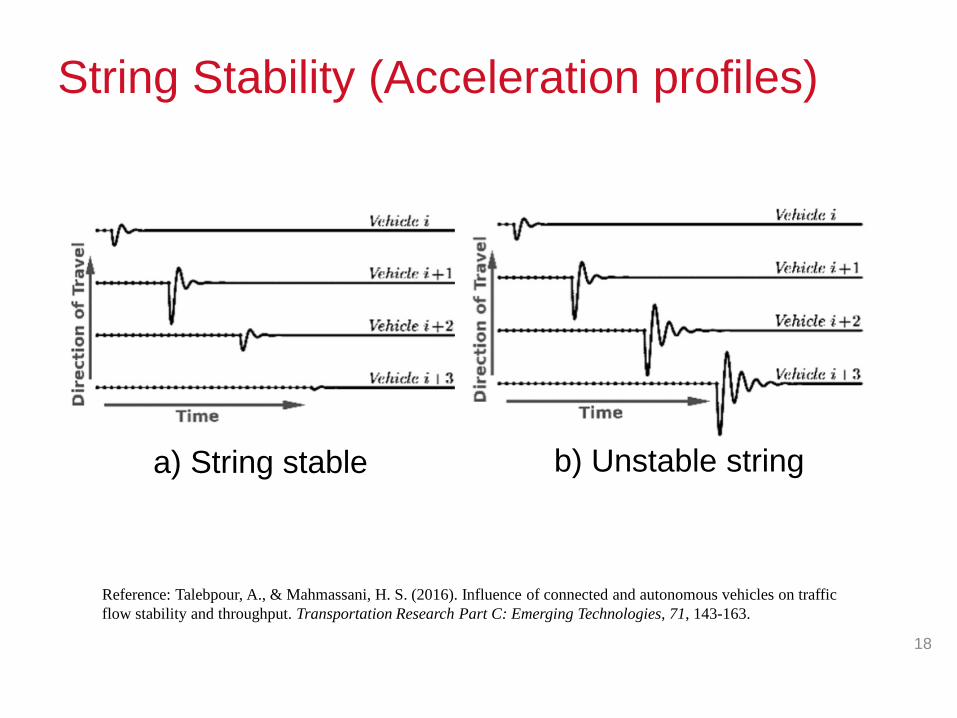
String Stability (Acceleration profiles)
18
a) String stable b) Unstable string
Reference: Talebpour, A., & Mahmassani, H. S. (2016). Influence of connected and autonomous vehicles on traffic flow stability and throughput. Transportation Research Part C: Emerging Technologies, 71, 143-163.
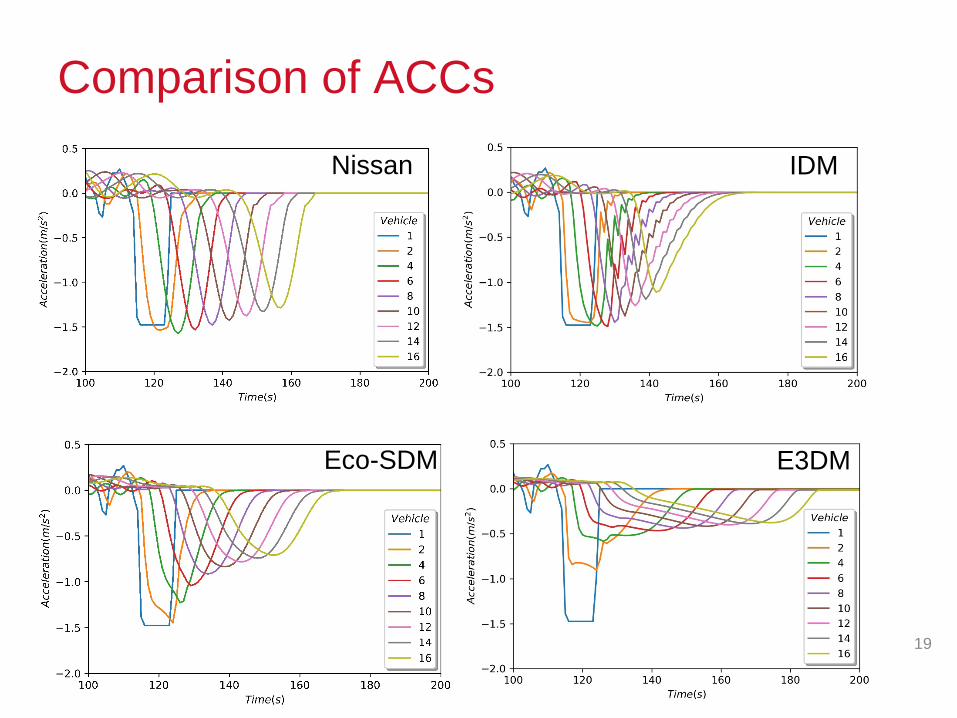
Comparison of ACCs
19
Nissan IDM
Eco-SDM E3DM
Simulation
traffic stream with 1000 vehicles
a single lane
the platoon size ranges from 14 to 81 vehicles
20
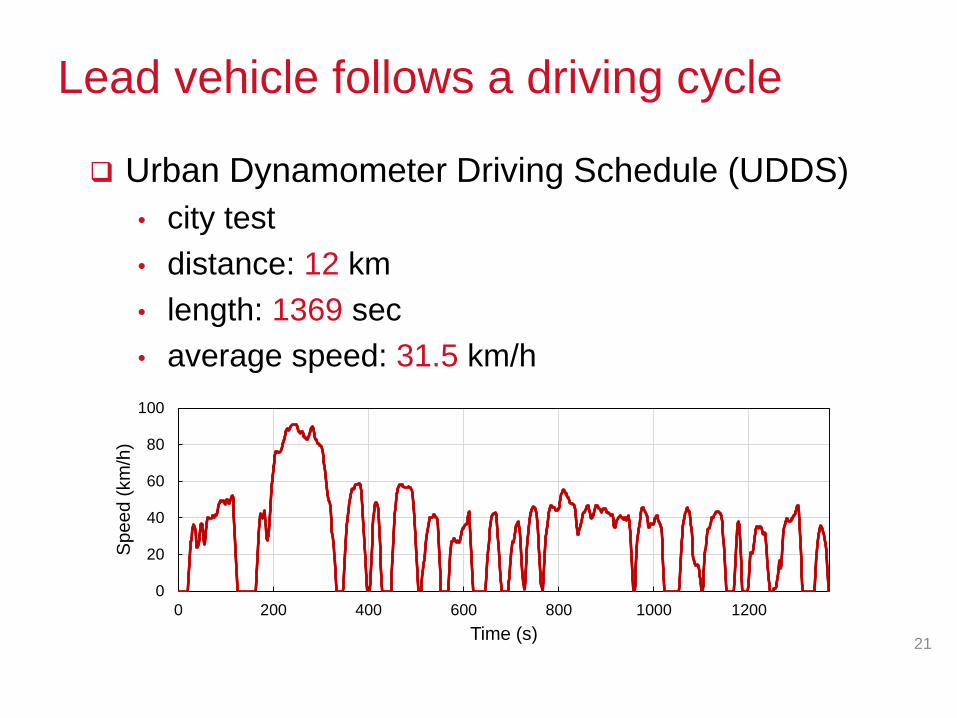
Lead vehicle follows a driving cycle
Urban Dynamometer Driving Schedule (UDDS)• city test• distance: 12 km• length: 1369 sec• average speed: 31.5 km/h
21
0
20
40
60
80
100
0 200 400 600 800 1000 1200
Spe
ed (k
m/h
)
Time (s)
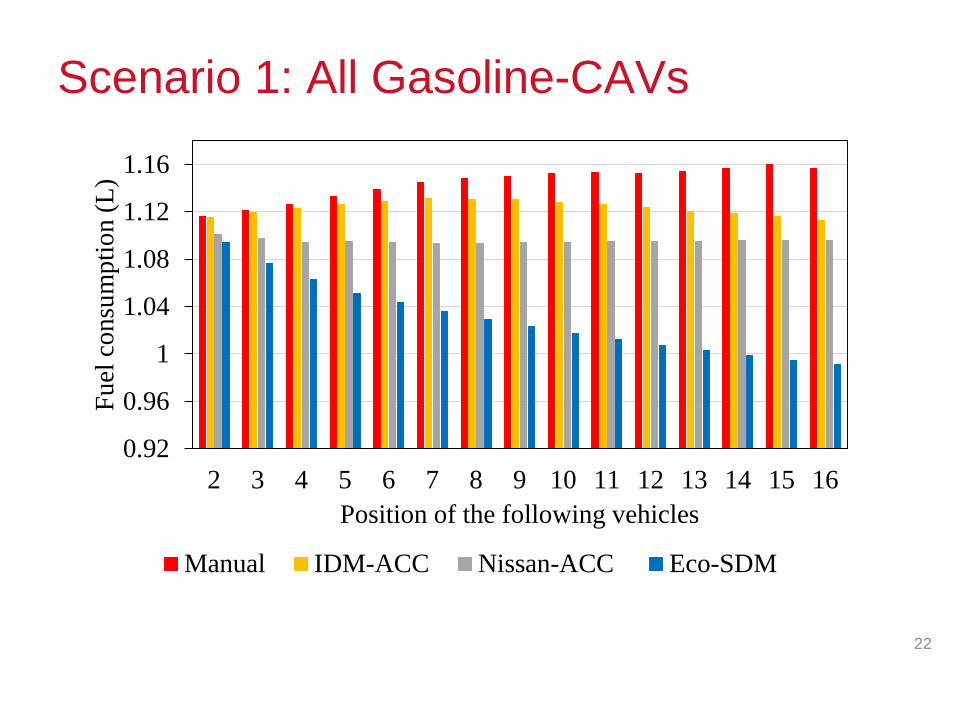
Scenario 1: All Gasoline-CAVs
22
0.92
0.96
1
1.04
1.08
1.12
1.16
2 3 4 5 6 7 8 9 10 11 12 13 14 15 16
Fuel
con
sum
ptio
n (L
)
Position of the following vehicles
Manual IDM-ACC Nissan-ACC Eco-SDM
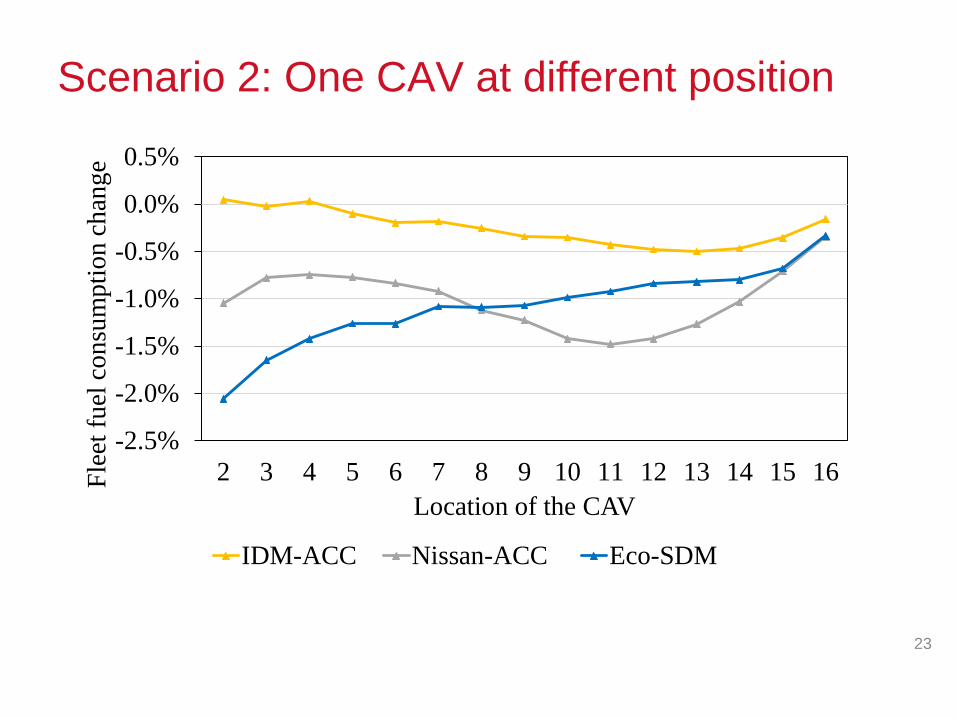
Scenario 2: One CAV at different position
23
-2.5%
-2.0%
-1.5%
-1.0%
-0.5%
0.0%
0.5%
2 3 4 5 6 7 8 9 10 11 12 13 14 15 16Flee
t fue
l con
sum
ptio
n ch
ange
Location of the CAV
IDM-ACC Nissan-ACC Eco-SDM
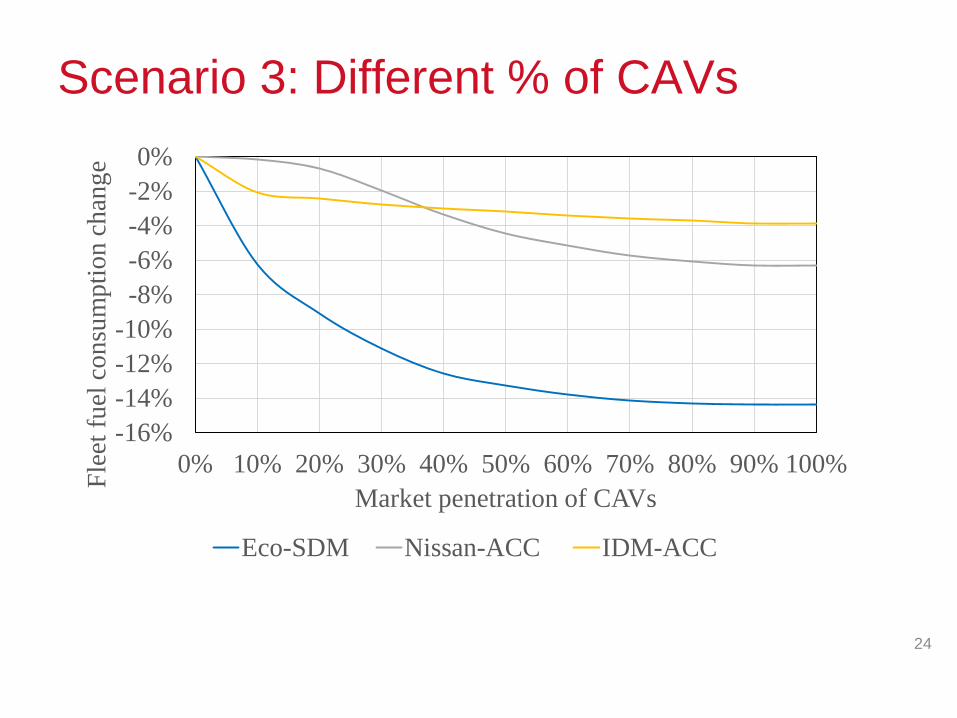
Scenario 3: Different % of CAVs
24
-16%-14%-12%-10%-8%-6%-4%-2%0%
0% 10% 20% 30% 40% 50% 60% 70% 80% 90% 100%Flee
t fue
l con
sum
ptio
n ch
ange
Market penetration of CAVs
Eco-SDM Nissan-ACC IDM-ACC
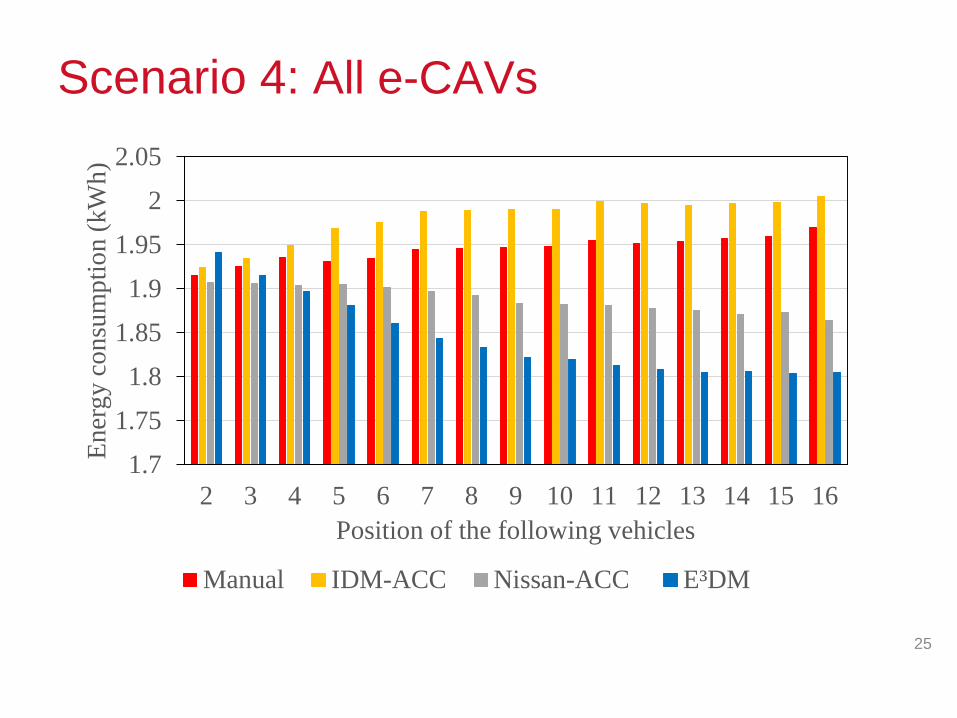
Scenario 4: All e-CAVs
25
1.7
1.75
1.8
1.85
1.9
1.95
2
2.05
2 3 4 5 6 7 8 9 10 11 12 13 14 15 16
Ener
gy c
onsu
mpt
ion
(kW
h)
Position of the following vehicles
Manual IDM-ACC Nissan-ACC E³DM
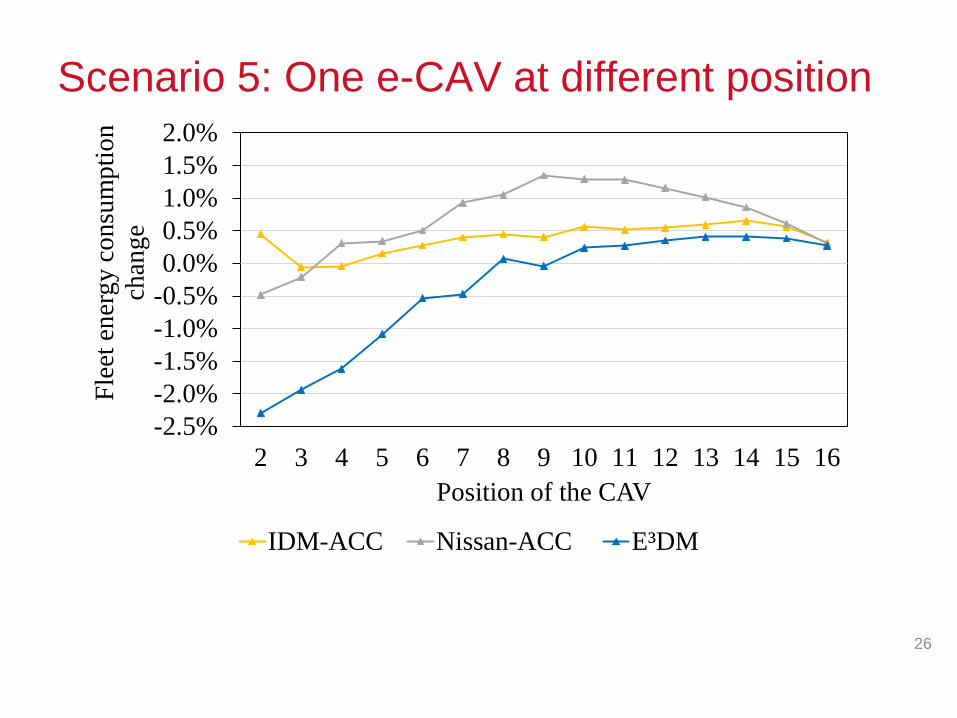
Scenario 5: One e-CAV at different position
26
-2.5%-2.0%-1.5%-1.0%-0.5%0.0%0.5%1.0%1.5%2.0%
2 3 4 5 6 7 8 9 10 11 12 13 14 15 16
Flee
t ene
rgy
cons
umpt
ion
chan
ge
Position of the CAV
IDM-ACC Nissan-ACC E³DM
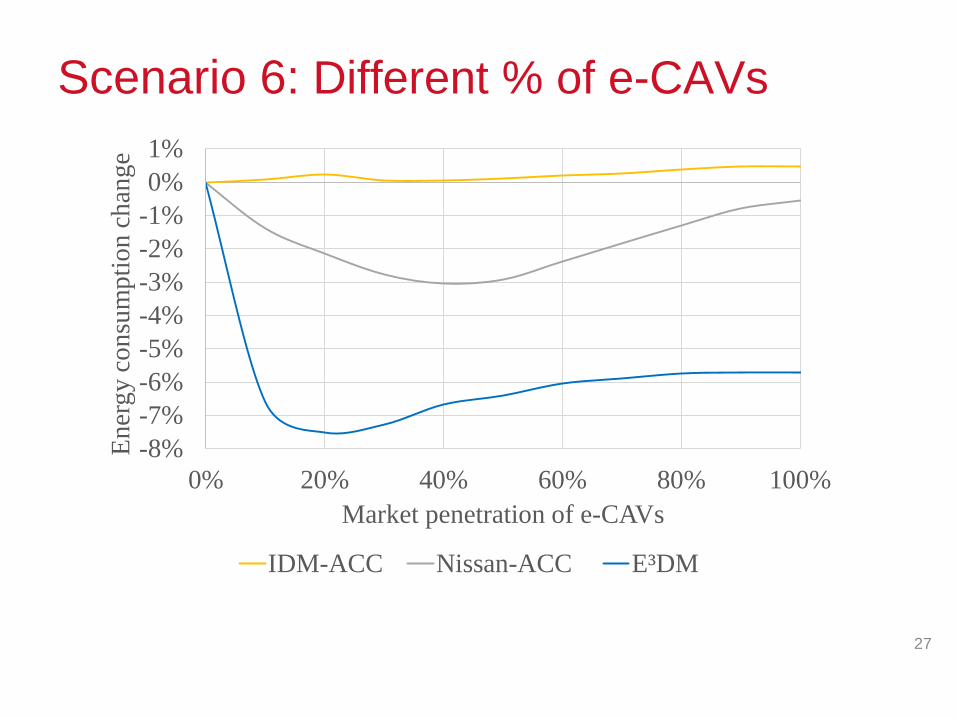
Scenario 6: Different % of e-CAVs
27
-8%-7%-6%-5%-4%-3%-2%-1%0%1%
0% 20% 40% 60% 80% 100%
Ener
gy c
onsu
mpt
ion
chan
ge
Market penetration of e-CAVs
IDM-ACC Nissan-ACC E³DM
Conclusion
Gasoline vehicles• a CAV fleet consumes less fuel than a manual
vehicle fleet;• 1 CAV at the front of a mixed fleet has larger
impacts on the fleet fuel efficiency;• higher % of CAV leads to more fuel savings, but
the marginal benefit diminishes after about 30%.
28
Conclusion
Electric vehicles• a E3DM-equipped CAV fleet consumes less
energy than a manual vehicle fleet;• 1 e-CAV at the front of a mixed fleet has larger
impacts on the energy efficiency;• The higher % of e-CAVs may not result in better
energy efficiency of the entire fleet.• With E3DM, the highest fleet-level energy
efficiency is achieved when the market penetration of e-CAVs is 20%.
29
ReferenceYao, E., Wang, M., Song, Y. and Zhang, Y., 2014. Estimating energy consumption on the basis of microscopic driving parameters for electric vehicles. Transportation Research Record: Journal of the Transportation Research Board, (2454), pp.84-91.Yang, S.C., Li, M., Lin, Y. and Tang, T.Q., 2014. Electric vehicle’s electricity consumption on a road with different slope. Physica A: Statistical Mechanics and its Applications, 402, pp.41-48.Ahn, K., Rakha, H., Trani, A. and Van Aerde, M., 2002. Estimating vehicle fuel consumption and emissions based on instantaneous speed and acceleration levels. Journal of transportation engineering, 128(2), pp.182-190.Dong, J. and Hu, L., 2017. Investigation of the Link Between Macroscopic Traffic Flow Characteristics and Individual Vehicle Fuel Consumption.Greene, D.L., Liu, J., Khattak, A.J., Wali, B., Hopson, J.L. and Goeltz, R., 2017. How does on-road fuel economy vary with vehicle cumulative mileage and daily use?. Transportation Research Part D: Transport and Environment, 55, pp.142-161.Fiori, C., Ahn, K. and Rakha, H.A., 2016. Power-based electric vehicle energy consumption model: Model development and validation. Applied Energy, 168, pp.257-268.S. Akhegaonkar, L. Nouvelière, S. Glaser, and F. Holzmann, “Smart and Green ACC : Energy and Safety Optimization Strategies for EVs,” IEEE Trans. Syst. Man, Cybern. Syst., vol. PP, no. 99, pp. 1–12, 2016.Z. Wang, X. M. Chen, Y. Ouyang, and M. Li, “Emission Mitigation via Longitudinal Control of Intelligent Vehicles in a Congested Platoon,” Comput. Civ. Infrastruct. Eng., vol. 30, no. 6, pp. 490–506, 2015
31
ReferenceTalebpour and H. S. Mahmassani, “Influence of connected and autonomous vehicles on traffic flow stability and throughput,” Transp. Res. Part C Emerg. Technol., vol. 71, pp. 143–163, 2016P. A. Ioannou and M. Stefanovic, “Evaluation of ACC vehicles in mixed traffic: Lane change effects and sensitivity analysis,” IEEE Trans. Intell. Transp. Syst., vol. 6, no. 1, pp. 79–89, 2005.Wu, X., X. He, G. Yu, A. Harmandayan, and Y. Wang. Energy-Optimal Speed Control for Electric Vehicles on Signalized Arterials. IEEE Transactions on Intelligent Transportation Systems, Vol. 16, No. 5, pp. 2786–2796, 2015S. Park, H. A. Rakha, K. Ahn, K. Moran, B. Saerens, and E. Van Den Bulck, “Predictive Ecocruise Control System Model Logic and Preliminary Testing,” Transp. Res. Rec. J. Transp. Res. Board, vol. 2270, pp. 113–123, 2012.K. Ahn, H. A. Rakha, and S. Park, “Ecodrive Application Algorithmic Development and Preliminary Testing,” Transp. Res. Rec. J. Transp. Res. Board, vol. 2341, pp. 1–11, 2013.C. Lu, L. Hu, and J. Dong, “Ecological Adaptive Cruise Control in a Traffic Stream with Mixed Autonomous and Manually Driven Vehicles.” Presented at Transportation Research Board 97th Annual Meeting, January 7-11, 2018-Washington, D.C.U.S Environmental Protection Agency. Dynamometer Drive Schedules. https://www.epa.gov/vehicle-and-fuel-emissions-testing/dynamometer-drive-schedules. Accessed Jul. 28, 2017.
32