Energy Efficiency Tax Incentives in the Context of Tax Reform
37
© American Council for an Energy-Efficient Economy 529 14 th Street NW, Suite 600, Washington, DC 20045 Phone: (202) 507-4000 Twitter: @ACEEEDC Facebook.com/myACEEE www.aceee.org Energy Efficiency Tax Incentives in the Context of Tax Reform Steven Nadel July 2012 An ACEEE Working Paper
Transcript of Energy Efficiency Tax Incentives in the Context of Tax Reform

© American Council for an Energy-Efficient Economy
529 14th Street NW, Suite 600, Washington, DC 20045
Phone: (202) 507-4000 Twitter: @ACEEEDC
Facebook.com/myACEEE www.aceee.org
Energy Efficiency Tax Incentives in the Context of Tax Reform
Steven Nadel
July 2012
An ACEEE Working Paper


i
Contents ACEEE Tax Reform Working Papers .............................................................................................................. ii
Acknowledgments .............................................................................................................................................. ii
Executive Summary ........................................................................................................................................... iii
Introduction .........................................................................................................................................................1
Current and Past Energy Efficiency Tax Incentives........................................................................................1
Energy Tax Act of 1978 ..................................................................................................................................2
Energy Policy Act of 2005 ..............................................................................................................................3
Energy Efficiency Tax Incentives with Tax Reform ........................................................................................8
The Need ..........................................................................................................................................................8
Barriers .............................................................................................................................................................8
Role of Energy Efficiency Tax Incentives in Tax Reform ..........................................................................9
Targeting Energy Efficiency Tax Incentives ............................................................................................. 10
Reducing Costs—Repayable Tax Incentives ............................................................................................ 10
Relationship Between Federal Energy Efficiency Tax Incentives and Other Policies to Promote
Energy Efficiency ......................................................................................................................................... 11
Analysis of Potential Savings and Cost-Effectiveness ............................................................................. 12
Conclusion ......................................................................................................................................................... 14
References .......................................................................................................................................................... 15
Appendix A: Estimating Costs and Benefits of Energy-Efficiency Tax Incentives: Methodology, Data
Sources and Detailed Analysis Results ........................................................................................................... 19

ii
ACEEE Tax Reform Working Papers This is the fourth in a series of working papers on tax reform issues related to energy efficiency that
ACEEE is preparing in 2012. We welcome feedback on this working paper. Send comments to
[email protected]. We also welcome suggestions on other topics to cover.
UPDATE: A summary report on this and the other working papers was published in February 2013
and is available at http://aceee.org/research-report/e132.
Acknowledgments Thanks to Kate Farley for helping compile portions of this paper. Several ACEEE colleagues provided
useful comments on a draft of this paper—Neal Elliott, Therese Langer, Sara Hayes, and Maggie
Molina. Renee Nida edited this paper. To all of them I am thankful.
Funding for this work was provided by the Kresge Foundation, Energy Foundation, and a third
foundation wishing to remain anonymous.

iii
Executive Summary Over the years, Congress has enacted hundreds of tax incentives in order to encourage activities it
considered desirable. These tax incentives have been politically popular because once enacted they do
not require an annual appropriation and also because they reduce taxes for voters. However, the U.S.
government’s growing debt and chronic budget deficits mean that tax incentives are now under the
microscope. There is interest on both sides of the Congressional aisle in tax reform that would
simplify the tax code and reduce marginal tax rates.
This paper looks at tax incentives for energy efficiency in the context of tax reform. A review of
experience with current and past energy efficiency tax incentives finds that the 10 percent energy
efficiency tax credits enacted in 1978 were not very effective in spurring substantial energy savings as
these credits promoted tried-and-true energy efficiency measures that many consumers and
businesses were installing on their own, resulting in high expenditures for “free riders”—consumers
and businesses who would have installed the efficiency measures even without a tax credit.
Furthermore, the value of the tax credit was too small to spur additional installations.
Tax incentives enacted in 2005 were more targeted, emphasizing advanced technologies and paying
higher incentives. The new homes and appliance tax incentives were particularly effective in spurring
a much higher market share for qualifying homes and appliances and in the case of appliances have
led to a permanent transformation of the market. Credits for heavy-duty hybrid vehicles, furnaces, air
conditioners, and heat pumps have also been effective in spurring product introductions and
increased market share. On the other hand, the windows tax credit had high levels of free riders and
some of the other tax incentives had low participation, resulting in low impacts but also low costs.
We review the large cost-effective opportunities for energy efficiency investments and some of the
market barriers that hinder these investments. To overcome these barriers will require a variety of
strategies. As discussed in other papers in this series (noted in the References), modest and major
reforms to the tax code will help. In addition, targeted tax incentives can also help, just as many of the
incentives enacted in 2005 have made a difference. However, given current budget deficits, funds for
energy-related tax incentives will be very limited. It is very unlikely that all energy-related tax
incentives will be phased out. Therefore, we recommend that a specific budget be developed for
energy-related tax incentives and this budget be allocated in ways that will maximize benefits per
dollar of federal expenditure.
Experience with past tax incentives helps show the most effective ways to apply limited funds. Federal
energy incentives should target only technologies or processes that provide a societal good in the
energy sector, such as reducing energy use and saving money or encouraging new energy sources that
will be important in the long term. We recommend that these limited available funds target
technologies or practices that are not widespread, but that with medium-term support (e.g., 5 years)
can experience market transformation and become much more widely used even after tax incentives
end. Recent examples of such tax incentives include the appliance tax credit and the new homes tax
credit. An example outside of energy efficiency might be the wind energy production tax credit,
which helped to establish a major U.S. wind energy industry. There is now general agreement that the
credit can be phased out, although there is disagreement on the length of the phase-out period.

iv
Based on the experience with recent energy efficiency tax incentives, we recommend that future
energy incentives should:
Target energy-saving equipment and practices with substantial energy savings—we want
“mountains” not “molehills”);
Target only technologies or processes that provide a societal good in the energy sector, such
as reducing energy use and saving money or encouraging new energy sources that will be
important in the long term;
Target efficiency levels and new energy sources that currently have a very small market share
to keep costs down and minimize the number of “free riders”;
Pay substantial incentives to motivate significant sales; and
Be in place for a medium period of time (e.g., 5 years) so manufacturers and other market
players know incentives will be available for long enough that it is worth making investments.
Short-term incentives do not provide such assurance. After this medium period of time,
incentives should either be phased out or eligibility levels increased, starting a new market
transformation process.
In addition, for measures that are expensive and for which quick market transformation is not
possible, such as comprehensive home and commercial building energy efficiency retrofits, Congress
should enact initial tax incentives to help spur market growth, but then consider transitioning to
repayable incentives after the initial 5-year incentive ends.
Repayable tax incentives are a way to limit long-term costs to the Treasury by requiring recipients to
repay the incentive over time as benefits are realized. The initial credit helps reduce the upfront cost
of the investment, and the latter payments reduce the cost to the Treasury. For example, if a business
receives an initial tax credit of $100,000 on a combined heat and power (CHP) system the year the
system was placed into service, they might repay the federal credit at the rate of $20,000 per year over
the next 5 years. The initial credit encourages the investment, and the subsequent repayments
channel the value of some of the energy bill savings back to the federal government, so that the long-
term cost to the federal government is very low—just defaults plus interest costs. Essentially this
would be a zero-interest loan.
To help guide how to put these principles into action, we analyzed the costs and savings of a 5-year
federal tax credit for high-efficiency products and services, including estimated effects on the market
for these products and services over the following decade. Results of this analysis are summarized in
Table ES-1.

v
Table ES-1. Costs, Savings, and Federal Cost per Btu of Different Energy Efficiency Tax
Incentives
All of the tax incentives examined are highly cost-effective, with a federal cost of $0.02–2.33 per
million Btu of energy saved, far less than the approximately $10 per million Btu we now pay for
energy. The new construction and equipment (appliances, air conditioners, furnaces, water heaters,
and advanced windows) are particularly cost-effective (less than $1 per million Btu, with most less
than $0.35 per million Btu saved) because they can help permanently transform markets by laying the
foundation for improvements to building codes and product efficiency standards. The commercial
building retrofit and CHP system incentives are also very cost-effective. Retrofitting homes and
replacing chillers are more expensive but still very cost-effective, with federal costs ranging from
$1.33–2.33 per million Btu saved. These measures also have less of a long-term market
transformation effect. While not included in this analysis, we plan to analyze incentives for heavy-
duty hybrid vehicles and light-duty electric vehicles soon.
All of the measures listed have a 5-year cost to the Treasury of about $13 billion, which is less than $3
billion per year. If funds are more limited, we would recommend concentrating on the most cost-
effective items and further refining criteria to reduce the cost of items that have a 5-year cost of more
than $1 billion. For some of these items (those with a substantial credit per taxpayer), repayable
incentives can also be considered.
These tax incentives are highly cost-effective investments, which will continue to pay off via energy
bill reductions for decades to come. These tax incentives will leverage very substantial private
investments as the tax incentives cover only a portion of the cost of efficiency measures.
Furthermore, these tax incentives will help our economy as investments in energy efficiency help to
create jobs, including direct jobs in the production and installation of efficient technologies and
Five-Tear
Cost to Electricity Savings Fuel Savings Federal $/
Treasury 5th Year 15th Year Lifetime 5th Year 15th Year Lifetime Lifetime
Item ($millions) (GWh) (GWh) (GWh) (TBtu) (TBtu) (TBtu) mBtu Rank
Increasing commercial building deduction to $3/sf $52 552 2,636 158,139 2 10 599 $0.02 1
New homes -- extend current credit 1,076 2,590 14,608 876,505 10 96 5,785 0.07 2
Commercial building retrofits (20%+ savings) 843 14,349 34,678 520,164 40 106 1,596 0.12 3
Water heaters -- heat pump and advanced gas 1,308 3,841 32,035 416,459 7 95 1,229 0.24 4
CHP -- remove size cap but limit to 25 MW/system 270 0 0 0 38 64 956 0.28 5
A/C & HP SEER 16 installed per ACCA-QI 2,426 8,162 35,262 634,707 13 94 1,698 0.30 6
Residential appliances -- extend and update 1,148 2,624 18,371 275,562 3 41 612 0.34 7
Furnaces (95% AFUE + efficient fan) 901 897 3,545 63,808 13 105 1,886 0.36 8
Advanced windows (DOE U .22 spec) 504 538 2,984 59,674 3 16 328 0.54 9
New homes -- 50% whole home savings 646 1,203 3,488 69,758 7 21 411 0.58 10
Whole house retrofits (20%+ savings) 1,875 1,269 3,808 68,544 13 40 722 1.33 11
Replace CFC industrial & commercial chillers 236 1,665 0 16,646 0 0 0 1.42 12
Insulation and sealing for homes per 25C 2,022 1,540 1,586 31,717 22 27 549 2.33 13
Totals $13,300 39,200 153,000 3,191,700 170 720 16,400 $0.28

vi
induced jobs created as consumers and businesses re-spend their energy bill savings. For these
reasons, modest medium-term federal energy efficiency tax incentives that help leverage long-term
changes in markets should be included as part of tax reform.

Energy Efficiency Tax Incentives
1
Introduction Over the years, Congress has enacted hundreds of tax incentives in order to encourage activities it
considered desirable. These tax incentives have been politically popular because once enacted they do not
require an annual appropriation and also because they reduce taxes for voters. However, the U.S.
government’s growing debt and chronic budget deficits mean that tax incentives are now under the
microscope. There is interest on both sides of the Congressional aisle in tax reform that would simplify
the tax code and reduce marginal tax rates.
This paper looks at tax incentives for energy efficiency in the context of tax reform. We do not look at tax
incentives for other energy sources, such as renewable energy, nuclear, oil, and natural gas, except for a
few places where we try to put energy efficiency incentives in context relative to other energy tax
incentives. We begin by reviewing experience with current and past energy efficiency tax incentives. We
then discuss opportunities for energy efficiency tax incentives and strategies for constructing such tax
incentives so they are low cost and could potentially fit into tax reform plans.
Readers are also encouraged to read the other papers in this series. This paper on tax incentives is the
fourth in a multi-part series of working papers by ACEEE on tax reform. We plan to issue a revised
version in late 2012. We welcome any comments or feedback, which may be sent to us at
Current and Past Energy Efficiency Tax Incentives The current tax code includes some energy efficiency incentives, most established in the Energy Policy Act
of 2005 but modified since then. These include:
Commercial building tax deduction—Incentive of up to $1.80 per square foot for new and
renovated commercial buildings that use half the energy of a building built to model codes;
Plug-in electric drive vehicles—A credit of $2,500–7,500 per vehicle weighing less than 14,000
pounds gross capacity, with the incentive varying by battery capacity;
CHP systems—Investment tax credit of 10 percent of cost for eligible systems;
Ground source heat pumps—Investment tax credit of 30 percent of the cost for eligible systems;
Fuel cells—A credit of 30 percent of cost up to a maximum of $3,000 per kW of power that can be
produced; and
Microturbines—Investment tax credit of 10 percent of cost up to a maximum of $200 per kW of
power that can be produced.
Other incentives were provided over the 2005–2011 period for the following but have since expired:
Upgrades to residential buildings including: insulation, windows, heating and cooling systems
and water heaters
Construction of new homes that use half the energy of a home built to model codes
Manufacture of high-efficiency refrigerators, clothes washers, and dishwashers
Purchase of hybrid, advanced diesel, and fuel cell light-duty vehicles, and hybrid commercial
vehicles.

Energy Efficiency Tax Incentives © ACEEE
2
In addition, in 1978 Congress enacted a 15 percent tax credit for residential energy efficiency measures
and a 10 percent tax credit for energy efficiency investments by businesses. The residential credits ended
in 1985, the business credits in 1982.
In the following sections we summarize the experience with energy efficiency tax incentives in both the
1970’s and the 2000’s with a focus on lessons learned.
ENERGY TAX ACT OF 19781
Tax incentives were enacted during the 1970s to stimulate adoption of both residential and industrial
energy efficiency measures. The Energy Tax Act of 1978 included a 15 percent tax credit up to a
maximum of $300 (i.e., a 15 percent credit on expenditures up to $2,000) for residential conservation and
renewable energy investments made between April 1977 and December 1985. Eligible conservation
measures included insulation, storm windows and doors, weather stripping, and furnace modifications—
standard energy efficiency measures at that time. During 1978–85, there were about 30 million claims for
the residential energy conservation and renewable energy credits, amounting to nearly $5 billion in lost
revenues for the Treasury.
Early studies of the net benefits of the residential tax credit were deemed inconclusive (OTA 1992) due, in
part, to the fact that a variety of policy and market changes occurred simultaneously. However, evidence
emerged that the tax credit had relatively little impact on consumer behavior. First, a household survey
conducted in 1983 found that 85 percent of households that implemented energy efficiency retrofits in
1983 did not claim a tax credit; in addition, 88 percent of the households that claimed a credit that year
said they would have made the improvement even if the credit had not been available (EIA 1986). Also,
the credits tended to be used by wealthier owner-occupied households. Based on this information as well
as the small size of the credit, lack of promotion, and administrative burdens, one review concluded that
the credit itself probably did little to motivate retrofitting and that most recipients were free riders who
would have made the efficiency investment without the incentive (OTA 1992).
The Energy Tax Act of 1978 also included a 10 percent tax credit for specified energy efficiency measures
installed by businesses. The measures covered included heat recovery equipment, waste heat boilers,
energy control systems, and economizers (GAO 1985). The Act was amended in 1980 to add cogeneration
equipment to the list of eligible measures. This credit was in effect during 1978–82 and it also cost the
Treasury approximately $5 billion. Surveys and analyses indicated that due primarily to the small
magnitude, the credit had little effect on corporate decision-making (ASE 1983; OTA 1983). In other
words, most of the measures probably would have been installed without incentives, indicating a high free
rider level. The industrial tax credit also has been criticized for covering a relatively limited list of
conventional "add-on" efficiency measures and thereby not supporting technological innovation (ASE
1983). The credits generally did not address opportunities for industrial process improvement, nor were
they based on performance.
1 This section is taken from Quinlan, Geller, and Nadel (2001).

Energy Efficiency Tax Incentives
3
In summary, it appears that both the residential and industrial tax credits in effect during 1978–85 cost
the Treasury a substantial amount of money but had relatively little net impact on fostering energy
efficiency improvements. The credits were relatively small in percentage terms while eligibility was limited
to widely available and commonly adopted efficiency measures. Consequently, free rider levels were
probably very high.
ENERGY POLICY ACT OF 2005
At the beginning of the 21st century, energy efficiency tax incentives again came under discussion but with
a focus on encouraging advanced energy-saving technologies. The original discussions started in 1996
during the Clinton Administration. For example, in 2000 President Clinton proposed a variety of tax
incentives as part of the Climate Change Technology Initiative (White House 2000). In subsequent years,
this proposal went through many changes before being adopted by a Republican Congress and signed by
President George W. Bush as part of the Energy Policy Act of 2005.
In 2011, ACEEE reviewed the experience with these tax incentives (Gold and Nadel 2011). Overall, this
these tax incentives were generally effective in spurring adoption of energy-saving measures, but that
some of the incentives were more effective and more cost-effective than others.
Of the tax incentives, probably the most successful were the appliance and new home tax incentives. The
appliance incentives provided per-unit credits to manufacturers for the production of the most efficient
refrigerators, clothes washers, and dishwashers. The original incentives only applied to appliances
produced in the United States during 2006 and 2007, and had a total cap of $75 million per manufacturer.
These tax incentives were extended to cover 2008–2010 and incentive levels were made more stringent as
a part of the Emergency Economic Stabilization Act of 2008. They were extended again in 2011 as a part
of the Middle Class Tax Relief Act of 2010, with incentive levels adjusted to focus on even more efficient
products.
The tax incentives encouraged manufacturers to produce more of their highest efficiency products on the
market and to offer related discounts and promotions on these units. As these products gained greater
market share, the ENERGY STAR specifications were tightened, and the next phase of the tax incentives
was adjusted to increase tax credit qualification levels. Figure 1 shows the market transformation of
refrigerators and clothes washers that has occurred in recent years, spurred in part by these tax incentives.
Ultimately the efficiency levels originally covered by the 2005 incentives became the basis for new
minimum efficiency standards adopted by DOE in 2012. Due to the significant growth in the market for
high-efficiency appliances supported by these incentives, appliance manufacturers supported the increase
in minimum efficiency standards to these levels.
Fortunately, the cost of these incentives has been moderate due to the cap on incentive per manufacturer
plus the very high eligibility level. The Joint Committee on Taxation (JCT), in 2010, estimated that the
cost to the Treasury of revising and extending the credit into 2011 would be $78 million (JCT 2010).
However, in 2010 and 2011 manufacturers emphasized sales of the very highest efficiency levels, which
were not subject to the cap. This raised the cost. In 2012, based on the most recent data, JCT estimated
that a 1-year extension of the appliance tax credit would cost the Treasury $644 million (JCT 2012). In

Energy Efficiency Tax Incentives © ACEEE
4
our analysis later in this report, we look at an option that would result in costs midway between these two
estimates.
Figure 1. Market Transformation of Refrigerators and Clothes Washers, 2000–2015
Note: MEF is Modified Energy Factor, a measure of clothes washer efficiency.
Another successful tax incentive is the new home tax credit, which has significantly raised the market
share of qualifying energy-efficient homes at a modest cost. This provision provided a credit of $2,000 for
builders of homes that use 50 percent less energy for space heating and cooling than homes built
according to the 2004 supplement to the International Energy Conservation Code (IECC). The credit was
extended in the Emergency Economic Stabilization Act of 2008 until December 31, 2009, lapsed in 2010,
but was renewed to cover new homes built in 2010 and 2011 as a part of the Middle Class Tax Relief Act
of 2010.
The tax credit has been successful in moving the new homes market toward more energy-efficient
homes. As shown in Table 1, the number of homes participating in the credit grew four-fold between 2006
and 2009. In addition, energy-efficient homes gained a greater market share, as the number of homes
certified as complying with the tax credit rose to 10 percent of new homes sold in 2009, although due to
the recession the number of new homes declined substantially. The proportion of new homes qualifying
for the new homes tax credit declined to 7 percent in 2010, presumably largely because the incentive
lapsed at the beginning of the year. It was extended retroactively in December 2010, but was not in effect
when builders were making decisions on energy efficiency (RESNET 2012). This experience suggests that
the market has been partially transformed but that the incentive continues to drive additional market
share (e.g., an additional 4 percent in 2011).
Clothes Washer Energy Efficiency 2000-2015
0
0.5
1
1.5
2
2.5
3
2000 2002 2004 2006 2008 2010 2012 2014 2016 2018
Mo
dif
ed E
ner
gy F
acto
r (M
EF)
Standard - Top Loading
Standard - Front Loading
EnergyStar
minimum tax credit
maximum tax credit
Refrigerator Energy Efficiency 2000-2015
0.0
100.0
200.0
300.0
400.0
500.0
600.0
700.0
800.0
2000 2002 2004 2006 2008 2010 2012 2014
kWh
/yea
r
Standard
EnergyStar
minimum tax credit
maximum tax credit

Energy Efficiency Tax Incentives
5
Based on the number of new single-family homes eligible in 2011, the maximum cost of this credit for
single-family homes will be $64 million, though it is unlikely that all eligible builders will apply, reducing
the cost. There is also a $1,000 credit for manufactured homes that reduce energy use by 30 percent. In
2010, approximately 4,800 homes qualified (Gold and Nadel 2011) indicating that this provision for
manufactured homes has a maximum cost of less than $5 million.2 Costs are likely to increase some as the
home construction industry recovers from the recession.
Table 1. Number of New Homes Certified as Qualifying for the Federal Tax Credit
Year Number of Homes Verified as Qualified for the Tax Credit
Percent of New Homes Sold
2006 7,110 0.7%
2007 23,000 3%
2008 22,000 5%
2009 37,000 10%
2010 21,000 7%
2011 32,000 11%
Source: RESNET (2012)
The heavy-duty hybrid vehicle credit in EPAct 2005 was also successful to some degree in encouraging
development and market introduction of new hybrid vehicles. Notwithstanding the large fuel savings
potential from the hybridization of trucks used in urban applications, such as pick-up and delivery and
refuse hauling, heavy-duty hybrid development lags light-duty hybrid development by several years.
Consequently, there were few heavy-duty hybrids available in the early years of the credits. Use of the
credit was also low because the dollar amount of the credits was too low given the high incremental cost of
the heavy-duty hybrid technology. Nonetheless, by the time the credit expired at the end of 2009, ten
manufacturers had placed over 50 eligible hybrid vehicles on the market, and interest in hybrids is very
high in the heavy-duty vehicle market today. The California Hybrid Truck and Bus Voucher Project is a
program that began partially as a result of the availability of this tax credit, and there have been repeated
efforts to renew this credit at the federal level now that the market has shifted. A recent proposal was
included in the Job Creation and Tax Cuts Act introduced by Senator Baucus in the 111th Congress.
Incentives for energy efficiency improvements to existing homes have been successful at spurring sales of
qualifying measures, but have been more expensive. EPAct 2005 also included a Nonbusiness Energy
Property tax credit that provided tax credits for homeowners who installed new energy-efficient central
air conditioners, heat pumps, and water heaters in existing homes. In addition, there were tax credits for
upgrading building envelope components in existing homes, such as windows, insulation, and ENERGY
STAR metal roofs. These provisions were originally for equipment put in place in 2006 and 2007. They
were extended with some changes in eligibility levels as a part of the Emergency Economic Stabilization
Act of 2008, covering improvements installed in 2009, but not 2008. The American Recovery and
2 Maximum cost is 32,000 single-family homes times $2,000 plus 4,800 manufactured homes times $1,000, which equals $68.8
million.
Energy Efficiency Tax Incentives © ACEEE
6
Reinvestment Act (ARRA) extended these through December 2010 and increased the incentive to 30
percent of equipment cost (from 10 percent previously) and increased the cap on incentives from $500 to
$1,500 per household. These credits were extended to 2011, but with the original level of incentives and
$500 limit as a part of the Middle Class Tax Relief Act of 2010.
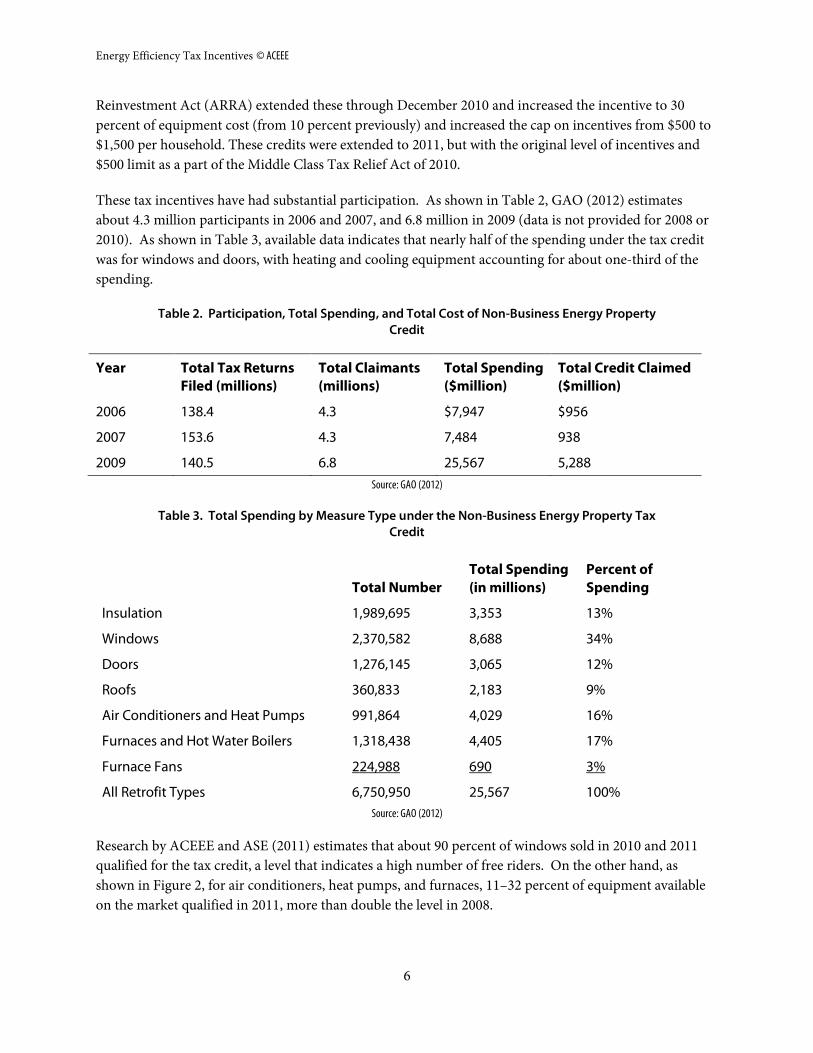
These tax incentives have had substantial participation. As shown in Table 2, GAO (2012) estimates
about 4.3 million participants in 2006 and 2007, and 6.8 million in 2009 (data is not provided for 2008 or
2010). As shown in Table 3, available data indicates that nearly half of the spending under the tax credit
was for windows and doors, with heating and cooling equipment accounting for about one-third of the
spending.
Table 2. Participation, Total Spending, and Total Cost of Non-Business Energy Property Credit
Year Total Tax Returns Filed (millions)
Total Claimants (millions)
Total Spending ($million)
Total Credit Claimed ($million)
2006 138.4 4.3 $7,947 $956
2007 153.6 4.3 7,484 938
2009 140.5 6.8 25,567 5,288
Source: GAO (2012)
Table 3. Total Spending by Measure Type under the Non-Business Energy Property Tax Credit
Total Number Total Spending (in millions)
Percent of Spending
Insulation 1,989,695 3,353 13%
Windows 2,370,582 8,688 34%
Doors 1,276,145 3,065 12%
Roofs 360,833 2,183 9%
Air Conditioners and Heat Pumps 991,864 4,029 16%
Furnaces and Hot Water Boilers 1,318,438 4,405 17%
Furnace Fans 224,988 690 3%
All Retrofit Types 6,750,950 25,567 100%
Source: GAO (2012)
Research by ACEEE and ASE (2011) estimates that about 90 percent of windows sold in 2010 and 2011
qualified for the tax credit, a level that indicates a high number of free riders. On the other hand, as
shown in Figure 2, for air conditioners, heat pumps, and furnaces, 11–32 percent of equipment available
on the market qualified in 2011, more than double the level in 2008.

Energy Efficiency Tax Incentives
7
Other energy efficiency tax incentives have not been as successful, according to Gold and Nadel (2011).
The Commercial Buildings Tax Deduction has resulted in some lighting improvements, but it appears
that the incentive has been too low and application requirements too onerous to result in many qualifying
whole-building improvements. Impacts of the passenger vehicle, fuel cell, and microturbine incentives
have also been modest. The passenger vehicle credit contributed to an increase in the hybrid vehicle
market share from 1.2 percent in 2005 before the credit began to 2.8 percent in 2009. Likewise, regarding
the credit for stationary fuel cells, according to one source cited by Gold and Nadel, the credit helped fuel
cell sales to increase 10 percent in 2006.
While not examined by Gold and Nadel, the CHP tax credit is included in a recent review of CHP policies
by Chittum and Kaufman (2011). This 10 percent investment tax credit was enacted as part of the
Emergency Economic Stabilization Act of 2008. The credit is limited to the first 15 MW of a system's
capacity and is only applicable to systems of 50 MW or smaller. The credit has not been substantially used
by developers, and all uses of the tax credit have been under the unique temporary parameters authorized
by the ARRA, which allows the tax credit to be taken as a grant instead of a tax credit.
Figure 2. Percentage of Air-Conditioner, Heat Pump, and Furnace Shipments Qualifying for
Federal Tax Incentives by Year
Note: Tax incentive was 10 percent of cost in 2008 and 2011 and 30 percent of cost in 2009 and 2010. This likely explains lower penetration in 2011.
Source: AHRI (2012)
0%
5%
10%
15%
20%
25%
30%
35%
40%
45%
Furnace Air Conditioners Heat Pumps
2008
2009
2010
2011
Energy Efficiency Tax Incentives © ACEEE
8
Energy Efficiency Tax Incentives with Tax Reform
THE NEED
Studies by ACEEE and others, such as McKinsey and Company, have found large potential for cost-
effective energy efficiency savings. For example, McKinsey (2009) found:
If executed at scale, a holistic approach would yield gross energy savings worth more than $1.2
trillion, well above the $520 billion needed through 2020 for upfront investment in efficiency
measures (not including program costs). Such a program is estimated to reduce end-use energy
consumption in 2020 by 9.1 quadrillion BTUs, roughly 23 percent of projected demand,
potentially abating up to 1.1 gigatons of greenhouse gases annually.
Looking farther into the future, Laitner et al. (2012) found that by 2050, energy efficiency measures and
practices could reduce U.S. energy use by 42–59 percent relative to current projections, and in the process
save consumers and businesses billions of dollars, raise gross domestic product in 2050 by $100–200
billion, and support 1.3–1.9 million jobs in 2050.
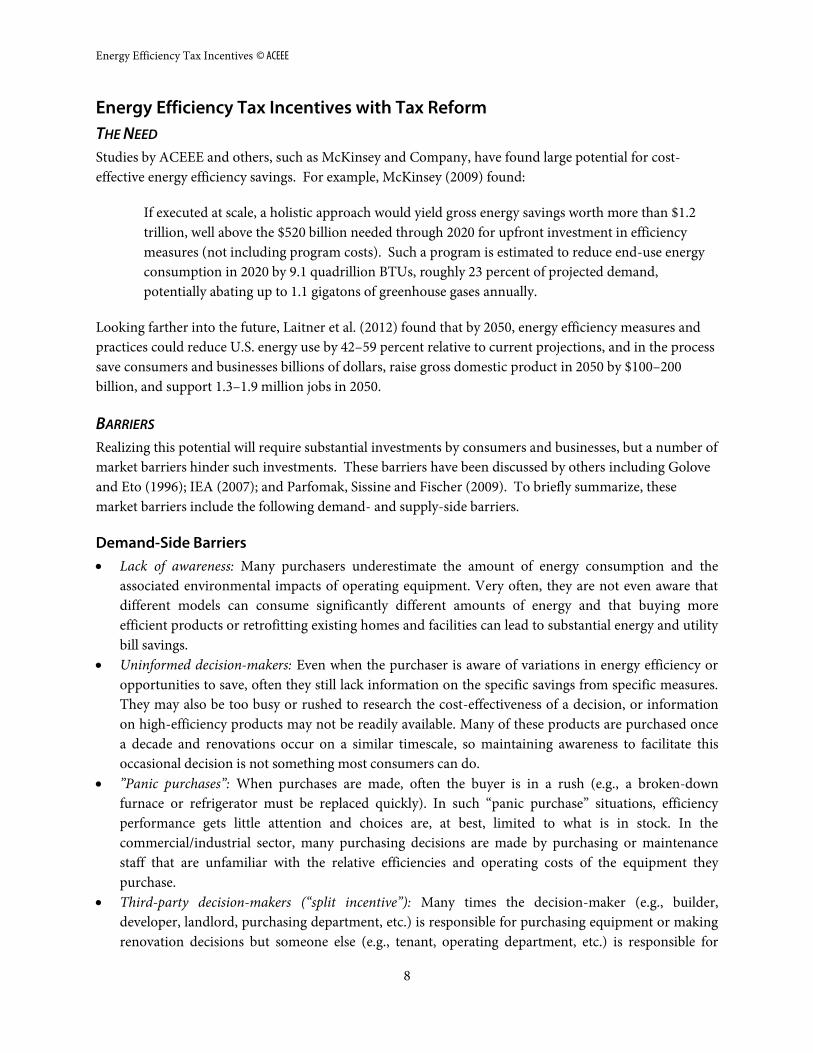
BARRIERS
Realizing this potential will require substantial investments by consumers and businesses, but a number of
market barriers hinder such investments. These barriers have been discussed by others including Golove
and Eto (1996); IEA (2007); and Parfomak, Sissine and Fischer (2009). To briefly summarize, these
market barriers include the following demand- and supply-side barriers.
Demand-Side Barriers
Lack of awareness: Many purchasers underestimate the amount of energy consumption and the
associated environmental impacts of operating equipment. Very often, they are not even aware that
different models can consume significantly different amounts of energy and that buying more
efficient products or retrofitting existing homes and facilities can lead to substantial energy and utility
bill savings.
Uninformed decision-makers: Even when the purchaser is aware of variations in energy efficiency or
opportunities to save, often they still lack information on the specific savings from specific measures.
They may also be too busy or rushed to research the cost-effectiveness of a decision, or information
on high-efficiency products may not be readily available. Many of these products are purchased once
a decade and renovations occur on a similar timescale, so maintaining awareness to facilitate this
occasional decision is not something most consumers can do.
”Panic purchases”: When purchases are made, often the buyer is in a rush (e.g., a broken-down
furnace or refrigerator must be replaced quickly). In such “panic purchase” situations, efficiency
performance gets little attention and choices are, at best, limited to what is in stock. In the
commercial/industrial sector, many purchasing decisions are made by purchasing or maintenance
staff that are unfamiliar with the relative efficiencies and operating costs of the equipment they
purchase.
Third-party decision-makers (“split incentive”): Many times the decision-maker (e.g., builder,
developer, landlord, purchasing department, etc.) is responsible for purchasing equipment or making
renovation decisions but someone else (e.g., tenant, operating department, etc.) is responsible for

Energy Efficiency Tax Incentives
9
paying the energy bills. In these instances, the purchaser tends to buy the least expensive equipment
or cut efficiency improvements from renovation specifications because he or she receives none of the
benefits from improved efficiency.
Financial procedures that overemphasize initial costs and de-emphasize operating costs: In the
commercial/industrial sector, accounting procedures often closely scrutinize capital costs, favoring
purchase of inexpensive equipment, while operating costs are generally less scrutinized. Furthermore,
when operating costs are reduced, the savings typically show up in a corporate-level account and are
rarely passed on to the department that made the decision and the investment. This diversion of
benefits discourages decision-makers from making energy-saving investments.
Supply-Side Barriers
Limited stocking of efficient products: Equipment distributors generally have limited storage space and
therefore only stock equipment that is in high demand. This creates a "Catch-22" situation: users
purchase inefficient equipment so distributors only stock inefficient equipment. Purchasing efficient
equipment thus may require a special order, which takes more time. Most equipment that fails needs
to be replaced immediately. Thus, if efficient equipment is not in stock, even customers who want
efficient equipment are often stuck purchasing standard equipment.
Efficiency bundled into premium products only: Often manufacturers will produce commodity-grade
and value-added product lines. The commodity-grade line just meets efficiency standards and
includes only basic features. The value-added line includes improved efficiency and other extra non-
energy features at a significantly higher cost than commodity-grade products. A portion of the extra
cost is for the improved efficiency but much of the extra cost is for the added “bells and whistles.”
Consumers desiring improved efficiency without the extra features are out of luck.
Shortage of skilled contractors: For many energy-saving projects, skilled contractors are needed to
assess energy saving opportunities, design projects, and implement these projects successfully. In
some regions of the country where efficiency projects have been promoted for many years, such
contractors are available. But in much of the country (e.g., “the Heartland”), such contractors are
often in short supply.
ROLE OF ENERGY EFFICIENCY TAX INCENTIVES IN TAX REFORM
To overcome these barriers will require a variety of strategies. As discussed in other papers in this series
(Nadel and Farley 2012a, 2012b; Sachs et al. 2012), modest and major reforms to the tax code will help. In
addition, targeted tax incentives can also help, just as many of the incentives enacted in 2005 have made a
difference. However, given current budget deficits, funds for energy-related tax incentives will be very
limited. It is very unlikely that all energy-related tax incentives will be ended. Therefore, we recommend
that a specific budget be developed for energy-related tax incentives and this budget be allocated in ways
that will maximize benefits per dollar of federal expenditure. Experience with past tax incentives helps
show the most effective ways to apply limited funds. In the next section, we discuss setting priorities for
energy efficiency tax incentives. In the following section, we also discuss an innovative way to minimize
long-term costs to the Treasury—repayable tax incentives.

Energy Efficiency Tax Incentives © ACEEE
10
TARGETING ENERGY EFFICIENCY TAX INCENTIVES
Federal energy incentives should target only technologies or processes that provide a societal good in the
energy sector, such as reducing energy use and saving money or encouraging new energy sources that will
be important in the long term. We recommend that these limited available funds target technologies or
practices that are not widespread, but that with medium-term support (e.g., 5 years) can experience
market transformation and become much more widely used even after tax incentives end.
As discussed above, recent examples of such tax incentives include the appliance tax credit (Section 45M)
and the new homes tax credit (Section 45L). An example outside of energy efficiency might be the wind
energy production tax credit, which helped to establish a major U.S. wind energy industry. There is now
general agreement the credit can be phased out, although disagreement on the length of the phase-out
period. Likewise, to provide an illustrative example for another energy sector, a tax credit for new
experimental oil and gas drilling techniques could be provided and phased out as the techniques become
established. Based on the experience with recent energy efficiency tax incentives, we recommend that
future energy incentives:
Target energy-saving equipment and practices with substantial energy savings—we want
“mountains” not “molehills”);
Incentives should target only technologies or processes that provide a societal good in the energy
sector, such as reducing energy use and saving money or encouraging new energy sources that
will be important in the long term;
Target efficiency levels and new energy sources that currently have a very small market share to
keep costs down and minimize the number of “free riders”;
Pay substantial incentives to motivate significant sales; and
Be in place for a medium period of time (e.g., 5 years) so manufacturers and other market players
know incentives will be available for long enough that it is worth making investments. Short-
term incentives do not provide such assurance. After this medium period of time, incentives
should either be phased out or eligibility levels increased, starting a new market transformation
process.
In addition, for measures that are expensive and for which quick market transformation is not possible,
such as comprehensive home and commercial building energy efficiency retrofits, Congress should enact
initial tax incentives to help spur market growth, but then consider transitioning to repayable incentives
after the initial 5-year incentive ends. We discuss such repayable tax incentives in the next section. After
this discussion we turn to an analysis we conducted to develop specific priorities for energy efficiency tax
incentives.
REDUCING COSTS—REPAYABLE TAX INCENTIVES
Repayable tax incentives are a way to limit long-term costs to the Treasury by requiring recipients to
repay the incentive over time as benefits are realized. The initial credit helps reduce the upfront cost of
the investment, and the latter payments reduce the cost to the Treasury. For example, if a business
receives an initial tax credit of $100,000 on a combined heat and power system the year the system was

Energy Efficiency Tax Incentives
11
placed into service, they might repay the federal credit at the rate of $20,000 per year over the next five
years. The initial credit encourages the investment, and the subsequent repayments channel the value of
some of the energy bill savings back to the federal government, so that the long-term cost to the federal
government is very low—just defaults plus interest costs. Essentially this would be a zero-interest loan.
This idea has already begun to circulate in Congress. In 2011 Senator Shaheen from New Hampshire
circulated a draft bill that would provide a repayable tax incentive for CHP systems. Under the proposal,
an incentive is given to electric utilities that finance CHP systems. The amount of the incentive is then
repaid to the Treasury through an annual installment payment paid by the customer who owns the CHP
system equal to the amount of the subsidy divided by an installment period, specified in years. In this
case, the installment period is 3 years (e.g., the customer repays the subsidy over 3 years) but payments
don’t begin until the third year after the subsidy is paid (i.e., the customer repays nothing for the first 2
years, then repays one-third of the subsidy each year for the next 3 years). However, this particular
proposal is complicated by the fact that the electric utility receives the tax incentive, but a business that
hosted the CHP system would make the repayment, resulting in some tricky legal issues. These issues
would be much more limited if the same firm received the credit and then made the repayments.
Under current federal procedures for “scoring” the cost of tax expenditures, costs and income are
estimated for each year, as well as a simple total, without any discounting. Thus a $100,000 expense
followed by 5 years of $20,000 repayments would be scored as zero over the life of the program. There
would, however, be some small cost risk to the Treasury based on the potential for businesses or
individuals to go bankrupt before they fully repaid their obligation.
Such a repayable tax incentive would be easier to implement for businesses than for individuals, since
businesses already depreciate capital investments over many years and thus need to track past investments
and depreciation from year to year when compiling their annual taxes. Tracking repayments would be
very similar. Likewise, this system could work well for individuals who use the federal long-form, as this
form already includes such items as capital gains and losses relative to expenditures in previous years.
Such a repayable incentive should probably be limited to fairly large investments, such as an individual
credit of $1,000 or more. Having to go through the extra tracking and paperwork for small investments
probably would not make sense. For example, Senators Snowe, Bingaman, and Feinstein recently
introduced a bill that would provide $2,000–5,000 tax incentives to homeowners who reduced the energy
use of their homes by at least 20 percent (Cut Energy Bills at Home Act, S. 1914). The same Senators are
working on a somewhat similar bill for commercial building retrofits. These incentives are large enough
that adding a repayment provision might be feasible.
RELATIONSHIP BETWEEN FEDERAL ENERGY EFFICIENCY TAX INCENTIVES AND OTHER POLICIES TO
PROMOTE ENERGY EFFICIENCY
In addition to federal tax incentives, there are other policies to promote energy efficiency. Perhaps most
importantly, many utilities offer energy efficiency programs, with budgets now in the billions of dollars
per year. However, these are not offered in all states, and even many of the states with some programs
have only limited efforts. For example, in 2010, ACEEE estimates that utility-sector energy efficiency
expenditures totaled $5.5 billion, but of these expenditures the top ten accounted for 67 percent and the

Energy Efficiency Tax Incentives © ACEEE
12
bottom half accounted for only 7 percent (Sciortino et al. 2011). Federal tax incentives help to serve the
rest of the country. In addition, manufacturers prefer consistency in incentives across the country as
consistency makes it easier and more likely that they will design and sell new products that qualify for the
incentives. In those states with significant utility-sector incentives, program operators will focus
incentives where there are no federal incentives or will fund complementary activities to help promote use
of the federal incentives.
Likewise, other programs and policies can be a useful complement to federal tax incentives. Appliance
and other labels provide useful information to consumers, making them more aware of efficiency choices
and therefore helping to point out high-efficiency products and services that may be eligible for
incentives. Likewise, as discussed above for refrigerators and clothes washers, federal incentives can help
lay a foundation for improved equipment efficiency standards. The same applies to improved building
codes.
ANALYSIS OF POTENTIAL SAVINGS AND COST-EFFECTIVENESS
To help guide how to put these principles into action, we prepared an analysis of the costs and savings of a
5-year federal tax credit for high-efficiency products and services, including estimated effects on the
market for these products and services over the following decade.
Specific tax incentives analyzed are:
Increase the current commercial building tax deduction (section 179D) from $1.80 per square
foot of building floor area to $3 per square foot. This provision primarily applies to new
commercial buildings.
Complement the current commercial building tax deduction with a similar deduction focused on
comprehensive energy-saving retrofits to existing buildings.
Extend the existing new homes tax credit.
Add a higher efficiency tier to the new homes tax credit, targeting 50% savings in whole building
energy use including lighting and appliances.
Extend and update the appliance tax credit.
Extend and update the credit for high efficiency furnaces to strengthen the qualifying criteria
relative to that in the 25C credit that expired at the end of 2011. Specifically, we examine a
furnace with a 95% efficiency and a high-efficiency furnace fan.
Extend and update the credit for high-efficiency air conditioners and heat pumps strengthening
the qualifying criteria relative to that in the 25C credit that expired at the end of 2011.
Specifically, we examine a unit with an efficiency rating of 16 (Seasonal Energy Efficiency Ratio—
SEER) that is installed in a quality manner in accordance with a quality installation specification
developed by the Air-Conditioning Contractors of America (ACCA). The specification is called
ACCA-QI. Quality installation will increase energy savings.
Extend and update the credit for high-efficiency water heaters. The credit will target heat pump
and condensing gas water heaters, but with a lower incentive for non-condensing tankless water
heaters.
Add a new tax incentive to promote comprehensive retrofits to new homes. This would be
similar to the Home Star program that nearly passed Congress a few years ago.

Energy Efficiency Tax Incentives
13
Improve the current tax credit for combined heat and power systems, removing the size cap but
limiting the incentive to 25 MW per system.3
Extend the recently expired credit for insulation and related measures. The credit would be 20
percent of cost up to a $1,000 credit.
Provide an incentive for replacement of old inefficient commercial and industrial chillers that still
use CFC’s (chlorofluorocarbon refrigerants). Replacing these units will save energy and reduce
release of refrigerants that harm the ozone layer.
In addition, we recommend that two other incentives be considered. We have not yet analyzed them but
plan to soon. These are:
Heavy-duty hybrid vehicles
Light-duty electric vehicles and their batteries
Our analysis of these options is summarized in Table 4. Detailed calculations and data sources are
provided in the Appendix to this report. In cases where we could not find specific data, we made
estimates based on our experience evaluating similar incentives, and consultations with experts for
specific efficiency measures. As a result, our analysis should be considered approximate and small
differences between measures (e.g., $0.30 per million Btu saved versus $0.33) are not significant.
Table 4. Costs, Savings and Federal Cost per Btu of Different Energy Efficiency Tax Incentives
All of the tax incentives we examined are highly cost-effective, with a federal cost of $0.02-2.33 per million
Btu of energy saved, far less than the approximately $10 per million Btu we now pay for energy.4 The new
construction and equipment incentives are particularly cost-effective (less than $1 per million Btu, with
most less than $0.35 per million Btu saved) because they can help permanently transform markets by
3 The current tax incentive does not expire until 2016 so we only analyzed the expansion and not the current incentive. 4 In 2009, the last year for which full data are available from the EIA (2011), energy costs in the U.S. averaged $10.83 per million
Btu. Total energy bills were $1.061 trillion and total energy consumption was 98,003 trillion Btu. $1.061 * 1 million (to align
units) / 98,008 = $10.83.
Five-Tear
Cost to Electricity Savings Fuel Savings Federal $/
Treasury 5th Year 15th Year Lifetime 5th Year 15th Year Lifetime Lifetime
Item ($millions) (GWh) (GWh) (GWh) (TBtu) (TBtu) (TBtu) mBtu Rank
Increasing commercial building deduction to $3/sf $52 552 2,636 158,139 2 10 599 $0.02 1
New homes -- extend current credit 1,076 2,590 14,608 876,505 10 96 5,785 0.07 2
Commercial building retrofits (20%+ savings) 843 14,349 34,678 520,164 40 106 1,596 0.12 3
Water heaters -- heat pump and advanced gas 1,308 3,841 32,035 416,459 7 95 1,229 0.24 4
CHP -- remove size cap but limit to 25 MW/system 270 0 0 0 38 64 956 0.28 5
A/C & HP SEER 16 installed per ACCA-QI 2,426 8,162 35,262 634,707 13 94 1,698 0.30 6
Residential appliances -- extend and update 1,148 2,624 18,371 275,562 3 41 612 0.34 7
Furnaces (95% AFUE + efficient fan) 901 897 3,545 63,808 13 105 1,886 0.36 8
Advanced windows (DOE U .22 spec) 504 538 2,984 59,674 3 16 328 0.54 9
New homes -- 50% whole home savings 646 1,203 3,488 69,758 7 21 411 0.58 10
Whole house retrofits (20%+ savings) 1,875 1,269 3,808 68,544 13 40 722 1.33 11
Replace CFC industrial & commercial chillers 236 1,665 0 16,646 0 0 0 1.42 12
Insulation and sealing for homes per 25C 2,022 1,540 1,586 31,717 22 27 549 2.33 13
Totals $13,300 39,200 153,000 3,191,700 170 720 16,400 $0.28

Energy Efficiency Tax Incentives © ACEEE
14
laying the foundation for improvements to building codes and product efficiency standards. The
commercial building retrofit and CHP system incentives are also very cost-effective. Retrofitting homes
and replacing chillers are more expensive but still very cost-effective, with federal costs ranging from
$1.33–2.33 per million Btu saved. These measures also have less of a long-term market transformation
effect.
All of the measures listed have a 5-year cost to the Treasury of about $13 billion, which is less than $3
billion per year. If funds are more limited, we would recommend concentrating on items in the upper
half of Table 4 and further refining criteria to reduce the cost of items that have a 5-year cost of more than
$1 billion. For some of these items (those with a substantial credit per taxpayer), repayable incentives can
also be considered.
Conclusion There are large opportunities for cost-effective energy savings in the U.S., but a variety of market barriers
serve to constrain the investments that are actually made. Tax reform can and should address some of
these barriers but other barriers will remain. Tax incentives can help address some of these barriers, but
given federal budget deficits, while some funds are likely to be used for energy-related tax expenditures,
available funds are likely to be very limited.
Past experience with energy efficiency tax incentives shows that modest incentives for measures that
already have substantial market share result largely in providing funds to “free riders”—consumers and
businesses who would have purchased efficiency measures even without tax incentives. On the other
hand, when incentives have been substantial enough to make a difference and have targeted measures
with a very small market share, the tax incentives can help to develop a market that can be sustained after
the tax incentives end.
Based on these findings, we recommend that future energy tax incentives:
Target energy saving equipment and practices with substantial energy savings and target energy
sources that can produce substantial energy in the long-term (we want “mountains” not
“molehills”);
Target efficiency levels and new energy sources that currently have a very small market share to
keep costs down and minimize the number of free riders;
Pay substantial incentives to motivate significant sales; and
Be in place for a medium period of time (e.g., 5 years) so manufacturers and other market players
know incentives will be available for long enough that it is worth making investments.
Our analysis of the relative cost-effectiveness of different energy efficiency tax incentives indicates that the
following incentives are particularly cost-effective because they can leverage substantial market changes
that will likely persist even after the incentives end:

Energy Efficiency Tax Incentives
15
Commercial new construction
New homes
Commercial building retrofits
Furnaces, air conditioners, heat pumps, and water heaters
Residential appliances
As noted earlier, we plan to analyze incentives for heavy-duty hybrid vehicles and light-duty electric
vehicles soon.
In addition, for measures that are expensive and for which quick market transformation is not possible,
such as comprehensive home and building energy efficiency retrofits, CHP systems, and chiller retrofits,
Congress should enact initial tax incentives to help spur initial market growth, but then consider
transitioning to repayable incentives after the initial incentive ends.
These tax incentives generally have a cost to the federal government of less than $1 per million Btu saved,
far less than the approximately $10 per million Btu average U.S. energy cost, making them highly cost-
effective investments, which will continue to pay off via energy bill reductions for decades to come. These
tax incentives will leverage very substantial private investments as the tax incentives cover only a portion
of the cost of efficiency measures. Furthermore, these tax incentives will help our economy as
investments in energy efficiency help to create jobs, including direct jobs in the production and
installation of efficient technologies and induced jobs created as consumers and businesses re-spend their
energy bill savings (ACEEE 2011). For these reasons, modest medium-term federal energy-efficiency tax
incentives that help leverage long-term changes in markets should be included as part of tax reform.
References [ACEEE] American Council for an Energy-Efficient Economy. 2011. How Does Energy Efficiency Create
Jobs? Fact Sheet. Washington, DC: American Council for an Energy-Efficient Economy.
[ACEEE and ASE] American Council for an Energy-Efficient Economy and Alliance to Save Energy.
2011. ENERGY STAR Window Market Share in Eight U.S. Regions. Fact Sheet. Washington, DC:
American Council for an Energy-Efficient Economy.
[AHRI] Amrane, Karim (Air-Conditioning, Heating, and Refrigeration Institute). 2012. Personal
Communication. March 30.
[ASE] Alliance to Save Energy. 1983. Industrial Investment in Energy Efficiency: Opportunities,
Management Practices, and Tax Incentives. Washington, DC: Alliance to Save Energy.

Energy Efficiency Tax Incentives © ACEEE
16
Chittum, Anna and Nate Kaufman. 2011. Challenges Facing Combined Heat and Power Today: A State-by-
State Assessment. American Council for an Energy-Efficient Economy. Washington, DC: American
Council for an Energy-Efficient Economy.
[EIA] Energy Information Administration. 1986. Residential Energy Consumption Survey: Housing
Characteristics 1984. DOE/EIA-0314(84). Washington, DC: U.S. Department of Energy, Energy
Information Administration.
———. 2011. Annual Energy Review 2010. DOE/EIA-0384(2010). Washington, DC: U.S. Department of
Energy, Energy Information Administration.
[GAO] U.S. General Accounting Office. 1985. Business Energy Investment Credit. GAO/GGD-86-21.
Washington, DC: U.S. General Accounting Office.
———. 2012. Factors to Consider in the Design of the Nonbusiness Energy Property Credit. GAO-12-318.
Washington, DC: U.S. General Accounting Office.
Gold, Rachel and Steven Nadel. 2011. Energy Efficiency Tax Incentives, 2005–2011: How Have They
Performed? Washington, DC: American Council for an Energy-Efficient Economy.
Golove, William H. and Joseph H. Eto. 1996. Market Barriers to Energy Efficiency: A Critical Reappraisal
of the Rationale for Public Policies to Promote Energy Efficiency. LBL-38059/UC-1322. Berkeley, CA:
Lawrence Berkeley National Laboratory, University of California.
[IEA] International Energy Agency. 2007. Mind the Gap: Quantifying Principal-Agent Problems in Energy
Efficiency. Paris, France: International Energy Agency
[JCT] Joint Committee on Taxation. 2010. Estimated Budget Effects Of The “Tax Relief, Unemployment
Insurance Reauthorization, And Job Creation Act Of 2010,” Scheduled For Consideration By The
United States Senate. JCX-54-10. Washington, DC: Joint Committee on Taxation, Congress of the
United States.
———. 2012. Estimated Budget Effects of The Revenue Provisions Contained in the President’s Fiscal Year
2013 Proposal. JCX-27-12. Washington, DC: Joint Committee on Taxation, Congress of the United
States.
McKinsey & Company. 2009. Unlocking Energy Efficiency in the US Economy. McKinsey & Company.
Laitner, John A. “Skip,” Steven Nadel, R. Neal Elliott, Harvey Sachs, and A. Siddiq Khan. 2012. The Long-
Term Energy Efficiency Potential: What the Evidence Suggests. Washington, DC: American Council for
an Energy-Efficient Economy.
Nadel, Steven and Kate Farley. 2012a. Should the U.S. Consider a Modest Emissions Fee as Part of a
Strategy to Lower Marginal Tax Rates? Washington, DC: American Council for an Energy-Efficient
Economy.

Energy Efficiency Tax Incentives
17
———. 2012b. Modifying How Energy Costs Are Treated for Business Tax Purposes in Order to Decrease
Subsidies and Increase Energy Efficiency. Washington, DC: American Council for an Energy-Efficient
Economy.
[OTA] Office of Technology Assessment. 1983. Industrial Energy Use. Washington, D.C.: U.S. Congress,
Office of Technology Assessment.
———. 1992. Building Energy Efficiency. Washington, DC: U.S. Congress, Office of Technology
Assessment.
Parfomak, Paul W., Fred Sissine and Eric A. Fischer. 2009. Energy Efficiency in Buildings: Critical Barriers
and Congressional Policy. Washington, DC: Congressional Research Service.
Quinlan, Patrick, Howard Geller, and Steven Nadel. 2001. Tax Incentives for Innovative Energy-Efficient
Technologies (Updated). Washington, DC: American Council for an Energy-Efficient Economy.
[RESNET] Baden, Steve (Residential Energy Services Network). 2012. Personal Communication. July 6.
Sachs, Harvey M., Christopher Russell, Ethan A. Rogers, and Steven Nadel. 2012. Depreciation: Impacts of
Tax Policy. Washington, DC: American Council for an Energy-Efficient Economy.
Sciortino, Michael, Max Neubauer, Shruti Vaidyanathan, Anna Chittum, Sara Hayes, Seth Nowak, and
Maggie Molina. 2011. The 2011 State Energy Efficiency Scorecard. Washington, DC: American
Council for an Energy-Efficient Economy.
White House. 2000. Climate Change Technology Initiative: $4.0 Billion in Tax Incentives. White House
Press Release. http://clinton5.nara.gov/WH/New/html/20000204_9.html. Accessed June 21, 2012.

Energy Efficiency Tax Incentives © ACEEE
18

Energy Efficiency Tax Incentives
19
Appendix A: Estimating Costs and Benefits of Energy-Efficiency Tax Incentives: Methodology, Data Sources and Detailed Analysis Results
We examined the various energy efficiency tax incentive options discussed in the body of the text using a
spreadsheet model we developed. The model includes a variety of specific assumptions and then uses
these to estimate the cost to the federal Treasury, electricity and fuel savings, and the ratio of federal
spending to the amount of energy saved. Specific assumptions are provided in Table A1. Sources and
explanations for these assumptions are summarized in Table A2.
Based on these values, several values are calculated as follows:
Participation over 5 years = Sum of the individual annual participation rates.
Cost to the Treasury = Average Incentive * Annual Sales or Stock *Participation over 5 Years * % eligible
who take the credit. For this last factor we assumed 60 percent.
Electricity and Fuel Savings = Average Unit Savings * Annual Sales or Stock * # Years in Analysis *
(Average Annual Participation Rate – Current Market Share). For measures with a free rider rate (shown
in Table A1 as “FR”), instead of subtracting Current Market Share from the participation rate we
multiplied total savings by 1 minus the FR rate. For 5 year savings used Participation over 5 Years. For 15
year savings, took Participation over 5 Years and added Average Participation Subsequent 10 Years.
Lifetime savings = 15th Year Savings * Average Lifetime.
Federal $/Lifetime million Btu = Cost to Treasury / ([Lifetime GWh savings * 10,000 Btu/kWh / 1 million]
+ Lifetime TBtu savings). The 1 million is to convert millions to trillions.
In a few cases, special adjustments were made as follows:
For residential appliances, federal costs were cut in half because only incremental sales relative to
a 2-year rolling base receive the tax credit. Cost was divided in half again because of the cap per
manufacturer.
For water heaters, the average life is only 13 years so savings in the 15th year do not include
participants from the first 2 years as those water heaters will be retired by the 15th year.
For chillers, we estimate that these chillers would be replaced anyway after 10 years so lifetime
savings credit only 10 years of savings. Also, no savings in 15th year since all of these chillers
would be replaced by then without the incentive.

Energy Efficiency Tax Incentives © ACEEE
20
Table A1. Savings and Costs of Prospective Energy Efficiency Tax Incentives (5-year incentive plus market transformation effects over subsequent decade)

Energy Efficiency Tax Incentives
21
Table A2. Key Data Points and Sources
Average Incentive
Average Unit Savings Annual Sales or Stock (Millions)
Average Lifetime (years)
Current Market Share
Participation Rate (All are ACEEE estimates.)
Average Participation Subsequent 10 years (All are ACEEE estimates.)
kWh mBtu Fuel
Incr
eas
ing
co
mm
erc
ial b
uild
ing
d
ed
uct
ion
$3/sf, 25% tax bracket.
16.2 kWh/sf from CBECS 2003 for buildings built 2000-2003 * 60% of electricity use covered by 90.1 (estimate) * 50% savings.
35 cf gas/sf in bldgs built 2000-2003 from CBECS 2003 * 1029 Btu/sf * 50% savings /1m to convert to mBtu.
Annual average for new construction over 2000-2003 from CBECS 2003.
ACEEE estimate.
Very small. NBI has identified just a few hundred buildings at this level, built over about a decade -- http://buildings.newbuildings.org.
Ne
w h
om
es
-- e
xte
nd
cu
rre
nt
cre
dit
Set in existing law.
SH, AC and WH consumption for homes built 2000-2005 from 2005 RECS * 50% savings.
See box to left. Economy.com is projecting about 757k in 2013, 1.099 m in 2014, 1.646 m in 2015, 1.858 m in 2016 and 1.814 m in 2017.
ACEEE estimate.
11% in 2011 per RESNET but this is with construction levels ~1/3 of those estimated for the future.
15% in 1st year, 65% in 5th year and beyond due to new building codes, steady ramp between the two.

Energy Efficiency Tax Incentives © ACEEE
22
Average Incentive
Average Unit Savings Annual Sales or Stock (Millions)
Average Lifetime (years)
Current Market Share
Participation Rate (All are ACEEE estimates.)
Average Participation Subsequent 10 years (All are ACEEE estimates.)
kWh mBtu Fuel C
om
me
rcia
l bu
ildin
g r
etr
ofi
ts
Snowe-Bingaman bill has a deduction of $1.50/sf for 25% savings. Avg. business tax rate ~25%.
Average use per sq. ft. for buildings 50,000 sq. ft. or more per CBECS 2003 times 25% average savings.
See box to left. Buildings over 50,000 sf. Derived from data in CBECS.
Estimates by ACEEE and by Lane Burt at USGBC.
ACEEE estimate.
Wat
er
he
ate
rs –
he
at
pu
mp
& a
dva
nce
d
nat
ura
l gas
ACEEE recommendation -- fixed incentive, not % of cost.
From final DOE water heater TSD, Table 10.4.1. Savings relative to new standard.
From DOE TSD. 10-year average from AHRI -- 2002-2011.
From DOE TSD.
Based on estimates of the entire market provided by AO Smith.
10% for 5 years then 75% for next 5 years due to new minimum standards.

Energy Efficiency Tax Incentives
23
Average Incentive
Average Unit Savings Annual Sales or Stock (Millions)
Average Lifetime (years)
Current Market Share
Participation Rate (All are ACEEE estimates.)
Average Participation Subsequent 10 years (All are ACEEE estimates.)
kWh mBtu Fuel C
HP—
rem
ove
siz
e c
ap b
ut
limit
to
25
MW
/sys
tem
Assumes cost of 1800 per installed kW X 10% ITC.
Credits all savings to fuel displaced in electric generation with average heat rates of 8000 (util) and 4600 (CHP). Assume 6000 op hrs./yr.
Assumes new installations of 500 MW per year incremental to existing credit. Only first 25 MW of a system is eligible for the credit.
ACEEE estimate.
Estimate ¼ are free riders.
"Annual sales" is an annual participation rate.
ACEEE estimate of what happens after credit expires due to impact of tax credit (not baseline).
Energy Efficiency Tax Incentives © ACEEE
24
Average Incentive
Average Unit Savings Annual Sales or Stock (Millions)
Average Lifetime (years)
Current Market Share
Participation Rate (All are ACEEE estimates.)
Average Participation Subsequent 10 years (All are ACEEE estimates.)
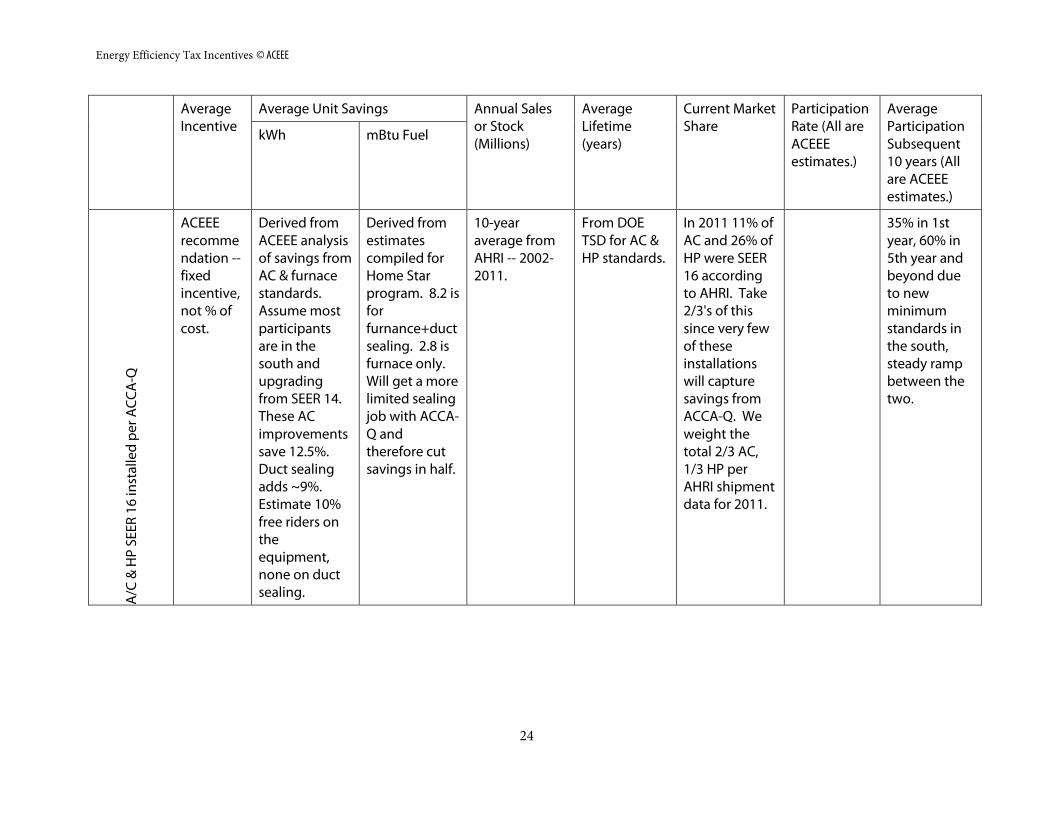
kWh mBtu Fuel A
/C &
HP
SEE
R 1
6 in
stal
led
pe
r A
CC
A-Q
ACEEE recommendation -- fixed incentive, not % of cost.
Derived from ACEEE analysis of savings from AC & furnace standards. Assume most participants are in the south and upgrading from SEER 14. These AC improvements save 12.5%. Duct sealing adds ~9%. Estimate 10% free riders on the equipment, none on duct sealing.
Derived from estimates compiled for Home Star program. 8.2 is for furnance+duct sealing. 2.8 is furnace only. Will get a more limited sealing job with ACCA-Q and therefore cut savings in half.
10-year average from AHRI -- 2002-2011.
From DOE TSD for AC & HP standards.
In 2011 11% of AC and 26% of HP were SEER 16 according to AHRI. Take 2/3's of this since very few of these installations will capture savings from ACCA-Q. We weight the total 2/3 AC, 1/3 HP per AHRI shipment data for 2011.
35% in 1st year, 60% in 5th year and beyond due to new minimum standards in the south, steady ramp between the two.

Energy Efficiency Tax Incentives
25
Average Incentive
Average Unit Savings Annual Sales or Stock (Millions)
Average Lifetime (years)
Current Market Share
Participation Rate (All are ACEEE estimates.)
Average Participation Subsequent 10 years (All are ACEEE estimates.)
kWh mBtu Fuel R
esi
de
nti
al a
pp
lian
ces
-- e
xte
nd
an
d u
pd
ate
Average of midpoint incentive for CW, DW and RF.
Average from ACEEE analysis of appliance standards agreement.
See box to left. Sum of sales of RF, CW and DW.
Approximate average from DOE TSDs.
ACEEE estimate.
Eligibility thresholds increased to limit market share. Assume will save and cost at same rate as current incentives.
Become basis for new minimum efficiency standards a few years out.

Energy Efficiency Tax Incentives © ACEEE
26
Average Incentive
Average Unit Savings Annual Sales or Stock (Millions)
Average Lifetime (years)
Current Market Share
Participation Rate (All are ACEEE estimates.)
Average Participation Subsequent 10 years (All are ACEEE estimates.)
kWh mBtu Fuel Fu
rnac
es (9
5%
AFU
E +
eff
icie
nt
fan
)
ACEEE recommendation -- fixed incentive, not % of cost.
Derived from estimates compiled for Home Star program. 1009 is for AC+duct sealing. 561 is AC only. ~2/3 homes have CAC.
Derived from ACEEE estimate of savings from furnace standards. Assume mostly in north and upgrading from 90%. Duct sealing saves 9% (ACEEE NW study), the furnace saves 5.26% (90->95% AFUE). Estimate 20% free riders on the equipment, none on duct sealing.
10-year average from AHRI -- 2002-2011.
From DOE TSD.
AHRI reports 32% share for 95% AFUE in 2011 but we cut in half because we also require an efficient furnace fan.
Only 3 years -- after that free riders too high.
40% in 1st year, 60% in 5th year and beyond due to new minimum standards in the north, steady ramp between the two.

Energy Efficiency Tax Incentives
27
Average Incentive
Average Unit Savings Annual Sales or Stock (Millions)
Average Lifetime (years)
Current Market Share
Participation Rate (All are ACEEE estimates.)
Average Participation Subsequent 10 years (All are ACEEE estimates.)
kWh mBtu Fuel A
dva
nce
d w
ind
ow
s
(DO
E U
.22
spe
c)
ACEEE recommendation -- fixed incentive, not % of cost.
Weighted average calculated from LBL software as compiled by Nils Petermann, ASE. This is for average savings from U .22 windows relative to a 50-50 mix of Energy Star and "conventional new" windows.
See box to left. Ducker study for 2011 and 2012, provided by Nils Petermann at ASE.
ACEEE estimate.
ASE estimates 1-2%.
Growth in availability and market share allows these windows to be incorporated into building codes across the far north.

Energy Efficiency Tax Incentives © ACEEE
28
Average Incentive
Average Unit Savings Annual Sales or Stock (Millions)
Average Lifetime (years)
Current Market Share
Participation Rate (All are ACEEE estimates.)
Average Participation Subsequent 10 years (All are ACEEE estimates.)
kWh mBtu Fuel N
ew
ho
me
s—5
0% w
ho
le h
om
e sa
vin
gs
$5000 incentive contained in legislation introduced by Senators Snowe and Bingaman.
Total consumption for homes built 2000-2005 from 2005 RECS * 80% in covered end-uses * 50% savings.
Total natural gas use is 1000 cf for homes built 2000-2005 per RECS 2005 * 50% savings.
Economy.com is projecting about 757k in 2013, 1.099 m in 2014, 1.646 m in 2015, 1.858 m in 2016 and 1.814 m in 2017.
ACEEE estimate.
Very small. ACEEE estimate.
Wh
ole
ho
use
re
tro
fits
For 25% savings from legislation introduced by Senators Snowe and Bingaman.
Base from RECS 2005; assume participants are higher use households and use 50% more. 25% average savings.
ACEEE estimate.
In millions, not %. DOE website says over 150,000 homes. Our understanding is that majority have been recent.
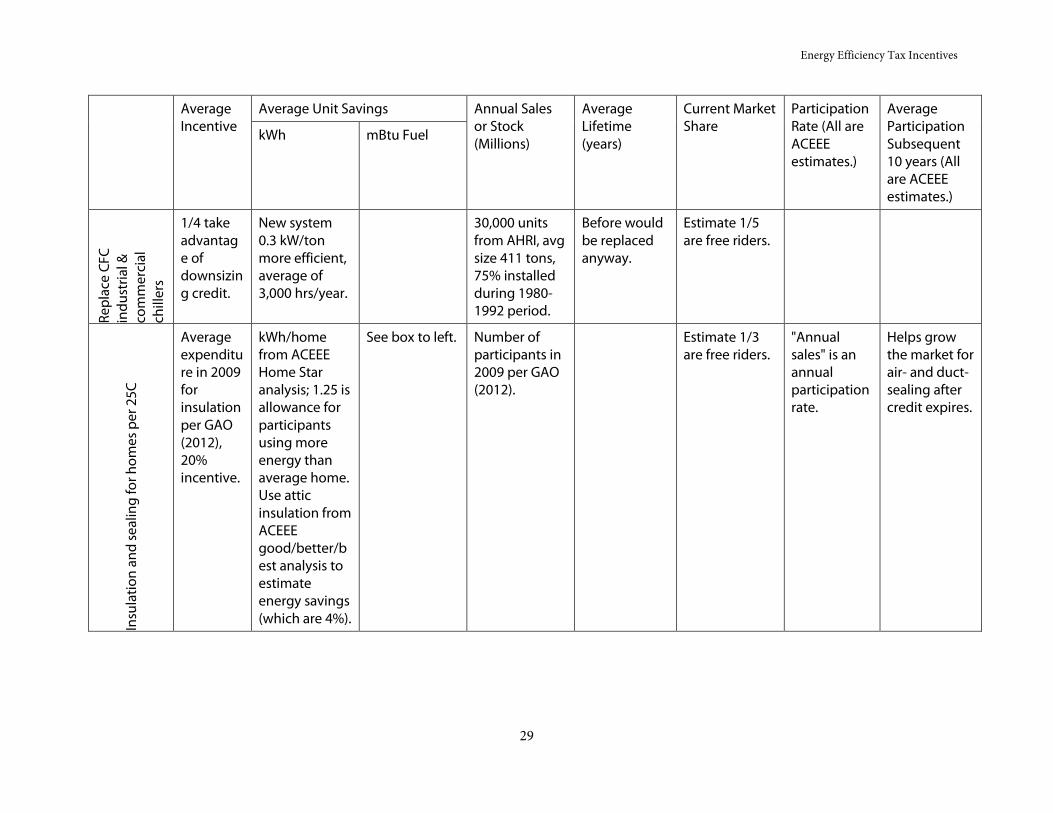
Energy Efficiency Tax Incentives
29
Average Incentive
Average Unit Savings Annual Sales or Stock (Millions)
Average Lifetime (years)
Current Market Share
Participation Rate (All are ACEEE estimates.)
Average Participation Subsequent 10 years (All are ACEEE estimates.)
kWh mBtu Fuel
Re
pla
ce C
FC
ind
ust
rial
&
com
me
rcia
l ch
ille
rs
1/4 take advantage of downsizing credit.
New system 0.3 kW/ton more efficient, average of 3,000 hrs/year.
30,000 units from AHRI, avg size 411 tons, 75% installed during 1980-1992 period.
Before would be replaced anyway.
Estimate 1/5 are free riders.
Insu
lati
on
an
d s
eal
ing
for
ho
me
s p
er
25
C
Average expenditure in 2009 for insulation per GAO (2012), 20% incentive.
kWh/home from ACEEE Home Star analysis; 1.25 is allowance for participants using more energy than average home. Use attic insulation from ACEEE good/better/best analysis to estimate energy savings (which are 4%).
See box to left. Number of participants in 2009 per GAO (2012).
Estimate 1/3 are free riders.
"Annual sales" is an annual participation rate.
Helps grow the market for air- and duct-sealing after credit expires.