Energy Efficiency Potential Study - emnrd.state.nm.us€¦ · Comparison of baseline and EE...
45
© 2010 1 Energy Efficiency Potential Study Project Briefing for Stakeholders Prepared for Energy Conservation and Management Division State of New Mexico, EMNRD by Global Energy Partners, LLC September 29-30, 2010
Transcript of Energy Efficiency Potential Study - emnrd.state.nm.us€¦ · Comparison of baseline and EE...

© 2010 1
Energy Efficiency Potential StudyProject Briefing for Stakeholders
Prepared for
Energy Conservation and Management Division
State of New Mexico, EMNRD
by
Global Energy Partners, LLC
September 29-30, 2010
© 2010
Topics
Introductions
Overview of the study
Analysis steps and approach
Meetings – project kick-off and stakeholder meetings
Market characterization
Baseline forecast
Estimating (EE) potential
Estimating demand response (DR) potential
Strategies to achieve the potential
Reports and presentations
Timeline, key milestones, project team members
Wrap up
2
© 2010
The Project Team: Global Energy Partners & The Brattle Group
Key team members
Ingrid Rohmund, Director
Bridget Kester, Manager
Debyani Ghosh, Asst. Manager
Greg Wikler, Advisor
Ahmad Faruqui, Ph.D. (Brattle) Project advisor
Recent projects*:
AmerenUE DSM potential
PECO Energy DSM Plan and program design
FERC National Assessment of Demand Response
EPRI National Potential Study
BPA DR Strategy, Potential, Awareness and Pilots
EPRI Energy Efficiency Planning Guidebook
Midwest ISO DSM potential study (GEP)
Con Edison of NY efficiency potential (GEP)
Avista and Inland Power & Light CPAs (GEP)
FERC National DR Action Plan (Brattle)
*Joint unless otherwise noted
3
© 2010
Purpose and background
Purpose
Conduct a statewide energy efficiency potential study to determine the potential for development of specific natural gas and electric energy efficiency measures in the various regions of New Mexico.
Information will be used by each utility in implementing cost-effective energy efficiency and load management programs under New Mexico’s Efficient Use of Energy Act (EUEA).
Background
EUEA directs New Mexico to support public utility development of all cost-effective energy efficiency and load management measures. These measures include removing regulatory disincentives and allowing rate recovery of energy efficiency and load management program costs. Under PRC rules, IOU gas and electric public utility must obtain PRC approval of energy efficiency programs, implement those programs, and report their results and costs.
No comprehensive statewide study has been conducted to date, although some entities have conducted their own studies.
4

© 2010
Objectives
Provide information to the public
Identify energy-efficiency measures that meet the total resource cost (TRC) test
Specify measures relating to housing and building structures and appliances
Address climate zones and other geographic considerations, as well as utility service areas
Describe and quantify the strategies for implementing those measures in a manner that produces the maximum achievable energy savings
5
© 2010
Overview of scope of work
Energy efficiency (EE) assessment
Identify, define and quantify technically feasible EE measures
Identify and rank those most likely to meet cost effectiveness requirements
Estimate realistic achievable potential
Demand response (DR) assessment
Identify, define and quantify DR options
Estimate realistic achievable potential
Strategy for achieving EE and DR savings
Program design
New technologies
Role of codes and standards
6

© 2010
Approach for estimating potential
Baseline forecasting
Customer surveys
Secondary data
Forecast data
Prototypes and
energy analysis
Market characterizationUtility data
EE measure list
Measure descriptionMeasure screening
Customer acceptanceProgram results
Best-practices research
Establish objectives
Base-year energy use by fuel, segment
End-use forecast by
fuel, segment
Technical and economic potential
Achievable potential
7
© 2010
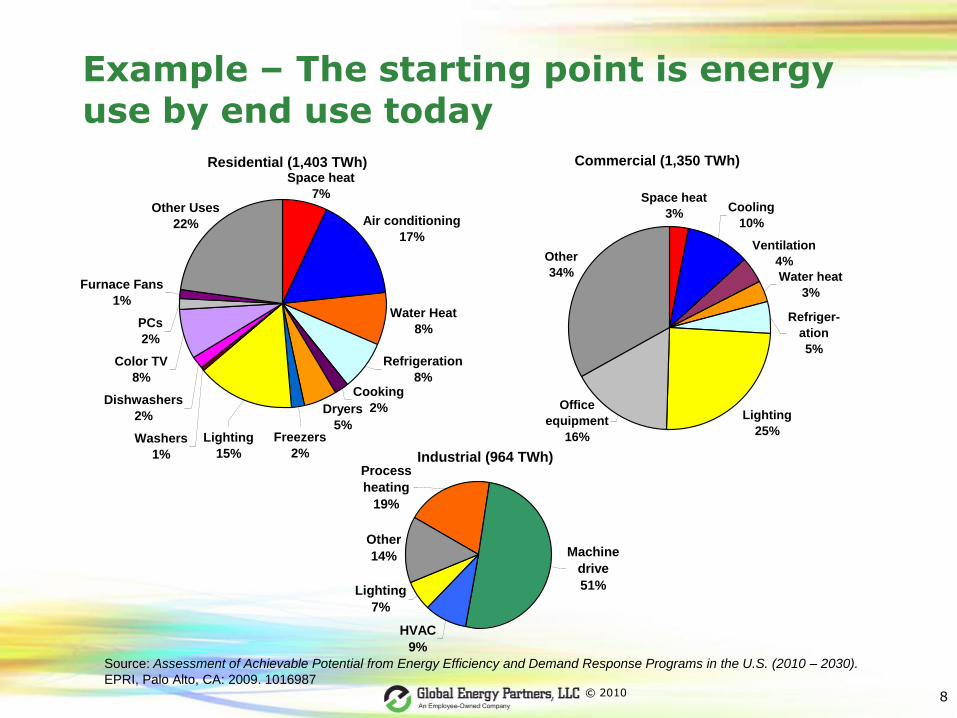
Example – The starting point is energy use by end use today
8
Residential (1,403 TWh)
Water Heat
8%
Washers
1%
Dishwashers
2%
Color TV
8%
PCs
2%
Furnace Fans
1%
Space heat
7%Other Uses
22% Air conditioning
17%
Refrigeration
8%
Dryers
5%
Cooking
2%
Freezers
2%
Lighting
15%
Commercial (1,350 TWh)
Lighting
25%
Other
34% Water heat
3%
Ventilation
4%
Cooling
10%
Refriger-
ation
5%
Office
equipment
16%
Space heat
3%
Industrial (964 TWh)
HVAC
9%
Lighting
7%
Other
14% Machine
drive
51%
Process
heating
19%
Source: Assessment of Achievable Potential from Energy Efficiency and Demand Response Programs in the U.S. (2010 – 2030).
EPRI, Palo Alto, CA: 2009. 1016987
© 2010
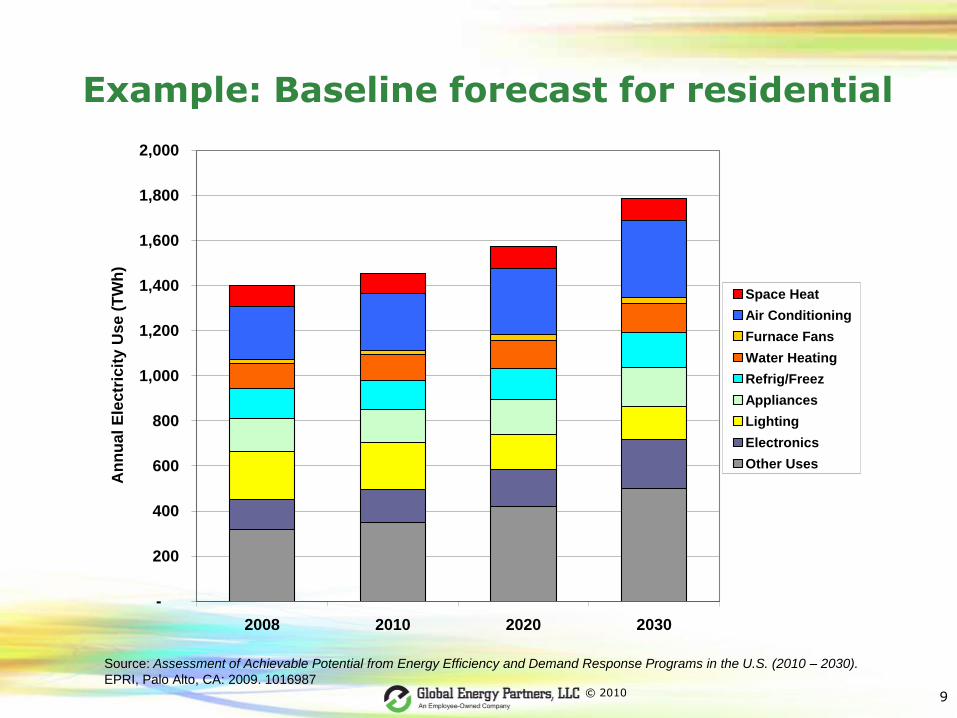
Example: Baseline forecast for residential
9
Source: Assessment of Achievable Potential from Energy Efficiency and Demand Response Programs in the U.S. (2010 – 2030).
EPRI, Palo Alto, CA: 2009. 1016987
-
200
400
600
800
1,000
1,200
1,400
1,600
1,800
2,000
2008 2010 2020 2030
An
nu
al
Ele
ctr
icit
y U
se (
TW
h)
Space Heat
Air Conditioning
Furnace Fans
Water Heating
Refrig/Freez
Appliances
Lighting
Electronics
Other Uses
© 2010
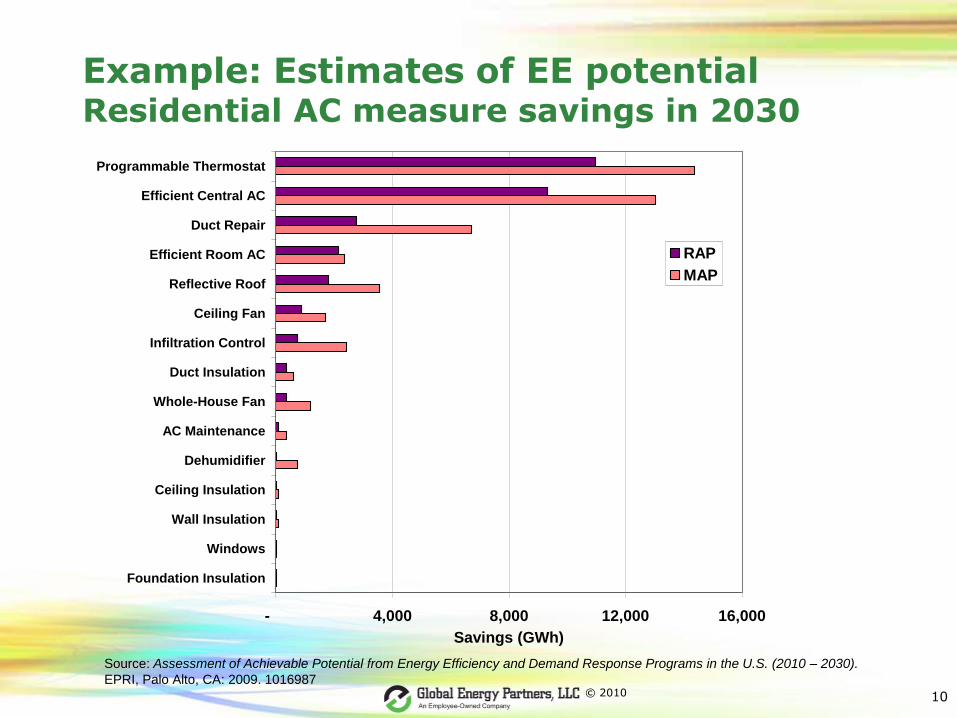
Example: Estimates of EE potentialResidential AC measure savings in 2030
10
Source: Assessment of Achievable Potential from Energy Efficiency and Demand Response Programs in the U.S. (2010 – 2030).
EPRI, Palo Alto, CA: 2009. 1016987
- 4,000 8,000 12,000 16,000
Foundation Insulation
Windows
Wall Insulation
Ceiling Insulation
Dehumidifier
AC Maintenance
Whole-House Fan
Duct Insulation
Infiltration Control
Ceiling Fan
Reflective Roof
Efficient Room AC
Duct Repair
Efficient Central AC
Programmable Thermostat
Savings (GWh)
RAP
MAP
© 2010
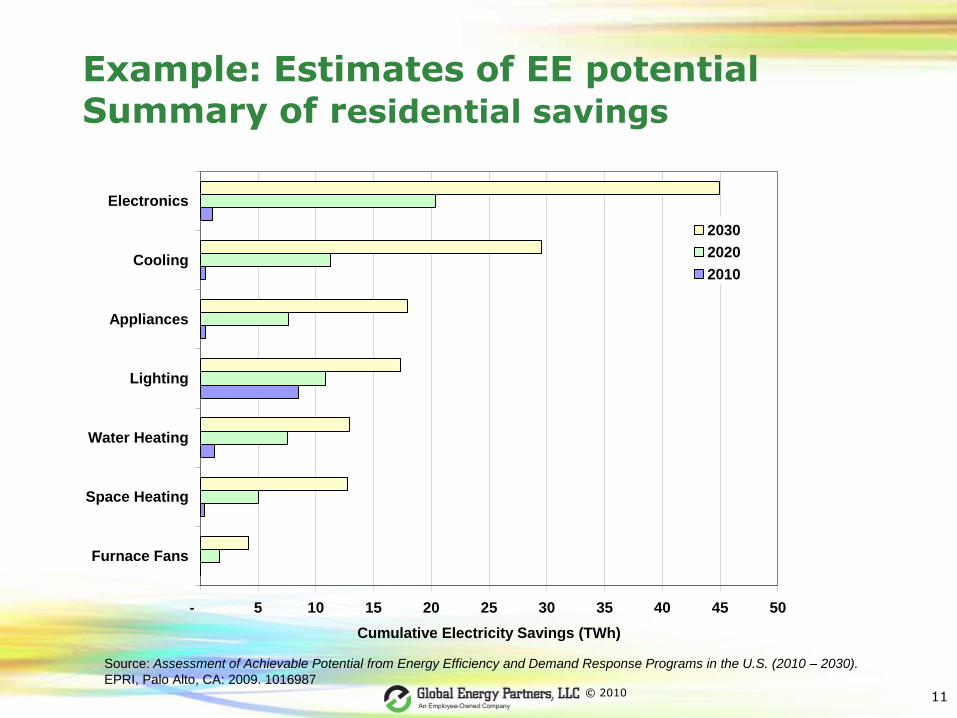
Example: Estimates of EE potentialSummary of residential savings
11
Source: Assessment of Achievable Potential from Energy Efficiency and Demand Response Programs in the U.S. (2010 – 2030).
EPRI, Palo Alto, CA: 2009. 1016987
- 5 10 15 20 25 30 35 40 45 50
Furnace Fans
Space Heating
Water Heating
Lighting
Appliances
Cooling
Electronics
Cumulative Electricity Savings (TWh)
2030
2020
2010
© 2010
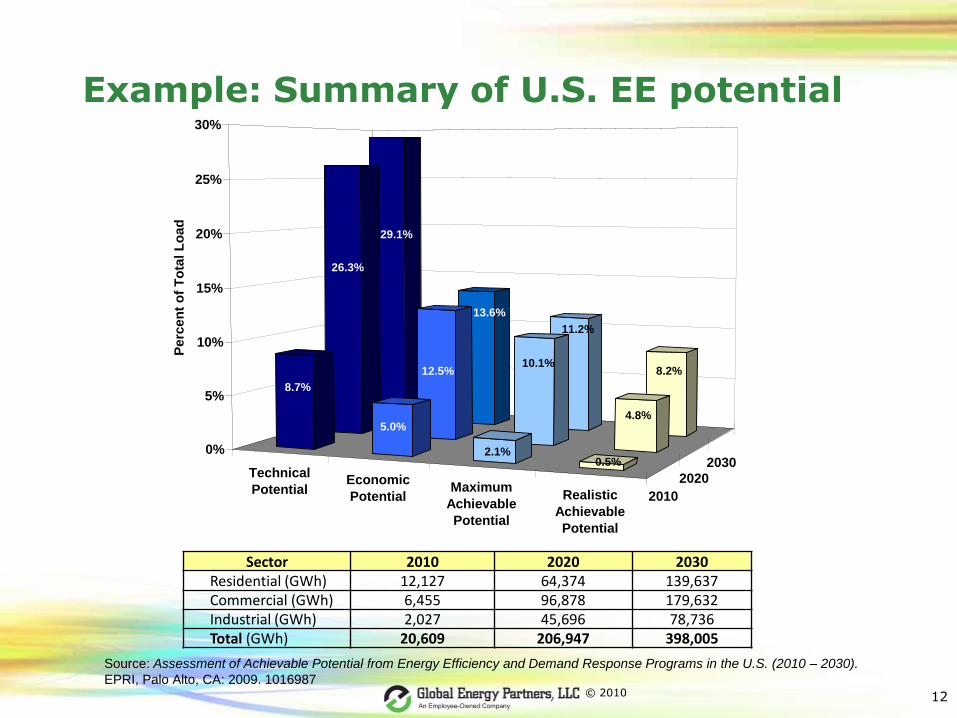
Example: Summary of U.S. EE potential
12
Source: Assessment of Achievable Potential from Energy Efficiency and Demand Response Programs in the U.S. (2010 – 2030).
EPRI, Palo Alto, CA: 2009. 1016987
Technical
PotentialEconomic
PotentialMaximum
Achievable
Potential
Realistic
Achievable
Potential
2010
2020
2030
29.1%
13.6%
11.2%
8.2%
26.3%
12.5%10.1%
4.8%
8.7%
5.0%
2.1%0.5%
0%
5%
10%
15%
20%
25%
30%
Perc
en
t o
f T
ota
l L
oad
Sector 2010 2020 2030Residential (GWh) 12,127 64,374 139,637Commercial (GWh) 6,455 96,878 179,632Industrial (GWh) 2,027 45,696 78,736Total (GWh) 20,609 206,947 398,005
© 2010
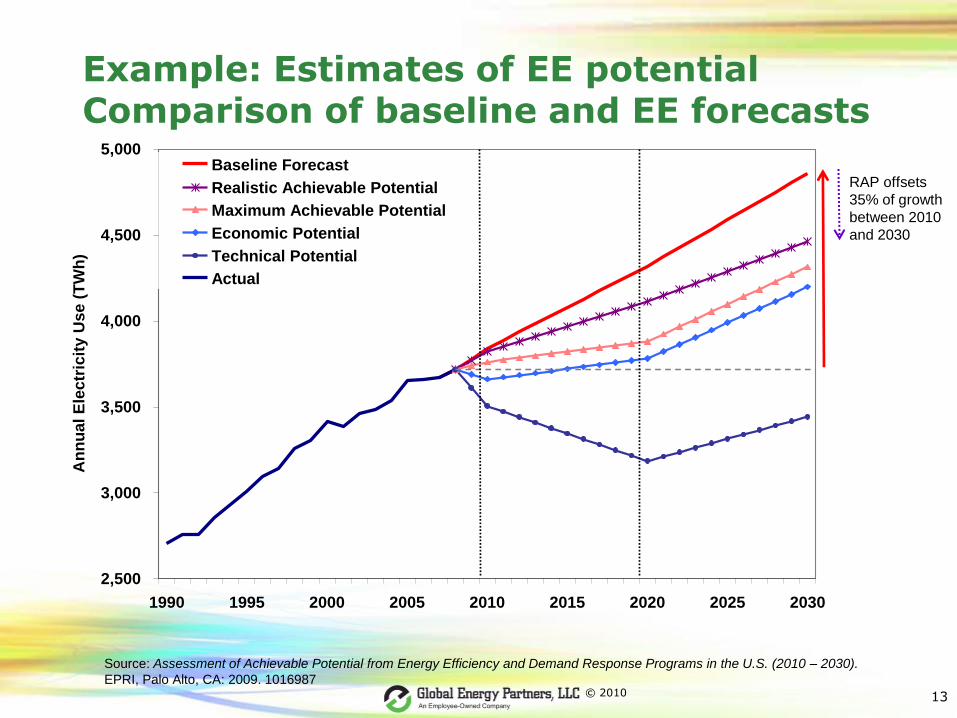
Example: Estimates of EE potentialComparison of baseline and EE forecasts
13
Source: Assessment of Achievable Potential from Energy Efficiency and Demand Response Programs in the U.S. (2010 – 2030).
EPRI, Palo Alto, CA: 2009. 1016987
2,500
3,000
3,500
4,000
4,500
5,000
1990 1995 2000 2005 2010 2015 2020 2025 2030
An
nu
al
Ele
ctr
icit
y U
se
(T
Wh
)
Baseline Forecast
Realistic Achievable Potential
Maximum Achievable Potential
Economic Potential
Technical Potential
Actual
RAP offsets
35% of growth
between 2010
and 2030
© 2010
Project tasks
1. Project kick-off and work plan development
2. Stakeholder input sessions
3. Primary market research
4. Develop estimates of potential
5. Strategy development
6. Final report and presentations
14
© 2010
1. Kickoff and work plan
Kickoff meeting held on August 3, 2010
Refined objectives
Became acquainted and established contacts
Developed preliminary segmentation approach
Refined the work plan by August 31, 2010
Distributed data request to NM utilities and entities
15

© 2010
Preliminary segmentation for electricity
Electricity analysis
Isolate three major IOUs (PNM, SPS/Xcel, El Paso)
Gather data for municipal utilities, rural cooperatives and Navajo Tribal Utility Authority
Residential sector by housing type
Non-residential sector: Separate commercial and industrial based on rate class and NAICS code
Small is <200 kW
Large is 200+ kW
Building vintage: existing buildings and new construction
We will recommend a segmentation scheme for non-IOUs based on the data we receive
16

© 2010
Preliminary segmentation for natural gas
Natural gas analysis
Isolate NM Gas
Gather data for other gas companies
Residential sector by housing type
Non-residential sector: Separate commercial and industrial based on rate class and NAICS code
Small is <200,000 therms
Medium is > 200,000 and < 2,000,000 therms
Large is 2,000,000+ therms
Building vintage: existing buildings and new construction
17

© 2010
Data request
Market characterization
Electricity by sector and size
Number of customers
Base-year sales (GWh)
Base-year summer peak demand (MW)
Natural gas by sector
Number of customers
Base-year sales
Utility data
Customer surveys
Forecasts
Electricity sales
Peak demand
Natural gas sales
Status of AMI
Avoided costs
Existing and planned utility programs
Potential studies
Program plans
IRP
Evaluation studies
18

© 2010
2. Stakeholder input sessions
Objectives
Engage stakeholders to review work plan
Establish pathway for communication
Meetings held in Las Cruces and Santa Fe
Outcome of meetings will be delivered to EMNRD in written report
19

© 2010
3. Primary market research
Objective is to gather information about
Appliance/end-use saturations and inventories
Particularly for lighting, electronics, IT
Saturation of EE measures
Customer behavior and likely participation in EE and DR programs
Barriers to engaging in EE and DR programs
Conduct telephone and/or online surveys with
~1,000 residential customers
~1,000 business customers
Combine results with existing surveys and secondary sources
20

© 2010
4. Develop estimates of EE and DR potential
Overview of analysis approach
Introduction to LoadMAP modeling framework
Develop baseline forecast
Identify and characterize EE and DR measures
Estimate EE and DR potential
Allocate estimates to utilities
21

© 2010
Approach for estimating EE potential
Baseline forecasting
Customer surveys
Secondary data
Forecast data
Prototypes and
energy analysis
Market characterizationUtility data
EE measure list
Measure descriptionMeasure screening
Customer acceptanceProgram results
Best-practices research
Establish objectives
Base-year energy use by fuel, segment
End-use forecast by
fuel, segment
Technical and economic potential
Achievable potential
22

© 2010
LoadMAPTM
Load Management Analysis and Planning tool
1. An end-use forecasting model built upon well-established end-use modeling framework
Similar to EPRI’s REEPS and COMMEND (but simpler)
2. An analysis tool for estimating DSM potential
1. Measure lists
2. Cost-effectiveness screening
3. Technical, economic and achievable potential
23
© 2010
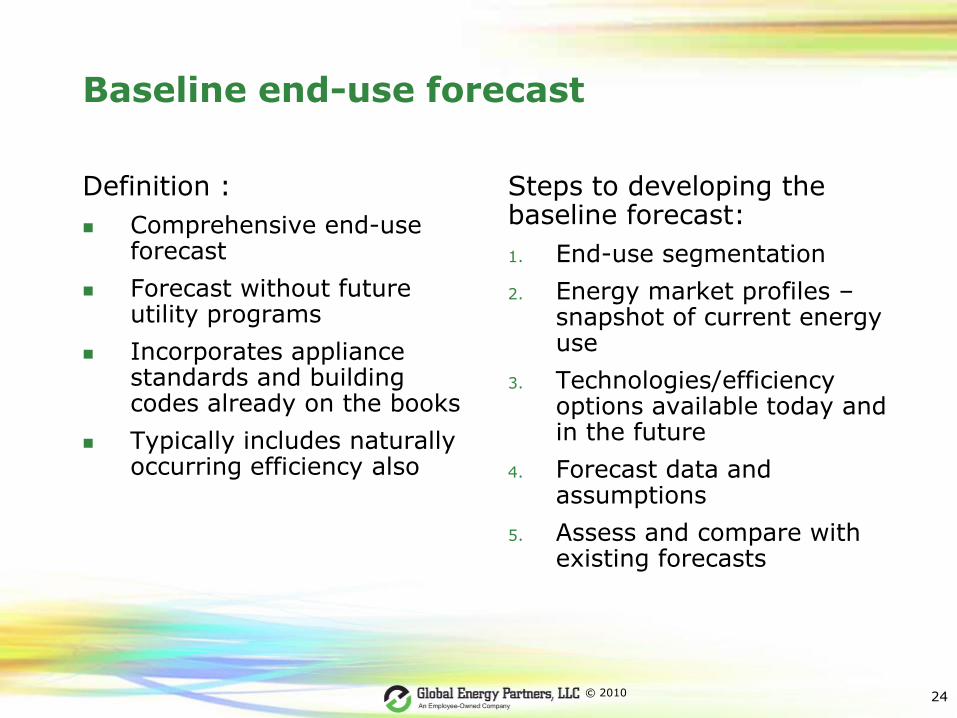
Baseline end-use forecast
Definition :
Comprehensive end-use forecast
Forecast without future utility programs
Incorporates appliance standards and building codes already on the books
Typically includes naturally occurring efficiency also
Steps to developing the baseline forecast:
1. End-use segmentation
2. Energy market profiles –snapshot of current energy use
3. Technologies/efficiency options available today and in the future
4. Forecast data and assumptions
5. Assess and compare with existing forecasts
24

© 2010
Example of end-use segmentation
25
Residential Commercial IndustrialCooling Cooling Process Heating
Central AC Central Chiller Electric resistance
Room AC Packaged AC Radio frequency
Space Heating PTAC Process Cooling and Refrigeration
Electric Resistance Space Heating Machine Drive
Electric Furnace Electric Resistance 1-5 hp motors
Combined Heating/Cooling Combined Heating/Cooling 5-20 hp motors
Air Source Heat Pump Air Source Heat Pump 20-50 hp motors
Geo-Thermal Heat Pump Geo-thermal Heat Pump 50-100 hp motors
Water Heating Water Heating 100-200 hp motors
Interior Lighting Interior Lighting 200-500 hp motors
Screw-in Screw-in 500-1,000 hp motors
Linear Fluorescent Linear Fluorescent 1,000-2,500 hp motors
Exterior Lighting Exterior Lighting >2,500 hp motors
Screw-in Screw-in Facility HVAC
Linear Fluorescent Linear Fluorescent Facility lighting
Appliances Refrigeration Incandescent
Refrigerator Walk-in Refrigeration Fluorescent
Freezer Reach-in Refrigeration HID
Clothes Washer Office Equipment
Clothes Dryer PC
Combined Washer/Dryer Server
Dishwasher Monitor
Cooking Printer/Copier
Electronics Food Service
Personal Computer Ventilation
Color TV Miscellaneous
Other Electronics
Miscellaneous
Pool Pump
Furnace Fan
Other Miscellaneous

© 2010
Example of an energy market profile: Residential sector
26
End Use Technology SaturationUEC Intensity Usage
(kWh) (kWh/HH) (GWh)
Cooling Central AC 86% 3,985 3,433 1,587
Cooling Room AC 13% 3,188 410 190
Space Heating Electric Resistance 5% 18,214 910 421
Space Heating Electric Furnace 0% 18,943 - -
Heat/Cool Air Source Heat Pump 13% 14,004 1,820 842
Heat/Cool Geo-Thermal Heat Pump 0% 9,242 - -
Water Heating Water Heater 24% 2,793 663 307
Interior Lighting Screw-in 100% 1,242 1,242 574
Interior Lighting Linear Fluorescent 100% 243 243 112
Exterior Lighting Screw-in 85% 374 318 147
Exterior Lighting Linear Fluorescent 85% 73 62 29
Appliances Refrigerator 100% 891 891 412
Appliances Freezer 42% 376 157 73
Appliances Second Refrigerator 20% 1,326 265 123
Appliances Clothes Washer 96% 561 540 250
Appliances Clothes Dryer 84% 821 693 321
Appliances Combined Washer/Dryer 0% 786 - -
Appliances Dishwasher 61% 173 105 49
Appliances Cooking 71% 750 533 247
Electronics Personal Computer 65% 470 306 142
Electronics Color TV 96% 313 300 139
Electronics Other Electronics 100% 343 343 159
Miscellaneous Pool Pump 13% 2,671 339 157
Miscellaneous Furnace Fan 68% 431 293 136
Miscellaneous Other Miscellaneous 100% 194 194 90
Total 14,069 6,505
Cooling26%
Space Heating11%
Combined Heating/Cooling
11%Water Heating
6%
Interior Lighting
10%
Exterior Lighting3%
Appliances21%
Electronics7%
Miscellaneous5%
End-use shares of total
residential sector use
Key data sources
Market characterization data Previous potential studies Previous customer surveys Results from Task 3 Prototypes and BESTTM analysis

© 2010
Technology data
Technology data for forecast
List of efficiency options for each technology
Include appliance/efficiency standards already in place
27
Technology Efficiency Label UEC Savings
Central AC E1 SEER 13 4,031 0%
Central AC E2 SEER 14 3,643 10%
Central AC E3 SEER 15 3,158 22%
Central AC E4 SEER 16 2,823 30%
Central AC E5 SEER 18 2,535 37%
Central AC E6 SEER 20 2,439 40%
Central AC E7 Ductless VRF 2,357 42%

© 2010
Forecast data and assumptions
Forecast drivers
Customer growth
Other exogenous variables
Energy prices
Income
Usage elasticities by end use for each exogenous variable
Borrowed from EPRI end-use models
Technology forecasts
Equipment purchase shares by decision type
Replace on burnout
New construction
Non-owner acquisition
Shares are user defined
Defaults based on trends in EIA’s Annual Energy Outlook
Incorporate existing appliance/equipment standards
Will be refined using New Mexico data
28

© 2010
Example: Baseline residential forecast
29
End use 2008 2010 2020 2030%
Increase
Average
Growth
Rate
Space Heat 95,586 89,212 97,007 100,599 5% 0.2%
Air Conditioning 233,372 251,357 294,732 340,326 46% 1.7%
Furnace Fans 19,219 20,304 23,679 26,203 36% 1.4%
Water Heating 111,661 112,721 126,625 130,450 17% 0.7%
Refrigerators 110,451 107,936 110,056 118,955 8% 0.3%
Freezers 23,827 23,766 27,485 33,988 43% 1.6%
Dishwashers 27,428 27,183 28,699 32,286 18% 0.7%
Cooking 31,017 31,820 37,408 42,212 36% 1.4%
Clothes Washers 9,994 9,645 8,036 8,306 -17% -0.8%
Clothes Dryers 74,337 74,702 81,024 89,726 21% 0.9%
Lighting 214,205 211,220 152,381 147,992 -31% -1.7%
Personal Computers 23,094 27,989 36,404 47,816 107% 3.3%
Color TV 109,238 115,247 128,111 168,074 54% 2.0%
Other Uses 319,205 350,581 421,978 500,294 57% 2.0%
Total 1,402,634 1,453,685 1,573,622 1,787,225 27% 1.1%
-
200
400
600
800
1,000
1,200
1,400
1,600
1,800
2,000
2008 2010 2020 2030
An
nu
al
Ele
ctr
icit
y U
se
(T
Wh
)
Space Heat
Air Conditioning
Furnace Fans
Water Heating
Refrig/Freez
Appliances
Lighting
Electronics
Other Uses
Source: Assessment of Achievable Potential from Energy Efficiency and Demand Response Programs in the U.S. (2010 – 2030).
EPRI, Palo Alto, CA: 2009. 1016987

© 2010
Steps to estimating EE potential
Identify and characterize EE measures
Uses technology data from baseline forecast
Includes additional measures
Perform economic screen
Requires measure costs and economic assumptions for TRC
Apply awareness,market adoption rates
Technical potential
Economic potential
Achievable potential
30
© 2010
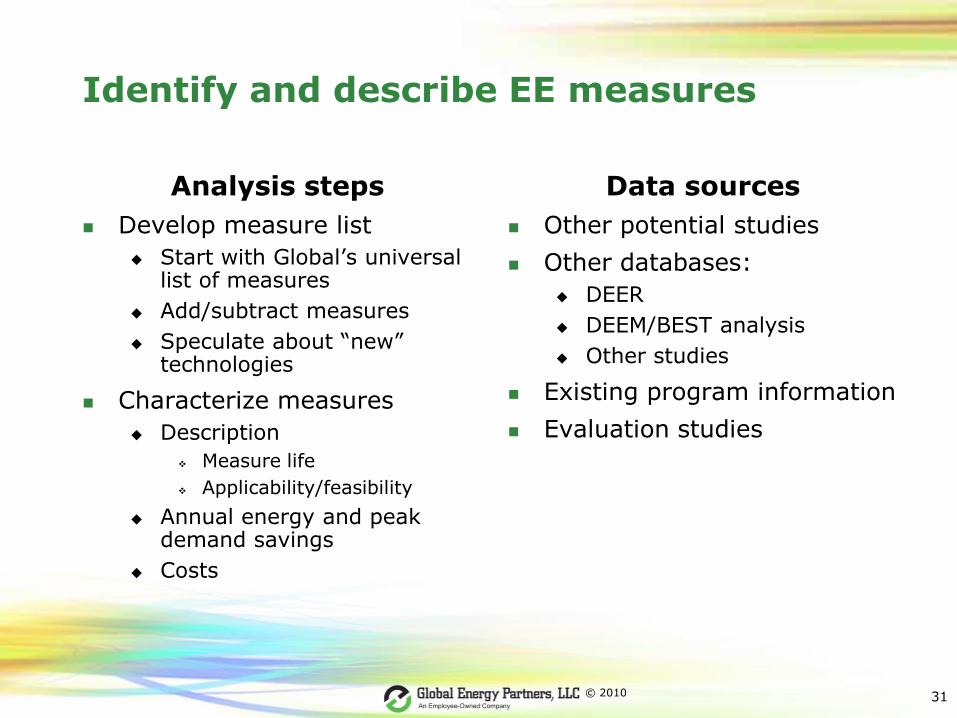
Identify and describe EE measures
Analysis steps
Develop measure list
Start with Global’s universal list of measures
Add/subtract measures
Speculate about ―new‖ technologies
Characterize measures
Description
Measure life
Applicability/feasibility
Annual energy and peak demand savings
Costs
Data sources
Other potential studies
Other databases:
DEER
DEEM/BEST analysis
Other studies
Existing program information
Evaluation studies
31
© 2010
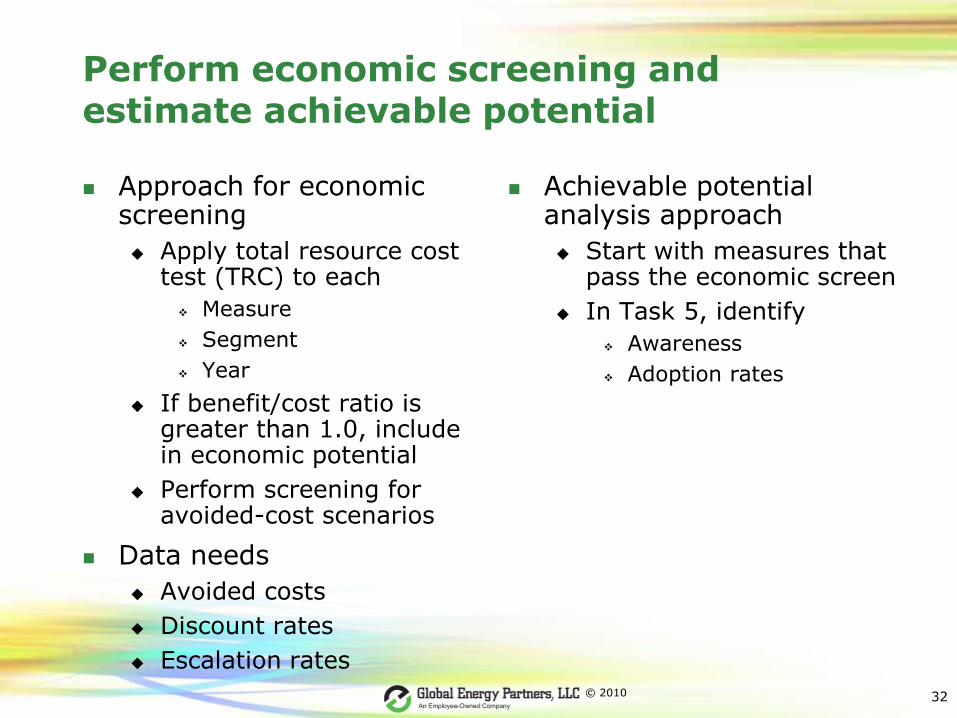
Perform economic screening and estimate achievable potential
Approach for economic screening
Apply total resource cost test (TRC) to each
Measure
Segment
Year
If benefit/cost ratio is greater than 1.0, include in economic potential
Perform screening for avoided-cost scenarios
Data needs
Avoided costs
Discount rates
Escalation rates
Achievable potential analysis approach
Start with measures that pass the economic screen
In Task 5, identify
Awareness
Adoption rates
32

© 2010
33
4b. Estimate demand response potential
Identify market segmentation approach
Recommend rate class – residential, small C&I, medium C&I, large C&I
Develop revised peak demand forecast
After savings from EE are applied
Identify capacity-constraint time period
Summer peak day (hot weather)
Other (e.g., top 100 hours)
Identify and characterize relevant DR options
Estimate potentials
Need to identify which levels of potential to estimate

© 2010
34
Relevant DR options
Dynamic pricing options
Critical peak pricing
Peak-time rebate
Real time pricing
Incentive-based options
Interruptible/curtailabletariffs
Direct load control
Switches
PCTs
Auto DR
Demand bidding/buyback
Ancillary services
Need to map options to sectors/segments
© 2010
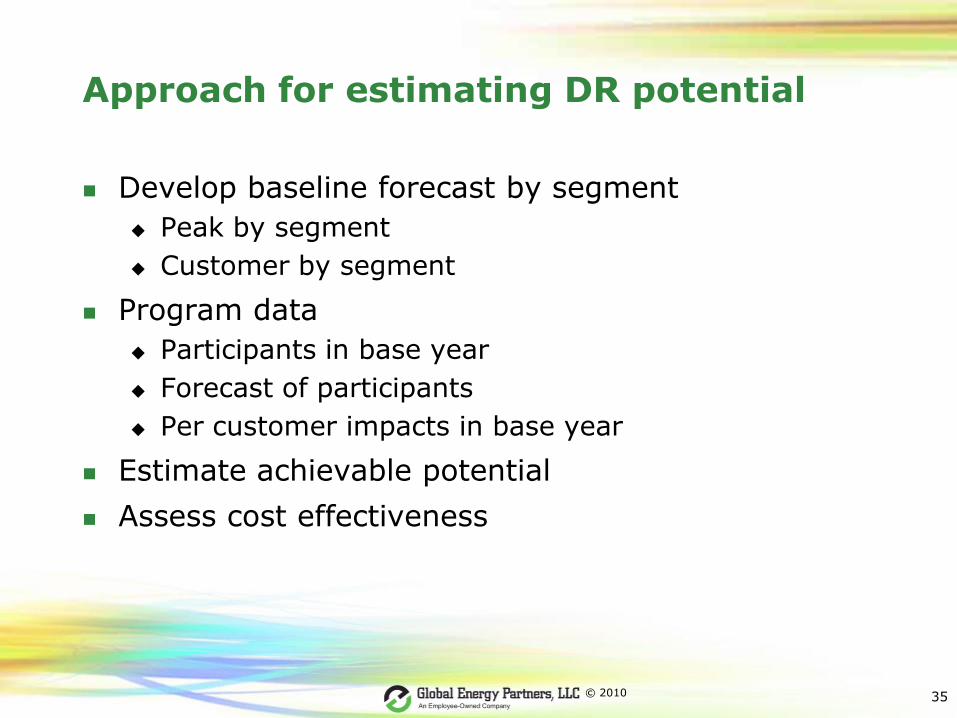
Approach for estimating DR potential
Develop baseline forecast by segment
Peak by segment
Customer by segment
Program data
Participants in base year
Forecast of participants
Per customer impacts in base year
Estimate achievable potential
Assess cost effectiveness
35
© 2010
5. Develop strategies
Focus on strategies to maximize customer adoption of EE and DR programs:
Program design
Marketing
Approach
Conduct independent best-practices research to identify high-achieving programs and critical success factors
Use Delphi method to gather expert opinion
Use two-pronged research to develop recommendations for New Mexico
36

© 2010
Types of EE programs offered nationwide
Information-based initiatives (e.g., customer awareness, advertising)
Technical assistance (e.g., audits, direct installs, etc.)
Rebates for the installation of pre-specified measures
Rebates for customized measures
Rebates for new construction measures and practices
Financing programs for energy efficiency
Targeted low-income customer campaigns
Initiatives targeting specific customer groups (e.g., government, schools, etc.)

© 2010
Types of DR programs offered nationwide
Direct control of end-use loads, including A/C and water heating
Curtailable contracts
Dynamic pricing programs, such as critical peak pricing, peak-time rebate
Capacity market programs
Technology enablement initiatives, such as automated DR
© 2010
Channel strategies – Most effective roles of various channels
Trade allies--partner with utility to design, supply and install EE measures; deliver program message and incentives to consumers
Trade associations--facilitate education of nonresidential and residential consumers
Community groups--provide workforce for events, education, and distribution/installation; raise profile of promo events
News media—provide promotion via paid advertising, education via reporting on energy issues & programs available
Government agencies--cost-share and champion public facility programs, coordinate low-income programs
Utility staff--range from administration only (turnkey outsource) to hands-on delivery (recruitment to incentives processing); always set and track goals
Third-party implementers--operate turnkey programs or individual components, provide education

© 2010
Customer education – Best practices
General EE vs. Program-Specific Education
Almost all utilities use bill inserts regularly to raise awareness and understanding of energy efficiency benefits and periodically promote a single program/measure
Almost all utilities combine some amount of general EE information with specific program information
e.g., Did you know that cutting your electricity use by just x% reduces carbon emissions by… And right now you can save $x on the purchase of a new ENERGY STAR® refrigerator…

© 2010
Customer education (cont.)
All successful programs have a strong educational component.
Audits used extensively to educate residential and business customers (window of opportunity)
Education and outreach directed to specific target markets is mostly conducted in person
Low-income customers-- part of in-home audits, general assistance, community outreach meetings
A&E contractors-- seminars for new construction design
Community campaigns and contests increasingly used to raise awareness of schools, neighborhood businesses, etc.
Engaging trade/industry associations and news media to run topical series in publications/meetings/shows effectively raises EE IQ and sparks inquiries about programs
© 2010
6. Final deliverables
Reports
Final report will document entire study
Will be based upon interim deliverables
Draft report will be provided well in advance of the final to allow for review
Final report delivered in June 2011
Meet ARRA reporting requirements
Presentations
At conclusion of study, there will be a formal presentation
Draft presentation will be delivered in advance
May also conduct one or more webinars
42

© 2010
Project organization
43
EMNRD Project ManagerKen Hughes
Global Project DirectorI. Rohmund
Global Project ManagerBridget KesterDebyani Ghosh
Senior AdvisorGreg Wikler
SubcontractorThe Brattle Group
1: Kickoff & Work PlanIngrid Rohmund
3: Primary Market ResearchBarb Ryan
4: PotentialsEE – Sharon YoshidaDR – Debyani Ghosh
5: StrategyGreg Wikler
Ahmad Faruqui
2: Stakeholder MeetingsBridget Kester
6. Final Report and PresentationsBridget Kester
New Mexico

© 2010
Project schedule
44
Task Description Due Date
1 Project kickoff and work plan September 1
2 Stakeholder input sessions October 1
3 Primary market research December 31
4 Potentials estimates February 28, 2011
5 Strategy analysis April 30, 2011
6 Final report and formal presentations June 15, 2011

© 2010
Contact Information
Global Energy Partners, LLC
Ingrid [email protected]
760-943-1532
Bridget [email protected]
858-780-2635
Debyani [email protected]
925-482-2002
Greg [email protected]
925-482-2010
45
The Brattle Group
Ahmad Faruqui, Ph.D.
415-217-1026
Doug Mitarotonda, Ph.D.
415-217-1033