ENERGY EFFICIENCY Market Report 2013 - gob.mx · 2019-04-18 · The Energy Efficiency Market Report...
278
ENERGY EFFICIENCY 2 0 13 Market Trends and Medium-Term Prospects Market Report Please note that this PDF is subject to specific restrictions that limit its use and distribution. The terms and conditions are available online at http://www.iea.org/ termsandconditionsuseandcopyright/ © OECD/IEA, 2013
Transcript of ENERGY EFFICIENCY Market Report 2013 - gob.mx · 2019-04-18 · The Energy Efficiency Market Report...

ENERGY EFFICIENCY2013
Market Trends and Medium-Term Prospects
Market Report
Please note that this PDF is subject to specific restrictions that limit its use and distribution. The terms and conditions are available online at http://www.iea.org/termsandconditionsuseandcopyright/
© O
EC
D/IE
A, 2
013

Energy efficiency has been referred to as a “hidden fuel”, one that extends energy supplies, increases energy security, lowers carbon emissions and generally supports sustainable economic growth. Yet it is hiding in plain sight: in 2011, investments in the energy efficiency market globally were at a similar scale to those in renewable energy or fossil-fuel power generation.
The Energy Efficiency Market Report provides a practical basis for understanding energy efficiency market activities, a review of the methodological and practical challenges associated with measuring the market and its components, and statistical analysis of energy efficiency and its impact on energy demand. It also highlights a specific technology sector in which there is significant energy efficiency market activity, in this instance appliances and ICT. The report presents a selection of country case studies that illustrate current energy efficiency markets in specific sectors, and how they may evolve in the medium term.
The energy efficiency market is diffuse, varied and involves all energy-consuming sectors of the economy. A comprehensive overview of market activity is complicated by the challenges associated with quantifying the components of the market and the paucity of comparable reported data. This report underscores how vital high-quality and timely energy efficiency data is to understanding this market.
This first Energy Efficiency Market Report sits alongside IEA market reports for oil, gas, coal and renewable energy, highlighting its place as a major energy resource. It summarises in one place the trends and prospects for investment and energy cost savings in the medium term, up to 2020.
ENERGY EFFICIENCY2013
Market Trends and Medium-Term Prospects
Market Report
€100 (61 2013 11 1P1) ISBN: 978 92 64 19122 8
© O
EC
D/IE
A, 2
013

ENERGY EFFICIENCY2013
Market Trends and Medium-Term Prospects
Market Report
© O
EC
D/IE
A, 2
013
INTERNATIONAL ENERGY AGENCY
The International Energy Agency (IEA), an autonomous agency, was established in November 1974. Its primary mandate was – and is – two-fold: to promote energy security amongst its member
countries through collective response to physical disruptions in oil supply, and provide authoritative research and analysis on ways to ensure reliable, affordable and clean energy for its 28 member countries and beyond. The IEA carries out a comprehensive programme of energy co-operation among its member countries, each of which is obliged to hold oil stocks equivalent to 90 days of its net imports. The Agency’s aims include the following objectives:
n Secure member countries’ access to reliable and ample supplies of all forms of energy; in particular, through maintaining effective emergency response capabilities in case of oil supply disruptions.
n Promote sustainable energy policies that spur economic growth and environmental protection in a global context – particularly in terms of reducing greenhouse-gas emissions that contribute to climate change.
n Improve transparency of international markets through collection and analysis of energy data.
n Support global collaboration on energy technology to secure future energy supplies and mitigate their environmental impact, including through improved energy
efficiency and development and deployment of low-carbon technologies.
n Find solutions to global energy challenges through engagement and dialogue with non-member countries, industry, international
organisations and other stakeholders.IEA member countries:
Australia Austria
Belgium Canada
Czech RepublicDenmark
FinlandFrance
GermanyGreece
HungaryIreland
ItalyJapan
Korea (Republic of)LuxembourgNetherlandsNew Zealand NorwayPolandPortugalSlovak RepublicSpainSwedenSwitzerlandTurkeyUnited Kingdom
United States
The European Commission also participates in
the work of the IEA.
Please note that this publication is subject to specific restrictions that limit its use and distribution.
The terms and conditions are available online at http://www.iea.org/termsandconditionsuseandcopyright/
© OECD/IEA, 2013International Energy Agency
9 rue de la Fédération 75739 Paris Cedex 15, France
www.iea.org
FOREWORD
ENERGY EFFICIENCY MARKET REPORT 2013 3
FOREWORD Each year the IEA publishes reports that analyse global market trends for each of the primary energy sources and provide medium-term forecasts. This first Energy Efficiency Market Report extends the series. I am pleased to release this inaugural Energy Efficiency Market Report, which is our first attempt to describe the wide range of energy efficiency activities worldwide in market terms. While it faces various data shortcomings which we hope to remedy in future reports, I believe it is informative, thought-provoking and valuable. Quite simply, we must change the way we think about energy efficiency. We need to start considering it a fuel, alongside oil, gas, coal or renewable energy, even though you cannot see or transport it as you can these other energy commodities. This report aims to highlight energy efficiency’s place as a major energy resource and the critical role it plays in the global energy market. The Energy Efficiency Market Report 2013 complements other IEA work that has highlighted the importance and potential of energy efficiency for meeting multiple economic, energy, and environmental policy objectives. This includes the 25 Energy Efficiency Recommendations, the Policy Pathways series, Energy Technology Perspectives and the World Energy Outlook. Yet the significant potential of energy efficiency is still far from being realised. By taking a market approach, we aim to present a different perspective, open a new debate and provide fresh impetus for energy efficiency uptake. This is our first effort and we look forward, with the support of stakeholders, to refining our approach and filling in any gaps for our next report. Investing in energy efficiency is a valuable alternative to investing in traditional supply-side fuels. By reducing or limiting energy demand, energy efficiency measures can increase resilience against a variety of risks, such as energy price rises and volatility, stress on energy infrastructure, and disruptions to energy supply systems. As an energy resource, energy efficiency has the unique potential to simultaneously contribute to long-term energy security, economic growth, and even improved health and well-being; in particular, it is a key means to reduce greenhouse gas emissions. The report finds that energy efficiency is an important market that is gaining momentum. Identified investments of up to USD 300 billion globally in 2011 are at a similar scale to renewable energy and fossil fuel power sector investments. The reduced energy demand stemming from energy efficiency over the past decades is larger than any other single supply-side energy source for a significant share of IEA member countries, suggesting it is not so much a “hidden fuel” but could in fact be our “first fuel”. It has been necessary to confront a number of methodological challenges associated with approaching energy efficiency from a market perspective. Should the market be measured in terms of investments in energy efficiency, the resulting avoided energy, or the value of this avoided energy? We think that each of these metrics can play a role. In addition, practical challenges have been faced in terms of data. For example, statistical analyses of the impacts of energy efficiency investments have only been possible for varying subsets of IEA member countries, depending on the sector. This report underscores how vital high-quality and timely energy efficiency data is to understanding this market. While the availability and reporting of data may not yet allow for a comprehensive
© O
EC
D/IE
A, 2
013

FOREWORD
4 ENERGY EFFICIENCY MARKET REPORT 2013
assessment of the market in all countries, the information that has been gathered here represents a shift in thinking towards considering energy efficiency in the context of a market – a place where supply and demand interact, and which can be measured. This shift in thinking is particularly relevant for governments. The design, monitoring and evaluation of policies and programmes must account for the impact on market actors and on the provision of and demand for energy-efficient goods and services. Governments will increasingly have to evaluate and optimise the way their energy price regimes and energy efficiency policies stimulate energy efficiency market activity and private sector investments. In the private sector, those involved in markets for energy-efficient products and services – from cars and buildings to energy management systems and specialised software tools – can also benefit from this strategic shift in the way energy efficiency is viewed. Their role in providing the data and information required to facilitate participation in the market – including by consumers, equipment manufacturers and service providers – will be essential for the expansion of investment and for meeting society’s energy and environment objectives. The Energy Efficiency Market Report underscores the importance of improving our understanding of and ability to measure energy efficiency markets. For the private sector, investments in energy efficiency can be even more attractive than other investments in the energy sector but are too often overlooked. This is a market with an exciting range of opportunities for entrepreneurship, innovation and growth. Consumers are the primary beneficiaries of this growing market. Where demand for energy services is already largely saturated, such as in IEA member countries, energy efficiency can relieve the pressure to keep energy bills down while taking on the climate change challenge. At a global level, energy efficiency can help limit the projected increase in demand for energy in the medium term. Where consumers have low levels of energy services today, energy efficiency can help make mobility, lighting, communication and other services all more available and affordable. Reduced expenditure on energy does not hinder economic growth; on the contrary, it releases consumer spending into other sectors of the economy, reallocating resources and stimulating growth. Ultimately, energy efficiency raises the productivity of our energy resources. Around the world, countries are generating more economic activity from each unit of energy they consume, in large part thanks to energy efficiency. This rise in energy productivity can help grow the global economy on a secure and sustainable basis. Promoting inclusive growth and energy security in the context of the climate challenge establishes a vital role for the energy efficiency market, one that is set to expand, as illustrated by this first Energy Efficiency Market Report. This report is published under my authority as Executive Director of the IEA. Maria van der Hoeven Executive Director International Energy Agency
© O
EC
D/IE
A, 2
013

ACKNOWLEDGEMENTS
ENERGY EFFICIENCY MARKET REPORT 2013 5
ACKNOWLEDGEMENTS The Energy Efficiency Market Report was prepared by the Energy Efficiency Unit (EEU) of the International Energy Agency (IEA). Drafting and co-ordination of the report was led by Sara Moarif, Simon Bennett (Energy Analyst in the Energy Efficiency and Environment Division) and Patricia Lightburn. Overall guidance and input was provided by Robert Tromop, Head of the EEU, and Philippe Benoit, Head of the Energy Efficiency and Environment Division (EED). This report received input and contributions from many EEU colleagues: Grayson Heffner, Lisa Ryan, Kyeong-Hee Je, Vida Rozite, Nina Campbell and Sara Pasquier, with invaluable support provided by Audrey Glynn-Garnier and Sally Wilkinson. The report’s analysis using energy efficiency indicators was prepared by Taejin Park (Energy Data Centre [EDC]), Nathalie Trudeau (Energy Demand Technology [EDT] Unit) and Simon Bennett, with guidance from Roberta Quadrelli (EDC) and Cecilia Tam (EDT). Didier Houssin, Director of Sustainable Policy and Technology (SPT), provided valuable direction and input into this work. This report benefitted from the important contributions of various IEA colleagues, particularly Dagmar Graczyk, Joerg Husar, Florian Kitt, Yerim Park, Veronika Gyuricza , Jonathan Sinton, Julie Jiang, Fabian Kesicki, Shigetoshi Ikeyama, Alessandro Blasi, Laura Cozzi, Alexander Koerner, François Cuenot, Dennis Volk and Keith Burnard. Timely data from the Energy Data Centre was fundamental; particular thanks are due to Taejin Park, Roberta Quadrelli, Helen Beilby-Orrin and Vladimir Kubecek. Other IEA colleagues have also provided valuable comments and important guidance for this work, particularly Laszlo Varro, Head of the Gas, Coal and Power Markets Division, Cecilia Tam, Head of the EDT Unit, and Jean-Yves Garnier, Director of the Energy Data Centre. This work benefitted from review and comments from the IEA Energy Efficiency Working Party, as well as experts from member and partner countries and from various organisations. In particular, thanks are due individuals from the following organisations, who provided important review comments or project inputs: AFC First, Alliance to Save Energy, American Council for an Energy-Efficiency Economy (ACEEE), American Gas Association, Australia (Department of Resources, Energy and Tourism), Canada (Natural Resources Canada), Canadian Electricity Association (CEA), CDC Climat, Centre Scientifique et Technique du Bâtiment (CSTB), Climate Strategy, Collaborative Labeling and Appliance Standards Program (CLASP), Consortium for Energy Efficiency, India (Energy Efficiency Services Limited), Energy Trust of Oregon, Eoin Lees, Eskom, EuroACE, European Commission (Directorate-General for Energy), Eurelectric, eu.ESCo, European Climate Foundation, European Council for an Energy Efficiency Economy (eceee), France (Ministère de l’Ecologie, du Développement Durable et de l’Energie), Germany (Federal Ministry of Economics and Technology – BMWi), Institute for Industrial Productivity, Inter-American Development Bank, ISO New England, Korea (Korea Energy Management Corporation – KEMCO; Ministry of Trade, Industry and Energy – MOTIE), Institute for Electric Efficiency, The International Council for Clean Transportation (ICCT), The Institute of Energy Economics, Japan (IEEJ), Japan (Ministry of Economy, Trade and Industry), Latin American Energy Organization (OLADE), Mexico (Comisión Nacional para el Uso Eficiente de la Energía – CONUEE), National Association of Regulatory Utility Commissioners (NARUC), National Association of State Energy Officials (NASEO), National Electrical Manufacturers Association (NEMA), New Zealand (Energy Efficiency and Conservation Authority), Nexant Ltd., North American Insulation Manufacturers Association, Ontario Power Authority, Opportunity Studies, Pacific Northwest Laboratory (PNNL), Regulatory Assistance Project, Southern California Edison, Southwest Energy Efficiency Project, United Kingdom (Department of Energy and Climate Change), UK Green Building Council, United
© O
EC
D/IE
A, 2
013

ACKNOWLEDGEMENTS
6 ENERGY EFFICIENCY MARKET REPORT 2013
States (Department of Energy), University of California Davis, Institute of Transportation Studies. Particular thanks are due to colleagues at Laurence Berkeley National Laboratory for their substantive inputs. The authors would like to thank Justin French-Brooks for his excellent editing of the manuscript, as well as the IEA Communication and Information Office, in particular Muriel Custodio, Cheryl Haines, Astrid Dumond, Greg Frost, Robert Youngblood, Rebecca Gaghen and Angela Gosmann for their invaluable assistance.
© O
EC
D/IE
A, 2
013

TABLE OF CONTENTS
ENERGY EFFICIENCY MARKET REPORT 2013 7
TABLE OF CONTENTS
Foreword ..................................................................................................................................... 3
Acknowledgements ...................................................................................................................... 5
Executive Summary .................................................................................................................... 16
Introduction ............................................................................................................................... 24
The purpose of the market report ........................................................................................................ 24
Approach taken ..................................................................................................................................... 24
How to read this report ......................................................................................................................... 25
References ............................................................................................................................................. 26
Part 1. The Market for Energy Efficiency........................................................ 27
1. Understanding the Market for Energy Efficiency ...................................................................... 28
Defining the energy efficiency market .................................................................................................. 28
The dynamics of supply and demand .................................................................................................... 28
Key sectors in the energy efficiency market ......................................................................................... 36
Multiple benefits of energy efficiency .................................................................................................. 38
References ............................................................................................................................................. 39
2. Measuring the Market for Energy Efficiency ............................................................................ 42
Quantifying the global energy efficiency market .................................................................................. 42
Challenges of defining the energy efficiency market ............................................................................ 42
A summary literature review on estimates: a variety of approaches ................................................... 44
Deriving an investment estimate for the global energy efficiency market ........................................... 49
Conclusions ............................................................................................................................................ 51
References ............................................................................................................................................. 51
3. What the Numbers Say: Energy Efficiency and Changing Energy Use ........................................ 53
Quantifying energy use and the impacts of the energy efficiency market ........................................... 53
Energy efficiency: the first fuel? ............................................................................................................ 55
Energy intensity, productivity and per-capita consumption ................................................................. 57
IEA indicators: moving beyond energy intensity for a subset of countries .......................................... 60
Sectoral indicators ................................................................................................................................. 62
Conclusions ............................................................................................................................................ 74
References ............................................................................................................................................. 75
4. Technology Focus: Appliances, Lighting and ICT ....................................................................... 76
Trends in global appliance, lighting and ICT markets ............................................................................ 76
Market transformation towards greater efficiency in appliances and lighting .................................... 80
The opportunities and challenges of ICT markets ................................................................................. 84
© O
EC
D/IE
A, 2
013

TABLE OF CONTENTS
8 ENERGY EFFICIENCY MARKET REPORT 2013
Conclusions ............................................................................................................................................ 88 References ............................................................................................................................................. 89
Part 2. Energy Efficiency Market Compendium: Country Case Studies ........... 93 5. Introduction ........................................................................................................................... 94
6. Australia ................................................................................................................................. 95 Energy profile and context .................................................................................................................... 95 Energy efficiency market activity .......................................................................................................... 99 Conclusions .......................................................................................................................................... 102 References ........................................................................................................................................... 103
7. Canada .................................................................................................................................. 104
Energy profile and context .................................................................................................................. 104
Energy efficiency market activity ........................................................................................................ 107
Conclusions .......................................................................................................................................... 112
References ........................................................................................................................................... 112
8. China ..................................................................................................................................... 114
Energy profile and context .................................................................................................................. 114
Energy efficiency market activity ........................................................................................................ 116
Conclusions .......................................................................................................................................... 122
References ........................................................................................................................................... 122
9. European Union ..................................................................................................................... 124
Energy profile and context .................................................................................................................. 124
Energy efficiency market activity ........................................................................................................ 127
Conclusions .......................................................................................................................................... 134
References ........................................................................................................................................... 135
10. France ................................................................................................................................. 137
Energy profile and context .................................................................................................................. 137
Energy efficiency market activity ........................................................................................................ 141
Conclusions .......................................................................................................................................... 146
References ........................................................................................................................................... 146
11. Germany ............................................................................................................................. 149
Energy profile and context .................................................................................................................. 149
Energy efficiency market activity ........................................................................................................ 153
Conclusions .......................................................................................................................................... 159
References ........................................................................................................................................... 159
12. India .................................................................................................................................... 162
Energy profile and context .................................................................................................................. 162
Energy efficiency market activity ........................................................................................................ 164
© O
EC
D/IE
A, 2
013

TABLE OF CONTENTS
ENERGY EFFICIENCY MARKET REPORT 2013 9
Conclusions .......................................................................................................................................... 168
References ........................................................................................................................................... 168
13. Japan ................................................................................................................................... 169
Energy profile and context .................................................................................................................. 169
Energy efficiency market activity ........................................................................................................ 172
Conclusions .......................................................................................................................................... 176
References ........................................................................................................................................... 176
14. Korea .................................................................................................................................. 178
Energy profile and context .................................................................................................................. 178
Energy efficiency market activity ........................................................................................................ 181
References ........................................................................................................................................... 187
15. Mexico ................................................................................................................................ 188
Energy profile and context .................................................................................................................. 188
Energy efficiency market activity ........................................................................................................ 190
Conclusions .......................................................................................................................................... 194
References ........................................................................................................................................... 195
16. New Zealand ....................................................................................................................... 196
Energy profile and context .................................................................................................................. 196
Energy efficiency market activity ........................................................................................................ 199
Conclusions .......................................................................................................................................... 204
References ........................................................................................................................................... 205
17. South Africa ......................................................................................................................... 206
Energy profile and context .................................................................................................................. 206
Energy efficiency market activity ........................................................................................................ 208
Conclusions .......................................................................................................................................... 212
References ........................................................................................................................................... 212
18. Southeast Asian Countries ................................................................................................... 214
Energy profile and context .................................................................................................................. 214
Energy efficiency market activity ........................................................................................................ 218
Conclusions .......................................................................................................................................... 227
References ........................................................................................................................................... 228
19. United Kingdom ................................................................................................................... 230
Energy profile and context .................................................................................................................. 230
Energy efficiency market activity ........................................................................................................ 234
Conclusions .......................................................................................................................................... 240
References ........................................................................................................................................... 241
© O
EC
D/IE
A, 2
013

TABLE OF CONTENTS
10 ENERGY EFFICIENCY MARKET REPORT 2013
20. United States ....................................................................................................................... 243
Summary outlook ................................................................................................................................ 243
Energy profile and context .................................................................................................................. 244
Energy efficiency market activity ........................................................................................................ 246
Conclusions .......................................................................................................................................... 257
References ........................................................................................................................................... 258
Part 3. Annex and Glossary ......................................................................... 261
Annex: Country-level Energy Use and Intensity Data .................................................................. 262
Glossary .................................................................................................................................... 267
Definitions ........................................................................................................................................... 267
Scenarios ............................................................................................................................................. 268
Regions ................................................................................................................................................ 268
Acronyms, abbreviations and units of measure .................................................................................. 270
LIST OF FIGURES Figure ES.1 Global levels of investment and subsidy in selected areas of the energy system, 2011 .... 17 Figure ES.2 The “first fuel”: avoided energy use from energy efficiency in 11 IEA member countries ... 18 Figure ES.3 Change in aggregate intensity, decomposed into structure and efficiency effects, 1990-2010 ........................................................................................................................ 19 Figure ES.4 The market for energy efficiency .................................................................................... 20 Figure 1.1 The market for energy efficiency .................................................................................... 28 Figure 1.2 Energy efficiency cost curve for the United States ......................................................... 32 Figure 1.3 Progress in implementation of IEA 25 EEPR by IEA countries ......................................... 34 Figure 1.4 Growing magnitude of imports of coal and coal products, oil and oil products and gas (from left to right), 2001-11 ............................................................................... 36 Figure 1.5 The multiple benefits of energy efficiency ...................................................................... 38 Figure 2.1 Reductions in TFC due to efficiency by region in IEA World Energy Outlook scenarios ...... 48 Figure 2.2 Cumulative reductions in TFC by sector in the EWS compared to the NPS, 2013-20 ..... 49 Figure 3.1 TPES and TFC, 2001-11, and energy supply by source, 2011 .......................................... 53 Figure 3.2 Sectoral breakdown of global TFC by energy source, 2001 and 2011 ............................ 54 Figure 3.3 The “first fuel”: long-term improvements in energy efficiency in 11 IEA member countries .. 56 Figure 3.4 The “first fuel”: contribution of energy efficiency compared to other energy resources consumed in 2010 in 11 IEA member countries ............................................................. 56 Figure 3.5 Evolution of IEA and World average energy intensity, TPES per GDP ............................ 57 Figure 3.6 Evolution of energy productivity for selected IEA member countries, GDP per unit of TPES, 2002-12 ........................................................................................ 58 Figure 3.7 Approximate trends in GDP per unit of TPES and TPES per capita for IEA member countries, 2002-12 ................................................................................ 59 Figure 3.8 Approximate trends in GDP per unit of TPES and TPES per capita in BRICS countries, 2002-12 ............................................................................................................................ 60
© O
EC
D/IE
A, 2
013

TABLE OF CONTENTS
ENERGY EFFICIENCY MARKET REPORT 2013 11
Figure 3.9 Changes in TFC, decomposed into structure, activity and efficiency effects for 15 IEA member countries .......................................................................................... 61 Figure 3.10 Changes in aggregate intensities of 15 member IEA countries, decomposed into structure and efficiency effects, 1990-2010 ...................................... 61 Figure 3.11 Industrial energy use per unit of value-added for 20 IEA member countries, 1990 and 2010 ................................................................................................................. 62 Figure 3.12 Composition of industrial value-added for 21 IEA member countries, 1990 (left) and 2010 (right) ............................................................................................. 65 Figure 3.13 Change in industrial energy intensity, decomposed into structure and efficiency effects for 20 IEA member countries, 1990-2010 ....................................................................... 66 Figure 3.14 Global potential savings from the adoption of BAT in the five most energy-intensive industries ............................................................................................... 66 Figure 3.15 Residential energy consumption by end-use for 20 IEA member countries, 1990 (left) and 2010 (right) ............................................................................................. 67 Figure 3.16 Share of space heating by fuel for 22 IEA member countries, 1990 (left) and 2010 (right) ... 68 Figure 3.17 Changes in space heating per capita, decomposed into contributing factors for 20 IEA member countries, 1990-2010 ....................................................................... 69 Figure 3.18 Energy per passenger-kilometre for 20 IEA member countries, 1990 and 2010 ............ 70 Figure 3.19 Share of total passenger-kilometres by mode for 22 IEA member countries, 1990 (left) and 2010 (right) ............................................................................................. 71 Figure 3.20 Trends in new-car fuel efficiency for 15 IEA member countries, 1990-2010 ................. 71 Figure 3.21 Freight transport energy per tonne-kilometre for 20 IEA member countries, 1990 (left) and 2010 (right)............................................................................................... 73 Figure 3.22 Share of tonne-kilometres by transport mode for 24 IEA member countries, 1990 (left) and 2010 (right) ............................................................................................. 73 Figure 3.23 Trends in truck freight energy intensity for 20 IEA member countries, 1990-2010 ....... 74 Figure 4.1 Global appliance and ICT production forecast, 2010-17 ................................................. 76 Figure 4.2 The expanding scope of networked technologies .......................................................... 77 Figure 4.3 Network-connected-product shipment forecast ............................................................ 77 Figure 4.4 Smart appliance global market value, 2010-19............................................................... 78 Figure 4.5 Projection of general lighting market expansion by region ............................................ 79 Figure 4.6 Lighting market penetration by technology: total worldwide lighting stock .................. 79 Figure 4.7 Market transformation of products due to implementation of standards and labels ... 80 Figure 4.8 Sales of ENERGY STAR certified products since 1993 ..................................................... 82 Figure 4.9 Energy efficiency classes of domestic appliances sales in the European Union, 2011 ... 83 Figure 4.10 Smart meter shipment forecast ...................................................................................... 88 Figure 6.1 TPES and TFC, 2001-12, and energy supply by source, 2012 .......................................... 95 Figure 6.2 Share of TFC by sector, 2011, and TFC by sector and by energy source, 2001 and 2011 .. 96 Figure 6.3 Evolution of Australian energy intensity as a function of GDP, 2001-12 ........................ 96 Figure 6.4 Changes in TFC, decomposed into structure, activity and efficiency effects .................. 97 Figure 6.5 Changes in electricity generation and consumption, 2002-12 ....................................... 98 Figure 6.6 Volume, price and costs of oil imports, 2002-12 ............................................................ 98 Figure 7.1 TPES and TFC, 2001-12, and energy supply by source, 2012 ........................................ 104 Figure 7.2 Share of TFC by sector, 2011, and TFC by sector and by energy source, 2001 and 2011 ... 105 Figure 7.3 Changes in TFC, decomposed into structure, activity and efficiency effects ................ 105 Figure 7.4 Evolution of energy intensity as a function of GDP, 2001-12 ....................................... 106
© O
EC
D/IE
A, 2
013

TABLE OF CONTENTS
12 ENERGY EFFICIENCY MARKET REPORT 2013
Figure 7.5 Volume, price and costs of oil imports, 2002-12 .......................................................... 106 Figure 7.6 Changes in electricity generation and consumption, 2002-12 ..................................... 107 Figure 7.7 Final energy use, with and without energy efficiency improvements, 1990-2010 ....... 107 Figure 7.8 ENERGY STAR qualified appliances as a percentage of total shipments in Canada, 1999-2010 ...................................................................................................................... 111 Figure 8.1 TPES and TFC, 2001-11, and energy supply by source, 2011 ........................................ 115 Figure 8.2 Share of TFC by sector, 2011, and TFC by sector and by energy source, 2001 and 2011 ... 115 Figure 8.3 Evolution of energy intensity as a function of GDP, 2001-11 ....................................... 116 Figure 8.4 Changes in electricity generation and consumption, 2001-11 ..................................... 116 Figure 8.5 SC and USC capacity in major coal-using countries ...................................................... 119 Figure 9.1 TPES and TFC, 2001-11, and energy supply by source, 2011 ........................................ 124 Figure 9.2 Evolution of energy intensity as a function of GDP, 2001-12 ....................................... 125 Figure 9.3 Share of TFC by sector, 2011, and TFC by sector and by energy source, 2001 and 2011 ... 125 Figure 9.4 Changes in electricity generation and consumption, 2001-11 ..................................... 126 Figure 9.5 Projection of primary energy use for the European Union to 2020 ............................. 127 Figure 9.6 Direct and avoided costs in five-year periods as a result of the EED ............................ 128 Figure 10.1 TPES and TFC, 2001-12, and energy supply by source, 2012 ........................................ 137 Figure 10.2 Share of TFC by sector, 2011, and TFC by sector and by energy source, 2001 and 2011 ... 138 Figure 10.3 Changes in electricity generation and consumption, 2002-12 ..................................... 138 Figure 10.4 Changes in TFC, decomposed into structure, activity and efficiency effects ................ 139 Figure 10.5 Evolution of energy intensity as a function of GDP ...................................................... 139 Figure 10.6 Volume, price and costs of oil imports, 2002-12 .......................................................... 140 Figure 10.7 Proportion of household expenditure on energy ......................................................... 140 Figure 10.8 Overall energy savings from improvements in energy efficiency ................................. 141 Figure 11.1 TPES and TFC, 2001-12, and energy supply by source, 2012 ........................................ 149 Figure 11.2 Share of TFC by sector, 2011, and TFC by sector and by energy source, 2001 and 2011 ... 150 Figure 11.3 Overall energy savings from improvement in energy efficiency .................................. 150 Figure 11.4 Changes in TFC, decomposed into structure, activity and efficiency effects ................ 151 Figure 11.5 Evolution of energy intensity as a function of GDP, 2001-12 ....................................... 151 Figure 11.6 Volume, price and costs of oil imports, 2002-12 .......................................................... 152 Figure 11.7 Changes in electricity generation and consumption, 2002-12 ..................................... 152 Figure 11.8 Proportion of household expenditure on energy ......................................................... 153 Figure 11.9 Volume of grants and loans under building refurbishment programmes .................... 156 Figure 11.10 Reductions in final energy demand from building retrofit programmes ...................... 157 Figure 12.1 TPES and TFC, 2001-11, and energy supply by source, 2011 ........................................ 162 Figure 12.2 Evolution of energy intensity as a function of GDP, 2001-11 ....................................... 163 Figure 12.3 Share of TFC by sector, 2011, and TFC by sector and by energy source, 2001 and 2011 ... 163 Figure 12.4 Changes in electricity generation and consumption, 2001-11 ..................................... 164 Figure 13.1 TPES and TFC, 2001-12, and energy supply by source, 2012 ........................................ 169 Figure 13.2 Share of TFC by sector, 2011, and TFC by sector and by energy source, 2001 and 2011 ... 170 Figure 13.3 Volume, price and costs of oil imports, 2002-12 .......................................................... 170 Figure 13.4 Changes in TFC, decomposed into structure, activity and efficiency effects ................ 171 Figure 13.5 Evolution of energy intensity as a function of GDP, 2001-12 ....................................... 171 Figure 13.6 Changes in electricity generation and consumption, 2001-11 ..................................... 172 Figure 13.7 Average fuel economy of cars and share of passenger transport, 2000-10 ................. 173 Figure 13.8 Comparison of light-duty vehicle fuel efficiency standards and targets ....................... 174
© O
EC
D/IE
A, 2
013

TABLE OF CONTENTS
ENERGY EFFICIENCY MARKET REPORT 2013 13
Figure 14.1 TPES and TFC, 2001-12, and energy supply by source, 2012 ........................................ 178 Figure 14.2 Share of TFC by sector, 2011, and TFC by sector and by energy source, 2001 and 2011 ... 179 Figure 14.3 Evolution of energy intensity as a function of GDP, 2001-12 ....................................... 179 Figure 14.4 Volume, price and costs of oil imports, 2002-12 .......................................................... 179 Figure 14.5 Changes in electricity generation and consumption, 2001-11 ..................................... 180 Figure 14.6 Proportion of household expenditure on energy ......................................................... 180 Figure 14.7 Energy demand and target, 2008-30 ............................................................................ 181 Figure 14.8 Breakdown by efficiency level of appliances and equipment sold in Korea, 2008-12 .. 183 Figure 14.9 Car ownership in Korea ................................................................................................. 184 Figure 14.10 Breakdown by efficiency level of car sales in Korea, 2007-11 ...................................... 185 Figure 15.1 TPES and TFC, 2001-12, and energy supply by source, 2012 ........................................ 188 Figure 15.2 Share of TFC by sector, 2011, and TFC by sector and by energy source, 2001 and 2011 ... 188 Figure 15.3 Evolution of energy intensity as a function of GDP, 2001-12 ....................................... 189 Figure 15.4 Changes in electricity generation and consumption, 2001-11 ..................................... 189 Figure 15.5 Proportion of household expenditure on energy ......................................................... 190 Figure 16.1 TPES and TFC, 2001-12, and energy supply by source, 2012 ........................................ 196 Figure 16.2 Share of TFC by sector, 2011, and TFC by sector and by energy source, 2001 and 2011 ... 197 Figure 16.3 Changes in TFC, decomposed into structure, activity and efficiency effects ................ 197 Figure 16.4 Evolution of energy intensity as a function of GDP, 2001-12 ....................................... 198 Figure 16.5 Changes in electricity generation and consumption, 2002-12 ..................................... 199 Figure 16.6 Volume, price and costs of oil imports, 2002-12 .......................................................... 199 Figure 16.7 Changes in final residential energy consumption, decomposed into contributing factors ... 200 Figure 16.8 Energy consumption by type of appliance .................................................................... 201 Figure 16.9 Improvement in the average efficiency of appliance classes in New Zealand since 2000 ... 202 Figure 17.1 TPES and TFC, 2001-11, and energy supply by source, 2011 ........................................ 206 Figure 17.2 Share of TFC by sector, 2011, and TFC by sector and by energy source, 2001 and 2011 ... 206 Figure 17.3 Changes in electricity generation and consumption, 2001-11 ..................................... 207 Figure 17.4 Evolution of energy intensity as a function of GDP, 2001-11 ....................................... 207 Figure 17.5 Eskom’s programmes to engage different market segments ....................................... 210 Figure 18.1 Evolution of energy intensity as a function of GDP, 2001-11 ....................................... 215 Figure 18.2 TFC by sector and by energy source, 2001-11 .............................................................. 216 Figure 18.3 Reduction in TPES in the Efficient ASEAN Scenario relative to the NPS ....................... 223 Figure 18.4 Share of total projected primary energy demand to be met through energy efficiency, 2030 .. 224 Figure 18.5 Annual electricity savings potential in Indonesia, Malaysia, Singapore, Thailand and Vietnam, 2010-20 ................................................................................................... 225 Figure 18.6 Investment (left) and savings (right) potential by country by sector............................ 226 Figure 19.1 TPES and TFC, 2001-12, and energy supply by source, 2012 ........................................ 230 Figure 19.2 Share of TFC by sector, 2011, and TFC by sector and by energy source, 2001 and 2011 ... 231 Figure 19.3 Changes in electricity generation and consumption, 2002-12 ..................................... 231 Figure 19.4 Overall avoided energy use from improvements in energy efficiency, 2000-10 .......... 232 Figure 19.5 Changes in TFC, decomposed into structure, activity and efficiency effects ................ 232 Figure 19.6 Evolution of energy intensity as a function of GDP, 2001-12 ....................................... 233 Figure 19.7 Volume, price and costs of oil imports, 2002-12 .......................................................... 233 Figure 19.8 Proportion of household expenditure on energy ......................................................... 234 Figure 20.1 Impact of supply- and demand-side improvements on oil import needs ..................... 243 Figure 20.2 TPES and TFC, 2001-12, and energy supply by source, 2012 ........................................ 244
© O
EC
D/IE
A, 2
013
TABLE OF CONTENTS
14 ENERGY EFFICIENCY MARKET REPORT 2013
Figure 20.3 Share of TFC by sector, 2011, and TFC by sector and by energy source, 2001 and 2011 ... 244 Figure 20.4 Evolution of energy intensity as a function of GDP, 2001-12 ....................................... 245 Figure 20.5 Changes in TFC, decomposed into structure, activity and efficiency effects ................ 245 Figure 20.6 Proportion of household expenditure on energy ......................................................... 246 Figure 20.7 International comparison of light-duty vehicle fuel economy standards ..................... 248 Figure 20.8 Potential energy savings from new appliance energy performance standards............ 249 Figure 20.9 Ratepayer-funded natural gas and electric energy efficiency spending ....................... 251 Figure 20.10 Projected electric and gas energy efficiency programme spending under three scenarios, 2012-25 .................................................................................... 251 Figure 20.11 Impact of energy efficiency policies on retail electricity sales, 2010-35 ...................... 252 Figure 20.12 Historical and forecast revenues of ESCO industry, 1990-2020.................................... 253 Figure 20.13 ESCO project value under DOE’s Super-ESPC programme, 1998-2013 ........................ 253 Figure 20.14 Estimated ESCO market potential in commercial and MUSH sectors .......................... 254 Figure 20.15 Actual and forecast annual savings from energy efficiency policies and markets, 2011 and 2020 ............................................................................................................... 257
LIST OF TABLES Table 1.1 Metrics describing energy supply and consumption ......................................................... 30 Table 1.2 Selected national studies of energy efficiency potential ................................................... 31 Table 2.1 Comparison of energy efficiency spending estimates ....................................................... 46 Table 3.1 Variables and metrics used for sectoral indicators ............................................................ 64 Table 4.1 Projected market share by label efficiency category in China ........................................... 81 Table 4.2 Estimated annual savings in 2030 in SEAD economies ...................................................... 81 Table 4.3 Appliance and equipment efficiency programmes in Korea .............................................. 84 Table 4.4 Medium-term smart meter developments in key regions ................................................. 88 Table 6.1 Opportunities for avoided energy use in Australian industry in 2010/11 ....................... 100 Table 7.1 Overview of key federal government programmes targeting energy efficiency ............. 108 Table 7.2 Estimated impact of the energy efficiency regulations, 2010 and 2020 (aggregate annual savings) ............................................................................................... 109 Table 8.1 Summary of investments in programmes within the 11th FYP ....................................... 117 Table 9.1 Energy efficiency market drivers in the EED .................................................................... 130 Table 9.2 EU energy efficiency funding ............................................................................................ 133 Table 10.1 Investments and outcomes of the French white certificate scheme (CEE)...................... 144 Table 11.1 Estimated 2020 final energy consumption under business-as-usual scenario and Energy Concept scenario ........................................................................................... 154 Table 11.2 KfW current refurbishment and construction residential buildings sector programmes ...... 155 Table 12.1 Expected investment and impact ..................................................................................... 164 Table 12.2 Energy savings investment potential in India by sector ................................................... 165 Table 12.3 Overview of key energy efficiency policies ...................................................................... 165 Table 13.1 Results of quantitative cost-benefit analysis of Top Runner energy efficiency standards ... 175 Table 14.1 Projected energy demand under current policies and new policies (Mtoe) .................... 181 Table 14.2 Global market size for major appliances (USD billion) and Korea’s market share ........... 182 Table 14.3 Results of Korean energy efficiency standards and labelling programmes, 2011 ........... 183 Table 14.4 New fuel economy label stringency levels ....................................................................... 184 Table 14.5 Fuel savings when moving one level up ........................................................................... 184
© O
EC
D/IE
A, 2
013

TABLE OF CONTENTS
ENERGY EFFICIENCY MARKET REPORT 2013 15
Table 14.6 Korean Average Fuel Economy Programme standards .................................................... 185 Table 14.7 ESCO sector turnover, 2007-11 (USD million) .................................................................. 186 Table 14.8 Cumulative ESCO expenditure by technology, 2007-11 (USD million)............................. 186 Table 15.1 Mexican energy policies and programmes ....................................................................... 191 Table 15.2 Mexican equipment labels and standards coverage ........................................................ 191 Table 16.1 Cost-benefit analysis of New Zealand’s WUNZ-HS Programme ....................................... 203 Table 16.2 Estimated producer surplus of the WUNZ-HS Programme .............................................. 203 Table 18.1 Changes in energy supply and energy consumption ........................................................ 214 Table 18.2 Selected energy efficiency and conservation goals .......................................................... 218 Table 18.3 Efficiency programmes, investments and outcomes in Indonesia ................................... 218 Table 18.4 Efficiency programmes, investments and outcomes in Singapore .................................. 219 Table 18.5 Efficiency programmes, investments and outcomes in the Philippines .......................... 220 Table 18.6 Efficiency programmes, investments and outcomes in Thailand ..................................... 220 Table 18.7 Efficiency programmes, investments and outcomes in Vietnam ..................................... 221 Table 18.8 Efficiency programmes, investments and outcomes in Malaysia .................................... 222 Table 18.9 Investment needed to meet national energy efficiency targets by 2020 ........................ 224 Table 19.1 Energy-saving potentials and energy savings from policy, 2020 (Mtoe) ......................... 235 Table 19.2 Scope and market activity under CERT and CESP ............................................................. 237 Table 19.3 Scope and expected market activity under the Green Deal and ECO .............................. 239 Table 20.1 Energy efficiency policies and results ............................................................................... 247 Table 20.2 Tailwinds and headwinds for US medium-term energy efficiency markets .................... 256 Table A.1 Total primary energy supply (TPES) by country (million tonnes of oil equivalent ([Mtoe]) ... 262 Table A.2 Total final consumption (TFC) by country (million tonnes of oil equivalent ([Mtoe]) ..... 263 Table A.3 TPES/GDP PPP by country (toe per thousand 2005 USD) ................................................ 264 Table A.4 TPES/population by country (toe per capita) ................................................................... 265 Table A.5 Electricity consumption by country (Mtoe) ..................................................................... 266
LIST OF BOXES Box ES.1 Definitions and approach taken ............................................................................................ 17 Box 1.1 Energy savings as avoided energy consumption .................................................................. 29 Box 1.2 The IEA 25 energy efficiency policy recommendations and progress in policy implementation .. 34 Box 1.3 The multiple benefits of energy efficiency ........................................................................... 38 Box 2.1 Methodological challenges ................................................................................................... 42 Box 2.2 The IEA Efficient World Scenario .......................................................................................... 48 Box 3.1 Methodology: how decomposition analysis is used to identify the role of efficiency ......... 63 Box 4.1 Intelligent efficiency.............................................................................................................. 86 Box 8.1 Importance of supply-side efficiency in managing coal demand ....................................... 118 Box 8.2 China’s pilot carbon emissions trading schemes ................................................................ 119 Box 9.1 EU legislation at work ......................................................................................................... 129 Box 20.1 Near-zero-energy schools in Kentucky ............................................................................... 250 Box 20.2 Is the end of US electricity demand growth at hand? ........................................................ 252
© O
EC
D/IE
A, 2
013

EXECUTIVE SUMMARY
16 ENERGY EFFICIENCY MARKET REPORT 2013
EXECUTIVE SUMMARY Energy efficiency: an important market that is gaining momentum Energy efficiency markets deliver goods and services that reduce the energy required to fuel our economies. The International Energy Agency (IEA) estimates that investment in key energy efficiency markets worldwide totalled up to USD 300 billion in 2011. This is a conservative estimate based on an assessment of direct and leveraged investment in identifiable energy efficiency initiatives by the public sector, multilateral finance institutions and major private institutions. Energy efficiency investment has already delivered significant reductions in energy demand. The IEA estimates that for 11 IEA member countries,1 investment in energy efficiency since 2005 has resulted in cumulative avoided energy consumption of 570 million tonnes of oil-equivalent (Mtoe) over the five years to 2010. Without these energy efficiency measures, 5% more energy would have been consumed by the 11 countries over that period. This amount of avoided energy is greater than oil used in the United States’ transport sector in 2010 (554 Mtoe). In monetary terms, 570 Mtoe of crude oil would be valued at USD 420 billion at a price of USD 100 per barrel. Despite these measures being taken only relatively recently, they have already had a significant impact on total final consumption. The emerging energy efficiency market In 2011, total investment in energy efficiency was similar in magnitude to supply-side investment in renewable or fossil fuel electricity generation (Figure ES.1). However, investment in energy efficiency is still less than two-thirds of the level of fossil fuel subsidies. Investment in energy efficiency is distributed unevenly across countries and energy-consuming sectors (buildings, domestic appliances, transport and industry). The estimate provided is considered conservative because, first, limited information on private sector investment means it relies primarily on public-sector investment information, and second, the energy efficiency components of investment are frequently not discernable from business-as-usual infrastructure and consumer investment. The energy efficiency market is increasingly delivering outcomes that can help address important public policy challenges. Energy efficiency investments can produce multiple benefits by reducing or limiting the demand for energy. This includes reducing both domestic and international pressures on energy supply systems, thereby increasing system resilience and improving security. It can also produce positive economic outcomes, such as allowing spending on energy to be redirected towards other economic sectors, and by reducing public expenditures. Energy efficiency investments can also result in improved health and well-being, and avoided emissions of greenhouse gases and other pollutants. Energy efficiency has a role as an important domestically produced energy resource – it can improve the trading position of countries by reducing the need for fuel imports, or freeing up other domestic energy reserves for export. Governments will need to understand the dynamics that stimulate energy efficiency activity if they are to successfully fulfil the parallel objectives of maintaining a high level of energy services, fuelling economic growth, keeping energy affordable and reducing carbon dioxide emissions.
1 Those for which sufficient data is available to undertake such analysis: Australia, Denmark, Finland, France, Germany, Italy, Japan, the Netherlands, Sweden, the United Kingdom and the United States.
© O
EC
D/IE
A, 2
013
Raúl Talán
Resaltado
Raúl Talán
Nota adhesiva
El Gasto en subsidio a combustibles es a fondo perdido. El gasto a eficiencia energética es una inversión. Hay que medir en gasto en subsidios de energía de México.
Raúl Talán
Resaltado
Raúl Talán
Resaltado
Raúl Talán
Resaltado
Raúl Talán
Resaltado
Raúl Talán
Resaltado

EXECUTIVE SUMMARY
ENERGY EFFICIENCY MARKET REPORT 2013 17
Figure ES.1 Global levels of investment and subsidy in selected areas of the energy system, 2011
* Estimated range of USD 147 billion to USD 300 billion.
Note: investment figures include public and private investment and do not exclude subsidies.
Sources: +IEA, 2012a; ++ BNEF, 2013; +++IEA, 2012b.
0
100
200
300
400
500
600
700
Upstream oil and gas+
Coal, oil and gas electricity generation++
Renewable electricity
generation+++
Energy efficiency*
Renewable energy
subsidies+
Fossil fuel subsidies+
USD
bill
ion
Box ES.1 Definitions and approach taken The market for energy efficiency is as diffuse as energy consumption patterns themselves. It is composed of many market actors who demand more efficient provision of energy services, and those that supply the necessary goods and know-how to deliver this greater efficiency. Consumers in this market include individuals, businesses and governments, and market activities cover all energy-consuming sectors of the economy.
Given the methodological and practical challenges associated with defining such a diffuse and diverse market and the “first-time” nature of this analysis, this report draws on three principal metrics to define and measure the energy efficiency market:
• Investments in energy efficiency: in general this encompasses direct public expenditure; investments by private actors, frequently stimulated through government policies and programmes; investment funded by commercial and multilateral development banks; investment by manufacturers; and consumer spending.
• The avoided demand for energy, or energy savings, delivered as a result of these investments: generally measured in the units of energy avoided, such as million tonnes of oil equivalent (Mtoe), megawatt hour (MWh) or tonnes of oil.
• The monetary value of these savings: generally measured in terms of the monetary value of the avoided energy.
Accurate data and information for each metric are not always available or sufficiently comprehensive. Future reports will hopefully benefit from greater data availability, which will require a step-change in reporting.
This report does not develop a single recommended methodology, but uses these three metrics to define and measure the energy efficiency market. These metrics, which are used as available rather than comprehensively due to data challenges, provide the basis for describing and framing energy efficiency market activity throughout the report.
© O
EC
D/IE
A, 2
013
Raúl Talán
Resaltado
Raúl Talán
Resaltado
Raúl Talán
Resaltado
Raúl Talán
Resaltado

EXECUTIVE SUMMARY
18 ENERGY EFFICIENCY MARKET REPORT 2013
This inaugural Energy Efficiency Market Report focuses on identifiable demand-side investments and market outcomes from avoided energy consumption. The global market for energy efficiency that this report seeks to analyse is diverse and diffuse, making it challenging to define and measure (see Box ES.1). A chapter on energy efficiency indicators demonstrates changes in energy use that result from energy efficiency. The report also provides an overview of relevant global energy trends and different approaches to quantifying the size of the energy efficiency market. It spotlights the appliance and information and communication technology (ICT) sub-markets. The ICT sector is expected to account for over 14% of global electricity consumption by 2020, and while appliances have become significantly more efficient over the past decade, new challenges and opportunities are emerging in this sector. In addition, 15 country and regional case studies, drawn from all continents and including both IEA member countries and non-IEA countries, demonstrate the variety of ways in which energy efficiency markets operate worldwide. The mix of case studies illustrates the various approaches and policies that drive energy efficiency markets, and their differing impacts. From “hidden fuel” to “first fuel”? The energy savings from efficiency measures taken over the longer term exceed the output from any other single fuel source in a subset of 11 IEA member countries. Energy efficiency investments made since 1974 have had a major cumulative impact on annual energy use, resulting in avoided energy consumption of 63 exajoules (EJ) (1.52 billion tonnes of oil-equivalent) in these 11 IEA member countries in 2010 (Figure ES.2). This amount was larger than the consumption of oil (43 EJ), electricity or natural gas (22 EJ each) in these countries in 2010 alone. This reflects an increase in energy efficiency investments over several decades, and the continued delivery of energy savings from these investments, net of any rebound effect. The size and duration of energy savings are affected by various factors, including the lifetime of the investment, and the extent to which disposable income generated from avoided energy consumption is spent on additional energy services (the rebound effect).
Figure ES.2 The “first fuel”: avoided energy use from energy efficiency in 11 IEA member countries
Notes: TFC = total final consumption. The 11 countries are Australia, Denmark, Finland, France, Germany, Italy, Japan, the Netherlands, Sweden, the United Kingdom and the United States, those for which sufficient data is available to undertake analysis. “Other” includes biofuels plus heat from geothermal, solar, co-generation and district heating. Co-generation refers to the combined production of heat and power.
Source: IEA indicators database.
0
500
1 000
1 500
2 000
2 500
3 000
3 500
4 000
0
20
40
60
80
100
120
140
160
180
Mto
eEJ
Coal Oil GasElectricity Other Avoided energy useTFC
TFC
Hypothetical energy use had there been no energy efficiency
improvements Avoided energy equal to 65% of 2010 TFC
© O
EC
D/IE
A, 2
013
EXECUTIVE SUMMARY
ENERGY EFFICIENCY MARKET REPORT 2013 19
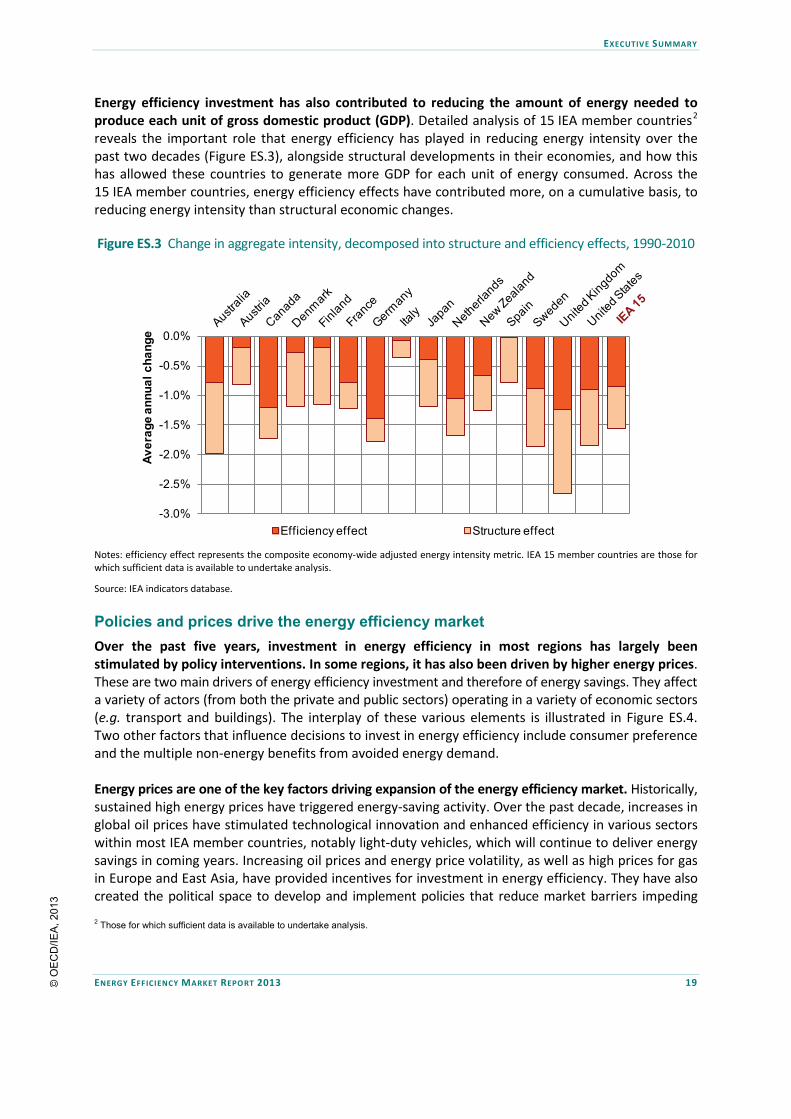
Energy efficiency investment has also contributed to reducing the amount of energy needed to produce each unit of gross domestic product (GDP). Detailed analysis of 15 IEA member countries2 reveals the important role that energy efficiency has played in reducing energy intensity over the past two decades (Figure ES.3), alongside structural developments in their economies, and how this has allowed these countries to generate more GDP for each unit of energy consumed. Across the 15 IEA member countries, energy efficiency effects have contributed more, on a cumulative basis, to reducing energy intensity than structural economic changes.
Figure ES.3 Change in aggregate intensity, decomposed into structure and efficiency effects, 1990-2010
Notes: efficiency effect represents the composite economy-wide adjusted energy intensity metric. IEA 15 member countries are those for which sufficient data is available to undertake analysis.
Source: IEA indicators database.
Policies and prices drive the energy efficiency market Over the past five years, investment in energy efficiency in most regions has largely been stimulated by policy interventions. In some regions, it has also been driven by higher energy prices. These are two main drivers of energy efficiency investment and therefore of energy savings. They affect a variety of actors (from both the private and public sectors) operating in a variety of economic sectors (e.g. transport and buildings). The interplay of these various elements is illustrated in Figure ES.4. Two other factors that influence decisions to invest in energy efficiency include consumer preference and the multiple non-energy benefits from avoided energy demand. Energy prices are one of the key factors driving expansion of the energy efficiency market. Historically, sustained high energy prices have triggered energy-saving activity. Over the past decade, increases in global oil prices have stimulated technological innovation and enhanced efficiency in various sectors within most IEA member countries, notably light-duty vehicles, which will continue to deliver energy savings in coming years. Increasing oil prices and energy price volatility, as well as high prices for gas in Europe and East Asia, have provided incentives for investment in energy efficiency. They have also created the political space to develop and implement policies that reduce market barriers impeding 2 Those for which sufficient data is available to undertake analysis.
-3.0%
-2.5%
-2.0%
-1.5%
-1.0%
-0.5%
0.0%
Aver
age
annu
al c
hang
e
Efficiency effect Structure effect
© O
EC
D/IE
A, 2
013

EXECUTIVE SUMMARY
20 ENERGY EFFICIENCY MARKET REPORT 2013
energy efficiency investments. Energy prices and the presence (or absence) of transparent and dynamic price signals can facilitate or hinder investment in energy efficiency. For example, fossil fuel subsidies distort price signals, lowering the demand for energy efficiency by artificially reducing the price consumers pay for energy. However, other barriers to energy efficiency mean that transparent pricing alone does not directly lead to an optimal level of energy efficiency investment.
Figure ES.4 The market for energy efficiency
Note: ESCO = energy service company.
Policy is the other key stimulus for the energy efficiency market, commonly used by governments to overcome barriers and market failures that undermine the effect of price signals. These barriers and market failures include high transaction costs, information failure, and lack of technical or institutional capacity, all of which dilute the effect of price signals on the demand for energy services and the corresponding demand for energy savings. As a consequence, policy interventions have been essential to stimulating the demand for energy efficiency and by extension for the energy efficiency market. Policy approaches vary, reflecting different drivers within countries and across regions and different economic and energy contexts, such as concerns over energy imports and climate change in the European Union, and the Southeast Asia region’s focus on energy security and economic development. Energy efficiency markets are diverse and growing Energy efficiency activities in different countries illustrate the development of this market worldwide. The country case studies in this report paint a picture of a market that is diverse and ready to grow in the medium term. The market has distinctive characteristics related to country-specific socio-economic conditions and resource endowments. Despite the various differences between countries, including in their policy approaches, a number of common themes emerge across the 15 countries and regions analysed. A successful mix of information provision and regulation has played a leading role in stimulating the energy efficiency market. Measures developed include: standards and labelling for a range of
Macro-economy
Government/society
Financing
Market actors
Supply of efficiency measures
Demand for energy efficiency
Market assetsAppliances
Service contracts SoftwareBuildingsVehicles
Equipment
Energy prices, economic growth, population change
• Equipment manufacturers• Research and development• Utilities and ESCOs• Construction industry• Financial institutions
Commercial sector •Industry •
Households/consumers •Public sector •
Financial institutions •
Policies and consumer preferencesPolicies and technological change
Investment in production and producers of efficient goods and
services $
$
$
Procurement of efficient goods and services $
$
$
© O
EC
D/IE
A, 2
013

EXECUTIVE SUMMARY
ENERGY EFFICIENCY MARKET REPORT 2013 21
energy-using products (including light-duty vehicles, new buildings, appliances, lighting and other equipment used in the commercial and industrial sectors); providing access to energy assessments and to preferential financing; and energy efficiency obligations placed on energy suppliers. Assessments of these programmes show that most have had a positive impact on the size of national energy efficiency markets. The great potential for energy performance improvements in buildings has generated significant investment in many countries. In Germany, the government development bank KfW provided USD 12.7 billion in loans for energy efficiency investments in the residential buildings sector in 2012, and it estimates that this stimulated USD 35 billion in home efficiency refurbishments. New Zealand’s home insulation programme has invested USD 243 million over the last four years, evaluated as delivering benefits five times the value of this investment. French public spending on energy efficiency in the residential sector stood at USD 473 million in 2011, and total spending associated with its “white certificate” scheme could trigger private spending 20 times this figure based on previous years’ performance. In Mexico, the Green Mortgage Programme mobilised nearly USD 1 billion in public subsidies and nearly USD 500 million in additional lending by mortgage providers to over three million householders between 2009 and 2012. Utility and energy service company (ESCO) schemes have also driven growth in energy efficiency markets, especially among large energy users. In the United States, for example, levels of spending on ratepayer-funded efficiency programmes have grown from USD 1 billion in 2000 to USD 7 billion in 2011, an average annual growth rate of 20%. Annual turnover for Korean ESCOs reached USD 330 million in 2011, an increase of 63% compared to 2010. ESCO activity in Korea avoided the consumption of energy equal to 1.3 Mtoe in 2011. ESCOs are now active in close to 50 countries globally. Energy efficiency investments are also being actively promoted in the industrial sector, although they can be more difficult to identify; efficiency is often one feature of a broader investment with multiple objectives, and financial flows towards efficiency projects are difficult to single out. Promotion of energy efficiency through information and voluntary programmes, including public-private sector co-operation, has yielded energy savings without the need for significant public capital. In Australia, government assistance with identifying highly cost-effective energy savings opportunities led industry to make net annualised financial savings of USD 283 million in 2010/11, based on investments made from 2006 onwards. The voluntary Canadian Industry Program for Energy Conservation supports process integration studies in industrial facilities, which led to annual energy savings worth USD 54 million in 2012. In emerging economies, the drivers for energy efficiency investment are more closely related to economic development, energy security and reliability of supply. The emerging economies examined in this report all anticipate increasing energy consumption in the medium term, in many cases coupled with energy supply constraints and/or burgeoning energy import costs. As such, limiting the demand for energy, especially imported sources of energy, is an important tool for meeting growing demand for energy services while limiting public expenditure and meeting environmental objectives. As an example, China’s 11th Five-Year Plan raised the importance of energy efficiency as a tool to support the country’s social and economic development, leading to a reduction in energy intensity of over 19%. It also stimulated rapid growth in local energy efficiency services markets. For example, the Chinese market for energy performance contracts grew to USD 1.46 billion in the four years to 2008;
© O
EC
D/IE
A, 2
013

EXECUTIVE SUMMARY
22 ENERGY EFFICIENCY MARKET REPORT 2013
the market value of ESCOs increased from USD 694 000 in 2005 to USD 12 billion by 2010; and the International Finance Corporation estimates that technically and economically feasible projects represent a potential ESCO market in excess of USD 100 billion. A spotlight on appliance technologies and the potential of the ICT sector The ICT sector presents both important opportunities and challenges for energy efficiency. Networked products provide a good example. The rapid introduction of networked products and services, such as “smart” appliances, will enable a wide range of innovative energy management systems to proliferate and improve efficiency through greater consumer control and price-responsiveness. However, uptake of networked products and services is also driving up aggregate energy demand and the opportunity for these products to power down to energy-saving modes is limited by their constant connection to the network. The amount of excess energy used due to the inability of network equipment to go into a standby mode could reach 550 terawatt hours (TWh) as early as 2020, greater than the annual consumption of electricity in Canada. There also remains room to improve the energy efficiency of products in the “traditional” appliance market. For example, raising the efficiency of products sold in some of the world’s major markets3 to global best levels, and using other policy levers to sustain improvements, could reduce electricity demand by 1 800 TWh in 2030 (about two-thirds of 2010 electricity consumption in the European Union). Medium-term prospects Energy efficiency markets are expected to grow in all the regions examined in this report, principally driven by price and policy. Much of that growth is anticipated to come from private investment enabled by government policy rather than direct public investment. Examples from the cases considered in this report illustrate the extent of growth prospects: • The new Canadian National Energy Code is expected to save USD 350 million in 2020. • The French government is considering a nearly threefold increase in the target for the Certificats
d’économie d’énergie obligation scheme to 600 TWh, stimulating energy efficiency investments in the building and transport sectors.
• Germany’s 2010 Energy Concept could avoid USD 42 billion in energy costs in 2020. A 2% renovation rate requirement for buildings will deliver more and deeper energy-efficient retrofits, and provides certainty for market investors.
• The market for fuel-efficient vehicles is accelerating rapidly in South Korea, with a requirement that suppliers shift from 30% to 100% compliance with a fuel efficiency standard of 17 kilometres per litre of fuel by 2015.
• Standards entering into force for a range of appliances in the United States will lead to over 80 TWh of annual electricity savings by 2020. The ESCO industry and low-income weatherisation industry will face challenges as federal recovery funding ends, but ESCO revenues are nonetheless projected to double to USD 13 billion by 2020.
• From 2014, energy suppliers in EU member states will be required to achieve annual energy savings equivalent to 1.5% of their energy sales volume through to 2020. This is expected to lead to expanded energy efficiency investment across the EU.
3 Super-efficient Equipment and Appliance Deployment (SEAD) Initiative members: Australia, Brazil, Canada, the European Commission, France, Germany, India, Japan, Korea, Mexico, Russia, South Africa, Sweden, the United Arab Emirates, the United Kingdom and the United States.
© O
EC
D/IE
A, 2
013
EXECUTIVE SUMMARY
ENERGY EFFICIENCY MARKET REPORT 2013 23
• China’s 12th Five-Year Plan envisages a 17% improvement in energy intensity, continuing the trend towards meeting the world average.
• The UK government has developed polices to stimulate energy efficiency investments by households and businesses, which are expected to save 14.4 Mtoe of final energy consumption annually by 2020. The capital cost of the technical potential for energy efficiency in the residential buildings is estimated at USD 90 billion, of which USD 3.5 billion are low-cost measures.
• The Japanese Top Runner programme, expected to deliver over USD 3 billion in consumer benefits through efficiency targets for lighting, vehicles and appliances, will broaden its scope to cover three-phase induction motors, LEDs, heat pumps and printers in 2015.
The energy efficiency market still holds significant untapped potential to deliver energy savings. The Efficient World Scenario of the IEA World Energy Outlook 2012 estimates that by implementing cost-effective energy efficiency measures and removing market barriers, total primary energy supply could be reduced by an additional 900 Mtoe in 2020 beyond those reductions generated from current and announced policy interventions. This additional 900 Mtoe in avoided energy is equivalent to 7% of 2010 global consumption, greater than the combined energy supply of Australia, Japan, Korea and New Zealand today, and would produce a corresponding reduction of USD 458 billion in consumer energy expenditure. Improved metrics and data are essential to catalyse energy efficiency market activity To ensure that prices and policies create a level playing field for energy efficiency markets, stakeholders must address the urgent need for better data to support stronger systems of measurement. The energy efficiency market is growing in stature and maturity, but it is developing more rapidly than the ability to properly evaluate and understand it. A particular priority is to improve our capability to measure the size, nature and impact of energy efficiency markets and the outcomes from investments made in them. Further attention is especially warranted in the following areas: how to identify and measure the investments made in energy efficiency; assessing the magnitude of the resultant avoided energy and its monetary value; identifying and evaluating the related social, economic and environmental outcomes; understanding the impacts of energy prices on energy efficiency investments and vice versa; and measuring the impacts of government policies. Improved data and metrics will help policy makers and other decision makers more predictably assess the costs and benefits of energy efficiency investments, and their value relative to other energy sources. References BNEF (Bloomberg New Energy Finance) (2013), Global Trends in Renewable Energy Investment 2013, Bloomberg New Energy Finance data pack for the Frankfurt School – United Nations Environment Programme Collaborating Centre for Climate and Sustainable Energy Finance, Frankfurt. IEA (International Energy Agency) (2012a), World Energy Outlook 2012, OECD/IEA, Paris. IEA (2012b), Renewable Energy Medium-Term Market Report, OECD/IEA, Paris.
© O
EC
D/IE
A, 2
013

INTRODUCTION
24 ENERGY EFFICIENCY MARKET REPORT 2013
INTRODUCTION The purpose of the market report Each year the International Energy Agency (IEA) assesses market developments and forecasts market trends over the medium term for the principal global energy sources. These medium-term market reports are highly valued by governments and the private sector alike. The increasing importance of energy efficiency for governments and investors has led to this IEA analysis of energy efficiency markets and prospects, which complements the equivalent reports for oil, gas, coal and renewable energy.1 This first Energy Efficiency Market Report provides evidence that investments in energy efficiency can deliver energy resources equivalent to investment in energy supply, with additional economic and environmental returns to investment that include avoided energy production and import costs, more control over energy bills, reduced greenhouse gas (GHG) emissions and others besides. Examples from countries around the world support the view that energy efficiency is a resource that reduces the amount of energy required to deliver a given amount of energy services. This report shows that well-developed energy efficiency markets exist across major regions of the world, and are forecast to grow in part due to supportive government policies and energy prices that are high or unpredictable in many regions. This report is a first step toward describing the global energy efficiency market in the investment terms that are needed to unlock the potential of energy efficiency as a resource. There are a number of reasons why this presents a challenge for analysis. It is not immediately obvious how to measure the size of the market for energy efficiency; is it the sum total of the investments in efficient goods and services, the energy savings that accrue from these investments, the monetary value of these savings, or all three of these? In addition, investments in energy efficiency are unlike investments in other energy markets. The market for energy efficiency covers an extremely diverse set of sectors and types of investment, and a great diversity of consumers and producers, often dealing with relatively small transactions. Cost-effective energy efficiency investments are typically confronted by non-economic market barriers (Ryan et al., 2011). In addition, such investments may be perceived as more risky than investments in other types of energy projects (De’Tserclaes, 2010). At the same time, energy efficiency is taking on increased strategic importance and visibility, stemming in part from efforts to support global economic growth while limiting GHG emissions and managing national energy resources. Measuring progress in overcoming investment barriers, and relating government energy efficiency policies to their market outcomes, are important reasons for estimating, analysing and reporting on the energy efficiency market. Approach taken A comprehensive overview of the global market – or even regional markets – for energy efficiency is complicated by the challenges associated with quantifying the level of investment in energy efficiency measures and the value of resultant energy savings. It is further held back by the paucity of comparable reported data. Given the various methodological and practical challenges associated with both defining and measuring the market for energy efficiency, this first Energy Efficiency Market Report takes a modest and practical approach. It focuses on five elements: a conceptual basis for understanding energy efficiency market activities; a review of the methodological and practical challenges associated 1 See www.iea.org/publications/medium-termreports for more information on the other annual IEA market reports.
© O
EC
D/IE
A, 2
013
INTRODUCTION
ENERGY EFFICIENCY MARKET REPORT 2013 25
with measuring the market and its components; statistical analysis of energy efficiency and its impact on energy demand; a spotlight on a technology sector in which there is significant energy efficiency market activity; and a selection of country case studies that illustrate current energy efficiency markets in specific sectors, and how they may evolve in the medium term. In order to understand and measure the energy efficiency market, three principal metrics are identified: • investments in energy efficiency; • the energy consumption avoided as a result of these investments; and • the monetary value of these energy savings. Accurate data and information for each metric is currently insufficient or unavailable. Ideally, the scope of each metric would be specified to allow consistent monitoring and measurement of investments and outcomes. This report does not develop a single recommended methodology, but introduces a way to frame and understand the energy efficiency market in terms of the three metrics. How to read this report The individual sections of this report provide the reader with several distinct elements that can be read in different ways. Chapter 1 of the report, Understanding the Market for Energy Efficiency, defines the energy efficiency market and the driving forces behind supply and demand. It explains the sectoral nature of energy efficiency and the characteristics of the different sectors. Chapter 2, Measuring the Market for Energy Efficiency, discusses the methodological and practical challenges presented to the analyst. This includes an overview of the different ways in which the size of the energy efficiency market has previously been estimated at national, regional and global levels. This chapter, which explains the differences between the definitions and methods used in these estimates, describes the analytical frameworks that underpin much of the rest of the report. It does not, however, adopt or recommend any specific approaches to addressing the various methodological and practical challenges presented. The third chapter of the report, What the Numbers Say, presents statistical analyses of how energy efficiency investments are changing energy use in different countries and sectors. In this section, high-level global trends are unpacked using decomposition analysis to reveal the extent to which changes are related to energy efficiency improvements compared to other macroeconomic, demographic and structural factors. From an energy policy perspective, understanding these complex relationships is key. Metrics that are often used as proxies for energy efficiency, such as energy intensity (energy use per unit of economic production), are easily accessible and presented in this chapter at a global level, but their inadequacy for accurately describing energy efficiency is highlighted. Better indicators, such as decomposition analyses, require more detailed data, however, and trends are only presented for subsets of IEA member countries as a result. Readers looking for information on policy activity that shapes and impacts energy efficiency markets should refer to the Technology Focus and Energy Efficiency Market Compendium. Chapter 4, Technology Focus, looks at the growing electronic equipment market, examining household appliances and information and communication technologies (ICTs) in particular. For appliances, it provides an overview of the size of the markets, and how they have been shaped by energy efficiency regulations
© O
EC
D/IE
A, 2
013

INTRODUCTION
26 ENERGY EFFICIENCY MARKET REPORT 2013
such as standards and labelling programmes. The ICT sector is then discussed in terms of the opportunity presented by these technologies for reducing the electricity consumption of appliances, but also the challenge associated with limiting their energy use, especially in relation to the growing market for networked appliances and equipment. The substantive description of policies and markets is found in the Energy Efficiency Market Compendium. This presents a selection of country case studies that illustrate important policies and report on their implementation and impact over the past five years, as well as a qualitative assessment of the challenges and market outlook for the period to 2020. Each case study lays the context in terms of the country’s energy demand profile and the high-level drivers for energy efficiency investments. The three main market metrics (investments, avoided energy, and the monetary value of avoided energy) have been used across the countries and regions in accordance with the available data. These metrics provide a basis for describing and framing the market activity as outcomes of investment; outcomes that are often, but not always, stimulated by government policies. The focus is on demand-side interventions, but supply-side activities are also described in several cases, notably in non-OECD countries where they are particularly important. It should be noted that information on investments and outcomes is not comparable across the countries and regions assessed due to differences in data sources and data completeness. Furthermore, the country case studies are not designed to assess the adequacy of government policies, nor make policy recommendations. All chapters can be read individually, though there are complementarities between them. For example, the frameworks described in Understanding the Market for Energy Efficiency and Measuring the Market for Energy Efficiency will help readers understand the scope of the country case studies. In addition, for most IEA member countries included in the case studies, more detailed disaggregation of energy use and the role of energy efficiency is included in What the Numbers Say. This first Energy Efficiency Market Report summarises in one place the trends and prospects for investment and energy cost savings in the medium term, up to 2020. While not exhaustive, its analysis of developments, policies, barriers and opportunities provides a valuable overview of the state of the market today, defines an initial baseline, and encourages governments and other stakeholders to analyse how prices and policies can motivate market investments with sustainable outcomes. References De T’Serclaes, P. (2010), Money Matters: Mitigating Risk to Spark Private Investments in Energy Efficiency, IEA Information Paper, Energy Efficiency Series, OECD/IEA, Paris. Ryan, L., et al. (2011), Energy Efficiency Policy and Carbon Pricing, IEA Information Paper, Energy Efficiency Series, OECD/IEA, Paris.
© O
EC
D/IE
A, 2
013

PART 1 THE MARKET FOR
ENERGY EFFICIENCY
© O
EC
D/IE
A, 2
013

UNDERSTANDING THE MARKET FOR ENERGY EFFICIENCY
28 ENERGY EFFICIENCY MARKET REPORT 2013
1. UNDERSTANDING THE MARKET FOR ENERGY EFFICIENCY Defining the energy efficiency market The energy efficiency market is more diffuse and localised compared with those of traditional oil, gas and other supply-side resources; there is also far less data reported or available. The metrics used to describe traditional supply-side energy markets are well known. Other IEA medium-term market reports, for example, document extraction rates, stocks, traded volumes, consumption and prices, along with industry projections of expected future supply and demand impacts. While there are parallels between energy efficiency and these other energy markets, it is much more difficult to directly measure equivalent markets for energy efficiency. As with other energy resources, energy efficiency activity takes place as part of a market – where forces of demand and supply operate, buyers and sellers interact, and transactions occur. In its most basic form, investments are made in energy efficiency that lead to avoided energy consumption (for demand-side interventions such as improved vehicle efficiency) or avoided energy losses (for supply-side interventions such as improvements to the efficiency of electricity distribution). Delivering the same level of energy services (lighting, heating, transport etc.) while using less energy has a value related to the cost of the energy saved.
Figure 1.1 The market for energy efficiency
Note: ESCO = energy service company.
The dynamics of supply and demand The market for energy efficiency is as diffuse as energy consumption patterns themselves. It is composed of many market actors who demand more efficient provision of energy services, and those that supply the necessary goods and know-how. Describing the energy efficiency market in terms of
Macro-economy
Government/society
Financing
Market actors
Supply of efficiency measures
Demand for energy efficiency
Market assetsAppliances
Service contracts SoftwareBuildingsVehicles
Equipment
Energy prices, economic growth, population change
• Equipment manufacturers• Research and development• Utilities and ESCOs• Construction industry• Financial institutions
Commercial sector •Industry •
Households/consumers •Public sector •
Financial institutions •
Policies and consumer preferencesPolicies and technological change
Investment in production and producers of efficient goods and
services $
$
$
Procurement of efficient goods and services $
$
$
© O
EC
D/IE
A, 2
013

UNDERSTANDING THE MARKET FOR ENERGY EFFICIENCY
ENERGY EFFICIENCY MARKET REPORT 2013 29
the drivers of supply and demand helps to reveal the key factors, including policy interventions, that shape the market and show how their interactions deliver investments and outcomes.
A diverse set of market actors The actors and dynamics driving the energy efficiency market are numerous and diverse (Figure 1.1). Production and consumption decisions, as in other markets, occur within a particular economic and socio-political context. In the case of the energy efficiency market, the broader economic environment is particularly sensitive to energy prices. In addition to energy prices, government policy plays an especially critical role. The ways in which policies affect the decision-making processes of a variety of private and public sector investors are complex and require careful understanding. The energy efficiency market is also characterised by a range of market agents acting in a variety of economic sub-sectors (both as direct producers and consumers). This report focuses on investments in energy efficiency (the monetary flows in Figure 1.1), and on market outputs (the market assets created by interaction of supply and demand) and outcomes (the avoided energy consumption and its associated value).
Supply of energy efficiency The cost-effective supply of energy efficiency can be defined as the investment opportunities for which the sum of the benefits, stemming from avoided energy consumption, outweighs the investment costs. Throughout this report, the energy that is not consumed as a result of energy efficiency measures, whether it is a barrel of oil, cubic metre of gas, tonne of coal or terawatt hour of electricity, is described in terms of the physical energy quantities avoided. This important notion of how energy efficiency can directly substitute, and be equated with, supply-side commodities is central to conceptualising the supply of energy efficiency and is discussed further in Box 1.1. Energy efficiency is a domestically produced energy resource, for which the market is often local. Like other energy markets, its equipment and infrastructure may be imported, but avoiding ongoing fuel requirements can provide greater control over domestic energy supply.
Box 1.1 Energy savings as avoided energy consumption
Energy efficiency can be quantified as a resource that provides energy services while avoiding a portion of the energy that would otherwise have been consumed to deliver the same level of service. There are many ways to express energy quantities, and different metrics make sense in different contexts. For example, the electricity sector uses megawatt hours (MWh), whereas national energy statistics are often expressed in million tonnes of oil equivalent (Mtoe) or petajoules (PJ). These units can be used interchangeably. For illustrative purposes, four examples of energy efficiency measures are expressed below in terms of their avoided energy consumption (Table 1.1).
This report expresses reductions in energy demand as avoided tonnes of oil equivalent (potentially expressed as Av-toe), which can be used to analyse primary energy or final consumption and is consistent with other energy metrics as reported by the IEA. Avoided tonnes of oil equivalent can be converted into other metrics and vice versa. The international standard under development, “General calculation methods on energy efficiency and savings for countries, regions or cities” (ISO/TC 257/WG2), proposes to use megajoules (MJ), while others have proposed the Rosenfeld, a much larger unit based on the annual output from a 500 megawatt (MW) power plant (Koomey et al., 2010). When comparing final consumption (demand side) with primary energy (supply side), it is important to account for the energy losses associated with transformation of primary energy into electricity and other products, as well as their transmission.
© O
EC
D/IE
A, 2
013

UNDERSTANDING THE MARKET FOR ENERGY EFFICIENCY
30 ENERGY EFFICIENCY MARKET REPORT 2013
Cost curves, such as Figure 1.2, are one way to illustrate the different opportunities that comprise the supply of energy efficiency. Depending on the height of each column, these opportunities will be more or less economic at today’s market prices. The widths of the columns indicate the size of the opportunity for energy savings. Expressing the supply of energy efficiency in this way can usefully present the potential for avoided energy use in an economy, an exercise that has been undertaken in a number of countries. Table 1.2 shows a range of national assessments of potentials and illustrates the variety of approaches used. At an aggregate level, the sum of these opportunities at today’s price levels can be considered to be our “reserves” of avoided energy use. These reserves are analogous to the world’s stated reserves of
Box 1.1 Energy savings as avoided energy consumption (continued)
The difference between annual and cumulative avoided energy consumption is a further complicating factor when accounting for avoided energy demand. An upfront investment in an energy efficiency measure will go on to produce an annual quantity of avoided energy over the lifetime of the efficient good or service, e.g. building, appliance or vehicle. This is similar to investment in a power plant that generates electricity at a given annual rate over the course of its lifetime. Calculating cumulative avoided energy therefore requires understanding the lifetimes of the energy-efficient interventions or technologies, which vary widely from a few years to several decades.
Table 1.1 Metrics describing energy supply and consumption
Unit Example Annual energy consumption
Annual avoided energy
Tonnes of oil equivalent (toe): Energy content of a metric tonne of crude oil.
Average annual fuel consumption of a 2010 model LDV in the United States (27.5 mpg) 1.5 toe
0.4 toe Average annual fuel consumption of a 2016 model LDV in the United States (37.5 mpg) 1.1 toe
Thousands of cubic metres (tcm): Energy content of a thousand cubic metres of natural gas.
Annual consumption of a 300 square metre (m2) house compliant with 2006 IECC model
building code
1.2 tcm (1.1 toe)
0.4 toe Annual consumption of a 300 m2 home
compliance with 2012 IECC model building code 0.8 tcm (0.7 toe)
Kilowatt hour (kWh): Electricity produced by a 1 kW rated rooftop PV unit operating at maximum output for one hour.
Average annual electricity required for a household central air conditioner in 2005
2 880 kWh (248 toe)
76 toe Annual electricity required for a household central air conditioner with SEER of 13
(beginning 2006)
2 000 kWh (172 toe)
Joule (J): Energy required to raise 1 g of water by 1°C; this is the SI unit for energy.
Annual energy consumption of an integrated basic oxygen furnace steel mill with
US average efficiency*
160 PJ (3.8 Mtoe)
0.6 Mtoe Annual energy consumption of an integrated
basic oxygen furnace steel mill using best available technology
136 PJ (3.2 Mtoe)
* Steel mill with a capacity of 10 million tonnes per year operating at 80% load factor.
Note: IECC = International Energy Conservation Code; LDV = light-duty vehicle; SEER = seasonal energy efficiency ratio.
Source: unless otherwise indicated, all tables and figures in this section derive from IEA data and analysis.
© O
EC
D/IE
A, 2
013

UNDERSTANDING THE MARKET FOR ENERGY EFFICIENCY
ENERGY EFFICIENCY MARKET REPORT 2013 31
oil or of gas. Like fossil fuel reserves, they expand when the costs of producing a unit of avoided energy consumption diminish or the costs of other energy supply options increase. For example, if oil, coal or electricity prices rise in a given region, more of the global resources of avoided energy would be added to these “economic reserves”. Country-level analyses of technical or economic potential are often performed in response to a particular policy question, may look at a particular sector, and may assess economic impacts of the potential over different time frames. As a result these “economic reserves” of avoided energy cannot be consistently aggregated to develop international reserve estimates. Market actors on the supply side bring these reserves into the market to meet the demand for efficient goods and services. Energy efficiency suppliers are diverse and comprise providers of products and services that reduce the energy needed to provide a given energy service. They include ESCOs, vehicle, appliance and equipment manufacturers, gas and electricity distributors and retailers, construction and renovation contractors, and appliance and equipment resellers/retailers.
Table 1.2 Selected national studies of energy efficiency potential
Potential type* Avoided Energy Value Year** Current energy use/
supply*** European Union
Economic Primary 368 Mtoe**** EUR 193 billion 2020 1 654 Mtoe
Germany Final 155 TWh EUR 33 billion 2020 2 570 TWh France Final 63 Mtoe***** 2020 152 Mtoe Canada Economic Final 22 Mtoe USD 10.5 billion 2025 204 Mtoe
New Zealand Realisable Primary 2.8 Mtoe NZD 10 billion 2026 18.6 Mtoe
Italy Final and Primary 15.5 Mtoe (final) 20 Mtoe (primary) - 2020 126.7 Mtoe (final)
158.6 Mtoe (primary) Hungary Primary 236 PJ - 2030 984 PJ Finland Economic Final 43.8 TWh - 2020 293 TWh Sweden Economic Primary 22 TWh****** - 2020 124 TWh Spain Primary 0.133 Mtoe EUR 70 billion 2020 125 Mtoe Switzerland Final 77 TWh - 2050 226 TWh World Economic Primary 900 Mtoe - 2035 13 113 Mtoe
* Economic potential refers to avoided energy consumption from technically feasible measures that are considered cost-effective. Realisable refers to the economic potential with more conservative assumptions on rates of end-use technology uptake. Primary refers to primary energy supply, while final refers to final consumption.
** Refers to the year in which the potential could be realised.
*** Expressed in the same values as potentials, i.e. final or primary energy, in same units; for Sweden, covers final consumption in industrial sector only. Values are for 2012 for primary energy and 2011 for final energy for IEA member countries, and 2011 for the European Union 27 and Global (IEA statistics).
**** Cost-effective savings in 2020 compared to 2007 baseline scenario.
***** Excludes consideration of sectors covered by the EU emissions trading system.
****** Analysis undertaken for the industrial sector.
Note: TWh = terawatt hour.
Sources (in order of listing): EC, 2006, 2011, 2012; Dena, 2012; CESE, 2013; MEDDTL and MEFI, 2011; Marbek and Jaccard, 2006; Patterson, 2011; GoI, 2013; MND, 2012; GoF, 2011; Thollander et al., 2013; IDAE, 2011; BFE, 2012; IEA, 2012.
© O
EC
D/IE
A, 2
013

UNDERSTANDING THE MARKET FOR ENERGY EFFICIENCY
32 ENERGY EFFICIENCY MARKET REPORT 2013
Figure 1.2 Energy efficiency cost curve for the United States
* Average price of avoided energy consumption at the industrial price; USD 35.6/MBtu represents the highest regional electricity price used.
Note: Btu = British thermal unit; MMBtu = million British thermal units.
Source: McKinsey, 2009, from Unlocking Energy Efficiency in the U.S. Economy July 2009, McKinsey & Company, www.mckinsey.com/insights, reprinted with permission.
Demand for energy efficiency Demand for energy efficiency is driven primarily by four factors: • Price: energy prices clearly drive demand for more energy-efficient goods and services. However, market
response often lags energy price movements by a considerable amount. Industrial users of energy regularly act on the incentive to reduce operational costs by integrating efficient processes in response to high energy prices. For example, high fuel costs have driven innovation in the airline industry, and have resulted in profound changes in the fuel efficiency of automobile fleets in different regions.
• Policy: government policies can further stimulate demand, and are themselves driven by various considerations, such as reducing imports, improving balance of trade and meeting energy security objectives. Policies are particularly relevant when price signals are ineffective. These policies can include regulation (e.g. minimum energy performance standards), economic instruments (such as taxes or incentives) that adjust the relative cost of efficient options compared with less efficient ones, direct investment through procurement or energy efficiency research and development (R&D), and provision of information.
• Consumer preference: beyond considering energy costs, consumers also act in accordance with personal preferences surrounding energy use, and purchase decisions may be based on social, environmental or utility factors. Some consumers have a preference for greater control over their resource consumption or for being early adopters of technology. The market is also driven by consumers seeking more energy services from a limited level of energy supply. These include, for
8 0007 5007 0006 500 0 1 5001 000 6 0005 000500 4 5004 0003 5003 0002 5002 000
8
6
4
24
22
20
2
18
16
5 500
14
12
10
09 5009 0008 500
ResidentialCommercial Industrial
Computers
Non-PC office equipment efficiencies
Electronic devicesCement processesCommunity infrastructure
improvementsElectric motors
Energy management for support systems
Cooling efficiencies
Refrigerators
Non-commercial electrical devices
Chemical processes
Energy management for non-energy-intensive processes
Energy management for energy-intensive processes
Waste heat recovery efficiencies
New building shell improvements
Pulp and paper processes
Energy management for waste heat recovery
Lighting efficiencies
Programmable thermostats
Cooking efficien-cies
Non-energy-intensive processes large enterprises
Basement insulationDuct sealing
Insulation
Non-energy-intensive processes small enterprises Air sealing
Sheath improvements
Refrigeration improvementsBoiler pipe insulation
Lighting efficienciesVentilation improvements
DishwashersCooling efficiencies
Wall insulationHeat efficiencies
Slab insulation
Water heaters*
Non-energy-intensive processes medium enterprises
Steam systemsAttic insulation
Iron and steel processes
Clothes washers
Building utilities
Heating efficienciesRetrocommissioning
Water heatersWindow improvements
Freezers*
Average cost forend-use energy savings(USD per MMBtu)
Potential(trillion
Btu)
13.80*
© O
EC
D/IE
A, 2
013

UNDERSTANDING THE MARKET FOR ENERGY EFFICIENCY
ENERGY EFFICIENCY MARKET REPORT 2013 33
example, those who operate battery-powered devices for whom efficiency can provide longer service from each battery charge, as well as those for whom energy access is limited.
• Multiple benefits: goods and services that reduce energy consumption may also provide the consumer with non-energy benefits that greatly exceed the value of the energy avoided. Improved health and well-being are notable examples of collateral benefits from investment in building insulation. These additional benefits create further demand for energy-efficient goods and services by altering the way in which the returns on investment are valued.
Barriers to demand The energy efficiency supply/demand relationship is characterised by numerous behavioural and market failures that are recognised as deterring demand and, by extension, investment. Even in cases where the financial benefits of an efficiency measure are clear, consumers often do not select it. One reason why consumers may not undertake cost-effective efficiency measures relates to behavioural preferences, such as avoiding the perceived inconvenience of, for example, building renovations. Market failures tend to attenuate energy price signals and can act to increase the perceived cost and risk of energy-efficient technology, hindering the full potential of cost-effective energy efficiency improvements.
Four market failures have been widely identified in the literature (Ryan et al., 2011): • Imperfect information: consumers may undervalue energy efficiency because they do not understand
the opportunity presented. Accurate and sufficient information on energy performance can be difficult to obtain easily and at low cost, particularly since energy efficiency comprises a wide range of products and services whose features are not easy for consumers to identify or separate from other attributes. Thus, the market does not always produce or transmit sufficient information to allow for optimal energy efficiency investment decisions.
• Asymmetric information: information failure occurs where the parties to a transaction have access to different levels of information on the subject of the transaction. For example, a manufacturer may know more about the actual energy performance of a product than the purchaser, and energy suppliers may hold information on future energy supply risks or costs unknown to consumers.
• Principal/agent problem: market failure encompassing split incentives and asymmetric information can occur in a situation where one party (the principal) delegates work, for example provision of a good or service, to another (the agent) who performs that work. Landlord (the agent) and tenant (the principal) relationships are a good illustration of this problem, as they have misaligned responsibility for energy consumption and authority to invest in energy-efficient improvements. Principal/agent problems also often occur within firms due to organisational arrangements, which can, for example, maintain separate budgets for operational energy costs and capital investment in energy-using equipment.
• Externalities: negative externalities associated with the generation and use of energy, for example excessive GHG emissions and their impacts, impose a cost on society and decrease social welfare. When these costs are not borne by those who produce and consume energy, the result will be higher energy use and less energy efficiency than is socially desirable. Since energy efficiency choices often involve decisions that trade off initial capital expenditure against uncertain future energy cost savings, the expected energy price has a significant influence on the outcome of the investment analysis.
Policy and price drivers Policy and price are two important drivers for creating the market signals that influence demand for energy savings and therefore investments in energy efficiency measures. Energy prices and costs of equipments and services are essential factors in determining cost-effective energy efficiency interventions. The precise relationship between energy prices and energy efficiency outcomes is not straightforward,
© O
EC
D/IE
A, 2
013

UNDERSTANDING THE MARKET FOR ENERGY EFFICIENCY
34 ENERGY EFFICIENCY MARKET REPORT 2013
however, and involves significant behavioural aspects and time lags in terms of turnover of energy-consuming equipment in the economy. As a result, government policies are more frequently analysed in terms of their impact on energy use and efficiency. Government policies can influence prices, but, importantly, they can also create demand through awareness programmes and regulation. A leading role for policy
Policy interventions can address market failures and technical barriers, along with behavioural and organisational barriers that may reinforce existing market failures (Ryan et al., 2011). They can focus on specific barriers in specific sectors or act across the economy and can be divided into three broad categories: regulation, provision of information, and economic instruments. They often need to be combined to overcome the particular barriers facing energy efficiency.
Box 1.2 The IEA 25 energy efficiency policy recommendations and progress in policy implementation
The IEA 25 energy efficiency policy recommendations (EEPR) comprise a suite of cost-effective priority energy efficiency policies across seven sectors. First developed in 2005, they were updated in 2011. The updated EEPR include policies that establish market signals to motivate effective action, accelerate the introduction of new technologies and strengthen and enforce minimum energy performance standards for appliances, lighting, equipment and building energy codes. IEA countries have made progress in implementing the recommendations in all sectors, particularly the appliance, lighting and transport sectors, although further policy implementation is still needed (Figure 1.3). The IEA is currently developing new EEPR for developing countries. These will be created to reflect the regional, developmental, climatic and cultural contexts of developing countries.
Figure 1.3 Progress in implementation of IEA 25 EEPR by IEA countries
Source: Pasquier and Saussay, 2012.
In addition, the IEA Policies and Measures Databases (PAMS) provide a comprehensive inventory of information on energy efficiency policy packages in force or planned globally. PAMS covers IEA member countries, Clean Energy Ministerial countries and many more. Because PAMS is regularly updated by the governments of IEA member countries, it provides a valuable tool for tracking latest policy developments, supporting the work of policy makers and market analysts both inside and outside the IEA. It is free to access online at: www.iea.org/policiesandmeasures/.
19%
14%
9%
2%
4%
11%
11%
36%
29%
33%
32%
6%
25%
18%
25%
19%
28%
48%
57%
29%
36%
17%
21%
15%
5%
10%
15%
32%
3%
17%
12%
13%
24%
20%
4%
4%
1%
17%
9%
7%
3%
10%
29%
26%
11%
18%
2%
22%
29%
22%
19%
29%
24%
9%
21%
32%
27%
26%
32%
31%
60%
23%
39%
4%
20%
19%
26%
26%
23%
2%
1%
20112009
20112009
20112009
20112009
20112009
20112009
20112009
Full implementation Substantial implementationPlan to implement Not implementedNot applicable
Cross-sectoral
Appliances
Lighting
Transport
Utilities
Buildings
Industry
© O
EC
D/IE
A, 2
013

UNDERSTANDING THE MARKET FOR ENERGY EFFICIENCY
ENERGY EFFICIENCY MARKET REPORT 2013 35
An IEA survey of energy efficiency experts clearly identified the primary barrier as lack of information and low awareness. Other frequently cited barriers included low energy prices, difficulty in accessing affordable financing and lack of implementation capacity (IEA, 2010). Regulation, incentives and direct investment all play a pivotal role in stimulating energy efficiency market activity, by encouraging or requiring investment in energy efficiency. The IEA 25 energy efficiency policy recommendations provide examples of policy packages that have been shown to deliver significant energy savings where implemented (Box 1.2). Government support for R&D in the area of energy-efficient technologies has led to cost-effective solutions that reduce energy consumption in vehicles, appliances, buildings and industry. Policies that increase demand for energy-efficient products and services also stimulate their supply, through innovation and investment in development and commercialisation of new and improved technologies and services. Government support and market structure can also influence the delivery of energy efficiency. For example, the nature of the utility model for electricity supply can affect whether and how suppliers provide energy efficiency services to their customers; in some models revenues are dependent on greater electricity sales. In some jurisdictions, energy efficiency and other demand-side resources are allowed to compete on an equivalent basis with new electricity generation capacity in forward capacity market auctions. Government policies can also affect supply by enabling access to financing, reducing the perceived risk associated with energy investments, or providing favourable financing terms that lower the cost of supply (as well as lowering the effective purchase price for consumers on the demand side). An important role for prices
Energy price levels, and thus energy costs relative to other inputs, are a key determinant of the financial benefits from avoided energy demand. Periods of sustained high energy prices have indeed stimulated efficiency investments. For example, an efficiency drive was initiated in member countries of the Organisation for Economic Co-operation and Development (OECD) by the oil crisis of the 1970s (Geller et al., 2006). Importantly, the effects of high prices tend to lag the price changes due to inertial effects in the economy, slow turnover of capital stock and a delay between price effects and induced innovation (Birol and Keppler, 2000; Popp, 2002). Technological innovation stimulated by increases in global oil prices over the past decade will continue to deliver energy savings in coming years. The relationship between price and efficiency is not straightforward, and energy prices are just one of the factors influencing the intensity of energy use. When making vehicle purchases, for example, US consumers do respond to fuel prices, but imperfectly, and may undervalue energy prices as automobile manufacturers often adjust vehicles prices according to changes in fuel prices (Allcott and Wozny, 2012; Busse et al., 2013; Langer and Miller, 2012). Prices and energy costs are important for governments. It is sobering to calculate how much is being spent by countries on energy imports, volumes of which are rising worldwide for oil, coal and natural gas (Figure 1.4). The 3.3 billion toe of oil imported globally in 2008 had a value of USD 1.8 trillion at an average price of USD 79 per barrel. During the 2008 fuel price spike, many countries significantly increased expenditure on fuel. Whether or not an economy could readily absorb this was dependent on its degree of energy self-sufficiency and the extent to which its economic structures relied on transport, oil-fired power generation and energy-intensive industrial production.
© O
EC
D/IE
A, 2
013

UNDERSTANDING THE MARKET FOR ENERGY EFFICIENCY
36 ENERGY EFFICIENCY MARKET REPORT 2013
Figure 1.4 Growing magnitude of imports of coal and coal products, oil and oil products and gas (from left to right), 2001-11
Key sectors in the energy efficiency market The supply of energy efficiency cannot be considered as a distinct sector of the economy. Its magnitude is intimately linked to economic structure and the sectors in which the potential for energy savings lie. Almost any process that uses energy has the potential to become more efficient. Energy efficiency programmes in IEA member countries have often focused on sectors where energy price signals have not been optimised in purchasing decisions, including the residential sector. In countries that are adding new capacity to meet the energy needs of a growing economy, there is often a greater interest in ensuring that upstream energy conversion processes, such as power plants and refineries that will operate for several decades, are installed with best available technology. The energy intensity of individual sectors is influenced by technology choices and the resulting fuel mix. Sectoral energy efficiency measures will therefore impact fuel use within the broader economy. The transport sector, for example, is dominated by oil and avoided energy use in transport can reduce oil consumption and a nation’s oil import bills. Energy use in buildings is likely to be dominated by electricity, and gas for heating. Avoided energy use in buildings, appliances and lighting will primarily affect the cost of and demand for energy sources that are used for electricity generation. Electricity sources vary and will have different conversion rates for translating reduced energy demand into the larger quantity of avoided primary energy, which takes into account efficiency losses during power generation and transmission. The main energy-consuming sectors, and those with significant potential for avoiding energy demand, are: • Buildings: energy use in residential, commercial and public buildings was responsible for 35% of global
final energy demand,1 and about 50% of global final electricity consumption, in 2010 (IEA, 2013). Buildings have long lifetimes: more than half of the current global building stock will still be standing in 2050; in OECD member countries, that figure is closer to 75%. While the overall building stock turnover rate is only 1% to 2% per year, heating and cooling systems are generally upgraded or replaced every 10 to 30 years (IEA, 2013). Policies targeted at new buildings therefore take time to generate energy savings and are often complemented by policies that encourage refurbishments. As a consequence, the market for investment in the building sector in developed countries is dominated by refurbishments, while in faster-growing economies investments are driven by the demand for new buildings.
1 Excluding non-energy use in total final energy consumption.
0
100
200
300
400
500
600
700
800M
toe
0
500
1 000
1 500
2 000
2 500
3 000
0
200
400
600
800
1 000
OECD AmericasNon-OECD Asia (excl. China)Non-OECD Americas
OECD Asia OceaniaChinaMiddle East
OECD EuropeAfricaNon-OECD Europe and Eurasia
© O
EC
D/IE
A, 2
013

UNDERSTANDING THE MARKET FOR ENERGY EFFICIENCY
ENERGY EFFICIENCY MARKET REPORT 2013 37
• Appliances and lighting: global final energy consumption for lighting, cooking, appliances and other buildings equipment accounted for roughly 45% of total final energy used in buildings in 2010 (IEA, 2013). New household appliances are purchased every 5 to 20 years, while consumables, such as mobile telephones, have much shorter life spans (IEA, 2013). The level of investment related to each energy service is therefore dictated by the lifetime of the appliance stock. Energy costs for individual appliances are often small relative to the total cost of the appliance. For example, annual energy expenses for a refrigerator may represent approximately 10% of the product cost; better fridge technology may reduce energy consumption by between 10% and 45%, but this can equate to a cost saving of only USD 6 to USD 33 per year per refrigerator in the United States (DoE, 2009). Energy-efficient appliances will generate the highest energy savings and financial flows in market segments with high energy consumption, more rapid stock turnover and where technological change can significantly reduce energy consumption without increasing lifecycle costs.
• Transport: the transport sector accounted for 27% of global final energy consumption in 2010.2 Cars and trucks generally have lifetimes of between 10 and 15 years. Due to high levels of ownership and relatively high capital costs per vehicle, the market for vehicles, and therefore the market for more efficient vehicles, is large: 82 million vehicles were sold globally in 2012 and the turnover of the automotive industry was estimated to be USD 1.9 trillion (OICA, 2007, 2012). Fuel costs in this sector, including fuel excise taxes that are widely applied across the world, are higher relative to ownership costs, leading to a stronger price signal for consumer investment. Accelerating the uptake of efficiency in the transport sector requires raising the efficiency of new vehicles, reorienting the market towards more efficient vehicle classes and, in some cases, increasing the replacement rate.
• Industry: the industrial sector both manufactures energy-consuming products and consumes energy in the production of goods and services. Industry accounts for 28% of global final energy consumption, a proportion that tends to be much higher in countries that are industrialising. Energy consumption by heavy industry is often related to large, energy-hungry equipment that can be responsible for a high share of operational costs and have lifetimes of over 40 years.3 Refurbishment of this equipment is generally only undertaken if the payback period is in the order of two to five years. The energy efficiency market in industry is therefore unevenly distributed, largely driven by economic growth, and comprises many globally active players. Most investments have shifted towards emerging economies with expanding industrial sectors. Industrial firms often have competitiveness pressures that drive autonomous energy efficiency measures, especially in times of stable demand for industrial output. In addition to efficiency measures, strategies to reduce energy consumption in the manufacturing sector include the recovery of waste energy, as well as recycling, substitution and re-use of materials and products (IEA, 2007).
• Upstream energy production: extraction, refining and related transformation, and electricity generation, transmission and distribution processes are all areas for potential energy-efficient investments. The dynamics of investment are similar (long life, slow stock turnover) to those of the heavy industry sector. Unlike other industrial sectors, upstream energy production from fossil fuels is universally energy-intensive. One of the drivers for energy efficiency in the upstream energy sector is the expansion of environmental standards at the same time as unconventional energy resources, such as heavy oil or coal-based fuels, are being developed.
2 Including non-energy use in total final energy consumption. 3 This is industry-specific; some sectors have more rapid stock turnover. For example, in the information technology sector, the fast pace of technological change leads to higher replacement rates.
© O
EC
D/IE
A, 2
013

UNDERSTANDING THE MARKET FOR ENERGY EFFICIENCY
38 ENERGY EFFICIENCY MARKET REPORT 2013
Multiple benefits of energy efficiency Investment in energy efficiency generates a variety of non-energy benefits, including economic, environmental, and socio-economic. Avoiding new demands for energy can generate additional public benefits for the economy and environment. For example, the IEA (2012) estimates that implementing economically viable energy efficiency measures and removing barriers to energy efficiency investments could avoid the consumption of an amount of fuel worth up to USD 17.5 trillion, which would furthermore avoid associated infrastructure expenditure worth USD 5.9 trillion to 2035. Energy efficiency also generates a myriad of other multiple benefits, including benefits for energy security and for health (Box 1.3).
Box 1.3 The multiple benefits of energy efficiency
Energy professionals often measure the outcome of energy efficiency interventions in purely energy terms but, as with increases in energy supply to an economy, there are multiple benefits attributable to reduced energy demand through energy efficiency. These range from localised benefits, such as social development, to sectoral benefits, such as industrial productivity. Energy efficiency is a special case in the energy sector as the multiple benefits associated with improving the amount of energy service available for a given energy input can help to meet a wide variety of public policy objectives. These include increased energy affordability, reduced environmental damage, improved health and well-being, enhanced energy security and resilience, improved national competitiveness and stronger trade balances. In addition, energy efficiency can support international public goods, such as climate change mitigation efforts, and generally reduce resource consumption.
The contribution of energy efficiency improvements to the achievement of non-energy outcomes is rarely considered or quantified in other fields. The IEA report, Spreading the Net: The Multiple Benefits of Energy Efficiency (Ryan and Campbell, 2012), provides more detail and is the foundation of a current project to enable a fuller valuation of the net benefits of energy efficiency improvements.
Figure 1.5 The multiple benefits of energy efficiency
Source: Ryan and Campbell, 2012.
© O
EC
D/IE
A, 2
013

UNDERSTANDING THE MARKET FOR ENERGY EFFICIENCY
ENERGY EFFICIENCY MARKET REPORT 2013 39
While not included in most definitions of the energy efficiency market, a monetary value can be applied to the multiple benefits of energy efficiency beyond avoided energy consumption. They can even be the key drivers behind energy efficiency investments (e.g. lowering public expenditure on health and GHG emissions abatement, rather than reduced consumer expenditure on energy). A system-wide lifecycle approach could incorporate, for example, the financial benefits of not expanding electricity generation and transmission infrastructure to meet additional demand that is avoided by energy efficiency measures. At an economy-wide level, consumer spending may be redirected from energy expenditure to other sectors of the economy, as a result of energy savings from efficiency investments. This can be of particular benefit to energy importing countries and those with specific industrial policy objectives. Including these various factors substantially increases the complexity of assessing the value of avoided energy use. References Allcott, H. and N. Wozny, (2012), Gasoline Prices, Fuel Economy, and the Energy Paradox, NBER Working Paper No. 18583, The National Bureau of Economic Research, Cambridge. BFE (Swiss Federal Office of Energy) (2012), Energiestrategie 2050; Bericht des Teilprojekts Energienetze und Ausbaukosten (Swiss Energy Strategy 2050), BFE, Bern. Birol, F. and J.H. Keppler (2000), “Prices, Technology Development and the Rebound Effect”, Energy Policy, Vol. 28, Issues 6-7, Elsevier, Amsterdam, pp. 457-469. Busse, M., C. Knittel, C. and F. Zettelmeyer (2013), “Are Consumers Myopic? Evidence from New and Used Car Purchases”, American Economic Review, Vol. 103, Issue 1, American Economic Association, Pittsburgh, pp. 220-256. CESE (Conseil Economique, Social et Environnemental) (2013), Efficacité Énergétique : Un Gisement d’Économies; un Objectif Prioritaire, Avis du Conseil économique, social et environnemental, Anne de Béthencourt et Jacky Chorin, rapporteurs, Journal Officiel de la République Française, Paris. Dena (Deutsche Energie Agentur) (2012), Abschätzung: Wirtschaftlich erschliessbare Endenergieeinsparpotenziale in Deutschland bis 2020, Berlin, Germany. DoE (US Department of Energy) (2009), Preliminary Technical Support Document: Energy Efficiency Program for Consumer Products: Refrigerators, Refrigerator-Freezers, and Freezers, US Department of Energy, Washington DC. EC (European Commission) (2006), Action Plan for Energy Efficiency: Realising the Potential, COM(2006)545, European Commission, Brussels. EC (2011), Energy Efficiency Plan 2011, COM(2011) 109, European Commission, Brussels. EC (2012), “EUROPE 2020 TARGETS: Climate Change and Energy”, Europe 2020: Themes – Energy and GHG, European Commission, Brussels.
© O
EC
D/IE
A, 2
013

UNDERSTANDING THE MARKET FOR ENERGY EFFICIENCY
40 ENERGY EFFICIENCY MARKET REPORT 2013
Geller, H., et al. (2006), “Polices for Increasing Energy Efficiency: Thirty Years of Experience in OECD Countries”, Energy Policy, Volume 34, Issue 5, Elsevier, Amsterdam, pp. 556-573. GoF (government of Finland) (2011), Finland’s Second National Energy Efficiency Action Plan (NEEAP-2), Report for the European Commission under Article 14 of the Energy Services Directive (32/2006/EC), Helsinki. GoI (government of Italy) (2013), Government Analysis – 2013 Interim Report for 2014 National Energy Efficiency Action Plan, personal communication. IDAE (Instituto para la Diversificación y Ahorro de la Energía) (2011), Energy Saving and Efficiency Action Plan 2011-2020, IDAE, Madrid. IEA (International Energy Agency) (2007), Tracking Industrial Energy Efficiency and CO2 Emissions, IEA/OECD, Paris. IEA (2010), Energy Efficiency Governance, IEA/OECD, Paris and European Bank for Reconstruction and Development (EBRD), London. IEA (2012), World Energy Outlook 2012, OECD/IEA, Paris. IEA (2013), Transition to Sustainable Buildings – Strategies and Opportunities to 2050, OECD/IEA, Paris. Koomey, J. et al. (2010), “Defining a Standard Metric for Electricity Savings”, Environmental Research Letters, Vol. 5 No.1, IOP Publishing, Bristol. Langer, A. and N. Miller (2012), “Automakers’ Short-Run Responses to Changing Gasoline Prices and the Implications for Energy Policy”, Review of Economics and Statistics, MIT Press Journals, Cambridge, MA, forthcoming. Marbek (Marbek Resource Consultants) and Jaccard (M.K. Jaccard Associates, Inc.) (2006), Demand Side Management Potential in Canada: Energy Efficiency Study, submitted to Canadian Gas Association, Marbek Resource Consultants, Ottawa and M.K. Jaccard Associates, Inc., Vancouver. McKinsey (McKinsey & Company) (2009), Unlocking Energy Efficiency in the U.S. Economy, July, McKinsey Global Energy and Materials, McKinsey & Company, New York. MEDDTL (Ministère de l’Écologie, du Développement Durable, des Transports et du Logement) and MEFI (Ministère de l’Économie, des Finances et de l’Industrie) (2011), Plan d’Action de la France en Matière d’Éfficacité Énergétique, MEDDTL et MEFI, Paris. MND (Ministry of National Development of Hungary) (2012), National Energy Strategy 2030, Ministry of National Development, Budapest. OICA (International Organization of Motor Vehicle Manufacturers) (2007), “Economic Contributions – Facts and Figures”, http://oica.net/category/economic-contributions/facts-and-figures/, OICA, Paris.
© O
EC
D/IE
A, 2
013

UNDERSTANDING THE MARKET FOR ENERGY EFFICIENCY
ENERGY EFFICIENCY MARKET REPORT 2013 41
OICA (2012), “World Sales – All Vehicles”, http://oica.net/wp-content/uploads/total_sales_2005-2012.pdf, OICA, Paris. Pasquier, S. and A. Saussay (2012), Progress Implementing the IEA 25 Energy Efficiency Policy Recommendations: 2011 Evaluation, Insight Series 2012, OECD/IEA, Paris. Patterson, R. (2011), Optimisation Model to Estimate Potential Energy Savings in the New Zealand Economy, Riverdale Associates Ltd., Palmerston. Popp, D. (2002), "Induced Innovation and Energy Prices," American Economic Review, Vol. 92, No. 1, American Economic Association, Washington DC, pp. 160-180. Ryan, L. and N. Campbell (2012), Spreading the Net: the Multiple Benefits of Energy Efficiency, IEA Insight Series, OECD/IEA, Paris. Ryan, L., et al. (2011), Energy Efficiency Policy and Carbon Pricing, IEA Information Paper, OECD/IEA, Paris. Thollander, P., et al. (2013), “Energy in Swedish Industry 2020 – Current Status, Policy Instruments, and Policy Implications”, Journal of Cleaner Production, Vol. 51, Elsevier, Amsterdam, pp. 109-117.
© O
EC
D/IE
A, 2
013

MEASURING THE MARKET FOR ENERGY EFFICIENCY
42 ENERGY EFFICIENCY MARKET REPORT 2013
2. MEASURING THE MARKET FOR ENERGY EFFICIENCY Quantifying the global energy efficiency market Determining the aggregate level of investments in energy efficiency worldwide, as well as the resulting energy savings, can give policy makers important insights into the use and effectiveness of this energy source. It can also provide all stakeholders with more information to make choices across different energy resources, including in deciding upon appropriate support or other mechanisms, taking into account energy security, climate change mitigation and other objectives. The methodological challenges in this regard are significant. Nevertheless, they are worth tackling, given the increasing strategic importance and visibility of energy efficiency, stemming in part from efforts to support global economic growth while limiting greenhouse gas (GHG) emissions and managing national resources. This chapter describes the methodological challenges associated with measuring the energy efficiency market. It then describes some of the other efforts that have been made to delimit and measure the energy efficiency market. In this initial Energy Efficiency Market Report, no specific approach is adopted or recommended for addressing the methodological challenges listed. Finally, this chapter sets out an estimate of the global energy efficiency investment level, together with a description of the methodology used.
Challenges of defining the energy efficiency market Developing and employing energy efficiency market metrics in order to define and measure the market for energy efficiency presents a variety of methodological and practical challenges, outlined below.
Methodological challenges Measuring the market for energy efficiency poses significant methodological challenges (Box 2.1). Several market metrics are possible: the value of annual efficiency-related investment in goods and
Box 2.1 Methodological challenges
Metrics and methods to define and measure energy efficiency markets are needed, but this raises key methodological challenges, including:
• how to identify the energy efficiency “component” in the cost of a product (the incremental investment required to achieve the energy efficiency gain) or within overall spending on goods and services;
• how to integrate into a uniform market framework energy savings from a highly diverse and varied set of sectors and sources;
• identifying the better metric for measuring energy efficiency markets – the value of avoided energy demand versus energy efficiency investments and the returns on these investments;
• how to define the baseline or counterfactual against which energy savings over time are measured; and
• how to account for differences in product lifetimes and associated energy savings.
Defining the market also presents a variety of practical challenges, including lack of data, capturing activities that are spread across a diffuse range of sectors and a lack of consensus on indicators.
© O
EC
D/IE
A, 2
013

MEASURING THE MARKET FOR ENERGY EFFICIENCY
ENERGY EFFICIENCY MARKET REPORT 2013 43
spending on services; the annual or cumulative amount of avoided energy consumption; and the economic value of the energy not consumed. These three market metrics measure different outcomes and are not directly comparable; all three are used in this report to measure aspects of the energy efficiency market. Many attempts have been made to use these metrics to evaluate market size but there is no established approach to estimating the size of the energy efficiency market. Separating out the energy efficiency investment
Separating out the energy efficiency component of total spending on goods and services,1 as opposed to ongoing expansion, renovation and replacement of the stock of buildings and goods, is challenging. Separating out the energy efficiency component of the total product purchase price requires detailed data on product price and sales, product attributes, relative energy savings and other variables. This requires an understanding of the cost-performance curve associated with the product, technology or investment. Such marginal cost curves are often developed at the product level, as part of the cost-benefit analysis of new regulations. Even for products with an easily identifiable efficiency premium, such as energy-saving light bulbs or insulation, market data is scarce and frequently proprietary. Extending this approach to other sectors, such as investments in buildings or manufacturing, is even more difficult. In top-down analyses, identifying reliable multiplier or leverage factors for the private sector investment stimulated by public energy efficiency spending is also difficult, as these vary by type of investment and geographical region. Measuring avoided energy demand Measuring a negative quantity (whether avoided consumption or saved expenditure) always presents particular challenges. Defining the baseline against which energy savings are measured over time is a critical methodological question. Frequently, the amount of saved energy can only be assessed against an assumed baseline representing market activities in the absence of energy efficiency investments. Estimating future avoided energy consumption following energy efficiency interventions generally requires development of a counterfactual scenario, usually based on modelling, which has associated uncertainties as various social and economic factors influence the actual energy savings related to an individual measure. Measuring gross vs. net savings: the impact of the rebound effect
While energy efficiency investments generate direct energy savings, they can also engender effects that result in increased energy consumption, thereby indirectly reducing the overall savings impact. The rebound effect refers to lower-than-anticipated energy savings accruing from a given action, as a result of financial savings from reduced energy consumption being spent on additional energy-consuming activities. Very high rebound effects that cancel out the benefits of the action in pure energy terms, while rare, have been reported (IEA, 2012a). The rebound effect must be included in forecasting of energy savings from energy efficiency.2 There are few examples where the rebound effects of energy efficiency are fully analysed.
1 The incremental investment required to achieve an energy efficiency gain. 2 The estimated magnitude of the rebound effect is nationally and sectorally specific. The IEA World Energy Outlook 2012 estimated a value of 9% for the proportion of savings that are achieved globally in its Efficient World Scenario compared to its New Policies Scenario that are subsequently counterbalanced by rebound effects (IEA, 2012a).
© O
EC
D/IE
A, 2
013

MEASURING THE MARKET FOR ENERGY EFFICIENCY
44 ENERGY EFFICIENCY MARKET REPORT 2013
Lifespan of savings
When assessing the value resulting from energy efficiency measures, it is necessary to judge the timeframe over which the savings will accrue. Whether the economic lifetime (i.e. the payback period) or the expected operational lifetime of a vehicle, building or appliance is used will make a difference to the estimated savings associated with the investment. An upfront investment in an energy efficiency measure will go on to produce an annual quantity of energy savings, or avoided energy, over the lifetime of the efficient good or service, e.g. building, appliance or vehicle. This is similar to investment in a power plant that generates electricity at a given annual rate over the course of its lifetime. Calculating cumulative avoided energy therefore requires understanding the lifetimes of the energy-efficient interventions or technologies, which vary widely from a few years to several decades. These assessments are technology, sector, and geographically specific. Aggregating prospective avoided energy demand from goods and services with a wide range of lifetimes therefore presents a methodological challenge. Monetary valuation of avoided energy
Translating prospective avoided energy consumption into monetary values presents a further methodological challenge relating to uncertainties over the “avoided” fuel mix. These calculations require assumptions to be made on the fuel mixes and conversion losses of the energy not consumed, which vary by country. Determining the appropriate energy prices is a further potential difficulty, as representative price data for the wide range of end-users is difficult to obtain. Prices for residential and industrial consumers tend to be different and accounting for taxes can be complex. Practical challenges The variety of practical challenges associated with defining the market includes: lack of data, or a dependence on proprietary data, on actual investments, detailed energy use, and energy prices; capturing activities that are spread across a diffuse range of sectors; and a lack of consensus on indicators. For example investment figures in other market areas, such as manufacturing, could also include investments in greater energy efficiency but may not be reported as such. In the absence of sufficient data for a thorough summation of all investments in energy efficiency, it is possible to use available data to estimate the size of the investment market. Estimation approaches include those that are “bottom-up” and, for example, aggregate programme spending associated with implementing energy efficiency measures or technologies. Other estimates can be “top-down” and use macroeconomic data to infer the components of total spending by utilities, governments or multilateral finance institutions that are related to energy efficiency. A summary literature review on estimates: a variety of approaches Recognised metrics for estimating the energy efficiency market are in their formative phase. A range of approaches to overcoming the methodological challenges can be observed in the recent literature. These vary in their data sources, regions covered and definitions of an energy efficiency investment. A selection of these estimates is provided in Table 2.1. The information set out in Table 2.1, while non-exhaustive, indicates the high level of interest in calculating aggregate energy efficiency spending estimates. These existing estimates are the primary tool available for building a picture of the market today and in the future, as some estimates are in fact projections. Identifying the most effective methodologies for recording and projecting trends is major challenge.
© O
EC
D/IE
A, 2
013

MEASURING THE MARKET FOR ENERGY EFFICIENCY
ENERGY EFFICIENCY MARKET REPORT 2013 45
The studies listed in Table 2.1 were commissioned to address different questions, and therefore approach the methodological and practical challenges associated with estimating market size in different ways. Three particular methodological approaches are worth noting: • Top-down versus bottom-up perspectives: bottom-up analyses, such as McKinsey (2009), can
yield different results to top-down approaches, such as Laitner (2013), for the same region and sectors. Bottom-up approaches may underestimate energy efficiency spending and may miss multiplier and other effects. Top-down approaches using economic spending data may overestimate or double-count energy efficiency spending and overlook additionality considerations, i.e. investments that may not specifically be for energy efficiency reasons as they fall within business-as-usual interventions. Comprehensive market analysis would ideally integrate both perspectives.
• Energy efficiency premium: few of the reviewed studies make explicit their approach to the efficiency component of market investments, namely the energy efficiency “premium”. One example, Laitner (2013), approaches this challenge by developing an incremental cost curve for light-duty vehicle fuel economy upgrades to identify the energy efficiency investment premium. It determined that a vehicle purchase price includes a cost premium of USD 125 for each mile per gallon (mpg) of performance above the average 23.5 mpg Corporate Average Fuel Economy (CAFE) standard. For appliances and household equipment, a 13% premium was derived from the additional cost of appliances labelled under the government-backed ENERGY STAR programme.
• Scenarios and baselines: assessing the impacts of energy efficiency investments requires that a baseline be established against which the projected impacts can be compared. Energy efficiency market projections in Table 2.1 have generally taken one of three main approaches: extrapolating current market activity based on assumptions about how government policy will
evolve in coming years; modelling energy efficiency scenarios, and calculating differences in capital flows and avoided
energy demand, in comparison to a baseline; or estimating market adoption of particular technologies based on assumed learning rates and
industry forecasts.
IEA approaches to assessing future impacts of potential energy efficiency investments have been based upon modelling energy efficiency scenarios. Analyses include forward projections of economically viable investments and their related energy savings (IEA, 2012a), and their importance over the medium to long term for climate change mitigation (IEA, 2012b). Box 2.2 provides an overview of the IEA World Energy Outlook 2012 Efficient World Scenario, which is an example of the use of scenarios and baselines. Job creation has also been employed as a metric for measuring one of the additional (non-energy-related) benefits of the energy efficiency market. In 2010, the United States energy and resource efficiency sector was estimated to employ 830 000 people (Muro et al., 2012). The approach taken involved the categorisation of all firms in industries that are related to the “clean economy” according to the products or services provided. Historical employment data was then used to estimate 2010 job numbers, adjusting for lay-offs. Employment in the provision of energy efficiency services in the buildings sector was estimating to reach 380 000 jobs by 2020 in the United States (Goldman et al., 2010). However, job creation, labour value and labour quality remain a difficult area for analysis in energy efficiency as in other sectors.
© O
EC
D/IE
A, 2
013

MEASURING THE MARKET FOR ENERGY EFFICIENCY
46 ENERGY EFFICIENCY MARKET REPORT 2013
Table 2.1 Comparison of energy efficiency spending estimates
Ass
ocia
ted
ener
gy
cost
sav
ings
Vo
lum
e (b
illio
n)
EUR
185
*
- - - - -
Year
(s)
2011
-20
- - - - -
Proj
ecte
d
inve
stm
ent
Volu
me
(bill
ion)
EUR
999
*
-
US
D 3
12
- - -
Year
(s)
2011
-20
- - - - -
Ann
ual
inve
stm
ent
Volu
me
(bill
ion)
-
US
D 9
0
-
US
D 9
.4
US
D 1
4
US
D 0
.6
Year
-
2010
-
2011
2011
2011
Dat
a In
put
Cap
ital n
eede
d to
fina
nce
the
com
mer
cial
isat
ion
of fo
ur g
roup
s of
ene
rgy
effic
ienc
y te
chno
logi
es (i
n bu
ildin
gs, n
etw
orks
an
d sh
ippi
ng) o
n a
per-c
ount
ry b
asis
.
Effi
cien
cy p
rem
ium
pai
d fo
r pro
duct
s an
d in
vest
men
ts b
eyon
d re
gula
tory
requ
irem
ents
, ba
sed
on p
rodu
ct s
ales
, bui
ldin
g im
prov
emen
ts, r
epai
rs a
nd c
onst
ruct
ion,
m
anuf
actu
ring
impr
ovem
ents
and
new
-car
sa
les
(abo
ve 2
7 m
pg).
Bas
ed o
n sa
les
and
spen
ding
dat
a an
d ex
trapo
late
d to
the
econ
omy
as a
who
le w
here
pos
sibl
e.
Sur
vey
of c
ompa
nies
(man
ufac
ture
rs, u
tiliti
es,
regu
lato
rs, e
nviro
nmen
tal a
naly
sts
and
repo
rters
, and
com
mer
cial
con
sum
ers)
.
Sur
vey
of e
nerg
y pr
ovid
er s
pend
ing
leve
ls fo
r r
atep
ayer
-fund
ed e
lect
ricity
and
gas
dem
and-
s
ide
man
agem
ent p
rogr
amm
es.
Gro
ss fl
ows
of c
omm
itted
inve
stm
ent c
apita
l in
to c
limat
e fin
ance
at p
rogr
amm
e- a
nd
proj
ect-l
evel
, with
a fo
cus
on d
evel
opm
ent
finan
ce in
stitu
tions
. Hou
seho
ld e
nerg
y ef
ficie
ncy
inve
stm
ents
are
not
mea
sure
d.
Ven
ture
cap
ital i
nves
tmen
ts in
cle
an
tec
hnol
ogy
com
pani
es.
Are
a
EU
25
Uni
ted
Sta
tes
Wor
ld
Uni
ted
Sta
tes
and
Can
ada
Wor
ld
Uni
ted
Sta
tes
Sou
rce
Acc
entu
re
Bar
clay
s,
201
1
AC
EE
E
(La
itner
, 2
013)
BC
C, 2
011
CE
E, 2
013
Clim
ate
P
olic
y
Ini
tiativ
e,
201
2
Ern
st &
Y
oung
, 2
012
© O
EC
D/IE
A, 2
013

MEASURING THE MARKET FOR ENERGY EFFICIENCY
ENERGY EFFICIENCY MARKET REPORT 2013 47
Ass
ocia
ted
ener
gy
cost
sav
ings
Vo
lum
e (b
illio
n)
EU
R 1
59
US
D 3
50
- -
US
D 1
30
Year
(s)
2020
2020
- -
2009
Proj
ecte
d
inve
stm
ent
Volu
me
(bill
ion)
-
US
D
11 8
00*
-
US
D 9
.5
(mid
dle
scen
ario
)
USD
520
*
Year
(s)
-
2012
-35
-
2025
2008
-20
Ann
ual
inve
stm
ent
Volu
me
(bill
ion)
- -
US
D 1
47
to
US
D 3
00
US
D 4
.8
US
D 1
0
to
US
D 1
2
Year
- -
2011
2010
2008
Dat
a In
put
Con
vers
ion
of fi
nal e
nerg
y de
man
d re
duct
ion
in th
e E
urop
ean
Com
mis
sion
’s ro
adm
ap fo
r a
low
-car
bon
econ
omy,
into
prim
ary
ener
gy
savi
ngs
and
tech
nolo
gica
l com
posi
tion,
bas
ed
on te
chni
cal p
oten
tials
of e
ffici
ency
mea
sure
s an
d th
eir c
ost-r
educ
tion
curv
es.
Effi
cien
t Wor
ld S
cena
rio: a
ll ec
onom
ical
ly
effic
ient
ene
rgy
savi
ngs
inve
stm
ents
acr
oss
all c
onsu
min
g se
ctor
s th
roug
h to
203
5.
-
Spe
ndin
g on
ele
ctric
and
gas
util
ity c
usto
mer
-fu
nded
effi
cien
cy p
rogr
amm
es.
All
cost
-effe
ctiv
e op
portu
nitie
s fo
r inv
estm
ent
in a
sui
te o
f 675
ene
rgy
savi
ng m
easu
res
in
the
resi
dent
ial,
com
mer
cial
and
indu
stria
l se
ctor
s su
mm
ed u
p.
Are
a
EU
27
Wor
ld
Wor
ld
Uni
ted
Sta
tes
Uni
ted
Sta
tes
Sour
ce
Fra
unho
fer
IS
I, 20
12
IE
A, 2
012a
IE
A (t
his
r
epor
t)
LB
NL,
2
013
McK
inse
y &
C
ompa
ny,
200
9
* Cumulative value between the two stated years, inclusive.
© O
EC
D/IE
A, 2
013

MEASURING THE MARKET FOR ENERGY EFFICIENCY
48 ENERGY EFFICIENCY MARKET REPORT 2013
Box 2.2 The IEA Efficient World Scenario
Scenario analysis can be very useful. The World Energy Outlook 2012 Efficient World Scenario (EWS) is an example of a scenario-based modelling approach (IEA, 2012a). In this scenario, all investments capable of improving energy efficiency are assumed to be made, as long as they are economically viable and any market barriers obstructing their realisation are removed. The scale of the opportunity is determined, by sector and region, on the basis of a thorough review of the technical potential to raise energy efficiency, and estimates of the payback periods that investors will require to commit funds to various types of energy efficiency projects. This scenario is compared to the World Energy Outlook 2012 New Policy Scenario (NPS), in which current trends are extrapolated, and current and pledged policies are included.
The EWS highlights how these investments would boost cumulative economic output globally by USD 18 trillion from 2010 to 2035, roughly equivalent to the current size of the economies of the United States, Canada, Mexico and Chile combined. Over the same period, global total primary energy supply (TPES) growth is halved, and oil import bills in the five largest oil-importing countries are reduced by 25%. Efficiency measures in supply and demand would reduce TPES by 900 Mtoe in 2020 and generate cumulative fuel cost savings of over USD 350 billion between 2010 and 2020. Regions vary in their contributions to overall reductions in energy consumption, with OECD member countries and Asia accounting for 75% of the cumulative reduction in total final energy consumption (TFC) (Figure 2.1) and 78% of TPES.
Figure 2.1 Reductions in TFC due to efficiency by region in IEA World Energy Outlook scenarios
Source: IEA, 2012a.
Sectoral differences are also important. Combined avoided energy consumption in the industrial, transport and buildings (residential, public and commercial) sectors represents 90% of cumulative reductions in TFC when moving to the EWS from the NPS. All three of these sectors make a substantial contribution (Figure 2.2). Any estimation of the potential for future avoided energy consumption across an economy should take each of these sectors into account.
8.0
8.2
8.4
8.6
8.8
9.0
9.2
9.4
9.6
9.8
10.0
Bill
ion
toe Africa
Middle East
Asia
Eastern Europe, EurasiaOECD Asia Oceania
OECD Europe
OECD Americas
© O
EC
D/IE
A, 2
013

MEASURING THE MARKET FOR ENERGY EFFICIENCY
ENERGY EFFICIENCY MARKET REPORT 2013 49
Box 2.2 The IEA Efficient World Scenario (continued)
Figure 2.2 Cumulative reductions in TFC by sector in the EWS compared to the NPS, 2013-20
Note: does not include all sectors.
Source: IEA, 2012a.
Projections of savings resulting from efficiency measures naturally depend on assumptions about fuel costs. Indeed, the impact of fuel subsidies that mask the price of energy in some countries must be taken into account. Fossil fuel subsidies were estimated to be USD 523 billion in 2011, and their gradual phase-out could generate significant price-induced energy savings, equating to a cumulative reduction in carbon dioxide emissions of 290 million tonnes by 2020 (IEA, 2013).3
Deriving an investment estimate for the global energy efficiency market The IEA estimates that total global investment in energy efficiency measures in 2011 was up to USD 300 billion. This is based on a country-by-country analysis of reported public spending, combined with information about multilateral institutional investment and private spending where available. This estimate is higher than other recent estimates (IEA, 2012a; Hayes et al., 2012), but is considered conservative because of the way energy efficiency investment is defined. In particular, the IEA excluded investments in transport and power infrastructure, due to the difficulty in identifying the efficiency component of these investments, and of accessing private sector investment data. One-third of global energy efficiency investment went to non-OECD countries, almost all of which (90%) was in the five BRICS countries (Ryan et al., 2012). Estimating global energy efficiency investment is difficult. There is no standard definition of what constitutes an energy efficiency investment. In addition, data are patchy and not available in a
3 While a common justification for fossil fuel subsidies is that they are needed to help the poor gain or maintain access to basic energy services essential to living standards, without precise targeting, such subsidies are often an inefficient means of assisting the poor. Studies have found that fossil fuel subsidies, as currently constituted, tend to be regressive, disproportionately benefiting higher-income groups (IEA, 2011).
0
50
100
150
200
250
Industry Transport Buildings
Mto
e
2013
2013
2013
2016
2016
201620
20
2020
2020
© O
EC
D/IE
A, 2
013

MEASURING THE MARKET FOR ENERGY EFFICIENCY
50 ENERGY EFFICIENCY MARKET REPORT 2013
consistent format; data on private sector investments are particularly difficult to access. Investments in energy efficiency are not systematically tracked, making a comprehensive estimate of the current global investment level difficult. Calculating a single leveraging ratio for public funds is not possible, requiring a wide range in the overall investment estimate. The IEA estimate includes surveys and interviews with public and private financial institutions to carry out a country-by-country analysis, using the following approaches: • Country sources and estimates were used wherever available. This proved possible for larger
countries, particularly in the OECD. • Energy efficiency investment was estimated using data from multilateral development banks and
other relevant sources of public funding, to which a multiplier was applied, based on the economic circumstances and practices of the individual country.
In both cases, the particular manner in which a given country or multilateral development bank classified investments as being energy efficiency related were generally accepted as reported. Where possible, only the energy efficiency component of investment, rather than the entire project cost, was included. The methodology used leverage ratios applied to public funds where data for private investment was not available. Public finance typically catalyses (i.e. leverages) private funds, and the leverage ratio provides an estimate of how much private finance is generated by public funds. Public funds attract private capital by mitigating risk and building awareness and capacity. Public financial institutions leverage public funds through private sector co-financing. The IEA used leverage ratios partly based on the United Nations’ High-Level Advisory Group on Climate Change Financing (AGF) methodology to calculate leverage in climate finance (UN, 2010). In most cases, these are based on generic investments rather than climate-specific investments, and, due to a lack of data and a common agreed definition of leverage, should be treated with caution. The UN report calculates an average leverage factor of three for private investment in climate mitigation activities, derived from various types of financing instruments and their associated leverage ratios. Using the leverage ratios from the AGF report with data obtained from countries and multilateral development banks, along with relevant estimates provided in various analyses, the IEA has calculated a range of EUR 147 billion to EUR 300 billion of investment in energy efficiency in 2011. For example, the IEA applied leverage ratios of between two and eight according to geographic region and type of funding, to allow for different possible levels of activity in energy efficiency markets. This investment range is considered conservative, as it likely under-estimates private sector energy efficiency activity. In Germany, for example, the state bank KfW estimates that its loan programme stimulated EUR 27 billion in energy-efficient home refurbishments through EUR 9.9 billion in loans and grants in 2012, while other data estimate the total investment in energy efficiency refurbishments for buildings at EUR 53 billion in 2010 (BBSR, 2011). This example suggests a very high leverage rate where there are active energy efficiency markets. Meanwhile, the German energy efficiency industry assesses the full size of the energy-efficient service and product market in Germany to be worth EUR 146 billion in 2012 (DENEFF, 2013). Should this value be realistic, it suggests all previous attempts to determine the size of investment in energy efficiency could be significantly underestimating the actual market.
© O
EC
D/IE
A, 2
013

MEASURING THE MARKET FOR ENERGY EFFICIENCY
ENERGY EFFICIENCY MARKET REPORT 2013 51
Conclusions Refining energy efficiency market metrics would complement the wealth of existing work on the subject matter, which has tended to focus on quantifying the value of energy savings, determining appropriate policies to promote efficiency measures, and developing new technologies and methods to stimulate deployment and reduce upfront costs. This report highlights the need for continued development of methodologies for estimating, reporting and comparing the investments made in energy efficiency, the resulting avoided energy, the impacts of energy prices on energy efficiency investments and vice versa, and the impact of government policies. Better metrics and data can help improve the design, monitoring and evaluation of energy efficiency programmes and investments. References Accenture Barclays (2011), Carbon Capital: Financing the Low Carbon Economy, Accenture, London. BBSR (Bundesinstitutfür Bau-, Stadt- und Raumforschung) (2011), Struktur der Bestandsinvestitionen, BBSR-Berichte Kompakt, Bundesamt für Bauwesen und Raumforschung, Bonn. BCC (BCC Research) (2011), Green Technologies and Global Markets, BCC Research, Wellesley, Massachussetts. CEE (Consortium for Energy Efficiency) (2013), 2012 State of the Efficiency Programme Industry: Budgets, Expenditures, and Impacts, Annual Industry Report, CEE, Boston. CPI (Climate Policy Initiative) (2012), The Landscape of Climate Finance 2012, CPI, San Francisco. DENEFF (Deutsche Unternehmensinitiative Energieeffizienz) (2013), Branchenmonitor Energieeffizienz 2013, DENEFF, Berlin. Ernst & Young (2011), “US Venture Capital Investment in Cleantech Steady at $4.9 billion Despite Tough Economy”, press release, Ernst & Young. Fraunhofer ISI (2012), Concrete Paths of the European Union to the 2°C Scenario: Achieving the Climate Protection Targets of the EU by 2050 through Structural Change, Energy Savings and Energy Efficiency Technologies, Scientific Support in the Preparation of Proposals for an EU Energy Roadmap, Fraunhofer Institute for Systems and Innovation Research ISI, Karlsruhe. Goldman, C. A., et al. (2010), Energy Efficiency Services Sector: Workforce Education and Training Need, Lawrence Berkeley National Laboratory, Berkeley. Hayes, S., R. Young, and M. Sciortino (2012), The ACEEE 2012 International Energy Efficiency Scorecard, ACEEE Report No. E12A, Washington DC. IEA (International Energy Agency) (2011), World Energy Outlook 2011, OECD/IEA, Paris. IEA (2012a), World Energy Outlook 2012, OECD/IEA, Paris. IEA (2012b), Energy Technology Perspectives 2012: Pathways to a Clean Energy System, OECD/IEA, Paris.
© O
EC
D/IE
A, 2
013

MEASURING THE MARKET FOR ENERGY EFFICIENCY
52 ENERGY EFFICIENCY MARKET REPORT 2013
Laitner, J. A. (2013), Calculating the Nation’s Annual Energy Efficiency Investments, report for the American Council for an Energy-efficient Economy, Washington DC. LBNL (Lawrence Berkeley National Laboratory) (2013), The Future of Utility Customer-Funded Energy Efficiency Programmes in the United States: Projected Spending and Savings to 2025, LBNL, Berkeley. McKinsey (McKinsey & Company) (2009), Unlocking Energy Efficiency in the U.S. Economy, McKinsey Global Energy and Materials, McKinsey & Company, New York. Muro, M., J. Rothwell and D. Saha (2012), Sizing the Clean Economy: A National and Regional Green Jobs Assessment, The Brookings Institution, Washington DC. Ryan, L., N. Selmet and A. Aasrud (2012), Plugging the Energy Efficiency Gap with Climate Finance, IEA Insights Series, OECD/IEA, Paris. UN (United Nations) (2010), Report of the Secretary-General’s High-Level Advisory Group on Climate Change Financing, United Nations, New York.
© O
EC
D/IE
A, 2
013

WHAT THE NUMBERS SAY: ENERGY EFFICIENCY AND CHANGING ENERGY USE
ENERGY EFFICIENCY MARKET REPORT 2013 53
3. WHAT THE NUMBERS SAY: ENERGY EFFICIENCY AND CHANGING ENERGY USE Quantifying energy use and the impacts of the energy efficiency market Energy statistics show how energy use changes over time. The two highest-level measures are total primary energy supply (TPES) and total final consumption (TFC). The difference between the two figures is related to the conversion and distribution losses associated with transforming primary energy into the energy products, such as transport fuels and electricity, that are transported to final users for consumption. Global trends in energy use: a brief overview Between 2011 and 2001, TPES grew faster than TFC, and, in relative terms, electricity consumption growth outpaced both with an increase of almost 50% (Figure 3.1). A rise in the electricity consumption is consistent with a widening gap between TPES and TFC as the losses associated with electricity generation are relatively high compared to other end-use energy products. In 2011, TPES reached 13.1 billion tonnes of oil-equivalent (toe). Following a 0.7% drop in TPES between 2008 and 2009, strong growth resumed in 2010 and 2011. This resulted in an annual average rate of growth in global energy supply of 2.5% for the decade to 2011. At this rate, world TPES would be double 1990 levels in 2023, just ten years from now. This presents serious challenges for energy supplies to keep pace with demand as well as major implications for the environment; the Energy Sector Carbon Intensity (ESCI) index – carbon dioxide emissions per unit of supplied energy – has not significantly changed since 1990 (IEA, 2013).
Figure 3.1 TPES and TFC, 2001-11, and energy supply by source, 2011
Source: unless otherwise indicated, all tables and figures in this chapter derive from International Energy Agency (IEA) data and analysis.
At 4.1 billion toe and 32% in 2011, oil remains the largest single energy source due to its unsurpassed position as the world’s first choice transport fuel (Figure 3.2). Energy demand in all sectors rose between 2001 and 2011 by at least 12% (residential) and up to 35% (industry). Reaching 3.8 billion toe in 2011, coal was the fastest-growing energy source between 2001 and 2011, growing at nearly double the rate of both renewables and natural gas.
0
2
4
6
8
10
12
14
Bill
ion
toe
TPES TFC Electricity consumption
Nuclear5%
Renewable13%
Coal and coal
products29%
Oil and oil products
32%
Natural gas21%
© O
EC
D/IE
A, 2
013

WHAT THE NUMBERS SAY: ENERGY EFFICIENCY AND CHANGING ENERGY USE
54 ENERGY EFFICIENCY MARKET REPORT 2013
Figure 3.2 Sectoral breakdown of global TFC by energy source, 2001 and 2011
Notes: “Other” includes biofuels plus heat from geothermal, solar, co-generation and district heating. Co-generation refers to the combined production of heat and power. In the residential sector at a global level, this sector is dominated by traditional use of biomass.
TFC and TPES statistics tell us little about energy efficiency, however. More sophisticated statistical methods are required to relate changes in energy use to the factors that influence them, including the impact of energy efficiency market activities. The role of indicators in supporting the energy efficiency market Assessing energy efficiency developments and their underlying causes requires detailed energy efficiency data and standardised statistical metrics that allow meaningful comparisons. Highly aggregated statistics tell only part of the story; efficiency impacts can be masked by variations in economic structure, climate, population, behaviour or affordability of energy services. This is in contrast to other energy source datasets that can reasonably rely on straightforward production, consumption and capacity statistics. The suite of metrics available from the International Energy Agency (IEA) indicators database is an authoritative source of information on the causes of changes in patterns of energy consumption. In general, these indicators are ratios of energy use to other empirical physical, economic and social data, such as population, house sizes or industrial output. They serve two important purposes: tracking changes in energy use by IEA member countries; and providing a measure of the outcomes of the market for energy efficiency. Understanding the extent to which changes are related to energy efficiency improvements compared to other macroeconomic, demographic and structural factors is a key issue from an energy policy perspective. Tracking 10 or 20 years of changes in energy use, and the drivers behind them, allows long-term trends to be revealed. By exploring the detail behind aggregate energy statistics, it is possible to evaluate where markets and policies are reducing energy use and improving efficiency. The indicators approach picks apart the various factors that influence changes in energy consumption, such as changes in economic activity, transport journeys, residential heating demand and dwelling size. This type of analysis complements the description of market and policy developments in this report, by providing a quantitative measure of the progress that has been made. Analysis of progress indicates the areas where future improvements – and therefore future investment – might be expected.
0
500
1 000
1 500
2 000
2 500
3 000
2001 2011 2001 2011 2001 2011 2001 2011
Industry Transport Commercial and public services
Residential
Mto
e
Coal/peat Oil Gas Electricity Other
© O
EC
D/IE
A, 2
013

WHAT THE NUMBERS SAY: ENERGY EFFICIENCY AND CHANGING ENERGY USE
ENERGY EFFICIENCY MARKET REPORT 2013 55
Organisation of this chapter Energy use data are available at different levels of analysis, from countries to sectors and sub-sectors. This chapter begins with a presentation of high-level overall trends for IEA member countries and discusses the broad relationships between population, energy use and gross domestic product (GDP). These trends include the convergence of IEA member countries towards lower levels of per-capita energy use and the rising productivity of energy use – in terms of GDP generated per unit of energy. These energy intensity and productivity metrics do not accurately track changes in energy efficiency, so this highly aggregated discussion is then followed by presentation of more detailed IEA indicators; these reveal how the efficiency of energy use has changed over the past two decades for a smaller number of countries for which more detailed data are available. Indicators include, for example, decomposition analyses of the drivers of energy demand for certain sectors. For IEA member countries, these are the industrial, residential and transport sectors. Transport is split into passenger and freight transport. Scope of IEA indicators analysis Long-term data are available for the industrial, transport and residential sectors for subsets of IEA member countries. Depending on the sectoral dataset used, the number of countries analysed in this chapter ranges between 15 and 24. National and aggregate indicators have been calculated by weighting and combining these sectoral data. As a result, due to gaps in the database, a complete indicator analysis from 1973 to 2010 is possible for only 11 IEA member countries.1 These 11 countries represented 77% of total IEA energy supply in 2012. The decomposition analyses presented in this chapter add an additional two years of previously unpublished data (from 2009 and 2010) to update the IEA Scoreboard 2011 (IEA, 2011). Decomposition analysis uses economic and social statistics to develop indicators that are effective proxies for energy efficiency.2 These proxies provide a strong indication of energy efficiency drivers and impacts. Energy efficiency: the first fuel? Analysis of the 11 IEA member countries for which suitable data are available indicates that, between 1974 and 2010, energy efficiency was the largest energy resource (Figure 3.3). Over this period, energy efficiency helped limit the growth in energy consumption to just 20% compared to 1974 levels. Without energy efficiency improvements, energy consumption would have increased by 93%. Between 1974 and 2010, cumulative avoided energy consumption due to energy efficiency in these IEA member countries amounted to over 1 350 EJ (32 billion toe). The same analysis from a medium-term perspective shows that the cumulative additional energy savings that were associated with energy efficiency effects between 2006 and 2010 totalled 24 EJ (570 Mtoe) for the 11 IEA member countries. This represents 5% of the final energy consumed by these countries over the five-year period, a significant proportion over such a short time period. By contributing 63 exajoules (EJ) (1.52 billion toe) of avoided energy use in 2010, the contribution of energy efficiency was larger than the supply of oil (43 EJ), electricity or natural gas (22 EJ each) (Figure 3.4). This points to energy efficiency being not just a “hidden fuel”, but in fact, the “first fuel”. 1 These are: Australia, Denmark, Finland, France, Germany, Italy, Japan, the Netherlands, Sweden, the United Kingdom and the United States. For the period between 1990 and 2010, data are also available for Austria, Canada, New Zealand and Spain. 2 For a fuller description of the IEA indicator methodology, see Box 3.1.
© O
EC
D/IE
A, 2
013

WHAT THE NUMBERS SAY: ENERGY EFFICIENCY AND CHANGING ENERGY USE
56 ENERGY EFFICIENCY MARKET REPORT 2013
Figure 3.3 The “first fuel”: long-term improvements in energy efficiency in 11 IEA member countries
Notes: TFC = total final consumption. The 11 countries are Australia, Denmark, Finland, France, Germany, Italy, Japan, the Netherlands, Sweden, the United Kingdom and the United States. Estimated energy use is calculated on the basis of how much energy would have been required to deliver the actual levels of activity reported each year for all sub-sectors had 1974 levels of energy use per unit of output persisted. Due to the nature of decomposition analyses, actual energy use may not add up to total final consumption for the same countries as published in IEA balances. “Other” includes biofuels plus heat from geothermal, solar, co-generation and district heating. Co-generation refers to the combined production of heat and power.
Figure 3.4 The “first fuel”: contribution of energy efficiency compared to other energy resources consumed in 2010 in 11 IEA member countries
Note: the 11 countries are Australia, Denmark, Finland, France, Germany, Italy, Japan, the Netherlands, Sweden, the United Kingdom and the United States. Avoided energy use represents the difference between global TFC in 2010 and the volume of energy that would have been consumed had there been no improvement in energy efficiency since 1974, based on a long-term IEA decomposition analysis. For comparison with this 35-year period of constant efficiency investment, offshore oil and gas rigs in operation today are on average about 24 years old (Reuters, 2011).
0
500
1 000
1 500
2 000
2 500
3 000
3 500
4 000
0
20
40
60
80
100
120
140
160
180
Mto
eEJ
Coal Oil GasElectricity Other Avoided energy useTFC
TFC
Hypothetical energy use had there been no energy efficiency
improvements Avoided energy equal to 65% of 2010 TFC
0
200
400
600
800
1 000
1 200
1 400
1 600
0
10
20
30
40
50
60
70
Oil Electricity Gas Coal Other Avoided energy use
Mto
e
EJ
© O
EC
D/IE
A, 2
013

WHAT THE NUMBERS SAY: ENERGY EFFICIENCY AND CHANGING ENERGY USE
ENERGY EFFICIENCY MARKET REPORT 2013 57
Energy intensity, productivity and per-capita consumption Trends in energy intensity: energy use in the economy The energy intensity of the economy (measured in TPES required to generate one unit of GDP or TPES/GDP)3 has traditionally been used as a very imperfect proxy for energy efficiency when making international comparisons. This is partly due to the limited availability of disaggregated data for more than a handful of countries. As an indicator, it is used by the United Nations Sustainable Energy for All initiative, which has a global scope and has set a global objective of a 2.6% annual average reduction in TPES/GDP for the period 2010-30 (UN, 2013).4 TPES is generally used to calculate energy intensity for an economy because it captures the efficiency of conversion of primary energy sources into useful energy for consumers, including sectors such as refining or electricity generation. The energy intensity of an economy is a measure of how much energy is required to produce each unit of national economic production. It is a relatively crude measure because comparisons between countries on the basis of energy intensity do not reflect differences in the structures of the economies, the sizes of the countries, the efficiencies of energy use or different climates. On the other hand, at a high level, it can provide useful information about how closely countries’ energy needs and economic performance are linked and how their relationship shifts over time. Energy intensity at a global level has fallen over the past decade. Aggregate energy intensity across IEA member countries fell by 1.7% per year on average between 2001 and 2012 (Figure 3.5). Looking further back, TPES/GDP decreased by 50% between 1973 and 2012, while GDP increased by 150%, denoting an apparent improvement in the way energy is used to produce economic value.5 A GDP increase of 20% between 2000 and 2012, and a TPES/GDP decrease of 19%, highlights a slowing of the improvement rate in recent years.
Figure 3.5 Evolution of IEA and World average energy intensity, TPES per GDP
Note: data for 2012 for IEA member countries are estimated and are unavailable for the World average.
3 All energy used in a country is included in the calculation of TPES, including production, imports (minus exports) and stock changes minus international marine and aviation bunkers. A key difference between TPES and TFC is that TPES includes fuel consumed in the processing of fuel and generation of electricity, plus losses associated with transmission of all on-grid electricity. 4 See Box 0.2 in the Overview section of UN, 2013 for more information. 5 GDP measured on a purchasing power parity (PPP) basis in 2005 United States dollars (USD).
0.12
0.14
0.16
0.18
0.20
0.22
toe
per t
hous
and
2005
USD
PPP
World
IEA member countries
© O
EC
D/IE
A, 2
013

WHAT THE NUMBERS SAY: ENERGY EFFICIENCY AND CHANGING ENERGY USE
58 ENERGY EFFICIENCY MARKET REPORT 2013
From intensity to productivity Energy intensity measures the energy used per unit of GDP produced. The reciprocal of energy intensity provides the inverse metric, which measures the amount of GDP produced for each unit of energy used – namely the “productivity” of energy in terms of GDP generated. Although this productivity metric has the same analytical shortcomings as energy intensity, namely its inabilty to represent national structural, size, climatic and other differences, it is perhaps a more intuitive and constructive metric than energy intensity. This productivity metric, and its evolution over time is presented in Figure 3.6 for an illustrative select set of IEA member countries.
Figure 3.6 Evolution of energy productivity for selected IEA member countries, GDP per unit of TPES, 2002-12
Notes: left ends of bars represent 2002 values, right ends represent 2012 values. 2012 data are estimated.
Combining productivity and per-capita consumption Further insights can be obtained by plotting energy productivity against TPES per capita. Looking at per-capita energy use enables comparison between countries with widely varying populations. Higher-income countries, such as IEA member countries, are relatively uniform in the energy productivity (and similarly the energy intensity) of their economies, but vary significantly in their energy use per capita (UN, 2013). While North America has some of the highest per-capita levels of energy consumption, certain European countries have among the lowest levels. Per-capita energy consumption is therefore not just an indicator of wealth and income, but also the level of heavy industry in the economy and the efficiency of energy use. Furthermore, countries that are structurally similar can differ in terms of energy use per capita if their climates and geographic areas require different levels of space heating, cooling or transport distances. By plotting changes in energy productivity and TPES per capita over time together on the same chart, it is possible to see how similar countries have similar patterns of energy consumption, based on economic structure and climatic zones in particular. Similar countries tend to exhibit similar trajectories of productivity and per-capita consumption over time, which can help inform expectations about how rapidly they might progress to greater productivity and efficiency. Norway, Turkey and Japan,
4 5 6 7 8 9 10 11Thousand 2005 USD PPP per toe
Finland Korea
United States Australia
Poland France
Netherlands Norway
Japan Germany
Turkey
Italy UK
Canada
© O
EC
D/IE
A, 2
013

WHAT THE NUMBERS SAY: ENERGY EFFICIENCY AND CHANGING ENERGY USE
ENERGY EFFICIENCY MARKET REPORT 2013 59
for example, have similar levels of energy productivity, but very different patterns of development of per-capita energy consumption due to varying climates and economic structures. Trends for IEA member countries In general, IEA member countries are using less energy per unit of GDP and per capita (Figure 3.7). These are welcome trends, even if, as discussed below, these measures do not necessarily indicate improving energy efficiency. Almost all IEA member countries are increasing energy consumption at a slower rate than they are increasing population, i.e. the number of people that are served by energy supplied to the economy.
Figure 3.7 Approximate trends in GDP per unit of TPES and TPES per capita for IEA member countries, 2002-12
Note: Korea and Luxembourg are outliers and have not been included in these generic trends. The arrows are smoothed and representative trendlines through the underlying groups of data points, moving in general from top left (2002) to bottom right (2012), with arrow heads approximately representing 2012 values for individual countries. See Annex for the underlying data.
Figure 3.7 shows that IEA member countries can be grouped into four general types that reflect: country size, which can affect transport needs; climate; population density; and economic choices. The types broadly correspond to: countries with significant energy-intensive primary industries and more extreme climates (green line); countries undergoing major changes in the structure of their economies, defined by increases in productivity (light blue line); countries with warm climates that have increased GDP over the period based in part on larger service sectors (orange line); and countries with less climatic variation and relatively high energy service demands, coupled with reliance on energy imports (dark blue line). For IEA member countries a converging “direction of travel” is apparent, with the prospect of countries trending towards increasing energy productivity and a level of consumption of around 3 toe to 4 toe per capita. Different development paths for energy use in non-IEA countries The BRICS6 countries show a very different pattern of evolution compared both to IEA member countries and to each other (Figure 3.8). A variety of factors may explain these differences, including 6 Brazil, Russia, India, China and South Africa.
1
2
3
4
5
6
7
8
9
10
3 4 5 6 7 8 9 10 11 12 13
toe
per
capi
ta
Thousand 2005 USD PPP per toe
United Kingdom
Denmark
FinlandUnited States
PortugalTurkey
Czech RepublicNew Zealand
JapanFrance
Netherlands
Norway
Spain SwitzerlandIreland
AustriaGermany
HungaryPolandSlovak Republic
Greece
Italy
Canada
AustraliaSwedenBelgium
© O
EC
D/IE
A, 2
013

WHAT THE NUMBERS SAY: ENERGY EFFICIENCY AND CHANGING ENERGY USE
60 ENERGY EFFICIENCY MARKET REPORT 2013
different levels of industrialisation, resource endowment and population. The extent to which these countries increase their energy productivity, and reach a level of per-capita consumption that meets their socio-economic and environmental policy objectives (which may vary over time), will contribute to the global demand for energy and potentially affect international energy demand and prices.
Figure 3.8 Approximate trends in GDP per unit of TPES and TPES per capita in BRICS countries, 2002-12
Note: the arrows are smoothed and representative trendlines through the underlying groups of data points, with arrowheads representing 2012 values. See Annex for the underlying data.
IEA indicators: moving beyond energy intensity for a subset of countries Because energy intensity data are readily available for most countries, they are often used as a proxy for energy efficiency. This is a mistake, however, as just because a given country has a low energy intensity level does not mean that its efficiency is high. For instance, a small country with a mild climate that is becoming more service-based and more dependent on industrial imports is likely to be reducing its energy intensity more quickly than a large, industry-based country in a very cold climate. This would not, however, reflect the efficiency with which specific energy services and industrial materials were being supplied. Energy efficiency is realised in specific sectors and end-uses; its analysis requires detailed data at end-use levels. A limiting factor is that detailed data are only available up to 2010 and for a subset of IEA member countries. The role of efficiency in TFC changes Final energy use (measured in terms of TFC) for a group of 15 IEA member countries increased by 0.5% per year over the entire period 1990-10, but fell between 2000 and 2010 (Figure 3.9). A decomposition analysis of the different factors that drive changes in energy consumption (namely activity, structure and actual efficiency improvements) shows that energy efficiency has been the key factor restraining the growth in energy consumption that would otherwise have resulted from increased economic activity, transport and population (components in the “activity” factor). The efficiency effect is larger than the effect of structural changes, which have also contributed to a decline in final energy consumption over the past decade.
0
1
2
3
4
5
6
2 3 4 5 6 7 8
toe
per
capi
ta
Thousand 2005 USD PPP per toe
SouthAfrica
India
China
Russia
BrazilWorld
© O
EC
D/IE
A, 2
013

WHAT THE NUMBERS SAY: ENERGY EFFICIENCY AND CHANGING ENERGY USE
ENERGY EFFICIENCY MARKET REPORT 2013 61
Figure 3.9 Changes in TFC, decomposed into structure, activity and efficiency effects for 15 IEA member countries
Note: the 15 countries are Australia, Austria, Canada, Denmark, Finland, France, Germany, Italy, Japan, the Netherlands, New Zealand, Spain, Sweden, the United Kingdom and the United States. A discussion of the decomposition analysis methodology is provided in Box 3.1. In IEA indicator analysis, household energy use changes are corrected for yearly climate variations.
Efficiency and structure have both influenced intensity changes IEA decomposition analysis, presented in Figure 3.10, shows that both economic structure and energy efficiency contributed to reducing aggregate energy intensity between 1990 and 2010 in the 15 IEA member countries analysed. Just over half (54%) of the reduction in aggregate intensity was due to improved efficiency and 46% can be accounted for by changes in economic structure.
Figure 3.10 Changes in aggregate intensities of 15 member IEA countries, decomposed into structure and efficiency effects, 1990-2010
Note: aggregate intensity is a composite measure of energy use per unit of activity across different sectors that each have their own individual measures (see Box 3.1).
-2%
-1%
0%
1%
2%
3%
1990-2000 2000-10 1990-2010
Aver
age
annu
al c
hang
e
TFC Activity effect Structure effect Efficiency effect
-3.0%
-2.5%
-2.0%
-1.5%
-1.0%
-0.5%
0.0%
Aver
age
annu
al c
hang
e
Efficiency effect Structure effect
© O
EC
D/IE
A, 2
013

WHAT THE NUMBERS SAY: ENERGY EFFICIENCY AND CHANGING ENERGY USE
62 ENERGY EFFICIENCY MARKET REPORT 2013
The relative contribution of structure and efficiency to the overall trend varies among countries, driven by contrasting economic performance over the period and also by varying impact of the recent global recession. For 4 out of 15 countries, the energy efficiency effect was the dominant factor in the reduction of aggregate energy intensity. Different national trends also need to be understood in relation to the country-specific starting-points in 1990. Some countries had high levels of aggregate energy intensity in 1990 and thus more room to improve efficiency. Countries that did not reduce intensity by similarly high proportions include those that have had long-term energy efficiency policies in place since before 1990, and started from lower intensities. Some countries experienced structural changes, such as the expansion of their services sector or a marked increased in the total residential floor area. Sectoral indicators Indicators have also been developed at a sectoral level. These reveal the contributions of specific economic and household activities to overall energy use for various IEA member countries. The sectors are industry, residential and transport, the last of which in turn is considered in two parts, passenger and freight.7 The analysis separates out the impact of energy efficiency measures from structural and activity effects that operate at a sectoral or sub-sectoral level (see Box 3.1). Industrial sector The energy efficiency indicator most commonly used for the industrial sector is total industrial energy consumption8 per unit of industry value-added.9 For 20 IEA member countries, this indicator shows that all countries improved their adjusted industrial energy intensity between 1990 and 2010 (Figure 3.11). Hungary, Luxembourg and Sweden have shown most improvement proportionally.
Figure 3.11 Industrial energy use per unit of value-added for 20 IEA member countries, 1990 and 2010
Note: MJ = megajoule. 7 The commercial sector is not included. 8 For this analysis, total industrial energy consumption includes energy use in coke oven and blast furnaces, but excludes energy use as feedstock in the chemical and petrochemical sectors. 9 Value-added is the net output of a sector after adding up all outputs and subtracting intermediate inputs. It is calculated without making deductions for depreciation of fabricated assets or depletion and degradation of natural resources (World Bank).
0
5
10
15
20
25
30
35
40
45
MJ
per 2
005
USD
PPP
1990 2010
© O
EC
D/IE
A, 2
013

WHAT THE NUMBERS SAY: ENERGY EFFICIENCY AND CHANGING ENERGY USE
ENERGY EFFICIENCY MARKET REPORT 2013 63
Box 3.1 Methodology: how decomposition analysis is used to identify the role of efficiency
The IEA methodology for analysing sectoral energy end-use trends in depth distinguishes between three main components affecting energy use:
• activity levels;
• structure (the mix of activities within a sector); and
• energy intensities (energy use per unit of sub-sectoral activity).
Depending on the sector, activity is a function of demand changes within a sector or sub-sector, measured as value-added, passenger-kilometres, tonne-kilometres or population (Table 3.1). Structure considers changes in the relative shares of the industrial sub-sectors, transport modes or types of residential end-use. Using an appropriate measure of end-use activity, adjusted energy intensities are then calculated for each of these sub-sectors, modes or end-uses. Changes in these adjusted energy intensities are used as proxies for changes in energy efficiency by separating out how changing energy intensities influence energy consumption for a particular sector. This is referred to in this chapter as the “efficiency effect”.
As an illustration, an increase in the number of kilometres travelled would be an activity change in the passenger transport sector, while an increase in the share of rail relative to car transport would represent a structural change. An improvement in the fuel economy of vehicles or an increase in the average occupancy per vehicle, accounting for their relative shares in passenger transport, would lead to a change in the efficiency effect.
At the national level, the efficiency effect is a composite of all adjusted intensity effects in sectors and sub-sectors, weighted accordingly (for example, see the decomposition shown in Figure 3.8).
In practice, the decomposition method calculates the relative impact on energy use that would have been expected to occur between a base year (usually 1990 in this chapter) and a future year (2010) if the aggregate activity levels and structure for a sector remained fixed at base year values while the adjusted energy intensity level followed its actual development. A similar approach – controlling two variables to estimate the impact of the third – is used to calculate the activity and structure effects.
The IEA uses the Laspeyres method of decomposition, see IEA (2007) for further details. Other decomposition methodologies, for example the logarithmic mean divisia index (LMDI), can yield different results. An important feature of the Laspeyres statistical method is that there is always a residual interaction term which is generally small and has little impact on the overall analysis. However, in a small number of cases interaction between structure and efficiency effects, and, consequently, the residual interaction term, can be significant. The result is a discrepancy between aggregate intensity changes and the sum of the effects of structure and efficiency changes. This helps to explain the discrepancy in the case of Hungary in Figure 3.10.
Aside from decomposition methodologies, other reasons why national statistics can show some deviation from the IEA indicator analysis include different definitions of sectors and sub-sectors and different levels of detail in the sub-sectoral analysis. US indicators analysis, for example, has greater resolution of energy end-use data for commercial buildings within the services sector (Belzer, 2013).
It should also be noted that at the national level, the efficiency effect – referred to as “aggregate intensity” in Figure 3.7 – is not the same as energy intensity (energy use per GDP) since the residential and transport sectors, which are included in the economy-wide efficiency indicator, do not have an economic measure of activity.
© O
EC
D/IE
A, 2
013

WHAT THE NUMBERS SAY: ENERGY EFFICIENCY AND CHANGING ENERGY USE
64 ENERGY EFFICIENCY MARKET REPORT 2013
Analysing the industrial sector as a whole, however, does not reveal important differences in the scale, composition or relative intensities of its sub-sectors. The paper, pulp and printing, chemicals, non-metallic minerals and primary metals industries are the most energy-intensive in the industrial sector.
Box 3.1 Methodology: how decomposition analysis is used to identify the role of efficiency (continued)
At the sectoral level, decomposition analysis presents a specific challenge for industry. Ideally, when calculating the efficiency effect for industry, change in the average energy use per unit of output from each industrial sub-sector would be used as a proxy for efficiency. However, the lack of homogeneity between the various industrial sub-sectors makes this average impractical, if not impossible, to calculate. Energy use per unit of economic value-added of each industrial sub-sector is used in its place. However, this measure may not always solely reflect technical improvements in efficiency as changes in the value-added of products within sub-sectors can influence the aggregate metric. The apparent reduction in efficiency in Austria in Figure 3.10 could be an example of this issue.
Table 3.1 Variables and metrics used for sectoral indicators
Sector Sub-sector Activity Structure* Adjusted intensity*
Residential
Space heating Population Floor area/population Space heating energy**/floor area
Water heating Population Population/ occupied dwellings
Water heating energy***/
occupied dwellings
Cooking Population Population/ occupied dwellings
Cooking energy***/ occupied dwellings
Lighting Population Floor area/population Lighting energy/floor area
Appliances Population Appliance ownership/ population
Appliance energy/ appliance ownership
Passenger transport
Car, bus, rail, domestic air
Passenger-kilometre
Share of passenger-kilometres
Energy/passenger-kilometres
Freight transport
Truck, rail, domestic shipping
Tonne-kilometre
Share of tonne-kilometres
Energy/ tonne-kilometre
Industry
Food, beverages and tobacco; paper, pulp
and printing; chemicals; non-metallic minerals; primary metals; metal
products and equipment; other industry
Value-added
Share of value-added
Energy/ value-added
Services Service Value-added
Share of value-added
Energy/ value-added
Other industries****
Agriculture and fishing, construction
Value-added
Share of value-added
Energy/ value-added
* Structure and adjusted intensity metrics are ratios, for example “total residential floor area divided by total population”.
** Adjusted for climate variations using heating degree-days.
*** Adjusted for household occupancy.
**** The following sectors are not included in the analysis: mining and quarrying; fuel processing; and electricity, gas and water supply. Industries in the category “Other industries” are analysed only to a very limited extent.
Source: IEA, 2007.
© O
EC
D/IE
A, 2
013

WHAT THE NUMBERS SAY: ENERGY EFFICIENCY AND CHANGING ENERGY USE
ENERGY EFFICIENCY MARKET REPORT 2013 65
All things being kept equal, a relative increase in production from these industries will have more of an impact on total energy consumption than other less energy-intensive industries. Disaggregation of the sectoral activity shows structural changes within the sector between 1990 and 2010 (Figure 3.12).
Figure 3.12 Composition of industrial value-added for 21 IEA member countries, 1990 (left) and 2010 (right)
Notes: the left-hand columns for Czech Republic and Slovak Republic represent 1993 and for Hungary represent 1991, the earliest years for which data are available. Consequently, the left-hand column for IEA 22 uses these data points in the aggregate shares. “Other industry” includes agriculture, fishing and construction.
The share of energy-intensive industries is a good predictor of a country’s industrial energy intensity. Countries showing improvement in industrial energy intensity generally experienced a decrease in the value-added share of their energy-intensive industries (for example, the share of paper, pulp and printing decreased notably in Finland, Japan, Sweden and the United States). Countries where the share of energy-intensive industries increased tend to have experienced a smaller decrease in industrial energy intensity (for example, Australia and Belgium). Despite the recent recession, which caused some upward pressure on energy intensity in many countries due to lower capacity utilisation rates, industrial energy intensity (energy use per dollar of value-added) fell by 1.7% between 1990 and 2010 for the 20 countries analysed (Figure 3.13). Around half of this improvement was due to energy efficiency. At a country level this split shows considerable variation; the large improvement in industrial energy intensity in Sweden, for example, is shown to have been largely driven by structural change. The overall contribution of energy efficiency was significantly lower than it was from 1974 to 1990, when numerous transformative technological developments were introduced in intensive industries, such as cement and aluminium production.
0%
20%
40%
60%
80%
100%
Other industry Metal products and equipmentFood, beverages and tobacco Primary metalsNon-metallic minerals ChemicalsPaper, pulp and printing
© O
EC
D/IE
A, 2
013

WHAT THE NUMBERS SAY: ENERGY EFFICIENCY AND CHANGING ENERGY USE
66 ENERGY EFFICIENCY MARKET REPORT 2013
Figure 3.13 Change in industrial energy intensity, decomposed into structure and efficiency effects for 20 IEA member countries, 1990-2010
Notes: aggregate intensity is a composite measure of energy use per unit of activity across different sub-sectors that each have their own individual measures. Differences between aggregate intensities and the sums of the effects of structure and efficency changes are due to methodological challenges. These challenges, and a possilbe explanation for Austria’s apparent reduction of industrial energy efficiency over the period, are described in Box 3.1.
Figure 3.14 Global potential savings from the adoption of BAT in the five most energy-intensive industries
Note: full technical potentials are shown based on energy consumption by these sectors in 2010. This illustration of overnight replacement benefits does not take into account the economic challenges or suitability of replacing infrastructure before the end of its life.
Source: IEA, 2012.
-7%
-6%
-5%
-4%
-3%
-2%
-1%
0%
1%
2%
Aver
age
annu
al c
hang
e
Efficiency effect Structure effect Aggregate intensity
0
20
40
60
80
100
120
140
0
1
2
3
4
5
6
Chemicals Iron and steel Cement Pulp and paper Aluminium
Mto
eEJ
© O
EC
D/IE
A, 2
013

WHAT THE NUMBERS SAY: ENERGY EFFICIENCY AND CHANGING ENERGY USE
ENERGY EFFICIENCY MARKET REPORT 2013 67
The industrial sector still shows considerable potential for further efficiency gains. The global application of best available technology (BAT) in the five most energy-intensive industries could reduce energy consumption by around 20%. The estimated savings for the five sectors are 16 EJ per year (Figure 3.14). The prevailing rates of stock turnover in the sector suggest that achieving this improvement would at best take several decades. In practice, the rate of implementation of BAT by industry is likely to depend on several factors, including, among other things, relative energy costs, raw material availability, equipment age, rate of return on investment and regulations. Residential sector Trends in residential energy consumption are influenced by various factors, notably the following: • population size and growth; • occupancy (i.e. number of inhabitants per dwelling); • climatic conditions; • dwelling size (i.e. house floor area); • the market penetration of appliances and other equipment; • consumer behaviour; and • household wealth.
Figure 3.15 Residential energy consumption by end-use for 20 IEA member countries, 1990 (left) and 2010 (right)
Note: lighting is included in appliances for Denmark, Hungary, and Japan; water heating is included in space heating for Denmark; lighting and cooking are included in appliances for the United States. Understanding the trends in residential energy consumption requires that these factors are included and controlled for in any analysis. For example, residential energy consumption is more than just a function of population growth, but also household structure and ownership of appliances.
0%
20%
40%
60%
80%
100%
Space heating Space cooling Water heating CookingLighting Appliances Non Specified
© O
EC
D/IE
A, 2
013

WHAT THE NUMBERS SAY: ENERGY EFFICIENCY AND CHANGING ENERGY USE
68 ENERGY EFFICIENCY MARKET REPORT 2013
For IEA member countries as a whole, residential energy consumption per capita increased by 0.2% per year on average between 1990 and 2010, while the population increased by 0.7% each year. Per-capita consumption trends differed between the first and second decades of this period. Between 1990 and 2000 residential energy consumption saw annual growth of 0.4%, leading to average consumption of 27 GJ per person (0.65 toe per person). By contrast, the period 2000-10 saw an average annual decrease of 0.07%, which reduced consumption by 0.2 GJ per person. This trend was not significantly affected by the financial crisis. Space heating represents the dominant demand for final energy consumption in the residential sector in most of the 20 IEA member countries analysed, with much of the difference between countries attributable to variations in climate and comfort requirements (Figure 3.15). However, heating’s share of energy consumption in the sector fell from 60% in 1990 to 53% in 2010. This reflects both an improvement in the way houses are heated – through higher-efficiency space heating equipment and improved thermal performance of new and existing dwellings – but also the rapid growth in energy consumption by household appliances.
Figure 3.16 Share of space heating by fuel for 22 IEA member countries, 1990 (left) and 2010 (right)
Notes: district heating is heat distributed from a central heating plant to buildings, factories, etc. “Renewables” includes combustible renewables and waste. “Other” includes geothermal and solar thermal.
In 22 IEA member countries analysed, the largest single fuel source for space heating is natural gas (Figure 3.16). Fuel shares vary significantly from country to country, however, and in Japan oil products remain the dominant fuel. Electricity represents only 8.9% of the total energy use for space heating in the countries analysed but is important for space heating in New Zealand, Norway and Sweden, consistent with access to large hydroelectric resources. In Denmark, Finland and Sweden, district thermal heating is the most important source of space heating.
0%
20%
40%
60%
80%
100%
Oil Natural gas Coal Renewables District heating Electricity Other
© O
EC
D/IE
A, 2
013

WHAT THE NUMBERS SAY: ENERGY EFFICIENCY AND CHANGING ENERGY USE
ENERGY EFFICIENCY MARKET REPORT 2013 69
By decomposing the changes in space heating per capita, it is possible to see which of the factors acted to increase or decrease demand in 20 IEA member countries. For most countries analysed, fewer occupants (occupancy effect) and larger homes (dwelling size effect) played a role in increasing demand for energy for space heating (Figure 3.17). This increase was offset by lower end-use conversion losses (related to changes in the energy mix for heating, rather than improvements in efficiency of equipment using specific fuels) and, more importantly, an improvement in energy efficiency, as measured by the useful intensity of space heating. The useful intensity effect can generally be assigned to mandatory efficiency standards for new heating equipment and, potentially, strengthening of buildings codes for new buildings.
Figure 3.17 Changes in space heating per capita, decomposed into contributing factors for 20 IEA member countries, 1990-2010
Notes: changes energy used for space heating per capita are decomposed into the factors which affect them: occupancy effect is an activity factor that represents the impact of changes in the number of persons per dwelling; dwelling size effect is a structural factor that represents the impact of changes in floor area per capita; fuel mix change effect is a structural factor that represents the impact of changes in the type of energy used for space heating; heating efficiency effect refers to the impact of changes in the intensity of energy use per floor area per capita, adjusted for climate variations using heating degree-days. Water heating is included in space heating for Denmark.
Transport sector Analysis of the transport sector requires differentiation between passenger and freight transport. The influences on these two forms of transport differ, as do the vehicles and modes that are used; passenger transport is dominated by cars and buses, whereas freight transport is dominated by truck and rail. In addition, as described in subsequent sections, government policies typically employ distinct policy tools to address fuel efficiency.
-5%
-4%
-3%
-2%
-1%
0%
1%
2%
3%
Aver
age
annu
al c
hang
e
Fuel mix change effect Dwelling size effect Occupancy effectHeating efficiency effect Space heating per capita
© O
EC
D/IE
A, 2
013

WHAT THE NUMBERS SAY: ENERGY EFFICIENCY AND CHANGING ENERGY USE
70 ENERGY EFFICIENCY MARKET REPORT 2013
Passenger transport
Global passenger transport, measured in passenger-kilometres, increased by more than 50% between 1990 and 2010, according to the IEA mobility model database. Most of the growth was in non-IEA countries, with the collective increase in the 20 analysed IEA member countries close to 33%. Despite the overall increase in passenger-kilometres, the energy intensity of passenger transport, measured as the ratio of energy used per passenger-kilometre travelled, decreased in 16 out of the 20 IEA member countries between 1990 and 2010 (Figure 3.18).
Figure 3.18 Energy per passenger-kilometre for 20 IEA member countries, 1990 and 2010
Note: pkm = passenger-kilometre.
This metric reflects much more than technological energy efficiency improvements of different transport modes, as it also includes the efficiency impacts of modal shifts and changes in average occupancy rates. The increases in the energy intensities of passenger transport in Denmark, Japan and the Netherlands reflect reductions in the occupancy rates of light-duty vehicles. In Japan average occupancy rates fell 22% to 1.59 persons per vehicle between 1990 and 2010. Different transport modes measured by this metric have very different efficiencies, which is often a result of load factors. Mass transport modes, such as public buses and trains, have average efficiencies that are on average four times higher, respectively, than transport using passenger light-duty vehicles in the 20 IEA member countries. Average light-duty vehicle efficiency per passenger-kilometre is comparable with that of aircraft (IEA, 2009). The modal variation in passenger transport among IEA member countries is much less diverse than for freight transport. In all of the 22 countries analysed, motorised passenger transport is dominated by passenger cars, accounting for about 80% of all passenger-kilometres travelled (Figure 3.19). Japan and the Czech Republic are exceptions, with passenger cars having a somewhat lower share of passenger-kilometres (60%). The modal split of domestic passenger transport is generally a function of country size and existing transport infrastructure, which helps to explain the rise in air travel in Australia, Canada and the United States between 1990 and 2010.
0.0
0.5
1.0
1.5
2.0
2.5
3.0
MJ/
pkm
1990 2010
© O
EC
D/IE
A, 2
013

WHAT THE NUMBERS SAY: ENERGY EFFICIENCY AND CHANGING ENERGY USE
ENERGY EFFICIENCY MARKET REPORT 2013 71
Figure 3.19 Share of total passenger-kilometres by mode for 22 IEA member countries, 1990 (left) and 2010 (right)
Note: the left-hand column for Czech Republic represents 1995 and for Slovak Republic represents 1993, the earliest years for which data are available. Consequently, the left-hand column for IEA 22 uses these data points in the aggregate shares.
Figure 3.20 Trends in new-car fuel efficiency for 15 IEA member countries, 1990-2010
* Due to different test cycles to measure fuel economy, data for the United States, Canada and Japan are not directly comparable with the other countries.
Sources: GFEI, 2013; IEA Mobility Model (MoMo) databases.
0%
20%
40%
60%
80%
100%
Light-duty vehicles Buses Rail Aviation Ships
0
2
4
6
8
10
12
14
LGE/
100
km
1990 1995 2000 2005 2010
© O
EC
D/IE
A, 2
013

WHAT THE NUMBERS SAY: ENERGY EFFICIENCY AND CHANGING ENERGY USE
72 ENERGY EFFICIENCY MARKET REPORT 2013
Light-duty vehicles (including passenger cars) experienced an increase in percentage share in only eight countries. In certain larger countries, the share of passenger car travel decreased due to increased shares of domestic air travel, while others saw increases in rail travel. The shares of passenger rail and bus transport in the 22 countries in aggregate remained relatively constant, with a slight increase for buses and a slight decrease for rail. These modal choices affect the efficiency of passenger transport. Lower efficiencies often correlate with higher shares of air transport, for example in Australia and the United States. Higher passenger transport energy efficiencies generally correlate with higher shares of rail transport, for example in France and Japan. It should be noted that the absence of non-domestic aviation data from the indicators database is likely to positively influence the relative efficiency indicator for passenger transport in, for example, European countries. Average fuel economy of new vehicles differs greatly across the 14 analysed IEA member countries, ranging from 9.2 litres of gasoline-equivalent per 100 km (LGE/100 km) in Australia and 5.3 LGE/100 km in Denmark in 2010 (Figure 3.20). In all countries, the fuel economy of new vehicles improved significantly between 1990 and 2010, with rates of reduction between 11% in the United States and 38% in Denmark. The average fuel economy of new vehicles, weighted by market size, improved by almost 20%, averaged across the selected countries. The introduction of mandatory fuel economy standards, especially in the United States, Japan and Europe, will continue to be a major driver of this trend in light-duty vehicle markets. Fuel efficiency of passenger cars has improved faster than for freight trucks. Freight transport
Freight transport is one of the fastest-growing energy-using sectors. Globally, the number of tonne-kilometres transported increased by more than 60% between 1990 and 2010, according to the IEA mobility model database. The 20 IEA member countries analysed experienced an increase of 35% over the same period. A common indicator for energy efficiency of the freight transport sector is energy used per tonne-kilometre. In aggregate, the 20 analysed IEA member countries showed a slight improvement in freight transport energy intensity between 1990 and 2010 (Figure 3.21). Of the 20 countries, 8 showed an improvement in this metric. The energy efficiency of freight transport comprises all freight transport modes and so not only reflects technological improvement, but also shifts between modes and changes in load factors.10 Different transport modes have very different energy efficiencies. Ships are on average between half and one order of magnitude more fuel-efficient than rail freight, which is in turn another order of magnitude more efficient than road freight. Differences between countries’ efficiencies also reflect the ratio of weight and volume of the “average good” transported. The sector displays considerable regional variability with respect to transport modes (Figure 3.22). This variability reflects the weight, size and value of the goods transported, as well as distance, available infrastructure and fuel costs. In European countries, freight transport is generally dominated by road freight. In the United States, Canada and Australia, where bulk goods including coal, wheat and metal ores are carried over long distances, rail freight takes a higher share.
10 The extent to which the full capacity of the vehicle is utilised.
© O
EC
D/IE
A, 2
013

WHAT THE NUMBERS SAY: ENERGY EFFICIENCY AND CHANGING ENERGY USE
ENERGY EFFICIENCY MARKET REPORT 2013 73
Figure 3.21 Freight transport energy per tonne-kilometre for 20 IEA member countries, 1990 (left) and 2010 (right)
Notes: tkm = tonne-kilometre. water transport is excluded for Denmark, Finland, Greece, Portugal and Switzerland due to lack of data.
Figure 3.22 Share of tonne-kilometres by transport mode for 24 IEA member countries, 1990 (left) and 2010 (right)
Notes: tonne-kilometre data for water transport are not available for Denmark, Finland, Greece and Portugal. The left-hand column for Czech Republic represents 1993, the earliest years for which data is available. Consequently, the left-hand column for IEA 24 uses this data point in the aggregate shares. “Other” includes water and domestic air transport.
0.00.51.01.52.02.53.03.54.04.55.0
MJ/
tkm
1990 2010
0%
20%
40%
60%
80%
100%
Trucks Rail Other
© O
EC
D/IE
A, 2
013

WHAT THE NUMBERS SAY: ENERGY EFFICIENCY AND CHANGING ENERGY USE
74 ENERGY EFFICIENCY MARKET REPORT 2013
For 20 out of the 24 countries analysed, the share of road freight increased between 1990 and 2010 despite it being the least efficient of the three freight transport modes. This modal shift helps to explain many of the reductions in overall efficiency seen for individual countries in Figure 3.21. In France and Austria this was at the expense of rail freight, whereas in the United States and the United Kingdom, shipping’s share declined. Countries with higher shares of rail freight, especially those using long length trains, show better freight transport efficiencies than those countries with very high shares of road freight transport. In addition, large countries with a high share of primary industries, such as Australia, have more efficient road freight fleets due to the high load factors and large vehicles. Freight transport efficiency decreased in more than half of the analysed 24 countries. The aggregate efficiency of road freight across 20 IEA member countries has improved over time, reflecting improvements at a national level in more than half of the countries (Figure 3.23). Improvements in logistics and increasing truck fuel efficiency are key factors behind this trend. Nearly half the IEA member countries in Figure 3.23 saw little or no increase in road freight efficiencies. This is likely related to changes in the goods transported as well as the fuel efficiency of trucks. A shift towards higher value but lower weight products tends to decrease the load factor of trucks, and may increase the share of empty trucks, reducing overall efficiency. Improved logistics can counter shifts towards lower load factors and more empty or partially loaded running trucks. Recent and planned developments of fuel efficiency standards for freight vehicles in several countries are likely to further contribute to this pattern.
Figure 3.23 Trends in truck freight energy intensity for 20 IEA member countries, 1990-2010
Conclusions Almost all IEA member countries have increased the amount of GDP generated for per unit of energy supply over the last ten years. Countries with higher than average per-capita energy supply have generally been converging towards the IEA average. More detailed analysis of the various factors that influence energy use, including energy efficiency, shows progress in energy efficiency at national and sectoral levels.
0
1
2
3
4
5
6
LGE/
100
km
1990 1995 2000 2005 2010
© O
EC
D/IE
A, 2
013

WHAT THE NUMBERS SAY: ENERGY EFFICIENCY AND CHANGING ENERGY USE
ENERGY EFFICIENCY MARKET REPORT 2013 75
Energy efficiency indicators reveal trends and impacts that cannot be observed without the use of detailed analytical methods, such as decomposition analysis. Such analysis reveals that energy efficiency investments have already delivered reductions in energy demand that exceed the output of any other fuel source in many IEA member countries. This points to energy efficiency being not just a hidden fuel, but in fact, the “first fuel”. Energy efficiency investments have contributed over half the increase in the amount of GDP generated per unit of energy supplied across 15 member IEA countries, a greater contribution than structural effects. However, looking at progress over the whole period since 1973, the positive impact of energy efficiency on total final consumption has diminished.11 It is difficult to attribute this slowing of the rise in impact of the efficiency effect to any particular cause without considerable further analysis; yet understanding and, potentially, reversing this trend may be important for achieving climate change mitigation objectives, especially if fossil fuels continue to dominate primary energy supplies. Indicators are an important tool for tracking energy efficiency market outcomes. Improving our understanding of how efficiency drives changes in energy consumption patterns is invaluable to policy makers and other stakeholders, highlighting where efficiency measures are delivering positive impacts and where there is room for improvement. This understanding can help improve the design and implementation of effective energy efficiency policies and programmes, which, in a virtuous cycle, catalyse responses in the energy efficiency market that further improve and reorient energy efficiency gains. In many cases, energy efficiency indicators can also be employed directly by the private sector to help benchmark corporate performance and reduce information costs, thereby helping realise the benefits of improved energy efficiency. References Belzer, D. (2013), A Comprehensive System of Energy Intensity Indicators for the US: Methods, Data and Key Trends, Pacific Northwest National Laboratory, prepared for US Department of Energy, Richland. GFEI (Global Fuel Economy Initiative) (2013), International Comparison of Light-Duty Vehicle Fuel Economy: An Update Using 2010 and 2011 New Registration Data, GFEI, London. IEA (International Energy Agency) (2007), Energy Use in the New Millennium: Trends in IEA Countries, IEA/OECD, Paris. IEA (2009), Transport, Energy and CO2: Moving Towards Sustainability, IEA/OECD, Paris. IEA (2011), IEA Scoreboard 2011 - Implementing Energy Efficiency Policy: Progress and Challenges in IEA Member Countries, IEA/OECD, Paris. IEA (2012), Energy Technology Perspectives 2012: Pathways to a Clean Energy System, IEA/OECD, Paris. Reuters (2011), “Average Offshore Rig Now 24 years Old”, press release, Thomson Reuters, 31 March. UN (United Nations) (2013), Global Tracking Framework, UN Sustainable Energy for All, website, www.sustainableenergyforall.org/tracking-progress.
11 The proportion of additional TFC that would have been consumed had it not been for energy efficiency improvements reduced from an annual average of 2% between 1974 and 1990 to 0.5% between 1990 and 2000 and 1.1% between 2000 and 2010.
© O
EC
D/IE
A, 2
013

TECHNOLOGY FOCUS: APPLIANCES, LIGHTING AND ICT
76 ENERGY EFFICIENCY MARKET REPORT 2013
4. TECHNOLOGY FOCUS: APPLIANCES, LIGHTING AND ICT Energy efficiency has become a significant driver in equipment markets: standards and labelling policies have transformed appliances and lighting, while information and communications technology (ICT) is positioned to enable energy savings across a variety of sectors and systems. ICT equipment and infrastructure are being deployed rapidly around the world, and appliances and lighting markets are growing steadily in emerging economies; a focus on energy efficiency is key to constraining the growing energy consumption of these technologies. This chapter provides an overview of the appliance, lighting and ICT markets, describes the impact that standards and labelling policies have had in transforming them (using the examples of the United States, the European Union and Korea), highlights the challenges and opportunities in the ICT sector, and assesses prospects for energy efficiency market growth. Trends in global appliance, lighting and ICT markets The value of the global home appliance market is expected to reach USD 295 billion in 2013, a 5% increase from USD 281 billion in 2012 (Marketline, 2012). Production levels for different product categories in 2010 and 2011 show that audio-visual equipment and home appliances had only marginal growth and although demand for these products is increasing in emerging economies, global production forecasts are relatively flat (Figure 4.1). However, strong demand is projected for ICT equipment, where the relatively short lifecycles of mobile telephones and laptops, and rapid product development, ensure frequent replacement levels.
Figure 4.1 Global appliance and ICT production forecast, 2010-17
Source: Fuji Chimera Research Institute, 2012.
The ICT market has rapidly moved beyond the desktop age, to a reality where networked information processing and data storage and access are integrated into everyday objects and activities (Figure 4.2). This transformation presents both a challenge in ensuring that ICT products, services and infrastructure incorporate robust energy efficiency norms, as well as the opportunity for using ICT to better manage energy use.
0
500
1 000
1 500
2 000
2 500
3 000
2010 2011 2012 2013 2014 2015 2016 2017
Mill
ion
units
Audiovisualequipment
Home appliances
ICT equipment
© O
EC
D/IE
A, 2
013

TECHNOLOGY FOCUS: APPLIANCES, LIGHTING AND ICT
ENERGY EFFICIENCY MARKET REPORT 2013 77
Figure 4.2 The expanding scope of networked technologies
Note: GPS = global positioning system; SCADA = supervisory control and data acquisition control system.
Figure 4.3 Network-connected-product shipment forecast
Notes: data for 2013-17 are forecasts. Home gateways connect a home’s local area network to the internet.
Sources: IDC, 2013; IEA estimates.
The deployment of network equipment, such as servers and modems, as well as network-connected products, including appliances, computers, telephones, televisions and imaging equipment, is growing
AppliancesWhiteware, lighting, kitchen
appliances, health products, power tools…
CommunicationsServer and broadband systems, cloud
data storage, smart phones, tablets, WIFI, GPS…
ControlBuilding
management systems,
SCADA, smart sensors, logistics
management, traffic controls,
condition monitoring…
MediaTVs, radio,
audio, computing,
imaging equipment, gaming…
Increasing network
connectivity
Smart grids, smart meters…
Internet TV, online entertainment, gaming and movies…
Smart TVs, Internet, video displays in appliances…
Integrated home networks, home gateways, lighting controls, smart appliances, Nest Thermostats, green buttons…
0
50
100
150
200
250
300
350
400
Mill
ion
units Desktop PCs
Laptops
Tablets
Games consoles
Networked audio
Home gateways and thin clients
Set-top boxes
© O
EC
D/IE
A, 2
013

TECHNOLOGY FOCUS: APPLIANCES, LIGHTING AND ICT
78 ENERGY EFFICIENCY MARKET REPORT 2013
rapidly (Figure 4.3). In 2012, worldwide shipments of network-connected devices exceeded 1 billion units, representing a value of USD 676.9 billion and 29% growth year-on-year (IDC, 2013). On average, each US home has four network-connected products today; this is expected to increase to 16 products per home by 2015 (GSMA, 2011). Total worldwide consumer spending on ICT was estimated at USD 4 406 billion in 2012 (OECD, 2012). Of this, 58% (USD 2 572 billion) was spent on communication services and equipment, 21% on computer services, 12% on computer hardware and 9% on software. The consumer segment accounted for 33% of ICT spending in 2012 (OECD, 2012). The ICT sector is attracting venture capital, accounting for more than 50% of all venture capital in the United States in 2011. At the same time, ICT research and development (R&D) investment is growing, with Korea and Finland, for example, investing over 1.5% of their gross domestic product in this sector (OECD, 2012). ICT is rapidly changing the market for appliances. Despite static forecasts for much of the appliance and equipment market, the smart appliance market is expanding apace: its value is projected to grow from USD 40 million in 2010 to USD 26 billion by 2019 (Figure 4.4) (Intertek, 2011). With an increasing number of home appliances able to connect wirelessly to the internet, similar to smartphones, tablets and other devices, there are significant energy efficiency opportunities and implications for the conventional market for refrigerators, washers, dryers, dishwashers and ovens.
Figure 4.4 Smart appliance global market value, 2010-19
Source: Intertek, 2011.
The value of the global lighting market was estimated at EUR 73 billion in 2011. General lighting1 is the largest lighting market, with total market revenues of approximately EUR 55 billion in 2011. The automotive lighting market is estimated at EUR 14 billion and the backlighting market had estimated revenues of almost EUR 4 billion in 2011 (McKinsey, 2012).
1 The three major sectors in lighting are general lighting, automotive lighting and backlighting. Key backlighting applications include illumination for television, computer and mobile device screens, where a fluorescent or light-emitting diode array provides the illumination for a liquid crystal display (LCD).
40 509 9842 150
3 7726 266
9 773
14 597
19 942
26 149
0
5 000
10 000
15 000
20 000
25 000
30 000
USD
mill
ion
© O
EC
D/IE
A, 2
013

TECHNOLOGY FOCUS: APPLIANCES, LIGHTING AND ICT
ENERGY EFFICIENCY MARKET REPORT 2013 79
Asia has the largest market in both total general lighting and light-emitting diode (LED) lighting, with current revenues of over EUR 20 billion and EUR 1.5 billion respectively (Figure 4.5). China’s general lighting market is expected to reach EUR 13 billion by 2016 (41% of Asia’s and 17% of the global market), and its LED general lighting market to be EUR 11 billion by 2020 (42% of Asia’s and 20% of the global revenues) (McKinsey, 2012).
Figure 4.5 Projection of general lighting market expansion by region
Source: McKinsey, 2012.
Figure 4.6 Lighting market penetration by technology: total worldwide lighting stock
Note: CFL = compact fluorescent lamp; HID = high-intensity discharge lamp.
Source: Cleantech Group and Canaccord Genuity Analysis, 2011.
Incandescent lighting still comprised more than 30% of general lighting stock in 2011, but this share is expected to decrease gradually (Figure 4.6). In 2011, LED lamps only had a 10% share of the lighting market, but it is expected to grow fast due to rapid price reductions. McKinsey (2012) anticipates the LED lighting market to grow to a value of around EUR 37 billion in 2016 and EUR 64 billion in 2020, effectively doubling every four years.
3 4 44 5 612
1519
10
1519
12
14
1515
19
20
0
10
20
30
40
50
60
70
80
90
2011 2016 2020
EUR
bill
ion
Europe
North America
China
Asia (excl. China)
Latin America
Middle East and Africa
2011 2012 2013 2014
100%90%80%70%60%50%40%30%20%10%
0%
Incandescent CFL Fluorescent HID LED
Pene
trat
ion
© O
EC
D/IE
A, 2
013

TECHNOLOGY FOCUS: APPLIANCES, LIGHTING AND ICT
80 ENERGY EFFICIENCY MARKET REPORT 2013
Market transformation towards greater efficiency in appliances and lighting The two principal energy efficiency policies that target market transformation in equipment markets are standards and labelling. Energy efficiency standards restrict the market to those products that meet the prescribed minimum energy performance standard. By requiring all products in the market to be more energy-efficient, standards can shift the market towards greater efficiency, create level playing fields for industry, and automatically influence investment and purchasing decisions relating to energy-efficient products. Energy labels supplement standards by informing consumers about the energy performance of a product and the benefits of highly efficient products. They can push the market to efficiency levels even higher than those prescribed by the minimum standards.
Figure 4.7 Market transformation of products due to implementation of standards and labels
Source: Yanti and Mahlia, 2009.
Figure 4.7 illustrates the process of market transformation and product distribution resulting from standards and labelling policies. The average efficiency of appliances from the first curve (baseline average efficiency) is pushed towards the second curve (standards average efficiency) after implementation of standards. The distribution is pushed by the standards towards greater efficiency in the year the standards are implemented. Introducing energy labels encourages the availability of even more efficient product in the market. Therefore, the product distribution is represented by three curves, which are the baseline, minimum energy efficiency standards and higher efficiency results tied in part to energy labels (Yanti and Mahlia, 2009). Together, these policies drive markets towards higher-efficiency products. Such market transformation can be enhanced by policies that phase out highly inefficient products, such as incandescent lamps, or policies that subsidise the commercialisation of highly efficient products (e.g. efficient lamp subsidies). McKinsey (2012) suggests that a major shift to more efficient appliances in the future would create large economies of scale that would ensure limited – or even no – additional cost to end-users. Market impacts of standards and labelling
Energy efficiency standards and labelling programmes for appliances and equipment have been adopted by more than 75 countries (Clean Energy Solutions Centre, 2012). While sales of appliances and equipment are stagnant in Europe, economies such as China, Russia, Turkey, India, Indonesia and Brazil are seeing an increase both in production and sales of appliances and equipment (Fuji Keizai Group, 2013). Applying stronger energy efficiency regulations before product sales expand in those economies will have a strong impact on the future appliance and equipment stock and will transform their markets. An example from China shows how standards policies can quickly shift markets (Table 4.1).
Labels
Eliminated from the market
Improving product efficiency
Num
ber o
f pro
duct
s
Current efficiency
Standards
© O
EC
D/IE
A, 2
013

TECHNOLOGY FOCUS: APPLIANCES, LIGHTING AND ICT
ENERGY EFFICIENCY MARKET REPORT 2013 81
Table 4.1 Projected market share by label efficiency category in China
2008 2012 2020
Frozen efficiency (baseline case)
Super Efficient 27% 19% 19% Efficient 61% 61% 61% Ordinary 13% 20% 20%
Market transformation case Super Efficient 27% 33% 79%
Efficient 61% 60% 20% Ordinary 13% 7% 2%
Note: the market transformation case evaluation draws upon the market transformation experience of the related EU energy information label, for which quantitative assessments of its market impact exist. By assuming a parallel process unfolding in China, it is possible to estimate the potential impact of labels to 2020.
Source: Ernest Orlando Lawrence Berkeley National Laboratory, 2008.
The avoided energy demand potential from standards and labelling Efficiency standards currently in place in Australia, Canada, the European Union, India, Japan, Korea, Mexico, Russia, South Africa and the United States are projected to reduce annual electricity consumption by about 150 terawatt hours (TWh) and annual primary energy consumption by 1 500 petajoules (PJ) by 2030 (Table 4.2) (SEAD, 2011). These measures could save about USD 10 billion per year in net energy-related expenditure (i.e. reduced energy expenditure minus the additional cost of higher-efficiency equipment).
Table 4.2 Estimated annual savings in 2030 in SEAD economies
Current measures*
Finalised measures**
Best practice energy efficiency
potential***
Portion of potential under development****
Electricity savings 150 TWh/yr 80 TWh/yr 1 800 TWh/yr 170 TWh/yr Primary energy savings 1 500 PJ/yr 1 000 PJ/yr 21 000 PJ/yr 3 600 PJ/yr Net savings on energy-related expenditure***** USD 11 billion/yr USD 7 billion/yr USD 150 billion/yr USD 22 billion/yr
* Measures put into effect between January 2010 and April 2011.
** Measures finalised between January 2010 and April 2011 but not yet put into effect.
*** Potential energy efficiency savings if all SEAD partners were to adopt the most stringent standards currently implemented around the world.
**** Portion of best practice energy efficiency potential in SEAD member economies attributable to products with energy efficiency standards under development as of April 2011.
***** Taking into account an estimate of the higher initial cost of more efficient products.
Note: Super-efficient Equipment and Appliance Deployment (SEAD) Initiative members are Australia, Brazil, Canada, the European Commission, France, Germany, India, Japan, Korea, Mexico, Russia, South Africa, Sweden, the United Arab Emirates, the United Kingdom and the United States.
Source: SEAD, 2011.
The potential for further reductions in energy demand by raising the efficiency of products sold in these countries to world-best levels, and using other policy levers to sustain progress, could reduce annual demand for electricity by 1 800 TWh in 2030 (about two-thirds of 2007 electricity consumption in the European Union). It would also conserve 21 000 PJ per year of primary energy and lead to a net saving of nearly USD 150 billion per year on energy-related expenditure. Appliance and equipment efficiency standards currently under development by these countries cover product categories that would deliver nearly 10% of those potential electricity savings, and around 15% of the primary energy and financial savings (SEAD, 2011).
© O
EC
D/IE
A, 2
013

TECHNOLOGY FOCUS: APPLIANCES, LIGHTING AND ICT
82 ENERGY EFFICIENCY MARKET REPORT 2013
In the lighting sector, efficient lighting can have important benefits: in the United States alone, cutting the energy used by lighting by 40% would save USD 53 billion in annual energy costs and reduce energy demand by an amount equivalent to 198 medium-sized power stations (The Climate Group, 2012; IEA, 2011). The United States, the European Union and Korea provide interesting examples of the impacts of standards and labelling. United States
All major home appliances must meet the appliance standards set by the US Department of Energy (DoE). Manufacturers must use standard test procedures that are regulated by the DoE to verify the efficiency and technical performance of their products. ENERGY STAR, on the other hand, is a US Environmental Protection Agency (EPA) voluntary programme. The ENERGY STAR label indicates that a product has been third-party tested to be energy-efficient. For appliances, the stringency level that a product must reach varies: an ENERGY STAR certified dishwasher, for example, must be 10% more efficient than the least efficient unit, while washing machines must be 37% more efficient to be ENERGY STAR certified. The EPA (2012) estimates that over 85% of consumers recognise the ENERGY STAR label. The sale of ENERGY STAR certified products has increased significantly since 1993 across all sectors (Figure 4.8).
Figure 4.8 Sales of ENERGY STAR certified products since 1993
* Lighting category means light fixtures (not light bulbs).
Note: HVAC = heating, ventilation and air conditioning.
Source: Energy Star, 2012.
Home electronics
HVAC and other
Home office equipment
Appliances
Office equipment
Lighting*
Units
purc
hase
d (b
illion
)
© O
EC
D/IE
A, 2
013

TECHNOLOGY FOCUS: APPLIANCES, LIGHTING AND ICT
ENERGY EFFICIENCY MARKET REPORT 2013 83
European Union
EU product policy has been under development since the 1990s and now covers a number of energy-using products that are sold in the EU market. Annual energy savings resulting from the standards and labelling regulations are estimated to reach 90 Mtoe by 2020. The regulations fall under the umbrella of two key directives: • The Ecodesign Directive of 2005 provides the framework to set mandatory minimum energy
efficiency requirements at the EU level for household appliances and for professional and commercial equipment. In 2009, the scope of the directive was enlarged from energy-using products to include energy-related products, such as windows. By the end of 2012, 16 product groups2 were regulated and regulations for another six product groups are expected to be finalised before the end of 2013.3 Voluntary agreements address minimum energy efficiency requirements for two further product groups4 and there are standby energy use requirements for a large range of appliances.
• A harmonised EU framework for energy labelling of household appliances has been in place since 1979 and became mandatory in all EU member states from 1992. In 2010, the scope of the Energy Labelling Directive was expanded to include energy-related products. At present, nine product groups have energy labels.5 The ENERGY STAR label and a voluntary ecolabel for the best-performing appliances according to a range of environmental criteria have also been implemented. The European Union’s labelling scheme has had a significant impact on the appliance market, with the vast majority of domestic appliances (washing machines, dishwashers, and cooling and freezing appliances) rated A or above (Figure 4.9).
Figure 4.9 Energy efficiency classes of domestic appliances sales in the European Union, 2011
Source: Bertoldi et al., 2012.
During the June 2013 EU Sustainable Energy Week, the European Commission’s Director General for Energy proposed a new energy labelling concept that would move away from the rather cumbersome 2 Household tumble driers, air circulators, water pumps, air conditioners and comfort fans, industrial fans, household dishwashers, household washing machines, directional lamps and LED lamps, fluorescent lamps, non-directional household lamps, refrigerators and freezers, televisions, electric motors, external power supplies, simple set-top boxes and hot water boilers. 3 At least for vacuum cleaners, computers, space heaters and water heaters. 4 Complex set-top boxes and imaging equipment. 5 Electrical lamps and luminaires, household tumble driers, air conditioners, household dishwashers, household washing machines, household refrigerating appliances, televisions, household electric ovens and household combined washer-driers.
2% 3% 5%
67%80% 87%
47% 36%
21%8% 4%
43%46%
6% 6% 8% 10%4%
Total Washing machines
Dishwashers Cooling Freezers
A+++
A++
A+
A
B
C
D
E to G
© O
EC
D/IE
A, 2
013

TECHNOLOGY FOCUS: APPLIANCES, LIGHTING AND ICT
84 ENERGY EFFICIENCY MARKET REPORT 2013
product-based relative efficiency labels (e.g. A+++) and towards a simple three-tier scheme, endorsing higher-efficiency products in a similar way to the labelling schemes in the United States (ENERGY STAR) and Japan (Top Runner). Korea
In Korea, three programmes drive the energy efficiency market using standards and labelling: the Energy Efficiency Label and Standard Programme, the High-efficiency Appliance Certification Programme and the e-Standby Programme (Table 4.3). Tremendous pressure is placed on appliance and equipment manufacturers to produce more energy-efficient products due to intense competition and regularly updated government regulations. The amount of first (highest efficiency) to fifth (lowest efficiency) grade products varies from year to year, depending on when standards are tightened. The absolute efficiency of all appliances has steadily improved over time due to this process of continuous increase in standard stringency.
Table 4.3 Appliance and equipment efficiency programmes in Korea
Programme Policy type Target products Rating Market impacts
Energy Efficiency Label and Standard Programme
Mandatory MEPS
35 products, including refrigerators, freezers, kimchi refrigerators, air conditioners,
washing machines.
Rating from 1 to 5, with 1 most
efficient and 5 representing the
MEPS.
Highest-rated refrigeration, air
conditioners, rice cookers and wet goods took 40%
market share in 2011.
High-efficiency Appliance Certification Programme
Voluntary
Certifies products that are most efficient in a given product
category. 44 products, including sensor lighting equipment, heat
recovery ventilators, pumps, centrifugal screw chillers.
- Sales increased
32.9% from 2010 to 2011.
e-Standby Programme Voluntary
Reduced standby power products. 22 products, including
computers, monitors, printers, fax machines, copiers, scanners,
multi-function devices.
- -
Notes: MEPS = minimum energy performance standard. Target product numbers are as of June 2013.
Sources: MOTIE and KEMCO, (2010); KEMCO, 2012.
The opportunities and challenges of ICT markets From an energy use and efficiency perspective, the incredible growth in network connectivity creates both challenges and opportunities. ICT-based products and services can be used to optimise the efficiency of energy use, such as in smart grids and smart homes. However, the associated expansion in network connectivity comes with an energy penalty: ICT products and services are consuming a growing amount of energy on aggregate levels. Improving the energy efficiency of ICT-based products and services Data centres already account for 2% of global electricity consumption (Emerson Network Power, 2011), and the amount of data collected, transmitted and stored globally (1.8 trillion gigabytes in 2011) doubles every 18 months (McKinsey, 2011). The rapid increase in the use of ICT devices and the growing quantity and speed of digital traffic data requires a significant increase in energy-consuming network infrastructure, such as data centres and routers (The Climate Group, 2008).
© O
EC
D/IE
A, 2
013

TECHNOLOGY FOCUS: APPLIANCES, LIGHTING AND ICT
ENERGY EFFICIENCY MARKET REPORT 2013 85
A large proportion of energy consumption for ICT products and services is used to maintain data transmission capacity; up to 90% of energy is consumed even when no data is being sent. There are significant energy savings potentials in reducing electricity losses and energy requirements for cooling. Increasing the computing power per watt, i.e. replacing inefficient servers with units that are more efficient and use less power, also holds potential for reducing energy consumption. Full savings potentials can only be unlocked through holistic approaches that cover re-design of networks, communication protocols, software and hardware. The IEA estimates that through integrated approaches, savings potentials in the region of 60% or more are possible. Further work is required to ensure that the energy consumption of ICT products and services does not outweigh the potential energy savings enabled by ICT. ICT: enabling energy efficiency in other sectors ICT can play a crucial role in enabling energy efficiency. According to SBI Energy (2010), the global value of energy efficiency gains that could be generated by energy-smart ICT products and solutions across all sectors is projected to grow from USD 170 billion in 2010 to over USD 478 billion in 2015. Key sectors where ICT is expected to have a major impact on energy efficiency include: transport and logistics; industry; the power, commercial and public sectors; and cross-cutting segments such as buildings. There are also opportunities in enabling systems-wide energy efficiency in whole districts or cities. Two key opportunities lie within the residential sector (smart homes and smart devices), and in the power system management sector (smart grids and smart meters). Smart homes and smart home devices
The market for smart home products and services will see dramatic growth over the next few years, as an expanding internet protocol (IP) infrastructure combined with smart mobile devices, cloud applications and services and sensor network technologies allow consumers to exploit opportunities for more intelligent management of energy use (Box 4.1). High network connectivity rates, the emergence of modular, out-of-the-box systems, and the steadily decreasing cost of installing smart technologies in the home, are opening up demand from the mainstream consumer segment. With nearly 70 million households in the United States already connected to networks, the potential for growth is high. In 2010, Europe’s smart home market, including products, system integration (design, installation, wiring, customised programming, etc.) and installation labour, was valued at EUR 529.6 million, an 18% increase from EUR 448.3 million in 2008 (BSRIA, 2012). Smart home business models are evolving rapidly, with new powerful entrants into smart homes and home energy management, including broadband providers, wireless providers, utility companies, consumer electronics manufacturers and retail outlets. Increasingly, television service providers are expanding their services into energy management. Research from Strategy Analytics suggests there will be three million television service subscribers using smart home applications in the United States alone by 2015, with revenues set to exceed USD 5 billion (Adams, 2011). Meanwhile, traditional security and home automation suppliers, distributors and dealers are developing new business models. New building construction represents a significant potential for growth: smart home systems are most cost-effective when incorporated into the building design. In Korea, over 60% of 10 million new households are expected to have home networks, while in China construction of 36 million new urban homes with building automation and smart meter technologies is planned between 2011 and 2015
© O
EC
D/IE
A, 2
013

TECHNOLOGY FOCUS: APPLIANCES, LIGHTING AND ICT
86 ENERGY EFFICIENCY MARKET REPORT 2013
(MKE/KEMCO, 2010; GSMA, 2011). As part of its smart grid deployment stimulus, the US government is planning the deployment of 170 000 smart thermostats and 175 000 other load control devices to enable consumers to reduce their energy use (ITU/UNESCO, 2011).
Various market analysts have projected significant growth and value in the smart home and smart device markets in the medium term. In 2011, 1.8 million home automation systems were supplied globally, with 12 million systems expected to be in place by 2016 (GSMA, 2011). Berg Insight (2011) forecasts that worldwide revenues from shipments of home automation systems will grow at a compound annual growth rate of 33%, from USD 2.3 billion in 2010 to nearly USD 9.5 billion in 2015. The total European smart homes market is expected to be worth USD 3.3 billion by 2015, while the energy management market segment is expected to grow at a relatively high compound annual growth rate of 21.4% from 2010 to 2015 (Markets and Markets, 2011). IMS Research (2013) projects that smart home nodes focused on energy management applications will be the most-deployed option during the period 2010-17, with almost 150 million nodes projected to be shipped. This category includes a range of devices, from HVAC controls, such as smart thermostats and radiator controls, to energy measurement devices such as smart plugs and in-home displays. In the longer term, systems that consolidate a range of applications, such as energy management, home security monitoring, lighting control and other home automation systems, are expected to drive the market. Smart grids and smart meters
Important potential energy efficiency savings are available from better management of electricity supply and demand. Smart grids6 and smart meters are two of the key building blocks for optimising energy efficiency in the delivery and use of electricity. Studies indicate that reductions of between 10% and 25% in electricity demand are achievable through the deployment of smart grids (ITU/UNESCO, 2011). Smart meters are an important component in the deployment of these systems, as they provide energy system managers with more precise and timely information regarding consumption and demand. 6 As defined by IEA (2011b), A smart grid is an electricity network that uses digital and other advanced technologies to monitor and manage the transport of electricity from all generation sources to meet the varying electricity demands of end-users. Smart grids co-ordinate the needs and capabilities of all generators, grid operators, end-users and electricity market stakeholders to operate all parts of the system as efficiently as possible, minimising costs and environmental impacts while maximising system reliability, resilience and stability.
Box 4.1 Intelligent efficiency
Intelligent efficiency is about using information technology to process energy consumption data and enable consumers to make smart choices about how they use energy. New gadgets and applications are growing in popularity as consumers begin to understand that managing energy use can be fun and accessible. The driver for this new market is the growing amount of new and existing data that is being made accessible to consumers. Impressive advances in processing power and sensor data allow for much more accurate and dynamic monitoring of energy-consuming systems, such as homes, data centres and factories. Increased processing power and sensor data also allow new technologies to incorporate these systems in order to be more efficient by design. The opportunities presented by this flood of data have quickly attracted the attention of the technology start-up industry and venture capitalists, in addition to utilities and energy service companies (ESCOs). By empowering consumers to play an active role in managing energy use, intelligent efficiency is positioned to enable a revolution in the efficiency market.
© O
EC
D/IE
A, 2
013

TECHNOLOGY FOCUS: APPLIANCES, LIGHTING AND ICT
ENERGY EFFICIENCY MARKET REPORT 2013 87
Pike Research (2010) anticipates that governments and utilities will increase investment in smart grids, spending a total of USD 200 billion worldwide from 2008 to the end of 2015. Of this amount, 84% would be in technologies to automate the grid, 14% in smart metering systems, and 2% in electric vehicle systems (ITU/UNESCO, 2011). Visiongain (2012) calculated that the global smart grid market in 2012 had a value of USD 33.91 billion. Investment is advancing rapidly across many countries. At the national level, recent economic stimulus packages have benefitted smart grid and smart meter projects, including Australia (AUD 100 million)7 and Germany (EUR 100 million) (ITU/UNESCO, 2011). The 2009 American Recovery and Reinvestment Act (ARRA) also heavily invested in smart grid technologies, leading to over 130 smart city projects and USD 32.3 million in tax credits to seven companies in smart grid-related manufacturing. By 2010, ARRA had invested USD 4.5 billion in smart grid development, leading to an additional investment of USD 6 billion by the private sector (Council of Economic Advisers, 2010). The smart grid technology market in Asia is being led by China, which represents 70% of the Asian smart grid market; Japan and South Korea represent 20% and 10% respectively (GTM Research, 2012).8 In 2009, the Chinese State Grid Corporation (SGCC), which covers 88% of China’s electricity grid, announced a plan for the development and construction of a “strong smart grid” with a total cost of USD 101 billion by 2020 (Zpryme, 2011). Projected transmission line investments for 2015 are in the region of USD 269 billion. SGCC has earmarked over USD 40 billion toward smart grid technologies between 2011 and 2016 (GTM Research, 2012). In the European Union, the European Commission estimates that EUR 40 billion will be required for R&D in the areas of energy storage and smart grid applications (EU Council, 2011). The EU Seventh Framework Programme (FP7) is funding two large-scale demonstration projects, though total investment amounts are well below the Commission’s estimates. The GRID4EU project has a total budget of EUR 54 million, with EUR 25 million from the European Commission and the remainder from industry. The EcoGrid EU project has a budget of EUR 21 million, of which half is financed by the European Commission (WEC, 2012). Both initiatives support smart grid demonstration projects in Europe. Smart meters also serve an important second energy efficiency-related function, as they allow consumers to access important information that can influence their consumption patterns. The energy data provided by smart meters and used in display technology for home management can, through raising awareness, reduce household residential consumption by 15% (OECD, 2012). By mid-2011, nearly 90 million smart meters were installed globally, up from 80 million in 2009 (IDC, 2012; ITU/UNESCO, 2011). The rate of deployment is forecast to grow significantly faster, with 490 million smart meters expected by 2015 (GSMA, 2011). IMS Research (2012) projects that the number of smart electricity meters installed will double by the end of 2016, with an almost 35% global penetration. Smart meter deployment is forecast to grow in most jurisdictions, and very rapidly in Asia (Figure 4.10). Table 4.4 provides more detail on smart meter regional investment and uptake.
7 Across 2009/10 as part of the National Energy Efficiency Initiative to develop an innovative energy network. 8 The smart grid technology markets of China, Japan and South Korea have an estimated value of nearly USD 8.5 billion, with forecasted growth to USD 19 billion by 2016.
© O
EC
D/IE
A, 2
013

TECHNOLOGY FOCUS: APPLIANCES, LIGHTING AND ICT
88 ENERGY EFFICIENCY MARKET REPORT 2013
Figure 4.10 Smart meter shipment forecast
Notes: APJ = Asia Pacific Japan; EMEA = Europe, Middle East and Africa. Data for 2012-17 are forecasts.
Source: IDC, 2012.
Table 4.4 Medium-term smart meter developments in key regions
Investment, market size, and benefits Growth
Europe
Electricity distribution network operators and power suppliers to
invest approximately EUR 15.8 billion in the deployment of 110 million smart
meters (by 2017).
Installed base forecasted to grow at a compound annual growth rate of 20.5% to reach 154.7 million units (2011-17). The penetration rate will more than triple from 18% in 2011 to 56% in 2017. Based on
current deployment plans, around 70% of EU households will have smart electricity meters by 2020.
United Kingdom
Smart meter roll-out to cost GBP 11.5 billion over the next
20 years, delivering gross benefits of GBP 25.3 billion, and net benefits of
GBP 14 billion.
Installation of smart meters (including in-home displays indicating energy use) in 28 million homes
and two million small businesses (2014-19).
China Market for smart meters to reach between USD 2.5 billion to USD 3 billion per year
between 2011 and 2016. -
United States - 40 million smart meters in homes by 2015
and more than 1 million in-home energy displays.
Sources: Berg Insight, 2011; British Gas and Oxford Economics, 2012; GTM Research, 2012; US White House, 2010; ITU/UNESCO, 2011.
Conclusions While many traditional product categories in the global appliance and equipment market are static, sales of high-efficiency products and smart appliances are growing steadily. Standards and labelling polices have already led to avoided consumption of significant volumes of energy in many countries and sub-regions, such as the European Union, Korea and the United States. Co-operation by governments and industry in international standards, and the internationalisation of minimum energy performance standards and labelling initiatives, such as ENERGY STAR, have been strong drivers in appliance and equipment markets. However, scope remains for further international co-operation. Initiatives such as the IEA 4E Implementing Agreement, and the SEAD Initiative, are actively targeting the efficiency
0
20
40
60
80
100
120
140
2010 2011 2012 2013 2014 2015 2016
Mill
ion
units APJ
EMEA
Americas
© O
EC
D/IE
A, 2
013

TECHNOLOGY FOCUS: APPLIANCES, LIGHTING AND ICT
ENERGY EFFICIENCY MARKET REPORT 2013 89
levels of a range of appliances from a global perspective. These international efforts could further push the appliance market towards greater energy efficiency levels. The ICT market shows strong growth prospects and represents a transformative new opportunity in energy management and efficiency, which will define the future of the market. As with other appliance classes, co-operation on international standards will be key to developing consistent performance requirements, minimising the energy consumption of networked products (including from network standby), and ensuring smoother market access for manufacturers, as well as ensuring consumer confidence in the efficiency levels of emerging ICT products. References Adams, D. (2011), “Smart-Home: at a tipping point,” Cable and Satellite International, Perspective Publishing Limited, London. Berg Insight (2011), Smart Metering in Europe, MTM Research Series, Berg Insight, Gothenburg. Bertoldi, P., B. Hirl and N. Labanca (2012), Energy Efficiency Status Report: Electricity Consumption and Efficiency Trends in the EU-27, JCR Scientific and Policy Reports, European Commission, Brussels. British Gas and Oxford Economics (2012), “Smart Meters to Bring £14 Billion of Benefits to Britain,” press release, British Gas, Windsor and Oxford Economics, Oxford. BSRIA (2012), Smart Home 2010 Europe Study (updated to 2012), BSRIA Ltd., Berkshire. Clean Energy Solutions Centre (2012), Standards and Labels: Transforming the Market for Energy Efficient Appliances, Clean Energy Solutions Centre and the Collaborative Labelling and Standards Program, Washington DC. Cleantech Group and Canaccord Genuity Analysis (2011), Advanced Lighting Market Insight: Overview and Segmentation Analysis, Cleantech Group LLC, San Francisco. EC (European Commission) (2013), Green Paper a 2030 Framework for Climate and Energy Policies, European Commission, Brussels. Energy Star (2012), ENERGY STAR® Overview of 2012 Achievements, United States Environmental Protection Agency, Washington DC. EPA (United States Environmental Protection Agency) (2011), ENERGY STAR® and Other Climate Protection Partnerships 2011 Annual Report, EPA, Washington DC. Emerson Network Power (2011), State of the Data Centre 2011, Emerson Network Power, Columbus. LBNL (Lawrence Berkeley National Laboratory) (2008), China Refrigerator Information Label: Specification Development and Potential Impact, LBNL, Berkeley.
© O
EC
D/IE
A, 2
013

TECHNOLOGY FOCUS: APPLIANCES, LIGHTING AND ICT
90 ENERGY EFFICIENCY MARKET REPORT 2013
Forrester (2010), The Evolution Of Enterprise Carbon And Energy Management Software, Forrester Research Inc., Cambridge. Frost & Sullivan (2011), Strategic Assessment of the World Power Management Software Market, Frost & Sullivan, London. Fuji Chimera Research Institute (2012), Worldwide Electronics Market 2012 – Comprehensive Study, Fuji Chimera Research Institute Inc., Tokyo. Fuji Keizai Group (2013), “Study of the World Market for 33 Small Appliances and White Goods”, Press Release, Fuji Keizai Group, Tokyo. GSMA (2011), Vision of Smart Home: The Role of Mobile in the Home of the Future, Parks Associates, September, London. GTM Research (2012), The Smart Grid in Asia, 2012-2016: Markets, Technologies and Strategies, Greentech Media, Boston. IDC (IDC Energy Insights) (2012), “Worldwide Smart Meter Shipments Grow 28.8% Year over Year in the First Quarter of 2012”, press release, 12 June, based on IDC Energy Insights’ Worldwide Quarterly Smart Meter Tracker, IDC Energy Insights, Framingham. IDC (2013), Worldwide Quarterly Smart Connected Device Tracker Forecast Data, 28 February, Framingham. IEA (International Energy Agency) (2011), CO2 Emissions from Fuel Combustion, OECD/IEA, Paris. IMS Research (2013), “Global Cellular Machine-to-Machine Connections Growing to More than 325 million by 2016”, press release, 13 March, IHS Inc., Englewood, Colorado. IMS Research, (2012), The World Market for Smart Electricity Meters – 2012 Edition, IHS Inc., Englewood, Colorado. Intertek (2011), Evolving Smart Technologies across Home Appliance and Consumer Electronics Markets, Intertek Testing Services, Boxborough, Massachusetts. ITU/UNESCO (International Telecommunication Union and United Nations Educational Scientific and Cultural Organisation) (2011), Broadband: a Platform for Progress, a report by the Broadband Commission for Digital Development, ITU/UNESCO, Paris. Marketline (2012), Household Appliances: Global Industry Almanac, MarketLine, Manchester. McKinsey (McKinsey & Company) (2012), Lighting the Way: Perspectives on the Global Lighting Market, McKinsey & Company Inc., Vienna, Palo Alto, Munich. MOCIE (Ministry of Commerce, Industry and Energy formerly MOTIE) and KEMCO (Korea Energy Management Corporation) (2010), Korea’s 1-Watt Plan – Standby Korea, MOTIE and KEMCO, Seoul.
© O
EC
D/IE
A, 2
013
TECHNOLOGY FOCUS: APPLIANCES, LIGHTING AND ICT
ENERGY EFFICIENCY MARKET REPORT 2013 91
OECD (Organisation for Economic Co-operation and Development) (2012), OECD Internet Economy Outlook 2012, OECD, Paris. Pike Research (2010), Cloud Computing Energy Efficiency Strategic and Tactical Assessment of Energy Savings and Carbon Emissions Reduction Opportunities for Data Centers Utilizing SaaS, IaaS, and PaaS, Navigant Research, Boulder. SBI Energy (2010), ICT Energy Efficiency: Commercial and Industrial, SBI Energy, Rockville. SEAD Initiative (Super-efficient Equipment and Appliance Deployment) (2011), The Energy Savings Potential of Appliance and Equipment Efficiency, Collaborative Labeling and Appliance Standards Program (CLASP), Washington DC. The Climate Group (2012), Lighting the Clean Revolution – The Rise of LEDs and What it Means for Cities, The Climate Group, London. US White House (undated), “Building a Platform for Private Sector Innovation: Investments in Broadband, Smart Grid, and Health Information Technology”, The Recovery Act, accessed February 2013. Yanti, P. and T.M. Mahlia (2009), “Market Transformation due to Implementation of Energy Efficiency Standards and Labels Implementation for Electric Motor”, Journal of Applied Sciences, Vol. 9, Asian Network for Scientific Information, pp. 2630-2634. Zpryme (Zpryme Research & Consulting) (2011), China: Rise of the Smart Grid, Special Report by Zpryme’s Smart Grid Insights, Zpryme Research and Consulting, LLC, Austin.
© O
EC
D/IE
A, 2
013

© O
EC
D/IE
A, 2
013
PART 2 ENERGY EFFICIENCY
MARKET COMPENDIUM: COUNTRY CASE STUDIES
© O
EC
D/IE
A, 2
013

COUNTRY CASE STUDIES: INTRODUCTION
94 ENERGY EFFICIENCY MARKET REPORT 2013
5. INTRODUCTION This part presents a selection of country case studies to illustrate energy efficiency market activity within various national and sectoral contexts. Rather than provide a comprehensive overview, this part aims to highlight important areas of market activity in several IEA member countries and non-IEA countries that are important energy consumers. They set out salient data and information on investments and outcomes where available, along with opportunities for and challenges facing development within these markets. Additional countries, sectors and activity areas will be examined in future reports, particularly for non-IEA countries. The scope of this selection partly reflects data availability challenges, and partly reflects the lack of comprehensive and comparable information on costs, investments, energy-saving outcomes and their monetary value. This information has been included where available. Each case study first describes the country’s particular energy profile, setting the context relevant to understanding current and prospective energy efficiency market activity. This is followed by sections highlighting the policy and price elements that shape the market, a description of current market activity, and a discussion of the prospects for market activity over the next five to seven years. Each country case study covers a select number of sectors and activities within the broader energy efficiency market. They also reflect innovative approaches adopted by governments that are affecting the energy efficiency market, or are set to do so in the near to medium term. As discussed in Chapter 1, Understanding the Energy Efficiency Market, policy is a key driver for energy efficiency activities, and new and planned policies will influence the market in the medium term. Policy as a driver is highlighted in the case studies,1 which focus on those interventions for which extensive evaluations have been undertaken and reported. This presents a particular challenge: policy interventions for which such evaluations are available tend to be successful, arguably resulting in a selection that may overrepresent positive policy examples. In practice, many energy efficiency policy interventions face substantial challenges, such as higher-than-anticipated costs, difficulty with implementation, unintended outcomes, lower-than-anticipated delivery of energy savings, or uncertain impacts on energy efficiency market activity. A brief discussion of these challenges is also included in each case study. As a complement to the previous chapters of the report, which provide broader assessments and country-level comparative analyses, this compendium of case studies conveys the richness and diversity of energy efficiency markets worldwide, highlighting the specific and dynamic contexts within which they operate.
1 By comparison, there is less analysis of the impact of the other key driver, relative end-use energy prices, because of data availability challenges and relatively greater uncertainties in projecting future pricing trends. It is anticipated that future editions of the Energy Efficiency Market Report may further the price impact as data availability improves.
© O
EC
D/IE
A, 2
013

COUNTRY CASE STUDIES: AUSTRALIA
ENERGY EFFICIENCY MARKET REPORT 2013 95
6. AUSTRALIA
Energy profile and context Australia’s total primary energy supply (TPES) in 2012 was 134 million tonnes of oil-equivalent (Mtoe), an increase of 9% compared to 2011 and a 26% increase over ten years (Figure 6.1). TPES, total final consumption (TFC) of energy, as well as electricity consumption, have all risen over the past decade, despite the decreases in TFC and electricity demand experienced in 2009. Australia’s primary energy supply comprises 95% fossil fuels, of which coal, at 39%, is the largest source. According to International Energy Agency (IEA) statistics, absolute levels of domestic coal use remained stable between 2001 and 2011, while production grew 25% to 222 Mtoe and the proportion exported rose from 70% to 82%. A small drop in domestic coal use over the later years indicates some displacement of coal by natural gas. In 2012, Australia produced 325 Mtoe of primary energy, almost two and a half times Australia’s domestic needs and an increase of around 6% relative to 2011. Australia produced 23 Mtoe of oil in 2011, representing 56% of domestic oil use, and 45 Mtoe of natural gas, representing 166% of domestic gas use.
Figure 6.1 TPES and TFC, 2001-12, and energy supply by source, 2012
Note: unless otherwise indicated, all tables and figures in this chapter derive from IEA data and analysis.
0
20
40
60
80
100
120
140
160
Mto
e
TPES TFC Electricity consumption
Renewable5%
Coal and coal
products36%
Oil and oil products
33%
Natural gas26%
Australian annual primary energy use increased by 26% over the past decade, reflecting a growing economy that is increasingly based on energy-intensive primary activities. This is less than growth in gross domestic product (GDP) over the same period, partly reflecting consolidation within energy-intensive processing industries. Residential electricity prices have risen over the past decade, which has created an incentive for energy efficiency actions. Government energy efficiency programmes targeted at home insulation and industry, among other sectors, have had some success. Residential and industrial initiatives have highlighted the effectiveness of well-designed information programmes in stimulating energy efficiency market activity, especially in the manufacturing sector where intense international competition exists.
© O
EC
D/IE
A, 2
013
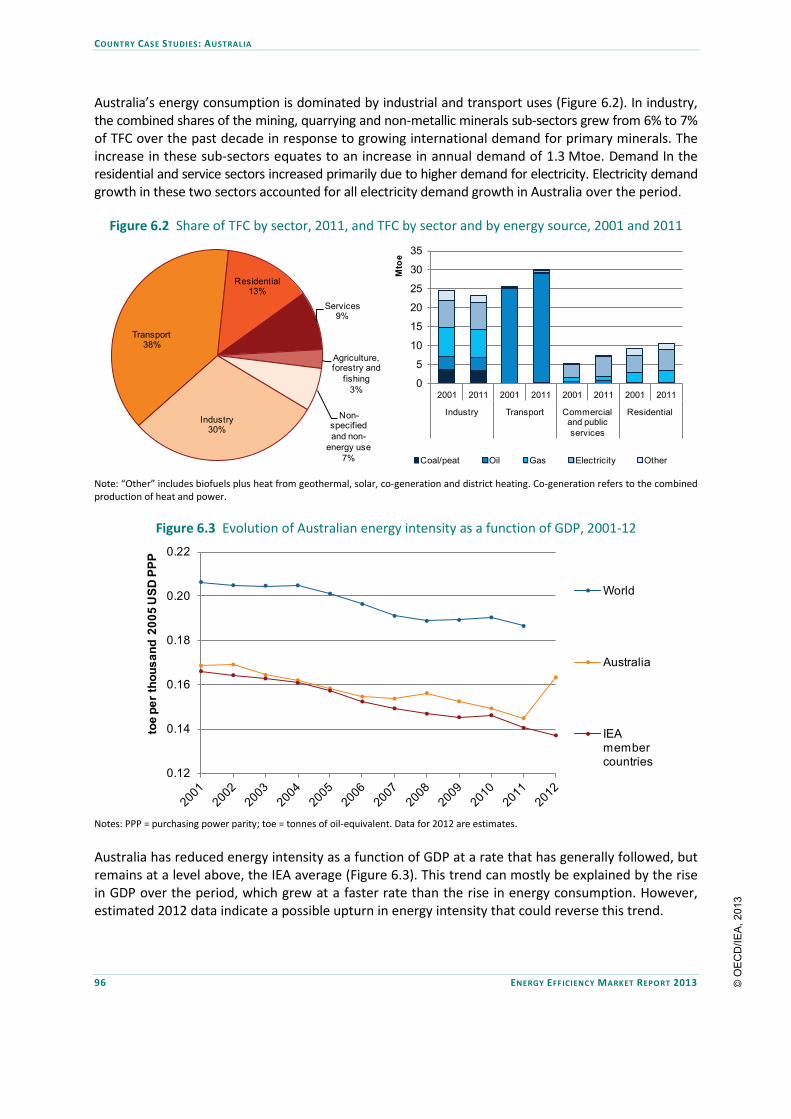
COUNTRY CASE STUDIES: AUSTRALIA
96 ENERGY EFFICIENCY MARKET REPORT 2013
Australia’s energy consumption is dominated by industrial and transport uses (Figure 6.2). In industry, the combined shares of the mining, quarrying and non-metallic minerals sub-sectors grew from 6% to 7% of TFC over the past decade in response to growing international demand for primary minerals. The increase in these sub-sectors equates to an increase in annual demand of 1.3 Mtoe. Demand In the residential and service sectors increased primarily due to higher demand for electricity. Electricity demand growth in these two sectors accounted for all electricity demand growth in Australia over the period.
Figure 6.2 Share of TFC by sector, 2011, and TFC by sector and by energy source, 2001 and 2011
Note: “Other” includes biofuels plus heat from geothermal, solar, co-generation and district heating. Co-generation refers to the combined production of heat and power.
Figure 6.3 Evolution of Australian energy intensity as a function of GDP, 2001-12
Notes: PPP = purchasing power parity; toe = tonnes of oil-equivalent. Data for 2012 are estimates.
Australia has reduced energy intensity as a function of GDP at a rate that has generally followed, but remains at a level above, the IEA average (Figure 6.3). This trend can mostly be explained by the rise in GDP over the period, which grew at a faster rate than the rise in energy consumption. However, estimated 2012 data indicate a possible upturn in energy intensity that could reverse this trend.
Industry30%
Transport38%
Residential13%
Services9%
Agriculture, forestry and
fishing3%
Non-specified and non-
energy use7%
0
5
10
15
20
25
30
35
2001 2011 2001 2011 2001 2011 2001 2011
Industry Transport Commercial and public services
ResidentialM
toe
Coal/peat Oil Gas Electricity Other
0.12
0.14
0.16
0.18
0.20
0.22
toe
per t
hous
and
2005
USD
PPP
World
Australia
IEA member countries
© O
EC
D/IE
A, 2
013

COUNTRY CASE STUDIES: AUSTRALIA
ENERGY EFFICIENCY MARKET REPORT 2013 97
The impact of this efficiency improvement offset the increases in energy demand associated with higher economic activity linked to growing GDP. Australia’s GDP growth over the last decade has been proportionately linked to energy-intensive activities, while structural change towards less energy-intensive economic activities has been limited (Figure 6.4). Energy efficiency has acted to mitigate some of the increase in TFC that would have otherwise occurred. A closer look at the impacts of the financial crisis between 2008 and 2010 indicates that the initial impact was a structural shift towards less energy-intensive activities, a change that was sustained between 2009 and 2010. However, the IEA indicators database shows that structural change since 2000 in the manufacturing sector alone has been towards more energy-intensive activities and TFC was rising again by 2010 in line with a return to growth in energy-using activities.
Figure 6.4 Changes in TFC, decomposed into structure, activity and efficiency effects
Note: IEA decomposition analysis calculates the relative impacts of three main factors that drive changes in TFC, using 1990 as a base year. The activity effect is a function of demand changes within a sector or sub-sector, measured as value-added, passenger-kilometres, tonne-kilometres or population. Structure effect is a function of changes in the relative shares of the industrial sub-sectors, transport modes or types of residential end-use. Efficiency effect is a function of changes in energy use per unit of activity within each of these sub-sectors, modes or end-uses. Further information on methodology can be found in Box 3.1.
Source: IEA indicators database.
The amount of electricity generated in Australia has grown by 20% over the past decade (Figure 6.5). The main driver for rising electricity generation since 2000 has been increased demand from the residential sector and, to a lesser extent, the service sector. Electricity used in transport, notably rail transport, has increased, but from a relatively low base of 1.3% of total electricity demand. While the 2000-07 period was characterised by 2% average annual growth in electricity consumption, this rate of increase has fallen to less than 1% since 2008. This levelling-off has occurred in both the residential and industrial sectors and is due to a range of factors, including flatter economic conditions, relatively mild summers and solar photovoltaic (PV) and solar hot water installations on houses (AER, 2012). Importantly, industrial structural shifts to more primary energy sector activity in remote parts of the country means that, while generation in the national electricity market has been marginally declining since the fiscal year 2008/09, off-grid generation has been increasing rapidly
-4%
-2%
0%
2%
4%
2000-05 2005-10 2008-09 2009-10
Aver
age
annu
al c
hang
e
TFC Activity effect Structure effect Efficiency effect
© O
EC
D/IE
A, 2
013

COUNTRY CASE STUDIES: AUSTRALIA
98 ENERGY EFFICIENCY MARKET REPORT 2013
(BREE, 2013). Growth in industrial electricity demand has been met by on-site off-grid electricity generation. This off-grid generation is in general not included in Figure 6.5.
Figure 6.5 Changes in electricity generation and consumption, 2002-12
Notes: MER = market exchange rate basis for expressing GDP in real (constant) terms. Data for 2012 are estimates.
Market variable: end-use energy prices Australia is a net exporter of natural gas and a net importer of oil, with net crude imports equalling 30% of national supply. The impact of the 450% rise in oil prices since 2003 has therefore caused a significant rise in import costs, despite import volumes remaining relatively constant (Figure 6.6). The increase in real terms has been around USD 16 billion per year. This impact has, however, been mitigated by rising GDP and income from energy exports.
Figure 6.6 Volume, price and costs of oil imports, 2002-12
Preliminary data suggest that the proportion of household expenditure on energy (excluding transport) is 2.6% (ABS, 2012). This proportion is the same as it was ten years previously (ABS, 2002). However,
80%
100%
120%
140%
160%
180%
200%
2002
= 1
00%
Electricity generation Electricity use by industryElectricity consumption/GDP (MER) Electricity use by transportElectricity consumption per capita Electricity use by residential
0
4
8
12
16
20
2005
USD
bill
ion
Import spending
0%
100%
200%
300%
400%
500%
2002
= 1
00%
Average import priceImport costs as % of GDPImport volume
© O
EC
D/IE
A, 2
013

COUNTRY CASE STUDIES: AUSTRALIA
ENERGY EFFICIENCY MARKET REPORT 2013 99
it should be noted that household incomes have also risen by 39% in the decade to 2012, partially offsetting an increase in electricity prices. Over the past four years the cost of electricity for households has risen on average by around 70% nationally (RET, 2013). Minimising further increases in household energy bills, as well as avoiding costly grid expansions to provide capacity to remote locations and congested urban systems, provide a rationale for energy efficiency in a country where increasing wealth has done much to reduce the impact of energy price signals elsewhere in the economy. Energy efficiency market activity Market driver: energy efficiency policies and programmes The Australian government has acted to stimulate the uptake of energy efficiency measures mainly in two sectors: heavy industry and residential buildings. In industry, it was identified that a main barrier to efficiency investments was a lack of awareness rather than a challenging financing or cost-benefit environment. By contrast, in the residential sector, grants were made available to householders who, it was considered, would not take up insulation measures without such an incentive, despite their cost-effectiveness over the lifetime of the measure. These two policy areas are described in more detail in the following sections. Addressing industrial efficiency in Australia
Australian industry is continuing a long-term structural shift to primary extractive industries. Total capital spending by the mining industry in Australia increased from AUD 12 billion in 2002/03 to over AUD 82 billion in 2011/12 (Grafton, 2012). Cumulative expenditure on major mining projects over the past five years comes to around AUD 100 billion, but projects that have passed final approvals and final investment decisions currently amount to AUD 260 billion. Australia is still only a third of the way, in value terms, through the investment phase of the mining boom (Grafton, 2012). The government introduced the Energy Efficiency Opportunities (EEO) programme in 2006. This decision was based on its identification of the greatest potential for energy efficiency savings as residing with the largest energy-using corporations, and a general lack of uptake of energy efficiency opportunities by firms in response to market forces. The EEO addresses information failures that stand in the way of businesses benefiting from cost-effective energy efficiency opportunities. Over 300 corporations are covered by the EEO, representing two-thirds of Australia’s primary energy consumption. Since 2011, the EEO has included companies from the electricity-generating sector. Participation in the programme is mandatory for all corporations that use more than 0.5 petajoules (PJ) (12 000 toe) per year. The programme aims to build industrial capability and capacity to identify, assess and implement cost-effective energy efficiency opportunities with a payback period of four years or less. It mandates reporting of efficiency opportunities to the public and the corporate board. This requirement is intended to facilitate systemic behavioural change, to make identification of energy-saving opportunities an integral part of standard business practices. There is no requirement for corporations to implement identified energy efficiency opportunities. An evaluation of the EEO programme in 2013 estimated that 40% of reported energy savings by participants had been realised above what would have been achieved in its absence. This additionality estimate equates to annual net energy savings of 34.6 PJ (0.8 Mtoe) being directly attributable to the programme between 2006/07 and 2010/11 compared to business-as-usual (ClimateWorks, 2013a).
© O
EC
D/IE
A, 2
013

COUNTRY CASE STUDIES: AUSTRALIA
100 ENERGY EFFICIENCY MARKET REPORT 2013
Of these, 86% had a payback period of less than two years, and 64% were in the manufacturing sector. In total, AUD 320 million in net annualised financial savings for participants from energy use were directly attributable to the EEO programme in 2010/11. These savings were in addition to 49.7 PJ (1.2 Mtoe) of savings that would likely have been achieved by industry participants during the same period independent of the EEO programme. Interestingly, of these, only 65% had a payback period of two years or less, with 20% having a payback period of four years or more. Analysis conducted for a wider range of corporations in certain sectors (those with energy use above 0.1 PJ, not just EEO participants) (Table 6.1) identified cost-effective energy-saving opportunities estimated to be worth AUD 3.3 billion in 2010/11 in these sectors, of which AUD 1.2 billion was expected to be implemented under current policy.
Table 6.1 Opportunities for avoided energy use in Australian industry in 2010/11
Sector Annual energy use Estimated total
opportunities across the sector
Proportion that would be implemented under
current policies Mining 414 PJ (9.9 Mtoe) 47 PJ (1.1 Mtoe) 48% Metals manufacturing 578 PJ (1.4 Mtoe) 38 PJ (0.9 Mtoe) 46% Chemicals and energy manufacturing 409 PJ (9.8 Mtoe) 65 PJ (1.6 Mtoe) 43%
Other manufacturing, construction and services 348 PJ (8.3 Mtoe) 48 PJ (1.1 Mtoe) 34%
Freight and air transport 233 PJ (5.6 Mtoe) 26 PJ (0.6 Mtoe) 39% Total 1 980 PJ (47.3 Mtoe) 225 PJ (5.4 Mtoe) 42%
Notes: identified opportunities include all cost-effective opportunities with a payback period of less than two years. Sectors do not correspond exactly to the IEA sector categories used elsewhere in this chapter.
Sources: ClimateWorks (2013a); ClimateWorks (2013b).
An independent review of the EEO programme undertaken in 2013 identified that it: • had been effective in addressing information-type market failures; • was complementary to current government policies, and addressed information failures not addressed
by carbon pricing policies; • had facilitated the identification of an additional 40% in energy savings, above and beyond what
would have been achieved in its absence; and • had been highly cost-effective, with a benefit-to-cost ratio of almost 4:1 (ACIL Tasman, 2013). In 2013, the Australian government assessed the potential expansion of the EEO programme to electricity and natural gas transmission and distribution networks, and to greenfield and major expansion projects. It was concluded that there was no net benefit from expanding the EEO programme to cover network businesses, but that energy savings of between 11% and 50% could be achieved by extension of the programme to greenfield and major expansion projects. The EEO programme has covered such developments since July 2013. It has been proposed that the programme run for a further five years, and that improvements be made, including: • to reduce reporting compliance elements and keep them flexible and outcome-based; • to improve guidance about what is or is not mandatory; and • to improve co-ordination with other government programmes.
© O
EC
D/IE
A, 2
013

COUNTRY CASE STUDIES: AUSTRALIA
ENERGY EFFICIENCY MARKET REPORT 2013 101
Australia’s home insulation programme
A key element of the Australian government’s AUD 42 billion 2009 Nation Building and Jobs Plan for economic stimulus was the provision of AUD 3.9 billion for the Energy Efficient Homes Package (EEHP), including the Home Insulation Program (HIP). Under the HIP, homeowners and landlords with eligible dwellings were able to claim the cost of installing ceiling insulation. Eligible dwellings included homes built before the mandatory thermal performance requirements introduced in the 2003 building code, as well as dwellings that had little or no ceiling insulation. Under the HIP, around 1.1 million roofs were insulated at a cost of AUD 1.45 billion. The programme closed in 2010, over one year before its scheduled end, following safety and compliance concerns in relation to installed insulation materials, as 29% of inspections identified some level of deficiency (ANAO, 2010). Deficiency concerns have led to expected expenditure on remediation (retrospectively addressing inadequate installations) of AUD 0.4 billion. Given that annual installations of ceiling insulation rose sixfold to 1.2 million during the first year of the HIP, it was perhaps unsurprising that the scheme ran into problems related to installation adequacy (EES, 2011). Analysis of the impacts of the partially completed HIP indicates national energy savings of 230 000 toe per year by 2020, despite the programme’s short duration (EES, 2011). These savings could equal cumulative economic benefits of AUD 3.9 billion from avoided space heating and cooling energy requirements by 2020. In addition, peak demand reductions of 400 MW could have a value of avoided infrastructure investment of AUD 1.7 billion (EES, 2011). Given that the greenhouse gas emissions reductions attributable to the HIP are estimated at 10 million tonnes of carbon dioxide (CO2) between 2009 and 2020, it is possible that the net return of the HIP was AUD 370 for each tonne of CO2 avoided. This compares favourably with many supply-side measures, such as renewable power, which have net costs of around AUD 100 or more per tonne of CO2 avoided. Furthermore, these figures do not account for other benefits of better insulation, such as health benefits for low-income households (ANAO, 2010). According to these estimates, the HIP outcomes were cost-effective despite the remediation costs. Its impact on the jobs market, on the other hand, was lower than anticipated, as the early termination of the programme meant that many jobs were not sustained (ANAO, 2010). More thorough policy design would have mitigated some of the practical implementation risks related to complexity, rapid implementation without adequate administrative competence, tight timeframes and imbalance between public and private risks. More broadly, policy makers could learn from experience with the HIP, and explore options for improvements in market delivery and cost-benefit performance of household retrofit schemes. Challenges While the markets for energy efficiency in Australia have been stimulated by government policy in the last five years, especially in the residential and energy-intensive industrial sectors, its longer-term prospects face two challenges from the perspective of durability and scale. First, despite rising electricity prices creating a demand for lower energy bills, the success of future policies may rest on their ability to overcome the negative publicity associated with the HIP. Second, while Australia’s primary industry sector is investing in future production, manufacturing industries are exposed to more intense international competition. The ability of policies to motivate markets to deliver
© O
EC
D/IE
A, 2
013

COUNTRY CASE STUDIES: AUSTRALIA
102 ENERGY EFFICIENCY MARKET REPORT 2013
increased efficiency in this area will depend on the ability of companies to take decisions about their medium-term future in an environment of low confidence about their cost competitiveness. Prospects for energy efficiency market activity In addition to continuation of the EEO and business-as-usual investments in energy efficiency by industry, as identified in the EEO evaluations, policy statements and measures indicate that the market for energy efficiency is likely to grow. In its 2012 Energy White Paper, the Australian government identified improving energy productivity as one of eight core elements of Australia’s energy policy. The objective is to help consumers manage energy costs, improve national productivity, increase energy security and lower greenhouse gas abatement costs. Efficient generation, distribution and use of energy were proposed to yield benefits, not just to firms and households, but also to the costs of the whole national energy system. This focus should further stimulate the market for energy efficiency beyond the initiatives described above. A recent analysis undertaken by the Climate Institute estimated that every 1% improvement in energy efficiency had a 0.1% improvement in GDP (Vivid Economics 2013). New allocations for funding support are likely to improve the accessibility of funding, and include the following: • Clean Technology Investment Program: this was announced in 2012 for eligible projects that
improve the carbon and energy efficiency of the applicant’s manufacturing process. AUD 800 million in grants will be made available. Grants of less than AUD 0.5 million must be complemented by an equal contribution from the applicant, which rises to a contribution of 300% for grants over AUD 10 million.
• Clean Energy Finance Corporation: this legislated fund is dedicated to investing in Australian-based renewable energy, low emissions and energy efficiency technologies. Under enabling legislation, its investment activities will be funded with AUD 2 billion every year for five years, commencing from 1 July 2013.
Conclusions Australia’s economy is relatively energy intense. Efficiency gains have had an impact on overall energy use, and, notwithstanding 2012, energy intensity has fallen in recent years. In interviews with companies, the most significant driver of energy efficiency activity was considered to be energy price rises, along with the carbon price and the EEO programme (ClimateWorks, 2013c). However, TPES has increased with rising GDP, which has been increasingly driven by energy-intensive industries such as mineral extraction. In addition, household energy bills have increased and electricity grid congestion has become a greater concern. Following the implementation of several energy efficiency programmes, the government continues to make commitments to energy efficiency, which is sensible in a country that has national greenhouse gas emissions targets yet is heavily reliant on indigenous coal use and fossil fuel exports. Future policies may benefit from the lessons learnt during previous programmes. However, ensuring that industrial energy efficiency programmes, such as the EEO, can be extended and expanded will require companies to commit to measures identified as having longer payback periods. This could require either strong corporate leadership or different policies to make publicly backed finance available.
© O
EC
D/IE
A, 2
013

COUNTRY CASE STUDIES: AUSTRALIA
ENERGY EFFICIENCY MARKET REPORT 2013 103
References ABS (Australian Bureau of Statistics) (2002), Year Book Australia 2002, ABS, Canberra. ABS (2012), Year Book Australia 2012, ABS, Canberra. ACIL Tasman (2013), Energy Efficiency Opportunities Program Review: Energy Efficiency Opportunities Programme End of First Full Five Year Cycle Evaluation – Final Report, Department of Resources Energy and Tourism, Canberra. AER (Australian Energy Regulator) (2012), State of the Energy Market 2012, AER, Melbourne. ANAO (Australian National Audit Office) (2010), Home Insulation Program – Performance Audit Report 12 2010–11, ANAO, Canberra. BREE (Bureau of Resources and Energy Economics) (2013), 2013 Australian Energy Update, BREE, Canberra. Grafton, Q. (2012), “Australia and the Millenium Mining Boom”, remarks made at the Australian National Conference on Resources and Energy, Bureau of Resources and Energy Economics, Canberra, 18 September. ClimateWorks (2013a), Energy Efficiency Opportunities Program Additionality Analysis – Technical Report, ClimateWorks Australia, Melbourne. ClimateWorks (2013b), Industrial Energy Efficiency Data Analysis Project, ClimateWorks Australia, Melbourne. ClimateWorks (2013c), Tracking Progress Towards a Low Carbon Economy, National Progress Report, ClimateWorks Australia, Melbourne. EES (Energy Efficient Strategies) (2011), The Value of Ceiling Insulation: Impacts of Retrofitting Ceiling Insulation to Residential Dwellings in Australia, Report for The Insulation Council of Australian and New Zealand, EES, Gippsland. RET (Australian Department of Resources Energy and Tourism) (2012), Energy White Paper 2012: Australia's Energy Transformation, RET, Canberra. RET (2013), The Facts on… Electricity Prices, RET, Canberra. The Climate Institute (2013), Boosting Australia’s Energy Productivity, The Climate Institute, Sydney and Melbourne. Vivid Economics (2013), Energy Efficiency and Economic Growth, report prepared for The Climate Institute, Vivid Economics, London.
© O
EC
D/IE
A, 2
013

COUNTRY CASE STUDIES: CANADA
104 ENERGY EFFICIENCY MARKET REPORT 2013
7. CANADA
Energy profile and context In 2010, total primary energy supply (TPES) for Canada totalled about 250 million tonnes of oil-equivalent (Mtoe) and total final consumption (TFC) totalled about 200 Mtoe. Consumption increased slightly over the decade to 2010 (Figure 7.1). Oil and gas represent almost two-thirds of TPES.
Figure 7.1 TPES and TFC, 2001-12, and energy supply by source, 2012
Note: unless otherwise indicated, all tables and figures in this chapter derive from International Energy Agency (IEA) data and analysis.
The transport and industrial sectors account for over half of TFC, followed by the residential sector (Figure 7.2). Energy consumption in these three sectors has been increasing slowly over the past decade, especially the industrial and transport sectors. Analysis of the factors influencing changes in energy consumption indicates that energy efficiency was a key factor limiting the growth in TFC over the past two decades (Figure 7.3). Efficiency improvement slowed in the period preceding the recession and dropped further in 2008-09. However, data for 2009-10 indicates that Canada may be returning to the path of improving energy efficiency. Canada’s energy profile is characterised by relatively high rates of TPES per unit of gross domestic product (GDP), including relative to other IEA member countries (Figure 7.4). A significant concentration of energy-intensive industry, a cold climate, vast geography and a high standard of living, with minimal
0
50
100
150
200
250
300
Mto
e
TPES TFC Electricity consumption
Nuclear10%
Renewable18%
Coal and coal
products7%Oil and oil
products33%
Natural gas32%
Canada has a consistent record of delivering and building on a number of complementary energy efficiency programmes at the federal, provincial and municipal levels. Economy-wide efficiency improvements between 1990 and 2010 resulted in over CAD 32 billion of avoided energy expenditure in 2010, and saved an amount of energy equivlant to the total Canadian electricity production in 2010. The existing framework of policies and programmes should continue to support a relatively robust efficiency market. Furthermore, financing mechanisms and policies and programmes that do not rely on direct government funding are expected to play a growing role in enabling investment. This chapter highlights a number of the successful programmes and the underlying fiscal framework that encourages investment in Canadian efficiency markets.
© O
EC
D/IE
A, 2
013

COUNTRY CASE STUDIES: CANADA
ENERGY EFFICIENCY MARKET REPORT 2013 105
constraints on space occupation, are major factors driving consumption. However, Canada has made significant progress in improving energy use per unit of GDP between 2001 and 2012.
Figure 7.2 Share of TFC by sector, 2011, and TFC by sector and by energy source, 2001 and 2011
Note: “Other” includes biofuels plus heat from geothermal, solar, co-generation and district heating. Co-generation refers to the combined production of heat and power.
Figure 7.3 Changes in TFC, decomposed into structure, activity and efficiency effects
Note: IEA decomposition analysis calculates the relative impacts of three main factors that drive changes in TFC, using 1990 as a base year. The activity effect is a function of demand changes within a sector or sub-sector, measured as value-added, passenger-kilometres, tonne-kilometres or population. Structure effect is a function of changes in the relative shares of the industrial sub-sectors, transport modes or types of residential end-use. Efficiency effect is a function of changes in energy use per unit of activity within each of these sub-sectors, modes or end-uses. Further information on methodology can be found in Box 3.1.
Source: IEA indicators database.
Since 1990, Canada has become a net exporter of energy and since 2001 the volume of oil imports has remained steady. Import prices and expenditure reflect global trends in oil prices, specifically a significant drop in 2009 driven by the economic and financial crisis. Import costs as a percentage of GDP have increased significantly since 2002 (Figure 7.5).
Industry28%
Transport29%
Residential16%
Services13%
Agriculture, forestry and
fishing2%
Non-specified and non-
energy use12%
0
10
20
30
40
50
60
70
2001 2011 2001 2011 2001 2011 2001 2011
Industry Transport Commercial and public services
Residential
Mto
e
Coal/peat Oil Gas Electricity Other
-6%
-4%
-2%
0%
2%
4%
2000-05 2005-10 2008-09 2009-10
Aver
age
annu
al c
hang
e
TFC Activity effect Structure effect Efficiency effect
© O
EC
D/IE
A, 2
013
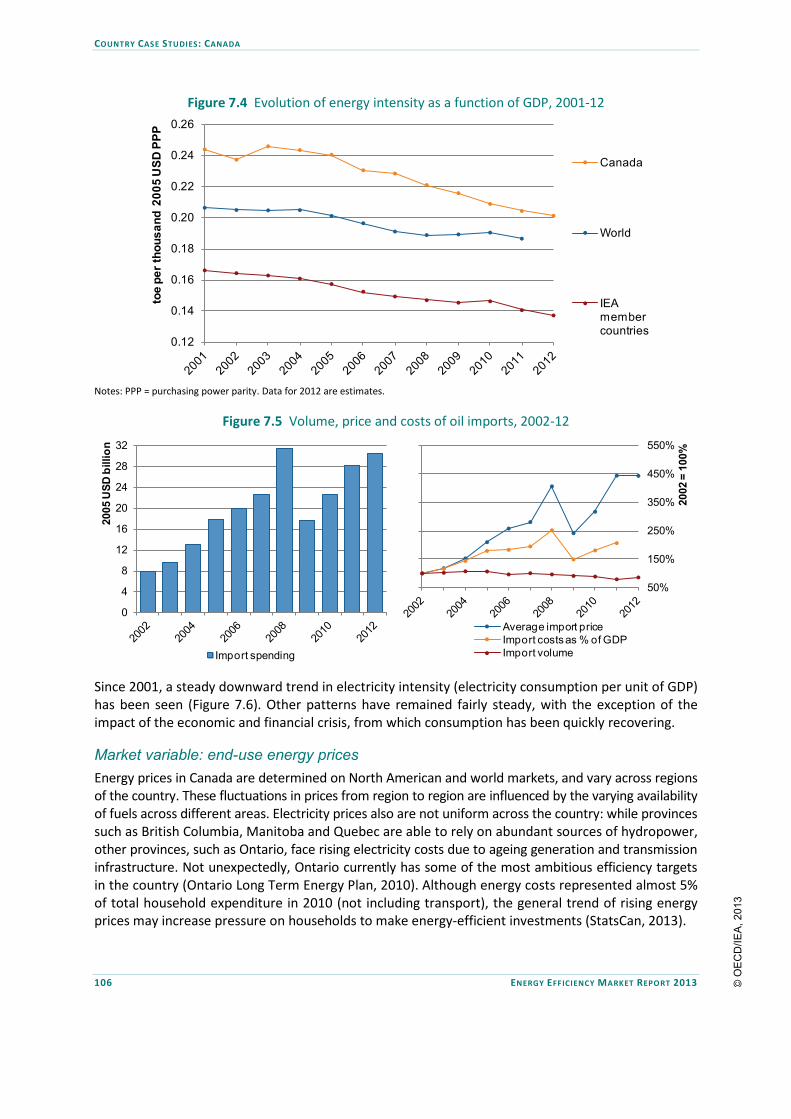
COUNTRY CASE STUDIES: CANADA
106 ENERGY EFFICIENCY MARKET REPORT 2013
Figure 7.4 Evolution of energy intensity as a function of GDP, 2001-12
Notes: PPP = purchasing power parity. Data for 2012 are estimates.
Figure 7.5 Volume, price and costs of oil imports, 2002-12
Since 2001, a steady downward trend in electricity intensity (electricity consumption per unit of GDP) has been seen (Figure 7.6). Other patterns have remained fairly steady, with the exception of the impact of the economic and financial crisis, from which consumption has been quickly recovering.
Market variable: end-use energy prices Energy prices in Canada are determined on North American and world markets, and vary across regions of the country. These fluctuations in prices from region to region are influenced by the varying availability of fuels across different areas. Electricity prices also are not uniform across the country: while provinces such as British Columbia, Manitoba and Quebec are able to rely on abundant sources of hydropower, other provinces, such as Ontario, face rising electricity costs due to ageing generation and transmission infrastructure. Not unexpectedly, Ontario currently has some of the most ambitious efficiency targets in the country (Ontario Long Term Energy Plan, 2010). Although energy costs represented almost 5% of total household expenditure in 2010 (not including transport), the general trend of rising energy prices may increase pressure on households to make energy-efficient investments (StatsCan, 2013).
0.12
0.14
0.16
0.18
0.20
0.22
0.24
0.26
toe
per t
hous
and
2005
USD
PPP
Canada
World
IEA member countries
0
4
8
12
16
20
24
28
32
2005
USD
bill
ion
Import spending
50%
150%
250%
350%
450%
550%
2002
= 1
00%
Average import priceImport costs as % of GDPImport volume
© O
EC
D/IE
A, 2
013

COUNTRY CASE STUDIES: CANADA
ENERGY EFFICIENCY MARKET REPORT 2013 107
Figure 7.6 Changes in electricity generation and consumption, 2002-12
Note: MER = market exchange rate basis for expressing GDP in real (constant) terms.
Energy efficiency market activity Market supply: potential for avoiding energy demand Accounting for differences in economic structure, weather and other effects, energy efficiency improvements in Canada contributed to a 25.3% reduction in energy use between 1990 and 2010 (Figure 7.7). This is equivalent to 1 681 petajoules (PJ) and represents CAD 32.4 billion in savings (NRCan, 2013c).
Figure 7.7 Final energy use, with and without energy efficiency improvements, 1990-2010
Note: EJ = exajoule.
Source: NRCan, 2013b.
70%
80%
90%
100%
110%
120%20
02 =
100
%
Electricity generation Electricity use by industryElectricity consumption/GDP (MER) Electricity use by transportElectricity consumption per capita Electricity use by residential
6
7
8
9
10
11
EJ
Estimated TFC without energy efficiency improvements Actual TFC
© O
EC
D/IE
A, 2
013

COUNTRY CASE STUDIES: CANADA
108 ENERGY EFFICIENCY MARKET REPORT 2013
Canada has made progress in improving energy efficiency in all end-use sectors, however considerable energy efficiency potential remains. Market drivers: energy efficiency policies and programmes Canada has a robust suite of energy efficiency policies and programmes at federal, provincial and municipal levels. Co-operation between the different levels of government allows for programmes to flow from one level of government to the next. There is a high degree of synergy between the different policies and regulations, which range from direct incentives to codes and standards, capacity building and fiscal policies. Federal energy efficiency programmes have evolved substantially over the past 20 years. Most recently, government programmes have been delivered under the umbrella of the ecoENERGY Efficiency initiatives. Table 7.1 below provides a summary of recent federal programmes in the industrial, housing, buildings, equipment and transport sectors. Projected investment between 2011 and 2016 in the various ecoENERGY Efficiency initiatives is CAD 195 million. Analysis by Natural Resources Canada (NRCan), the ministry of the government of Canada responsible for energy, points to positive results for various programmes. It estimates that they will result in annual savings of between 36 PJ and 44 PJ of energy in 2016 (NRCan, 2013b).
Table 7.1 Overview of key federal government programmes targeting energy efficiency
Sector 2007-11 2011-16
Industry ecoENERGY for Industry
ecoENERGY Retrofit – Small and Medium Organisations*
ecoENERGy Efficiency for Industry***
Buildings ecoENERGY Retrofit – Small and
Medium Organisations* ecoENERGY for Buildings and Houses**
ecoENERGy Efficiency for Buildings***
Housing ecoENERGY for Buildings and Houses** ecoENERGY Retrofit – Homes (2007-12) ecoENERGY Efficiency for Housing***
Equipment ecoENERGY for Equipment ecoENERGY Efficiency for Equipment Standards and Regulations***
Transport ecoENERGY for Fleets ecoENERGY for Personal Vehicles ecoENERGY Efficiency for Vehicles***
* ecoENERGY Retrofit – Small and Medium Organizations was a single programme with both industrial and commercial/institutional components.
** ecoENERGY for Buildings and Houses was a single programme with both buildings and housing components.
*** The 2011-16 ecoENERGY Efficiency activities operate as sector-specific components under one programme.
Standards and labelling
The Energy Efficiency Act gives the government of Canada the authority to make and enforce regulations that prescribe standards and labelling requirements. Regulations have now been established for more than 40 products, including major household appliances, water heaters, heating and air conditioning equipment, commercial refrigeration and electric motors, among others. NRCan processed more than 1.93 million records in 2011/12 relating to the importation of regulated energy-using products to Canada (NRCan, 2013b). The annual aggregate savings resulting from energy efficiency regulations are shown in Table 7.2.
© O
EC
D/IE
A, 2
013
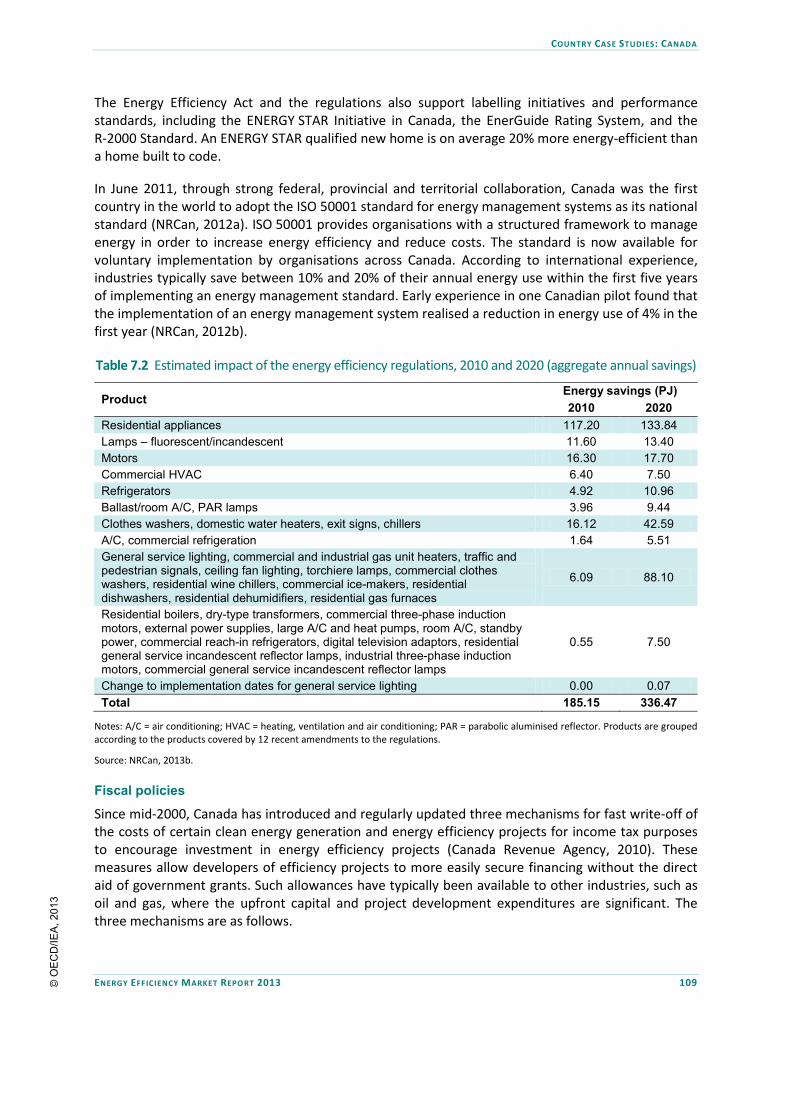
COUNTRY CASE STUDIES: CANADA
ENERGY EFFICIENCY MARKET REPORT 2013 109
The Energy Efficiency Act and the regulations also support labelling initiatives and performance standards, including the ENERGY STAR Initiative in Canada, the EnerGuide Rating System, and the R-2000 Standard. An ENERGY STAR qualified new home is on average 20% more energy-efficient than a home built to code. In June 2011, through strong federal, provincial and territorial collaboration, Canada was the first country in the world to adopt the ISO 50001 standard for energy management systems as its national standard (NRCan, 2012a). ISO 50001 provides organisations with a structured framework to manage energy in order to increase energy efficiency and reduce costs. The standard is now available for voluntary implementation by organisations across Canada. According to international experience, industries typically save between 10% and 20% of their annual energy use within the first five years of implementing an energy management standard. Early experience in one Canadian pilot found that the implementation of an energy management system realised a reduction in energy use of 4% in the first year (NRCan, 2012b).
Table 7.2 Estimated impact of the energy efficiency regulations, 2010 and 2020 (aggregate annual savings)
Product Energy savings (PJ) 2010 2020
Residential appliances 117.20 133.84 Lamps – fluorescent/incandescent 11.60 13.40 Motors 16.30 17.70 Commercial HVAC 6.40 7.50 Refrigerators 4.92 10.96 Ballast/room A/C, PAR lamps 3.96 9.44 Clothes washers, domestic water heaters, exit signs, chillers 16.12 42.59 A/C, commercial refrigeration 1.64 5.51 General service lighting, commercial and industrial gas unit heaters, traffic and pedestrian signals, ceiling fan lighting, torchiere lamps, commercial clothes washers, residential wine chillers, commercial ice-makers, residential dishwashers, residential dehumidifiers, residential gas furnaces
6.09 88.10
Residential boilers, dry-type transformers, commercial three-phase induction motors, external power supplies, large A/C and heat pumps, room A/C, standby power, commercial reach-in refrigerators, digital television adaptors, residential general service incandescent reflector lamps, industrial three-phase induction motors, commercial general service incandescent reflector lamps
0.55 7.50
Change to implementation dates for general service lighting 0.00 0.07 Total 185.15 336.47
Notes: A/C = air conditioning; HVAC = heating, ventilation and air conditioning; PAR = parabolic aluminised reflector. Products are grouped according to the products covered by 12 recent amendments to the regulations.
Source: NRCan, 2013b.
Fiscal policies
Since mid-2000, Canada has introduced and regularly updated three mechanisms for fast write-off of the costs of certain clean energy generation and energy efficiency projects for income tax purposes to encourage investment in energy efficiency projects (Canada Revenue Agency, 2010). These measures allow developers of efficiency projects to more easily secure financing without the direct aid of government grants. Such allowances have typically been available to other industries, such as oil and gas, where the upfront capital and project development expenditures are significant. The three mechanisms are as follows.
© O
EC
D/IE
A, 2
013
COUNTRY CASE STUDIES: CANADA
110 ENERGY EFFICIENCY MARKET REPORT 2013
• Accelerated Capital Cost Allowance for Class 43.1 and 43.2 assets. In Canada’s Income Tax Regulations, electric power generation assets are typically depreciated at annual rates of between 4% and 20%. Under Class 43.1 or Class 43.2 in the regulations, qualifying costs may be written off at Accelerated Capital Cost Allowance (ACCA) rates of 30% or 50% per year respectively on a declining balance basis. The Class 43.1 Technical Guide, developed by NRCan, provides details on the types of assets that are eligible for Class 43.1 or Class 43.2. The assets include energy efficiency and renewable energy technologies, as well as certain high-efficiency fossil fuel generation and co-generation equipment, heat recovery systems and exchangers, thermal waste electrical generation equipment and fuel cells.
• Canadian Renewable Conservation Expenses. Canadian Renewable and Conservation Expenses (CRCE) complements ACCA by allowing certain project development costs to be fully deductible, where at least 50% of the capital costs incurred are expected to be eligible for inclusion in Classes 43.1 or 43.2. Alternatively, the provision allows for these expenditures to be carried forward indefinitely for deduction in later years. For projects that have significant site preparation, feasibility study or training costs, this provision can greatly increase the attractiveness of the investment.
• Flow-through share treatment. This provision helps project developers attract equity financing by allowing CRCE-deductible expenditures to be passed on to the company shareholders, allowing shareholders to reduce their income tax liability by claiming deductions as if they had incurred the expenditures directly. Flow-through shares can be issued to raise equity for a project in the early stages of development when the project is not yet profitable.
Current energy efficiency market activity The Federal Buildings Initiative, which facilitates the retrofit of federal buildings through third-party energy performance contracts, has drawn over CAD 300 million in private sector investment since 1991 and has resulted in the retrofit of over one-third of federal floor space. With the financial burden assumed by the private sector, and start-up and implementation assistance from NRCan, the barriers to entry and risks for the building manager are low. The projects have demonstrated on average energy savings of 15% to 20%, and generated average total annual energy cost savings of CAD 43 million (NRCan, 2011). The Manitoba Hydro Power Smart PAYS Program, which was introduced at the end of 2012, provides a mechanism for efficiency upgrades to be financed through a loan to the homeowner that is repaid through the monthly energy bill. The term of the loan is tied to the extent of upgrades, and the monthly financing payment is less than the estimated annual energy savings averaged out on a monthly basis. For a five-year loan, the annual interest rate is fixed at 3.9%. The programme also allows loans to be transferred with the sale of the home, encouraging deeper retrofits. The Canadian Industry Program for Energy Conservation (CIPEC) is an industry-government partnership delivered through NRCan. The CIPEC network encompasses more than 50 associations and 25 industrial sectors that cover 98% of industrial energy use in Canada. Registered CIPEC Leader companies voluntarily commit to energy efficiency improvements, as well as to reducing greenhouse gas emissions. Innovative companies at the leading edge receive recognition through the national CIPEC Leadership Awards. CIPEC supports process integration studies in Canadian industrial facilities. An impact analysis of 53 companies that had undertaken process integration studies showed savings of 6.6 PJ annually, which translates into annual cost savings of CAD 54 million (NRCan, 2013b). Estimated total annual energy savings attributable to CIPEC’s activities exceeded 0.6 PJ (CIPEC, 2012).
© O
EC
D/IE
A, 2
013

COUNTRY CASE STUDIES: CANADA
ENERGY EFFICIENCY MARKET REPORT 2013 111
There is significant activity as a result of the various standards and labelling programs. There are over 1 000 builders registered to build ENERGY STAR homes and over 30 000 ENERGY STAR homes have been built to date (NRCan, 2013a). Surveys of recent purchasers of home heating and cooling products and appliances indicate that two-thirds chose ENERGY STAR qualified products, and 85% of the respondents indicated that ENERGY STAR qualification was important in their purchase decision (NRCan, 2013a). Figure 7.8 shows the percentage of sales of dishwashers, refrigerators and clothes washers that qualified as ENERGY STAR. The noticeable drop in the number of ENERGY STAR qualified dishwasher shipments (12% between 2009 and 2010) reflects changes in the regulations for this appliance effective in August 2009 (NRCan, 2012c). It is estimated that ENERGY STAR resulted in energy savings of 3.4 PJ in 2011 (NRCan, 2013a).
Figure 7.8 ENERGY STAR qualified appliances as a percentage of total shipments in Canada, 1999-2010
Source: NRCan, 2012c.
Challenges Despite improvements in energy efficiency, Canada’s energy use per capita has increased since 2009, reflecting growth in passenger light trucks and increasing distance and weight of goods transported by heavy trucks, larger houses with fewer people per household and increasing use of electronics (NRCan, 2013c). Canada has a severe climate, energy-intensive economic structure and a small, highly dispersed population, which makes it especially challenging to reduce energy use. Existing policies at all levels of government would benefit from a consistent and robust measurement and evaluation process that monitors energy efficiency market capability and the motivating impact of policies.
Prospects for energy efficiency market activity Given significant investment over the last five years (e.g. almost CAD 1 billion from the federal government) and recent budgetary constraints, federal and provincial governments are providing fewer direct incentives to fund energy efficiency. However, alternative approaches to financing that leverage private capital are being investigated, which may help maintain investment. The Manitoba Power Smart PAYS program is an example of a mechanism that could help fill the funding gap for home retrofits created in 2012 when the ecoENERGY Retrofit – Homes program ended.
0102030405060708090
100
Ship
men
ts (%
)
Model year
Dishwashers Clothes washers Refrigerators
© O
EC
D/IE
A, 2
013

COUNTRY CASE STUDIES: CANADA
112 ENERGY EFFICIENCY MARKET REPORT 2013
There are several other drivers that are expected to influence the efficiency market. The renewal of ageing distribution infrastructure presents opportunities for utilities to invest in smart grid and demand management systems. Provincial and municipal level initiatives are expected to increase, with growing collaboration between the different levels of government, and an increased interest in education and outreach and in setting codes and standards.1 In particular, several of the municipality-owned utilities are taking a very active role in delivering energy efficiency programmes.2 The government of Canada continues to build on its progress in developing labelling and ratings systems, as well as minimum codes and standards. For example, in early 2013 it announced new fuel efficiency standards for heavy-duty vehicles, 2014-18 model years, in alignment with recent US policy. This is in addition to previously announced light-duty vehicle standards that establish progressively more stringent greenhouse gas emission standards for new passenger automobiles and light trucks for the 2011-16 model years. More stringent standards are also proposed for model years 2017-25. Other federal programming also targets the transportation sector, including the voluntary SmartWay Transport Partnership, which could result in savings of approximately 2 000 litres to 3 000 litres of fuel per truck per year from participating Canadian fleets, resulting in overall savings of up to 60 million litres of diesel fuel in 2020 (Energy and Mines Ministers’ Conference, 2012). As of June 2013, two provinces, Ontario and British Columbia, had adopted the recently introduced National Energy Code for Buildings 2011, which is 25% more stringent than the previous code. Twelve Canadian provinces and territories are adopting or adapting the code, and one territory published guidelines that exceed it. The extent to which the provinces and territories adopt the building energy code and support the adoption of complementary ratings systems will be a determining factor in the efficiency of new buildings nationally. The National Energy Code for Buildings 2011 is expected to save CAD 350 million per year in energy costs in 2020 (Energy and Mines Ministers’ Conference, 2012). Conclusions Despite a steady growth in energy consumption, Canada’s energy efficiency has improved by 25.3% since 1990 (NRCan, 2013c). The government of Canada has taken an active role in developing and delivering programmes and policies and co-ordinating with the provinces to promote codes and standards. The close level of co-operation between the different levels of government has helped to ensure consistency in the market and synergy between the different programmes and policies. References Canada Revenue Agency (2010), “Renewable Energy and Energy Conservation”, website, government of Canada, Ottawa, www.cra-arc.gc.ca/tx/bsnss/tpcs/fts-paa/nrgy-eng.html. CIPEC (Canadian Industry Program for Energy Conservation) (2012), 2012 CIPEC Annual Report: Energy Management That Works, government of Canada, Ottawa. Energy and Mines Ministers’ Conference (2012), Moving Forward on Energy Efficiency in Canada: Achieving Results to 2020 and Beyond, government of Canada, Ottawa. 1 See for example, the Vancouver Building Bylaw: http://vancouver.ca/your-government/vancouver-building-bylaw.aspx. 2 See Toronto Hydro for example: www.torontohydro.com/sites/electricsystem/electricityconservation.
© O
EC
D/IE
A, 2
013

COUNTRY CASE STUDIES: CANADA
ENERGY EFFICIENCY MARKET REPORT 2013 113
Government of Ontario (2010), Ontario’s Long Term Energy Plan: Building Our Clean Energy Future, government of Ontario, Toronto. NRCan (2011), “Federal Buildings Initiative – Results”, website, NRCan, Ottawa, http://oee.nrcan.gc.ca/communities-government/buildings/federal/10696. NRCan (2012a), “CAN/CSA-ISO 50001 Energy Management Systems Standard”, website, government of Canada, Ottawa, http://oee.nrcan.gc.ca/industrial/cipec/4101. NRCan (2012b), 2011-12 Departmental Performance Report, government of Canada, Ottawa. NRCan (2012c), Energy Consumption of Major Household Appliances Shipped in Canada 1990-2010, government of Canada, Ottawa. NRCan (Natural Resources Canada) (2013a), ENERGY STAR® in Canada Annual Report 2011-2012, government of Canada, Ottawa. NRCan (2013b), Improving Energy Performance in Canada – Report to Parliament Under the Energy Efficiency Act For the Fiscal Year 2011-2012, government of Canada, Ottawa. NRCan (2013c), Energy Efficiency Trends in Canada 1990 to 2010, government of Canada, Ottawa. StatsCan (Statistics Canada) (2013), “Table 203-0021 – Survey of household spending (SHS)”, CANSIM database, StatsCan, government of Canada, www5.statcan.gc.ca/cansim/a01?lang=eng.
© O
EC
D/IE
A, 2
013

COUNTRY CASE STUDIES: CHINA
114 ENERGY EFFICIENCY MARKET REPORT 2013
8. CHINA
Energy profile and context Various characteristics of China’s energy market are highly favourable for energy efficiency. Demand for energy services continues to grow as China responds to global and internal demand for its wide range of industrial outputs, and as its population grows wealthier and more urban. Meeting the energy needs of a large population is challenging; domestic energy resources, although large in terms of volume, are small when divided on a per-capita basis. Energy imports of oil, gas and coal are increasing. Concerns over local environmental impacts are becoming more acute and are increasingly a key driver of policies for energy efficiency and clean energy. Long distances and underdeveloped energy infrastructure place pressure on the price of fuels. These factors have contributed to an increasingly strong focus on ensuring both energy access and security, while minimising increases in energy prices. This policy context continues to provide fertile ground for energy efficiency investments, even after three decades of active intervention. The Chinese government sees sustained efforts to improve energy efficiency as imperative to deriving the most utility out of constrained energy supplies (Chandler et al., 2011), and also as a key means to achieving social and economic goals. The economy depends on coal for nearly two-thirds of its total primary energy supply (TPES), and on oil (over half of which is now imported) for a further 16% (Figure 8.1). The increasing share of renewable energy is also notable, currently contributing 11% to TPES,1 with a strong policy push aimed at raising its share further. Traditional uses of bioenergy remain important, but virtually all growth in renewables has come from power generation, which has doubled from 401 terawatt hours (TWh) in 2005 to 847 TWh in 2011, and is projected to double again by 2017. The scale and pace of change is unmatched in the world today, with total final consumption (TFC) nearly doubling from approximately 800 million tonnes of oil-equivalent (Mtoe) to over 1 600 Mtoe (Figure 8.1). Industry continues to dominate China’s energy demand, and its absolute energy consumption more than doubled between 2001 and 2011, accounting for nearly half of TFC in 2011 (Figure 8.2). Despite the gradual shift in economic structure toward less energy-intensive sectors in recent years, overall industrial energy demand grew by more than 150% in the past ten years. Transport energy demand 1 Note that China’s national figure for the share of renewable energy in TPES tends to be lower due to differences in accounting techniques, and, consequently, nationally reported shares of non-renewable resources are higher. The International Energy Agency (IEA) uses the physical energy content method to convert renewable energy to TPES, which assumes 33% efficiency for solar thermal and 10% efficiency for geothermal energy. The method used in China assumes 100% efficiency for these resources.
The progress of, and prospects for, energy efficiency markets in China are shaped by the Five-Year Plans, and the policy and market obligations set within them. China’s 11th Five-Year Plan (FYP) from 2006 to 2010 included quantified energy-related targets for the first time, including an aggressive energy-intensity target to reduce energy consumption per unit of gross domestic product (GDP). Updates made to policies and regulations in the 12th FYP (2011-15) reflect the challenges and lessons learned from implementation of the previous FYP under widely varying conditions across the country, with a continued reliance on a managed approach to meeting energy efficiency targets. The scale and pace of change in regional and sectoral sub-markets for energy efficiency are significant and represent some the world’s largest single markets for energy efficiency.
© O
EC
D/IE
A, 2
013
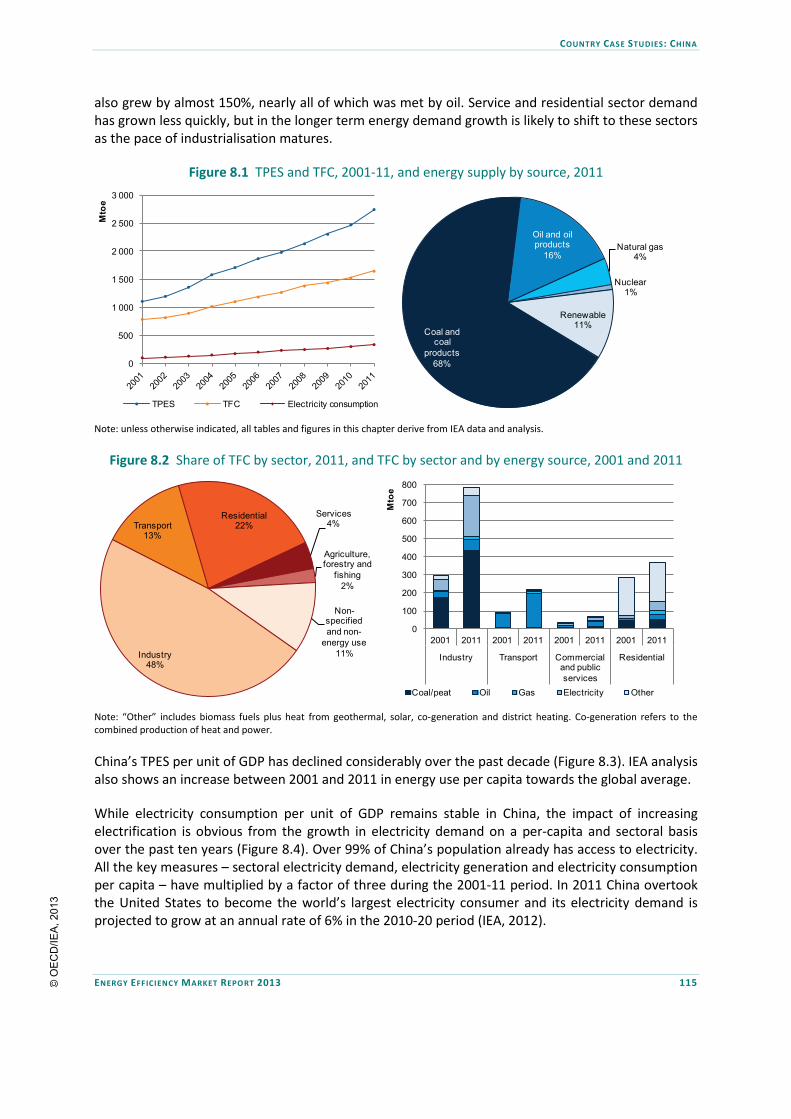
COUNTRY CASE STUDIES: CHINA
ENERGY EFFICIENCY MARKET REPORT 2013 115
also grew by almost 150%, nearly all of which was met by oil. Service and residential sector demand has grown less quickly, but in the longer term energy demand growth is likely to shift to these sectors as the pace of industrialisation matures.
Figure 8.1 TPES and TFC, 2001-11, and energy supply by source, 2011
Note: unless otherwise indicated, all tables and figures in this chapter derive from IEA data and analysis.
Figure 8.2 Share of TFC by sector, 2011, and TFC by sector and by energy source, 2001 and 2011
Note: “Other” includes biomass fuels plus heat from geothermal, solar, co-generation and district heating. Co-generation refers to the combined production of heat and power.
China’s TPES per unit of GDP has declined considerably over the past decade (Figure 8.3). IEA analysis also shows an increase between 2001 and 2011 in energy use per capita towards the global average. While electricity consumption per unit of GDP remains stable in China, the impact of increasing electrification is obvious from the growth in electricity demand on a per-capita and sectoral basis over the past ten years (Figure 8.4). Over 99% of China’s population already has access to electricity. All the key measures – sectoral electricity demand, electricity generation and electricity consumption per capita – have multiplied by a factor of three during the 2001-11 period. In 2011 China overtook the United States to become the world’s largest electricity consumer and its electricity demand is projected to grow at an annual rate of 6% in the 2010-20 period (IEA, 2012).
0
500
1 000
1 500
2 000
2 500
3 000
Mto
e
TPES TFC Electricity consumption
Nuclear1%
Renewable11%
Coal and coal
products68%
Oil and oil products
16%Natural gas
4%
Industry48%
Transport13%
Residential22%
Services4%
Agriculture, forestry and
fishing2%
Non-specified and non-
energy use11%
0
100
200
300
400
500
600
700
800
2001 2011 2001 2011 2001 2011 2001 2011
Industry Transport Commercial and public services
Residential
Mto
e
Coal/peat Oil Gas Electricity Other
© O
EC
D/IE
A, 2
013

COUNTRY CASE STUDIES: CHINA
116 ENERGY EFFICIENCY MARKET REPORT 2013
Figure 8.3 Evolution of energy intensity as a function of GDP, 2001-11
Note: PPP = purchasing power parity; toe = tonnes of oil-equivalent.
Figure 8.4 Changes in electricity generation and consumption, 2001-11
Notes: MER = market exchange rate basis for expressing GDP in real (constant) terms. Electricity use by transport has increased by 300% over the period however it remains a minor source of energy compared to other fuels in the transport sector.
Energy efficiency market activity Current energy efficiency market activity: investment over the 11th FYP period The 11th FYP heralded energy efficiency as a means to advance social and economic development, targeting an ambitious 20% reduction in energy intensity over the five-year period against the 2005 baseline. Key elements in the plan included the Ten Key Projects, the 1 000 Industries Programme and the Obsolete Capacity (Small Plant) Closure programme. In addition, appliance standards and labelling programmes were strengthened, and enforcement of new building codes implemented.
0.16
0.18
0.20
0.22
0.24
0.26
0.28
0.30
0.32
0.34
toe
per t
hous
and
2005
USD
PPP
China
World
100%
150%
200%
250%
300%
350%
400%
2001
= 1
00%
Electricity generation Electricity use by industryElectricity consumption/GDP (MER) Electricity use by transportElectricity consumption per capita Electricity use by residential
© O
EC
D/IE
A, 2
013
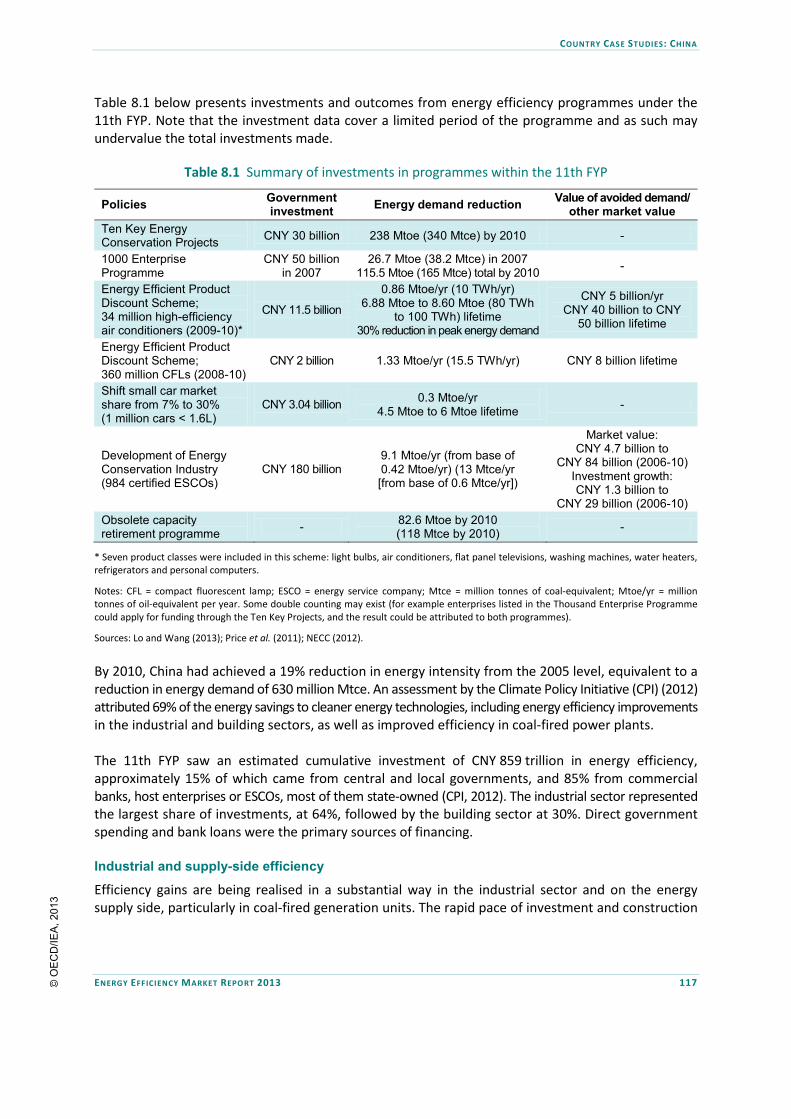
COUNTRY CASE STUDIES: CHINA
ENERGY EFFICIENCY MARKET REPORT 2013 117
Table 8.1 below presents investments and outcomes from energy efficiency programmes under the 11th FYP. Note that the investment data cover a limited period of the programme and as such may undervalue the total investments made.
Table 8.1 Summary of investments in programmes within the 11th FYP
Policies Government investment Energy demand reduction Value of avoided demand/
other market value Ten Key Energy Conservation Projects CNY 30 billion 238 Mtoe (340 Mtce) by 2010 -
1000 Enterprise Programme
CNY 50 billion in 2007
26.7 Mtoe (38.2 Mtce) in 2007 115.5 Mtoe (165 Mtce) total by 2010 -
Energy Efficient Product Discount Scheme; 34 million high-efficiency air conditioners (2009-10)*
CNY 11.5 billion
0.86 Mtoe/yr (10 TWh/yr) 6.88 Mtoe to 8.60 Mtoe (80 TWh
to 100 TWh) lifetime 30% reduction in peak energy demand
CNY 5 billion/yr CNY 40 billion to CNY
50 billion lifetime
Energy Efficient Product Discount Scheme; 360 million CFLs (2008-10)
CNY 2 billion 1.33 Mtoe/yr (15.5 TWh/yr) CNY 8 billion lifetime
Shift small car market share from 7% to 30% (1 million cars < 1.6L)
CNY 3.04 billion 0.3 Mtoe/yr 4.5 Mtoe to 6 Mtoe lifetime -
Development of Energy Conservation Industry (984 certified ESCOs)
CNY 180 billion 9.1 Mtoe/yr (from base of 0.42 Mtoe/yr) (13 Mtce/yr [from base of 0.6 Mtce/yr])
Market value: CNY 4.7 billion to
CNY 84 billion (2006-10) Investment growth: CNY 1.3 billion to
CNY 29 billion (2006-10) Obsolete capacity retirement programme - 82.6 Mtoe by 2010
(118 Mtce by 2010) -
* Seven product classes were included in this scheme: light bulbs, air conditioners, flat panel televisions, washing machines, water heaters, refrigerators and personal computers.
Notes: CFL = compact fluorescent lamp; ESCO = energy service company; Mtce = million tonnes of coal-equivalent; Mtoe/yr = million tonnes of oil-equivalent per year. Some double counting may exist (for example enterprises listed in the Thousand Enterprise Programme could apply for funding through the Ten Key Projects, and the result could be attributed to both programmes).
Sources: Lo and Wang (2013); Price et al. (2011); NECC (2012).
By 2010, China had achieved a 19% reduction in energy intensity from the 2005 level, equivalent to a reduction in energy demand of 630 million Mtce. An assessment by the Climate Policy Initiative (CPI) (2012) attributed 69% of the energy savings to cleaner energy technologies, including energy efficiency improvements in the industrial and building sectors, as well as improved efficiency in coal-fired power plants. The 11th FYP saw an estimated cumulative investment of CNY 859 trillion in energy efficiency, approximately 15% of which came from central and local governments, and 85% from commercial banks, host enterprises or ESCOs, most of them state-owned (CPI, 2012). The industrial sector represented the largest share of investments, at 64%, followed by the building sector at 30%. Direct government spending and bank loans were the primary sources of financing. Industrial and supply-side efficiency
Efficiency gains are being realised in a substantial way in the industrial sector and on the energy supply side, particularly in coal-fired generation units. The rapid pace of investment and construction
© O
EC
D/IE
A, 2
013

COUNTRY CASE STUDIES: CHINA
118 ENERGY EFFICIENCY MARKET REPORT 2013
means that improvements in these areas have a high potential to generate savings in the near future and position China to be a leader in manufacturing highly energy-efficient equipment. Closure of small and inefficient industrial production lines and generation facilities has been a priority since 2007, which signals that growth in the market for high-efficiency power generation and industrial facilities is being driven by replacement demand as well as from new capacity additions. The spillover effects of China’s new high-efficiency industrial and power generation facilities could be significant in the context of global markets.
The efficiency of new coal-fired power plants and the closure of ageing smaller power plants have both contributed tremendously to China’s overall progress in raising energy efficiency, and will continue to be an important factor contributing to security of supply in the future (Box 8.1). Between 2006 and 2011, 85 gigawatts (GW) of small, inefficient power plants were shut down (IEA, 2013a). Supercritical (SC) and ultra-supercritical (USC) coal-fired power plants make up 28% of the Chinese coal power plant fleet, the highest percentage in the world (IEA, 2013a) (Figure 8.5). The first 1 000 MW USC unit entered operation in China in 2007 and by the end of 2011, China had 194 USC units of 600 MW each and 39 USC units of 1 000 MW each (Zhan, 2012). The 12th FYP stipulates that all new plants of 600 MW or more must use SC or USC technology (IEA, 2013a). The expansion of high-efficiency power plants represents a significant improvement compared to many other parts of the world where ageing inefficient coal units are being maintained. In the industrial sector, the aluminium industry is an example of a significant energy efficiency transformation over the past decade: old inefficient units are quickly being replaced with state-of-the-art facilities, and are subject to mandatory energy management plans under the Ten Thousand Enterprise Programme. Energy intensity in the sector has declined from over 17 000 kilowatt hours per tonne (kWh/tonne) (alternating current [AC]) in 1980 to under 14 000 kWh/t in 2010, and advanced new plants have an AC intensity of 13 500 kWh/t or less (for cell production) (Wang, 2012). Aluminium is one of the eight high energy-consuming industries whose electricity prices are based on the energy intensity of the facility – an example of using price to stimulate efficiency investments.
Box 8.1 Importance of supply-side efficiency in managing coal demand
Coal will continue to dominate the energy picture in China for the foreseeable future. Coal currently represents about 68% of China’s TPES and provides nearly 80% of its electricity (IEA, 2012). Chinese coal demand alone is projected to increase from an estimated 75 exajoules (EJ) in 2011 to 93 EJ in 2017 (3.7% per annum) (IEA, 2013). However, at the same time China is increasingly faced with constraints, including energy security, local environmental pollution and climate change, that are creating pressure to change the way coal is used. While carbon capture and storage has long-term potential to mitigate the climate change concern, the near-term supply-side options of energy efficiency and renewable energy also address energy security concerns, in addition to the other multiple benefits discussed in the first chapter of this report (Understanding the Market for Energy Efficiency).
By investing in high-efficiency coal units, China can reduce coal demand and environmental impacts, including emissions of carbon dioxide, as well as NOx, SOx and particulates. The potential is significant: ultra-supercritical units reach an efficiency of 46% compared to the current global fleet average of 33% (IEA, 2013).
© O
EC
D/IE
A, 2
013

COUNTRY CASE STUDIES: CHINA
ENERGY EFFICIENCY MARKET REPORT 2013 119
Figure 8.5 SC and USC capacity in major coal-using countries
Source: IEA, 2013.
Prospects for energy efficiency market activity Under the 11th FYP, most energy savings were achieved in the industrial sectors, with some improvements in buildings, equipment, lighting and transport (Lo and Wang, 2013). The 12th FYP (2011-15), for the most part, enhances and expands programmes in the 11th FYP, meaning key market developments are likely to continue to be focused on the industrial and building sectors. However, several policy shifts may open up new opportunities within these sectors, including regional carbon emissions trading schemes, and the potential for a national carbon trading system by 2020 (Box 8.2). The 12th FYP also introduces a cap on annual primary energy consumption of 4 billion tce by 2015. It is still uncertain how this cap will be implemented or enforced over the coming years; however, it clearly signals how seriously the government considers the issue of efficiency and security of supply.
0
100
200
300
400
500
600
700
800
Aus
tralia
Ger
man
y
Japa
n
Kor
ea
Rus
sia
Sou
th A
frica
Uni
ted
Kin
gdom
2010
2012
2014
2010
2012
2014
2010
2012
2014
China India United States
GW
Subcritical
Supercritical
Ultra-supercritical
Box 8.2 China’s pilot carbon emissions trading schemes
The 12th FYP (2011-15) introduced the concept of a carbon emissions trading scheme. Pilot programmes are being introduced across seven major cities and regions, including Shenzhen, Beijing, Shanghai, Guangdong, Tianjin, Chongqing and Hubei. Each region will have a separate programme, with unique rules and trading platforms. It is expected that China’s economic performance over the coming years will influence which companies will be covered by the regulations and the level of the emissions caps.
In total, the trading scheme is set to be the largest cap and trade system in the world after Europe’s emissions trading system, regulating 800 million to 1 billion tonnes of carbon dioxide emissions by 2015. The first pilot was launched in June 2013 in Shenzhen and covers 638 companies. In this pilot, the carbon cap is tied to carbon dioxide emissions per unit of output. One of the first trades was made on the Shenzhen spot market on 18 June 2013 by PetroChina; a carbon dioxide permit was purchased for CNY 28 (USD 4.57) per tonne (Reuters, 2013).
The design and implementation experience of the seven pilot programmes is expected to influence whether and when a national cap and trade scheme will be implemented in China.
© O
EC
D/IE
A, 2
013

COUNTRY CASE STUDIES: CHINA
120 ENERGY EFFICIENCY MARKET REPORT 2013
The first change in the 12th FYP is the broader application of energy savings obligations and incentives to a more diverse set of industrial actors. The 1 000 Enterprise Programme is now the 10 000 Enterprise Energy Conservation Programme, largely because it has a lower energy consumption threshold for designated entities (10 000 tce as against the previous 180 000 tce). As such, it now encompasses nearly all kinds of industry, not just energy-intensive manufacturing. Enterprises with lower energy consumption have been assigned lower targets, while those of energy-intensive enterprises are more stringent compared with those under the 11th FYP (Lo and Wang, 2013). In addition, subsidies are now available for measures that reduce energy by 5 000 tce, half the previous threshold, and limitations on the use of specific technologies have been removed. The second change will affect efficiency measures and energy use in buildings. The 10 000 Enterprise Programme will also impose energy savings targets on 850 commercial and public buildings and require implementation of energy management systems. In addition, China’s National Development and Reform Commission (NDRC) has introduced progressive electricity tariffs for residential customers, divided into three groups based on their monthly electricity consumption levels. Up to 80% of residential consumers are unaffected, paying the subsidised price, while 5% of consumers exceeding the highest consumption level will pay the highest rate (Xiao, 2010; Xinhua, 2011). Finally, under the 12th FYP, a new emphasis on ESCOs (which have long struggled to gain a foothold in China) is likely to bring about enhanced market activities and investments in the ESCO industry. Besides direct stimulation of the ESCO market, the greater range of energy services required by non-energy-intensive industries, commercial and public buildings, will potentially increase demand for ESCO services. In 2011, the Ministry of Finance introduced subsidies of CNY 240/tce for the eastern region and CNY 300/tce for western and middle regions for energy performance contracts, payable on verified reductions in energy demand. This can be combined with existing incentives under the Ten Key Projects programme, and ESCOs have also been granted various fiscal incentives (on business, income, and value-added tax) since 2010 (Lo and Wang, 2013). Energy provider obligations: significant challenges and opportunities
Continuing concerns about growing electricity demand and the prospects of shortages led the State Council to issue a new Demand-side Management (DSM) Rule on 4 November 2010. Administered by the NDRC, the DSM Rule requires electricity distribution companies to achieve two targets (0.3% peak load reduction from previous year level and 0.3% electricity consumption deduction from previous year). The DSM Rule requires the two large government-owned grid companies (State Grid Corporation and China Southern Grid) to achieve both end-use energy efficiency and upstream energy savings (e.g. line loss reductions). The DSM Rule also requires specific measures: the installation of load monitoring equipment on 70% of peak load, and load control equipment on 10% of the peak load (Crossley et al., 2012). Grid companies are ultimately responsible for financing the cost of complying with the DSM Rule, incorporating the related expenses into their power supply costs. Provincial governments are also establishing new funding sources to support their additional costs, such as surcharges collected through electricity tariffs, revenues from differential pricing for energy-intensive users, or special funds supported by government budgets (Crossley et al., 2012).
© O
EC
D/IE
A, 2
013

COUNTRY CASE STUDIES: CHINA
ENERGY EFFICIENCY MARKET REPORT 2013 121
Both State Grid Corporation and China Southern Grid Company are positioning themselves to use all the energy savings options available to them. State Grid Corporation has created provincial ESCO subsidiaries in all 26 provinces in its service territory, and signed contracts worth 0.7 TWh of annual savings (Heffner et al., 2013). State Grid has also launched an end-use energy efficiency promotional campaign, as well as starting construction of high-voltage direct current transmission lines, which will decrease grid losses by 0.07%. China Southern’s Green Action Programme features early closure of low-efficiency coal-fired power plants, selection of energy-efficient transformers, and 27 TWh of energy savings (by 2015) from high-efficiency lighting, electrical devices and appliances (Crossley et al., 2012). Although modest by the standard of energy efficiency obligations in the United States, for example, complying with China’s DSM Rule will be a major challenge for provincial grid companies and governments. Many energy efficiency obligation issues faced by regulators and energy providers will have to be resolved.2 Devolving responsibility to provinces means that dozens of different approaches may develop, complicating the overall compliance process for central authorities, but creating a significant learning capability. The compliance arrangements, measurement and verification arrangements, methods for integrating demand and supply planning, and establishment and regulation of hundreds of ESCOs at the provincial and local distributor level will all drive new large-scale markets for energy efficiency technologies and services. Financial markets
The energy efficiency market is in large part financed by loans offered by state-owned banks to large state-owned enterprises for efficiency investments. Since 2004, total energy efficiency loans in China have been increasing steadily, from CNY 10 billion to nearly CNY 90 billion in 2008, with more than half of loans by volume and more than two-thirds of energy efficiency clients by number provided by public banks (World Bank, 2010). Investment in energy performance contracts has been growing since 2004. According to the World Bank (2010), total investment increased from below USD 100 million in 2004 to USD 1.46 billion by 2008. The International Finance Corporation (2011) estimates that the total investment opportunity in the Chinese energy efficiency market exceeds USD 100 billion. While large state-owned enterprises generally have ample access to financing for energy efficiency, small and medium-sized enterprises (SMEs) have difficulty accessing loans due to lack of credit history, inexperience with or high risk perception of energy efficiency projects on the part of loan officers, lack of fixed asset collateral (efficiency projects lead to savings not revenue) and tightening of bank lending policies, forcing SMEs to turn to private lenders (Chandler et al., 2011 and Romankiewicz et al., 2012). According to the International Finance Corporation (2011), the main sources of funding for ESCO projects are 100% equity from third-party investors or long-term debt from local lenders, or a combination thereof. Local lenders typically require at least 30% equity and liquid collateral equal to or exceeding the loan amount. Expansion of financing from non-public sources to fund efficiency projects would allow the energy efficiency market to grow and decrease its dependence on government policies. To increase access to financing, the World Bank introduced, through the International Finance Corporation, the China Utility-Based Energy Efficiency (CHUEE) Finance Program in 2006. The programme 2 These include controlling overhead costs, keeping energy providers financially viable, managing bill increases due to financing energy efficiency, balancing least-cost energy savings with equity concerns, and avoiding any excesses from trading or proliferation of third-party energy efficiency providers.
© O
EC
D/IE
A, 2
013

COUNTRY CASE STUDIES: CHINA
122 ENERGY EFFICIENCY MARKET REPORT 2013
targets multi-household residential, commercial and industrial consumers, and provides marketing, engineering, project development and financing services (including partial loan guarantees) for energy efficiency projects. As of September 2012, the CHUEE programme’s participating banks have provided loans worth over USD 800 million, financing more than 170 energy efficiency/renewable energy projects. While this is useful stimulus, even together with China’s internal financing capability it remains well short of the identified potential. The significant contribution of the programme appears to be capacity building in the banking sector, and the establishment of a risk-sharing mechanism to overcome unfamiliarity with efficiency projects. Challenges Significant growth in economic development and energy services demand in China will continue to challenge energy efficiency markets. The complex administrative system, at national and local levels, and the heavy reliance on regulatory approaches is driving necessary medium-term progress, but can ultimately delay the full development of energy efficiency markets. Despite the broad framework provided by the five-year plans, the above factors along with the diversity of targets, (energy intensity, carbon intensity and renewable generation) can make it difficult for policies to be implemented and for companies to develop long-term investment strategies. Tracking the progress of energy efficiency market developments is central to ensuring that policies will continue to grow these critical markets. Conclusions The ongoing growth-related challenges faced by China in the energy sector suggest that the energy efficiency market will need to continue to grow. The government has clearly recognised that increasing energy efficiency provides essential economic and social value. Rapidly increasing energy demand, urbanisation and the changing structure of the economy will continue to drive significant new investments in buildings, transport and energy infrastructure, representing an enormous opportunity for efficiency gains. ESCOs and energy providers will play a growing role in enabling these improvements. Investments made in highly efficient technologies and equipment are positioning China as a leader in the field and raising the bar for industry globally. The pilot carbon emissions trading programme launched in June 2013 is an interesting example of a market-based approach that could significantly help to expand the efficiency market in China. References Chandler, W., H. Gwin and S. Chen (2011), Financing Energy Efficiency in China: 2011 Update, Energy Transition Research Institute, Annapolis. CPI (Climate Policy Initiative) (2012), Annual Review of Low Carbon Development in China 2011-2012, CPI, Beijing. Crossley, D., et al., (2012), Best Practices in Designing and Implementing Energy Efficiency Obligation Schemes, International Energy Agency Demand Side Management Programme, Task XXII Research Report, The Regulatory Assistance Project, Montpelier, Vermont. IEA (International Energy Agency) (2012), World Energy Outlook 2012, OECD/IEA, Paris. IEA (2013), Tracking Clean Energy Progress 2013: IEA Input to the Clean Energy Ministerial, OECD/IEA, Paris.
© O
EC
D/IE
A, 2
013

COUNTRY CASE STUDIES: CHINA
ENERGY EFFICIENCY MARKET REPORT 2013 123
IFC (International Finance Corporation) (2011), IFC Energy Service Company Market Analysis, Final Report, Revised, IFC, Washington DC. Heffner, G., et al. (2013), Energy Provider-Delivered Energy Efficiency: A global stock-taking based on case studies, IEA Insights Series, OECD/IEA, Paris. Lo, K. and M. Wang (2013), “Energy Conservation in China’s Twelfth Five-Year Plan Period: Continuation or Paradigm Shift?”, Renewable and Sustainable Energy Reviews Vol. 18, Elsevier, Amsterdam, pp. 499-507. NECC (National Energy Conservation Centre) (2012), From 11th FYP to 12th FYP China’s Achievements and Priorities in the Field of Energy Conservation, National Energy Conservation Centre, Beijing. Price, L., et al. (2011), “Assessment of China’s Energy-saving and Emission Reduction Accomplishments and Opportunities During the 11th Five Year Plan,” Energy Policy, Vol.39, Issue 4, Elsevier, Amsterdam, pp. 2165-2178. Reuters (2013), “China Takes Cautious Step toward Carbon Emissions Trading”, press release, 18 June, www.reuters.com/article/2013/06/18/us-china-carbon-trading-idUSBRE95H03M20130618. Romankiewicz, J., et al. (2012) Addressing the Effectiveness of Industrial Energy Efficiency Incentives in Overcoming Investment Barriers in China, China Energy Group, Environmental Energy Technologies Division, Lawrence Berkeley National Laboratory, Berkeley. Wang, Y. (2012), Effective Policy Levers to Promote Industrial EE – Example from Chinese Aluminium Industry, Tsinghua University, Beijing, www.ipeec.org/docs/eeg/2_4_WANG_Yanjia.pdf. World Bank (2010), Assessing the Impact of IFC’s China Utility-based Energy Efficiency Finance Program, World Bank, Washington, DC. Xiao, W. (2010), NDRC Proposes Stepwise Residential Power Tariff, Natural Resources Defence Council (NRDC), Beijing, www.nrdc.cn/english/E_news_center_flag.php?id=933&cid=208. Xinhua (2011), China Hikes Power Tariffs, Adjusts Coal Prices to Ease Power Shortages, press release, 30 November, http://news.xinhuanet.com/english2010/china/2011-11/30/c_131280061.htm. Zhan, L. (2012), Clean Coal Power Generation in China, Cleaner Fossil Energy Securing a Cleaner Energy Future, APEC Clean Fossil Energy Technical and Policy Seminar 2012, Gold Coast, Australia, 21-24 February, www.egcfe.ewg.apec.org/publications/proceedings/CFE/Austrailia_2012/2C-1_Zhan.pdf.
© O
EC
D/IE
A, 2
013

COUNTRY CASE STUDIES: EUROPEAN UNION
124 ENERGY EFFICIENCY MARKET REPORT 2013
9. EUROPEAN UNION
Energy profile and context Total primary energy supply (TPES) for the 27 EU member states totalled 1 654 Mtoe in 2011 (approximately 60% of China’s 2011 TPES), primarily comprising oil (33%) and natural gas (25%), while total final consumption (TFC) totalled 1 144 Mtoe. TFC increased slightly from 2000 to 2003, and remained relatively steady till 2008. After declining nearly 6% between 2008 and 2009, it rose slightly in 2010 before dropping back to 2009 levels in 2011 (Figure 9.1).
Figure 9.1 TPES and TFC, 2001-11, and energy supply by source, 2011
Note: unless otherwise indicated, all tables and figures in this chapter derive from International Energy Agency (IEA) data and analysis.
The amount of energy used per unit of gross domestic product (GDP) has declined steadily since 2001 (Figure 9.2). As reflected in this figure, growth in TPES appears largely to have decoupled from GDP growth, meaning that economic growth has generally exceeded growth in energy consumption. According to the EU’s Odyssee indicators, energy consumption per unit of GDP has declined steadily at approximately 1.5% annually since 2001. The indicators attribute approximately 20% of the decline
0
200
400
600
800
1 000
1 200
1 400
1 600
1 800
2 000
Mto
e
TPES TFC Electricity consumption
Nuclear15%
Renewable10%
Coal and coal
products17%
Oil and oil products
33%
Natural gas25%
In 2007, European Union (EU) member states agreed they would work to improve energy efficiency by 20% by 2020, expressed as a limit on energy consumption 20% below the projected 2020 level. Updated to reflect Croatia’s accession to the EU, the limit is set at 1 483 million tonnes of oil equivalent (Mtoe) of primary energy consumption in 2020. Various European directives have been adopted to improve the energy efficiency of appliances, equipment, vehicles and buildings, and have transformed products and services within these markets. However, expectations that these efforts would be insufficient to meet the 2020 target led to the adoption of the 2012 Energy Efficiency Directive (EED), in addition to the 2011 Transport White Paper and measures to enhance financing opportunities for energy efficiency investments. Revisions to existing directives will continue to deepen and expand efficiency markets. It is anticipated that the EED will improve the efficiency of the whole energy chain, from transformation to final use. The new directive is also expected to expand utility obligation programmes by requiring increased energy efficiency investments. Energy efficiency markets, particularly in the residential and commercial sectors, are expected to continue to grow moderately to 2020.
© O
EC
D/IE
A, 2
013

COUNTRY CASE STUDIES: EUROPEAN UNION
ENERGY EFFICIENCY MARKET REPORT 2013 125
in energy intensity to structural changes in the economy, namely the shift from more energy-intensive activities towards less energy-intensive services. Energy efficiency improvements also supported this trend; they have been highest in the residential sector, followed by industry. However, since 2007 the industrial and freight transport sectors have seen a reversal in efficiency improvements, attributed to the economic crisis (leading to factories not running at full capacity, and lower load factors for goods transport) (Odyssee, 2013a). Per-capita consumption remained relatively steady from 2000 to 2008. After declining in 2009, it reached 3.42 toe per capita in 2010, well above the World average of 1.87, but below the IEA average of 4.7.
Figure 9.2 Evolution of energy intensity as a function of GDP, 2001-12
Notes: PPP = purchasing power parity. Data for 2012 are estimates.
Figure 9.3 Share of TFC by sector, 2011, and TFC by sector and by energy source, 2001 and 2011
Note: “Other” includes biofuels plus heat from geothermal, solar, co-generation and district heating. Co-generation refers to the combined production of heat and power.
Since 2001, final energy consumption has shifted away from industry and toward services and transport (Figure 9.3). Buildings in the residential and service sectors represent the largest consumer of energy, totalling approximately 40% of TFC in 2010 (Eichhammer et al., 2012).
0.10
0.12
0.14
0.16
0.18
0.20
0.22
toe
per t
hous
and
2005
USD
PPP
World
IEA member countries
European Union
Industry24%
Transport28%
Residential24%
Services12%
Agriculture, forestry and
fishing2%
Non-specified and non-
energy use10%
0
50
100
150
200
250
300
350
2001 2011 2001 2011 2001 2011 2001 2011
Industry Transport Commercial and public services
Residential
Mto
e
Coal/peat Oil Gas Electricity Other
© O
EC
D/IE
A, 2
013

COUNTRY CASE STUDIES: EUROPEAN UNION
126 ENERGY EFFICIENCY MARKET REPORT 2013
Electricity generation and per-capita consumption have been increasing since 2001; by contrast, electricity consumption per unit of GDP began to decrease around 2004 and has remained steady since 2007 (Figure 9.4). Electricity use has steadily increased in the residential sector, while industrial use decreased significantly around 2008 as a consequence of the economic crisis, picking up since 2009. The increase in electricity consumption since 2001 has also been driven by the services sector, in which consumption increased by 2.8% per year on average (Odyssee, 2013a).
Figure 9.4 Changes in electricity generation and consumption, 2001-11
Note: MER = market exchange rate basis for expressing GDP in real (constant) terms.
Market variable: end-user energy prices In the European Union, end-user energy prices are an important driver of energy efficiency improvements. In general, energy price expectations are important in valuing the attractiveness of energy efficiency investments, as they affect the expected value of resulting energy savings (Ryan et al., 2011). Increases in global oil prices over the past decade, along with excise taxes applied on various fuel types, have stimulated enhanced efficiency activity and driven technological innovation in various sectors within the European Union, notably light-duty vehicles (Odyssee, 2013a). The relative pricing of energy and the cost of energy efficiency investments in the European Union are not only driven by market forces, but also by several EU-level policy measures, such as the 2006 Value Added Tax (VAT) Directive. The directive specifies certain products and services that can benefit from VAT reductions; however various energy-saving materials such as building insulation materials are not eligible for these reduced rates. Energy prices are also affected by the 2003 Energy Taxation Directive, which sets minimum tax rates for a range of fuels, with some exemptions. Discussions on reforming the Directive to set minimum taxation rates based on energy content (as opposed to volume) and carbon dioxide (CO2) content are still ongoing.
85%
90%
95%
100%
105%
110%
115%
120%
2001
= 1
00%
Electricity generation Electricity use by industryElectricity consumption/GDP (MER) Electricity use by transportElectricity consumption per capita Electricity use by residential
© O
EC
D/IE
A, 2
013
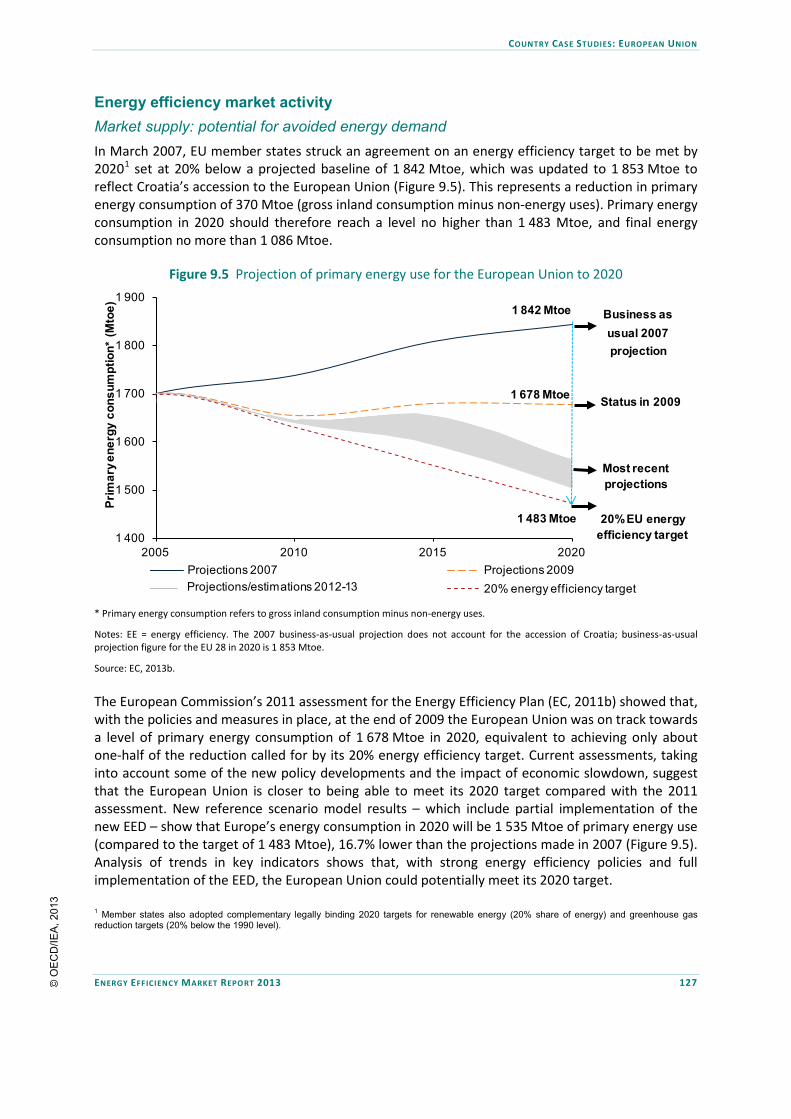
COUNTRY CASE STUDIES: EUROPEAN UNION
ENERGY EFFICIENCY MARKET REPORT 2013 127
Energy efficiency market activity Market supply: potential for avoided energy demand In March 2007, EU member states struck an agreement on an energy efficiency target to be met by 20201 set at 20% below a projected baseline of 1 842 Mtoe, which was updated to 1 853 Mtoe to reflect Croatia’s accession to the European Union (Figure 9.5). This represents a reduction in primary energy consumption of 370 Mtoe (gross inland consumption minus non-energy uses). Primary energy consumption in 2020 should therefore reach a level no higher than 1 483 Mtoe, and final energy consumption no more than 1 086 Mtoe.
Figure 9.5 Projection of primary energy use for the European Union to 2020
* Primary energy consumption refers to gross inland consumption minus non-energy uses.
Notes: EE = energy efficiency. The 2007 business-as-usual projection does not account for the accession of Croatia; business-as-usual projection figure for the EU 28 in 2020 is 1 853 Mtoe.
Source: EC, 2013b.
The European Commission’s 2011 assessment for the Energy Efficiency Plan (EC, 2011b) showed that, with the policies and measures in place, at the end of 2009 the European Union was on track towards a level of primary energy consumption of 1 678 Mtoe in 2020, equivalent to achieving only about one-half of the reduction called for by its 20% energy efficiency target. Current assessments, taking into account some of the new policy developments and the impact of economic slowdown, suggest that the European Union is closer to being able to meet its 2020 target compared with the 2011 assessment. New reference scenario model results – which include partial implementation of the new EED – show that Europe’s energy consumption in 2020 will be 1 535 Mtoe of primary energy use (compared to the target of 1 483 Mtoe), 16.7% lower than the projections made in 2007 (Figure 9.5). Analysis of trends in key indicators shows that, with strong energy efficiency policies and full implementation of the EED, the European Union could potentially meet its 2020 target.
1 Member states also adopted complementary legally binding 2020 targets for renewable energy (20% share of energy) and greenhouse gas reduction targets (20% below the 1990 level).
1 400
1 500
1 600
1 700
1 800
1 900
2005 2010 2015 2020Projections 2007 Projections 2009Projections/estimations 2012/3 20% energy efficiency target
Prim
ary e
nerg
y co
nsum
ptio
n*(M
toe) Business as
usual 2007 projection
1 842 Mtoe
1 483 Mtoe
Status in 2009
Most recent projections
20% EU energy efficiency target
1 678 Mtoe
Projections/estimations 2012-13
© O
EC
D/IE
A, 2
013

COUNTRY CASE STUDIES: EUROPEAN UNION
128 ENERGY EFFICIENCY MARKET REPORT 2013
The targeted level of avoided energy is higher than assessments of the cost-effective potential for savings from demand-side energy efficiency of 255 Mtoe in 2020 (Ecofys and Fraunhofer ISI, 2010), primarily because it includes supply-side efficiency options. Economic energy savings potential in energy transformation, distribution and transmission has been assessed at 173 Mtoe in 2020 (EC, 2011a). Estimated investment needed to meet the EU targets
Estimated levels of investment needed to reach the energy savings targets in 2020 range from EUR 80 billion to EUR 120 billion annually from 2010 to 2020. The largest part of the investment is expected to be in buildings (EUR 35 billion to EUR 60 billion annually) and transport (EUR 30 billion to EUR 50 billion annually), as well as industry (EUR 10 billion annually) (Odyssee, 2013b). The estimated investment requirements in the buildings sector have a relatively higher degree of uncertainty than other sectors, as they vary considerably depending on whether energy efficiency retrofits of existing buildings (the largest share of the required investment) occur separately from, or concurrently with, non-energy-related refurbishment activity. Value delivered
Meeting the 2020 target is expected to reduce the EU’s annual oil imports by 2.6 billion barrels in 2020, saving EUR 193 billion in the same year (Barroso, 2013). The European Commission’s assessment of its initial proposal for an EED found significant economic benefits from implementation of the directive, due to reduced energy demand, moderation of energy prices, avoided investment in new energy infrastructure, fewer energy imports and stimulation of market activity in energy services, notably construction and installation. It predicted that the directive would increase EU GDP by EUR 34 billion and net employment by 400 000 in 2020, compared with a baseline scenario. The renovation of public buildings and enhanced use of energy services would stimulate business activity and create jobs.
Figure 9.6 Direct and avoided costs in five-year periods as a result of the EED
* Power and steam refers to generation and distribution.
Note: The EED as passed is expected to deliver less avoided energy than the original directive proposal by the European Commission (potentially by approximately 25%), and therefore direct and avoided costs are likely to vary from the above assessment.
Source: EC, 2012c.
-500
-300
-100
100
300
2011-15 2016-20 2021-25
2008
EU
R b
illio
n
Investment cost – energy efficiency Investment cost – power and steam*Energy expenditure Total energy system costs for stationary uses
© O
EC
D/IE
A, 2
013

COUNTRY CASE STUDIES: EUROPEAN UNION
ENERGY EFFICIENCY MARKET REPORT 2013 129
Analysis of EED implementation investment needs has found that, over the period between 2011 and 2020, investment in energy efficiency would average EUR 24 billion annually, while reduced costs for investment in energy generation and distribution and reduced fuel expenditure would together average EUR 44 billion annually. As a result, the average annual reduction in overall spending on energy would be approximately EUR 20 billion over the same period (Figure 9.6). Market driver: energy efficiency policies and programmes Various measures set at EU level have been implemented across member states to limit and reduce energy consumption.2 A 2009 European Commission analysis, which projected that only 164 Mtoe of energy savings would be delivered in 2020, led to implementation of strengthened energy efficiency measures, notably the EED. This directive covers various sectors, such as the public sector, buildings, and utilities (Table 9.1).
Box 9.1 EU legislation at work
All member states but two put forward national indicative energy efficiency targets by the deadline of 30 April 2013, as required by the EED.3 The majority also complied with “translating” their target into projected primary and final energy consumption levels for 2020. The primary energy consumption targets of the 20 member states available thus far add up to 1 362 Mtoe, about 91.8% of the EU target of 1 483 Mtoe in 2020. The 22 final energy consumption targets add up to 1 039 Mtoe, or 95.7% of the EU target of 1 086 Mtoe in 2020 (as a point of comparison, these member states accounted for 88.9% of EU primary energy consumption and 93.3% of EU final energy consumption in 2010).
Based on these preliminary targets,4 it appears that most member states are collectively working towards a level of primary and final energy consumption in line with the overall EU target for 2020, though a gap still remains, particularly for the primary energy target.
More than half of the savings to 2020 stem from the EED’s requirement for member states to implement, from 2014, energy efficiency obligation schemes, and/or alternative policy measures (e.g. financing, fiscal measures, voluntary agreements), to achieve a certain amount of final energy savings over the 2014-20 obligation period. The EED also includes various measures, including:
• to promote long-term political commitment (e.g. by setting indicative national targets, national energy efficiency plans, building roadmaps, co-generation and heating and cooling assessments);
• to engage the public sector in market transformation (e.g. provision of energy performance model contracts and sharing of best practice);
• to facilitate information provision (e.g. through metering and billing, and energy audits); and
• to promote the provision of energy services (e.g. through the creation of registers, quality labels, points of contact and market monitoring) (see Table 9.1 for further examples).
The EED represents the major driver for energy efficiency markets within the EU in the medium term, and the market prospects related to its implementation are discussed further below. In addition, the EED requires that member states include a “qualitative review” in their energy efficiency action plans to monitor and evaluate their energy services markets. This holds potential for improved capacity to assess the energy efficiency market, though implementation will face various data and methodological challenges (Offerman et al., 2013).
2 These include the 2007 Energy Efficiency Action Plan, the 2006 Energy Services Directive, the 2004 Combined Heat and Power Directive, the 2002 and recast 2010 Energy Performance of Buildings Directive, and the 2009 Ecodesign Directive. 3 The indicative national targets that are reported to the Commission are available at: http://ec.europa.eu/energy/efficiency/eed/reporting_en.htm. 4 Taking into consideration that the member states reporting on primary energy are not necessarily the same as those reporting on final energy.
© O
EC
D/IE
A, 2
013

COUNTRY CASE STUDIES: EUROPEAN UNION
130 ENERGY EFFICIENCY MARKET REPORT 2013
Other actions have also been adopted, such as additional measures under the Ecodesign and Energy Labelling Directives, and increased financing, mainly as part of cohesion funds. The Transport White Paper of 2011 is also expected to deliver additional energy savings.
Table 9.1 Energy efficiency market drivers in the EED
Sector Measures
Public sector: buildings, appliances, equipment
Requirement to renovate 3% of buildings owned and occupied by central government; requirement for public purchasing to drive market transformation and promote innovative financing.
Utilities, public authorities, industry, residential, tertiary, transport sectors
Energy savings target for energy suppliers to reduce their annual energy sales to final consumers by 1.5%. This must be achieved in each member state, using energy efficiency obligation schemes or alternative policy measures. The target can exclude transport, and up to 25% of the target can be met using other options, including early actions (e.g. pre-existing energy efficiency obligation schemes that have delivered energy savings.)
Utilities Metering and billing to provide consumers with basic rights to information about their energy consumption.
National authorities, utilities, industry
Obligation on member states to assess potential for co-generation of heat and power, cost-benefit analyses, and policies that take these assessments into account.
Utilities Improving efficiency of energy transmission, aimed at increased efficiency from the management of energy infrastructure.
Industry, SMEs, households
Obligatory energy audits, providing information and triggering action mainly in large companies; mandatory promotion of audits, particularly for SMEs and households.
Note: SMEs are small and medium-sized enterprises, defined as companies with fewer than 250 employees, and either a turnover of under EUR 50 million or a balance sheet of under EUR 43 million.
Source: Directive 2012/27/EU of the European Parliament and of the Council.
Current energy efficiency market activity Energy efficiency activity occurs across all economic sectors in the European Union, largely driven by both EU and national government legislation and policies, as well as by relatively high end-user energy prices, which allow for valuable energy savings. The EU directives mentioned above have created and stimulated markets for energy services, more efficient appliances, equipment and vehicles, and energy-saving products for buildings. This has in part occurred through mandating the supply of efficiency measures, through standards (such as for appliances, vehicles and buildings), and supporting demand for efficiency through labelling. Various incentive measures implemented at member state level also strengthen demand for energy efficiency. In the buildings sector, the EU Energy Performance of Buildings Directive (EPBD) and its 2010 revision represents one of the world’s most progressive energy efficiency laws for new buildings. It sets minimum energy performance requirements for existing buildings that undergo major renovation, and requires the issuance of an energy performance certificate (EPC) for new construction, as well as for buildings being sold or rented out. Implementation of the recast directive at member state level is advancing, and its full impact is therefore yet to be seen; major challenges include compliance with regulations, and monitoring of EPC quality. Nevertheless, EPCs have stimulated a range of market activity related to training, certification and inspection of buildings, heating, and cooling systems (CA EPBD, 2010). A recent assessment found that EPCs have a positive impact on sales and rental prices, indicating that increased levels of energy efficiency are rewarded in the market (BIS, RL and IEEP, 2013). In most member states examined, the analysis found that improving energy performance ratings by one level (e.g. from a less efficient “C” rating to a more efficient “B” rating) results, on average, in a 3% to 5% increase in sales price, or higher average rental value.
© O
EC
D/IE
A, 2
013

COUNTRY CASE STUDIES: EUROPEAN UNION
ENERGY EFFICIENCY MARKET REPORT 2013 131
Energy efficiency investment by large private companies with a real estate portfolio favours new buildings, although companies in the European Union invest more in energy efficiency retrofits than in other regions (43% of Economist Intelligence Unit survey respondents in the European Union invest in retrofits in preference to new buildings, compared with 37%, 23% and 14% in the United States, China and India respectively) (EIU, 2013). There is also evidence to suggest that market professionals have embedded “green building” characteristics, including energy use, into real estate investment and asset management programmes as a result of several factors: • EU and member state regulatory pressure; • increased market demand for such buildings; and • heightened risk from the physical impacts of climate change (IIGC, 2013). EU policies, notably the Ecodesign and Energy Labelling Directives, have also led to significant transformation within certain energy-consuming product markets, notably appliances, and professional and commercial equipment, by excluding the most inefficient ones from the EU market, and providing transparent information on energy consumption via labelling (for further information refer to Chapter 4). The European Union has also long had high levels of passenger vehicle efficiency, in part driven by high oil prices, and is home to one of the world’s largest vehicle markets and a large number of innovative manufacturers and suppliers. The market was significantly affected by EU regulation limiting CO2 emissions from new passenger cars, promulgated in 2009. The effects were seen as early as 2007, as manufacturers anticipated the regulation. Average grams of CO2 per kilometre (gCO2/km) have decreased by approximately 3% per year, reaching 135.7 gCO2/km in 2011, close to the target of 130 gCO2/km established for 2015. The decrease has been most pronounced in gasoline vehicles since 2005, and significant developments in vehicle design have allowed overall emissions to decrease even as average vehicle mass has increased. Use of gasoline direct injection in passenger cars, which increases fuel efficiency, has increased markedly, particularly since 2008, and represented 20% of the overall market in 2011. Vehicle manufacturers and suppliers remain significant investors in research and development (R&D) in the European Union, with investment of approximately EUR 35 billion in 2011, representing 25% of private R&D spending in the European Union and approximately 5% of the EU vehicle industry’s annual turnover (JRC, 2013). Challenges The use of policy levers to stimulate investment and market activity can be challenging, with outcomes potentially falling short of expected energy savings. In the European Union, ensuring that potential energy savings are fully realised can be difficult, as implementation within each member state may be uneven and incomplete. For example, this has been a challenge with the EPBD. Different ways of implementing directives can also hinder EU-wide market activity. For example, variations in building standards, energy performance ratings and particular advantages associated with different ratings (e.g. receipt of fiscal incentives or improved resale values), are impediments to the provision of energy services across national markets. Prospects for energy efficiency market activity Utilities
The EED holds significant potential to spur energy efficiency market activity across a range of sectors. One notable illustration is the requirement that utilities achieve energy savings equivalent to 1.5% of their sales from 2014 to 2020. A certain amount of flexibility was introduced in the relevant article, for example allowing obligated parties to count reductions achieved by energy service providers or other third parties towards their target, provided that control and verification mechanisms are in
© O
EC
D/IE
A, 2
013

COUNTRY CASE STUDIES: EUROPEAN UNION
132 ENERGY EFFICIENCY MARKET REPORT 2013
place. Certain exemptions can also apply as long as they do not reduce the overall reduction target by more than 25%, such as energy savings achieved by certain energy supply-side measures, or by “early” actions. The latter category might potentially allow countries with existing energy efficiency obligation schemes to count savings under these activities towards the target set out in the directive. The directive also allows member states to take alternative policy measures rather than implement energy efficiency obligation schemes, as long as these achieve an equivalent amount of energy savings and follow certain criteria. Implementation may vary significantly by member state: countries with existing obligation schemes could continue these, while others might continue alternative programmes that have been successful, such as the KfW renovation loan and subsidy programmes operating in Germany.5 Preliminary information indicates that the EED will stimulate broader implementation of energy efficiency obligation schemes. Currently in place in five EU member states (France, Denmark, Italy, Poland and the United Kingdom), an additional ten countries may now be considering obligation schemes. This is likely to trigger a significant increase in efficiency activity by utilities, as well as in the energy service company (ESCO) market. The latter is likely to expand in the public and commercial sectors, and also potentially in the industrial sector. From the perspective of the electric utility sector, the various flexibility mechanisms and options for alternative policy measures create uncertainty in how the EED’s 1.5% target will be implemented. Along with a lack of clarity on the continuing stringency of climate targets, the utility sector believes policy uncertainty will affect the scale and type of energy efficiency activity in the medium term. Broader structural factors will also influence the role of electric utilities within the energy efficiency market, notably longer-term changes in the way electricity is generated and distributed, likely towards less centralised business models. While, utilities are likely to remain key energy service providers in the medium term, and may begin testing new business models, structural changes to the centralised generation and delivery of energy may also favourably position other energy efficiency market actors, such as supermarkets and large retailers. ESCOs, buildings and industry
The European ESCO and energy services market had a market value of between EUR 6.7 and EUR 8.5 billion in 2010, and is seen by experts as a strong market in the medium term. Its potential market size has been estimated at EUR 25 billion in 2020 (Bertoldi et al., 2010). While the ESCO market will benefit from the EED’s 3% refurbishment provision for public buildings, their small share of the total building stock means the EED’s impact on buildings will be modest. Nonetheless, ESCOs and energy performance contracting models are likely to see growth in the period to 2020, due to the increase in building refurbishment and renovation activity necessary to meet energy and climate targets. Climate and efficiency targets will require higher renovation rates in existing buildings, with an expansion of energy auditing and certification activity. The emergence of new market players and technologies, such as three-dimensional surveying and pre-fabricated mass customisation approaches, is anticipated, as actors in the construction value chain look to energy efficiency as a growth market. However, given the need for public subsidies to support investment in deep renovations, some see this market segment growing slowly to 2020. In new construction, the market will focus on near-zero energy buildings, combining very low energy demand with building-integrated renewable energy sources. Market impacts of the recast EPBD, in combination with EED measures, will unfold through 5 KfW is a German government-owned development bank.
© O
EC
D/IE
A, 2
013

COUNTRY CASE STUDIES: EUROPEAN UNION
ENERGY EFFICIENCY MARKET REPORT 2013 133
to 2020. In addition, the revision of the EPBD, scheduled for 2016, is viewed by some experts as having the potential to drive greater market activity, and possibly create a more coherent and ambitious framework for energy efficiency markets in the building sector. Prospects for market activity in the industrial sector are weaker; the EU emissions trading system (EU-ETS) has not created strong efficiency markets for industry, and audit requirements under the EED are considered weak. Efficiency obligation schemes could be used by countries to stimulate efficiency investment in the industrial sector, depending on how the schemes are designed. Investments: public funding programmes The European Commission and EU public financial institutions have extensive programmes to support investment in energy efficiency (Table 9.2). EU investments are planned over a multi-annual period in line with the EU budget. In addition, European development banks provide funding for energy efficiency projects in the form of soft loans and guarantees. Table 9.2 is a summary of EU-level funding for energy efficiency, with information (where assessed) on leveraged investments and avoided energy outcomes.
Table 9.2 EU energy efficiency funding
Funding source Funding for energy efficiency
Time period
Leveraged investments
Estimated energy savings
Cohesion Policy EUR 5.5 billion 2007-13 - - Research Funding EUR 290 million 2007-13 - - Enlargement Funding* EUR 112 million 2010-12 EUR 518 million - European Energy Efficiency Fund
Approximately EUR 186 million
Since 2011 - -
Intelligent Energy Europe II
Approximately EUR 365 million 2007-13 - -
EUR 31 million for Local Energy Assistance Facility (ELENA)
Since 2010
Potentially EUR 1.5 billion
(ELENA) 0.08 Mtoe per year
ICT Policy Support Programme EUR 74 million 2007-13 -
Building projects: 20% reduction in
energy consumption European Investment Bank EUR 4.8 billion 2008-11 - - European Bank for Reconstruction and Development
EUR 1.8 billion 2002-12 EUR 14.9 billion 1.8 Mtoe per year
Council of Europe Development Bank EUR 1.9 billion 2002-12 - -
European Energy Programme for Recovery – Energy Efficiency Fund**
EUR 265 million From 2011 - -
* Financing provided through intermediated financial facilities that blend EU grants with international financial institution funding.
** Funding not allocated by 31 December 2010 under the European Energy Programme for Recovery was reallocated to the European Energy Efficiency Fund.
Source: EC, 2012b, 2013.
EU institutions are currently negotiating the multi-annual financial framework for the 2014-20 period. Although details have not yet been decided, the new EU budget aims to integrate environmental priorities into a range of instruments. As such, the European Council (2013) decided that climate action objectives, which include energy efficiency, would represent 20% of EU spending in the 2014-20
© O
EC
D/IE
A, 2
013

COUNTRY CASE STUDIES: EUROPEAN UNION
134 ENERGY EFFICIENCY MARKET REPORT 2013
period. Prospective changes to the way cohesion policy funding will be disbursed over the period are likely to benefit access to financing for energy efficiency projects. These include the requirement that energy projects receiving cohesion funds must present a clear benefit to the environment (for example, energy efficiency and renewable energy), and that the European Regional Development Fund concentrates on a limited number of Europe 2020 objectives, notably energy efficiency, renewables and sustainable urban development. Current negotiations on cohesion policy funding for the 2014-20 period indicate that earmarking of such funds for renewable energy and energy efficiency activity is likely (EC, 2013b). Earmarks could be in the range of 10% to 12% for less developed regions, and 15% to 20% for transition and developed regions. The European Energy Efficiency Fund, operational since July 2011 with capital of EUR 265 million, may increase the scope of its activity over the medium term. It offers a range of debt and equity instruments, and 70% of funding is for energy efficiency and energy-saving investments. Given its recent establishment, activity under the fund is as yet limited and inconclusive. It appears that many potential recipients are not making successful applications to the fund, due to the length and complexity of the application procedure at regional and local level, and because of market fragmentation. Conclusions Energy efficiency market activity in the European Union is strongly driven by climate and energy goals common to all members of the regional bloc, but which are uniquely implemented in different countries. EU-level policies have significantly transformed the market for a range of products, notably vehicles, appliances, equipment and lighting. Due to the large size of the EU market, such regulation also influences global markets for these products. Experts consulted by the IEA see EU climate targets as having the potential to be a strong driver for energy efficiency markets, though many remain concerned that ambition levels will not increase in the medium term. Beyond the short term, prospects for energy efficiency markets point towards moderate growth. Major headwinds stem from the difficult economic context of EU member states, which has led to strong political aversion to any potential increase in the price of energy or to mandating new capital investments. While energy efficiency obligations on utilities involve investment outside direct government expenditure, concerns over impacts on energy bills may reign in expansion and ambition. Market actors will respond to anticipated increases in energy prices and carbon prices, but decision makers appear to be unwilling to take these longer-term considerations into account. Key pieces of legislation, such as the EPBD, are transforming efficiency markets for new buildings. Strengthened energy performance standards for major renovations of existing buildings, in place since 2010, are set to trigger a range of market activity. This will encourage existing market actors to grow, such as ESCOs, building component manufacturers and auditing and certification system providers. Recent market developments in the European Union are centred on the EED, which, through its emphasis on actions taken at the utility level, may lead to new types of utility obligation scheme across the European Union. Depending on how the directive is implemented within member states, it may alternatively lead to an increase in energy efficiency activity within existing utility obligation programmes. A major potential driver of demand for energy efficiency investments in the medium term is the extent to which it can be positioned as a response to the economic challenges facing the region today. Such investments can be a source of employment and economic growth that ultimately leads to improved public budgets. Experts remain ambivalent in their assessment of the extent to which
© O
EC
D/IE
A, 2
013
COUNTRY CASE STUDIES: EUROPEAN UNION
ENERGY EFFICIENCY MARKET REPORT 2013 135
energy efficiency has reached the political mainstream in the EU. While high-level EU and member state strategic statements and legislative frameworks mandate a certain level of growth in energy efficiency markets through to 2020, the currently strained economic climate – and the resulting political prioritisation – is seen as limiting the growth of the energy efficiency market. The expected result is only moderate growth, as compared to the higher level of activity that would be needed to meet the region’s climate and overall efficiency improvement goals. In light of the above challenges, the outcomes of the EU policies could be significantly enhanced by ensuring a learning process which tracks the evolving energy efficiency market capabilities in each country to identify policies which best motivate durable market outcomes in energy efficiency. As such, the requirement under the EED that member states review current and future development of their energy services markets is a positive development. References Barroso, J.M. (2013), “Energy Priorities for Europe”, Presentation of J.M. Barroso, President of the European Commission, to the European Council, Brussels, 22 May. BIS(Bio Intelligence Service), RL (Ronan Lyons) and IEEP (Institute for European Environmental Policy) (2013), Energy Performance Certificates in Buildings and their Impact on Transaction Prices and Rents in Selected EU Countries, Final report prepared for European Commission (DG Energy), Brussels. CA EPBD (Concerted Action Energy Performance of Buildings Directive (2010), “Outcomes 2007-2010”, website, CA EPBD, www.epbd-ca.eu/ca-outcomes/2007-2010-2. Ecofys and Fraunhofer ISI (2010), Energy Savings 2020: How to Triple the Impact of Energy Saving Policies in Europe, European Climate Foundation, The Hague. EIU (Economist Intelligence Unit) (2013), Investing in Energy Efficiency in Europe’s Buildings: a View from the Construction and Real Estate Sectors, GBPN, Paris. Eichhammer, W. et al. (2012), Financing the Energy Efficiency Transformation of the Building Sector in the EU, Fruanhofer ISI, ADEME editions, Paris. EC (European Commission) (2006), Action Plan for Energy Efficiency: Realising the Potential, COM(2006)545, European Commission, Brussels. EC (2011a), Impact Assessment accompanying Directive of the European Parliament and of the Council on Energy Efficiency, Commission Staff Working Paper, SEC (2011) 770 final, European Commission, Brussels. EC (2011b), Impact Assessment accompanying the Energy Efficiency Action Plan 2011, Commission Staff Working Document, European Commission, Brussels. EC (2012a), “EUROPE 2020 TARGETS: climate change and energy”, Europe 2020: Themes – Energy and GHG, European Commission, Brussels.
© O
EC
D/IE
A, 2
013

COUNTRY CASE STUDIES: EUROPEAN UNION
136 ENERGY EFFICIENCY MARKET REPORT 2013
EC (2012b), Report from the Commission to the European Parliament and the Council on the Implementation of the European Energy Programme for Recovery, SWD (2012) 243 final, COM (2012) 445 final, European Commission, Brussels. EC (2012c), Non-paper of the Services of the European Commission on Energy Efficiency Directive, Informal Energy Council, 19-20 April, European Commission, Brussels. EC (2013a), Financial Support for Energy Efficiency in Buildings, Report from the Commission to the European Parliament and the Council, COM (2013) 225 Final, European Commission, Brussels. EC (2013b), personal communication. European Council (2013), European Council 7/8 February 2013 Conclusions (Multiannual Financial Framework), EUCO 37/13, CO EUR 5, CONCL 3, General Secretariat of the Council, Brussels. Fraunhofer ISI et al. (2009), Study on the Energy Savings Potentials in EU Member States, Candidate Countries and EEA Countries, Final Report for the European Commission Directorate-General Energy and Transport, EC Service Contract Number TREN/D1/239-2006/S07.66640, Brussels. ICCT (The International Council on Clean Transportation) (2012), European Vehicle Market Statistics: Pocketbook 2012, ICCT Europe, Berlin. IIGC (Institutional Investors Group on Climate Change) (2013), Protecting Value in Real Estate: Managing Investment Risks from Climate Change, IIGC, London. JRC (Joint Research Centre) (2013), The 2012 EU Industrial R&D Investment Scoreboard, European Commission Joint Research Centre, Institute for Prospective Technological Studies, European Union, Luxembourg. Marino, A. et al. (2010), Energy Service Companies Market in Europe – Status Report 2010, JRC Scientific and Technical Reports, EUR 24516 EN - 2010, European Commission Joint Research Centre Institute for Energy, Luxembourg. Odyssee (2013a), Energy Efficiency Trends in the EU: Synthesis, Odyssee-MURE project, Energy Efficiency Indicators in Europe, updated January, www.odyssee-indicators.org. Odyssee (2013b), Energy Efficiency Policies in the EU: Synthesis, Odyssee-MURE project, Energy Efficiency Indicators in Europe, updated January, www.odyssee-indicators.org. Offermann, R. et al. (2013), Monitoring the Energy Efficiency Service Market in Germany¸ ECEEE Summer Study Proceedings, European Council for an Energy Efficient Economy, Stockholm. Papadopoulou, K., et al. (2009), Evaluation of the Impact of National EPBD Implementation in MS, ASIEPI WP-3, P 180, EIE/07/169/SI2.466278,ASIEPI, International Network for Information on Ventilation and Energy performance, Zaventem. Ryan, L., et al. (2011), Energy Efficiency Policy and Carbon Pricing, IEA Information Paper, OECD/IEA, Paris.
© O
EC
D/IE
A, 2
013

COUNTRY CASE STUDIES: FRANCE
ENERGY EFFICIENCY MARKET REPORT 2013 137
10. FRANCE
Energy profile and context France has a relatively unique energy profile, shaped by the high share of nuclear electricity in its energy supply (Figure 10.1). In 2011, total primary energy supply (TPES) reached 253 million tonnes of oil-equivalent (Mtoe) and remained steady in 2012, while total final consumption (TFC) reached 152 Mtoe. TPES declined slightly over the previous decade, by approximately 3%. TFC declined faster, by nearly 10% over the 2001 to 2011 period, while electricity consumption increased by nearly 6%.
Figure 10.1 TPES and TFC, 2001-12, and energy supply by source, 2012
Notes: unless otherwise indicated, all tables and figures in this chapter derive from International Energy Agency (IEA) data and analysis. Data for 2012 are estimated.
The residential and tertiary (commercial and public services) sectors represent the largest share of final energy consumption in France, together accounting for 38% of consumption in 2011 (Figure 10.2). While residential energy consumption has decreased over the past decade, it has increased in the tertiary sector. When corrected for climatic variation, both sectors together accounted for 44% of TFC in 2011, occurring largely in buildings (CGDD, 2012). Electricity generation has increased slightly since 2001, although electrical generation per unit of gross domestic product (GDP) steadily decreased. The residential sector saw the greatest increase in electricity consumption, by over 20% between 2001 and 2010, which then declined in 2011 (Figure 10.3).
0
50
100
150
200
250
300
Mto
e
TPES TFC Electricity consumption
Nuclear44%
Renewable8%
Coal and coal
products4%
Oil and oil products
29%
Natural gas15%
The energy efficiency market in France has a range of drivers, from concern about energy prices and imports, to EU-level climate policy obligations. The current context of reducing reliance on nuclear-generated electricity, the energy transition debate, and concerns about economic growth and competitiveness, has created an environment conducive to the mainstreaming of energy efficiency investments. In France, these have largely focused on residential buildings, which represent a major source of avoided energy supply. Various regulatory and fiscal measures have driven investment in the buildings sector; residential buildings are anticipated to deliver significant energy savings to 2020. A broad energy supplier obligation scheme is expected to grow increasingly ambitious over the next five years, improving the outlook for continued investment in energy efficiency.
© O
EC
D/IE
A, 2
013

COUNTRY CASE STUDIES: FRANCE
138 ENERGY EFFICIENCY MARKET REPORT 2013
Figure 10.2 Share of TFC by sector, 2011, and TFC by sector and by energy source, 2001 and 2011
Note: “Other” includes biofuels plus heat from geothermal, solar, co-generation and district heating. Co-generation refers to the combined production of heat and power.
Figure 10.3 Changes in electricity generation and consumption, 2002-12
Note: MER = market exchange rate basis for expressing GDP in real (constant) terms.
Reduction in TFC from 2005 to 2010 was primarily driven by improvements in energy efficiency (Figure 10.4). The five-year trend was also impacted by the financial crisis; the significant decrease in TFC from 2008 to 2009 was driven by strong efficiency improvements, but also by a reduction in the level economic activity, and despite a shift toward more energy-intensive sectors of the economy. In 2009 the trend bounced back to resemble that of the 2000-05 period, with a shift away from energy-intensive economic sectors, and an increase in the level of activity, and continuous improvements in energy efficiency. France’s energy intensity (TPES per unit of GDP) is lower than the IEA member country average (Figure 10.5). Energy intensity declined at an average rate of 0.9% between 2000 and 2010 (ADEME, 2012a). Final energy intensity (TFC per unit of GDP) dropped by 1.7% in 2011 and 1.6% in 2012,
Industry19%
Transport29%
Residential24% Services
14%Agriculture, forestry and
fishing3%
Non-specified and non-
energy use11%
05
101520253035404550
2001 2011 2001 2011 2001 2011 2001 2011
Industry Transport Commercial and public services
Residential
Mto
e
Coal/peat Oil Gas Electricity Other
80%
90%
100%
110%
120%
130%
2001
= 1
00%
Electricity generation Electricity use by industryElectricity consumption/GDP (MER) Electricity use by transportElectricity consumption per capita Electricity use by residential
© O
EC
D/IE
A, 2
013

COUNTRY CASE STUDIES: FRANCE
ENERGY EFFICIENCY MARKET REPORT 2013 139
higher than the average annual decrease of 1.3% since 2005; this rate still remains below the policy objective of a 2% average annual decline in final energy intensity (ADEME, 2012b).
Figure 10.4 Changes in TFC, decomposed into structure, activity and efficiency effects
Note: IEA decomposition analysis calculates the relative impacts of three main factors that drive changes in TFC, using 1990 as a base year. The activity effect is a function of demand changes within a sector or sub-sector, measured as value-added, passenger-kilometres, tonne-kilometres or population. Structure effect is a function of changes in the relative shares of the industrial sub-sectors, transport modes or types of residential end-use. Efficiency effect is a function of changes in energy use per unit of activity within each of these sub-sectors, modes or end-uses. Further information on methodology can be found in Box 3.1.
Source: IEA indicators database.
Figure 10.5 Evolution of energy intensity as a function of GDP, 2001-12
Notes: toe = tonnes of oil equivalent. Data for 2012 are estimates.
Market variable: end-use energy prices France has been reducing crude oil import volumes over the past decade and particularly since 2008 (Figure 10.6). However, given the sharp increase in average import prices over the past five years,
-6%
-4%
-2%
0%
2%
4%
2000-05 2005-10 2008-09 2009-10
Aver
age
annu
al c
hang
e
TFC Activity effect Structure effect Efficiency effect
0.10
0.12
0.14
0.16
0.18
0.20
0.22
toe
per t
hous
and
2005
USD
PPP
World
IEA member countriesFrance
European Union
© O
EC
D/IE
A, 2
013

COUNTRY CASE STUDIES: FRANCE
140 ENERGY EFFICIENCY MARKET REPORT 2013
France’s import spending and import costs as a share of GDP have continued to increase since 2009. Energy spending, primarily on oil and gas, increased by 32% between 2010 and 2011, reaching EUR 61 billion, and accounted for 88% of France’s trade deficit (ADEME, 2012b).
Figure 10.6 Volume, price and costs of oil imports, 2002-12
In the transport sector, the price differential between diesel and gasoline fuels at the pump has had a strong impact on the personal vehicle market. Gasoline prices in 2012 were over 10% higher than diesel prices, due to preferential energy taxation and value-added tax rates (IGF and CGEIET, 2012; CGDD, 2012a). Diesel vehicles comprised 72% of all new vehicle sales in 2011, up from 29% in 2000 (ADEME, 2012b).
Figure 10.7 Proportion of household expenditure on energy
Note: excludes fuels used for transport.
Source: OECD, 2013.
France benefits from relatively low electricity prices compared with other EU member states, for both commercial and residential customers; in 2011, prices were one-quarter below the EU average
0
10
20
30
40
50
60
2005
USD
bill
ion
Import spending
50%
150%
250%
350%
450%
2002
= 1
00%
Average import priceImport costs as % of GDPImport volume
3.0%
3.2%
3.4%
3.6%
3.8%
4.0%
4.2%
Prop
ortio
n of
exp
endi
ture
© O
EC
D/IE
A, 2
013

COUNTRY CASE STUDIES: FRANCE
ENERGY EFFICIENCY MARKET REPORT 2013 141
for both sets of customers. However, electricity prices have increased in recent years, by 8.6% for commercial and 7.9% for residential customers between 2010 and 2011. Gas prices before taxes in France remain higher than EU averages (6% for commercial and 12% for residential customers), but final prices are closer to the average (4% higher for residential customers in 2011) due to low taxation rates (CGDD, 2012b). Gas prices have also increased, by 11% between 2010 and 2011 for residential customers (ADEME, 2012b); energy costs as a share of household expenditure have increased steadily in recent years (Figure 10.7). Energy efficiency market activity Market supply: potential for avoided energy use Energy efficiency improvements since 1990 have resulted in savings of approximately 1 000 petajoules or 24 Mtoe by 2010, of which two-thirds occurred in the residential sector (Figure 10.8). IEA indicator analysis demonstrates that energy use for space heating in the residential sector, decreased between 1990 and 2010, by almost 20% when corrected for climatic variation. Energy efficiency was the key factor in this decrease, improving by nearly 2.5% per year over the period. As required by European legislation, France has developed a National Energy Efficiency Action Plan, most recently revised in 2011. Measures currently in place are expected to deliver a reduction in France’s TFC of 28 Mtoe, causing it to fall to 135 Mtoe in 2010. In order to meet the EU target of a 20% reduction in TPES in 2020 – set against the business-as-usual reference level in 2020 – France has identified an additional 35 Mtoe of savings from energy efficiency that would be achievable by 2020 through complementary policy measures (CESE, 2013).
Figure 10.8 Overall energy savings from improvements in energy efficiency
Market driver: energy efficiency policies and programmes In France, several framework policies have a major impact on energy efficiency market activity. Within the past decade, EU climate and energy policy has set the framework for investments in energy efficiency, including:
0
20
40
60
80
100
120
140
160
0
1
2
3
4
5
6
7
Mto
eEJ
Manufacturing Residential ServicesTransport Non-residential sectors Residential
© O
EC
D/IE
A, 2
013
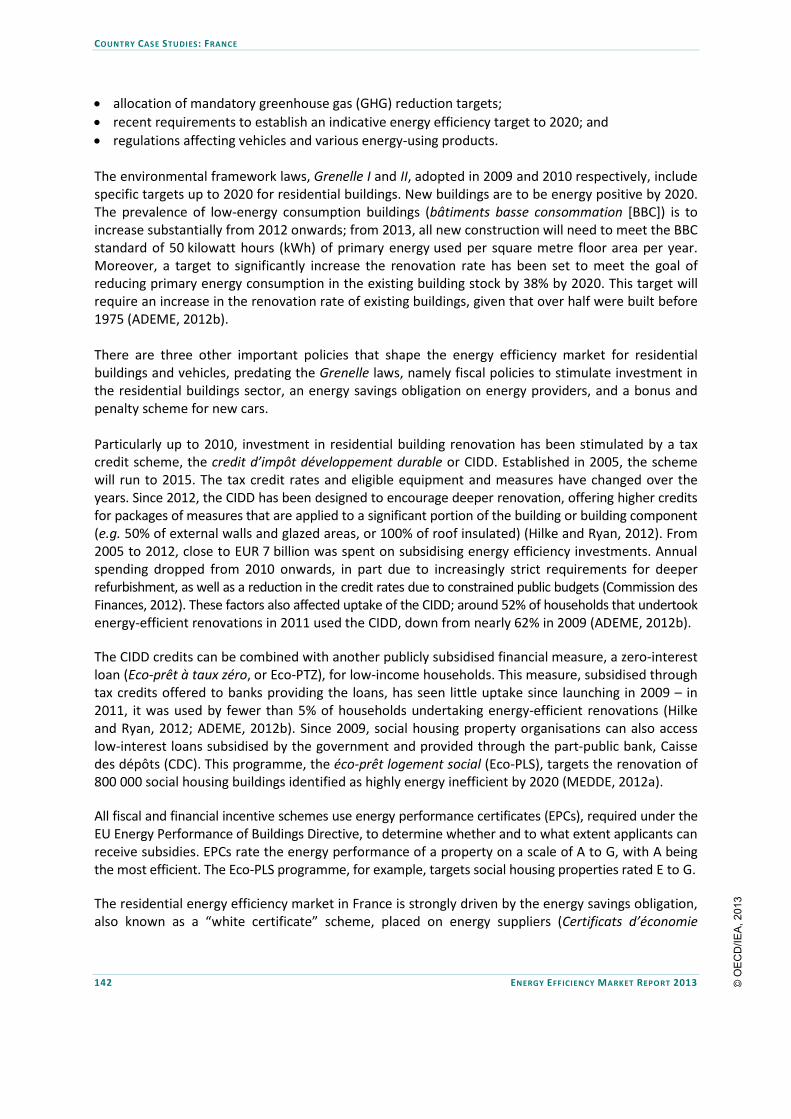
COUNTRY CASE STUDIES: FRANCE
142 ENERGY EFFICIENCY MARKET REPORT 2013
• allocation of mandatory greenhouse gas (GHG) reduction targets; • recent requirements to establish an indicative energy efficiency target to 2020; and • regulations affecting vehicles and various energy-using products. The environmental framework laws, Grenelle I and II, adopted in 2009 and 2010 respectively, include specific targets up to 2020 for residential buildings. New buildings are to be energy positive by 2020. The prevalence of low-energy consumption buildings (bâtiments basse consommation [BBC]) is to increase substantially from 2012 onwards; from 2013, all new construction will need to meet the BBC standard of 50 kilowatt hours (kWh) of primary energy used per square metre floor area per year. Moreover, a target to significantly increase the renovation rate has been set to meet the goal of reducing primary energy consumption in the existing building stock by 38% by 2020. This target will require an increase in the renovation rate of existing buildings, given that over half were built before 1975 (ADEME, 2012b). There are three other important policies that shape the energy efficiency market for residential buildings and vehicles, predating the Grenelle laws, namely fiscal policies to stimulate investment in the residential buildings sector, an energy savings obligation on energy providers, and a bonus and penalty scheme for new cars. Particularly up to 2010, investment in residential building renovation has been stimulated by a tax credit scheme, the credit d’impôt développement durable or CIDD. Established in 2005, the scheme will run to 2015. The tax credit rates and eligible equipment and measures have changed over the years. Since 2012, the CIDD has been designed to encourage deeper renovation, offering higher credits for packages of measures that are applied to a significant portion of the building or building component (e.g. 50% of external walls and glazed areas, or 100% of roof insulated) (Hilke and Ryan, 2012). From 2005 to 2012, close to EUR 7 billion was spent on subsidising energy efficiency investments. Annual spending dropped from 2010 onwards, in part due to increasingly strict requirements for deeper refurbishment, as well as a reduction in the credit rates due to constrained public budgets (Commission des Finances, 2012). These factors also affected uptake of the CIDD; around 52% of households that undertook energy-efficient renovations in 2011 used the CIDD, down from nearly 62% in 2009 (ADEME, 2012b). The CIDD credits can be combined with another publicly subsidised financial measure, a zero-interest loan (Eco-prêt à taux zéro, or Eco-PTZ), for low-income households. This measure, subsidised through tax credits offered to banks providing the loans, has seen little uptake since launching in 2009 – in 2011, it was used by fewer than 5% of households undertaking energy-efficient renovations (Hilke and Ryan, 2012; ADEME, 2012b). Since 2009, social housing property organisations can also access low-interest loans subsidised by the government and provided through the part-public bank, Caisse des dépôts (CDC). This programme, the éco-prêt logement social (Eco-PLS), targets the renovation of 800 000 social housing buildings identified as highly energy inefficient by 2020 (MEDDE, 2012a). All fiscal and financial incentive schemes use energy performance certificates (EPCs), required under the EU Energy Performance of Buildings Directive, to determine whether and to what extent applicants can receive subsidies. EPCs rate the energy performance of a property on a scale of A to G, with A being the most efficient. The Eco-PLS programme, for example, targets social housing properties rated E to G. The residential energy efficiency market in France is strongly driven by the energy savings obligation, also known as a “white certificate” scheme, placed on energy suppliers (Certificats d’économie
© O
EC
D/IE
A, 2
013

COUNTRY CASE STUDIES: FRANCE
ENERGY EFFICIENCY MARKET REPORT 2013 143
d’énergie, or CEE). Effective since 2006, the CEE was amended in 2011 and now also applies to transport fuel retailers. It requires achievement of energy savings, delivered through energy savings certificates, over three-year periods. Each certificate represents 1 kWh, cumulated and actualised (cumac) over the lifespan of the action of equipment; this refers to the annual delivered energy savings from an energy efficiency measure, which is summed over the lifetime of the measure and discounted at 4% annually. The scheme is currently in its second period, running from 2011 to 2013. Over the three-year period, energy suppliers must achieve savings of 255 terawatt hours (TWh) cumac, while transport fuel suppliers are required to deliver 90 TWh cumac of savings. These savings are overwhelmingly delivered through energy efficiency measures undertaken within the suppliers’ customer base, generally using a set of standardised intervention measures with associated lifetime energy savings. These standardised measures, specified by the government, facilitate market activity as they simplify the identification and quantification of energy efficiency interventions. In 2007, the French government established a combined bonus and penalty system (bonus-malus programme) to encourage the purchase of low-polluting vehicles. It applies to new vehicle purchases, with bonus and penalty levels set in accordance with the vehicle’s carbon dioxide (CO2) emissions. The programme is credited with stimulating a shift in the passenger vehicle market, as consumers responded with a strong uptake of low-emitting and more fuel-efficient vehicles. Uptake was stronger than expected – while the programme was designed for penalty receipts to balance out bonus disbursements, net public costs reached EUR 1.45 billion from 2008 to 2011 due to the high level of bonus payments. In 2012 for the first time programme spending of EUR 230 million was recovered through penalty payments (Lefebvre, 2013). For 2013, a bonus of between EUR 200 and EUR 7 000 is offered according to five categories of vehicle. The highest bonus is awarded to those with lowest CO2 emissions, from 0 grams of CO2 per kilometre (gCO2/km) to 20 gCO2/km (electric vehicles), and the lowest bonus to those emitting from 91 gCO2/km to 105 gCO2/km. A penalty fee is levied across ten CO2 emissions categories, starting at EUR 100 for vehicles emitting between 136 gCO2/km and 140 gCO2/km, and reaching EUR 6 000 for those emitting over 200 gCO2/km. Last year the French government initiated a wide-ranging energy transition debate, in order to meet three policy objectives by 2020: reducing GHG emissions, reducing dependence on energy imports, and controlling the price of energy to combat fuel poverty. These not only fit within broader EU climate and energy-saving objectives, but also a political commitment to reduce the share of nuclear power in France’s overall electricity generation portfolio from 75% to 50% by 2025. Energy efficiency has emerged as a high-level strategic priority as part of the energy transition debate, and is being positioned as a primary source of energy for development (CESE, 2013). Current energy efficiency market activity The residential sector in France has seen significant energy efficiency market activity under the CEE scheme. Activity has particularly focused on the installation of boilers, insulation, windows and heat pumps. Over the period 2006-09, EUR 3.9 billion were invested in energy efficiency measures, including the installation of 550 000 efficient heating systems and 340 000 insulation measures (MEDDE, 2012). To date, the majority of activity in the residential sector has involved replacement of existing heating systems by higher-efficiency equipment, with less emphasis on building insulation. Not only are there more commercial advantages to equipment replacement, in terms of customer loyalty, but these
© O
EC
D/IE
A, 2
013

COUNTRY CASE STUDIES: FRANCE
144 ENERGY EFFICIENCY MARKET REPORT 2013
measures are also generally easier to install, given the higher level of co-financing required from customers to implement insulation measures (MEDDTL and MEFI, 2011; MEDDE, 2013).
Table 10.1 Investments and outcomes of the French white certificate scheme (CEE)
2006-09 2011-13
Obligated entities Energy retailers Energy retailers and importers of transport fuel
Eligible sectors All, except those covered by the EU-ETS All, except those covered by the EU-ETS Measures undertaken 87% residential 79% residential (to 31 March 2013) Spending EUR 180 million (2009) EUR 340 million (2011) Total investment EUR 3.9 billion - Cost per kilowatt hour saved EUR 0.0042 EUR 0.004
Cost savings for customers EUR 4.3 billion over lifetime of the measures -
Avoided energy 65 TWh cumac
98 TWh cumac during 2010 “transition” year
387 TWh cumac (to 31 May 2013)
Note: EU-ETS = EU emissions trading system.
Sources: Hilke and Ryan, 2012; Staniaszek and Lees, 2012; Cowart, 2012; MEDDE, 2013a, 2013b; MEDDTL and MEFI, 2011.
The energy savings obligation on transport fuel retailers has led to some innovative programmes in the transport sector. Total, which due to its size holds one-third of the transport fuel supplier target, has spent approximately EUR 13.5 million annually on producing energy savings in the transport sector. Most of the savings produced to date have been through long-haul ride-sharing schemes. However, Total expects to produce only 6 TWh cumac from transport measures over 2011-13, and will deliver the majority of its 30 TWh cumac target through measures in the buildings sector (Heffner et al., 2013). The number of standardised measures for energy efficiency interventions continues to increase in the transportation sector, reaching 25 in 2013, up from only nine in December 2010 (MEDDE, 2013b). Surveys undertaken by both CEE obligated entities and energy service companies demonstrate that, since 2011, the CEE scheme has positively influenced household decisions on investments in energy-efficient renovation. It has provided a source of financing and has led to investment decisions being made more quickly, to the selection of deeper and higher-performing measures, and to the increased use of professionals to undertake the renovation activity (ADEME, 2013). According to ADEME (2012), private investment in refurbishment measures, including those using the financial and fiscal incentives described above, have been dominated by investments in insulation (over 60% of measures in 2011), mostly double-glazing and replacement of windows and doors, followed by improvement or replacement of heating systems. In 2011, EUR 13.5 million was spent by households on energy efficiency measures, representing 35% of the total amount spent that year on general maintenance and improvement. The share of energy efficiency spending varies according to building components and measures taken: energy efficiency investments represented a nearly 14% share of spending on doors and windows, a 9% share of spending on heating equipment, but only a 2% and 3% share of spending on façade and roof renovation. The majority of investments were funded personally by householders, along with use of the CIDD tax credit and commercial bank loans. Over the 2008 to 2010 period, ADEME (2011) found that renovations appeared to be deeper and of higher
© O
EC
D/IE
A, 2
013

COUNTRY CASE STUDIES: FRANCE
ENERGY EFFICIENCY MARKET REPORT 2013 145
quality, with increasing use of professional installers. The Eco-PTZ programme also triggered a greater level of investment over this period, due to its requirement for deeper renovation and implementation of a package of measures.1 The personal vehicle market has also been greatly transformed since 2007, with implementation of new European regulations on CO2 emissions for vehicles, as well as the bonus-malus programme. ADEME (2012c) reports that France has met the 2015 EU target for new-car average emissions (130 gCO2/km) since 2010; in 2011 average emissions further declined to 127 gCO2/km. The average fuel consumption of new cars sold also improved significantly from 2007 onwards, particularly for petrol vehicles, though fuel consumption in litres per 100 kilometres has remained stable since 2009, alongside a trend of increased horsepower and vehicle weight. Since 2008, sales of A, B and C class vehicles – which are more fuel-efficient and emit less CO2 – have steadily increased, as have sales of vehicles benefiting from a bonus or exemption from a penalty under the bonus-malus. French car manufacturers have also gained 45% market share in the class-A vehicle segment, up from 8% in 2009. Challenges Policies designed to stimulate the energy efficiency market in France face various challenges in delivering intended outcomes in a cost-effective manner. In France, the bonus-malus programme took several years to become cost-neutral, with higher-than-anticipated public expenditure for the first four years. Similarly, the low-interest loans and tax credits for building refurbishment have both required adjustments to reduce their impact on public budgets, and to make the incentives more coherent; uptake of these incentives remains low, thus limiting investments in energy efficiency refurbishments (Hilke and Ryan, 2012). In addition, consumer organisation investigations have pointed to the high degree of variability in energy performance ratings, particularly problematic given the A to G rating is used as a basis for the provision of subsidies. EPC assessors have reported being put under pressure when providing ratings to ensure a property would be eligible for the Eco-PTZ loan, for example (Boughriet, 2011; UFC-Que Choisir, 2012). When policies and programmes interact, uneven implementation in one policy risks undermining the performance of other, related policies and the market investments and outcomes they target. Prospects for energy efficiency market activity The French white certificate scheme (or CEE) has had a positive impact on the residential energy efficiency market, resulting in greater provision of higher value-added energy systems and materials, as well as an increase in the professionalisation of energy efficiency service delivery through qualification and training programmes (Romon, 2013). Discussions are currently underway for the third period of the CEE obligation scheme, which was set to run from 2014 to 2017. However, 2014 will instead be the start of a transition period in which current targets will be maintained, with the beginning of the third period yet to be determined. Discussions on the target for the third period are still ongoing, though the government appears to be considering a target that is in line with that required by the EU Energy Efficiency Directive: at least 600 TWh cumac over three years. This falls between the 900 TWh cumac target considered feasible by the French energy agency ADEME, and the target of 255 TWh cumac to 345 TWh cumac suggested by obligated energy suppliers (Romon, 2013). This would represent an almost threefold increase from the current target, and correspondingly should further stimulate efficiency investments in the building
1 See Hilke and Ryan (2012) for more details on the Eco-PTZ (zero-interest loan) policy.
© O
EC
D/IE
A, 2
013

COUNTRY CASE STUDIES: FRANCE
146 ENERGY EFFICIENCY MARKET REPORT 2013
sector and increasingly in the transport sector. However, achieving this increase in energy savings would likely require amendments to the scheme or supplementary measures in order to meet the EU Directive obligations (which exclude transport fuels) (CDC Climat, 2012). The range of targets set for the buildings sector described above (e.g. implementation of the BBC standard for all new-builds from this year onwards, and the 38% energy consumption reduction target for existing buildings) should spur significant investments in the buildings energy efficiency market. The delivery of EPCs has also been reformed since April 2013, requiring use of pre-authorised diagnostic tools, and strengthening training and certification of assessors (RT-Bâtiment, 2013). Use of CIDD and Eco-PTZ is expected to remain low, given the reduction in credit amounts and requirements for deeper renovation. However, the government’s housing investment plan of March 2013 foresees legislative changes in 2014 to better harmonise the two schemes, and potentially transfer responsibility for assessing technical eligibility from banks to technical experts under the Eco-PTZ (METL, 2013; Hilke and Ryan, 2012). Social housing represents approximately 14% of the total housing stock in France; as such, recent funding increases announced in the government’s building sector plan for both the Eco-PLS and the major fuel poverty programme, habiter mieux, are likely to expand the renovation market in this important residential building sub-sector. Conclusions Policies have led to investment and market transformation in the buildings sector, notably in residential buildings, as well as passenger vehicles. While partly related to implementation of EU directives, France’s success in these areas has been primarily due to specific domestic measures targeting investment towards them. The CEE white certificate scheme has successfully delivered energy savings at reasonable cost, and will be a strong driver for continuing investment and potentially innovative solutions in the transport sector, through the recent inclusion of transport fuel providers as obligated entities. The current context of planning a phased reduction in reliance on nuclear-generated electricity, the energy transition debate, and concerns about economic growth and competitiveness, have created an environment conducive to expanding energy efficiency investment. Economic concerns and the related hesitancy to undertake new capital expenditure, on the other hand, may act as countervailing forces that slow the growth of this market. Overall, France’s energy efficiency market is expected to continue to grow in the medium term, and whether this growth is incremental or substantial will depend in part on the level of ambition integrated into the design of existing market mechanisms, particularly the CEE scheme. References ADEME (Agence de l’Environnement et de la Maitrise de l’Energie) (2011), Observatoire Permanent de l’amélioration Energétique du logement OPEN Campagne 2011 Résultats 2010, ADEME Service Bâtiment, Valbonne. ADEME (2012a), Energy Efficiency Policies and Measures in France, ODYSSEE-MURE, Angers. ADEME (2012b), Chiffres clés du bâtiment 2012, ADEME, Valbonne. ADEME (2012c), Véhicules particuliers vendus en France : Evolution du marché, caractéristiques environnementales et techniques, Édition 2012, ADEME Données et Références, ADEME, Valbonne.
© O
EC
D/IE
A, 2
013

COUNTRY CASE STUDIES: FRANCE
ENERGY EFFICIENCY MARKET REPORT 2013 147
ADEME (2013), Evaluation qualitative du dispositif CEE 2ème période 2011-2013 : Les Certificats d’Economies d’Energie, un dispositif qui catalyse les décisions de travaux d’économies d’énergie dans les ménages, ADEME, Angers. ANAH (L’agence nationale de l’habitat) (2013), Habiter mieux programme, website, www.anah.fr/habitermieux.html, accessed 20 August 2013. Boughriet, R. (2011), “Manque de fiabilité des DPE : les diagnostiqueurs plaident non coupable”, 17 March, Actu-environnement.com. Commission des Finances (2012), Projet de loi de finances pour 2012 : Articles de la deuxième partie, Rapport Assemblée Nationale No. 3805 (2011-2012), Paris. CDC Climat (2012), “The new European Energy Efficiency Directive: France is on track”, Climate Brief, No. 23, October, CDC Climat Research, Paris. CESE (Conseil Economique, Social et Environnemental) (2013), Efficacité Énergétique : Un Gisement d’Économies ; un Objectif Prioritaire, Avis du Conseil économique, social et environnemental, Anne de Béthencourt et Jacky Chorin, rapporteurs, Journal Officiel de la République Française, Paris. CGDD (Commissariat Général du Développement Durable) (2012a), Bilan énergétique de la France pour 2011, Références juillet, Services de l’observation et des statistiques, Ministère de l’Écologie, du Développement durable et de l’Energie (MEDDE), Paris. CGDD (2012b), “Prix du gaz et de l’électricité dans l’Union européenne en 2011”, Chiffres et Statistiques No. 366, November, Observation et Statistiques – Énergie, Ministère de l’Écologie, du Développement durable et de l’Energie (MEDDE), Paris. Cowart, R. (2012), “Energy Efficiency Obligations: Global Experience, Design Options for Europe”, presentation at the Informal Energy Council, Horsens, Denmark, The Regulatory Assistance Project, Brussels, 19 April. Energie Plus (2012), “Hors-série: Certificats d’économies d’énergie, Journées techniques de l’ADEME – 18-19 septembre 2012”, Energie Plus, Association technique énergie environnement, Arceuil. Heffner, G. et al. (2013), Energy Provider-delivered Energy Efficiency: A Global Stock-taking Based on Case Studies, International Energy Agency Insights Series, OECD/IEA, Paris. Hilke, A. and L. Ryan (2012), Mobilising investment in energy efficiency: Economic instruments for low-energy buildings, International Energy Agency Insights Series, OECD/IEA, Paris. IGF (Inspection générale des finances) and CGEIET (Conseil général de l’économie, de l’industrie, de l’énergie et des technologies) (2012), Note de synthèse – Les prix, les marges et la consommation des carburants, IGF No. 2012-M-065-04, CGEIET No. 2012/22/CGEIET/SG, Paris.
© O
EC
D/IE
A, 2
013

COUNTRY CASE STUDIES: FRANCE
148 ENERGY EFFICIENCY MARKET REPORT 2013
Lefebvre, E. (2013), “Le bonus-malus automobile n’a rien coûté à l’État en 2012”, Les Echos, 11 February, accessed 4 June 2013. MEDDE (Ministère de l’Écologie, du Développement durable et de l’Energie) (2012a), “L’éco-prêt logement social”, 5 July, MEDDE www.developpement-durable.gouv.fr/L-eco-pret-logement-social,28944.html. MEDDE (2012b), “Lettre d’information « Certificats d’économies d’énergie »”, February, MEDDE, Paris. MEDDE (2013a), “Lettre d’information « Certificats d’économies d’énergie »”, April, MEDDE, Paris. MEDDE (2013b), personal communication. MEDDTL (Ministère de l’Écologie, du Développement Durable, des Transports et du Logement) and MEFI (Ministère de l’Économie, des Finances et de l’Industrie) (2011), Plan d’action de la France en matière d’efficacité énergétique, MEDDTL and MEFI, Paris. METL (Ministère de l’Egalité des territoires et du Logement) (2013), Dossier de presse – Plan d’investissement pour le logement – les 20 mesures, METL, Paris. OECD (Organisation for Economic Cooperation and Development) (2013), “National Accounts: Final consumption expenditure of households”, OECD National Accounts statistics (database), www.oecd-ilibrary.org/statistics, accessed 15 May 2013. Romon, X. (2013), “Certificats d’Economies d’Energie – Bilan et Perspectives”, Conseils : Actualités Techniques, xpair.com, 1 March. Staniaszek, D. and E. Lees (2012), Determining Energy Savings for Energy Efficiency Obligation Schemes, European Council for an Energy Efficiency Economy (eceee) and Regulatory Assistance Project (RAP), Brussels. UFC-Que Choisir (2012), “Fiabilité des DPE – De piètres évaluations…ça suffit!”, Que Choisir, 2 October, www.quechoisir.org/environnement-energie/energie/communique-fiabilite-des-dpe-de-pietres-evaluations-ca-suffit.
© O
EC
D/IE
A, 2
013

COUNTRY CASE STUDIES: GERMANY
ENERGY EFFICIENCY MARKET REPORT 2013 149
11. GERMANY
Energy profile and context Energy consumption in Germany has been steadily decreasing over the past ten years, from a total primary energy supply (TPES) of 346 million tonnes of oil-equivalent (Mtoe) in 2001 to 312 Mtoe in 2011. In 2012, TPES declined further to 307 Mtoe. Total final consumption (TFC) dropped by a smaller amount, 4.5%, over the same period, which indicates a slight reduction in the efficiency of supply-side energy generation and consumption. TFC has remained relatively stable over the past several decades, ranging between 216 Mtoe and 250 Mtoe. In 2011, TFC was 221 Mtoe. Germany is a major energy consumer within the European Union, making up approximately 20% of the bloc’s energy consumption in 2010. Oil is the largest source of energy supply at one-third of the total. Coal and natural gas each make up one-quarter of energy supplied, while renewables and nuclear energy make up roughly 10% (Figure 11.1).
Figure 11.1 TPES and TFC, 2001-12, and energy supply by source, 2012
Notes: unless otherwise indicated, all tables and figures in this chapter derive from International Energy Agency (IEA) data and analysis. Data for 2012 are estimates.
In 2011, three-quarters of energy was consumed by the residential, transport and industrial sectors in almost equal parts, at around 25% each (Figure 11.2), while the commercial and public services sector accounted for 14% of TFC. Industry’s share of TFC in Germany is in the mid-range compared to other IEA member countries, as is the share of transport. However, the share of the residential sector is high, ranking ninth largest in 2011. TFC in the industrial sector increased by close to 8% between 2001 and 2011, and also increased in the commercial and public services sector by 11% over the same period. Meanwhile, final energy consumption decreased significantly in the residential sector, by 19.5%, and decreased by 6.9% in the transport sector (Figure 11.2).
0
50
100
150
200
250
300
350
400
Mto
e
TPES TFC Electricity consumption
Nuclear9%
Renewable11%
Coal and coal
products25%
Oil and oil products
33%
Natural gas22%
Germany is a world leader in energy efficiency. Germany’s state-owned development bank, KfW, plays a crucial role by providing loans and subsidies for investment in energy efficiency measures in buildings and industry, which have leveraged significant private funds. This chapter looks at the state of current and future German energy efficiency markets and examines how KfW programmes and investments in these sectors have influenced the market for energy efficiency measures.
© O
EC
D/IE
A, 2
013

COUNTRY CASE STUDIES: GERMANY
150 ENERGY EFFICIENCY MARKET REPORT 2013
Figure 11.2 Share of TFC by sector, 2011, and TFC by sector and by energy source, 2001 and 2011
Note: “Other” includes biofuels plus heat from geothermal, solar, co-generation and district heating. Co-generation refers to the combined production of heat and power.
Over the period 1990-2010, TFC decreased by 4% despite a 15% increase in the number of households, a 52% increase in economic value added in the services sector, and a 20% increase in economic value added in the manufacturing sector.1 Energy efficiency played an important role in this reduction: without it, energy consumption would have increased by 25% over the same period (Figure 11.3). In 2010, the energy saved in all sectors was nearly equivalent to total residential energy consumption, with approximately 20% of the savings stemming from the residential sector.
Figure 11.3 Overall energy savings from improvement in energy efficiency
Note: EJ = exajoule.
Source: IEA indicators database.
From 2000 to 2010, there was a slight decline in TFC, driven primarily by improvements in energy efficiency and to a lesser extent from changes in types of economic activity (Figure 11.4). The small decline in TFC 1 Value added is the net output of a sector after adding up all outputs and subtracting intermediate inputs. It is calculated without making deductions for depreciation of fabricated assets or depletion and degradation of natural resources (World Bank).
Industry25%
Transport25%
Residential25%
Services14%
Agriculture, forestry and
fishing0.4%
Non-specified and non-
energy use11%
0
10
20
30
40
50
60
70
80
2001 2011 2001 2011 2001 2011 2001 2011
Industry Transport Commercial and public services
Residential
Mto
e
Coal/peat Oil Gas Electricity Other
0
50
100
150
200
250
0
2
4
6
8
10
12
Mto
eEJ
Manufacturing Residential Services Transport Savings
© O
EC
D/IE
A, 2
013

COUNTRY CASE STUDIES: GERMANY
ENERGY EFFICIENCY MARKET REPORT 2013 151
over 2005-10 masks a significant drop in 2008, counterbalanced by a significant increase in 2009. In 2008, changes in economic activity and structure were the main factors leading to the drop, while in 2009 economic activity picked up. However, energy efficiency actually decreased in each of those two years. Energy efficiency improvements were strong enough over 2005-08 to contribute positively to a decline in TFC.
Figure 11.4 Changes in TFC, decomposed into structure, activity and efficiency effects
Note: IEA decomposition analysis calculates the relative impacts of three main factors that drive changes in TFC, using 1990 as a base year. The activity effect is a function of demand changes within a sector or sub-sector, measured as value-added, passenger-kilometres, tonne-kilometres or population. Structure effect is a function of changes in the relative shares of the industrial sub-sectors, transport modes or types of residential end-use. Efficiency effect is a function of changes in energy use per unit of activity within each of these sub-sectors, modes or end-uses. Further information on methodology can be found in Box 3.1.
Source: IEA indicators database.
Figure 11.5 Evolution of energy intensity as a function of GDP, 2001-12
Notes: PPP = purchasing power parity; toe = tonne of oil-equivalent. Data for 2012 are estimates. Germany had an energy intensity of 0.11 tonnes of oil-equivalent (toe) per thousand USD of gross domestic product (GDP) at purchasing price parity (PPP) in 2012, lower than the IEA average (Figure 11.5).
-6%
-4%
-2%
0%
2%
4%
6%
2000-05 2005-10 2008-09 2009-10
Aver
age
annu
al c
hang
e
TFC Activity effect Structure effect Efficiency effect
0.10
0.12
0.14
0.16
0.18
0.20
0.22
toe
per t
hous
and
2005
USD
PPP
World
IEA member countries
European Union
Germany
© O
EC
D/IE
A, 2
013

COUNTRY CASE STUDIES: GERMANY
152 ENERGY EFFICIENCY MARKET REPORT 2013
Its per-capita consumption is also lower than the IEA average. Energy intensity decreased at an average annual rate of 2.1% from 2001 to 2012, translating into a decline of over 20% between 2001 and 2012. On the energy supply side, the amount of oil imported has been decreasing, although expenditure on oil imports has significantly increased since 2002 (Figure 11.6), mainly due to the large price rise. Consequently oil import costs as a share of GDP have approximately doubled since 2002, providing a compelling motive for energy efficiency.
Figure 11.6 Volume, price and costs of oil imports, 2002-12
Figure 11.7 Changes in electricity generation and consumption, 2002-12
Note: MER = market exchange rate basis for expressing GDP in real (constant) terms.
Electricity generation has increased relative to 2001, as has corresponding use by sectors. While electricity use dropped significantly in all sectors in 2008 due to the economic crisis, it rose again in 2009. The use of electricity by industry rose further in 2011 and is now nearly higher than in 2001 (Figure 11.7).
0
10
20
30
40
50
60
70
80
2005
USD
bill
ion
Import spending
50%
150%
250%
350%
450%
2002
= 1
00%
Average import priceImport costs as % of GDPImport volume
85%
90%
95%
100%
105%
110%
115%
2001
= 1
00%
Electricity generation Electricity use by industryElectricity consumption/GDP (MER) Electricity use by transportElectricity consumption per capita Electricity use by residential
© O
EC
D/IE
A, 2
013

COUNTRY CASE STUDIES: GERMANY
ENERGY EFFICIENCY MARKET REPORT 2013 153
Market variable: end-use energy prices End-use energy prices have increased dramatically in Germany since 2002. Figure 11.8 indicates the increasing share of energy as a proportion of household expenditure since 2000, although it remains below 5% (excluding transport). Household electricity prices in Germany have increased significantly over the past decade, and are now among the highest in IEA Europe (IEA, 2013). Germany also introduced environmental taxes on energy products through the 1999 Ecological Tax Reform, creating a stronger price signal to incentivise energy efficiency improvements. These taxes apply to petroleum, heating fuels, heavy fuel oil and natural gas, and have progressively increased on some products over the past ten years.
Figure 11.8 Proportion of household expenditure on energy
Note: excludes fuels used for transport.
Source: OECD, 2013.
For economic, environmental and socio-political reasons, several tax relief policies have been introduced that affect final energy costs for consumers. For example, income tax relief is provided for commuter travel in Germany, regardless of the mode of travel, which may offset some of the increases in fuel taxes. Energy-producing and using industry has also been granted tax relief on energy use. However, tax relief for industries (the tax cap, or Spitzenausgleich) has been linked since the beginning of 2013 to energy efficiency measures, such as implementation of energy management systems and achieving energy efficiency targets. Energy efficiency market activity Market supply: potential for energy savings Germany’s 2010 Energy Concept strategy set an ambitious 2050 target: to cut primary energy consumption in half from the 2008 level. The plan is to achieve this mainly through energy efficiency measures, including in the buildings sector. The German Energy Agency2 (Dena) (2012), a partly state-owned company, estimates that by pursuing this target, by 2020 Germany could save 13% of 2008 energy use, and avoid EUR 33 billion in energy costs (Table 11.1).
2 In German, Deutsche Energie-Agentur GmbH.
2.0%
2.5%
3.0%
3.5%
4.0%
4.5%
5.0%
5.5%
Prop
ortio
n of
exp
endi
ture
© O
EC
D/IE
A, 2
013

COUNTRY CASE STUDIES: GERMANY
154 ENERGY EFFICIENCY MARKET REPORT 2013
Table 11.1 Estimated 2020 final energy consumption under business-as-usual scenario and Energy Concept scenario
2008 2020 business-as-usual scenario
2020 Energy Concept scenario
TFC (TWh)
Energy costs (EUR billion)
Avoided TFC (TWh)
Avoided energy costs (EUR billion)
Avoided TFC (TWh)
Avoided energy costs (EUR billion)
Residential 707 76.7 57 4.8 121 11.2 Commercial and public services 399 37.5 32 2.3 67 5.7
Industry 702 39.6 41 2.1 75 4.4 Transport 714 107.1 54 8.8 78 12.0 Total 2 522 2 263.9 185 18.0 340 33.2
Note: TWh = terawatt hour.
Source: Dena, 2012.
The modelling results in Table 11.1 show that the potential for energy saving is shared among all sectors. The residential sector offers an estimated potential saving of 17% compared with 2008 TFC levels, through reductions in energy use in heating and electricity of 20% and 6% respectively. The industry and transport sectors each have the potential to reduce energy use by 11%, while energy savings in the commercial and public services sector could reach 17%. Overall, the residential and transport sectors offer the most potential to save energy: two-thirds of the avoided energy costs, equivalent to EUR 23 billion, stem from these two sectors. Market driver: energy efficiency policies and programmes In Germany, policies have long been in place to promote energy efficiency through a range of regulatory, informational and financial incentive measures. Currently, energy efficiency activity is framed by the 2010 Energiewende, or energy transition, along with the Energy Concept published later that year. These policies emphasised the need to improve energy efficiency, particularly in the buildings sector and the industrial sector, with a focus on small and medium-sized enterprises (SMEs) (BMU/BMWi, 2010). The German federal government encourages the market for energy efficiency with a range of policy initiatives and measures relating to energy efficiency. On the demand side, these focus on: buildings, especially in the residential sector; the public sector, in buildings and through procurement; industry, particularly for SMEs; transport, through supporting market penetration of fuel-efficient vehicles; and public awareness. Buildings are a key policy area in Germany, representing 60% of planned energy savings to 2020 (IEA, 2013), although some studies question the size of the potential that can be achieved (Henger and Voigtländer, 2011; Simons, 2012; Michelson and Mueller-Michelson, 2010). The Energy Concept includes the following buildings sector targets for 2020:3 • A 20% reduction in the heating requirement of buildings by 2020. This requires doubling of the
current building renovation rate, from less than 1% of the total building stock per year to 2% (3% for residential buildings).
• From 2020, all new buildings should be “climate neutral” based on primary energy specific values.
3 It also includes a target of an 80% reduction in the primary energy requirement of the buildings sector to be met by 2050.
© O
EC
D/IE
A, 2
013
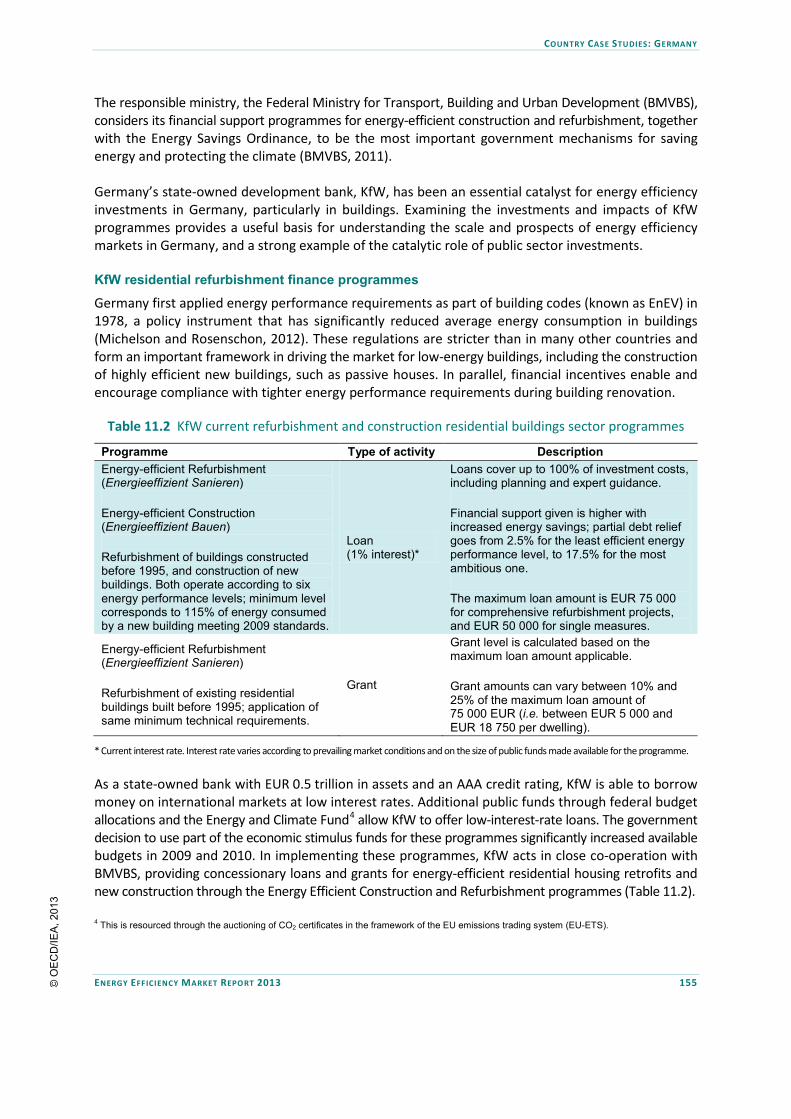
COUNTRY CASE STUDIES: GERMANY
ENERGY EFFICIENCY MARKET REPORT 2013 155
The responsible ministry, the Federal Ministry for Transport, Building and Urban Development (BMVBS), considers its financial support programmes for energy-efficient construction and refurbishment, together with the Energy Savings Ordinance, to be the most important government mechanisms for saving energy and protecting the climate (BMVBS, 2011). Germany’s state-owned development bank, KfW, has been an essential catalyst for energy efficiency investments in Germany, particularly in buildings. Examining the investments and impacts of KfW programmes provides a useful basis for understanding the scale and prospects of energy efficiency markets in Germany, and a strong example of the catalytic role of public sector investments. KfW residential refurbishment finance programmes
Germany first applied energy performance requirements as part of building codes (known as EnEV) in 1978, a policy instrument that has significantly reduced average energy consumption in buildings (Michelson and Rosenschon, 2012). These regulations are stricter than in many other countries and form an important framework in driving the market for low-energy buildings, including the construction of highly efficient new buildings, such as passive houses. In parallel, financial incentives enable and encourage compliance with tighter energy performance requirements during building renovation.
Table 11.2 KfW current refurbishment and construction residential buildings sector programmes
Programme Type of activity Description Energy-efficient Refurbishment (Energieeffizient Sanieren) Energy-efficient Construction (Energieeffizient Bauen) Refurbishment of buildings constructed before 1995, and construction of new buildings. Both operate according to six energy performance levels; minimum level corresponds to 115% of energy consumed by a new building meeting 2009 standards.
Loan (1% interest)*
Loans cover up to 100% of investment costs, including planning and expert guidance. Financial support given is higher with increased energy savings; partial debt relief goes from 2.5% for the least efficient energy performance level, to 17.5% for the most ambitious one. The maximum loan amount is EUR 75 000 for comprehensive refurbishment projects, and EUR 50 000 for single measures.
Energy-efficient Refurbishment (Energieeffizient Sanieren) Refurbishment of existing residential buildings built before 1995; application of same minimum technical requirements.
Grant
Grant level is calculated based on the maximum loan amount applicable. Grant amounts can vary between 10% and 25% of the maximum loan amount of 75 000 EUR (i.e. between EUR 5 000 and EUR 18 750 per dwelling).
* Current interest rate. Interest rate varies according to prevailing market conditions and on the size of public funds made available for the programme.
As a state-owned bank with EUR 0.5 trillion in assets and an AAA credit rating, KfW is able to borrow money on international markets at low interest rates. Additional public funds through federal budget allocations and the Energy and Climate Fund4 allow KfW to offer low-interest-rate loans. The government decision to use part of the economic stimulus funds for these programmes significantly increased available budgets in 2009 and 2010. In implementing these programmes, KfW acts in close co-operation with BMVBS, providing concessionary loans and grants for energy-efficient residential housing retrofits and new construction through the Energy Efficient Construction and Refurbishment programmes (Table 11.2).
4 This is resourced through the auctioning of CO2 certificates in the framework of the EU emissions trading system (EU-ETS).
© O
EC
D/IE
A, 2
013

COUNTRY CASE STUDIES: GERMANY
156 ENERGY EFFICIENCY MARKET REPORT 2013
In 2012, the federal government provided EUR 1.5 billion to further subsidise KfW’s low-interest-rate loan programme and EUR 1.8 billion is planned for 2013. In total, from 2009 to 2011, KfW lent EUR 24 billion for energy efficiency in homes, which leveraged a total investment of EUR 58 billion. The proportion of overall investment to loan size has risen from 1.1 in 2008 to 1.39 in 2010. Much higher proportions can be found for the promotion of new low-energy buildings, e.g. 3.91 in 2010 (Kuckshinrichs et al., 2011). The volume of loans disbursed under refurbishment programmes between 2001 and 2011 totalled over EUR 26 billion (Figure 11.9), and reached EUR 38.1 billion in 2012.5 The average size of loans rose steadily until 2008 (EUR 98 000) but fell in 2009 and 2010 to around EUR 87 000 and EUR 85 000 respectively due to the new eligibility of single refurbishment measures for the loans (Hilke and Ryan, 2012). Neuhoff et al. (2011) point out that even though higher incentive levels are available for the most energy-efficient retrofits, the majority of participants opted for the lowest possible level of retrofit. In 2010, nearly 8 000 refurbishment projects received financial support for measures intended to meet the energy performance level set by the 2009 EnEV building standard, while only 112 refurbishment projects achieved the highest energy performance level.
Figure 11.9 Volume of grants and loans under building refurbishment programmes
Note: covers the programmes “CO2 refurbishment of buildings” (2001-09) and “Energy-efficient refurbishment” (2009-10).
Sources: IEA, 2012; IEA analysis based on Kleemann et al., 2005; Clausnitzer et al., 2007-10; Diefenbach et al., 2011; Diefenbach et al., 2012.
Current energy efficiency market activity Impact of the KfW building programmes
Under the building refurbishment programmes, over 1 million dwellings were refurbished between 2001 and June 2012.6 With about 19 million residential buildings in Germany (Statistische Ämter des Bundes und der Länder, 2013), this equates to approximately 5% of the residential building stock.
5 Between 2001 and 2009 the programme was known as the CO2 Refurbishment Programme, and from 2009 became the Energy-efficient Refurbishment Programme. 6 This does not include refurbishments using single energy efficiency measures.
0
1
2
3
4
5
6
2001 2002 2003 2004 2005 2006 2007 2008 2009 2010 2011
EUR
mill
ion
Volume of loans disbursed Volume of grants granted
© O
EC
D/IE
A, 2
013

COUNTRY CASE STUDIES: GERMANY
ENERGY EFFICIENCY MARKET REPORT 2013 157
The average reduction in final energy demand in buildings participating in the schemes has been estimated at around 45% per grant or loan in 2007, and 48% in 2008. This decreased to 27% and 31% in 2009 and 2010 respectively. The total reduction in final energy demand from the grant and loan programmes increased significantly from 2008 to 2009 (Figure 11.10). The slight decline in energy demand reduction seen in 2010 reflects the increase in the number of loans and grants used towards less deep refurbishment (Hilke and Ryan, 2012). However, despite these incentives, the annual rate of energy-efficient refurbishments in Germany remains low, at around 1%.
Figure 11.10 Reductions in final energy demand from building retrofit programmes
Notes: GWh = gigawatt hour. Covers the programmes “CO2 refurbishment of buildings” (2001-09) and “Energy-efficient refurbishment” (2009-10).
Sources: IEA analysis based on Clausnitzer et al., 2007-2010; Diefenbach et al., 2011.
Although investment in energy-efficient renovation and construction has increased since 2005, when it was at its lowest point in a decade, it is difficult to assess how the KfW loan and grant programmes have influenced such investments. Investment has shifted over the past decade from new construction to renovation of existing buildings; the share of new construction in overall construction activities dropped from 42% in 2000 to 22% in 2010 (BBSR, 2013). KfW estimates that in 2012, in addition to public funds of EUR 1.5 billion, it raised another EUR 8.4 billion on international capital markets to invest a total of EUR 9.9 billion in the energy efficiency loan and grant programmes. They estimate that these programmes leveraged an additional EUR 17.2 billion, resulting in EUR 27.1 billion invested in home refurbishments. KfW has also estimated other economic benefits of the resultant market activity, such as employment (Hilke and Ryan, 2012). The large increase in programme funding under 2009 stimulus measures is estimated to have created or saved 111 000 person-years of work, although there is no information provided on the duration of the jobs. These employment effects benefitted various related sectors, with only 55% occurring specifically within the construction sector (Kuckshinrichs et al., 2011).
0
500
1 000
1 500
2 000
2 500
3 000
2005 2006 2007 2008 2009 2010
GW
h/ye
ar
Reduction from loans Reduction from grants
© O
EC
D/IE
A, 2
013

COUNTRY CASE STUDIES: GERMANY
158 ENERGY EFFICIENCY MARKET REPORT 2013
In addition, KfW estimates that EUR 1.5 billion in government subsidy has led to between EUR 3 billion and EUR 4 billion in tax revenues as a result of the increased business activity.7 The energy efficiency industry body, DENEFF, estimates that the sector employs 800 000 people, which also has a positive impact on the public budget. Energy efficiency markets
In 2013, DENEFF undertook a survey of the energy efficiency market in Germany (DENEFF, 2013).8 According to DENEFF data, turnover in the energy efficiency services and products sector increased from EUR 126 billion in 2011 to EUR 146 billion in 2012, a 16% increase; a further increase of 10% is expected in 2013. The number of people employed in the sector also rose over the same year, from 737 000 to 807 000. The energy services industry demonstrated the greatest growth, as a result of anticipated EU regulation affecting the energy and electricity sectors. Companies surveyed by DENEFF considered regulations, standards and financial incentives as important contributing factors to the growth of the energy efficiency market. The availability of capital was also cited as driving investment in energy efficiency. Surveyed companies found that, for households, a combination of mortgage availability, low interest rates, KfW incentive programmes and historically high rates of savings meant that households have good access to capital, which should support residential investment in energy efficiency. However, the economic crisis and resulting tighter regulation of bank lending have had, and continue to have, an impact on credit availability for companies. The Federal Institute for Research on Building, Urban Affairs and Spatial Development (2011) estimates that that in 2010 EUR 164 billion was spent on renovation of buildings in Germany. Of that, EUR 56 billion was invested in improving energy efficiency, demonstrating that the total amount of investment in energy efficiency across all sectors is much higher when private undocumented investment is taken into account. This suggests that the sum total of energy efficiency investments in Germany appears to greatly exceed previous estimates. Further data collection and analysis is required in this regard. The German energy efficiency industry also engages in significant energy efficiency research. Patent applications for technologies relating to energy efficiency and climate protection have seen an annual growth rate of up to 20% since the late 1990s. German patent applications in the subject area of "energy efficiency and greenhouse gas reduction in buildings" are double those of any other European country, and also higher than in Japan and the United States. Patent applications are strong in the fields of thermal insulation and related technologies (roofs, walls, ceilings), and in energy-efficient heating, cooling and ventilation (BMVBS, 2013). This may also reflect the impact of significant public funds provided by the German government towards energy efficiency research, development and demonstration programmes, which amounted to EUR 135 million in 2010, and are projected to increase over the coming years. Challenges There are various challenges associated with energy efficiency policy delivering the desired market outcomes. In Germany, approximately half of the housing stock has levels of energy performance below the minimum legal requirements, due to their age, and renovation uptake remains slower than is required to refurbish this share of the building stock (Schröder et al., 2011). While the KfW 7 Tax revenues attributable to the KfW programmes include value-added tax (VAT) paid by investors, taxes on goods, other taxes on production minus subsidies, wage tax, social security contributions, avoided costs of unemployment and taxes on property income or profits of corporations. 8 The companies surveyed reflect the following energy efficiency sectors: energy services and management, building materials and installation, building and ventilation technology, financial services, measurement and control technology, buildings services, energy providers, electronic suppliers and mechanical engineering companies.
© O
EC
D/IE
A, 2
013

COUNTRY CASE STUDIES: GERMANY
ENERGY EFFICIENCY MARKET REPORT 2013 159
programmes are considered financially sustainable and have had a positive impact on the market, they are not currently delivering the 2% rate of renovation required to cost-effectively meet climate targets (Rüdinger, 2013). Achieving the scale of renovation required will be challenging for existing programmes, and methods of stimulating energy efficiency investments by building owners without public subsidies are likely to be needed (OECD, 2012). Prospects for energy efficiency market activity The outlook is bright for energy efficiency markets in Germany, where a combination of government policy requiring better energy performance, a history of industry engaged in providing energy-efficient products, and financial support available to consumers for energy efficiency, mean that significant investment is expected to continue. European carbon dioxide emissions regulations for cars will require the large German car industry to continue investing in fuel-efficient technology. Potential opportunities for energy efficiency investment can also be found in industry, where energy management programmes are now necessary to access certain tax relief programmes. Buildings are likely to remain an area with further potential for investment in energy efficiency. The 2% renovation rate target set in the Energy Concept strategy should translate into further investment opportunities for energy efficiency refurbishments, involving both a larger number of buildings and deeper retrofits. Although much progress has already been made, significant investment opportunities remain in the buildings sector over the next five to ten years. Markets for energy efficiency services, notably energy advice, energy management and energy contracting, have experienced steady growth over the last five years in Germany. However, they are not considered to have met their potential, and further growth will likely be driven by policy in the medium term (Offermann et al., 2013). Continuing barriers to market development are also largely related to policy; moves to facilitate market activity, such as through certification and determining transparent definitions of products and services, are expected spur continued growth in energy efficiency markets. Conclusions Thanks to numerous energy efficiency policies and a global demand for German energy efficiency products, energy efficiency markets are well established in Germany. In the medium term, policy makers face a dilemma on the best use of public funds to improve the energy performance of buildings, which remains an important target sector. To achieve the 2% renovation rate, a greater number of buildings will need to undergo energy efficiency refurbishment, while at the same time incentives for comprehensive or deep renovations will need to be maintained. However, tying financial support to more stringent energy performance criteria can deter participation in the programme. Both deep renovation and broad coverage are needed to transform markets and achieve the Energy Concept target of 80% reduction in the primary energy requirement of the buildings sector by 2050. Assessing these maturing energy efficiency markets is more than ever an important policy priority. The capacity to do so, required under the new EU Energy Efficiency Directive, will complement and supplement existing market capabilities. References BBSR (Bundesinstitut für Bau-, Stadt- und Raumforschung) (2011), Struktur der Bestandsinvestitionen, BBSR-Berichte KOMPAKT 12/2011, Berlin.
© O
EC
D/IE
A, 2
013

COUNTRY CASE STUDIES: GERMANY
160 ENERGY EFFICIENCY MARKET REPORT 2013
BMVBS (Bundesministerium für Verkehr, Bau und Stadtentwicklung) (2013), “Indikatoren zur Innovationstätigkeit am Bau im internationalen Vergleich”, BMVBS-Online-Publikation, Nr. 08/2013, May, Berlin. Carrington, D. (2012), “How a Green Investment Bank Really Works”, The Guardian Environment Blog, 24 May. Clausnitzer, K.-D. et al. (2007), Effekte des KfW-CO2-Gebäudesanierungsprogramms 2005 und 2006, Bremer Energie Institut/Institut Wohnen und Umwelt GmbH/Institut für Statistik, Universität Bremen, Bremen/Darmstadt. Clausnitzer, K.-D., et al. (2008), Effekte des CO2-Gebäudesanierungsprogramms 2007, Bremer Energie Institut/Institut Wohnen und Umwelt GmbH/Institut für Statistik, Universität Bremen, Bremen/Darmstadt. Clausnitzer, K.-D., et al. (2009), Effekte des CO2-Gebäudesanierungsprogramms 2008, Bremer Energie Institut/Institut Wohnen und Umwelt GmbH/Institut für Statistik, Universität Bremen, Bremen/Darmstadt. Clausnitzer, K.-D., et al. (2010), Effekte der Förderfälle des Jahres 2009 des CO2-Gebäudesanierungsprogramms und des Programms ‘Energieeffizient Sanieren’, Bremer Energie Institut/Institut Wohnen und Umwelt GmbH/Institut für Statistik, Universität Bremen, Bremen/Darmstadt. Clausnitzer, K.-D., M. Fette and J. Gabriel (2011), Evaluation der KfW-Programme ‘KfW-Kommunalkredit – Energetische Gebäudesanierung’, ‘Energieeffizient Sanieren – Kommunen’ und ‘Sozial investieren – Energetische Gebäudesanierung’ der Jahre 2007 bis 2010, Bremer Energie Institut, Bremen/Darmstadt. Dena (Deutsche Energie Agentur) (2012), Abschätzung: Wirtschaftlich erschliessbare Endenergieeinsparpotenziale in Deutschland bis 2020, Dena, Berlin. DENEFF (Deutsche Unternehmensinitiative Energieeffizienz) (2013), Branchenmonitor Energieeffizienz 2013, DENEFF, Berlin. Diefenbach, N., et al. (2011), Monitoring der KfW-Programme ‘Energieeffizient Sanieren’ 2010 und ‘Ökologisch/Energieeffizient Bauen’ 2006-2010, Institut Wohnen und Umwelt GmbH, Bremer Energie Institut, Bremen/Darmstadt. Diefenbach, N., et al. (2012), Monitoring der KfW-Programme ‘Energieeffizient Sanieren’ und ‘Energieeffizient Bauen’ 2011, Institut Wohnen und Umwelt GmbH, Bremer Energie Institut, Bremen/Darmstadt. Henger, R. and M. Voigtländer (2011), “Einflussfaktoren auf die Rentabilität energetischer Sanierungen bei Mietobjekten”, IW Köln Trends, Köln.
© O
EC
D/IE
A, 2
013

COUNTRY CASE STUDIES: GERMANY
ENERGY EFFICIENCY MARKET REPORT 2013 161
Hilke, A. and L. Ryan (2012), Mobilising Investment in Energy Efficiency, OECD/IEA, Paris. IEA (International Energy Agency) (2013), Energy Policies of IEA Countries: Germany 2013 Review, OECD/IEA, Paris. KfW (2012), “Bauen, Wohnen, Energie sparen: Energieeffizient sanieren – Kredit”, Merkblatt, KfW, Frankfurt am Main. Kleemann, M. and P.P. Hansen (2005), Evaluierung der CO2-Minderungsmassnahmen im Gebäudebereich, Forschungszentrum Jülich, Jülich. Kuckshinrichs, W., T. Kronenberg and P.P. Hansen (2011), Wirkungen der Förderprogramme im Bereich ‘Energieeffizientes Bauen und Sanieren’ der KfW auf die öffentlichen Haushalte, Forschungszentrum Jülich (IEK-STE), Jülich. Michelsen, C. and S. Müller-Michelsen (2010), “Energieeffizienz im Altbau: Werden die Sanierungspotenziale überschätzt?” Ergebnisse auf Grundlage des ista-IWH-Energieeffizienzindex, Wirtschaft Im Wandel, 16, Halle Institute for Economic Research, Halle, pp. 447-455. Michelson, C. and S. Rosenschon (2012), “The Effects of Building Energy Codes in Rental Housing: the German Experience”, Economics Bulletin, Vol. 32, Issue 4, AccessEcon, pp. 3488-3502, http://ideas.repec.org/s/ebl/ecbull.html. OECD (Organisation for Economic Co-operation and Development) (2012), Climate and Energy Policy in Germany: Mechanisms to Encourage Private Sector Investment/Participation in Low-carbon Development – A Case Study of Germany’s Building Sector, Towards a Green Investment Framework – Case Study Series, prepared by the German Federal Environment Agency and KfW, OECD, Paris. OECD (2013), “National Accounts: Final consumption expenditure of households”, OECD National Accounts statistics (database), www.oecd-ilibrary.org/statistics, accessed 15 May 2013. Offermann, R., et al. (2013), “Monitoring the energy efficiency service market in Germany”, ECEEE Summer Study Proceedings, European Council for an Energy Efficient Economy (eceee), Stockholm. Rüdinger, A. (2013), La rénovation thermique des bâtiments en France et en Allemagne : quels enseignements pour le débat sur la transition énergétique ?, Working Paper No.07/13, May 2013, Institut du développement durable et des relations internationales (IDDRI), Paris. Schröder, M., et al. (2011), The KfW Experience in the Reduction of Energy from Buildings: Operation, Impacts and Lessons for the UK, UCL Energy Institute and LSE Housing and Communities, University College London and London School of Economics, London. Simons, H. (2012), Energetische Sanierung von Ein- und Zweifamilienhäusern, Verband Der Privaten Bausparkassen E, V., Projektnummer: 2011180, Berlin. Statistische Ämter des Bundes und der Länder (2013), Zensus 2011, Statistische Ämter des Bundes und der Länder, Statistisches Bundesamt, Wiesbaden.
© O
EC
D/IE
A, 2
013

COUNTRY CASE STUDIES: INDIA
162 ENERGY EFFICIENCY MARKET REPORT 2013
12. INDIA
Energy profile and context India recently became the world’s third-largest energy consumer, overtaking Russia in 2010, and its energy consumption could more than double by 2035 (IEA, 2012a). India’s resource endowment means that it relies heavily on fossil fuels, with over 40% of its primary energy supply coming from coal (Figure 12.1). Total primary energy supply (TPES) and total final consumption (TFC) continue to increase with India’s economic development, reaching 750 million tonnes of oil-equivalent (Mtoe) and 493 Mtoe respectively in 2011.
Figure 12.1 TPES and TFC, 2001-11, and energy supply by source, 2011
Note: unless otherwise indicated, all tables and figures in this chapter derive from International Energy Agency (IEA) data and analysis.
Energy intensity, measured in terms of TPES per unit of GDP, has decreased significantly in India compared to other countries (Figure 12.2). Energy supply per capita increased by over 20% between 2000 and 2010, but at 0.59 tonnes of oil-equivalent (toe) per capita still remains less than half that of the world average. TFC increased across all sectors between 2001 and 2011, almost doubling in the industrial sector, rising by 45% in the transport sector and by 40% in commercial and public services (Figure 12.3). Residential energy use by source reflects the high portion of the population without access to modern energy sources: globally India has the largest population (nearly 800 million) that relies on traditional biomass for cooking (IEA, 2012a). The residential and industrial sectors represent almost three-quarters of TFC.
0
100
200
300
400
500
600
700
800
Mto
e
TPES TFC Electricity consumption
Nuclear1%
Renewable26%
Coal and coal
products44%
Oil and oil products
22%Natural gas
7%
Significant progress has been made in creating a sustainable policy and regulatory framework in India since the enactment of the Energy Conservation Act 2001, which will facilitate a market for energy efficiency. This chapter highlights several key energy efficiency policies, including the Perform, Achieve and Trade (PAT) mechanism, which are expected to play a key role in driving the efficiency market in India. The PAT is an innovative example of a market-based mechanism that could incentivise large energy-consuming industries to enhance their efforts towards achieving energy efficiency. Given India’s significant projected energy demand growth, there is enormous potential for expansion in the energy efficiency market.
© O
EC
D/IE
A, 2
013

COUNTRY CASE STUDIES: INDIA
ENERGY EFFICIENCY MARKET REPORT 2013 163
Figure 12.2 Evolution of energy intensity as a function of GDP, 2001-11
Note: PPP = purchasing power parity.
Figure 12.3 Share of TFC by sector, 2011, and TFC by sector and by energy source, 2001 and 2011
Note: “Other” includes biofuels plus heat from geothermal, solar, co-generation and district heating. Co-generation refers to the combined production of heat and power.
Electricity consumption per unit of GDP dropped by approximately 10% from 2001 to 2011 (Figure 12.4). Demand for electricity in the industrial and residential sectors has increased by nearly 120% over the same period. Electricity use per capita has increased by 60% and further increases are anticipated given that 25% of the population still does not have access to electricity. Furthermore, those with access to electricity will see their demand increase along with standards of living and greater electrification of services. Despite increases in generation, supply has been unable to keep up with demand. Energy efficiency will remain a priority in order to ensure that demand growth is moderated, while expanding access to a larger share of the population.
0.18
0.20
0.22
0.24
0.26
toe
per t
hous
and
2005
USD
PPP
India
World
Industry34%
Transport12%
Residential36%
Services4%
Agriculture, forestry and
fishing4%
Non-specified and non-
energy use10%
020406080
100120140160180200
2001 2011 2001 2011 2001 2011 2001 2011
Industry Transport Commercial and public services
Residential
Mto
e
Coal/peat Oil Gas Electricity Other
© O
EC
D/IE
A, 2
013

COUNTRY CASE STUDIES: INDIA
164 ENERGY EFFICIENCY MARKET REPORT 2013
Figure 12.4 Changes in electricity generation and consumption, 2001-11
Note: MER = market exchange rate basis for expressing GDP in real (constant) terms.
Energy efficiency market activity Market supply: potential for energy savings There is significant potential for energy savings in India. The estimates below highlight the magnitude of the potential for market growth (Table 12.1). According to the Indian Bureau of Energy Efficiency, fuel savings of 23 Mtoe by 2014/15 are projected with cumulative avoided electricity capacity of nearly 20 000 megawatts (MW) (BEE, 2010).
Table 12.1 Expected investment and impact
Initiative Estimated investment (USD billion)
Fuel savings (Mtoe)
Avoided capacity (MW)
Perform, Achieve and Trade Program
5.15 (INR 306 billion) 9.78 5 623
Demand-side management (including agriculture)
7.41 (INR 440 billion) 13.22 14 335
Total 12.56 (INR 746 billion) 23.00 19 958
Source: BEE, 2010.
On the supply side, the government of India estimates that the rehabilitation and remodelling of 27 gigawatts (GW) of coal-fired capacity could potentially improve the thermal efficiency of these plants by 10% to 15%, representing savings of about 10 million tonnes of coal per year (BEE, 2013).
The Asian Development Bank (ADB) has estimated that an investment of USD 10 billion in energy efficiency improvements could yield aggregate savings of 183.5 terawatt hours (TWh), representing USD 20 billion (Table 12.2).
80%
100%
120%
140%
160%
180%
200%
220%20
01 =
100
%
Electricity generation Electricity use by industryElectricity consumption/GDP (MER) Electricity use by transportElectricity consumption per capita Electricity use by residential
© O
EC
D/IE
A, 2
013

COUNTRY CASE STUDIES: INDIA
ENERGY EFFICIENCY MARKET REPORT 2013 165
Table 12.2 Energy savings investment potential in India by sector
Sector Investment potential (USD billion)
Energy savings (billion kWh)
Energy savings (MW)
Industrial (generic EE measures) 1.050 23.8 3 400 Industrial (process EE measures) 1.975 25.2 3 600 Commercial 1.647 0.8 290 Municipal 0.325 3.7 1 688 Agriculture 3.750 60 - Lighting 1.000 70 - Total 9.770 183.5 -
Note: EE = energy efficiency.
Source: ADB analysis as cited in The Climate Group, 2011.
Market driver: energy efficiency policies and programmes India enacted the Energy Conservation Act in 2001, which established the Bureau of Energy Efficiency (BEE) as India’s primary agency to develop and implement energy efficiency policies and programmes. Since 2001 several initiatives have been launched (Table 12.3), including: • minimum energy performance standards (MEPS) and labelling for equipment and appliances, including
industrial motors; • the Energy Efficiency Building Code (2006); • a clean development mechanism (CDM) project to introduce compact fluorescent lamps (CFLs); and • a dedicated project to enhance technical capacities and access to finance for small and medium-
sized enterprises.
Table 12.3 Overview of key energy efficiency policies
Buildings, appliances, equipment and lighting Transport Industry Cross-sectoral
Energy Conservation Building Code (2007), with voluntary requirements for commercial and residential buildings. Voluntary star ratings for office buildings. Mandatory standards and labelling for room air conditioners and refrigerators, voluntary for five other products.
Standards for passenger light-duty vehicles: under development; Trucks: currently no policies. Registration taxes by vehicle and engine size, sales incentives for advanced vehicles.
Perform, Achieve and Trade (PAT) in force since 2011. Audits mandated for designated consumers.
11th Five-Year plan (2007-12): target to improve energy efficiency by 20%. 12th Five-Year Plan (2013-17): target to improve energy efficiency by 20% by 2016-17.
Source: IEA, 2012a. In 2008, India also launched its National Action Plan on Climate Change that identified eight national missions, one of which is the National Mission for Enhanced Energy Efficiency (NMEEE). Four major initiatives are included under the NMEEE to deliver those targets, including the PAT scheme for industry, market transformation for energy efficiency, the Energy Efficiency Financing Platform to facilitate risk sharing and reduce investment barriers, and a set of fiscal and financial incentives to promote investment in energy efficiency. In addition to tax and duty incentives, two funds have been established, the Partial Risk Guarantee Fund and Venture Capital Fund. The government also created Energy Efficiency Services Limited (EESL), a “super” energy service company (ESCO), to serve the public sector and lead the market-related actions of the mission.
© O
EC
D/IE
A, 2
013

COUNTRY CASE STUDIES: INDIA
166 ENERGY EFFICIENCY MARKET REPORT 2013
It is estimated that over the 11th Five-Year Plan period (2007-12), energy efficiency policies resulted in an avoided generation capacity of over 10 000 MW (BEE, 2013). Current energy efficiency market activity The IEA (2012b) estimated that in 2011 energy efficiency investments in India totalled USD 9.5 billion. The following programme areas represent key energy efficiency market activities in India. Perform, Achieve and Trade mechanism
Launched in July 2012, this programme is intended to improve the cost-effectiveness of energy efficiency investments in the industrial sector by creating a market for tradable energy savings certificates. Certificates are issued to facilities that over-achieve the minimum energy savings target established by the government. The targets are specific to each facility and account for the relative baseline of each facility over the 2007-10 period: those that are more efficient are subject to lower efficiency targets than those that are less efficient. In general, a savings level of 1% to 2% per year will be required (Kumar and Agarwala, 2013). Facilities that exceed the minimum savings requirement are able to sell the resulting certificate on the market, helping to offset the cost of the energy efficiency investment. Non-compliance penalties are imposed on facilities that fail to meet the target. The first cycle of the Perform, Achieve and Trade (PAT) mechanism runs from 2012 to 2015 and targets eight energy-intensive industries, including: thermal power plants in the power sector, aluminium, cement, chlor-alkali, fertiliser, iron and steel, pulp and paper, and textiles. These industries represent 65% of India’s total industrial energy consumption. Energy savings of approximately 6.7 Mtoe are expected by the end of 2015, equivalent to about 4% of the total reported energy consumption of all the designated facilities, and an associated energy cost saving of approximately USD 1.14 billion (INR 68 billion) over that period (BEE, 2013). The total investment for the initial cycle is expected to be around USD 15 billion (IEA, 2012c). Energy Efficiency Financing Platform
The Energy Efficiency Financing Platform was set up specifically to target barriers to energy efficiency financing. The platform seeks to engage with banks and other financial institutions to enhance their capacity to appraise energy efficiency projects. It provides a platform for these institutions to jointly assess the viability of lending to energy efficiency projects in an effort to mainstream such lending in their operations. Market Transformation for Energy Efficiency
This component of the NMEEE encompasses a wide range of policies and measures, including standards and labelling, building code improvements, CDM programmes, improvements to public procurement processes and the national CDM roadmap. The objective is to accelerate the shift to energy-efficient appliances through market measures to make such products more affordable. The BEE (2012) estimated that from 2010 to 2011, India’s standards and labelling programme resulted in electricity savings of 3.7 TWh, representing an avoided generation capacity of over 2 GW. Framework for Energy Efficient Economic Development
The measures included in this programme are related to providing tax and duty incentives to promote energy efficiency. The two main features include the Partial Risk Guarantee Funding for Energy
© O
EC
D/IE
A, 2
013

COUNTRY CASE STUDIES: INDIA
ENERGY EFFICIENCY MARKET REPORT 2013 167
Efficiency (PRGFEE) and the Venture Capital Fund (VCF). The PRGFEE, which came into force in April 2012, helps to address credit risk by guaranteeing up to 50% of the principal loan amount provided by commercial banks in the case of default, and by supporting the capacity of commercial banks to structure and manage financing of energy efficiency projects. The VCF provides capital for energy efficiency projects. The two streams are complementary and are designed to target energy efficiency projects run through ESCOs in government buildings and municipalities. In the 2010/11 budget, USD 11.2 million (INR 670 million) was allocated to both programmes by the government. Supply-side efficiency: coal-fired generation renovation and modernisation
With coal representing 44% of total energy supply in 2011, India, along with China, is set to continue to drive global coal demand in the future. Pursuing efficiency in coal generation represents a significant potential for energy savings: India’s coal-based generation fleet is still dominated by ageing, low-efficiency sub-critical units with an average efficiency of 33% compared to 46% for an ultra-supercritical unit (IEA, 2013). Although optimal efficiencies may not be achievable under Indian ambient conditions and using Indian coal, there is clearly a large potential for efficiency improvement. The government has committed to increasing the share of supercritical units to 50% of new capacity additions in the 12th Plan period (2013-17) and to 100% in the 13th Plan period (2018-22) (Planning Commission, 2012). The government of India has also introduced the Renovation and Modernisation programme to support efficiency improvements in existing coal-fired power generation units through renovation, modernisation and improved operation and maintenance. A programme of retiring less efficient coal-fired power generation units is also being actively pursued. In 2009, an agreement was signed between the World Bank and the government of India to target the renovation and modernisation of three coal facilities, with a total capacity of 640 MW. The total project cost of USD 303.4 million includes a USD 180 million loan (from the International Bank for Reconstruction and Development) and a USD 45.4 million grant (from the Global Environment Facility). Challenges Despite the huge potential and government efforts to promote energy efficiency, barriers to expansion of the energy efficiency market remain. These essentially relate to the low levels of awareness and capacity among policy makers, facility owners and financial institutions. Also, availability of finance at reasonable rates is a major challenge. In this environment, policies like PAT that create tangible incentives from realisable energy efficiency outcomes are a very useful option for increasing market capacity. The major challenge in the Indian power sector is ensuring adequate generation in the context of rapidly increasing demand. The recent increase in electricity tariffs, along with high transmission and distribution losses in the power system, are increasing the importance of energy efficiency investments in the power sector. Addressing energy subsidies, which has been highlighted as a key priority in the 12th Five-Year Plan, will enable further growth in the market. Prospects for energy efficiency market activity With the high rate of energy demand growth and a projected USD 1 trillion investment in infrastructure during the 12th Five-Year Plan period, there is a large potential for energy efficiency in new generation, infrastructure, industry, transport, buildings and appliances in India (The Climate Group,
© O
EC
D/IE
A, 2
013

COUNTRY CASE STUDIES: INDIA
168 ENERGY EFFICIENCY MARKET REPORT 2013
2011). The established and robust technology sector and highly skilled manufacturing base leave India well-positioned to take advantage of the opportunities in the efficiency market. The Climate Group (2011) estimates that by 2020 India’s energy efficiency market will reach USD 77 billion. Conclusions The energy efficiency market is growing steadily in India due to a combination of price factors and the ongoing implementation of energy efficiency policies suited to India’s industry and regional government structure, such as the PAT mechanism. Further, now that the government has enhanced operational capability through the newly functioning EESL, there is likely to be a turnaround in the level of investment in energy efficiency. Government efforts to scale up interventions during the 12th Plan by investing USD 500 million (INR 25 billion) in energy efficiency will also accelerate and expand opportunities for the energy efficiency market to deliver continued energy intensity improvements. Evaluation of progress in India’s markets for energy efficiency is central to identifying and addressing market challenges. References BEE (Bureau of Energy Efficiency) (2010), “National Mission on Enhanced Energy Efficiency”, presentation by S.P. Garnaik, Bureau of Energy Efficiency, Ministry of Power, government of India, New Delhi, www.moef.nic.in/downloads/others/Mission-SAPCC-NMEEE.pdf. BEE (2012), “India’s Energy Efficiency Standards and Labelling Program”, presentation by Vineeta Kanwal, Bureau of Energy Efficiency, Ministry of Power, government of India, New Delhi, www.hrdp-net.in/ live/hrdpmp/hrdpmaster/hrdp-asem/content/e8451/e8981/e41200/e41953/e41954/ eventReport41968/Presentation-Ms.VineetaKanwal.pdf. BEE (2013), Personal communication, Bureau of Energy Efficiency Ministry of Power, government of India, New Delhi. IEA (International Energy Agency) (2012a), World Energy Outlook 2012, OECD/IEA, Paris. IEA (2012b), Plugging the Energy Efficiency Gap with Climate Finance, OECD/IEA, Paris. IEA (2012c), Energy Technologies Perspectives: Pathways to a Clean Energy System, OECD/IEA, Paris. IEA (2013), Tracking Clean Energy Progress 2013: IEA Input to the Clean Energy Ministerial, OECD/IEA, Paris. Kumar, R. and A. Agarwala (2013), “Renewable Energy Certificate and Perform, Achieve, Trade Mechanism to Enhance the Energy Security for India”, Energy Policy Vol. 55, April, Elsevier, Amsterdam, pp. 669-676. Planning Commission (2012), Draft 12th Five Year Plan 2012-2017, Planning Commission, government of India, New Delhi. The Climate Group (2011), India’s Clean Revolution, The Climate Group and HSBC (supporting partner), London.
© O
EC
D/IE
A, 2
013

COUNTRY CASE STUDIES: JAPAN
ENERGY EFFICIENCY MARKET REPORT 2013 169
13. JAPAN
Energy profile and context Total primary energy supply (TPES) equalled 461 million tonnes of oil-equivalent (Mtoe) in 2011, while total final consumption (TFC) reached 314 Mtoe. Both have been decreasing steadily since 2004 (Figure 13.1). TPES further declined in 2012 to 451 Mtoe. The Institute of Energy Economics, Japan (IEEJ) anticipated that TFC would also decline further in 2012, and projects that it will be 0.2% lower year-on-year in 2013, in part due to continuous improvements in fuel economy for vehicles, use of more efficient transport modes, and energy-efficient appliances in the residential sector (Nagatomi, 2013). Japan’s energy supply remains largely composed of fossil fuels, notably oil products (47%), followed by coal and natural gas, which together make up another 48% of energy supply.
Figure 13.1 TPES and TFC, 2001-12, and energy supply by source, 2012
Notes: unless otherwise indicated, all tables and figures in this chapter derive from International Energy Agency (IEA) data and analysis. Data for 2012 are estimates.
Industry and transport together account for just over half of Japan’s final energy consumption. Both sectors have seen their total energy consumption decrease over the past decade, by approximately 9% for industry and 14% for the transport sector (Figure 13.2). Meanwhile, energy use in the commercial and public services sector and the residential sector increased very slightly, generally remaining steady. The high share of imported oil in Japan’s energy supply base makes it particularly vulnerable to changes in the price of oil on international markets. While Japan has managed to decrease oil import volumes slightly since 2008, expenditure on oil as a share of gross domestic product (GDP) continues to increase (Figure 13.3).
0
100
200
300
400
500
600
Mto
e
TPES TFC Electricity consumption
Coal and peat25%
Oil and oil products
47%
Natural gas23%
Nuclear1%
Renewable4%
Japan has sustained significant progress in energy efficiency since the 1970s, and is currently prioritising energy efficiency to manage energy-supply stresses in the aftermath of the March 2011 earthquake. This chapter focuses on two important market sub-sectors in Japan, appliances and passenger vehicles, in which energy performance levels are strongly driven by Japan’s Top Runner programme. Overall, investments in energy efficiency stemming from the programme have resulted in positive economic gains for consumers.
© O
EC
D/IE
A, 2
013

COUNTRY CASE STUDIES: JAPAN
170 ENERGY EFFICIENCY MARKET REPORT 2013
Figure 13.2 Share of TFC by sector, 2011, and TFC by sector and by energy source, 2001 and 2011
Note: “Other” includes biofuels plus heat from geothermal, solar, co-generation and district heating. Co-generation refers to the combined production of heat and power.
Figure 13.3 Volume, price and costs of oil imports, 2002-12
Japan was the world’s largest importer of liquefied natural gas (LNG) in 2012. Increases in oil and, particularly, gas prices, coupled with the reduction in electricity generation from of nuclear plants since 2011, have placed additional pressure on Japan to advance energy efficiency from a balance-of-trade perspective. IEEJ expects the proportion of fossil fuels in total imports to show an increase from 29% in 2010 to 34% in 2012, and to have been a factor behind Japan’s 2012 trade deficit (Nagatomi, 2013). Analysis of energy efficiency trends for Japan between 1990 and 2010 indicates that, on average, the rate of energy efficiency improvement was lower than in other IEA member countries for which data are available. However, by 1990 Japan was already a relatively efficient economy, with comparatively fewer opportunities to improve energy efficiency given the long history of energy efficiency policies and improvement efforts. Despite this already high level of relative efficiency, energy efficiency has been the main contributor to the reduction in actual energy use since 2000 (Figure 13.4), in part due to effective programmes and policies, particularly the Top Runner programme.
Industry27%
Transport24%
Residential15%
Services21%
Agriculture, forestry and
fishing1%
Non-specified and non-
energy use12%
0102030405060708090
100
2001 2011 2001 2011 2001 2011 2001 2011
Industry Transport Commercial and public services
Residential
Mto
e
Coal/peat Oil Gas Electricity Other
0
20
40
60
80
100
120
140
160
2005
USD
bill
ion
Import spending
50%
150%
250%
350%
450%
2002
= 1
00%
Average import priceImport costs as % of GDPImport volume
© O
EC
D/IE
A, 2
013

COUNTRY CASE STUDIES: JAPAN
ENERGY EFFICIENCY MARKET REPORT 2013 171
Figure 13.4 Changes in TFC, decomposed into structure, activity and efficiency effects
Note: IEA decomposition analysis calculates the relative impacts of three main factors that drive changes in TFC, using 1990 as a base year. The activity effect is a function of demand changes within a sector or sub-sector, measured as value-added, passenger-kilometres, tonne-kilometres or population. Structure effect is a function of changes in the relative shares of the industrial sub-sectors, transport modes or types of residential end-use. Efficiency effect is a function of changes in energy use per unit of activity within each of these sub-sectors, modes or end-uses. Further information on methodology can be found in Box 3.1.
Source: IEA indicators database.
Japan’s energy use per unit of GDP, at approximately 0.11 tonnes of oil-equivalent (toe) per USD 1 000 (2005 dollars in purchasing price parity [PPP] terms) in 2012, is below the IEA average of 0.137 (Figure 13.5). In addition, per-capita energy use has also declined since 2004, reaching 3.5 toe per capita in 2012, also below the IEA average of 4.5.
Figure 13.5 Evolution of energy intensity as a function of GDP, 2001-12
Note: Data for 2012 are estimates.
-6%
-4%
-2%
0%
2%
4%
6%
8%
2000-05 2005-10 2008-09 2009-10
Aver
age
annu
al c
hang
e
TFC Activity effect Structure effect Intensity effect
0.10
0.12
0.14
0.16
0.18
0.20
0.22
toe
per t
hous
and
2005
USD
PPP
World
IEA member countries
Japan
© O
EC
D/IE
A, 2
013

COUNTRY CASE STUDIES: JAPAN
172 ENERGY EFFICIENCY MARKET REPORT 2013
Electricity generation and intensity have remained relatively stable over the decade to 2011 (Figure 13.6). Consistent with the overall decline in energy consumption in the industrial sector, electricity use in that sector dropped by close to 20%; however, electricity use increased by over 10% in the residential sector over the same period.
Figure 13.6 Changes in electricity generation and consumption, 2001-11
Note: MER = market exchange rate basis for expressing GDP in real (constant) terms.
Energy efficiency market activity Market driver: energy efficiency policies and programmes Energy efficiency policy, like other policy activity in Japan, seeks to work within a culture of a “social partnership”, where society is willing to obligate itself to pursue stated policy objectives. Japan’s government has a long-standing tradition of setting targets to improve the performance of production processes and products. In 1999, Japan introduced the Top Runner programme, which sets dynamic energy efficiency targets for a range of products, from vehicles to household electrical appliances. The programme was combined with a labelling system in 2000, which was extended to vehicles in 2004. Targets are based on the level of the best-performing model on the market, and then consider the scope for potential efficiency improvements, with manufacturers directly involved in target setting. It has been effective in promoting technological and energy efficiency improvements of covered products. The programme does not include public financial support, but fiscal incentives are in place for the purchase of products that meet or exceed Top Runner target levels. The programme is accompanied by a “name-and-shame” mechanism, under which the names of non-compliant companies are publicly disclosed. This puts the brand image of companies at risk, an incentive for eco-innovation that, in Japan, may be more effective than the stringency of regulations (OECD, 2010). In Japanese markets for energy efficiency, the Top Runner programme focuses on advancing best possible levels of energy efficiency. Markets are prompted to produce the most efficient products, advancing both incremental improvements in energy efficiency, such as for electrical appliances, as well as encouraging industry to seek breakthrough innovations, such as in the vehicle manufacturing
80%
90%
100%
110%
120%
2001
= 1
00%
Electricity generation Electricity use by industryElectricity consumption/GDP (MER) Electricity use by transportElectricity consumption per capita Electricity use by residential
© O
EC
D/IE
A, 2
013

COUNTRY CASE STUDIES: JAPAN
ENERGY EFFICIENCY MARKET REPORT 2013 173
industry. Under the Top Runner programme, firms with the most energy-efficient products at the start of a target cycle do not need to make further investments in improved performance; while this recognises early-movers and innovators, it also encourages incremental rather than breakthrough innovations (OECD, 2010). Current energy efficiency market activity Top Runner and the automotive sector
The automotive industry is a core sector of the Japanese economy. In 2010, automotive shipments accounted for 16.4% of the total value of Japan’s manufacturing output, and were valued at JPY 47.3 trillion,1 up by 16.8% on the previous year (JAMA, 2012). In the same year, the industry invested JPY 505 billion in equipment and JPY 2.061 trillion in research and development (R&D). Domestically, the road transport sector in Japan accounted for over 21% of TFC in 2011; this sector is also characterised by a relatively high fuel tax regime.2
Figure 13.7 Average fuel economy of cars and share of passenger transport, 2000-10
Note: LGE = litres of gasoline-equivalent.
Source: IEA indicators database.
Japan initiated vehicle fuel economy standards relatively early, in 1979, and has refined its approach with the Top Runner programme (Lipscy and Schipper, 2013). For passenger vehicles (capacity of ten people or less), Top Runner identifies the most fuel-efficient model in each weight class and designates it the “top runner”. Next, the Top Runner method estimates the technology level in the target year. More specifically, the Japanese government estimates the prevailing level of each technology by the target year, by how much fuel efficiency will be improved by the introduction of the technology, and then calculates the aggregate improvement rate. The government also evaluates any potentially negative impacts on fuel efficiency from complementary policies or regulations that might occur by the target year, for example safety amendments or pollutant regulations that could worsen fuel efficiency. Based
1 This includes both domestic and export shipments, and covers all types of vehicle and auto parts. 2 Japan maintains the following fuel tax levels (OECD and EEA, 2012): JPY 32.10 per litre (/L) on diesel, JPY 48.6 per L on gasoline (plus a JPY 5.20/L local gasoline tax) and JPY 17.5 per kilogram (kg) on liquefied petroleum gas (LPG) used for transport.
57.0%
57.5%
58.0%
58.5%
59.0%
59.5%
60.0%
60.5%
61.0%
61.5%
9.8
10
10.2
10.4
10.6
10.8
11
11.2
11.4
LGE
per 1
00 k
m
Average fuel economy of cars Share of cars to total passenger-kilometres
© O
EC
D/IE
A, 2
013

COUNTRY CASE STUDIES: JAPAN
174 ENERGY EFFICIENCY MARKET REPORT 2013
on these estimates, the government calculates the future fuel efficiency level that the current top runner could reach by the target year in each class. These estimated future fuel efficiencies are then established as the target values for each category, with an emphasis on cost-effectiveness (IEA, 2012). Vehicles are required to exceed the new target values for their weight class within three to ten years. The targets are mandatory, and manufacturers must ensure that the average fuel economy of their vehicles in each weight category meets the standard in a given financial year. Manufacturers are allowed to accumulate credits in one weight category for use in another (ICCT/DieselNet, 2013). As a result of the continuous progress in improving standards, the fuel economy of the Japanese light-duty passenger vehicle fleet has improved substantially since 2000 (Figure 13.7). Vehicle efficiency levels remain important, as cars account for close to 60% of the total volume of passenger travel. The 1999 Top Runner programme established a fleet average target of approximately 15.1 kilometres per litre (km/L) for 2010, and in 2007 a target of 16.8 km/L was set for 2015. Recently, the Japanese government issued 2020 standards that would set the fuel economy target at 20.3 km/L. The programme has produced important benefits: both 2010 and 2015 target levels will produce significant savings for consumers, at a cost of JPY 5 and JPY 14 per litre of oil saved (Table 13.1). Historically, Japan’s fuel economy standards have been some of the most stringent, and its vehicle fleet has been the lightest and most fuel-efficient in the world (Figure 13.8).
Figure 13.8 Comparison of light-duty vehicle fuel efficiency standards and targets
Notes: solid lines = historical performance; dashed lines = enacted targets; dotted lines = proposed targets or targets under study. LDV = light-duty vehicle. Standards have been standardised using the New European Drive Cycle (NEDC). In the United States, Canada and Mexico light-duty vehicles include light commercial vehicles. China’s target reflects gasoline vehicles only; the target may be higher after new energy vehicles are considered. Source: ICCT, 2013.
Hamamoto (2011) found that while the first Top Runner standards did not lead to increased R&D spending by major vehicle manufacturers, efficiency levels have improved, even prior to introduction of the programme. This is partly because Japanese manufacturers were early investors in energy efficiency, already undertaking research into efficient vehicles, including breakthrough technologies for hybrid and all-electric vehicles.
0123456789
101112
2000 2005 2010 2015 2020 2025
Litr
es/1
00 k
m (g
asol
ine-
equi
vale
nt)
norm
alis
ed to
NED
C T
est C
ycle
United States-LDV Canada-LDV European UnionJapan China South KoreaAustralia India Mexico-LDV
© O
EC
D/IE
A, 2
013

COUNTRY CASE STUDIES: JAPAN
ENERGY EFFICIENCY MARKET REPORT 2013 175
Top Runner and the efficient appliance market
The Top Runner programme obliges appliance manufacturers to pursue the highest levels of energy efficiency technically available. Targets have generally been met or exceeded; on average, while standards required improvements in energy efficiency of between 16% and 80% for major product categories up to 2010, actual improvements ranged from 22% to 99% over the five- to ten-year periods between target years (Kimura, 2010). The Top Runner standards, combined with the labelling programme, have also had a positive impact on investment in innovation. Hamamoto (2011) found that both programmes led to a 9.5% increase in R&D expenditure at 13 major Japanese appliance manufacturing firms. Kainou (2007) assessed the investment and benefits resulting from Top Runner energy efficiency standards initiated between 2003 and 2015. Table 13.1 records manufacturer investment totalling JPY 246 billion and lifecycle benefits to consumers totalling JPY 416 billion. For the majority of product categories, benefits to consumers have exceeded the costs to manufacturers; in some cases however, costs to manufacturers have been very high, particularly in relation to the energy savings achieved, for example for microwaves and personal computers.
Table 13.1 Results of quantitative cost-benefit analysis of Top Runner energy efficiency standards
Products Target year Additional cost* (JPY billion)
Direct benefit**
(JPY billion) Avoided energy
demand Lighting 2005 3.4 38.1 14 040 GWh (1.2 Mtoe) Refrigerator 2004 19.0 80.7 29 749 GWh (2.6 Mtoe) Gasoline vehicle (1st regulation) 2010 41.5 107.6 7 654 ML (6.6 Mtoe)
Video tape recorder 2003 3.5 8.8 3 241 GWh (0.28 Mtoe) Air conditioner 2004 29.1 63.7 23 483 GWh (2 Mtoe) Electric rice-cooker 2008 2.1 2.4 888 GWh (0.08 Mtoe) Gasoline vehicle (2nd regulation) 2015 60.7 65.4 4 436 ML (3.9 Mtoe)
Warming toilet seat 2006 5.5 6.0 2 210 GWh (0.19 Mtoe) Television 2003 28.1 23.9 8 819 GWh (0.76 Mtoe) Personal computer 2005 48.0 17.9 6 611 GWh (0.57 Mtoe) Microwave 2008 5.1 1.5 588 GWh (0.05 Mtoe) Total - 246.0 416.0 -
* Cost to manufacturers, including R&D, facility expenses and equipment investments.
** Benefits to residential consumers, including avoided electricity and fuel expenditure.
Notes: GWh = gigawatt hour; ML = million litres. Costs and benefits are quantified as average cost and benefit over 30 years using a 3% discount rate.
Source: Kainou, 2007.
Challenges Despite generally positive market impacts, Japan’s Top Runner programme has faced difficulties when setting targets designed to shift the appliance and vehicle markets. For some products, it can be difficult to determine the rate of feasible technological improvement, leading to rapid achievement of targets and therefore less progress in the market than might have been achieved (for example, with fluorescent lighting or liquid-crystal displays), or to standards that are costly to achieve (for example, cost-effective improvements in air conditioning technologies are limited). The absence of
© O
EC
D/IE
A, 2
013

COUNTRY CASE STUDIES: JAPAN
176 ENERGY EFFICIENCY MARKET REPORT 2013
explicit consideration of the price impacts of the standards, and the impact on consumers, means that consumer prices for certain products may become excessively high with payback periods that exceed the lifetime of the equipment. Kimura (2011) found this to be the case for room air conditioners sold in 2006. Prospects for energy efficiency market activity Exposure to global energy prices and the economic and energy system impacts of the March 2011 earthquake have both prompted Japan to place the highest priority on efficiency and energy conservation. Given these dynamics, the energy efficiency market can be expected to expand further. In addition to its traditional focus on vehicles and appliances, greater importance is being attached to two areas: energy efficiency of buildings and demand response. Energy usage in buildings has grown over the past several decades, prompting a renewed focus on energy efficiency. A new mandatory programme requiring all buildings to attain energy efficiency criteria is under development, along with the provision of subsidies for building and window insulation, totalling approximately JPY 4 billion in fiscal year 2013. In addition, amendments to the Energy Conservation Law will require insulation materials to be covered by the Top Runner programme starting in 2014. The Top Runner programme will also broaden its scope to cover three-phase induction motors, light-emitting diodes, heat pumps and printers in 2015, leading to further market transformation in these appliance and equipment markets. Importantly, following the March 2011 earthquake, in the face of power shortages and mandated reductions in electricity consumption, there has been a renewed understanding by consumers of the need to persist with energy conservation and efficiency. Companies will continue to invest in energy efficiency, including peak control equipment and management techniques, due to the ongoing risk of energy shortages along with higher energy prices. There is growing interest among local governments and companies in the Smart Community concept, which encourages the use of renewable energy and energy efficiency in the context of economic growth and improving quality of life. New policies will provide additional momentum to existing trends in energy efficiency, while markets for energy efficiency products and services in Japan should experience increased support from consumer-led demand that complement government policy and energy price drivers. Conclusions Notwithstanding consistent progress to date, Japan is stepping up energy efficiency ambitions. The March 2011 earthquake and ensuing accident at Fukushima Daiichi nuclear power plant led to immediate measures restricting electricity use by households and businesses in the face of power shortages. It also drove a strengthened focus on energy efficiency, alongside short-term increases in oil and gas prices. This focus is more strategic than ever, and with renewed engagement of consumers and new efforts to create sustainable cities, it is highly likely that Japan will continue to sustain its long-term progress in improving energy efficiency. References Hamamoto, M. (2011), “Energy Efficiency Regulation and R&D Activity: A Study of the Top Runner Program in Japan”, Low Carbon Economy 2011, Vol. 2, Scientific Research Publishing, Irvine, pp. 91-98. ICCT (The International Council on Clean Transportation) (2013), Global Standards Comparison datasheet, August 2013, ICCT, Washington DC.
© O
EC
D/IE
A, 2
013

COUNTRY CASE STUDIES: JAPAN
ENERGY EFFICIENCY MARKET REPORT 2013 177
ICCT and DieselNet (2013), “Japan: Light Duty: Fuel Economy”, TransportPolicy.net, January. IEA (International Energy Agency) (2012), Improving the Fuel Economy of Road Vehicles – a Policy Package, Policy Pathway Series, IEA/OECD, Paris. JAMA (Japan Automobile Manufacturers Association) (2012), The Motor Industry of Japan 2012, JAMA Inc., Tokyo. Kainou, K. (2009), Why do Top Runner Energy Efficiency Standard Regulations Result in Large Positive or Negative Costs? – Risk of Investment in High Energy Efficiency Products and Risk of Government Regulation Failure, Research institute of Economy Trade & Industry, Tokyo, www.rieti.go.jp/en/columns/a01_0215.html. Kimura, O. (2010), Japanese Top Runner Approach for Energy Efficiency Standards, SERC Discussion Paper SERC09035, Central Research Institute of Electric Power Industry (CRIEPI), Tokyo, www.climatepolicy.jp/thesis/pdf/09035dp.pdf. Lipscy, P. and L. Schipper (2013), “Energy Efficiency in the Japanese Transport Sector”, Energy Policy, Vol. 56, May, Elsevier, Amsterdam, pp. 248-258. Nagatomi, Y. (2013), Short Term Energy Supply and Demand Outlook – Energy Supply and Demand Forecast for FY2013, Institute of Energy Economics - Japan (IEEJ), Tokyo. OECD (Organisation for Economic Co-operation and Development) (2010), OECD Environmental Performance Reviews: Japan 2010, OECD, Paris. OECD and EEA (European Environment Agency) (2012), OECD/EEA database on environmentally related taxes, fees and charges, other economic instruments and voluntary approaches used in environmental policy and natural resources management, OECD, Paris (updated 5 May).
© O
EC
D/IE
A, 2
013
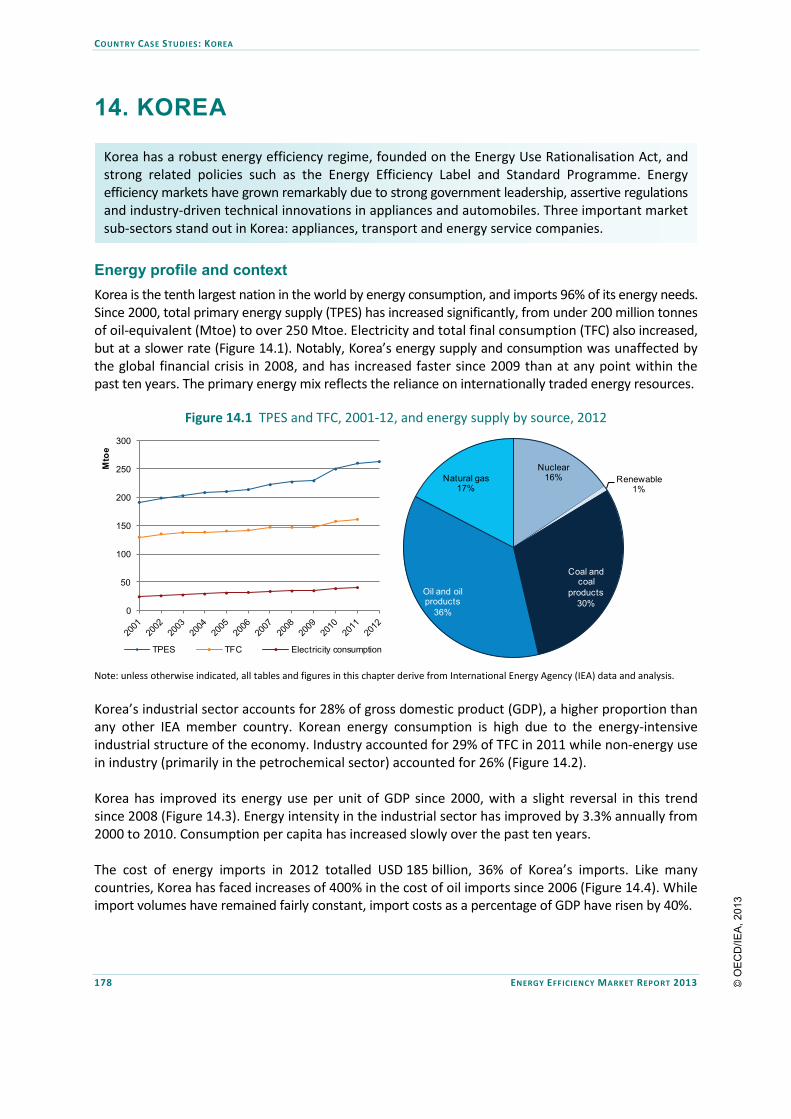
COUNTRY CASE STUDIES: KOREA
178 ENERGY EFFICIENCY MARKET REPORT 2013
14. KOREA
Energy profile and context Korea is the tenth largest nation in the world by energy consumption, and imports 96% of its energy needs. Since 2000, total primary energy supply (TPES) has increased significantly, from under 200 million tonnes of oil-equivalent (Mtoe) to over 250 Mtoe. Electricity and total final consumption (TFC) also increased, but at a slower rate (Figure 14.1). Notably, Korea’s energy supply and consumption was unaffected by the global financial crisis in 2008, and has increased faster since 2009 than at any point within the past ten years. The primary energy mix reflects the reliance on internationally traded energy resources.
Figure 14.1 TPES and TFC, 2001-12, and energy supply by source, 2012
Note: unless otherwise indicated, all tables and figures in this chapter derive from International Energy Agency (IEA) data and analysis.
Korea’s industrial sector accounts for 28% of gross domestic product (GDP), a higher proportion than any other IEA member country. Korean energy consumption is high due to the energy-intensive industrial structure of the economy. Industry accounted for 29% of TFC in 2011 while non-energy use in industry (primarily in the petrochemical sector) accounted for 26% (Figure 14.2). Korea has improved its energy use per unit of GDP since 2000, with a slight reversal in this trend since 2008 (Figure 14.3). Energy intensity in the industrial sector has improved by 3.3% annually from 2000 to 2010. Consumption per capita has increased slowly over the past ten years. The cost of energy imports in 2012 totalled USD 185 billion, 36% of Korea’s imports. Like many countries, Korea has faced increases of 400% in the cost of oil imports since 2006 (Figure 14.4). While import volumes have remained fairly constant, import costs as a percentage of GDP have risen by 40%.
0
50
100
150
200
250
300
Mto
e
TPES TFC Electricity consumption
Nuclear16% Renewable
1%
Coal and coal
products30%
Oil and oil products
36%
Natural gas17%
Korea has a robust energy efficiency regime, founded on the Energy Use Rationalisation Act, and strong related policies such as the Energy Efficiency Label and Standard Programme. Energy efficiency markets have grown remarkably due to strong government leadership, assertive regulations and industry-driven technical innovations in appliances and automobiles. Three important market sub-sectors stand out in Korea: appliances, transport and energy service companies.
© O
EC
D/IE
A, 2
013

COUNTRY CASE STUDIES: KOREA
ENERGY EFFICIENCY MARKET REPORT 2013 179
Figure 14.2 Share of TFC by sector, 2011, and TFC by sector and by energy source, 2001 and 2011
Note: “Other” includes biofuels plus heat from geothermal, solar, co-generation and district heating. Co-generation refers to the combined production of heat and power.
Figure 14.3 Evolution of energy intensity as a function of GDP, 2001-12
Note: PPP = purchasing power parity.
Figure 14.4 Volume, price and costs of oil imports, 2002-12
Industry29%
Transport18%
Residential12%
Services13%
Agriculture, forestry and
fishing2%
Non-specified and non-
energy use26%
05
101520253035404550
2001 2011 2001 2011 2001 2011 2001 2011
Industry Transport Commercial and public services
Residential
Mto
e
Coal/peat Oil Gas Electricity Other
0.12
0.14
0.16
0.18
0.20
0.22
toe
per t
hous
and
2005
USD
PPP
World
IEA member countries
Korea
0
20
40
60
80
100
2005
USD
bill
ion
Import spending
50%
150%
250%
350%
450%
2002
= 1
00%
Average import priceImport costs as % of GDPImport volume
© O
EC
D/IE
A, 2
013

COUNTRY CASE STUDIES: KOREA
180 ENERGY EFFICIENCY MARKET REPORT 2013
Consumption of electricity in Korea has increased by 80% since 2000 (Figure 14.5), compared to 12% average across IEA member countries. During this period the highest annual growth rate was between 2009 and 2010, when consumption rose by 10%. According to IEA analysis, consumption is projected to continue to rise at a rate of 4% until 2018, but below the 7% rate seen since 2000.
Figure 14.5 Changes in electricity generation and consumption, 2001-11
Note: MER = market exchange rate basis for expressing GDP in real (constant) terms.
Korean households are currently spending 25% less of their income on energy consumption (excluding transport) than ten years ago (Figure 14.6).
Figure 14.6 Proportion of household expenditure on energy
Note: excludes fuels used for transport.
Source: OECD, 2013.
90%
100%
110%
120%
130%
140%
150%
160%
170%
2000
= 1
00%
Electricity generation Electricity use by industryElectricity consumption/GDP (MER) Electricity use by transportElectricity consumption per capita Electricity use by residential
2.0%
2.2%
2.4%
2.6%
2.8%
3.0%
3.2%
3.4%
3.6%
3.8%
4.0%
Prop
ortio
n of
exp
endi
ture
© O
EC
D/IE
A, 2
013

COUNTRY CASE STUDIES: KOREA
ENERGY EFFICIENCY MARKET REPORT 2013 181
Energy efficiency market activity Market supply: potential for energy savings South Korea has had a robust system of energy efficiency targets in place since 1993. Most recently, in 2008 Korea updated its energy efficiency target to reflect its new Low Carbon Green Growth strategy: the First National Energy Master Plan (2008-30) aims to reduce energy intensity over the period by 244 Mtoe, which is 46% below the projected business-as-usual energy demand (Figure 14.7). The target is equivalent to an energy intensity level of 0.185 tonnes of oil-equivalent (toe) per USD 1 000, which is close to the current world average energy intensity.
Figure 14.7 Energy demand and target, 2008-30
Source: MOTIE and KEMCO, 2008.
Table 14.1 provides a breakdown of the expected energy savings from the new policies over the period 2007-30. These are required for the energy efficiency target to be met.
Table 14.1 Projected energy demand under current policies and new policies (Mtoe)
Category 2007 2012 2017 2020 2030 Existing policies (2007) 236.5 299.3 368.8 398.4 544.0 New policies - 265.1 282.0 288.0 300.4 Increase in energy savings - 34.2 86.8 110.4 243.6
Source: MOTIE and KEMCO 2008.
Market driver: energy efficiency policies and programmes Korea has important energy efficiency programmes targeting the appliance and car sectors. Additional programmes also target other sectors such as buildings. The energy service company (ESCO) market has also seen important growth in recent years. The Korean Energy Management Corporation (KEMCO), which is the government agency responsible for the implementation of energy conservation policies and energy efficiency improvement measures as well as climate change mitigation activities, and the Ministry of Trade, Industry and Energy (MOTIE) are the major government bodies responsible for
203.5236.5
299.3
368.8
544
265.1 282 300.4
0
100
200
300
400
500
600
2002 2007 2012 2017 2030
Mto
e
Estimated energy use without energy efficiency improvementsTarget total final consumption
(0.185 toe/GDP)
46 %
(0.367 toe/GDP)
© O
EC
D/IE
A, 2
013

COUNTRY CASE STUDIES: KOREA
182 ENERGY EFFICIENCY MARKET REPORT 2013
driving energy efficiency policy. Recent activities in standards and labelling in the appliance market, fuel economy standards and the ESCO market are highlighted below. Standards, labelling and the efficient appliance market
A leading energy efficiency initiative in Korea is the series of three standards and labelling programmes targeted at appliances. Korea is well known for its significant appliance manufacturing capacity, and has developed a leading role in advancing the energy efficiency of white goods and smart appliances. Korea’s strong position in those markets is expected to continue based on its performance over the past five years (Table 14.2).
Table 14.2 Global market size for major appliances (USD billion) and Korea’s market share
Category Market size/share 2008 2009 2010 2011 2012
Television World market size 96.17 96.22 113.18 114.39 108.83
Korea’s market share 33.8% 35.8% 36.0% 38.6% 42.8%
Refrigerator World market size 6.85 6.83 7.03 7.14 -
Korea’s market share 16.5% 15.6% 17.0% 18.7% -
Clothes washer World market size 3.22 3.2 3.29 3.76 -
Korea’s market share 17.0% 19.3% 21.6% 18.0% -
Air conditioner World market size 6.0 5.77 5.95 6.09 -
Korea’s market share 19.3% 17.6% 12.9% 10.7% -
Source: MOTIE, 2013.
Korea’s standards and labelling programmes have had a major impact on equipment and appliance markets; they have been particularly successful in driving efficiency improvements in refrigerators, air conditioners and washing machines. The programmes are as follows: • the Energy Efficiency Label and Standard Programme (1992) targets products with high energy
consumption by mandating a label indicating each product’s energy efficiency grade, and prohibits the production and sale of products that fall below a threshold designated as the fifth grade – effectively a minimum energy performance standard;
• the High-efficiency Appliance Certification Programme (1996) guarantees the high efficiency of products by certifying products that perform above certain standards;
• the E-Standby Programme (1999) uses the Energy Boy label, which is attached to consumer electronic appliances and office equipment that are major standby power consumers, and which satisfy the standby power reduction standards set by the government (KEMCO, 2013).
There is tremendous pressure on appliance and equipment manufacturers to produce more energy-efficient products due to intense competition and government regulations. The total number of high-efficiency products is increasing very fast in Korea. Standards are tightened on a regular basis, and as a result the proportion of products in each energy consumption category is constantly changing: today’s first grade (highest efficiency) product could be a second or third grade product next year and the current fifth grade product could be phased out. For example, the decrease in the total number of products sold in 2012 was caused partly by the phase-out of incandescent lamps (Figure 14.8). When new standards are set, it takes time before manufacturers are able to ramp up production volumes of the latest high-efficiency products, which also helps explain why the proportion of first grade products decreased from 35% in 2008 to 26% in 2012, even accounting for the recent technological progress in the energy efficiency field (Figure 14.8).
© O
EC
D/IE
A, 2
013

COUNTRY CASE STUDIES: KOREA
ENERGY EFFICIENCY MARKET REPORT 2013 183
Figure 14.8 Breakdown by efficiency level of appliances and equipment sold in Korea, 2008-12
Note: appliances and equipment includes: refrigerators, freezers, kimchi refrigerators, air conditioners, clothes washers, drum washing machines, driers, dishwashers, electric cold and hot water dispensers, vacuum cleaners, fans, air purifiers, incandescent lamps, fluorescent lamps, and ballast stabiliser embedded lamps.
Source: KEMCO, 2013.
Korea has realised significant savings as a result of the three energy efficiency standards and labelling programmes (Table 14.3).
Table 14.3 Results of Korean energy efficiency standards and labelling programmes, 2011
Category Target products
Sales of high-efficiency products (units)
Estimated savings (toe)
Estimated savings (USD)
Energy Efficiency Label and Standard Programme 30 146 055 171 1 056 946 472 million
High-efficiency Appliance Certification Programme 39 8 019 477 737 807 369 million
e-Standby Programme 21 20 404 643 468 683 239 million Total 90 174 475 291 2 263 436 1.08 billion
Source: KEMCO, 2013.
Fuel economy standards
In 2011, Korea was the fifth largest producer of motor vehicles in the world, following China, the United States, Germany and Japan (KAMA, 2012), and its domestic market has grown substantially since 2001 (Figure 14.9). The number of people per car has decreased from 4.48 in 1997 to 2.91 in 2009. However, this number is still high compared to other countries such as the United States (1.2), Japan (1.7) and Germany (1.9), and as a result domestic car sales are expected to continue to increase steadily. With the transport sector already representing 20% of TFC, the growing domestic vehicle market points to the need for the Korean government to continue with efforts to promote fuel efficiency (KEEI, 2009). In 1992, the Korean government introduced fuel economy labels for motor vehicles, which classify vehicles into five levels according to fuel efficiency, from level one (highest) to level five (lowest). The fuel economy stringency levels for the labels were tightened in 2012 (Table 14.4) to reflect new test criteria, including
0
5 000
10 000
15 000
20 000
25 000
30 000
35 000
40 000
45 000
50 000
2008 2009 2010 2011 2012
Thou
sand
uni
ts
Level 5 Level 4 Level 3 Level 2 Level 1
© O
EC
D/IE
A, 2
013

COUNTRY CASE STUDIES: KOREA
184 ENERGY EFFICIENCY MARKET REPORT 2013
from city-mode fuel economy (mono-standard) to combined fuel economy. The combined fuel economy reflects real driving conditions, including driving with an air conditioner turned on, aggressive and highly accelerated driving and driving in very low temperatures. Table 14.5 shows the resulting fuel savings.
Figure 14.9 Car ownership in Korea
Source: Korea Automobile Manufacturers Association, 2012.
Table 14.4 New fuel economy label stringency levels
Year Category Level 1 Level 2 Level 3 Level 4 Level 5 After 2012 Combined fuel economy (km/L) > 16.0 15.9-13.8 13.7-11.6 11.5-9.4 < 9.3 Before 2011 City-mode fuel economy (km/L) > 15.0 14.9-12.8 12.7-10.6 10.5-8.4 < 8.3
Note: km/L = kilometre per litre.
Source: KEMCO, 2012a.
Table 14.5 Fuel savings when moving one level up
Level 2 to level 1 Level 3 to level 2 Level 4 to level 3 Level 5 to level 4 Fuel Economy (km/L) 130 L 176 L 250 L 383 L
Notes: L = litre. Assuming annual mileage of 15 000 km.
Source: KEMCO, 2012a.
Figure 14.10 shows the distribution of car sales according to efficiency level. Standards are a moving target and therefore every time the standards are tightened, the proportion of high-efficiency vehicles may initially go down before rising again as the supply adapts. For example, when MOTIE tightened the fuel economy standards in 2008, the number of the level-one cars initially decreased from 17.1% in 2007 to 3.5% in 2008, but by 2011 had rebounded to reach nearly 40% of sales. From 2003 to 2011 the number of vehicles in Korea that qualified as level one increased from 33 models (9% of all the car models sold domestically) to 133 models (18% of all the car models). However, following the introduction of new criteria in 2012, only 46 models (6.4% of all the car models) will qualify. The Korean government expects the share of level-one passenger vehicles to decrease from more than 30% in 2011 to less than 10% from 2012 as a result of strengthened criteria.
12 91514 587
15 39716 428
17 325 18 437
8 88910 279
11 12212 100
13 02414 136
0
2 000
4 000
6 000
8 000
10 000
12 000
14 000
16 000
18 000
20 000
Thou
sand
uni
ts
Total vehicle sales Passenger vehicles
5%
18%
77%
Vans
Heavy-duty vehicles
Passenger vehicles
© O
EC
D/IE
A, 2
013

COUNTRY CASE STUDIES: KOREA
ENERGY EFFICIENCY MARKET REPORT 2013 185
Figure 14.10 Breakdown by efficiency level of car sales in Korea, 2007-11
Source: KEMCO, 2012a.
In 2006, the Korean government introduced the Average Fuel Economy Programme (similar to the US Corporate Average Fuel Economy [CAFE] standard) for all vehicle manufacturers and importers. Each manufacturer or importer must ensure that the sales-weighted average fuel economy of passenger vehicles that they sell in a year meets the standard. A standard of 17 km/L (140 grams per kilometre [g/km]) was set in 2011 for vehicles sales during the period from 2012 to 2015 (Table 14.6). New criteria require domestic manufacturers and importers to ensure that 30% of total sales volumes in 2012 meet the average fuel economy standards, rising to 60% in 2013, 80% in 2014 and 100% in 2015.
Table 14.6 Korean Average Fuel Economy Programme standards
Year Below 1 600 cc Above 1 600 cc 2006-11 12.4 km/L 9.6 km/L 2012-15 17 km/L (140 g/km)
Note: cc = cubic centimetres.
Source: KEMCO, 2012a.
The ESCO market
The ESCO market has been growing consistently in Korea. Between 1992 and 2011, the number of registered ESCOs increased from four to 235, 78 of which have undertaken energy efficiency projects. Total turnover between 2007 and 2011 increased from USD 212 million to USD 330 million, and total energy savings in 2011 from ESCO projects was estimated at 1.3 Mtoe (Table 14.7). About 65% of the funding for these projects came from the government budget and the remaining 35% from private sector. From 2007 to 2010, the level of government funding was relatively stable; however, in 2011 funding increased by 118% and resulted in a total turnover increase of 63% in the ESCO market. ESCO projects target different sectors and activities (Table 14.8); about two-thirds of ESCO investments were used for industrial process improvements and waste heat recovery between 2007 and 2011. Lighting energy efficiency improvements are the most frequently supported opportunities.
0
50
100
150
200
250
300
350
400
450
500
2007 2008 2009 2010 2011
Thou
sand
uni
ts
Level 5 Level 4 Level 3 Level 2 Level 1
© O
EC
D/IE
A, 2
013

COUNTRY CASE STUDIES: KOREA
186 ENERGY EFFICIENCY MARKET REPORT 2013
Table 14.7 ESCO sector turnover, 2007-11 (USD million)
Year Government funding Private funding Total turnover Estimated savings (toe) 2007 123.4 88.7 212.1 441 000 2008 101.5 46.3 147.7 514 000 2009 119.9 81.4 201.3 502 000 2010 118.8 84.0 202.8 585 000 2011 259.4 71.1 330.5 1 316 000 Total 723.0 371.5 1 094.4 3 358 000
Source: KEMCO, 2012b.
Table 14.8 Cumulative ESCO expenditure by technology, 2007-11 (USD million)
Category Lighting Co-generation Boiler Process
improvement Waste heat recovery
Heating and
cooling Motor Other Total
Number of projects 166 10 38 143 141 46 58 28 630
Funding 44.49 52.11 40.77 215.16 263.95 44.05 30.62 31.80 722.96
Notes: “Other” indicates new and renewable energy facilities, operating costs and IT facilities. Co-generation refers to the combined production of heat and power.
Source: KEMCO, 2012b.
Challenges Despite efforts by the Korean government to promote energy efficiency and the continuous technical advances in efficiency made by companies, domestic electricity consumption has increased to the extent that power supply has been unable to keep up the demand, resulting in power shortages. Electricity retail rates are relatively low and stable compared to oil and gas prices, which is driving consumers to switch to electric heating and cooling appliances. Fear of inflation has limited progress in allowing electricity retail rates to increase, which would help encourage efficiency at the consumer level and mitigate the issue of electricity shortages. The Korean government is imposing a ban on the production and import of incandescent lamps starting in 2014 and will encourage uptake of light-emitting diodes (LEDs). However, the high purchase price of LEDs, which can cost about ten times more than an incandescent bulb, is expected to make this transition challenging. Prospects for energy efficiency market activity Korean experts suggest that, while Korean domestic appliance markets are already saturated, demand will remain steady for the replacement of old appliances with smart and highly efficient models. This suggests a potential market shift towards new product categories. Another new source of demand for efficient appliances will be in newly built apartments. About 60% of Koreans live in apartments, which include pre-installed domestic appliances. The increasing stringency and scope of standards, such as building codes, and consumer awareness and education are expected to drive the uptake of more efficient products. The domestic vehicle market is expected to grow further, given low household car ownership (e.g. relative to other IEA member countries). Consumer preference for larger passenger cars (the market share of
© O
EC
D/IE
A, 2
013

COUNTRY CASE STUDIES: KOREA
ENERGY EFFICIENCY MARKET REPORT 2013 187
compact cars is 38% as against 54% in the European Union) will lead to further need for technological innovation by Korean manufacturers to meet fuel efficiency requirements and satisfy consumer preferences. A change in public perception in favour of smaller, more efficient vehicles would contribute to improving the efficiency of the Korean fleet. The Korean government plans to promote energy management systems (EMS) to achieve further energy savings. EMS allow entities to monitor, control and optimise the performance of their energy systems. The application of EMS will enable Korea to draw on its competitive information and communications technology (ICT) sector for energy efficiency-related ICT components such as sensors, software, hardware and controlling techniques. EMS can be applied to a variety of sectors, including factories, buildings and homes. MOTIE has announced that it will prepare comprehensive measures for the widespread adoption of EMS by the industrial sector, which currently represents a large portion of final energy use (MOTIE, 2013). Traditionally, much of the focus of energy efficiency measures has been on the consumption side rather than the supply-side and energy providers (e.g. appliance or fuel efficiency rather than smart grid management). However MOTIE and KEMCO have recently announced that they are considering expanding their operations to address efficiency within this area, which could provide an important potential for growth in the energy efficiency market. References KAMA (Korea Automobiles Manufactures Association) (2012), Korean Automobile Industry Annual Report 2012, KAMA, Seoul. KEEI (Korea Energy Economics Institute) (2009), Research on Improving National System of Implementing Energy Conservation and Efficiency: the Evaluation of Transportation Energy Efficiency, KEEI, Uiwang-si. KEMCO (Korea Energy Management Corporation) (2012a), Korea’s Energy Standards & Labelling, KEMCO, Yongin City. KEMCO (2012b), The Business Showings of ESCO in 2011, KEMCO, Yongin City. KEMCO (2013), Energy Savings of Three Major Energy Efficiency Programs, KEMCO, Yongin City. MOTIE (Ministry of Trade, Industry and Energy) (2013), Statistics for Home Appliances, MOTIE, Gwancheon-si. MOTIE and KEMCO (2008), The 4th Master Plan for Energy Utilization and Rationalization, MOTIE, Gwancheon-si and KEMCO, Yongin City. OECD (Organisation for Economic Co-operation and Development) (2013), “National Accounts: Final consumption expenditure of households”, OECD National Accounts statistics (database), www.oecd-ilibrary.org/statistics, accessed 15 May 2013.
© O
EC
D/IE
A, 2
013

COUNTRY CASE STUDIES: MEXICO
188 ENERGY EFFICIENCY MARKET REPORT 2013
15. MEXICO
Energy profile and context Energy consumption in Mexico has been increasing since 2001, in line with steady economic growth over the period. Primary energy consumption is dominated by oil and gas (Figure 15.1).
Figure 15.1 TPES and TFC, 2001-12, and energy supply by source, 2012
Note: unless otherwise indicated, all tables and figures in this chapter derive from International Energy Agency (IEA) data and analysis.
Figure 15.2 Share of TFC by sector, 2011, and TFC by sector and by energy source, 2001 and 2011
Note: “Other” includes biofuels plus heat from geothermal, solar, co-generation and district heating. Co-generation refers to the combined production of heat and power.
0
50
100
150
200
250
Mto
e
TPES TFC Electricity consumption
Nuclear1%
Renewable9%
Coal and coal
products5%
Oil and oil products
55%
Natural gas30%
Industry25%
Transport45%
Residential16% Services
3%
Agriculture, forestry and
fishing3%
Non-specified and non-
energy use8%
0
10
20
30
40
50
60
2001 2011 2001 2011 2001 2011 2001 2011
Industry Transport Commercial and public services
Residential
Mto
e
Coal/peat Oil Gas Electricity Other
Mexico has implemented major energy efficiency programmes, targeting lighting, appliances and buildings, all under the National Programme for Sustainable Use of Energy (PRONASE). The Luz Sustentable programme set a world record for incandescent lamp replacement, while the Green Mortgage Programme won the 2012 World Habitat Award. A newly elected government is expected to continue, but refine, these energy efficiency policies, as evidenced by a strong role set out for energy efficiency in the latest national energy strategy.
© O
EC
D/IE
A, 2
013

COUNTRY CASE STUDIES: MEXICO
ENERGY EFFICIENCY MARKET REPORT 2013 189
Transport and industry account for almost two-thirds of total final consumption, followed by the residential sector (Figure 15.2). The transport sector has grown rapidly over the past decade. Energy intensity in Mexico, as measured by total primary energy supply (TPES) per unit of gross domestic product (GDP), remains below the world average and also below the average for member countries of the Organisation for Economic Co-operation and Development (OECD) (Figure 15.3). TPES per capita is in line with the global average but well above other OECD member countries. A recent decrease in TPES per capita may have resulted from a combination of several factors – structural change, economic growth, manufacturing retrenchment in response to the recent economic downturn, and (possibly) early results of energy efficiency programmes.
Figure 15.3 Evolution of energy intensity as a function of GDP, 2001-12
Note: data for 2012 are estimates.
Figure 15.4 Changes in electricity generation and consumption, 2001-11
0.10
0.12
0.14
0.16
0.18
0.20
0.22
toe
per t
hous
and
2005
USD
PPP
World
OECD economies
Mexico
90%
100%
110%
120%
130%
140%
2001
= 1
00%
Electricity generation Electricity use by industryElectricity consumption/GDP (MER) Electricity use by transportElectricity consumption per capita Electricity use by residential
© O
EC
D/IE
A, 2
013

COUNTRY CASE STUDIES: MEXICO
190 ENERGY EFFICIENCY MARKET REPORT 2013
Electricity use in Mexico has increased steadily since 2001, driven by the residential sector (Figure 15.4). This continued growth in residential electricity consumption may help to explain recent increases in household energy expenditure (Figure 15.5).
Figure 15.5 Proportion of household expenditure on energy
Note: excludes fuels used for transport.
Source: OECD, 2013.
Energy efficiency market activity Market driver: energy efficiency policies and programmes Until the end of 2012, the main energy efficiency policy in Mexico was direct government involvement in promoting and supporting energy efficiency by means of the National Programme for Sustainable Use of Energy (Programa Nacional para el Aprovechamiento Sustentable de la Energía, or PRONASE), which was created by the 2008 Law for Sustainable Use of Energy. PRONASE was a three-year programme (2009-12) with the stated objective of saving 43 terawatt hours (TWh) of energy, the first step in a long-term goal of reducing electricity demand in 2030 by 18%. PRONASE encompassed seven sectoral programmes: road transport vehicles, lighting, household appliances, co-generation, electric motors, energy efficiency standards for new buildings, and water distribution. Another related long-standing national appliance and equipment efficiency standards programme delivers large and ongoing energy savings (Table 15.1).
The 2008 Law also created the National Commission for Energy Efficiency (CONUEE), a quasi-decentralised administrative agency within the Secretary of Energy (SENER) responsible for overseeing implementation of PRONASE. CONUEE has a staff of 150 and is responsible for collecting energy usage data, facilitating negotiations on energy savings programmes for large energy users, and overseeing the appliance and equipment efficiency standards programme. The long-standing Electric Power Savings Trust Fund (FIDE) has administered several programmes under the PRONASE umbrella, including: • The Luz Sustentable (Sustainable Light) programme, which distributed over 47 million compact
fluorescent lamps (CFLs) to replace incandescent bulbs in over eight million Mexican households
3.00%
3.05%
3.10%
3.15%
3.20%
3.25%
3.30%
3.35%
Prop
ortio
n of
exp
endi
ture
© O
EC
D/IE
A, 2
013

COUNTRY CASE STUDIES: MEXICO
ENERGY EFFICIENCY MARKET REPORT 2013 191
between 2009 and 2012. Each household was eligible to trade in up to four incandescent bulbs and receive four CFLs of equivalent lumens. This replacement programme is part of the national strategy to phase out sales of incandescent lamps by the end of 2013. The energy savings of 2 TWh per year will be equivalent to the output of two 900 megawatt (MW) power plants (Sener, 2012).
• The Cambia a tu viejo programme finances the substitution of old, inefficient refrigerators and air conditioners with modern and more efficient equipment. This national initiative from 2009 to 2012 replaced over 1.5 million refrigerators and air conditioners older than ten years by offering cash subsidies of up to USD 170 per household. Average annual savings of 150 kWh translate into programme savings of 0.2 TWh (Davis, 2013).
• The FIDE voluntary label identifies energy-efficient products on the Mexican market, similar to the ENERGY STAR endorsement brand used in the United States and the Top Runner brand used in Japan. Manufacturers submit certified test results to confirm their products are eligible for the FIDE label. FIDE aims to cover 7 700 products across 85 companies. FIDE complements the minimum energy performance standards (MEPS) on those product categories where they overlap (APERC, 2011).
Table 15.1 Mexican energy policies and programmes
Programme/policy Implementing agency 2012 annual energy savings (TWh)
Programme for Financing of Electric Energy Saving (PFAEE)
Electric Power Savings Trust Fund (FIDE) 0.2
Luz Sustentable FIDE 2.0
Co-generation Development Programme National Commission for Energy Efficiency (CONUEE) 2.1
Green Mortgage Programme Mexican National Housing Commission (CONAVI) 4.0
Appliance efficiency standards promulgated under the Federal Metric and Standardisation Law CONUEE 16.0
Sources: CONUEE, 2013; DeBuen and Segura, 2007; FIDE, 2013; World Habitat Awards, 2013.
Table 15.2 Mexican equipment labels and standards coverage
Label or standard Residential Multi-sector
Endorsement and comparative labels
Fluorescent lamps, televisions and DVD players, fluorescent lamp ballasts, room AC, commercial water coolers, refrigerators, clothes washers, central AC, instantaneous water heaters, water pumps, refrigerator-freezers.
Industrial three-phase motors, LEDs, HID lighting and ballast, lighting sensors, variable speed drives, fluorescent lamps, air compressors, CFLs, water heaters, inverters, freezers, GS motors, water coolers, refrigerated cabinets, pumps, transformers.
Minimum energy performance standards
Central AC, room AC, water heaters, building envelope materials, water pumps.
HID lighting, pumps, water heaters, fluorescent lamps, tortilla making machines, incandescent lighting, water heaters, lighting systems, building envelop materials, freezers, solid-state LEDs, three-phase motors, refrigerated cabinets.
Note: AC = air conditioner; GS = general service; HID = high-intensity discharge; LED = light-emitting diode.
Source: CLASP, 2013.
Mexico has a long-standing and very active appliance and equipment standards programme. The mandate for energy efficiency standards dates back to a 1992 generic law (Ley Federal sobre Metrología
© O
EC
D/IE
A, 2
013
COUNTRY CASE STUDIES: MEXICO
192 ENERGY EFFICIENCY MARKET REPORT 2013
y Normalización [LFMN]) of 16 July 1992. As of 2012, there were 25 enacted appliance and equipment standards, and more than 30 testing laboratories approved by CONUEE and accredited by the national accreditation entity (CLASP, 2013; CONUEE, 2013). The National Consultative Committee of Standards for the Preservation and Rational Use of Energy Resources is responsible for reviewing all MEPS proposals. The committee is a key element of energy efficiency governance in Mexico, as it has helped CONUEE develop a co-operative network of private and public organisations to oversee energy efficiency regulatory policy (IEA, 2010). A 2007 analysis estimated that energy efficiency standards saved an aggregate of 16 TWh for end-users between 1995 and 2006, and resulted in 2 926 MW of avoided power capacity, or 6% of Mexico’s installed generating capacity (De Buen and Segura, 2007). Until 2012, the government’s main energy efficiency initiative in the housing sector was the Green Mortgage, a housing finance scheme developed by the Institute for the National Workers’ Housing Fund (INFONAVIT) to encourage energy efficiency measures for low-income households. This programme offered credits of up to USD 1 250 to developers that include energy-saving materials and technologies in housing projects. The Mexican National Housing Commission (CONAVI) provided grants and loan supplements to encourage low-income families to buy homes equipped with energy-efficient and renewable energy technologies. New housing that qualified for the Green Mortgage achieved combined annual electricity and gas savings of 3 500 to 4 600 kWh per home.1 The average payback period for consumers was estimated at 4.1 years. The Green Mortgage Programme mobilised nearly USD 1 billion in public subsidies and nearly USD 500 million in additional lending by mortgage providers for energy-efficient housing from 2009 to 2012. Over 900 000 Green Mortgage credits have been granted, benefiting over three million people. The programme has been registered under the clean development mechanism (CDM) and has sought approval for registration as a Nationally Appropriate Mitigation Action (NAMA). As of 2012, energy-efficient homes supported by the subsidy and loan programmes represented around 1% of the total housing stock, and the market share of new housing benefiting from the programme approached 20% (Point Carbon Advisory Services, 2010; Building and Social Housing Foundation, 2012; International Finance Corp., 2013).
Challenges The challenges that stand in the way of scaling up energy efficiency markets in Mexico are largely the same as for any other country: low consumer awareness, lack of implementation capacity, limited access to financing and market distortions. Energy price subsidies have been largely phased out, so this barrier is fading away. Other challenges, such as institutional bias, still remain. Large industrial complexes, such as Petróleos Mexicanos (PEMEX), sometimes appear to be more focused on expanding production than on investing in saving energy, thus crowding out investment in energy efficiency.2 Much of the energy savings potential in Mexico is associated with incorporating energy efficiency in infrastructure investment and durable goods, for example broadening use of ISO 500013 in industry, 1 Savings dependent on climatic zone. 2 The co-generation potential in PEMEX alone has been estimated at three times the company’s own electricity consumption. 3 ISO 50001 (ISO 50001:2011, Energy management systems – Requirements with guidance for use) is a specification created by the International Organization for Standardization (ISO) for an energy management system. The standard specifies the requirements for establishing, implementing, maintaining and improving an energy management system, whose purpose is to enable an organisation to follow a systematic approach in achieving continual improvement of energy performance, including energy efficiency.
© O
EC
D/IE
A, 2
013

COUNTRY CASE STUDIES: MEXICO
ENERGY EFFICIENCY MARKET REPORT 2013 193
enforcing building codes, phasing out older vehicles on the road, strengthening and improving public transport, and supporting municipalities in making energy-saving investments in street lighting and water pumping. A key challenge will be the ability to mobilise finance from national sources and from private sources (via public-private partnerships), and to simplify the regulations for procuring the services and participation of energy service companies (ESCOs). Multilateral development banks are also a potential source of financing. Another medium-term challenge is the need for a more robust energy efficiency product supply chain to deliver proven and reliable technologies (e.g. solar water heaters, advanced street lighting), and the need to develop standards for these products. Problems have been reported with manufacturers and importers introducing poor-quality devices into the marketplace. Prospects for energy efficiency market activity Institutional outlook
The December 2012 governmental transition in Mexico is expected to lead to many changes in Mexican energy efficiency policy. However, overall commitment to and support for energy efficiency in national policy is likely to remain high. The new government has quickly published a national energy strategy covering 2012 to 2027, which includes a commitment to improve energy efficiency in all sectors, as one of seven structural elements within the overall energy strategy (SENER, 2013).4 Efforts over the past two decades have produced strong institutional and technical capacity in industry and government. This will be central to scaling up energy efficiency efforts in the future. CONUEE and FIDE have demonstrated institutional leadership by implementing national energy efficiency programmes. Mexico also has proven relationships with multilateral development banks (World Bank, Inter-American Development Bank) and bilateral donors (Deutsche Gesellschaft für Internationale Zusammenarbeit [GIZ], the US Agency for International Development). Many development and energy efficiency experts consider Mexico to be a model for scaling up energy efficiency within the Latin America and Caribbean region.5 Carrying forward earlier successes and further developing energy efficiency markets in Mexico will require updating existing legal and programme frameworks. The PRONASE programme expired in 2012, and the 2008 legislation establishing the programme and its implementing framework (e.g. CONUEE) needs to be updated. SENER is now considering a redraft of this legislation. Government institutions, e.g. SENER, CONUEE, FIDE and CONAVI, will continue to play a central role in scaling up energy efficiency. Activity in the ESCO sector could expand or remain modest, depending on government procurement policy. Mexican state-owned enterprises, such as PEMEX, might increase their energy efficiency activity, perhaps in response to a new emphasis on increasing productivity throughout the Mexican economy. Co-generation remains a huge energy efficiency opportunity throughout the industrial sector, especially oil and gas. Commercial banks are not expected to play a major role unless a reconstituted PRONASE motivates them. 4 The seven structural objectives are: “(1) to increase the production of oil and natural gas, (2) to diversify energy sources, giving priority to increase the participation of non-fossil technologies, (3) to increase the efficiency levels of energy consumption in all sectors, (4) to reduce the environmental impact of the energy sector, (5) to operate in an efficient, reliable and safe energy infrastructure, (6) to strengthen and modernise the sector’s infrastructure and (7) to promote the development of the petrochemical industry”. 5 The views expressed in this chapter on the future of energy efficiency in Mexico are drawn from interviews with officials from government and multi-lateral development banks.
© O
EC
D/IE
A, 2
013
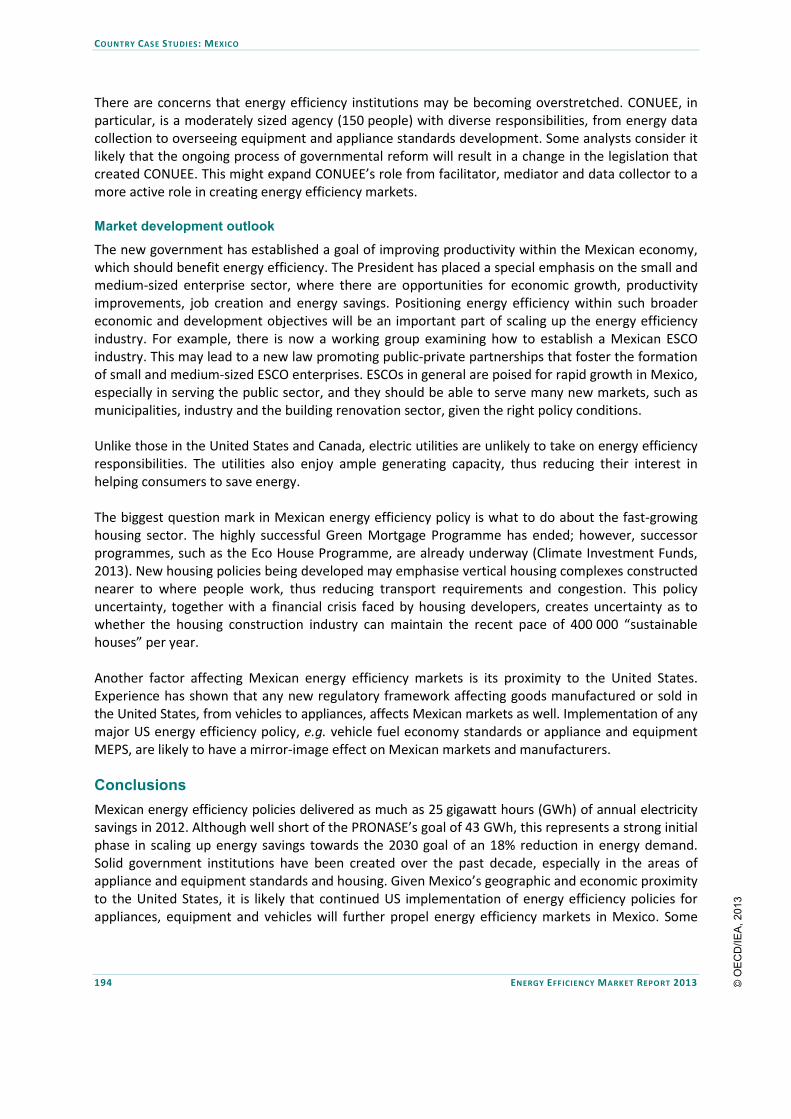
COUNTRY CASE STUDIES: MEXICO
194 ENERGY EFFICIENCY MARKET REPORT 2013
There are concerns that energy efficiency institutions may be becoming overstretched. CONUEE, in particular, is a moderately sized agency (150 people) with diverse responsibilities, from energy data collection to overseeing equipment and appliance standards development. Some analysts consider it likely that the ongoing process of governmental reform will result in a change in the legislation that created CONUEE. This might expand CONUEE’s role from facilitator, mediator and data collector to a more active role in creating energy efficiency markets. Market development outlook
The new government has established a goal of improving productivity within the Mexican economy, which should benefit energy efficiency. The President has placed a special emphasis on the small and medium-sized enterprise sector, where there are opportunities for economic growth, productivity improvements, job creation and energy savings. Positioning energy efficiency within such broader economic and development objectives will be an important part of scaling up the energy efficiency industry. For example, there is now a working group examining how to establish a Mexican ESCO industry. This may lead to a new law promoting public-private partnerships that foster the formation of small and medium-sized ESCO enterprises. ESCOs in general are poised for rapid growth in Mexico, especially in serving the public sector, and they should be able to serve many new markets, such as municipalities, industry and the building renovation sector, given the right policy conditions. Unlike those in the United States and Canada, electric utilities are unlikely to take on energy efficiency responsibilities. The utilities also enjoy ample generating capacity, thus reducing their interest in helping consumers to save energy. The biggest question mark in Mexican energy efficiency policy is what to do about the fast-growing housing sector. The highly successful Green Mortgage Programme has ended; however, successor programmes, such as the Eco House Programme, are already underway (Climate Investment Funds, 2013). New housing policies being developed may emphasise vertical housing complexes constructed nearer to where people work, thus reducing transport requirements and congestion. This policy uncertainty, together with a financial crisis faced by housing developers, creates uncertainty as to whether the housing construction industry can maintain the recent pace of 400 000 “sustainable houses” per year. Another factor affecting Mexican energy efficiency markets is its proximity to the United States. Experience has shown that any new regulatory framework affecting goods manufactured or sold in the United States, from vehicles to appliances, affects Mexican markets as well. Implementation of any major US energy efficiency policy, e.g. vehicle fuel economy standards or appliance and equipment MEPS, are likely to have a mirror-image effect on Mexican markets and manufacturers. Conclusions Mexican energy efficiency policies delivered as much as 25 gigawatt hours (GWh) of annual electricity savings in 2012. Although well short of the PRONASE’s goal of 43 GWh, this represents a strong initial phase in scaling up energy savings towards the 2030 goal of an 18% reduction in energy demand. Solid government institutions have been created over the past decade, especially in the areas of appliance and equipment standards and housing. Given Mexico’s geographic and economic proximity to the United States, it is likely that continued US implementation of energy efficiency policies for appliances, equipment and vehicles will further propel energy efficiency markets in Mexico. Some
© O
EC
D/IE
A, 2
013

COUNTRY CASE STUDIES: MEXICO
ENERGY EFFICIENCY MARKET REPORT 2013 195
energy efficiency policies will take time to develop, as new approaches for the housing and manufacturing sectors are still under development. Some energy efficiency markets – ESCOs and ratepayer-funded energy efficiency – will likely remain relatively underdeveloped. However, if energy efficiency policies can be demonstrated to serve the policy priorities of the new government, there is every reason to expect that Mexican energy efficiency markets will continue to grow in the coming years.
References APERC (Asia Pacific Economic Research Centre) (2012), Compendium of Energy Efficiency Policies of APEC Economies – Mexico, The Institute of Energy Economics - Japan (IEEJ), Tokyo. BSHF (Building and Social Housing Foundation) (2012), “Green Mortgage Programme – 2012 Award Winner”, World Habitat Awards, BSHF, Leicestershire. CIF (Climate Investment Funds) (2013), “Mexico Aims to Cut Home Energy Use with Green Loan Plan”, Climate Investment Funds, www.climateinvestmentfunds.org/cif/node/12540. CLASP (2013), Standards and Labelling Database: Mexico, CLASP, Washington DC, www.clasponline.org/Tools/Tools/SL_Search/. CONUEE (Comisión Nacional para el Uso Eficiente de la Energia) (2013), “Certificación”, (Certification), CONUEE, Mexico City, www.conae.gob.mx/wb/CONAE/CONA_256_certificacion. Davis, L. (2013), “Behavioral Response to an Appliance Replacement Program in Mexico”, Center for Effective Global Action’s fourth annual Evidence to Action Seminar, Berkeley City Club, Berkeley, 25 April. De Buen, O. and S. Segura, (2007), Energy Efficiency in North America: Evolution and Perspectives, World Energy Council (WEC), London. FIDE (2013), Luz Sustentable web site, www.luzsustentable.gob.mx/etapa2/home.php. IEA (International Energy Agency) (2010), Energy Efficiency Governance, IEA/OECD, Paris. IFC (International Finance Corporation) (2013), Green Housing – A 21st Century Solution: VINTE Homes, IFC, Mexico City. OECD (Organisation for Economic Co-operation and Development) (2013), “National Accounts: Final consumption expenditure of households”, OECD National Accounts statistics (database), www.oecd-ilibrary.org/statistics, accessed 15 May 2013. Point Carbon Global Advisory Services (2010), Supported NAMA Design Concept for Energy-Efficiency Measures in the Mexican Residential Building Sector, Point Carbon Global Advisory Services, Mexico City. SENER (Secretaría de Energía) (2012), “Luz sustenable concluyó satisfactoriamente y en tiempo récord, su segunda etapa”, 6 September press release, SENER, Mexico City. SENER (2013), Estrategia Nacional de Energía 2013-2027, SENER, Mexico City.
© O
EC
D/IE
A, 2
013

COUNTRY CASE STUDIES: NEW ZEALAND
196 ENERGY EFFICIENCY MARKET REPORT 2013
16. NEW ZEALAND
Energy profile and context New Zealand’s total primary energy supply (TPES) in 2012 was 18.6 million tonnes of oil-equivalent (Mtoe), an increase of 2% compared to 2011. This increase reversed the 1% drop in TPES seen between 2010 and 2011 and reflects the general upward trend between 2005 and 2011, a trend that persisted during the financial crisis (Figure 16.1). In comparison to TPES, total final consumption (TFC) has been relatively flat.
Figure 16.1 TPES and TFC, 2001-12, and energy supply by source, 2012
Note: unless otherwise indicated, all tables and figures in this chapter derive from International Energy Agency (IEA) data and analysis.
The contribution of renewable energy to New Zealand’s primary energy mix is 40% larger than that of oil, natural gas or coal (Figure 16.1). According to IEA statistics, in 2011 hydro and geothermal power made up 81% of renewable energy production, while biomass use in the wood and wood products industry contributed most of the difference. The biggest changes in primary energy sources since 2000 have been a 53% increase in renewable energy and a 36% reduction in natural gas, reflecting changes in domestic production of these resources. Supply of oil and oil products, which are predominantly imported, rose by 6.5% over the same period. In 2002, transport overtook industry as New Zealand’s largest source of final energy demand, accounting for a 36% share in 2011 (Figure 16.2). Between one-third and two-thirds of final energy use in the New Zealand economy is for processing and transport of primary products, but the share of TFC attributed to industry has fallen in seven out of the past ten years. While residential energy consumption has increased only slightly since 2000, the decadal trend has been dominated by the
0
2
4
6
8
10
12
14
16
18
20
Mto
e
TPES TFC Electricity consumption
Renewable38%
Coal and coal
products8%
Oil and oil products
33%
Natural gas21%
Energy efficiency measures offset 62% of the growth in residential energy demand between 2000 and 2011, leading to much slower demand growth than would otherwise have been expected. Government policies targeting home insulation and appliance efficiency are considered to have been the primary stimulus of market provision of efficiency improvements in the residential sector. The measurable additional benefits of these policies include positive health effects and upstream value chain activity.
© O
EC
D/IE
A, 2
013

COUNTRY CASE STUDIES: NEW ZEALAND
ENERGY EFFICIENCY MARKET REPORT 2013 197
shift of energy consumption from industry to transport. The greenhouse gas implications of this move from natural gas use in industry to oil use in transport has been largely offset by the use of renewable energy to supply the increased electricity demand from the services and residential sectors. As a result, carbon dioxide emissions per unit of primary energy in New Zealand decreased by 0.5% in the decade to 2010.
Figure 16.2 Share of TFC by sector, 2011, and TFC by sector and by energy source, 2001 and 2011
Note: “Other” includes biofuels plus heat from geothermal, solar, co-generation and district heating. Co-generation refers to the combined production of heat and power.
Figure 16.3 Changes in TFC, decomposed into structure, activity and efficiency effects
Note: IEA decomposition analysis calculates the relative impacts of three main factors that drive changes in TFC, using 1990 as a base year. The activity effect is a function of demand changes within a sector or sub-sector, measured as value-added, passenger-kilometres, tonne-kilometres or population. Structure effect is a function of changes in the relative shares of the industrial sub-sectors, transport modes or types of residential end-use. Efficiency effect is a function of changes in energy use per unit of activity within each of these sub-sectors, modes or end-uses. Further information on methodology can be found in Box 3.1.
Source: IEA indicators database.
Industry31%
Transport36%
Residential12%
Services9%
Agriculture, forestry and
fishing5%
Non-specified and non-
energy use7%
00.5
11.5
22.5
33.5
44.5
5
2001 2011 2001 2011 2001 2011 2001 2011
Industry Transport Commercial and public services
ResidentialM
toe
Coal/peat Oil Gas Electricity Other
-4%
-2%
0%
2%
4%
2000-05 2005-10 2008-09 2009-10
Aver
age
annu
al c
hang
e
TFC Activity effect Structure effect Efficiency effect
© O
EC
D/IE
A, 2
013

COUNTRY CASE STUDIES: NEW ZEALAND
198 ENERGY EFFICIENCY MARKET REPORT 2013
The overall increase in TFC in New Zealand has largely been driven by changes in the supply and demand for energy consistent with the country’s economic structure (Figure 16.3). This relates to changes in economic activity rather than structural or efficiency effects (indicated by the disaggregated intensity columns). The shifts between 2005 and 2010 can be explained by the impact of the financial crisis, as seen to the right of the chart. Efficiency and economic activity both decreased between 2008 and 2009, and, while economic activity rebounded in 2010, efficiency did not.1 This apparent drop in efficiency may be linked to the efficiency losses associated with lower capacity utilisation in the industrial sector following the economic crisis. The combination of rising gross domestic product (GDP) and strong structural change between 2005 and 2008 led to a fall of 14% in New Zealand’s aggregate energy intensity (TPES per unit of GDP) in the decade to 2011. This change was faster than the IEA average in the period before the financial crisis (Figure 16.4). In terms of this metric, New Zealand moved from being close to the World average to being closer to the IEA average, and largely stabilised at around 0.16 tonnes of oil-equivalent per USD in 2012. Figures 16.3 and 16.4 suggest that, without the financial crisis, efficiency would have had a much greater impact on actual energy use between 2005 and 2010 than it did between 1990 and 2005 and intensity would have met the IEA average by 2011.
Figure 16.4 Evolution of energy intensity as a function of GDP, 2001-12
Note: PPP = purchasing power parity; toe = tonnes of oil-equivalent.
Consistent with the above trends, since 2000 electricity use per unit of GDP has fallen, while electricity use per capita has remained relatively constant (Figure 16.5). The sector with the highest growth in electricity demand has been in the residential sector, which also stands out as an area where energy efficiency market and policy activity has been strongest.
1 According to the New Zealand government’s analysis of changes in energy use, energy efficiency had a positive effect on reducing TFC between 2000 and 2010 (MBIE, 2012). In their analysis, activity-led growth and fuel switching would have led to an increase of 80 petajoules (PJ) of energy demand between 2000 and 2010 had it not been for structural economic changes (worth a reduction of 39 PJ of energy demand) and energy efficiency improvements (worth a reduction of 23 PJ of energy demand). Structural changes were mainly in the industrial sector. Differences arise primarily from the different decomposition methodologies used.
0.12
0.14
0.16
0.18
0.20
0.22
toe
per t
hous
and
2005
USD
PPP
World
New Zealand
IEA member countries
© O
EC
D/IE
A, 2
013
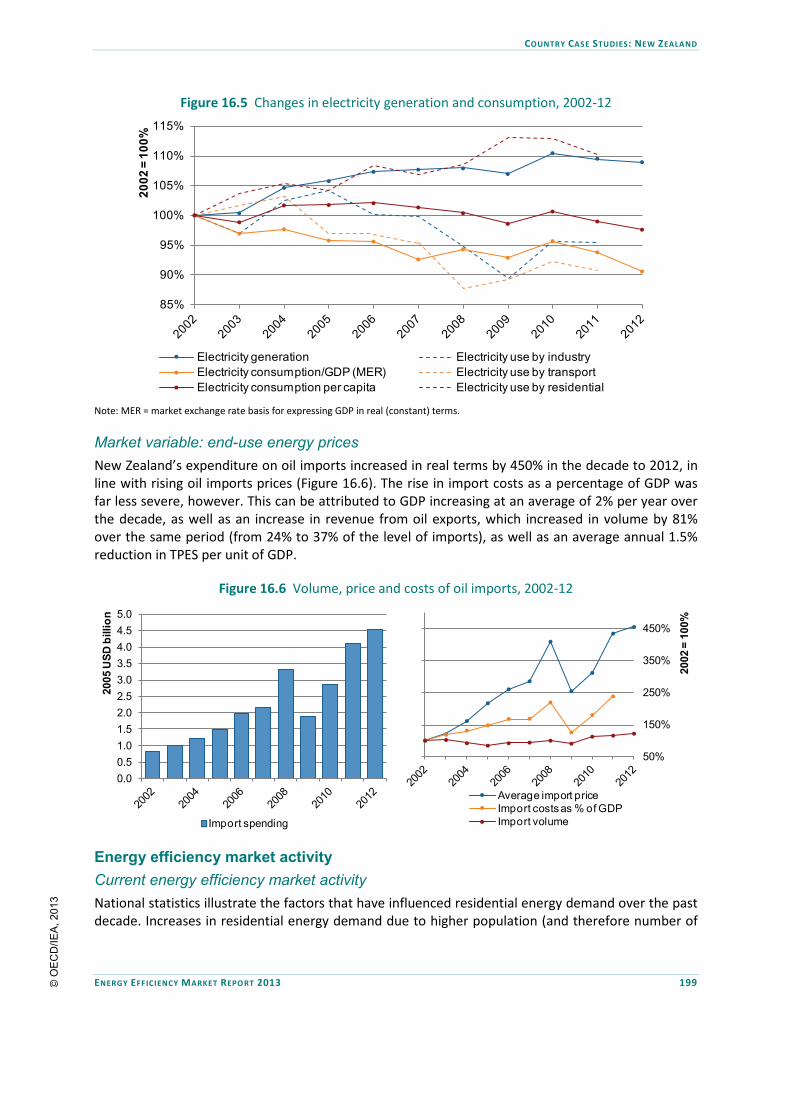
COUNTRY CASE STUDIES: NEW ZEALAND
ENERGY EFFICIENCY MARKET REPORT 2013 199
Figure 16.5 Changes in electricity generation and consumption, 2002-12
Note: MER = market exchange rate basis for expressing GDP in real (constant) terms.
Market variable: end-use energy prices New Zealand’s expenditure on oil imports increased in real terms by 450% in the decade to 2012, in line with rising oil imports prices (Figure 16.6). The rise in import costs as a percentage of GDP was far less severe, however. This can be attributed to GDP increasing at an average of 2% per year over the decade, as well as an increase in revenue from oil exports, which increased in volume by 81% over the same period (from 24% to 37% of the level of imports), as well as an average annual 1.5% reduction in TPES per unit of GDP.
Figure 16.6 Volume, price and costs of oil imports, 2002-12
Energy efficiency market activity Current energy efficiency market activity National statistics illustrate the factors that have influenced residential energy demand over the past decade. Increases in residential energy demand due to higher population (and therefore number of
85%
90%
95%
100%
105%
110%
115%20
02 =
100
%
Electricity generation Electricity use by industryElectricity consumption/GDP (MER) Electricity use by transportElectricity consumption per capita Electricity use by residential
0.00.51.01.52.02.53.03.54.04.55.0
2005
USD
bill
ion
Import spending
50%
150%
250%
350%
450%
2002
= 1
00%
Average import priceImport costs as % of GDPImport volume
© O
EC
D/IE
A, 2
013

COUNTRY CASE STUDIES: NEW ZEALAND
200 ENERGY EFFICIENCY MARKET REPORT 2013
households),2 lower occupancy (number of people per household) and larger household area per capita were to some extent offset by fuel switching and, above all, greater energy efficiency (Figure 16.7). The breakdown of the last three years of data shows that the financial crisis had some influence on the efficiency of energy use in the residential sector, but also that this was not a sustained trend and efficiency effects have subsequently grown again. Residential energy consumption grew by 7.6% between 2000 and 2011. Nevertheless, the avoided annual energy consumption due to efficiency was 1.9 PJ (46 000 toe or 530 gigawatt hours [GWh]) in 2011, equivalent to the annual output of one-quarter of all of New Zealand’s operating wind turbines. The residential sector has been a major focus of energy efficiency market activity in New Zealand, particularly insulation. In 2010, space heating accounted for around 30% of New Zealand’s residential energy use, and as a consequence was a target of government energy efficiency policy. The reduction in residential energy demand of 9.5 PJ (228 000 toe) between 2000 and 2011 that resulted from greater efficiency can largely be attributed to three energy efficiency policies, as described in Figure 16.7.
Figure 16.7 Changes in final residential energy consumption, decomposed into contributing factors
Notes: final consumption of energy in the residential sector is decomposed into the factors which affect it: population effect is an activity factor that represents the impact of population change; occupancy effect is an activity factor that represents the impact of changes in the number of persons per dwelling; dwelling size effect is a structural factor that represents the impact of changes in floor area per capita; fuel mix change effect is a structural factor that represents the impact of changes in the type of energy used for space heating; heating efficiency effect refers to the impact of changes in the intensity of energy use per floor area per capita, adjusted for climate variations using heating degree-days.
Source: MBIE and EECA, 2012.
2 The number of households increased by 31% between 1990 and 2011, and the total residential floor area grew by 60%.
-5%
-4%
-3%
-2%
-1%
0%
1%
2%
3%
4%
5%
6%
2000-05 2005-10 2008-09 2009-10 2010-11
Aver
age
annu
al c
hang
e
Fuel mix change effect Efficiency effect Dwelling size effectOccupancy effect Population effect Residential energy use
© O
EC
D/IE
A, 2
013

COUNTRY CASE STUDIES: NEW ZEALAND
ENERGY EFFICIENCY MARKET REPORT 2013 201
Appliances and equipment
Between 1990 and 2010, the proportion of household energy consumption used by domestic appliances grew from 230 000 toe to 394 000 toe in New Zealand, taking their share of residential energy demand from 18% to 26%. The main factor that has pushed up the total energy consumption of New Zealand’s appliances up is “other” appliances, which includes a range of gadgets and electronic equipment not dedicated to provision of traditional energy services (Figure 16.8). Energy consumption from this category in 2011 equated to 16% of all residential electricity consumption and 5% of New Zealand’s total electricity consumption.
Figure 16.8 Energy consumption by type of appliance
Note: ICT = information and communications technology; TWh = terawatt hour.
Source: IEA indicator database.
New Zealand’s appliance and equipment regulatory programme began in 2002. It has included product efficiency improvements through minimum efficiency performance standards (MEPS) and related actions to develop markets for the replacement of less efficient technologies with higher-efficiency systems, as well as voluntary schemes. In 2012 the programme was assessed to have delivered 1 108 GWh of avoided annual electricity demand, equivalent to 3% of electricity demand in 2011 and worth NZD 217 million.3 Avoided electricity demand has been estimated at 469 GWh (worth NZD 123 million) from white goods efficiency improvements, 270 GWh (worth NZD 70 million) from domestic refrigeration, and 481 GWh (worth NZD 105 million) from reverse-cycle heat pumps (EECA, 2013). Between 2000 and 2011, average per-unit energy consumption of refrigerators/freezers improved by 30% and televisions/home entertainment systems by 50% (Figure 16.9). As a result, energy consumption from large appliances remained relatively stable despite increases in stock. Without this increase in other appliances, total residential energy consumption would have increased by only 5% over the entire period (EECA, 2013). 3 Values of avoided energy consumption in this chapter are calculated using the average real residential and/or commercial electricity rates applying during the relevant year and expressed in 2012 NZD. Source: MBIE (2012b).
0
1
2
3
4
5
TWh
Refrigerator/freezer combinations DishwashersClothes washers Clothes dryersTelevision/home entertainment ICTOther appliances
© O
EC
D/IE
A, 2
013

COUNTRY CASE STUDIES: NEW ZEALAND
202 ENERGY EFFICIENCY MARKET REPORT 2013
Figure 16.9 Improvement in the average efficiency of appliance classes in New Zealand since 2000
Note: kWh = kilowatt hour.
Source: IEA indicators database.
The growth in efficient air source heat pumps is another indicator of the growing scale of the energy-efficient appliance market in New Zealand. Annual sales of heat pumps increased from 35 469 in 2004 to 118 732 in 2010, an increase of 234%. By 2012, ENERGY STAR heat pumps, only introduced in 2007, held a market share of 68% of total heat pump sales, one-quarter of New Zealand houses were recorded as using heat pumps for heating, up from just 4% in 2000, and almost half of new homes were installed with heat pumps (Build, 2008; EECA, 2013). Residential insulation retrofits The 1995 electricity market restructuring and the associated removal of subsidies to residential consumers led to greater price transparency. Between 2000 and 2007 the residential electricity price, adjusted for inflation, rose by 39% (Howden-Chapman et al., 2009). Despite three-quarters of New Zealand’s domestic heating being provided by electricity, the average per-dwelling electricity demand has barely changed over more than 30 years. In 2009 the government initiated the Warm Up New Zealand – Heat Smart (WUNZ-HS) programme. It is a large-scale home insulation scheme to improve efficiency and household comfort levels, and expanded an existing insulation programme. The programme was designed in response to recognition of identified benefits from insulation, and the absence of significant retrofitting of insulation in New Zealand. (Isaacs et al., 2010). Developed as a stimulus response in the face of the global economic crisis, it has contributed to large-scale investments in energy efficiency improvements (insulation and high-efficiency heaters) in dwellings constructed before 2000. WUNZ-HS invested NZD 330 million over the four-year period from 2009 to 2013 as scheduled (Grimes et al., 2012). The programme completed 178 259 insulation retrofits, as well as 60 635 clean heating installations. In addition to the government’s programme investment, over NZD 20 million in third-party funding and a further NZD 1.8 million in marketing and promotions from insulation and heating partners were spent in 2011 and 2012 (EECA, 2013).
0
100
200
300
400
500
600
700
Refrigerator/ freezer
combinations
Dishwashers Clothes washers
Clothes dryers Television/ home
entertainment
ICT
kWh/
year
2000 2011
© O
EC
D/IE
A, 2
013

COUNTRY CASE STUDIES: NEW ZEALAND
ENERGY EFFICIENCY MARKET REPORT 2013 203
Evaluation of the programme has shown it to deliver net benefits of NZD 4 for every NZD 1 invested (Table 16.1) (Grimes et al., 2012). This assessment accounts for health benefits and energy consumption reduction, and also takes into account installations that would have occurred without the programme. Transaction costs were assessed by including government programme costs and the programme’s deadweight cost of taxation. This analysis showed that a significant return on investment was derived from reduced health costs associated with improved indoor conditions.
Table 16.1 Cost-benefit analysis of New Zealand’s WUNZ-HS Programme
Discount rate 2.5% 4% 8% Low additionality (4% discount rate)
High additionality (4% discount rate)
Programme costs (NZD million) 339 332 317 205 460 Programme benefits (NZD million) 1 562 1 283 827 616 1 951 Net benefits (NZD million) 1 224 951 510 411 1 492
Source: adapted from Grimes et al., 2011.
A separate analysis assessed the upstream benefits to the markets supplying products and services to the programme (Table 16.2). This suggests that 5% to 10% of the net benefits accrue as producer surplus and sustain market activity.
Table 16.2 Estimated producer surplus of the WUNZ-HS Programme
Scenario estimate All insulation (NZD million) Clean heating (NZD million) Total (NZD million) Low 16-23 5 21-28 Central 25-53 10 44-62 High 52-80 16 66-94
Source: Denne and Bond-Smith, 2011.
Strategic marketing
Uptake of the above programmes by market participants and consumers has benefitted from a marketing programme that has created consumer interest in efficient appliances and insulation services. Each NZD 1 of government expenditure on ENERGY STAR advertising has been found to leverage NZD 3.5 in advertising expenditure by ENERGY STAR Partners4 on ENERGY STAR appliances. This multiplier effect is due to increased engagement by suppliers in the ENERGY STAR brand. Almost one-third of all white goods sold in New Zealand are now ENERGY STAR rated, while for air conditioners this figure is 68%. Market research identified a 22% increase in consumer predisposition to upgrading appliance efficiency, indicating increasing acceptance of energy-efficient appliances as the market norm by both suppliers and consumers (Hall and Turner, 2011). The insulation and heating programme sits within an overall national energy efficiency marketing strategy led by the Energy Efficiency and Conservation Authority’s (EECA) Energywise brand, with a three step approach: awareness raising, confidence building, and highlighting the ease with which energy efficiency can be done. Analysis of marketing impacts identifies growing levels of recall and awareness (from 61% in 2011 to 82% in 2012), high impact with low cost (53% of population reached for NZD 5.50 per head cost) and a high level of action taken (44% reporting actions undertaken as a 4 Partnerships with leading New Zealand distributors, manufacturers and retailers are key to the success of the ENERGY STAR programme in New Zealand. 38 manufacturers and distributors and 6 large retail chains have voluntarily committed to developing the ENERGY STAR brand.
© O
EC
D/IE
A, 2
013

COUNTRY CASE STUDIES: NEW ZEALAND
204 ENERGY EFFICIENCY MARKET REPORT 2013
result of marketing) (Hall and Turner, 2011; EECA, 2013). Importantly for the ongoing development of the market, while 200 000 homes have been insulated, a further 230 000 households have been identified as motivated and willing to insulate, and 60% of householders have an increased awareness of and interest in flexible funding options. Marketing efforts appear to be creating upstream value for service and equipment providers. Challenges The Warm Up New Zealand programme has not addressed window and wall thermal insulation, as it focuses on ceiling and floor insulation, draught-prevention (weatherisation) measures and clean heating. The returns to government, industry and consumers from comprehensive or deep retrofits are currently unknown, but the results from the partial retrofit schemes already in place suggest that evolving the programme into these additional areas could yield further returns. It took significant post-intervention research to quantify the main outcomes of these policies, so it is not surprising that consumers and policy makers initially struggle to understand the value of energy efficiency. While the analytical gap is closing, it is uncertain that this new information will be sufficient to motivate consumer demand to drive the residential energy efficiency market toward more comprehensive retrofits without an ongoing reliance on regulation or substantive grant funding. Prospects for energy efficiency market activity In 2013, the New Zealand government took the decision to reinvest operational savings from the WUNZ-HS programme into further retrofits, increasing the programme’s home retrofit target by 40 000 to 230 000 homes by September 2013 (EECA, 2013). A new insulation programme called Warm Up New Zealand: Healthy Homes has succeeded WUNZ-HS, and is targeted towards the retrofitting of 46 000 homes over three years for NZD 100 million in total. It will be targeted at low-income households occupied by people at risk from the health effects of cold, damp housing. Funding will be targeted at these groups through projects agreed with service providers and third-party funders. Homeowners will be able to receive the retrofits for free, except in cases where a contribution from landlords is required as part of the project’s criteria. Conclusions In 2007, per-capita residential heating intensity was 16 GJ per person or 100 megajoules per square metre per year5 – the lowest among all IEA member countries. According to the IEA indicator database, between 1990 and 2010, New Zealand experienced a 15% reduction in energy used for space heating, the largest reduction of all IEA member countries. This has been achieved despite the construction date of 60% of New Zealand’s 1.7 million dwellings predating insulation mandates, and indicates the success in stimulating market activity in the area of home insulation and efficient heating systems. The experience in New Zealand highlights the important complementary role of appliance efficiency in the residential sector. It also shows that complementing performance standards and financing schemes with marketing campaigns (as was done for housing retrofits) can deliver higher levels of market activity. There is also evidence from New Zealand of the benefits of ongoing and ex-post analysis of programmes. The latter in particular allows for analysis of the full range of activities and
5 Adjusted for constant heating degree-days.
© O
EC
D/IE
A, 2
013

COUNTRY CASE STUDIES: NEW ZEALAND
ENERGY EFFICIENCY MARKET REPORT 2013 205
complete evaluation of returns on energy efficiency investments, which may not be obvious or calculable before implementation of a programme. Programme evaluation also enables an ongoing learning process for government, industry and consumers. This can help them to better understand the implications of continual technological development and changes in consumer needs, and the corresponding advantages of adapting programmes to these shifts. References Build (2008), “Energy Efficiency”, Build Magazine, February/March, Branz, Porirua City, www.branz.co.nz/cms_display.php?sn=67&st=1&pg=3903. Denne, T. and S. Bond-Smith (2012), Impacts of the NZ Insulation Fund on Industry and Employment, Covec report prepared for Ministry of Economic Development, Wellington. EECA (Energy Efficiency and Conservation Authority) (2013), Annual Report 2011-2012, EECA, Wellington. Eliot, T., et al. (2012), Changes in Energy Use, New Zealand 1990-2011, Ministry of Business Innovation and Employment, Wellington. Grimes, A., et al. (2012), Cost Benefit Analysis of the Warm Up New Zealand Heat Smart Programme, Final report for the Ministry of Economic Development, Wellington. Howden-Chapman, P. et al. (2009), “Warm Homes: Drivers of the Demand for Heating in the Residential Sector in New Zealand”, Energy Policy, Vol. 37, Issue 9, Elsevier, Amsterdam, pp. 3387-3399. Isaacs, N. P., et al. (2010), Final Report on the Household Energy End-Use Project (HEEP), BRANZ study report 221, BRANZ ltd, Judgeford. MBIE (Ministry of Business, Innovation and Employment) and EECA (2012), Changes in Energy Use, New Zealand 1990-2011, MBIE and EECA, Wellington. MBIE (2012), Changes in Energy Use Data File, MBIE, Wellington. Hall D. and P. Turner (2011), Measuring ENERGY STAR®’s Value Proposition, Synovate Ltd., Nicosia.
© O
EC
D/IE
A, 2
013

COUNTRY CASE STUDIES: SOUTH AFRICA
206 ENERGY EFFICIENCY MARKET REPORT 2013
17. SOUTH AFRICA
Energy profile and context South Africa is an emerging economy whose growth has, in part, been driven by its energy-intensive resource extraction industries. Its total primary energy supply (TPES) and total final consumption (TFC) reached 141 million tonnes of oil-equivalent (Mtoe) and 71 Mtoe respectively in 2011 (approximately 20% of the African continent’s total energy supply). It relies heavily on coal and coal products for energy generation, and both production and use of energy have grown steadily since 2001 (Figure 17.1).
Figure 17.1 TPES and TFC, 2001-11, and energy supply by source, 2011
Note: unless otherwise indicated, all tables and figures in this chapter derive from International Energy Agency (IEA) data and analysis.
Figure 17.2 Share of TFC by sector, 2011, and TFC by sector and by energy source, 2001 and 2011
Note: “Other” includes biofuels plus heat from geothermal, solar, co-generation and district heating. Co-generation refers to the combined production of heat and power.
0
20
40
60
80
100
120
140
160
Mto
e
TPES TFC Electricity consumption
Nuclear2%Renewable
10%
Coal and coal
products70%
Oil and oil products
15%Natural gas
3%
Industry36%
Transport25%
Residential21%
Services6%
Agriculture, forestry and
fishing3%
Non-specified and non-
energy use9%
0
5
10
15
20
25
30
2001 2011 2001 2011 2001 2011 2001 2011
Industry Transport Commercial and public services
Residential
Mto
e
Coal/peat Oil Gas Electricity Other
Significant increases in energy demand and the challenge of ensuring reliable power supply have driven energy efficiency activities in South Africa. This chapter focuses on efficiency programmes and outcomes delivered by South Africa’s major electricity market players, as well as voluntary partnerships within industry and business.
© O
EC
D/IE
A, 2
013

COUNTRY CASE STUDIES: SOUTH AFRICA
ENERGY EFFICIENCY MARKET REPORT 2013 207
The industrial sector continues to dominate energy use in South Africa, and is a large consumer of electricity and coal, although energy consumption has increased across all sectors over the past decade (Figure 17.2). Electricity generation and consumption in the residential sector have both increased by approximately 20% since 2001, and industrial sector electricity consumption has increased by approximately 10% (Figure 17.3). Electricity use per capita increased up to 2010 and then dropped to below 2001 levels, while electricity use per unit of gross domestic product (GDP) has steadily declined over the past decade.
Figure 17.3 Changes in electricity generation and consumption, 2001-11
Note: MER = market exchange rate basis for expressing GDP in real (constant) terms.
Figure 17.4 Evolution of energy intensity as a function of GDP, 2001-11
Note: PPP = purchasing power parity.
As a top coal producer, South Africa meets most of its electricity need from its large coal deposits, with 94% of electricity produced from coal. Insufficient generation capacity has led to shortages and
70%
80%
90%
100%
110%
120%
130%
2001
= 1
00%
Electricity generation Electricity use by industryElectricity consumption/GDP (MER) Electricity use by residentialElectricity consumption per capita
0.16
0.18
0.20
0.22
0.24
0.26
0.28
0.30
0.32
0.34
toe
per t
hous
and
2005
USD
PPP
South Africa
World
© O
EC
D/IE
A, 2
013

COUNTRY CASE STUDIES: SOUTH AFRICA
208 ENERGY EFFICIENCY MARKET REPORT 2013
rolling blackouts in the past, and the system is expected to remain constrained for several years to come, although new generation capacity is being built and should improve the situation. Under projections that assume continued economic growth on a modest but stable path, South Africa will require an estimated 40 000 megawatts (MW) of new generation capacity by 2025 (tied to annual growth in GDP of around 3.6% or less) (IEA, 2012). South Africa’s energy use per unit of GDP has fluctuated significantly over the past decade and is currently on a downward trend (Figure 17.4). Energy intensity remains significantly higher than the world average; energy-intensive extractive industries play an important role in South Africa’s economy, notably mining, mineral processing and heavy manufacturing (Alessi, 2013). According to IEA statistics, energy use per capita has remained relatively steady since 2000, reaching 2.74 tonnes of oil-equivalent (toe) per capita in 2010, higher than the world average of 1.87. Market context: end-use energy prices Until recently, South African power costs have been historically low, with inexpensive and subsidised domestic fossil energy resources allowing large industrial and public sector customers to pay prices as low as ZAR 0.18 per kilowatt hour (kWh) (USD 0.024 per kWh) (IFC and AfDB, 2010). Abundant coal supplies have led to South Africa’s electricity still being among the cheapest in the world, despite a trend of annual tariff increases since 2009. The rate of increase has, however, steadily declined from 25% between 2009 and 2011, to 16% in 2012, and 8% from 2013 to 2014 (IEA, 2012). The development of the energy efficiency market has generally been slow, as payback periods on investment through avoided energy costs are longer in the face of inexpensive power prices. Energy efficiency market activity Market driver: energy efficiency policies and programmes In response to rapidly growing energy demand, the South African government began establishing policies for energy efficiency in 2004. Increasing demand for electricity, and therefore the need for greater generation and distribution capacity, have been predicted for more than a decade. While South Africa’s state-owned utility, Eskom, began remobilising long-decommissioned power stations, such measures were insufficient to prevent rolling blackouts in 2008. Eskom had to return to load shedding, and still faces suboptimal reserve margins. In light of this recent energy crisis, the South African government has recognised the importance of energy efficiency to deal effectively with potential electricity capacity shortages, environmental concerns and the rising price of energy sources. The latest overarching energy efficiency target for South Africa comes from the 2005 National Energy Efficiency Strategy, last reviewed in 2012. It maintains a target for energy efficiency improvement at 12% by 2015 for the country as a whole (below a business-as-usual projection from 2000 levels), measured as a 12% reduction in energy intensity (actual energy usage per ZAR of GDP). In addition, in 2005 more than 30 large companies, including from the iron, steel and cement industries, joined forces with the Department of Energy and Eskom by signing an Energy Efficiency Accord, committing to the goal of reducing energy use by between 12% and 15% below 2015 business-as-usual levels. The National Electricity Regulator of South Africa (NERSA) is responsible for ensuring sufficient generation capacity to meet electricity demand. In 2004, NERSA introduced the Regulatory Policy on
© O
EC
D/IE
A, 2
013

COUNTRY CASE STUDIES: SOUTH AFRICA
ENERGY EFFICIENCY MARKET REPORT 2013 209
Energy Efficiency and Demand-side Management for the South African Electricity Industry, which made energy efficiency and demand-side management (DSM) one of the licensing conditions for all electricity distributors. It also established a ratepayer-funded Energy Efficiency/DSM Fund administered by Eskom, defined the roles of energy service companies (ESCOs), and created an accreditation system for independent monitoring and verification (M&V) organisations. A continuing power shortage remains the most powerful impetus for energy efficiency in South Africa. Since 2005, the major utility Eskom’s DSM programmes have evolved to focus strongly on energy efficiency (Thorby, 2013). Major DSM initiatives included a national roll-out of compact fluorescent lamps (CFLs), development of an ESCO industry, and new initiatives on solar water heaters and light-emitting diode (LED) lamps. Between 2005 and 2011, these efforts reduced demand by 2 700 MW. A national roll-out of 52 million CFLs produced most of these demand reductions, and 1 million solar water heaters will be distributed during 2014. Current energy efficiency market activity The South African government has adopted a dual approach to encouraging energy efficiency: by implementing a series of energy efficiency measures with market actors, notably via its DSM programme; and in parallel, in recognition of the central role of industry in South Africa’s economy and its overall development aspirations, another programme focusing on the industry sector. DSM activities
The ratepayer-funded Energy Efficiency (EE)/DSM Fund has been a major source of support for energy efficiency. Since 2005, municipal distribution companies, factory and industrial managers, and third-party ESCOs can apply for subsidies of up to 50% to finance investments in energy efficiency and demand reduction. Funding grew rapidly over the 2007-09 period due to the acute power shortages that caused blackouts and hindered industry. The government initiated a review of international best practice for delivering energy efficiency. Based on this review, the Department of Energy in May 2010 endorsed the Standard Offer Programme (SOP), from among several new proposed models for disbursing energy efficiency and demand reduction incentives. One reason for developing the SOP was the difficulty in applying the ESCO model, which has been effective in the industrial sector in South Africa, to smaller projects in the commercial sector, which typically involve standard technologies such as lighting. For the period 2011-13, NERSA provided USD 670 million to Eskom’s Integrated Demand Management Unit (IDMU), with a target of reducing peak demand by 1 050 MW and saving 4 terawatt hours (TWh) of energy. IDMU operates several programmes targeting specific sectors, technologies and market actors (Figure 17.5). Under the ESCO model, operating since 2004, large energy-saving projects implemented by ESCOs or directly by asset owners have saved over 2.3 TWh and reduced demand by almost 800 MW. These are large (over 1 MW) individual projects, usually industrial, where Eskom makes payments of USD 0.06 per kWh to USD 0.09 per kWh for verified savings during peak demand periods from optimisation of processes, lighting, heating, ventilation and air conditioning, and other measures. These large projects require lengthy approval processes, complex contracts, and extensive M&V.
© O
EC
D/IE
A, 2
013

COUNTRY CASE STUDIES: SOUTH AFRICA
210 ENERGY EFFICIENCY MARKET REPORT 2013
Figure 17.5 Eskom’s programmes to engage different market segments
Source: Fortuin, 2013.
A new performance contracting model began in 2011, which allows Eskom to buy energy savings “in bulk” from developers with multiple large, capital-intensive projects (of at least 30 gigawatt hours [GWh] over three years). Eskom purchases verified savings at a price differentiated according to time of day (peak period savings earn USD 0.05 per kWh, while non-peak savings earn only a little over USD 0.01 per kWh). Although the individual measures may be small, the aggregate amounts are large, both because of project scale and targeting of industrial uses such as compressed air, motors, ventilation, lighting and solar water heating. Developers are paid on a performance basis over three years. To date, 16 projects will deliver 2 TWh of savings over three years. The programme is expected to deliver over 0.7 TWh per year of savings and 100 MW of demand reduction to the end of 2014. The new SOP is a streamlined vehicle for procuring energy savings meant for medium-sized and large businesses (e.g. hotel groups, commercial properties and light industry) that can show they have reduced their power consumption by means of technologies pre-approved by Eskom. Pre-approved energy-efficient products include lighting, hot water systems and process improvements. Customers can take part directly or partner with an ESCO or project developer to act on their behalf. Eskom offers USD 0.04 per kWh to USD 0.07 per kWh for peak period savings (6:00 to 22:00 weekdays) and USD 0.087 per kWh for savings from solar water heaters. As with the performance contracting model, savings are procured and payments made over a three-year period and performance is verified through an M&V protocol.1 Since April 2011, 61 projects under this new procurement model have delivered 148 GWh of energy savings and 31 MW of peak demand savings (Thorby, 2013).
1 There are other specific provisions. Rebates are based on a deemed savings method and installation subject to verification. The maximum rebate is USD 100 000 per single-metered entity, and a minimum 15% project cost share is required.
Performance Contracting (industrial)
Aggregated Standard Product
(industrial and commercial)
Residential Mass Rollout(residential)
ESCO Model(industrial and commercial)
Standard Offer(industrial and commercial)
Standard Product(commercial)
Funding modelsTargeted users
Size of projectsEnergy saved
50 kW
250 kW
1 MW
5 MW
> 3 GWh in three years
1 MW batches
1 MW batches
Technologies implemented
Custom or hybrid solution
Limited to specific products on published list
Limited to specific products on published list
Custom or hybrid solution
Limited to categories of technology on published list
Limited to specific products on published list
Payment mechanisms
Published rate of ZAR/kWh for demonstrated savings. Performance
payments over contract period.
Incentive value based on detailed financial and technical evaluation.
Payment during and on completion.
Published ZAR/kWh per technology category. Part payment after project
completion, part payment over contract period.
100%
70% 10% 10%10%
Published rate per technology. Full payment on commissioning.
100%
© O
EC
D/IE
A, 2
013
COUNTRY CASE STUDIES: SOUTH AFRICA
ENERGY EFFICIENCY MARKET REPORT 2013 211
Standardised energy-efficient products for mass-market distribution have proved useful for Eskom, especially in combating power shortages; these have been implemented across all the residential, commercial and industrial sectors, through the Residential Mass Rollout, Standard Product and Aggregated Standard Product programmes respectively. The commercial and industrial sector programmes offer rebates for the installation of a pre-approved list of energy-saving technologies. In response to recurrent power shortages, Eskom delivered over 50 million CFLs between 2004 and 2011, with savings of 3 TWh and 1 750 MW of peak demand reduction (Etzinger, 2013). The solar water heater incentive programme has led to the installation of 350 000 systems to date (Etzinger, 2013). In the commercial sector, the Standard Product programme delivered nearly 20 MW of demand savings and 87 GWh of energy savings in 2011 (Thorby, 2013). Industrial sector voluntary agreements
A major public-private co-operation programme has been underway for several years under the auspices of the National Business Initiative (NBI) and the Department of Energy. The Energy Efficiency Accord, originally launched in 2005, was been taken forward under a new title, the Energy Efficiency Leadership Network, which was itself launched in December 2011 when South Africa hosted the 17th annual Conference of the Parties (COP 17) of the United Nations Framework Convention on Climate Change. The Energy Efficiency Accord is estimated to have led to approximately ZAR 9.9 billion in investments by participating companies over six years (DME and NBI, 2008). Fifteen Energy Efficiency Accord companies reported a collective 2 405 GWh of electricity savings over the period 2005-07. While the Accord focused on heavy energy users (primarily industry and mining), the new Energy Efficiency Leadership Network has been broadened to include commercial and financial sector firms. This new network is an important collaboration between the government and 58 of South Africa’s leading companies, including mining, industrial, liquid fuel and commercial giants, who have agreed to show leadership by improving energy efficiency in their operations. Companies taking up energy efficiency improvement can now benefit from energy efficiency tax allowances provided for industrial projects under Section 12i of the Income Tax Act. ZAR 20 billion has been allocated over a period of five years, and 14 companies have already benefitted from this incentive. They can also benefit from the incentives offered by Eskom under the EE/DSM Fund. NBI and the Department of Energy hope to broaden participation in the network by signing up a number of key government departments, the South African Association of Local Government (SALGA) and state-owned enterprises. Challenges Energy efficiency policies in South Africa have faced various headwinds in delivering their intended outcomes. DSM energy efficiency efforts have faced unpredictable regulatory treatment, volatility in funding levels, and sometimes-overlapping programme offerings. There are also structural problems impeding the scaling up of DSM programmes. Municipally owned electricity retailers and distributors are reluctant to commit to energy savings policies, as they are reliant on electricity sales for municipal budgets. The ESCO industry also remains highly centralised; the largest industrial ESCO delivered almost half of total demand savings in the industrial sector (Etzinger, 2012).
© O
EC
D/IE
A, 2
013

COUNTRY CASE STUDIES: SOUTH AFRICA
212 ENERGY EFFICIENCY MARKET REPORT 2013
Prospects for energy efficiency market activity Uptake of the Standard Offer Programme and Standard Product Programme continues to grow, and the Eskom EE/DSM programme has delivered significant results over the past three years, realising audited savings of 589 MWh in 2012 (Etzinger, 2013). The ESCO industry is slowly moving down a path of reduced reliance on the EE/DSM Fund, and transitioning toward performance-based contracts and other commercial tools. The International Finance Corporation and African Development Bank (IFC and AfDB, 2010) estimate that funding requirements in South Africa for commercially viable energy efficiency investments over the 2010-14 period will reach well over USD 100 million, and see this as a driver for financial institutions to enter the energy efficiency market. Various funding flows are targeting the development of energy efficiency practices within South Africa’s well-developed financial sector. The Climate Investment Funds awarded USD 15 million towards supporting financial institution lending for energy efficiency investments in 2010. As part of a strategy to develop energy efficiency lending activity by commercial banks, the IFC has invested USD 69.87 million (mostly in the form of a loan) to expand Mercantile Bank’s lending to small and medium-sized enterprises (SMEs) and mid-market clients and to develop a portfolio of energy efficiency related business activity. It has also provided a loan of up to USD 10 million to Sasfin Bank, for capital to finance eligible SME energy efficiency lending. Successful implementation of these projects may have a broad impact among commercial banks and financial leasing companies in South Africa, leading to replication and scalability of energy efficiency lending, particularly to SMEs, and development of ESCOs as effective energy efficiency project aggregators. Conclusions As an emerging economy expected to generate GDP growth averaging 4% per year in the medium term (OECD, 2012), South Africa faces challenges in ensuring reliable energy supply in the face of growing demand for energy services. South Africa must also balance these important domestic concerns regarding reliable supply with its international pledges regarding climate change mitigation. Managing demand for energy, particularly since 2008, is an important strategy for facing these multiple challenges. As the main utility, Eskom has embarked on a massive capacity-building programme, with some coal-powered generation capacity to become available by the end of 2013 (800 MW at Medupi power station) and in 2015 (the first generator at Kusile power station). However, the full supply from both power stations will not come online before 2019. As such, continued pressure on electricity generation capacity, and planned increases in electricity tariffs (DoE, 2012), are expected to improve energy efficiency project economics, and further enhance DSM programme activity in the medium term. References Alessi, C. (2013), South Africa’s Economic Fault Lines, 17 May, Council on Foreign Relations, New York and Washington DC. DME (Department of Minerals and Energy) and NBI (National Business Initiative) (2008), Assessment of the Energy Efficiency Accord, Final Report, November, DME, Pretoria.
© O
EC
D/IE
A, 2
013

COUNTRY CASE STUDIES: SOUTH AFRICA
ENERGY EFFICIENCY MARKET REPORT 2013 213
DoE (South Africa Department of Energy) (2012), Draft Second National Energy Efficiency Strategy Review, Government Gazette/Staatskoerant, 29 November, No. 35920, Pretoria. Etzinger, D. (2011), “Energy Efficiency Financing Policy: South Africa’s Standard Offer Scheme”, presentation at the IEA-ADEME-DoE Energy Efficiency Day, Climate Change Response Expo, Durban, 7 December 2011. Etzinger, D. (2013), personal communication. Fortuin, W (2013), “Eskom’s Integrated Demand Management (IDM) Programme and Funding Options”, presentation at the 12th Annual Energy Efficiency Forum for Commercial Buildings Forum, City of Capetown, April. IEA (International Energy Agency) (2012), Energy Technology Perspectives 2012: Pathways to a Clean Energy System, OECD/IEA, Paris. IFC (International Finance Corporation) and AfDB (African Development Bank) (2010), CTF Private Sector Proposal – Energy Efficiency Component – South Africa Energy Efficiency Program, joint submission from IFC and AfDB, Washington DC and Abidjan. Organisation for Economic Co-operation and Development (OECD) (2012), OECD Economic Outlook, Volume 2012/1, OECD, Paris. Skinner, T. (2012), “An Overview of Energy Efficiency and Demand Side Management in South Africa”, presentation at The Road to Rio – World Bank/IFC Workshop on How to Choose Appropriate Incentives to Deploy Renewable Energy and Increase Energy Efficiency, Washington, DC, 30 January- 1 February. Thorby, J. (2013), “Strategies for the New Energy Reality”, presentation at Sustainability Week 2013, Johannesburg, 24-28 July.
© O
EC
D/IE
A, 2
013

COUNTRY CASE STUDIES: SOUTHEAST ASIAN COUNTRIES
214 ENERGY EFFICIENCY MARKET REPORT 2013
18. SOUTHEAST ASIAN COUNTRIES
Energy profile and context Across the six Southeast Asian countries assessed here, all but the Philippines have seen significant increases in both total primary energy supply (TPES) and total final consumption (TFC) over the past decade (Table 18.1). Increases in TPES range from 25% in Indonesia to just over 50% in Vietnam, and increases in TFC from 23% in Indonesia to 60% in Singapore. The table below also demonstrates the differences in energy use between the countries. The largest energy user, Indonesia, consumed nearly 45% more energy than the second largest energy user, Thailand. In addition, access to electricity varies widely between the countries, from nearly universal in Malaysia, Thailand and Singapore to only three-quarters of the population or less in the Philippines and Indonesia (IEA, 2013).
Table 18.1 Changes in energy supply and energy consumption
Country TPES (Mtoe) TFC (Mtoe)
2001 2011 2001 2011 Indonesia 159 209 124 158 Malaysia 49 76 31 45 Singapore 21 33 10 24 Thailand 74 119 52 88 Vietnam 31 61 27 51 Philippines 38 40 24 24
Notes: Mtoe = million tonnes of oil-equivalent. Unless otherwise indicated, all tables and figures in this chapter derive from International Energy Agency (IEA) data and analysis.
The overall trend in Southeast Asian countries has been one of improving energy intensity (measured as TPES per unit of gross domestic product [GDP] on a purchasing power parity basis) (Figure 18.1). There are also significant differences among countries, with Singapore and the Philippines in 2011 having intensity levels comparable with the European Union and Japan, though for very different reasons. As a small country, Singapore’s energy intensity has fluctuated over the past ten years: it increased significantly from 2007 to 2010, but declined slightly between 2010 and 2011. Indonesia experienced a reduction in energy intensity of approximately 20% over the decade. All countries, except the Philippines, have slowly increased their energy use per capita; however, other than in Malaysia and Singapore, per-capita energy use remains well below the world average.
Southeast Asia’s energy demand is projected to grow significantly faster than the world average over the next several decades. This presents challenges for the reliable provision of energy, and creates a strong case for sustainable growth supported by energy efficiency and supply expansion in tandem. The region has great potential for energy efficiency investment, driven by its current high level of energy intensity, its strong projected increase in energy consumption, and under-investment in energy infrastructure, leading to escalating energy supply constraints and energy access challenges. This chapter explores potential for energy savings and market activity, focusing on a sub-set of six Southeast Asian countries that represent 95% of the region’s total energy use: Indonesia, Malaysia, Thailand, the Philippines, Vietnam and Singapore.
© O
EC
D/IE
A, 2
013
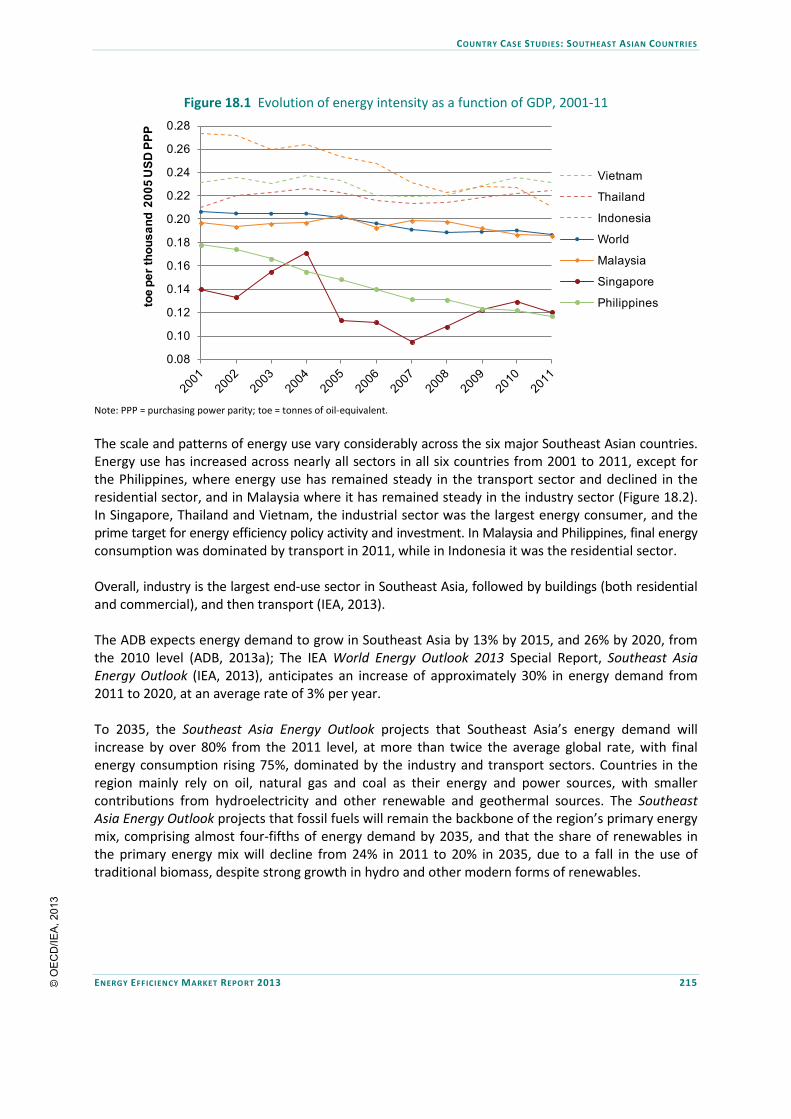
COUNTRY CASE STUDIES: SOUTHEAST ASIAN COUNTRIES
ENERGY EFFICIENCY MARKET REPORT 2013 215
Figure 18.1 Evolution of energy intensity as a function of GDP, 2001-11
Note: PPP = purchasing power parity; toe = tonnes of oil-equivalent.
The scale and patterns of energy use vary considerably across the six major Southeast Asian countries. Energy use has increased across nearly all sectors in all six countries from 2001 to 2011, except for the Philippines, where energy use has remained steady in the transport sector and declined in the residential sector, and in Malaysia where it has remained steady in the industry sector (Figure 18.2). In Singapore, Thailand and Vietnam, the industrial sector was the largest energy consumer, and the prime target for energy efficiency policy activity and investment. In Malaysia and Philippines, final energy consumption was dominated by transport in 2011, while in Indonesia it was the residential sector. Overall, industry is the largest end-use sector in Southeast Asia, followed by buildings (both residential and commercial), and then transport (IEA, 2013). The ADB expects energy demand to grow in Southeast Asia by 13% by 2015, and 26% by 2020, from the 2010 level (ADB, 2013a); The IEA World Energy Outlook 2013 Special Report, Southeast Asia Energy Outlook (IEA, 2013), anticipates an increase of approximately 30% in energy demand from 2011 to 2020, at an average rate of 3% per year. To 2035, the Southeast Asia Energy Outlook projects that Southeast Asia’s energy demand will increase by over 80% from the 2011 level, at more than twice the average global rate, with final energy consumption rising 75%, dominated by the industry and transport sectors. Countries in the region mainly rely on oil, natural gas and coal as their energy and power sources, with smaller contributions from hydroelectricity and other renewable and geothermal sources. The Southeast Asia Energy Outlook projects that fossil fuels will remain the backbone of the region’s primary energy mix, comprising almost four-fifths of energy demand by 2035, and that the share of renewables in the primary energy mix will decline from 24% in 2011 to 20% in 2035, due to a fall in the use of traditional biomass, despite strong growth in hydro and other modern forms of renewables.
0.08
0.10
0.12
0.14
0.16
0.18
0.20
0.22
0.24
0.26
0.28
toe
per t
hous
and
2005
USD
PPP
Vietnam
Thailand
Indonesia
World
Malaysia
Singapore
Philippines
© O
EC
D/IE
A, 2
013

COUNTRY CASE STUDIES: SOUTHEAST ASIAN COUNTRIES
216 ENERGY EFFICIENCY MARKET REPORT 2013
Figure 18.2 TFC by sector and by energy source, 2001-11
Note: “Other” includes biofuels plus heat from geothermal, solar, co-generation and district heating. Co-generation refers to the combined production of heat and power.
The Southeast Asia Energy Outlook finds that the region’s electricity demand has increased by more than a factor of four over the past two decades, though it remains low on a per-capita basis compared with that of IEA countries. Medium-term projections (Eurocham and Roland Berger, 2011)
0
10
20
30
40
50
60
2001 2011 2001 2011 2001 2011 2001 2011
Industry Transport Commercial and public services
Residential
Mto
e
Coal/peat Oil Gas Electricity Other
0
2
4
6
8
10
12
14
16
2001 2011 2001 2011 2001 2011 2001 2011
Industry Transport Commercial and public services
Residential
Mto
e
Coal/peat Oil Gas Electricity Other
0123456789
10
2001 2011 2001 2011 2001 2011 2001 2011
Industry Transport Commercial and public services
Residential
Mto
e
Coal/peat Oil Gas Electricity Other
0
1
2
3
4
5
6
7
8
9
2001 2011 2001 2011 2001 2011 2001 2011
Industry Transport Commercial and public services
Residential
Mto
e
Oil Gas Electricity
0
5
10
15
20
25
30
2001 2011 2001 2011 2001 2011 2001 2011
Industry Transport Commercial and public services
Residential
Mto
e
Coal/peat Oil Gas Electricity Other
02468
101214161820
2001 2011 2001 2011 2001 2011 2001 2011
Industry Transport Commercial and public services
Residential
Mto
e
Coal/peat Oil Gas Electricity Other
Indonesia Malaysia
Philippines Singapore
Thailand Vietnam
© O
EC
D/IE
A, 2
013

COUNTRY CASE STUDIES: SOUTHEAST ASIAN COUNTRIES
ENERGY EFFICIENCY MARKET REPORT 2013 217
foresee a 63% increase in TFC between 2010 and 2020 in Indonesia, Malaysia, Singapore, Thailand and Vietnam, with electricity consumption projected to increase at an even greater rate, by 88% over the same period. Longer-term, the ADB (2013a) estimates that total residential electricity consumption in Malaysia, Thailand and Vietnam will more than double to 2030 from the 2006 level, increasing by over 4% per year in the three countries to 2030. The IEA World Energy Outlook 2013 Special Report, Southeast Asia Energy Outlook projects that, driven by higher standards of living, increasing urbanisation and expanding electricity access, electricity demand increases by half by 2020 and to almost 1 900 TWh by 2035, at an annual average growth rate of 4.2%. To meet this growing demand, Southeast Asian countries are planning increased power plant investment. However, despite ambitious expansion plans, various assessments (ADB, 2013a; WB, 2010; Eurocham and Roland Berger, 2011) foresee rapid growth in energy consumption straining the provision of a reliable, continuous power supply. Given the prospects for coal expansion in the region, the choice of coal-fired generating technology will have significant implications for investments, efficiency, fuel inputs and costs. Of the coal-fired plants under construction in the region as of end-2012, 70% were based on subcritical designs. The IEA World Energy Outlook 2013 Special Report, Southeast Asia Energy Outlook, estimates that the average efficiency of coal-fired electricity generation in the region rises significantly over the outlook period, from 34% in 2011 to 39% in 2035, but still does not reach the level of Japan’s plants today. Energy efficiency measures are therefore an increasingly important strategy to control energy demand. Market variable: end-use energy prices Both the energy efficiency market and the potential for energy savings rely heavily on energy prices. This is the principal driver of the economic attractiveness of investment in energy efficiency.1 An important factor affecting energy prices in this region is price subsidies; with the exception of Singapore and the Philippines (which has the highest electricity prices of the Southeast Asia region) the four countries all subsidise fossil fuel and/or electricity prices (IEA, 2013). The IEA (2012) estimated that in 2011, fossil fuel subsidies accounted for 3.4% of GDP in Vietnam, 3% of GDP in Thailand, 2.5% and 2.6% of GDP in Indonesia and Malaysia respectively. In 2012, the Indonesian government spent USD 22 billion on fuel subsidies, 0.6% higher than spending on infrastructure investment; in Malaysia, 8.9% of the government budget was allocated to fuel subsidies in 2011. These subsidies not only impose a significant burden on public budgets, but lead to energy overuse and waste. Rising consumption and high energy prices have stimulated energy subsidy reform where the burden on public finances has become unsustainable. In 2013, the Indonesian parliament and administration agreed to allow fuel prices to rise, and a national social security system will be established in 2014 to enable the transfer of energy subsidies directly to poor families (ADB, 2013a). Indonesia increased gasoline and diesel prices in June 2013, accompanied by cash hand-outs to the poor (IEA, 2013). According to another study (Eurocham and Roland Berger, 2011), reforms to energy subsidy levels in five Southeast Asian countries increased the value of energy savings achieved in their energy efficiency market potential scenarios. The ADB (2013a) also highlights the need for energy pricing and market imperfections to be addressed to allow for energy efficiency investments. The IEA (2013) found that payback periods for efficiency investments are twice as long under current energy prices that include subsidies than they would be without energy subsidies.
1 ReEx Capital’s (ReEx Capital Asia, 2011) assessment demonstrates that payback periods for investments in industrial and commercial sectors vary directly with electricity rates, and that local energy costs are the principal factor affecting internal rates of return for investments.
© O
EC
D/IE
A, 2
013

COUNTRY CASE STUDIES: SOUTHEAST ASIAN COUNTRIES
218 ENERGY EFFICIENCY MARKET REPORT 2013
Energy efficiency market activity Market driver: energy efficiency policies and programmes All countries in Southeast Asia have established energy efficiency laws and overarching targets, contributing to the potential for energy efficiency investments. The primary energy efficiency and conservation goals for the major six energy-consuming nations (representing 95% of the region’s energy use) are provided in Table 18.2 below. Most also provide financial assistance for energy audits in industry and commercial buildings, while only three offer tax incentives and subsidies for efficiency activities (Malaysia, Singapore and Thailand). Within the region, Thailand and Singapore stand out as having a well-developed policy framework and regulatory environment.
Table 18.2 Selected energy efficiency and conservation goals
Country Goal Indonesia Reduce energy demand by 18% (86 Mtoe) compared to the BAU scenario in 2025.
Malaysia Reduce energy intensity (energy consumption per USD of GDP) 10% by 2030, below the BAU projected level.
Singapore 20% reduction in energy intensity in 2020, and 35% reduction in 2030, from the 2005 level. Thailand 25% reduction in energy intensity in 2030 compared with the 2005 level.
Vietnam Reduce TFC by 5% to 8% between 2010 and 2015 (11 Mtoe to 17 Mtoe); achieve a 10% reduction in energy intensity (energy use per tonne of output) in energy-intensive industries.
Philippines Reduce TFC 10% by 2030 compared to the BAU projected level.
Note: BAU = business-as-usual.
Sources: IEA, 2013; APEC, 2012; IEEJ, 2011; Thailand 20-year Energy Efficiency Development Plan 2011-2030; Philippines Department of Energy; Vietnam Ministry of Trade and Industry; EPU, 2010; ADB, 2013b.
Indonesia
The Indonesian government allocates an annual budget for energy conservation programmes and research and development. Indonesia has a 2025 energy-saving target of an 18% reduction in TFC compared with BAU levels, which will primarily be distributed between the industrial sector (6.9% reduction) and transport sector (7.4% reduction) (APEC, 2012). While the government currently does not provide low-interest loans for energy efficiency and conservation investments, it provides subsidies for programmes such as the Energy Conservation Partnership Programme for eligible households, which includes energy audits (USD 2 million in 2010 and 2011) and a lighting programme.
Table 18.3 Efficiency programmes, investments and outcomes in Indonesia
Programme Time period Investment Savings Indonesia Climate Change Trust Fund – Grant for Energy Conservation (implemented by the Ministry of Industry)
Since 2010
USD 2.2 million; implementing energy-saving opportunities in
35 steel sector and 15 pulp and paper facilities.
Contributing to 5% reduction in CO2
emissions by 2020 (below BAU).
Source: FS UNEP, 2012.
Singapore
Energy efficiency is a key part of national energy policy in Singapore. The 2009 Sustainable Singapore Blueprint set ten goals for 2030, including reducing energy intensity by 35% from 2005 levels. Its measures are also expected to reduce greenhouse gas (GHG) emissions to between 7% and 11% below 2020 BAU level. Singapore has also made a voluntary pledge under the United Nations
© O
EC
D/IE
A, 2
013

COUNTRY CASE STUDIES: SOUTHEAST ASIAN COUNTRIES
ENERGY EFFICIENCY MARKET REPORT 2013 219
Framework Convention on Climate Change (UNFCCC) to reduce its GHG emissions to a level 16% below the BAU level in 2020. Given its limited access to alternative energy, Singapore’s approach is primarily to improve energy efficiency in all sectors. The majority of Singapore’s energy efficiency policy and market activity is concentrated in the manufacturing sector, which is expected to account for 60% of total GHG emissions in 2020 (GoS, 2012).
Table 18.4 Efficiency programmes, investments and outcomes in Singapore
Programme Time period Investment Avoided energy Savings
Sustainable Energy Fund, to implement the Energy Efficient Singapore Strategy.
2010-15
2011: SGD 28 million
(USD 22 million) 2010-15:
SGD 50 million (USD 39 million)
- -
Energy Efficiency Improvement Assistance scheme; audits by ESCOs with recommended efficiency measures.
Since 2005 2011:
SGD 12.3 million (USD 9.6 million)
296 402 MWh annually, for participating
companies that implement the
measures.
SGD 23.4 million (USD 18.4 million)
annually for participating
companies that implement the
measures. Grant for Energy Efficient Technologies; co-funding for energy efficiency retrofits in industrial facilities.
Since 2008 2011:
SGD 46.8 million (USD 36.7 million)
3 535 MWh annually
(projects as of 2010)
SGD 705 531 (USD 553 888)
annually (projects as of 2010)
Green Mark Incentive Schemes; high-efficiency new-builds and renovations.
For existing buildings, since 2009,
funding to 2014.
For new buildings, 2006-09, funds still being disbursed.
Pilot Building Retrofit
Energy Efficiency Financing, 2011 to 2013 (or when 15 loans disbursed).
Design Prototype,
2010-14
SGD 100 million (USD 78.5 million)
SGD 20 million (USD 15.7 million)
Up to
SGD 75 million (USD 59 million)
in loans
SGD 5 million
(USD 3.9 million)
- -
Note: ESCO = energy service company.
Sources: APERC, 2012; Lye, 2011; GoS, 2012; NEA, 2010; BCA, 2013.
Philippines
In the Philippines, energy efficiency is a key contributor to various strategic goals under the Energy Plan 2012 to 2030, notably those of promoting energy security and expanding energy access. The annual government budget request for energy efficiency and conservation was PHP 25 million in 2013 (USD 580 000), nearly double the amount allocated in 2012 (PHP 12 million, or USD 280 000). The government has lined up several activities that will require PHP 48.69 billion (USD 1.1 billion) in capital investments for the period 2007-14. Of this amount, PHP 43.77 billion (USD 1 billion) will be sourced from private investors and the remaining
© O
EC
D/IE
A, 2
013

COUNTRY CASE STUDIES: SOUTHEAST ASIAN COUNTRIES
220 ENERGY EFFICIENCY MARKET REPORT 2013
PHP 4.92 billion (USD 114 million) will come from the government. Activities on energy labelling and energy efficiency standards will constitute the largest share at PHP 19.72 billion (USD 456 million), followed by the energy management programmes at PHP 16.1 billion (USD 372 million) (APERC, 2011, 2012).
Table 18.5 Efficiency programmes, investments and outcomes in the Philippines
Programme Time period Investment (USD million)
Avoided energy Savings
Government Energy Management Program (10% reduction in monthly electricity and transport consumption)
2005-11 Programme
still underway - 207 GWh
7.2 ML fuel PHP 1.8 billion
(USD 41 million)
Philippine Energy Efficiency Project (government buildings; industry and commercial buildings; communication)
2009-13 31 (ADB loan)
1.5 (ADB grant) 13.9 (government)
313 GWh (annually) 242 MWe
capacity savings
USD 28 million annually
Philippine Industrial Energy Efficiency Project (includes implementation of ISO 50001)
2011-17 20 (commercial banks)
4 (government) 3.2 (UNIDO-GEF grant)
6.1 PJ of steam 2.1 TWh -
Note: GWh = gigawatt hour; ML = million litres; MWe = megawatt electric; TWh = terawatt hour; UNIDO-GEF = United Nations Industrial Development Organization Global Environment Facility.
Sources: APERC, 2012; APERC, 2011; Reyes, 2013.
Thailand
Thailand has been a leader in designing and implementing energy efficiency in Southeast Asia since it passed its Demand-Side Management (DSM) Master Plan in 1991, and its Energy Conservation Promotion Act in 1992. Policies implemented include DSM programmes by the Electricity Generating Authority of Thailand (EGAT), focusing primarily on appliance and equipment efficiency, and a mix of mandatory standards, voluntary programmes and financial incentive programmes implemented by the Ministry of Energy.2
Table 18.6 Efficiency programmes, investments and outcomes in Thailand
Programme Time period Investment Avoided energy Savings
EGAT DSM programme (residential, commercial, industrial and SMEs)
2001- June 2013*
THB 2.6 billion (USD 83 million)
14.5 TWh of energy savings 2.4 GW of peak
demand reduction
-
Energy Efficiency Revolving Fund Since 2002
By 2010, USD 453 million
(both RE and EE) -
USD 154 million annually (average
payback of three years) Energy Efficiency Development Plan 2011-30
2011-15 USD 560 million - -
* EGAT’s demand-side management programme has run since 1995. Expenditure figures from 1995 to 2000 are not included here.
Note: EE = energy efficiency; GW = gigawatt; RE = renewable energy; SME = small and medium-sized enterprise.
Sources: APERC, 2012; APERC, 2011; Polycarp et al., 2013; IEA, 2011; EGAT, 2013.
2 The financial incentive programmes are implemented in co-operation with the Ministry of Finance and the Board of Investment.
© O
EC
D/IE
A, 2
013

COUNTRY CASE STUDIES: SOUTHEAST ASIAN COUNTRIES
ENERGY EFFICIENCY MARKET REPORT 2013 221
The government budget is approximately THB 4 billion (USD 130 million) per year. The Energy Conservation Promotion Fund has been established for implementing energy conservation programmes in both public and private sectors, with a 2011 budget allocation of THB 1.1 billion (USD 35 million). In addition, the Thai government operates revolving funds (soft loans), tax incentives and investment promotion via the Board of Investment, to encourage energy efficiency improvements. Vietnam
Under Vietnam’s 2012 to 2015 National Programme for Energy Efficiency and Conservation, specific energy intensity reduction targets have been established for the steel, cement and textile industries, requiring a nearly 11% reduction in energy consumption per tonne of steel from 2011 to 2015, and a 10% energy consumption reduction per tonne of cement and tonne of fibre. Various initiatives promoting energy management practices are included in the programme, which also requires implementation of and compliance with energy efficiency building standards from 2012 onwards. The total Energy Efficiency Plan (VNEEP) budget in 2007 and 2008 was nearly VND 70 billion (USD 4 million). A total of VND 30 billion (USD 1.8 million) of the state budget was allocated to 28 projects registered under VNEEP in 2007, while in 2008 VND 36 billion (USD 2.2 million) went to 48 projects, many of which were initiated in 2007. Of this funding, approximately VND 10 billion (USD 613 400) supported two energy-efficient lighting manufacturers, and VND 4 billion (USD 245 300) was invested in an energy efficiency laboratory for air conditioners and refrigerators (APERC, 2011).
Table 18.7 Efficiency programmes, investments and outcomes in Vietnam
Programme Time period Investment Avoided energy
National Programme for Energy Efficiency and Conservation
2011-15 (first phase began
in 2006)
VND 350 billion (USD 16.5 million) (central government)
VND 300 billion (USD 14.2 million) (local governments)
VND 180 billion (USD 8.5 million) (international sources)
VND 100 billion (USD 4.7 million) (other sources)
Spending to date: VND 150 billion (USD 8.7 million)
2006-11: energy consumption reduced 3.4%
(compared with BAU)
Sources: GoV, 2012; ESA, 2012.
Malaysia
Malaysia’s National Energy Efficiency Master Plan, through the 18 programmes proposed within it, is expected to reduce energy consumption by at least 10% below the BAU level projected for 2020. Originally set to be implemented in 2011, the plan was estimated to result in 85 TWh of savings over the 2011 to 2020 period, and to reduce annual electricity consumption by 19 TWh. This is expected to avoid the cost of installing 3.9 GW of new capacity, equivalent to over five average power plants in Malaysia. Implementing the plan will cost approximately MYR 255 million (USD 80 million) annually. Total public expenditure to 2020 is expected to reach MYR 2.3 billion (USD 722 million), leveraging MYR 12.1 billion (USD 3.8 billion) in private sector investment, and leading to energy cost savings of MYR 52 billion (USD 16.3 billion) over the lifetime of the energy efficiency initiatives (APEC, 2011). Delayed implementation of the plan, however, has affected investments and energy savings.
© O
EC
D/IE
A, 2
013

COUNTRY CASE STUDIES: SOUTHEAST ASIAN COUNTRIES
222 ENERGY EFFICIENCY MARKET REPORT 2013
Table 18.8 Efficiency programmes, investments and outcomes in Malaysia
Programme Time period Investment Avoided energy Savings
SAVE Program (rebates for 5-Star rated, high-efficiency appliances)
2011-12 - 127 GWh
MYR 32.04 million (USD 10 million)
annually. Up to
MYR 382.1 million (USD 120 million)
over lifetime of appliances.
Green Technology Financing Scheme (soft loans and loan guarantee for production and use of green technologies, including energy efficiency)
2010-12
MYR 1.5 billion (USD 470 million) from government;
MYR 2 billion (USD 628 million) from commercial banks.
By end 2012:
MYR 1.05 billion (USD 330 million) approved; MYR 300 million (USD 94 million) disbursed.
Total loan amount (public and
private) disbursed: MRY 814 million (USD 255 million).
- -
Sources: APERC, 2012; Green Prospects Asia, 2013.
Challenges As elsewhere, the six Southeast Asian countries examined face various challenges in ensuring that energy efficiency policy can be delivered cost-effectively, and can reliably produce anticipated results. The cost-effectiveness of energy efficiency investments varies in accordance with end-use energy prices, which are a sensitive issue; the political ability to address fossil fuel subsidies that artificially reduce energy prices is therefore uncertain. External funding sources are used in several of the countries to support and stimulate energy efficiency activity and investments, and any changes in these funding levels could negatively impact the market, which in some cases is not financially self-sustainable. Prospects for energy efficiency market activity IEA Efficient ASEAN Scenario: macroeconomic benefits of energy efficiency
The IEA’s World Energy Outlook 2013 Special Report, Southeast Asia Energy Outlook provides two scenarios, differentiated by their assumptions about government policies. The central scenario, the New Policies Scenario (NPS), incorporates policies and measures adopted as of mid-2013 and those that were announced, with a cautious view as to their full level of implementation. The Efficient ASEAN Scenario (EAS) assumes systematic adoption of best known technologies and practices to improve energy efficiency throughout Southeast Asia, as long as investments are economically viable and market barriers have been removed. Technologies implemented are subject to a stringent test of their economic viability, expressed as the acceptable payback period for each class of investment. Under the EAS, energy intensity declines at a rate of 2.5% per year rather than 1.9% per year under the NPS, and energy savings (primarily in power generation and industry) lead to a reduction in total primary energy supply of over 3% by 2020, and 13% by 2035 (Figure 18.3).
© O
EC
D/IE
A, 2
013

COUNTRY CASE STUDIES: SOUTHEAST ASIAN COUNTRIES
ENERGY EFFICIENCY MARKET REPORT 2013 223
Figure 18.3 Reduction in TPES in the Efficient ASEAN Scenario relative to the NPS
Note: “Other” includes nuclear, hydro, bioenergy and other renewables.
Source: IEA, 2013.
By 2035, region’s GDP increases by approximately USD 180 billion compared with the NPS; increases in value-added are strong in the transport sector, which receives significant additional investment through fuel economy standards and deployment of more efficient vehicles. The services sector also grows as a consequence of reduced energy bills which increase the share of income spent in other parts of the economy. The construction, iron and steel sectors experience greater demand for their goods and activities mainly through implementation of efficiency measures in the buildings. Under the EAS Scenario, additional cumulative investment of USD 330 billion in end-use sectors is more than offset by fuel cost savings of nearly USD 0.5 trillion by 2035; net economic savings in the power sector reach USD 200 billion. ADB: national targets as a driver of energy efficiency investment
The ADB (2013b) has estimated the potential for energy efficiency investment in Asia, based on the national clean energy and energy efficiency targets and policies in place in Southeast Asia. These regulations and targets will drive investment in, and deployment of, energy-efficient technologies and solutions. Using national clean energy targets and the average cost of energy efficiency from programmes in the United States, the ADB estimates that a total of USD 944 billion is needed for China, India and Southeast Asian countries to meet their national energy efficiency and GHG emission reduction targets by 2020. While the majority of this necessary investment (USD 865 billion) is in China, the investment required reaches nearly USD 11 billion across Southeast Asia (Table 18.9). An additional USD 15 billion will be needed to meet government targets in Southeast Asia by 2030. Indonesia makes up more than half of the region’s energy efficiency investment potential, at 57%, followed by Thailand and Malaysia, with 19% and 8%, respectively. As national policies evolve, they will further drive investment in the region. The ADB anticipates that investments associated with meeting national energy efficiency will help meet projected energy demand in 2030. Energy efficiency investments need only account for between
500
600
700
800
900
1 000
1 100
2011 2015 2020 2025 2030 2035
Mto
e Coal
Oil
Gas
Other
New Policies Scenario
EfficientASEAN Scenario
© O
EC
D/IE
A, 2
013

COUNTRY CASE STUDIES: SOUTHEAST ASIAN COUNTRIES
224 ENERGY EFFICIENCY MARKET REPORT 2013
1% and 8% of total energy sector investments to deliver an energy demand reduction of between 8% and 25% in 2030 (Figure 18.4). This demonstrates that energy efficiency investments are a least-cost solution to meeting growing energy demand across Southeast Asian countries.
Figure 18.4 Share of total projected primary energy demand to be met through energy efficiency in 2030
Notes: some percentages reflect rounding. Projected impacts of energy efficiency investments on meeting energy demand in 2030 assume national energy efficiency targets are met.
Source: ADB, 2013.
Table 18.9 Investment needed to meet national energy efficiency targets by 2020
Country Energy efficiency strategy/action plan Required investment (USD million)
Brunei Darussalam Attain 25% reduction of energy intensity from 2005 level by 2030 48 Cambodia Reduce final energy consumption by 10% in all sectors 126
Indonesia Decrease energy intensity by 1% annually and decrease energy-GDP elasticity to below 1% by 2025 6 019
Lao People’s Democratic Republic Reduce final energy consumption by 10% in all sectors 29
Malaysia Reduce final energy consumption in the industrial, commercial, and residential sectors by 10% from 2011 to 2030, and reduce final energy consumption of the transport sector by 2030
901
Myanmar Reduce primary energy consumption by 5% by 2020 and by 8% by 2030 compared to BAU, and improve EE in all end-uses by 16% by 2030 165
Philippines Reduce final energy consumption by 10% in all sectors from 2007 to 2014 601
Singapore Reduce energy intensity by 20% by 2020 and by 35% by 2030 from 2005 level; cap CO2 emissions from fuel combustion at 63 MtCO2 by 2020 97
Thailand Reduce the energy intensity of GDP by 25% by 2030 relative to BAU 2 006 Vietnam Reduce energy consumption by up to 5% by 2010 and up to 8% by 2015 649 Southeast Asia total 10 641 Southeast Asia, China, and India total 943 731
Notes: ktoe = thousand tonnes of oil-equivalent; MtCO2 = million tonnes of carbon dioxide; EE = energy efficiency. Required investment from ADB calculations based on national EE targets.
Source: ADB, 2013b.
0%
10%
20%
30%
40%
50%
60%
70%
80%
90%
100%
Brunei Indonesia Malaysia Philippines Thailand Vietnam
Share met by energy efficiency Total projected primary energy demand
© O
EC
D/IE
A, 2
013

COUNTRY CASE STUDIES: SOUTHEAST ASIAN COUNTRIES
ENERGY EFFICIENCY MARKET REPORT 2013 225
The World Bank: energy efficiency in Asia’s sustainable energy future
The World Bank (2010) foresees an average annual investment of approximately USD 10 billion from 2010 to 2030 in capital investment costs for power generation in Thailand, Malaysia, Indonesia, the Philippines and Vietnam. Moving to a more sustainable energy path would entail additional investments of approximately USD 27 billion a year over the same period, of which approximately USD 13 billion would be in energy efficiency. These additional investments would be rapidly recovered through energy savings, and under a sustainable energy scenario, Vietnam and Malaysia would be net energy exporters in 2030 rather than energy importers as under the baseline scenario. Electricity supply-side investments are typically two to three times higher than the cost of energy efficiency investments that avoid generation, transmission and distribution expansion. For the five Southeast Asian countries assessed by the World Bank, avoided thermal generation investments would save approximately USD 6 billion per year, while fuel cost savings from the additional energy efficiency investments would average USD 25 billion per year over the same period.3 Total financial costs to 2030, covering capital investments, operation and maintenance, and fuel costs, are lower with efficiency measures, averaging USD 108 billion annually in a sustainable energy scenario, rather than USD 117 billion under a BAU scenario. Under the scenarios assessed, a lower level of improvement in energy intensity requires more expensive investments, for example in low-carbon energy sources; energy efficiency is thus a more cost-effective way to meet energy demand needs sustainably. Estimate of aggregate electricity savings (2010 to 2020)
Two market reports published in 2011 (Eurocham and Roland Berger; ReEx Capital Asia) assessed a high potential for energy savings in Southeast Asian countries. Both studies examined the potentials in Indonesia, Malaysia, Singapore, Thailand and Vietnam, while the ReEx Capital Asia report also included the Philippines.
Figure 18.5 Annual electricity savings potential in Indonesia, Malaysia, Singapore, Thailand and Vietnam, 2010-20
Source: Roland Berger, 2011.
Based on estimations of energy consumption growth and energy savings, the Eurocham and Roland Berger study (2011) projects electricity savings potential in the period 2015-20, and the resulting cost savings. These are done using three scenarios, the Autonomous Progress Scenario, the Policy Intense Scenario and the Technology Intense Scenario. These vary according to:
3 Annual net present value (NPV) at a 10% discount rate.
© O
EC
D/IE
A, 2
013

COUNTRY CASE STUDIES: SOUTHEAST ASIAN COUNTRIES
226 ENERGY EFFICIENCY MARKET REPORT 2013
• the level of energy efficiency policy activity (implementation of existing policies; implementation of new policies; important policy programmes that lead to rapid diffusion of technological innovations); and
• the decrease in energy subsidies allowing for a higher increase in electricity prices.4 Under the Autonomous Progress Scenario, in which governments achieve their current savings goals and no changes in energy subsidy levels occur, electricity consumption in the five countries studied is projected to be 8% and 12% lower in 2015 and 2020 respectively. In nominal terms, these electricity savings amount to USD 6 billion and USD 15 billion respectively. Under the Policy Intense Scenario, which sees enhanced policy action and measures to reduce energy subsidies, consumption levels reduce by 12% and 20% respectively in 2015 and 2020, leading to saving potentials of USD 9 billion (or 86 TWh of electricity) and USD 26 billion (198 TWh) (Figure 18.5). Value of investments and savings in industrial and commercial sectors
An additional analysis, conducted by ReEx Capital Asia (2011), takes a different view by valuing in each of the six countries examined5 the market potential of energy efficiency investment opportunities across industry6 and commercial buildings. It quantifies the capital investment required for such projects (the investment potential), and the potential annual monetary savings resulting from these investments (the savings potential) in both the industrial and commercial sectors (Figure 18.6).
Figure 18.6 Investment (left) and savings (right) potential by country by sector
Source: ReEx Capital Asia, 2011.
The report also assesses profitability. In the industrial sector, the analysis examines the internal rate of return (IRR) for investments by country in specific sectors, based on investment potential and savings potential, using a five-year investment horizon. The lowest IRR was found in Vietnam, at just under 10%, while the highest was in Singapore at approximately 25%, followed by the Philippines. The principal factor affecting IRR is local energy costs: Singapore and the Philippines have the highest industrial sector electricity tariffs of the six countries, while Vietnam has the lowest. Payback periods are also analysed for investments in both industrial and commercial sectors. These estimate the number of years required for energy efficiency investments to break even, based on 4 Except for Singapore, where electricity prices are not subsidised. 5 Indonesia, Malaysia, Singapore, Thailand, the Philippines and Vietnam. 6 The analysis specifies that market potential assessments do not include co-generation, and may therefore undervalue market size in some countries.
0
200
400
600
800
1 000
USD
mill
ion
Industrial Commercial
0
50
100
150
200
250
USD
mill
ion
Industrial Commercial
© O
EC
D/IE
A, 2
013

COUNTRY CASE STUDIES: SOUTHEAST ASIAN COUNTRIES
ENERGY EFFICIENCY MARKET REPORT 2013 227
their energy savings potential. On average, energy efficiency projects across the six countries offer a payback period of 4.6 years (3.2 years for the industrial sector and 7.2 for the commercial sector). In the industrial sector, Singapore and the Philippines had the shortest payback periods at less than three years, although they were still less than four years for the other four countries. Across all categories of commercial building, Singapore and the Philippines yielded the fastest paybacks; their commercial electricity tariffs were once again highest among all six countries. Unlike in the industrial sector, Vietnam’s commercial electricity tariffs are the third highest amongst the countries, and payback periods were in fact the third lowest. In general, payback periods in the commercial sector were higher, and ranged from as low as 3.6 years for the hotel sector in Singapore, to as high as 18 years for the retail mall sector in Thailand. These results suggest that efforts to reform electricity pricing (including through reducing subsidies) would greatly affect payback periods and improve the economic attractiveness of investment in energy efficiency in the region. Prospects for energy efficiency market activity For all six Southeast Asian countries to meet their energy intensity or conservation targets, energy efficiency market activity will need to increase over the next five to eight years. This would lead to major investments and positive returns from lower expenditure on energy imports, plus increased energy exports for some (Eurocham and Roland Berger, 2011; World Bank, 2011). In all countries, the industrial sector will continue to be a major target for efficiency investment, given the sector’s predominance in national energy consumption which is expected to remain stable or expand over the next decade, with the buildings sector rising in importance as well. Indonesia’s Climate Change Trust Fund is a prime example of channelling funds to efficiency improvements. It has already contributed a significant share of its funds towards industrial energy conservation investments, and will begin its Transformation Phase over the next few years. This funding phase will move from grant funding to the establishment of a revenue-generating investment facility, potentially leveraging and stimulating significant private sector funds in energy efficiency. Energy efficiency investments are likely to be positively affected by fossil fuel subsidy reforms under way in a number of countries, notably in Indonesia, as well as in Malaysia, where the government intends to phase out certain vehicle fuel subsidies by 2015 (EPU, 2010). Conclusions In the six major Southeast Asian countries discussed above, energy efficiency will continue to play an important role in meeting a range of economic and social objectives, namely energy security, energy access and economic development, and increasingly climate change and other environmental degradation concerns. While distorted price signals, through fossil fuel subsidies, and a lack of access to financing, are barriers to energy efficiency activity, there are also major tailwinds that will ensure continued growth: long-term government targets, commitment to fossil fuel subsidy reform, and the pressure of delivering increased energy services to enable continued economic growth and development. Energy efficiency could play a useful role in delaying supply-side infrastructure investments requires in response to growth in energy demand.
© O
EC
D/IE
A, 2
013

COUNTRY CASE STUDIES: SOUTHEAST ASIAN COUNTRIES
228 ENERGY EFFICIENCY MARKET REPORT 2013
References ADB (Asian Development Bank) (2013a), Asian Development Outlook 2013: Asia’s Energy Challenge, ADB, Mandaluyong City. ADB (2013b), Same Energy, More Power: Accelerating Energy Efficiency in Asia, ADB, Mandaluyong City. APEC (Asia Pacific Economic Cooperation) (2011), Peer Review on Energy Efficiency in Malaysia, Final Draft Report for the APEC Energy Working Group, 11-12 May, APEC, Singapore. APEC (2012), Peer Review on Energy Efficiency in Indonesia, Final Draft Report for the APEC Energy Working Group, 13 February, APEC, Singapore. APERC (Asia Pacific Energy Research Centre) (2012), Compendium of Energy Efficiency Policies of APEC Economies, The Institute of Energy Economics – Japan (IEEJ), Tokyo. BCA (Building and Construction Authority) (2013), “Green Mark Incentive Schemes”, Building and Construction Authority, Technology Development website, pages updated February-May, government of Singapore, accessed 21 June 2013. EGAT (Electricity Generating Authority of Thailand) (2013), data provided by EGAT’s Demand Side Management Office, July. EPU (Economic Planning Unit) (2010), Tenth Malaysia Plan 2011-15, The Economic Planning Unit, Prime Minister’s Office, Putrajaya. ESA (Energy Saving Association) (2012), “Vietnam’s Energy Efficiency Programme to Cost $48m”, 9 February, The Energy Saving Association, London. EuroCham (European Chamber of Commerce Singapore) and Roland Berger (Roland Berger Strategy Consultants) (2011), Market Potential in Energy Efficiency in Southeast Asia: A Systematic Approach to Opportunities and Challenges in Southeast Asian Countries, Eurocham, Singapore. FS UNEP (Frankfurt School – UNEP Collaborating Centre for Climate & Sustainable Energy Finance) (2012), Case Study: The Indonesia Climate Change Trust Fund, Frankfurt School of Management and Finance, Frankfurt. GoV (government of Vietnam) (2012), “Decision on Approval of National Targeted Program on Energy Efficiency and Conservation Phase 2012-2015”, 2 October, Socialist Republic of Vietnam, Hanoi. Green Prospects Asia (2013), “RM 1.06 billion Approved to Date for Green Tech in Malaysia”, 6 January, Green Prospects Asia, Malaysia. IEA (International Energy Agency) (2011), Joint Public-Private Approaches for Energy Efficiency Finance: Policies to Scale-up Private Sector Investment, Policy Pathway Series, OECD/IEA, Paris. IEA (2012), World Energy Outlook 2012, OECD/IEA, Paris.
© O
EC
D/IE
A, 2
013
COUNTRY CASE STUDIES: SOUTHEAST ASIAN COUNTRIES
ENERGY EFFICIENCY MARKET REPORT 2013 229
IEA (2013), ASEAN Energy Outlook: World Energy Outlook 2013 Special Report, OECD/IEA, Paris. IEEJ (The Institute of Energy Economics - Japan) (2011), The 3rd ASEAN Energy Outlook, SOME-METI Programme on Energy Supply Security Planning in the ASEAN (ESSPA), IEEJ, Tokyo. Lye, L-H. (2011), “Recent Developments in Environmental Law and Policy in Singapore”, IUCN Academy of Environmental Law eJournal, Issue2011 (1), IUCN Academy of Environmental Law, Ottawa. National Climate Change Secretariat (NCCS) (2012), National Climate Change Strategy 2012, National Climate Change Secretariat, Prime Minister’s Office, Republic of Singapore. National Environment Agency Singapore (NEA) (2010), Factsheet: NEA’s Energy Efficiency Incentive Schemes, Ministry of the Environment and Water Resources, government of Singapore. Polycarp, C., L. Brown and X.F. Bertaux (2013), Mobilizing Climate Investment: Annex 1 – Energy Efficiency in Thailand, World Resources Institute, Washington DC. ReEx Capital Asia (2011), South East Asia Energy Efficiency Market Report 2011, ReEx Capital Asia Pte Ltd, Singapore. Reyes, E. (2013), “Energy Efficiency in the Philippines”, presentation to the 2nd EU-RP Meeting on Energy: Energy Efficiency to Boost Economic Growth, Makati City, 29 May.
© O
EC
D/IE
A, 2
013

COUNTRY CASE STUDIES: UNITED KINGDOM
230 ENERGY EFFICIENCY MARKET REPORT 2013
19. UNITED KINGDOM
Energy profile and context Total primary energy supply (TPES) and final energy consumption (TFC) have been steadily decreasing over the past ten years in the United Kingdom (Figure 19.1), particularly since 2005, falling to 188 million tonnes of oil-equivalent (Mtoe) of TPES and 126 Mtoe of TFC in 2011. TPES increased slightly in 2012, to reach 192 Mtoe. After rising in the first half of the last decade, electricity use has steadily declined since 2005. The United Kingdom’s energy supply is dominated by fossil fuels, primarily natural gas (38%) and oil products (32%).
Figure 19.1 TPES and TFC, 2001-12, and energy supply by source, 2012
Notes: unless otherwise indicated, all tables and figures in this chapter derive from International Energy Agency (IEA) data and analysis. Data for 2012 are estimates.
Between 2001 and 2011, the transport sector emerged as the largest energy-consuming sector, overtaking the residential sector. However, consumption declined across all sectors over this period, particularly in industry (Figure 19.2). The residential sector is the largest gas consumer in the United Kingdom, exposing it to international price fluctuations, and the sector’s electricity use remains higher than that of the industrial sector (Figure 19.3). TFC in the United Kingdom decreased by almost 9% between 2000 and 2010, with energy efficiency playing a major role. Without energy efficiency improvements since 2000, it has been estimated that energy consumption would have been 21% higher 2010 (Figure 19.4). The buildings sector, including households and services, accounted for over three-quarters of the savings.
0
50
100
150
200
250
Mto
e
TPES TFC Electricity consumption
Nuclear10% Renewable
4%
Coal and coal
products20%
Oil and oil products
31%
Natural gas35%
In the United Kingdom, legally binding carbon budgets that go beyond EU-designated greenhouse gas reduction targets, along with concerns over rising energy bills, are strong drivers for efficiency investment. This is particularly the case in the residential buildings sector, where energy supplier obligations have created an active energy efficiency market which is expected to expand further in the medium term. Development and mainstreaming of energy efficiency finance is probable over the next five years, in part depending on successful implementation and market uptake of the new Green Deal financing instrument.
© O
EC
D/IE
A, 2
013

COUNTRY CASE STUDIES: UNITED KINGDOM
ENERGY EFFICIENCY MARKET REPORT 2013 231
Figure 19.2 Share of TFC by sector, 2011, and TFC by sector and by energy source, 2001 and 2011
Note: “Other” includes biofuels plus heat from geothermal, solar, co-generation and district heating. Co-generation refers to the combined production of heat and power.
Figure 19.3 Changes in electricity generation and consumption, 2002-12
Note: MER = market exchange rate basis for expressing gross domestic product (GDP) in real (constant) terms.
The reduction in TFC over the past decade was impacted primarily by energy efficiency improvements, despite the strong impact of the economic recession seen in 2008-09 (Figure 19.5). In 2009-10, TFC bounced back somewhat from the steep decline of the previous year, along with economic activity. A slight decrease in efficiency in 2009 was insufficient to affect the positive impact efficiency improvements had on decreasing TFC over 2005-10. The United Kingdom’s primary energy supply per unit of GDP has been declining rapidly since 2000, and is lower than both the IEA and European Union (EU) average (Figure 19.6). IEA statistics also indicate that the United Kingdom’s energy consumption per head of population, at 3 tonnes of oil-equivalent per capita, is below the IEA average of 4.5.
Industry21%
Transport32%
Residential28%
Services11%
Agriculture, forestry and
fishing1%
Non-specified and non-
energy use7%
05
101520253035404550
2001 2011 2001 2011 2001 2011 2001 2011
Industry Transport Commercial and public services
Residential
Mto
e
Coal/peat Oil Gas Electricity Other
75%
80%
85%
90%
95%
100%
105%
110%
115%
2001
= 1
00%
Electricity generation Electricity use by industryElectricity consumption/GDP (MER) Electricity use by residentialElectricity consumption per capita
© O
EC
D/IE
A, 2
013

COUNTRY CASE STUDIES: UNITED KINGDOM
232 ENERGY EFFICIENCY MARKET REPORT 2013
Figure 19.4 Overall avoided energy use from improvements in energy efficiency, 2000-10
Notes: EJ = exajoules. Estimated energy use is calculated on the basis of how much energy would have been required to deliver the actual levels of activity reported each year for all sub-sectors had 2000 levels of energy use per unit of output persisted. It should be noted that this chart shows a ten-year snapshot of a decomposition analysis performed with 1990 as the base year. Due to the nature of decomposition analyses, actual energy use may not add up to total final consumption for the same countries as published in IEA balances. “Other” includes biofuels plus heat from geothermal, solar, co-generation and district heating. Co-generation refers to the combined production of heat and power.
Source: IEA indicators database.
Figure 19.5 Changes in TFC, decomposed into structure, activity and efficiency effects
Note: IEA decomposition analysis calculates the relative impacts of three main factors that drive changes in TFC, using 1990 as a base year. The activity effect is a function of demand changes within a sector or sub-sector, measured as value-added, passenger-kilometres, tonne-kilometres or population. Structure effect is a function of changes in the relative shares of the industrial sub-sectors, transport modes or types of residential end-use. Efficiency effect is a function of changes in energy use per unit of activity within each of these sub-sectors, modes or end-uses. Further information on methodology can be found in Box 3.1. Source: IEA indicators database.
0
20
40
60
80
100
120
140
160
0
1
2
3
4
5
6
7
Mto
eEJ
Electricity Oil GasCoal Other Avoided energy use
TFC
Hypothetical energy use had there been no energy efficiency improvements
-8%
-6%
-4%
-2%
0%
2%
4%
2000-05 2005-10 2008-09 2009-10
Aver
age
annu
al c
hang
e
TFC Activity effect Structure effect Intensity effect
© O
EC
D/IE
A, 2
013

COUNTRY CASE STUDIES: UNITED KINGDOM
ENERGY EFFICIENCY MARKET REPORT 2013 233
Figure 19.6 Evolution of energy intensity as a function of GDP, 2001-12
Note: PPP = purchasing power parity; toe = tonne of oil equivalent. Data for 2012 are estimates.
The United Kingdom is increasingly dependent on fossil fuel imports, and is becoming more exposed to risks from the interplay of rising global demand, limitations on production and price volatility. UK production of oil and gas has fallen from 134% of national demand in 2000 to 76% of demand in 2010; published projections show a further fall to 52% in 2020 (DECC, 2012c). Increasing prices since 2002 have led to an increasing share of UK GDP being spent on oil imports (Figure 19.7).
Figure 19.7 Volume, price and costs of oil imports, 2002-12
Market variable: end-use energy prices The average electricity and gas bill for a typical household in the United Kingdom increased in nominal terms from around GBP 610 in 2004 to GBP 970 in 2011 (CCC, 2013). It is projected to increase to GBP 1 331 (DECC, 2013a) or GBP 1 195 (CCC, 2013) in 2020. These projections assume successful delivery of improvements in energy efficiency, without which energy bills are expected to rise at an even faster rate. Energy as a component of household expenditure, which has increased sharply since 2003 (Figure 19.8), is likely to continue to increase.
0.08
0.10
0.12
0.14
0.16
0.18
0.20
0.22
toe
per t
hous
and
2005
USD
PPP
World
IEA member countries
European Union
United Kingdom
0
5
10
15
20
25
30
35
40
2005
USD
bill
ion
Import spending
50%
150%
250%
350%
450%
2002
= 1
00%
Average import priceImport costs as % of GDPImport volume
© O
EC
D/IE
A, 2
013

COUNTRY CASE STUDIES: UNITED KINGDOM
234 ENERGY EFFICIENCY MARKET REPORT 2013
Figure 19.8 Proportion of household expenditure on energy
Note: excludes fuels used for transport.
Source: OECD, 2013.
Energy efficiency market activity Market supply: potential for energy savings The UK Second National Energy Efficiency Action Plan (DECC, 2011a) foresees the United Kingdom achieving energy savings of 207 terawatt hours (TWh) or 17.8 Mtoe in 2016 as a result of policies implemented between 2007 and 2010. This represents a 14% reduction against its baseline target level, well beyond the 9% reduction aimed for under the EU Energy Services Directive.1 The household sector is expected to deliver the largest supply of avoided energy, contributing 61% of total expected savings by 2016, with private and public sector savings expected to contribute 21%, and transport 18% of the total. From 2012 to 2020, the UK government estimates that socially cost-effective investments in energy efficiency (assessed using an energy efficiency marginal abatement cost curve analysis) could yield nearly 17 Mtoe in energy savings (DECC, 2012a). These potentials correspond within broader factors that may lower energy demand in the medium term, including other environmental and energy policies, energy price increases and economic growth (DECC, 2012b). Market driver: energy efficiency policies and programmes Over the next five-year period, the United Kingdom’s second (2013-17) and third (2018-22) carbon budgets will form the basis for a range of policy activity leading to investment in energy efficiency. Policies stimulating energy efficiency are strongly driven by climate policy objectives: under current policies, 33% of greenhouse gas (GHG) emissions savings in 2020 will be delivered through energy efficiency measures (DECC, 2012a). The United Kingdom has also set its 2020 indicative national energy efficiency target under the EU Energy Efficiency Directive (EED) at 129.2 Mtoe of final energy consumption on a net calorific basis, amounting to an 18% reduction or 28.5 Mtoe of avoided energy from the United Kingdom’s 2007 business-as-usual projection.
1 The target is set at 9% below the average final energy consumption over 2001-05.
1.5%
2.0%
2.5%
3.0%
3.5%
4.0%
4.5%Pr
opor
tion
of h
ouse
hold
exp
endi
ture
© O
EC
D/IE
A, 2
013

COUNTRY CASE STUDIES: UNITED KINGDOM
ENERGY EFFICIENCY MARKET REPORT 2013 235
Buildings represented 37% of UK GHG emissions in 2012, and are therefore an important target area for meeting carbon budgets (CCC, 2013b). Investments stimulated by policies are expected to capture much of the estimated cost-effective energy savings potential in some sectors, notably residential buildings and vehicles (Table 19.1).
Table 19.1 Energy-saving potentials and energy savings from policy, 2020 (Mtoe)
Sector and principal policies Technical potential
Cost-effective potential
Projected savings*
Residential CERT (20% extension and uplift), CESP, Green Deal, ECO, Smart Meters, 2010 Building Regulations, Zero Carbon Homes, Warm Front
8 4.8 4.7
Commercial and public Green Deal, 2010 Building Regulations, CRC, Salix, SME Loans, Non-domestic Smart Meters
2.4 2.3 1.8
Industry Green Deal, CRC, 2010 Building Regulations, SME Loans, Carbon Price Floor (indirect)
3.6 3.6 0.51
Transport EU new-car CO2 regulation (2015 and 2020 targets), tyres for HGVs, complementary measures for cars and HGVs, hybrid buses, rail electrification, potential EU van regulation, behavioural measures
5.7 2.8 4.4
Products Ecodesign Directive implementation Tranches 1 and 2 3.3 3.3 2.8
Total 23 16.9 14.4
* Savings from policies implemented before 2009 and that will continue to deliver savings through to 2020 are not included here. Notably in the industrial sector, this includes the EU emissions trading system, and legacy savings from existing Climate Change Agreements (estimated to deliver 3.3 Mtoe of savings over 2012-20).
Note: CERT = Carbon Emissions Reduction Target; CESP = Community Energy Saving Programme; CRC = Carbon Reduction Commitment Energy Efficiency Scheme; ECO = Energy Companies Obligation; HGV = heavy goods vehicle; SME = small and medium-sized enterprise.
Source: UK DECC, 2012a.
The UK government aims for energy efficiency to become a mainstream market activity, and places an emphasis on market-based policies, which has in turn shaped the design of energy efficiency delivery structures. These mechanisms are often focused on stimulating private actors to make cost-effective investments, and include energy supplier obligation schemes and newly established financing structures. Energy efficiency is also seen by government as an important social policy tool for tackling fuel poverty.2 Implementation of two new policies in 2013 is expected to further stimulate energy efficiency market activity, namely the Green Deal and ECO. The Green Deal is a novel financing mechanism for residential and commercial premises, as well as a framework for delivering energy efficiency-related advisory, assurance and accreditation services. The Green Deal aims to overcome the barriers related to finance for initial investment, and to address the long payback periods for more expensive, deep refurbishment investments. It does this by providing loans for energy efficiency investments, which are then repaid through a charge attached to a property’s electricity meter. Loan repayments are calculated so as to remain lower than the expected energy savings on an average bill; this principle is known as the Green Deal “Golden Rule”. Building energy performance certificates (EPCs) are the main conduit for communicating information on any Green Deal plan attached to a given property.3 Since April 2012, 2 Fuel poverty is defined as when a household needs to spend more than 10% of its income for adequate heating and other energy needs. 3 As part of EU Energy Performance of Buildings Directive implementation, all buildings in the United Kingdom require an EPC on sale or rental, which rates a building’s energy performance on a scale of A to G (with A being the most efficient).
© O
EC
D/IE
A, 2
013

COUNTRY CASE STUDIES: UNITED KINGDOM
236 ENERGY EFFICIENCY MARKET REPORT 2013
EPCs directly list recommended measures to improve energy efficiency, the associated costs and energy savings, and whether the measures qualify for Green Deal financing. ECO, which replaces two previous supplier obligation schemes,4 places three obligations on energy suppliers: • a Carbon Saving obligation; • a Carbon Saving Communities obligation; and • an Affordable Warmth obligation. These can be met by installing measures to reduce carbon emissions or energy bills in the residential sector. To meet the obligations, suppliers will promote and subsidise measures, as under the previous CERT scheme. However, ECO’s scope and coverage is more limited as it is targeted at low-income households, and, under the Carbon Saving obligation, hard-to-treat homes where efficiency measures cannot fully meet the “Golden Rule”. The Green Deal and ECO can be combined to support the financing of measures. Implementation of minimum energy performance standards in the private rental property market from 2018 will also have an impact on the energy efficiency market. Regulations passed under the 2011 Energy Act will make it illegal to rent private commercial or residential properties below a minimum energy performance level, likely to be an E energy performance rating. Compliance with this requirement will be assessed according to two criteria: either the property will need to be brought up to the minimum energy performance level (for example, achieve an E rating), or all measures eligible for Green Deal financing need to be installed. Current energy efficiency market activity On the basis of the United Kingdom’s energy profile and context, and the assessment of significant potential for energy savings in its economy, the buildings sector (and particularly the residential sub-sector) is a target for energy efficiency investment. A significant market has been created through a series of energy supplier obligation schemes over the past decade. CERT, which ran from 2008 until 2012, led to the provision of free and subsidised insulation, lighting and other energy efficiency measures by energy suppliers. Suppliers invested approximately GBP 1.8 billion over 2011 and 2012 to meet their targets (expressed in CO2 emissions reductions). CESP, which ran from 2009 to 2012, specifically targeted low-income communities and whole-house retrofits. The market for energy efficiency measures in the residential sector was estimated at GBP 8.25 billion in 2007, and has been positively affected by energy supplier obligation programmes (DECC, 2012c). Under CERT, all six obligated energy suppliers developed a variety of ways to fulfil their obligations and established partnerships with a wide range of organisations to deliver measures, in response to the flexible design of the policy. This included a range of market actors, such as local authorities, insulation installers, managing agents, registered social landlords and retail stores (e.g. for direct sales of self-installed loft insulation). Energy suppliers also offered measures directly to households, and partnered with various brands on delivery of efficient electronics and white goods. Most market activity delivered under CERT occurred in the building insulation sector, especially cost-effective loft and cavity wall insulation (Table 19.2). Typically, energy suppliers set a price per tonne of carbon saved, with the efficiency measures provided through contracts with delivery agents. 4 The Carbon Emission Reduction Target (CERT) and Community Energy Savings Programme (CESP).
© O
EC
D/IE
A, 2
013

COUNTRY CASE STUDIES: UNITED KINGDOM
ENERGY EFFICIENCY MARKET REPORT 2013 237
However, the insulation market became somewhat dependent on energy supplier demand for services, and rule changes or suppliers nearing their targets led to strong fluctuations in the insulation market. The costs of cavity and wall insulation decreased with CERT, reflecting lower industry costs, economies of scale and a competitive market. In addition, CERT was preceded by the Energy Efficiency Commitment (EEC), an energy supplier obligation scheme which ran from 2002 to 2008, and also contributed to developing the market for delivery of energy efficiency services in the residential sector (DECC, 2011b; 2012a).
Table 19.2 Scope and market activity under CERT and CESP
CERT 2008-12 CESP 2009-12
Obligation coverage Six major gas and electricity suppliers. Six energy suppliers and four
independent electricity generators.
Target 293 MtCO2, of which 73.4 MtCO2 from professionally installed insulation.
19.25 MtCO2: 16.63 MtCO2 for suppliers; 2.62 MtCO2
for generators (following trading).
Delivered reductions
296.9 MtCO2; 75.1 MtCO2 from professionally installed insulation. 66% of savings from insulation; 17% from lighting;
17% from other measures.
16.31 MtCO2 (85% of target): 15.37 MtCO2 by suppliers; 0.94 MtCO2
by generators.
Number of measures
Loft insulations: 3.9 million professional; self-installed in 2.8 million homes; 2.6 million cavity wall insulations;
58 916 solid wall insulations; 304 million CFLs distributed;
108 516 central heating system installations; 55 000 energy efficiency products
and appliances distributed; 3.0 million real-time displays installed.
491 community schemes; 75 255 solid wall insulations;
60 016 new heating systems and controls; 42 898 replacement boilers;
23 503 loft insulations; 21 779 glazing measures.
Nearly 60% of dwellings received two or more measures.
Activity area Households: 40% of savings to be met in Priority Group. Low-income communities.
Investments GBP 5.5 billion (estimate).
Notes: CFL = compact fluorescent lamp; MtCO2 = million tonnes of CO2.
Sources: Ofgem, 2013a, 2013b; DECC, 2010, 2011b.
The level of market activity under the Green Deal and ECO is currently limited; both mechanisms have only been in place since January 2013. Statistics released in August (DECC, 2013c) indicate that only one Green Deal plan was underway by the end of July 2013; 132 were being finalised and 286 plans had been requested by customers. Provisional data for the ECO programme indicated that close to 150 000 measures were installed up to the end of June, split relatively equally among the three obligation types. Close to half of the measures were for loft insulation, with a third for cavity wall insulation and most of the remainder for boiler replacement. This is a significant drop from the number of loft and cavity insulations installed in 2012, which saw a high level of activity as energy companies sought to meet their final year targets under the CEST and CERT; there were 140 000 cavity wall insulations in the first three months of 2012 alone (CCC, 2013b). Reductions in loft and cavity insulations have led to loss of capacity in the insulation industry (Harvey, 2013). Challenges Driving investment in energy efficiency using policy measures presents various challenges, including uncertainty on how market actors will respond. In the United Kingdom, the Green Deal represents a
© O
EC
D/IE
A, 2
013

COUNTRY CASE STUDIES: UNITED KINGDOM
238 ENERGY EFFICIENCY MARKET REPORT 2013
significant shift from the previous supplier obligation scheme which delivered energy savings. Given it is early in the programme’s implementation and uptake to date has been very low, there is uncertainty surrounding the extent to which the financing mechanism will be used, and the impacts it will have on various market actors as well as on the real estate market. As such, investment in and delivery of avoided energy may fall below anticipated levels, as well as below the levels considered necessary to meet UK carbon budgets (CCC, 2013b). Incomplete policy implementation may also limit the potential for energy efficiency market activity expected through the private rental sector regulations. The requirements will apply to buildings with EPCs, thereby limiting the number of properties affected; currently, approximately 40% of residential buildings and 35% of commercial buildings have EPCs. Prospects for energy efficiency market activity The household sector will continue to be a key energy efficiency market, in line with new developments affecting investments in this sector. The capital cost of the technical potential for energy efficiency improvements in residential buildings is estimated at GBP 58 billion in 2013, of which low-cost insulation measures comprise GBP 2.2 billion (DECC, 2012c). Green Deal financing and supplier obligations
Implementation of Green Deal financing and ECO will be major factors affecting energy efficiency investments and market activity. An overview of expected investments and outcomes is outlined in Table 19.3 below. The Green Deal is primarily a financing mechanism designed to facilitate demand for energy efficiency investments. However, given its novelty, market prospects are inherently uncertain. Investments will be driven by various market factors and sentiment, and the extent to which households might use Green Deal financing remains unknown. The move from CERT to the Green Deal, where similar measures are financed through loans rather than provided for free or highly subsidised, has led to a steep, and expected, drop in efficiency investments. There is also concern that current interest rates for Green Deal financing, at close to 7%, are too high to be attractive compared with other forms of finance (CCC, 2013b). It is unclear whether this represents an actual barrier to uptake, as other forms of finance, such as mortgages or unsecured loans, may be difficult to access or unsuitable for certain borrowers (for example tenants) (BNEF, 2013). Efficiency investment is expected to recover in the medium term. It may also shift toward more difficult and expensive insulation measures, such as solid wall insulation, where investment payback periods tend to be longer than the average occupation length of property. Passing on the repayments and benefits to subsequent property owners or occupiers is thus a means to drive the initial investment. Besides a positive impact on the insulation market, the Green Deal is expected to stimulate activity in accreditation and assessment services. A new financing structure has also emerged, the Green Deal Finance Company (GDFC), allowing Green Deal providers to raise capital from investors to fund Green Deal investments.5
5 The GDFC currently has GBP 244 million available, of which GBP 69 million are committed funding from 16 GDFC members (including energy suppliers, installers and the UK Department of Energy and Climate Change [DECC]). Additional borrowing capacity is available through DECC (GBP 50 million) and the UK Green Investment Bank (GBP 125 million). The GDFC is also negotiating additional borrowing capacity through the European Investment Bank (GDFC, 2013).
© O
EC
D/IE
A, 2
013

COUNTRY CASE STUDIES: UNITED KINGDOM
ENERGY EFFICIENCY MARKET REPORT 2013 239
Table 19.3 Scope and expected market activity under the Green Deal and ECO
Green Deal Energy Companies Obligation (ECO) (2013-15)
Target n/a
27.8 MtCO2 (2013-15) 20.9 MtCO2 Carbon Saving obligation
6.8 MtCO2 Carbon Saving Communities (at least one to target rural households)
Affordable Warmth: GBP 4.2 billion reduction in lifetime notional space and heating costs
Measures
45 eligible measures, each with energy savings estimates,
covering space heating and cooling, building fabric, water heating and microgeneration
improvements
Carbon Savings: hard-to-treat cavity and solid wall insulation measures; subset of cavity wall insulations
unlikely to meet Golden Rule Carbon Saving Communities: all insulation measures
Affordable Warmth: heating and insulation to low-income private housing
Activity area Households Businesses Households
Energy company investment n/a
Carbon Saving: ∼ GBP 760 million/year Carbon Saving Communities: ∼ GBP 190 million/year
Affordable Warmth: ∼ GBP 350 million/year
Private investment
GBP 1.1 to GBP 1.3 billion cumulatively by 2015
GBP 2.3 to GBP 2.7 billion cumulatively by 2018
-
Employment impacts 65 000 insulation and construction jobs by 2015 -
Non-residential bill savings GBP 700 million in 2020 -
Household energy savings value GBP 1.49 billion/year to 2020
Estimated comfort and air quality benefits GBP 48 million/year to 2020
Energy savings 1.47 Mtoe in 2020
Note: n/a = not applicable.
Source: DECC, 2012c.
Private rental sector
The Energy Act 2011 enables government regulation designed to ensure the take-up of cost-effective energy efficiency improvements in the private rented sector. The private rental property market saw a very low level of energy efficiency activity under CERT, and actions have been taken to address market failures particular to this sector. Approximately 18% of residential buildings and 51% of commercial buildings are subject to private rental (DECC, 2013b). From April 2016, tenants will be allowed to request energy efficiency improvements, where financial support is available such as the Green Deal. In the residential sector, these improvements cannot be refused by a landlord if considered “reasonable”. Furthermore, from April 2018, the private rental standards will take effect. It is estimated that approximately 20% of properties in both the domestic and commercial building market segments are likely to fall below an E rating (GVA, 2012; DECC, 2013b). The private rental sector regulations are therefore expected to lead to increased investment in energy efficiency retrofits and medium-term growth in this market. The market impacts of the standards are likely to be
© O
EC
D/IE
A, 2
013

COUNTRY CASE STUDIES: UNITED KINGDOM
240 ENERGY EFFICIENCY MARKET REPORT 2013
stronger in the residential sector, in part because they will first apply to buildings for which leases are being renewed, and for those with EPCs. The domestic building sector has both shorter rental periods (an average of 22 months, as opposed to several years in the commercial sector), and a greater share of residential buildings have EPCs. The National Landlord Association is actively encouraging residential landlords to make use of the Green Deal, as private landlords are seeking to demonstrate their ability to self-regulate energy efficiency improvements ahead of the legal requirement. In the commercial building sector, large owners are beginning to assess the value of their building stock, and integrate the private rental standard in their investment plans and asset renewal programmes (DECC, 2013b). Other market development prospects
Various policy interventions and market forces look set to drive energy efficiency market activity in the United Kingdom. Notable measures include the following: • The requirement that all new buildings from 2016 onwards be “zero carbon”. This requirement
will involve an energy efficiency standard, on-site low and zero carbon energy, and a set of “allowable solutions” to meet the zero carbon standard. The latter remain undefined, but could be a form of carbon offset investment, including in energy efficiency and renewable energy measures (UK GBC, 2013; Zero Carbon Hub, 2012).
• The UK Green Investment Bank’s investments in energy efficiency: beyond contributing to the Green Deal Finance Company, the Green Investment Bank (GIB) provides financing solutions to commercial and industrial sector energy efficiency investment programmes. The GIB engages directly in transactions over GBP 30 million, and has committed GBP 100 million to two fund managers to support the market for smaller transactions (GIB, 2013).
• Proposals for a capacity market as part of Electricity Market Reform enabled under the 2012 Energy Bill, which may hold its first auction in 2014,6 would allow demand-side measures to compete against new supply in auctions for delivery of electricity capacity. Projects that deliver permanent reductions in electricity demand may also be able to participate in the capacity market (DECC, 2013d).
Conclusions As with other EU member states, energy efficiency activity in the United Kingdom is partly framed within broader EU-level directives and climate mitigation objectives. However, efficiency investments are further driven by specific domestic carbon policies and an emphasis on market-based solutions, generally applied through supplier obligations and new financing mechanisms for efficiency investments in the residential sector. The role of efficiency in limiting energy bill increases is also an important driver for continued activity in this area. Energy supplier obligation schemes to date have successfully spurred investment and development of the energy efficiency market, particularly building insulation. The Green Deal may lead to more economically sustainable efficiency investments, while the ECO may begin bringing down the costs of more expensive efficiency interventions. These two market-based measures, combined with new obligations in the property rental market from 2018 onwards, are expected to drive growth in the residential energy efficiency market in the medium term.
6 Subject to legislation and state aid clearance.
© O
EC
D/IE
A, 2
013

COUNTRY CASE STUDIES: UNITED KINGDOM
ENERGY EFFICIENCY MARKET REPORT 2013 241
References BNEF (Bloomberg New Energy Finance) (2013), 2013 Energy Efficiency Market Outlook, Bloomberg Finance L.P., London. BPF (British Property Federation) (2013), A British Property Federation Guide to Energy Efficiency and the Private Rented Sector, British Property Federation, London. CCC (Committee on Climate Change) (2013a), Energy Prices and Bills – Impacts of Meeting Carbon Budgets, CCC, London. CCC (2013b), “Chapter 3 – Progress in Reducing Emissions from Buildings”, in Meeting Carbon Budgets – 2013 Progress Report to Parliament, CCC, London. DECC (Department of Energy and Climate Change) (2010), Extending the Carbon Emissions Reduction Target to December 2012 – Impact Assessment, DECC, London. DECC (2011a), Report on Articles 4 and 14 of the EU End-use Efficiency and Energy Services Directive (ESD) – Update on Progress Against the 2007 UK National Energy Efficiency Action Plan, DECC, London. DECC (2011b), Evaluation Synthesis of Energy Supplier Obligation Policies, Research Report October 2011, DECC, London. DECC (2011c), The Carbon Plan: Delivering our Low Carbon Future, DECC, London. DECC (2012a), The Energy Efficiency Strategy: The Energy Efficiency Opportunity in the UK, DECC, London. DECC (2012b), Updated Energy and Emissions Projections, DECC, London. DECC (2012c), Final Stage Impact Assessment for the Green Deal and Energy Company Obligation, DECC, London. DECC (2012d), “Special Feature – Energy Supplier obligations”, DECC Energy Trends, September, DECC, London. DECC (2012e), “Estimates of Home Insulation Levels in Great Britain: October 2012”, Statistical Release: Experimental Statistics, DECC, London. DECC (2013a), Estimated Impacts of Energy and Climate Change Policies on Energy Prices and Bills, DECC, London. DECC (2013b), personal communication, DECC, London. DECC (2013c), Domestic Green Deal and Energy Company Obligation in Great Britain, Monthly Report, 20 August, DECC, London. DECC (2013d), Electricity Market Reform: Capacity Market – Detailed Design Proposals, DECC, London.
© O
EC
D/IE
A, 2
013
COUNTRY CASE STUDIES: UNITED KINGDOM
242 ENERGY EFFICIENCY MARKET REPORT 2013
Harvey, F. (2013), “Thousands in Insulation Industry Jobs Lost in the New Year, Figures Show”, The Guardian, London, 16 January. GDFC (Green Deal Finance Company) (2013), “Major Industry Players Back the Green Deal Finance Company as £244m Funding Package is Ready to Flow”, Press Release 11 April, The Green Deal Finance Company, London. GIB (Green Investment Bank) (2013), “Non-domestic Energy Efficiency”, web pages accessed 20 August 2013. GVA (2012), “Minimum EPC Ratings: Protecting your Assets”, GVA Bulletin, GVA Grimley Limited, London. OECD (Organisation for Economic Co-operation and Development) (2013), “National Accounts: Final consumption expenditure of households”, OECD National Accounts statistics (database). Ofgem (Office of gas and electricity markets) (2013a), Carbon Emissions Reduction Target Update, Issue 19, May, Ofgem, London. Ofgem (2013b), The Final Report of the Community Energy Saving Programme (CESP) 2009-2012, Ofgem, London. UK GBC (UK Green Building Council) (2013), “New Build Homes”. Zero Carbon Hub (2012), Allowable Solutions for Tomorrow’s New Homes – an Introduction, Zero Carbon Hub, Milton Keynes.
© O
EC
D/IE
A, 2
013

COUNTRY CASE STUDIES: UNITED STATES
ENERGY EFFICIENCY MARKET REPORT 2013 243
20. UNITED STATES
Summary outlook The International Energy Agency (IEA) World Energy Outlook 2012 describes striking new trends on the supply side of the US energy sector. Oil and gas production in the United States, after decades of decline, is undergoing a dramatic resurgence. These new supplies, together with a portfolio of demand-side efficiency policy measures, will have a dramatic effect on energy demand growth, oil imports and domestic energy markets. The net results of increased domestic energy production and decreased energy demand growth will be remarkable, with oil import requirements set to be almost halved by 2020 (Figure 20.1).
Figure 20.1 Impact of supply- and demand-side improvements on oil import needs
Note: mb/d = million barrels per day.
Source: IEA, 2012. This chapter1 focuses on the demand side of this US energy transformation, which will see a doubling in vehicle fuel economy, steadily increasing energy efficiency spending by ESCOs, energy utilities and 1 The principal author of this chapter, Grayson Heffner, gratefully acknowledges the assistance and inputs of the United States Department of Energy (US DOE) and the US national laboratories, especially Lawrence Berkeley National Laboratory (LBNL) and Pacific Northwest Laboratory (PNNL). Special thanks are due to Kym Carey of US DOE, Chuck Goldman, Pete Larsen, Steve Meyers, Alex Lekov, and Greg Rosenquist of LBNL, and Bing Liu, Rosemarie Bartlett, and Olga Livingston of PNNL.
0
2
4
6
8
10
2011 2015 2020 2025 2030 2035
mb/
d
Demand-side efficiency
Biofuels use in transport
Natural gas use in transport
Increased oil supply
Reductions due to:
2011 net oil import level
Projected net imports
The United States is home to the world’s most developed energy service company (ESCO) market, extensive energy efficiency programmes funded by utility customers, and a steadily expanding portfolio of energy-performance standards for appliances, vehicles, and buildings. Continued adoption of more stringent energy performance criteria will lead to steady growth in energy efficiency markets over the medium term. If current projections prove accurate, by 2020 the United States could achieve light-duty vehicle efficiency levels comparable to those in the EU and Japan, near-universal participation by energy utilities in delivering energy efficiency, the world’s largest energy services industry, and the world’s most extensive system of mandatory energy performance standards for appliances and equipment.
© O
EC
D/IE
A, 2
013

COUNTRY CASE STUDIES: UNITED STATES
244 ENERGY EFFICIENCY MARKET REPORT 2013
consumers, and expansion of appliance and equipment standards to include over 100 different product categories. These trends are expected to lead to flat or declining demand for transport fuels, natural gas and electricity over the medium term. Energy profile and context The US economy consumed 220 million tonnes of oil-equivalent (Mtoe) of primary energy in 2011 (Figure 20.2). Total primary energy supply (TPES) and total final consumption (TFC) have remained flat or have slightly fallen over the past decade. The supply portfolio has also shifted, with gas and renewable energy gaining market share at the expense of coal and oil products. Nuclear has remained steady.
Figure 20.2 TPES and TFC, 2001-12, and energy supply by source, 2012
Notes: unless otherwise indicated, all tables and figures in this chapter derive from IEA data and analysis; data for 2012 are estimates.
TFC has fallen by almost 10% since 2007, due mostly to the financial crisis but also structural change and growth in energy efficiency markets. Consuming sector shares have remained remarkably constant over the past ten years (Figure 20.3), with transport accounting for the largest share (approximately 40%) and the industrial and residential sectors contributing nearly 20% each.
Figure 20.3 Share of TFC by sector, 2011, and TFC by sector and by energy source, 2001 and 2011
0
500
1000
1500
2000
2500
Mto
e
TPES TFC Electricity consumption
Nuclear10%
Renewable6%
Coal and coal
products20%
Oil and oil products
36%
Natural gas28%
Industry19%
Transport39%
Residential17%
Services14%
Agriculture, forestry and
fishing1%
Non-specified and non-
energy use10%
0
100
200
300
400
500
600
700
2001 2011 2001 2011 2001 2011 2001 2011
Industry Transport Commercial and public services
Residential
Mto
e
Coal/peat Oil Gas Electricity Other
© O
EC
D/IE
A, 2
013
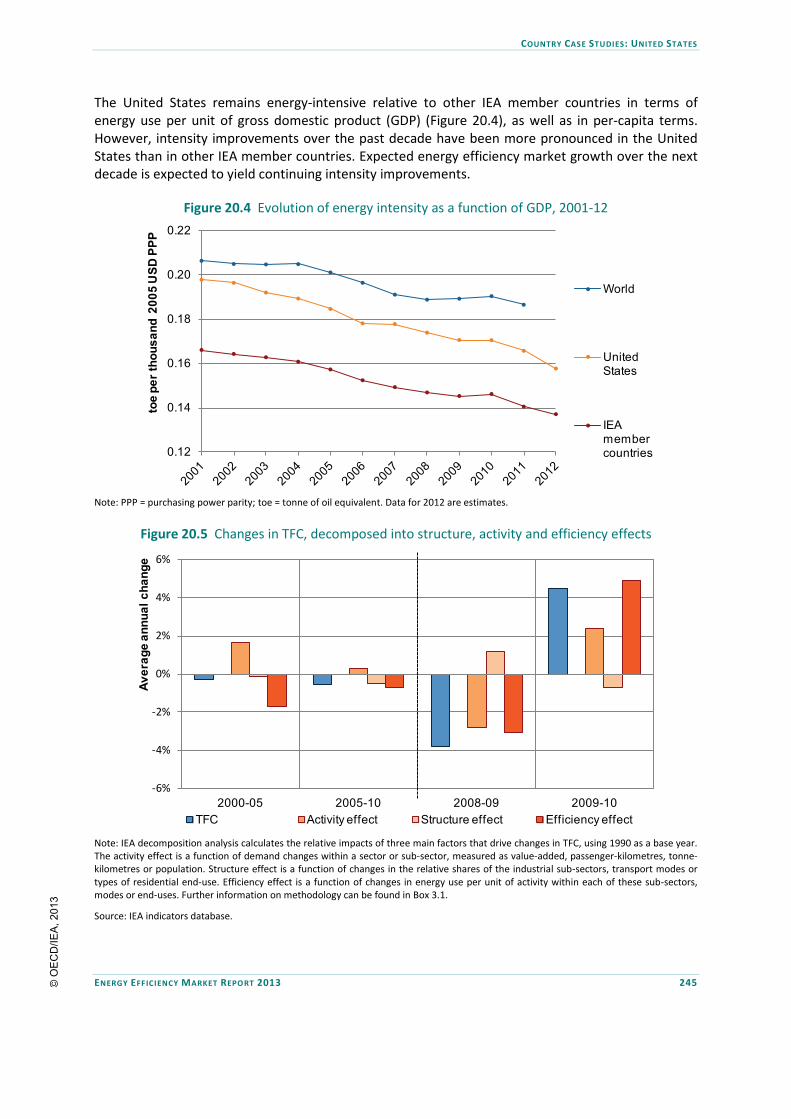
COUNTRY CASE STUDIES: UNITED STATES
ENERGY EFFICIENCY MARKET REPORT 2013 245
The United States remains energy-intensive relative to other IEA member countries in terms of energy use per unit of gross domestic product (GDP) (Figure 20.4), as well as in per-capita terms. However, intensity improvements over the past decade have been more pronounced in the United States than in other IEA member countries. Expected energy efficiency market growth over the next decade is expected to yield continuing intensity improvements.
Figure 20.4 Evolution of energy intensity as a function of GDP, 2001-12
Note: PPP = purchasing power parity; toe = tonne of oil equivalent. Data for 2012 are estimates.
Figure 20.5 Changes in TFC, decomposed into structure, activity and efficiency effects
Note: IEA decomposition analysis calculates the relative impacts of three main factors that drive changes in TFC, using 1990 as a base year. The activity effect is a function of demand changes within a sector or sub-sector, measured as value-added, passenger-kilometres, tonne-kilometres or population. Structure effect is a function of changes in the relative shares of the industrial sub-sectors, transport modes or types of residential end-use. Efficiency effect is a function of changes in energy use per unit of activity within each of these sub-sectors, modes or end-uses. Further information on methodology can be found in Box 3.1.
Source: IEA indicators database.
0.12
0.14
0.16
0.18
0.20
0.22
toe
per t
hous
and
2005
USD
PPP
World
United States
IEA member countries
-6%
-4%
-2%
0%
2%
4%
6%
2000-05 2005-10 2008-09 2009-10
Aver
age
annu
al c
hang
e
TFC Activity effect Structure effect Efficiency effect
© O
EC
D/IE
A, 2
013
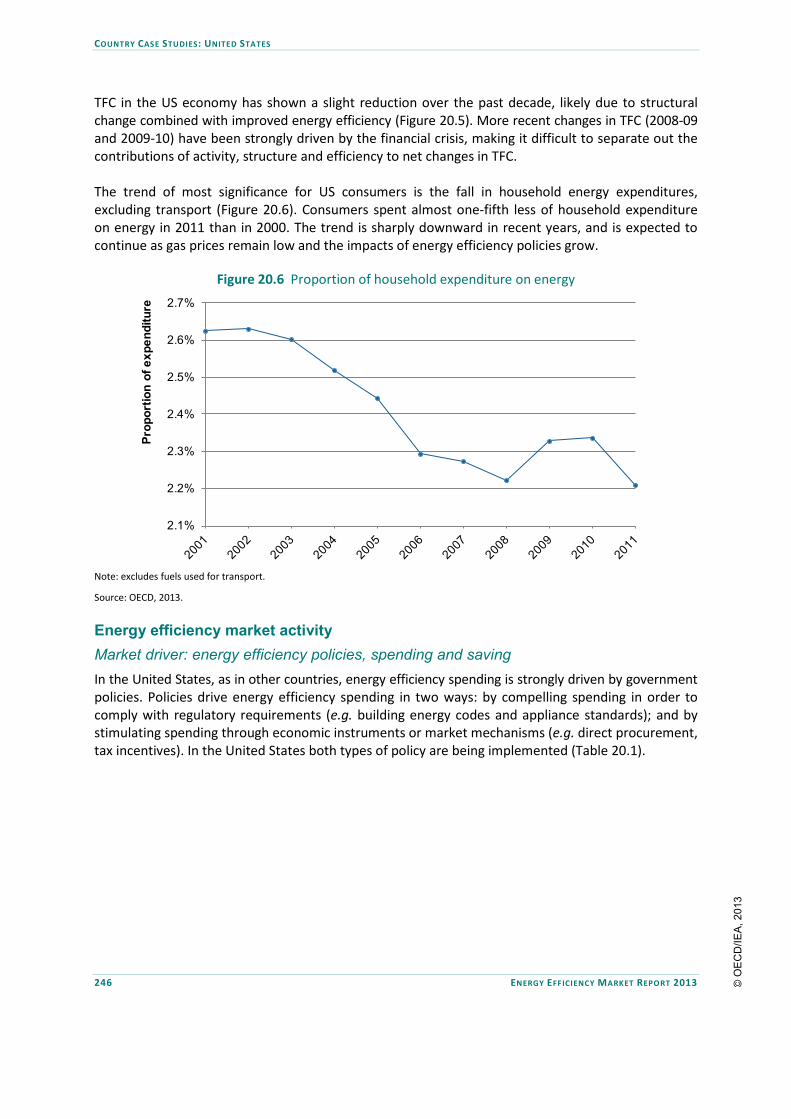
COUNTRY CASE STUDIES: UNITED STATES
246 ENERGY EFFICIENCY MARKET REPORT 2013
TFC in the US economy has shown a slight reduction over the past decade, likely due to structural change combined with improved energy efficiency (Figure 20.5). More recent changes in TFC (2008-09 and 2009-10) have been strongly driven by the financial crisis, making it difficult to separate out the contributions of activity, structure and efficiency to net changes in TFC. The trend of most significance for US consumers is the fall in household energy expenditures, excluding transport (Figure 20.6). Consumers spent almost one-fifth less of household expenditure on energy in 2011 than in 2000. The trend is sharply downward in recent years, and is expected to continue as gas prices remain low and the impacts of energy efficiency policies grow.
Figure 20.6 Proportion of household expenditure on energy
Note: excludes fuels used for transport.
Source: OECD, 2013.
Energy efficiency market activity Market driver: energy efficiency policies, spending and saving In the United States, as in other countries, energy efficiency spending is strongly driven by government policies. Policies drive energy efficiency spending in two ways: by compelling spending in order to comply with regulatory requirements (e.g. building energy codes and appliance standards); and by stimulating spending through economic instruments or market mechanisms (e.g. direct procurement, tax incentives). In the United States both types of policy are being implemented (Table 20.1).
2.1%
2.2%
2.3%
2.4%
2.5%
2.6%
2.7%
Prop
ortio
n of
exp
endi
ture
© O
EC
D/IE
A, 2
013

COUNTRY CASE STUDIES: UNITED STATES
ENERGY EFFICIENCY MARKET REPORT 2013 247
Table 20.1 Energy efficiency policies and results
Sector and policy Policy/legislation
2011 annual site energy
savings (TWh)*
Forecast annual site energy savings
in 2020 (TWh)*
Light and heavy-duty vehicle fuel economy standards
US EPA/NHTSA Joint Rulemakings for 2012-16 and 2017-25. n/a 962
Appliance and equipment standards programme
National Appliance Energy Conservation Acts of 1987 and 1988 (NAECA);
Energy Policy Act of 1992 (EPAct); Energy Policy Act of 2005 (EPAct 2005);
Energy Independence and Security Act 2007 (EISA).
398 (242 electric,
156 gas).
695 (610 from
standards in place today; 85 from
new standards).
Ratepayer-funded energy efficiency
State-level legislation and regulation establishing Energy Efficiency Resource
Standards and savings obligations.
117 (81 electric,
36 gas).
Medium: 210 High: 255
ESCO industry EISA, Section 432. 270 770 Building energy codes
EPAct plus IECC and ASHRAE model building energy codes.
63 (37 electric, 26 gas). 239
* Annual energy savings are the cumulative contributions in a given year of all energy savings measures still within their stipulated service-lives, including the savings from new efficiency measures added in that year. Site energy savings are the direct savings to consumers.
Note: ASHRAE = American Society of Heating, Refrigerating and Air-Conditioning Engineers; n/a = not applicable; NHTSA = National Highway Traffic Safety Administration; TWh = terawatt hour; US EPA = United States Environmental Protection Agency; IECC = International Energy Conservation Code.
Sources: vehicle standards: US EPA, 2012 and NHTSA, 2010; appliance and equipment standards – 2011 savings: Meyers, Williams and Chan, 2013; appliance and equipment standards – 2020 savings: Meyers, Williams and Chan, 2013 and ACEEE and ASAP, 2012; ratepayer-funded efficiency – 2011 savings: Forster, Wallace and Dahlberg, 2013; ratepayer funded efficiency – 2020 savings: Barbose et al., 2012; ESCO industry: Larsen and Goldman, 2013; building energy codes: Livingston, OV et al., 2013.
Fuel economy standards for light and heavy-duty vehicles
In 2012, the US EPA and the Department of Transportation’s NHTSA finalised a 15-year national programme to improve the fuel economy of cars and trucks sold in the United States. The programme is driven by a joint US EPA/NHTSA rulemaking establishing progressively more stringent fuel economy standards for light-duty vehicle model years 2012-16 and model years 2017-25. A companion rulemaking provides the first-ever US fuel economy standards for heavy-duty vehicles – tractor-trailers, heavy-duty pickup trucks and vans, and recreational vehicles – manufactured during model years 2014-18. These standards call for manufacturers to deliver a fleet of light and heavy-duty vehicles with steadily improving fuel economy over a 13-year period. Light-duty vehicle fuel economy is set to rise from 25.5 miles per gallon (mpg) in 2008 to 35.5 mpg in 2016 and 50 mpg in 2025 (US EPA, 2012).2 These policies will result in roughly parallel vehicle fuel economy improvements expected in the European Union, Japan and China, albeit from a lower starting point (Figure 20.7). These vehicle fuel economy standards are projected to save about 6.3 billion barrels of oil over the life of light-duty vehicles built from between 2012 and 2024 and heavy-duty vehicles built from 2014-18 model years, or 1.5 million b/d – equivalent to almost one-half of US oil imports in 2012. These fuel economy standards will also save almost USD 2 trillion for consumers in cumulative fuel costs (US EPA, 2012).
2 A comprehensive mid-term evaluation of progress in implementing the standards, including public notice and commenting, will be undertaken by the US EPA and NHTSA in conjunction with other federal and state agencies. This review will take place in 2015, and may result in changes to the fuel economy targets.
© O
EC
D/IE
A, 2
013

COUNTRY CASE STUDIES: UNITED STATES
248 ENERGY EFFICIENCY MARKET REPORT 2013
Figure 20.7 International comparison of light-duty vehicle fuel economy standards
Notes: solid lines = historical performance; dashed lines = enacted targets; dotted lines = proposed targets or targets under study. LDV = light-duty vehicle. Standards have been standardised using the US Corporate Average Fuel Economy (CAFE) test cycle. In the United States, Canada and Mexico light-duty vehicles include light commercial vehicles. China’s target reflects gasoline vehicles only; the target may be higher after new energy vehicles are considered.
Source: ICCT, 2013.
US DOE energy performance standards for appliances and equipment
Minimum energy performance standards for household appliances and commercial equipment date back to the early 1980s. Early efforts by California, beginning with refrigerators, led to a movement for national energy performance standards for common household appliances. Since 1987, Congress has directed the US Department of Energy (DOE) to set efficiency standards for more than 55 product categories. DOE also updates standards to reflect technological improvements and new products. Recent years have seen a record pace of new standards set as a result of court-ordered and statutory deadlines imposed on DOE. Some 20 new standards have been completed since 2009, with more expected in 2013 and over the medium term. Activity will likely focus on the appliance and equipment categories not yet covered, such as battery chargers, consumer electronics, pool pumps and spas, and luminaires. According to a recent study by appliance standards advocates, as many as 30 new product categories could be covered over the next six years with an aggressive DOE programme. The ACEEE and ASAP estimate that savings from these new product categories could add up to over 80 TWh of annual energy savings by 2020 (Figure 20.8) (ACEEE and ASAP, 2012; ASAP, 2013).3 Appliance standards produce long-lived energy savings. According to a recent analysis by the Lawrence Berkeley National Laboratory, the standards in place today produced 400 TWh of energy savings in 2011, with savings expected to top 600 TWh by 2020 (Meyers, Williams and Chan 2013). Adding in the savings estimated from new appliance and equipment standards that may be implemented in the coming years (Figure 20.8) could combine to produce total annual energy savings of as much as 695 TWh in 2020 (ASAP, 2013). 3 The IEA derived 2020 annual savings estimates based on the effectiveness dates of individual standards together with the annual energy savings in 2025 and 2035 projected by ACEEE and ASAP.
20
25
30
35
40
45
50
55
60
65
2000 2005 2010 2015 2020 2025
Mile
s pe
r gal
lon
(gas
olin
e)
United States-LDV
Canada-LDV
European Union
Japan
China
South Korea
Australia
India
Mexico-LDV
© O
EC
D/IE
A, 2
013

COUNTRY CASE STUDIES: UNITED STATES
ENERGY EFFICIENCY MARKET REPORT 2013 249
Figure 20.8 Potential energy savings from new appliance energy performance standards
Sources: ACEEE and ASAP, 2012; ASAP, 2013.
Energy efficiency policies for new buildings
Building codes are the responsibility of states, which can adopt or reject new code requirements. Some states have a legislative process; others have a regulatory process. Some “home rule” states devolve the authority to set building codes to localities. States often amend the model codes according to local needs and interests; these procedures are influenced by stakeholders within the development and construction industries. These state and local jurisdictions are also responsible for enforcing compliance with the building codes as adopted. The US DOE and state energy agencies play a leading role in encouraging adoption of building energy codes and building the capacity for inspection and enforcement. In response to the Energy Policy Act (EPAct) of 1992, the US DOE established the Building Energy Codes Program (BECP) to support the model national building energy codes development process and help states adopt and implement more efficient energy codes. Since its inception 20 years ago, BECP has become the central information resource on national energy codes and standards. Energy efficiency standards for new buildings have been progressively tightened over the past decade, culminating in the recent introduction of two new model building energy codes: the 2012 International Energy Conservation Code (IECC) covering residential buildings; and the 2010 ASHRAE Standard 90.1-2010 covering commercial buildings. These codes are projected to produce a 30% improvement in the energy efficiency of new buildings compared to buildings constructed to comply with the 2006 model code.4 The Pacific Northwest National Laboratory estimates today’s savings from building code changes over the past two decades to be 42 TWh (Livingston, et al., 2013). The 2012 code changes will produce additional, although difficult-to-estimate, annual energy savings by 2020. The IECC code includes stringent prescriptive elements, such as mandatory whole-house pressure tests, insulated domestic hot water piping and significantly lower duct leakage rates. Diffusion of the latest model building energy codes is expected to proceed quickly due to the ongoing assistance provided by BECP, with energy savings from implementation of more stringent building energy codes expected to triple between 2011 and 2020 (Livingston et al., 2013). 4 Both codes are updated on a three-year cycle. The next cycle will conclude in 2015. As a point of reference, a building constructed to meet ASHRAE 90.1-2010 will consume about half of the energy consumed under the first model building energy code, ASHRAE 90-75 (Bloomberg New Energy Finance/Business Sustainable Energy Council, 2013).
0
10
20
30
40
50
60
70
80
90
2014 2016 2018 2020
TWh Water heaters
Outdoor lighting fixturesComputer equipmentSet-top boxes and standby powerAir handlersTelevisionsRefrigeration (commercial)PumpsElectric motorsDistribution transformersWalk-in coolers and freezersClothes washersFluorescent lamps (general service)Battery chargersDishwashersCandelabra-style incandescentsIncandescent reflectors
© O
EC
D/IE
A, 2
013

COUNTRY CASE STUDIES: UNITED STATES
250 ENERGY EFFICIENCY MARKET REPORT 2013
Ratepayer-funded energy efficiency programmes
Ratepayer-funded energy efficiency has been a pillar of US energy efficiency efforts since the late 1990s. Spending levels have grown from USD 1 billion in 2000 to USD 7 billion in 2011 – an average annual growth of 20% (Figure 20.9). Energy savings from these programmes are significant. The latest industry report, a collaborative initiative by the Consortium for Energy Efficiency, the America Gas Association and the Institute for Electric Efficiency, estimated gross annual energy savings of 117 TWh from cumulative spending on energy efficiency through 2011 (Forster, Wallace and Dahlberg, 2013). Until recently, only a handful of Western and North-eastern states used ratepayer funds to invest in energy efficiency. In 2010, ten states with less than one-third of total natural gas and electricity sales accounted for two-thirds of total ratepayer-funded energy efficiency. These regional disparities are beginning to ease, due to wider adoption of regulatory mechanisms promoting energy efficiency.5 As of end-2012 there were 25 US states with energy efficiency resource standards (EERS), and another nine states adopting other policies requiring significant energy provider involvement in energy efficiency (ACEEE, 2012c).6 Ten states doubled their ratepayer-funded energy efficiency expenditure in 2010 (Institute for Electric Efficiency, 2012).7 Of the 25 EERS schemes, 18 incorporate incremental energy savings targets that, if followed, could result in a 30% annual (cumulative) energy savings or more by 2020. Some analysts question whether this rapid growth can be sustained. A recent study by Lawrence Berkeley National Laboratory (LBNL) examined the outlook for ratepayer-funded energy efficiency. The study projected ratepayer-funded energy efficiency spending and savings for three scenarios (low, medium and high), based on a review of state-level policies and plans and interviews with regulators and utility experts The low scenario projects lower interest 5 Regulatory mechanisms promoting energy efficiency include resource standards, statutory requirements setting goals or criteria for ratepayer-funded energy efficiency efforts, system benefit charges, integrated resource planning requirements and decoupling of revenues from sales (Regulatory Assistance Project, 2012). 6 An energy efficiency resource standard is a regulatory mechanism used by regulators to establish specific energy savings targets that regulated gas and electricity companies must achieve, or face penalties. An EERS is similar in concept to a Renewable Portfolio Standard (RPS), in that an EERS requires utilities to reduce energy use by a specified and increasing percentage or amount each year. 7 Oklahoma, Louisiana, Tennessee, North Carolina, Virginia, North and South Dakota, Ohio, Pennsylvania and Wyoming.
Box 20.1 Near-zero-energy schools in Kentucky
A recent article in Forbes points out that the fall in solar photovoltaic (PV) prices, together with more stringent building codes and lower-cost building materials, has brought the near-zero-energy building closer to commercial reality. A programme in Kentucky has constructed three net-zero elementary school buildings, all built within stringent cost caps applying to institutional structures. The Richardsville Elementary School in Warren County, Kentucky is the first net-zero elementary school in the United States, according to the Kentucky Department for Energy Development and Independence (KDEDI). School officials and institutional architects are watching closely, as Kentucky has now set a very high bar for the energy savings that can be accomplished while remaining within the cost envelope for public buildings.
Typical features of net-zero structures include very high efficiency, on-site PV systems, and use of building envelope features to control heat gain and loss and provide passive assistance to heating, cooling and lighting.
The affordability of key elements of low-energy buildings has been aided by the downturn in the economy and much lower costs for PV and other high-technology components. With building materials costs falling and builders competing to win school construction tenders, the construction cost premium for a net-zero school can be as low as 10% to 15%. Energy savings, and in some cases net electricity sales back to local utilities, can offset this higher cost in a few years (KDEDI, 2012; Forbes, 2012).
© O
EC
D/IE
A, 2
013

COUNTRY CASE STUDIES: UNITED STATES
ENERGY EFFICIENCY MARKET REPORT 2013 251
by regulators in energy efficiency as a resource, with spending remaining at 2010 levels. The medium scenario projects continued growth in spending by the states with ambitious EERS plus continued expansion of energy efficiency policies in other states, subject to constraints of technical capacity and rate/spending caps imposed by statute or regulatory order. Under this scenario, ratepayer-funded spending growth is lower than historical rates – about 4% annually. The high scenario is based on adoption of energy efficiency regulatory mechanisms by those states that have not yet pursued energy efficiency. This scenario foresees a tripling of combined gas and electric energy efficiency spending over the period to 2025, towards USD 16 billion annually (Figure 20.10) (Barbose et al., 2013).
Figure 20.9 Ratepayer-funded natural gas and electric energy efficiency spending
Sources: Forster, Wallace and Dahlberg, 2013; Barbose et al., 2013; ACEEE, 2012b.
Figure 20.10 Projected electric and gas energy efficiency programme spending under three scenarios, 2012-25
Source: Barbose et al., 2013.
Energy savings projections follow a similar path, with energy savings from ratepayer-funded electric efficiency programmes projected at 210 TWh to 255 TWh in 2020, equivalent to 6% of projected electricity consumption in that year (US EIA, 2013). Depending on electricity sales growth over the period, these annual energy savings levels could result in a net decline in electricity sales. A recent
0
1
2
3
4
5
6
7
USD
bill
ion
Gas
Electric
USD
bill
ion
Low Medium High
16
14
12
10
8
6
4
2
02012 2015 2020 2025
Low
© O
EC
D/IE
A, 2
013

COUNTRY CASE STUDIES: UNITED STATES
252 ENERGY EFFICIENCY MARKET REPORT 2013
report by the Institute for Electric Efficiency analysed the trends affecting electricity sales in the United States, and concluded that slow growth would be offset in the medium term by the combined effects of codes, standards and ratepayer-funded energy efficiency (Figure 20.11). According to this projection, electricity demand would decline to 2020 as these codes and standards take effect, and then return to modest growth as new technologies such as electric transport add new electricity consumption.8
Figure 20.11 Impact of energy efficiency policies on retail electricity sales, 2010-35
Notes: EE= energy efficiency; IEE = Institute for Electric Efficiency; AEO 2012 = the 2012 Annual Energy Outlook produced by the United States Department of Energy.
Source: IEE, 2013.
8 The IEA and US DOE both project that electricity demand in the United States will grow at about 0.7% over the next decade.
3 000
3 200
3 400
3 600
3 800
4 000
4 200
4 400
4 600
2010 2015 2020 2025 2030 2035
TWh
Moderate Electric Transportation Ratepayer Funded EE ProgramsModerate Codes and Standards AEO 2012 Reference CaseIEE Moderate Forecast
Codes andstandards (-420 TWh)
EE programmes (-249 TWh)
Electric transportation (+33 TWh)
3 805 TWh
Moderate electric transportationModerate codes and standardsIEE moderate forecast
Ratepayer funded EE programmesAEO 2012 reference case
Box 20.2 Is the end of US electricity demand growth at hand?
Energy regulators and utilities in the United States are considering how energy efficiency, distributed generation, net metering and feed-in tariffs for renewable energy will affect electricity sales in the future. LBNL’s “high” scenario for ratepayer-funded energy efficiency projects marginally lower electricity sales by 2020. The Institute for Electric Efficiency, the Pacific Northwest Planning Council and ISO New England all project a decline in electricity sales in the coming years. Other than the countervailing trends of electric vehicles and heat pumps, electricity demand in mature economies is growing slowly, if at all. Structural and socio-economic changes, together with consuming-behaviour changes, proliferation of energy performance codes and standards, and aggressive energy efficiency programmes, have all contributed to lower energy demand growth. Add in distributed generation, which is increasingly expected to provide a viable alternative to centralised power generation and networked distribution model, and the traditional electricity business model underpinning US electricity markets may need substantial adjustment to reflect a new era of steady or even declining demand (See for example: Barbose et al., 2013; IEE, 2013; Sioshansi, 2013).
© O
EC
D/IE
A, 2
013
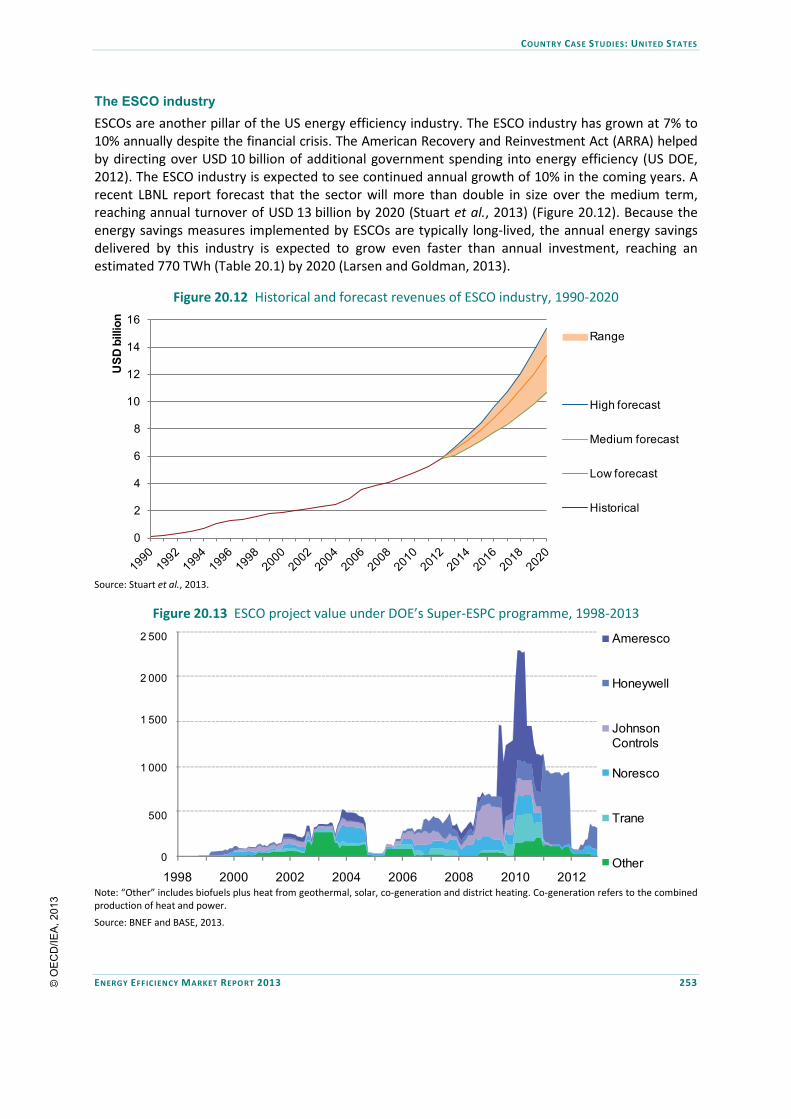
COUNTRY CASE STUDIES: UNITED STATES
ENERGY EFFICIENCY MARKET REPORT 2013 253
The ESCO industry ESCOs are another pillar of the US energy efficiency industry. The ESCO industry has grown at 7% to 10% annually despite the financial crisis. The American Recovery and Reinvestment Act (ARRA) helped by directing over USD 10 billion of additional government spending into energy efficiency (US DOE, 2012). The ESCO industry is expected to see continued annual growth of 10% in the coming years. A recent LBNL report forecast that the sector will more than double in size over the medium term, reaching annual turnover of USD 13 billion by 2020 (Stuart et al., 2013) (Figure 20.12). Because the energy savings measures implemented by ESCOs are typically long-lived, the annual energy savings delivered by this industry is expected to grow even faster than annual investment, reaching an estimated 770 TWh (Table 20.1) by 2020 (Larsen and Goldman, 2013).
Figure 20.12 Historical and forecast revenues of ESCO industry, 1990-2020
Source: Stuart et al., 2013.
Figure 20.13 ESCO project value under DOE’s Super-ESPC programme, 1998-2013
Note: “Other” includes biofuels plus heat from geothermal, solar, co-generation and district heating. Co-generation refers to the combined production of heat and power.
Source: BNEF and BASE, 2013.
0
2
4
6
8
10
12
14
16
USD
bill
ion
Range
High forecast
Medium forecast
Low forecast
Historical
0
500
1,000
1,500
2,000
2,500
1998 2000 2002 2004 2006 2008 2010 2012
Ameresco
Honeywell
Johnson Controls
Noresco
Trane
Other
2 500
2 000
1 500
1 000
500
0
© O
EC
D/IE
A, 2
013
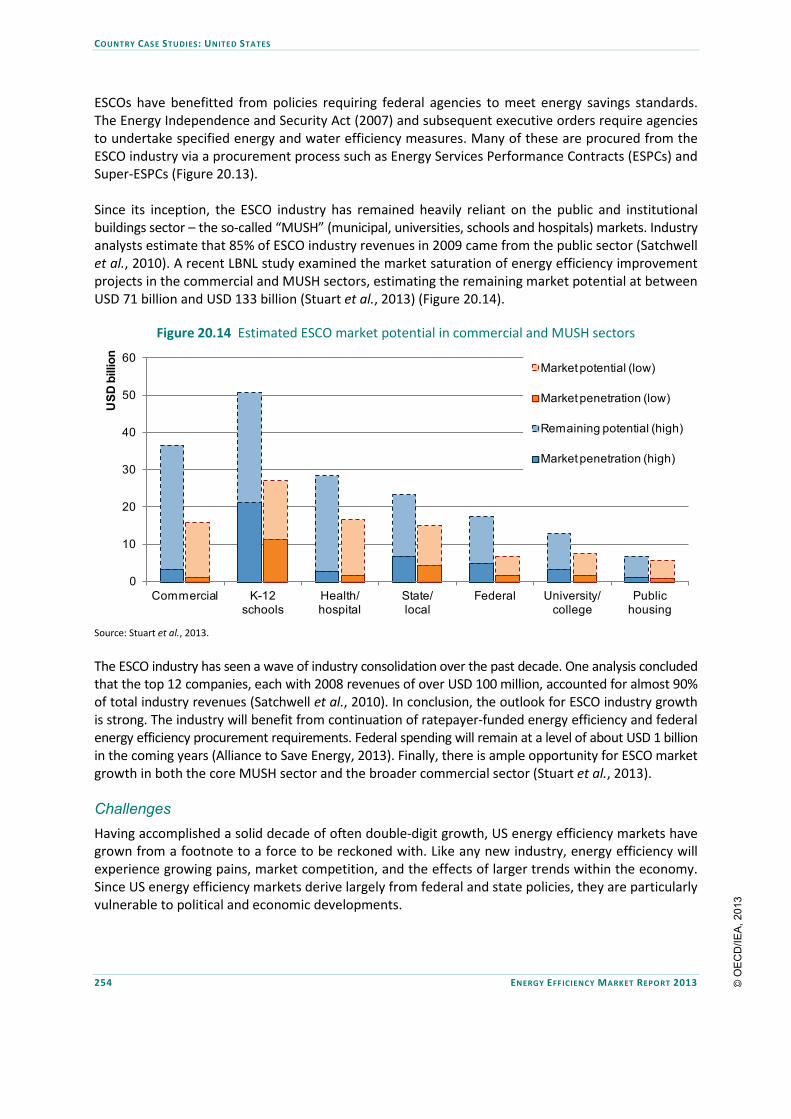
COUNTRY CASE STUDIES: UNITED STATES
254 ENERGY EFFICIENCY MARKET REPORT 2013
ESCOs have benefitted from policies requiring federal agencies to meet energy savings standards. The Energy Independence and Security Act (2007) and subsequent executive orders require agencies to undertake specified energy and water efficiency measures. Many of these are procured from the ESCO industry via a procurement process such as Energy Services Performance Contracts (ESPCs) and Super-ESPCs (Figure 20.13). Since its inception, the ESCO industry has remained heavily reliant on the public and institutional buildings sector – the so-called “MUSH” (municipal, universities, schools and hospitals) markets. Industry analysts estimate that 85% of ESCO industry revenues in 2009 came from the public sector (Satchwell et al., 2010). A recent LBNL study examined the market saturation of energy efficiency improvement projects in the commercial and MUSH sectors, estimating the remaining market potential at between USD 71 billion and USD 133 billion (Stuart et al., 2013) (Figure 20.14).
Figure 20.14 Estimated ESCO market potential in commercial and MUSH sectors
Source: Stuart et al., 2013.
The ESCO industry has seen a wave of industry consolidation over the past decade. One analysis concluded that the top 12 companies, each with 2008 revenues of over USD 100 million, accounted for almost 90% of total industry revenues (Satchwell et al., 2010). In conclusion, the outlook for ESCO industry growth is strong. The industry will benefit from continuation of ratepayer-funded energy efficiency and federal energy efficiency procurement requirements. Federal spending will remain at a level of about USD 1 billion in the coming years (Alliance to Save Energy, 2013). Finally, there is ample opportunity for ESCO market growth in both the core MUSH sector and the broader commercial sector (Stuart et al., 2013). Challenges Having accomplished a solid decade of often double-digit growth, US energy efficiency markets have grown from a footnote to a force to be reckoned with. Like any new industry, energy efficiency will experience growing pains, market competition, and the effects of larger trends within the economy. Since US energy efficiency markets derive largely from federal and state policies, they are particularly vulnerable to political and economic developments.
Commercial K-12schools
Health/hospital
State/local
Federal University/college
Publichousing
0
10
20
30
40
50
60
USD
bill
ion
Market potential (low)
Market penetration (low)
Remaining potential (high)
Market penetration (high)
© O
EC
D/IE
A, 2
013

COUNTRY CASE STUDIES: UNITED STATES
ENERGY EFFICIENCY MARKET REPORT 2013 255
Headwinds impeding energy efficiency market growth
Headwinds impeding medium-term energy efficiency market growth include: • Low natural gas prices: wholesale natural gas prices have rebounded from historical lows, but remain
significantly lower than in most IEA member countries. Low natural gas prices reduce the economic incentive for investing in energy efficiency, and lower the technical cost-effectiveness of ratepayer programmes. Energy Trust of Oregon recently received a temporary exception to continue operating their gas weatherisation programme, even though it is not cost-effective at today’s natural gas costs (Energy Trust of Oregon, 2013). Low prices also make it more difficult to sustain and increase ratepayer spending levels, as consumers see the energy efficiency surcharge on bills growing even as commodity costs are going down. This combination could create opposition by some utilities and regulators to continued energy efficiency spending.
• Declining federal financial support for energy efficiency: the energy efficiency industry received an unprecedented infusion of USD 10 billion in spending through ARRA. This spending benefitted state and local governments and low-income weatherisation programmes, as well as the ESCO industry, which grew rapidly over the period between 2008 and 2011 as thousands of energy savings retrofits took place in schools, hospitals and other public buildings (US DOE, 2013). The low-income weatherisation industry also received a huge infusion relative to long-term average spending levels. Both industries face challenges as federal financial support declines due both to the end of ARRA funding and lower federal budgets in general.
• Effect of flat or declining sales on the viability of energy providers: the combination of flat or declining sales growth, lower avoided costs and rate impacts from energy efficiency spending is creating concern among some energy utility managers. Steady erosion of revenues over several years has affected share prices and earnings. Concerns over profitability and growth of energy providers may impede the diffusion of EERS and other regulatory mechanisms in some states (Barbose et al., 2013).
• Workforce sufficiency and capacity: studies have shown that energy efficiency policies are effective in creating jobs. However, many of these jobs require on-the-job training and experience. Several studies have predicted that ramping up energy efficiency spending will create shortages in qualified workers needed to deliver high-quality energy efficiency investments (Goldman et al., 2010).
• Compliance monitoring capacity: over the next few years a growing number of appliance standards and building codes will be implemented. The expansion of standards to new product classes and promulgation of new model building energy codes to more state and local jurisdictions may strain compliance and enforcement capacity.
• Increasing cost of energy efficiency measures: in some states with a history of energy efficiency programmes, the availability of low-cost, short payback period energy efficiency is declining. As appliance and equipment stock turns over, and coverage and stringency of energy performance standards expand, there may be fewer cost-effective energy-saving opportunities. Developing new energy efficiency measures and programme offerings that are affordable and accessible to customers is critical if energy efficiency markets are to continue growing (Larsen, Goldman and Satchwell, 2012).
• Political opposition to increased energy efficiency spending: energy regulators in many states have played an activist role in creating regulatory mechanisms and supporting ratepayer-funded energy efficiency spending increases. However, in some jurisdictions there have been challenges by state legislators to these new regulatory policies, especially when there is a perception that they are adding to the energy bills of consumers. Regulators who have been active in promoting energy efficiency in Illinois, New Jersey, and elsewhere are facing political opposition from legislatures and sometimes the judiciary (Heffner and Migden-Ostrander, 2012).
© O
EC
D/IE
A, 2
013

COUNTRY CASE STUDIES: UNITED STATES
256 ENERGY EFFICIENCY MARKET REPORT 2013
Prospects for energy efficiency market activity US energy efficiency markets will continue to grow in the medium term, driven by federal and state policies and regulatory mechanisms (Table 20.1) as well as energy prices. Some analysts expect these policies to lower demand for gas, electricity and transport fuels in the coming years. A realistic outlook on energy efficiency in the United States needs to take into account the potential obstacles to continued steady growth (Table 20.2). There are concerns about whether spending on energy efficiency can be sustained, especially in light of the downward pressure on public budgets and continued low natural gas prices. Some analysts are concerned that the delivery capability of the energy efficiency industry may not be able to keep up with ambitious targets for savings and efficiency improvements. Delays in technology development could result in downward adjustments in appliance standards or vehicle fuel economy improvement targets.
Table 20.2 Tailwinds and headwinds for US medium-term energy efficiency markets
Tailwinds Headwinds Consensus federal and state policies in place Low natural gas prices Pipeline of new energy efficiency technologies Downward pressure on public budgets
Diffusion and rising stringency of state-level efficiency policies Reaction of energy providers to declining sales Improved co-ordination in delivering energy efficiency Workforce sufficiency New market methods for procuring energy efficiency Compliance monitoring capacity
New federal legislation – Shaheen Portman Act and the Sensible Accounting to Value (SAVE) act
Upward pressure on the cost of delivering energy savings
Opposition to increased energy efficiency spending Tailwinds supporting sustained energy efficiency market growth
Recent advancements and emerging trends in institutional capacity, consumer behaviour, technology development, and a pipeline of energy-efficient technologies should favour continued energy efficiency market growth over the next decade. These tailwinds include: • Political consensus on federal and state energy efficiency policies: appliance and equipment standards,
vehicle fuel economy standards, and building codes all enjoy bipartisan support. These policies will deliver the bulk of projected energy savings over the next decade.
• Emergence of new technologies and energy-saving opportunities: emerging technologies will lead to new energy-saving opportunities. Solid-state lighting will grow in importance as prices fall, taking market share from compact fluorescent lamps (CFLs). Communications, information technology and smart metering, along with new feedback and control mechanisms, will result in seamless methods to optimise consumption of all types, from industrial process controls and buildings energy management, to intelligent transport systems and smart homes.
• Diffusion of state-level policies, such as EERS: a long-standing regional pattern differentiating leading from lagging states is disappearing. New states are implementing energy efficiency policies, such as Missouri and Arkansas. Some regions (e.g. the Southwest) that were only recently lagging behind are now national leaders (Geller, 2012).
• Increased co-ordination and competency in implementing energy efficiency: institutions are becoming more adept at co-ordinating energy efficiency policies and programmes. Energy providers now facilitate adoption and enforcement of appliance standards and building energy codes. Community organisations use a combination of ratepayer-funded, state and federal funding to deliver low-income weatherproofing programmes. State legislation has placed EERS on public power entities
© O
EC
D/IE
A, 2
013

COUNTRY CASE STUDIES: UNITED STATES
ENERGY EFFICIENCY MARKET REPORT 2013 257
(municipal utilities and rural electricity co-operatives) for the first time. The emergence of third-party administrators has provided an alternative for delivering ratepayer-funded energy efficiency (ACEEE, 2012a).
• New markets and market mechanisms for energy efficiency: energy efficiency technology innovation is accompanied by innovative energy efficiency procurement. ISO New England, the regional transmission organisation, operates a forward capacity market, a competitive auction designed to procure least-cost capacity resources in response to projected capacity needs. Energy efficiency and other demand-side resources can compete in this market on an equivalent basis with generation. ISO New England acts as the market administrator, managing the auction and setting requirements for participation (Heffner et al., 2013). The Regional Greenhouse Gas Initiative (RGGI) is a cap-and-trade system for the North-eastern and Mid-Atlantic region, which provides a vehicle for proceeds from selling emission allowances to be used for energy efficiency spending. RGGI generated USD 300 million in energy efficiency programme spending in 2009.
Conclusions The United States is on track to become one of the most energy efficient IEA member countries by 2020. Energy efficiency improvements will continue to unfold over the medium term, due to already enacted legislation for the main consuming sectors. These regulatory policies will be supplemented by gradual promulgation of more stringent building codes at the state and local level plus continued modest growth in ratepayer-funded energy efficiency and ESCO sectors. Tax incentives could provide an additional stimulus to energy efficiency spending by households and businesses. These policies and programmes will combine to more than triple energy savings to 2020 from 2011 levels (Figure 20.15). The savings from these expanded energy efficiency markets, together with growing domestic energy production, could cut 2011 US oil imports almost in half by the end of the decade.
Figure 20.15 Actual and forecast annual savings from energy efficiency policies and markets, 2011 and 2020
0
500
1 000
1 500
2 000
2 500
3 000
2011 2020
TWh
Building energy codes
ESCO industry
Ratepayer-funded energy efficiency
Appliance standards programme
Light- and heavy-duty vehicle fuel economy standards
© O
EC
D/IE
A, 2
013

COUNTRY CASE STUDIES: UNITED STATES
258 ENERGY EFFICIENCY MARKET REPORT 2013
References ACEEE (American Council for an Energy Efficiency Economy) and ASAP (Appliance Standards Awareness Project) (2012), The Efficiency Boom – Cashing in on the Savings from Appliance Standards, Report Number ASAP 8/ACEEE-A123, ACEEE, Washington, DC and ASAP, Boston. ACEEE (2012a), Three Decades and Counting: A Historical Review and Current Assessment of Electric Utility Energy Efficiency Activity in the States, Report Number U123, June, ACEEE, Washington, DC. ACEEE (2012b), The 2012 State Energy Efficiency Scorecard, Report Number E12C, October, ACEEE, Washington, DC. Alliance to Save Energy (2013), telephone interview with Brian Castelli. ASAP (Appliance Standards Awareness Project) (2013), “Products”, ASAP website, ASAP, Boston, www.appliance-standards.org/products. BNEF (Bloomberg New Energy Finance) and BCSE (Business Council for Sustainable Energy) (2013), “Section 6 – Demand Side Energy Efficiency”, Sustainable Energy in America 2013 Factbook, BCSE, Washington DC. Barbose, G., et al. (2013), The Future of Utility Customer-Funded Energy Efficiency Programs in the United States: Projected Spending and Savings to 2025, LBNL-5803E, Lawrence Berkeley National Laboratory, Berkeley. Energy Trust of Oregon (2013), “Energy Trust of Oregon and Cost-Effectiveness”, presentation by Ted Light, Project Planning Manager, Energy Trust of Oregan, Portland, 20 February. Forbes (2012), “Net Zero Schools in Kentucky: Models for the Future Come from Surprising Places”, Forbes, 10 December 2012, www.forbes.com/sites/peterdetwiler/2012/12/10/net-zero-schools-in-kentucky-models-for-the-future-come-from-surprising-places/2/, December 10. Forster, H.J, P. Wallace and N. Dahlberg (2013), 2012 State of the Efficiency Program Industry – Budgets, Expenditures, and Impacts, Consortium for Energy Efficiency (CEE), Boston. Geller, H. (2012), The $20 billion Bonanza: Best Practice Electric Utility Energy Efficiency Programmes and their Benefits for the Southwest, Southwest Energy Efficiency Project, Boulder. Heffner, G. and J. Migden-Ostrander (2012), Workshop Report: Policies for Energy-Provider-Delivered Energy Efficiency: North American Regional Workshop, 18-19 April, OECD/IEA, Paris. Heffner, G., et al. (2013), Energy Provider-Delivered Energy Efficiency: A global stock-taking based on case studies, IEA Insights Series, OECD/IEA, Paris. ICCT (The International Council on Clean Transportation) (2013), Global Standards Comparison datasheet, August 2013, ICCT, Washington DC.
© O
EC
D/IE
A, 2
013

COUNTRY CASE STUDIES: UNITED STATES
ENERGY EFFICIENCY MARKET REPORT 2013 259
IEA (International Energy Agency) (2012), World Energy Outlook 2012, OECD/IEA, Paris. IEE (Institute for Electric Efficiency) (2012), Summary of Ratepayer-funded Electric Efficiency Impacts, Budgets, and Expenditures, IEE Brief, IEE, Washington DC. IEE (2013), Factors Affecting Electricity Consumption in the US (2010-2035), IEE Report March, IEE, Washington, DC. KDEDI (Kentucky Department for Energy Development and Independence) (2012), “Moving to Net Zero Energy Schools”, presentation at the NASEO 2012 Annual Meeting, Minneapolis, 9-12 September. Larsen, P., C. Goldman, and A. Satchwell (2012), “Evolution of the U.S. Energy Service Company Industry: Market Size and Project Performance from 1990-2008”, Energy Policy, Vol. 50, November, Elsevier, Amsterdam, pp. 802-820. Larsen, P. and C. Goldman (2013), Recent and Anticipated Energy Savings for the U.S. ESCO Industry: A Supplemental Analysis for the International Energy Agency, Energy Analysis and Environmental Impacts Department, Lawrence Berkeley National Laboratory, Berkeley, forthcoming. Livingston, O.V., P.C. Cole, D.B. Elliott and R. Bartlett, (2013), Building Energy Codes Program: National Benefits Assessment 1992-2040, PNNL-22610, Pacific Northwest National Laboratory, Richland (forthcoming). Meyers, S., A. Williams and P. Chan (2013), Energy and Economic Impacts of U.S. Federal Energy and Water Conservation Standards Adopted from 1987 through 2012, Report LBNL-6217E, Lawrence Berkeley National Laboratory, Berkeley. NAESCO (National Association of Energy Services Companies) (2012), interview and correspondence with Don Gilligan, NAESCO Executive Director. NHTSA (National Highway Traffic Safety Administration) (2010), NHTSA and EPA Establish New National Program to Improve Fuel Economy and Reduce Greenhouse Gas Emissions for Passenger Cars and Light Trucks, NHTSA Factsheet, NHTSA, Washington DC. OECD (Organisation for Economic Co-operation and Development) (2013), “National Accounts: Final consumption expenditure of households”, OECD National Accounts statistics (database), www.oecd-ilibrary.org/statistics, accessed 15 May 2013. Satchwell, A., et al. (2010), A Survey of the US ESCO Industry: Market Growth and Development from 2008-2011, Report LBNL 3479-E, Lawrence Berkeley National Laboratory, Berkeley. Sioshansi, F. (ed.) (2013), Energy Efficiency: Towards the End of Electricity Demand Growth, Academic Press, Waltham, Massachusetts.
© O
EC
D/IE
A, 2
013

COUNTRY CASE STUDIES: UNITED STATES
260 ENERGY EFFICIENCY MARKET REPORT 2013
Stuart, E., et al. (2013), Current Size and Remaining Market Potential of U.S. ESCO Industry, LBNL Report 6300-E, Lawrence Berkeley National Laboratory, Berkeley, in submission to Energy Policy, September. US DOE (United States Department of Energy) (2012), “American Recovery and Reinvestmant Act”, website, US DOE, Washington DC, www1.eere.energy.gov/recovery/index.html. US EIA (United States Energy Information Administration) (2013), Annual Energy Outlook 2013 Early Release, US EIA, Washington DC. US EPA (United Stated Environmental Protection Agency) (2012), Fact Sheet – EPA and NHTSA Set Standards to Reduce Greenhouse Gases and Improve Fuel Economy for Model Years 2017-2025 Cars and Light Trucks, US EPA, Washington DC.
© O
EC
D/IE
A, 2
013

PART 3 ANNEX AND GLOSSARY
© O
EC
D/IE
A, 2
013

ANNEX : COUNTRY-LEVEL ENERGY USE AND INTENSITY DATA
262 ENERGY EFFICIENCY MARKET REPORT 2013
ANNEX: COUNTRY LEVEL ENERGY USE AND INTENSITY DATA
Table A.1 Total primary energy supply (TPES) by country (million tonnes of oil equivalent ([Mtoe])
2002 2004 2006 2008 2010 2011 2012
Australia 109.46 112.70 115.02 122.52 122.51 122.89 133.68 Austria 30.45 32.69 33.80 33.55 34.23 33.02 32.90 Belgium 56.37 58.90 58.11 58.60 60.89 59.09 57.29 Canada 248.22 267.62 268.30 264.72 250.99 251.85 252.65 Chile 25.57 27.51 29.51 30.31 30.92 33.57 32.72 Czech Republic 42.54 45.51 45.90 44.87 44.04 43.43 42.82 Denmark 19.00 19.43 20.25 19.20 19.31 18.00 17.04 Estonia 4.71 5.28 5.04 5.44 5.57 5.60 5.72 Finland 34.82 37.12 37.33 35.28 36.43 34.75 33.48 France 261.18 269.78 266.79 264.80 261.16 252.83 251.71 Germany 338.55 340.68 340.49 334.63 329.77 311.77 307.38 Greece 28.32 29.71 30.22 30.42 27.62 26.72 25.99 Hungary 25.60 26.16 27.33 26.46 25.67 24.96 23.50 Iceland 3.28 3.37 4.16 5.35 5.37 5.73 6.02 Ireland 14.67 14.27 14.61 14.90 14.22 13.22 13.35 Israel* 18.81 19.24 20.38 22.87 23.19 23.25 24.08 Italy 172.40 181.99 181.83 176.00 170.24 167.42 158.62 Japan 510.39 522.49 519.81 495.35 499.09 461.47 451.50 Korea 198.67 208.28 213.60 226.95 249.96 260.44 263.00 Luxembourg 3.65 4.28 4.33 4.20 4.22 4.17 4.08 Mexico 150.84 159.32 172.31 181.88 178.92 186.17 191.92 Netherlands 75.71 79.07 76.83 79.55 83.43 77.42 78.22 New Zealand 17.12 17.39 16.97 17.41 18.29 18.17 18.57 Norway 24.91 26.43 27.13 29.81 32.34 28.14 29.82 Poland 88.86 91.37 97.24 97.89 101.54 101.31 96.54 Portugal 25.82 25.83 24.70 24.43 23.54 23.08 21.95 Slovak Republic 18.73 18.35 18.64 18.32 17.83 17.35 16.68 Slovenia 6.83 7.13 7.32 7.74 7.23 7.25 7.14 Spain 128.76 139.03 141.75 139.01 127.75 125.57 124.68 Sweden 51.78 52.59 50.21 49.60 51.32 49.04 48.88 Switzerland 25.89 26.09 27.08 26.77 26.20 25.37 25.50 Turkey 74.25 80.86 93.03 98.50 105.13 112.46 115.70 United Kingdom 218.31 221.56 218.96 208.21 201.83 188.07 192.38 United States 2 255.96 2 307.82 2 296.69 2 277.03 2 215.50 2 191.19 2 132.45 China 1 267.03 1 652.66 1 952.27 2 134.95 2 530.57 2 742.62 - Brazil 195.76 210.04 222.82 248.59 265.89 270.03 - India 477.54 519.17 567.18 632.96 723.74 749.45 - Indonesia 164.88 176.24 183.73 186.61 211.30 209.01 - Malaysia 51.01 58.69 63.72 73.01 72.65 75.91 - Philippines 38.77 38.64 38.46 40.01 40.51 40.45 - Russian Federation 623.10 647.39 670.67 688.48 702.29 730.97 - Singapore 21.01 30.85 23.51 25.16 34.28 33.45 - South Africa 109.91 128.72 127.26 146.77 142.29 141.37 - Thailand 82.26 96.29 101.04 107.66 117.43 119.15 - Vietnam 33.44 38.97 42.48 48.98 58.91 61.21 - IEA 5 100.38 5 257.99 5 266.96 5 219.01 5 155.03 5 043.20 4 970.33 World 10 362.30 11 246.26 11 840.89 12 279.70 12 904.82 13 113.38 - EU 27 1 719.88 1 775.08 1 778.63 1 750.07 1 715.73 1 654.01 -
* The statistical data for Israel are supplied by and under the responsibility of the relevant Israeli authorities. The use of such data by the OECD and/or the IEA is without prejudice to the status of the Golan Heights, East Jerusalem and Israeli settlements in the West Bank under the terms of international law.
Note: values for 2012 are estimates.
© O
EC
D/IE
A, 2
013

ANNEX : COUNTRY-LEVEL ENERGY USE AND INTENSITY DATA
ENERGY EFFICIENCY MARKET REPORT 2013 263
Table A.2 Total final consumption (TFC) by country (million tonnes of oil equivalent ([Mtoe])
2002 2004 2006 2008 2010 2011 2012
Australia 69.74 72.46 72.90 76.10 76.32 77.85 - Austria 25.12 26.96 27.65 27.38 28.11 26.80 - Belgium 40.24 41.93 40.83 42.50 42.20 42.64 - Canada 189.04 201.55 196.70 200.13 199.15 203.98 - Chile 20.66 21.66 22.88 22.60 23.84 25.18 - Czech Republic 25.51 27.65 28.02 27.19 27.03 25.96 - Denmark 14.36 14.84 15.08 14.89 14.89 14.09 - Estonia 2.73 2.97 3.01 3.18 2.91 2.85 - Finland 25.66 26.32 26.69 26.06 26.81 25.19 - France 164.92 169.85 167.50 165.46 162.70 152.20 - Germany 231.89 238.83 241.46 229.95 229.91 221.02 - Greece 19.50 20.39 21.38 21.19 19.44 19.00 - Hungary 18.04 18.64 19.67 18.58 18.12 17.70 - Iceland 2.25 2.26 2.39 2.92 2.94 2.96 - Ireland 11.06 11.46 12.73 12.54 11.34 10.44 - Israel 11.53 12.66 12.47 13.86 14.84 14.08 - Italy 131.10 137.00 136.95 132.33 129.77 126.75 - Japan 343.58 345.31 344.03 318.02 323.15 314.47 - Korea 135.39 138.46 142.11 146.88 157.66 161.04 - Luxembourg 3.36 3.96 3.99 3.93 3.89 3.89 - Mexico 97.90 102.88 109.93 115.07 113.61 116.07 - Netherlands 57.39 59.95 57.66 62.87 64.77 59.63 - New Zealand 13.49 13.21 12.66 12.68 12.81 12.66 - Norway 19.98 20.49 20.41 20.96 21.35 20.29 - Poland 56.78 60.75 64.39 65.62 69.91 68.31 - Portugal 19.96 20.42 19.71 19.52 18.94 18.12 - Slovak Republic 11.92 11.29 11.39 11.82 11.44 10.97 - Slovenia 4.75 5.08 5.24 5.50 5.12 5.04 - Spain 90.92 99.36 99.31 97.95 92.19 88.60 - Sweden 35.53 34.76 34.23 33.25 35.28 32.73 - Switzerland 19.64 20.40 20.54 20.62 21.04 19.45 - Turkey 57.24 63.16 72.47 74.38 77.61 81.46 - United Kingdom 147.37 149.92 145.72 141.58 137.41 126.30 - United States 1 532.64 1 577.26 1 563.66 1 538.38 1 518.83 1 503.71 - China 863.08 1 078.18 1 251.93 1 377.40 1 536.04 1 643.34 - Brazil 157.75 168.77 177.41 194.71 210.90 217.89 - India 329.10 349.68 383.67 418.49 474.55 492.51 - Indonesia 123.75 132.88 139.43 139.69 156.11 158.30 - Malaysia 32.85 36.62 39.31 44.33 43.33 44.94 - Philippines 23.57 23.70 22.20 22.42 23.83 23.72 - Russian Federation 408.26 419.90 423.72 434.07 440.67 458.57 - Singapore 11.21 15.75 17.63 18.92 24.14 24.32 - South Africa 58.35 62.64 63.09 69.31 67.98 71.13 - Thailand 58.72 69.14 71.59 73.83 84.97 88.38 - Vietnam 28.63 33.45 35.85 41.53 48.73 51.31 - IEA 3 511.36 3 626.59 3 619.81 3 562.77 3 552.07 3 485.25 - World 7 232.12 7 774.29 8 150.10 8 436.64 8 771.80 8 917.53 - EU 27 1 181.36 1 228.66 1 231.27 1 212.86 1 196.38 1 143.54 -
© O
EC
D/IE
A, 2
013

ANNEX : COUNTRY-LEVEL ENERGY USE AND INTENSITY DATA
264 ENERGY EFFICIENCY MARKET REPORT 2013
Table A.3 TPES/GDP PPP by country (toe per thousand 2005 USD)
2002 2004 2006 2008 2010 2011 2012
Australia 0.1691 0.162 0.1546 0.1562 0.1493 0.1449 0.1633 Austria 0.1166 0.121 0.1178 0.1112 0.1155 0.1085 0.1073 Belgium 0.177 0.1777 0.1678 0.1629 0.17 0.1621 0.1574 Canada 0.2373 0.2435 0.2305 0.221 0.2088 0.2043 0.2012 Chile 0.1463 0.1415 0.1352 0.1279 0.1243 0.1273 0.1175 Czech Republic 0.2267 0.2232 0.1971 0.1767 0.1773 0.1717 0.1714 Denmark 0.1111 0.1106 0.1089 0.1024 0.1075 0.0991 0.0943 Estonia 0.2639 0.2581 0.2054 0.2153 0.2482 0.2306 0.2281 Finland 0.2363 0.2371 0.222 0.1986 0.2169 0.2013 0.1944 France 0.1479 0.1476 0.1399 0.1359 0.136 0.1291 0.1285 Germany 0.1339 0.1337 0.128 0.1205 0.1201 0.1102 0.108 Greece 0.1185 0.1124 0.106 0.1032 0.1018 0.106 0.1101 Hungary 0.1692 0.1588 0.1536 0.1473 0.1512 0.1447 0.1386 Iceland 0.3758 0.3488 0.3837 0.4605 0.5154 0.5347 0.5527 Ireland 0.1044 0.0936 0.0859 0.0849 0.0863 0.0791 0.0792 Israel 0.1301 0.1251 0.1193 0.1214 0.1161 0.1112 0.1117 Italy 0.1068 0.1108 0.1073 0.1034 0.104 0.1019 0.0989 Japan 0.1384 0.1361 0.1314 0.1238 0.1262 0.1174 0.1126 Korea 0.2025 0.1974 0.1852 0.183 0.189 0.19 0.188 Luxembourg 0.1282 0.1419 0.1299 0.1192 0.1212 0.1178 0.1149 Mexico 0.1271 0.1272 0.1268 0.1279 0.1271 0.1272 0.1262 Netherlands 0.1383 0.1408 0.1297 0.1269 0.136 0.1249 0.1275 New Zealand 0.1816 0.1716 0.1595 0.161 0.1671 0.1643 0.163 Norway 0.1218 0.1232 0.1204 0.1288 0.1414 0.1216 0.1249 Poland 0.1915 0.18 0.174 0.156 0.1533 0.1464 0.1369 Portugal 0.1162 0.1155 0.108 0.1044 0.1016 0.1012 0.0994 Slovak Republic 0.2524 0.2246 0.1975 0.1661 0.1629 0.1535 0.1447 Slovenia 0.1626 0.1579 0.1473 0.1408 0.141 0.1405 0.1418 Spain 0.1194 0.1211 0.1146 0.1076 0.1031 0.1009 0.1016 Sweden 0.193 0.1837 0.163 0.1568 0.1603 0.1478 0.146 Switzerland 0.0991 0.0975 0.095 0.0885 0.0857 0.0814 0.081 Turkey 0.1186 0.1122 0.1114 0.112 0.115 0.1131 0.1138 United Kingdom 0.1208 0.1147 0.1075 0.0996 0.0988 0.0912 0.093 United States 0.1964 0.1893 0.1781 0.1739 0.1705 0.1657 0.1577 China 0.3027 0.3272 0.3093 0.2718 0.2685 0.2666 - Brazil 0.1364 0.1369 0.1354 0.1354 0.1351 0.1336 - India 0.2413 0.2253 0.2062 0.2017 0.1945 0.1885 - Indonesia 0.2720 0.2642 0.2470 0.2225 0.2267 0.2107 - Malaysia 0.1936 0.1972 0.1925 0.1979 0.1866 0.1856 - Philippines 0.1743 0.1551 0.1400 0.1312 0.1220 0.1172 - Russian Federation 0.4492 0.4059 0.3655 0.3284 0.3483 0.3475 - Singapore 0.1330 0.1711 0.1117 0.1080 0.1294 0.1204 - South Africa 0.3069 0.3340 0.2970 0.3132 0.2997 0.2888 - Thailand 0.2202 0.2262 0.2160 0.2137 0.2214 0.2245 - Vietnam 0.2356 0.2373 0.2204 0.2204 0.2357 0.2313 - IEA 0.1643 0.1608 0.1524 0.1469 0.1462 0.1405 0.1371 World 0.2049 0.2049 0.1964 0.1888 0.1904 0.1865 - EU 27 0.1387 0.1372 0.1299 0.1229 0.1233 0.1170 -
Note: values for 2012 are estimates.
© O
EC
D/IE
A, 2
013

ANNEX : COUNTRY-LEVEL ENERGY USE AND INTENSITY DATA
ENERGY EFFICIENCY MARKET REPORT 2013 265
Table A.4 TPES/population by country (toe per capita)
2002 2004 2006 2008 2010 2011 2012
Australia 5.5373 5.5652 5.511 5.6387 5.4627 5.399 5.7913 Austria 3.7673 4.0017 4.088 4.0237 4.0806 3.921 3.9134 Belgium 5.4574 5.6538 5.5118 5.4725 5.5952 5.383 5.1895 Canada 7.9167 8.3785 8.2362 7.9451 7.3549 7.3035 7.2584 Chile 1.6238 1.7097 1.7956 1.8081 1.8088 1.9443 1.8757 Czech Republic 4.1697 4.4588 4.4711 4.302 4.1878 4.1373 4.0753 Denmark 3.5349 3.5958 3.7248 3.4959 3.4813 3.2317 3.05 Estonia 3.4627 3.9096 3.7456 4.057 4.155 4.1813 4.2691 Finland 6.6947 7.1003 7.0896 6.6412 6.7927 6.4506 6.1877 France 4.2396 4.317 4.2086 4.129 4.0314 3.8828 3.8571 Germany 4.1046 4.1294 4.1339 4.0749 4.0335 3.8123 3.7653 Greece 2.5774 2.6855 2.7108 2.707 2.4421 2.3628 2.2938 Hungary 2.5201 2.588 2.7137 2.6358 2.5667 2.5034 2.3643 Iceland 11.4049 11.4952 13.6804 16.7846 16.8847 17.9652 18.876 Ireland 3.7318 3.5086 3.4209 3.3147 3.1183 2.8875 2.9103 Israel 2.8554 2.8167 2.8778 3.1142 3.0432 2.9951 3.0446 Italy 3.0162 3.1283 3.0849 2.9416 2.8147 2.757 2.6249 Japan 4.0062 4.0904 4.0661 3.8685 3.8978 3.61 3.548 Korea 4.1717 4.3357 4.4158 4.6364 5.059 5.2319 5.2643 Luxembourg 8.1558 9.33 9.1522 8.5972 8.3071 8.0358 7.6977 Mexico 1.4967 1.5485 1.645 1.7066 1.6522 1.7046 1.7423 Netherlands 4.6885 4.8584 4.7017 4.8388 5.022 4.6378 4.6693 New Zealand 4.3122 4.241 4.0413 4.0674 4.1742 4.1149 4.1704 Norway 5.4884 5.7576 5.8204 6.2498 6.6145 5.6808 5.9423 Poland 2.3241 2.3932 2.5501 2.5683 2.6362 2.6297 2.511 Portugal 2.4907 2.4596 2.3336 2.3 2.2131 2.1673 2.063 Slovak Republic 3.4825 3.4101 3.4577 3.389 3.2832 3.1885 3.0559 Slovenia 3.4236 3.5711 3.646 3.8279 3.5287 3.5308 3.4725 Spain 3.1165 3.2566 3.2166 3.049 2.7727 2.7224 2.7058 Sweden 5.8021 5.847 5.5288 5.3797 5.4713 5.1899 5.1282 Switzerland 3.5256 3.5002 3.5836 3.4721 3.3648 3.2247 3.2172 Turkey 1.1248 1.1939 1.3407 1.3855 1.4401 1.5207 1.5432 United Kingdom 3.6802 3.7024 3.6142 3.3911 3.2416 2.9979 3.0432 United States 7.8344 7.8695 7.6859 7.4769 7.152 7.0222 6.768 China 0.9844 1.2685 1.4814 1.6033 1.8816 2.0298 - Brazil 1.0919 1.1423 1.1855 1.2978 1.3639 1.3731 - India 0.4386 0.4623 0.4902 0.5315 0.5910 0.6037 - Indonesia 0.7528 0.7847 0.7991 0.7942 0.8809 0.8625 - Malaysia 2.0807 2.2935 2.3966 2.6546 2.5578 2.6303 - Philippines 0.4808 0.4604 0.4414 0.4437 0.4344 0.4265 - Russian Federation 4.2884 4.5005 4.7065 4.8502 4.9485 5.1502 - Singapore 5.0299 7.4022 5.3417 5.1998 6.7520 6.4520 - South Africa 2.4138 2.7584 2.6657 3.0276 2.7378 2.7946 - Thailand 1.2725 1.4576 1.5019 1.5770 1.6989 1.7139 - Vietnam 0.4204 0.4785 0.5098 0.5755 0.6777 0.6968 - IEA 4.8967 4.9827 4.9274 4.8152 4.6999 4.5741 4.4886 World 1.6548 1.7532 1.8028 1.8264 1.8757 1.8846 - EU 3.5419 3.6237 3.5996 3.5089 3.4170 3.2859 -
Note: values for 2012 are estimates.
© O
EC
D/IE
A, 2
013

ANNEX : COUNTRY-LEVEL ENERGY USE AND INTENSITY DATA
266 ENERGY EFFICIENCY MARKET REPORT 2013
Table A.5 Electricity consumption by country (Mtoe)
2002 2004 2006 2008 2010 2011 2012
Australia 16.44 16.28 16.57 17.40 17.98 18.14 - Austria 4.63 4.88 5.24 5.27 5.27 5.29 - Belgium 6.75 6.93 7.10 7.11 7.16 6.89 - Canada 42.09 43.59 42.70 42.98 43.51 44.62 - Chile 3.52 4.05 4.37 4.60 4.71 4.98 - Czech Republic 4.37 4.63 4.90 4.99 4.92 4.87 - Denmark 2.80 2.84 2.91 2.85 2.76 2.70 - Estonia 0.46 0.51 0.56 0.60 0.59 0.57 - Finland 6.85 7.15 7.40 7.10 7.18 6.90 - France 33.84 36.13 36.72 37.22 38.19 36.10 - Germany 43.73 44.69 45.22 45.20 45.49 44.85 - Greece 4.01 4.28 4.52 4.87 4.57 4.45 - Hungary 2.71 2.74 2.86 2.95 2.94 2.97 - Iceland 0.65 0.67 0.77 1.31 1.35 1.38 - Ireland 1.87 1.98 2.23 2.29 2.19 2.14 - Israel 3.31 3.52 3.78 4.11 4.19 4.21 - Italy 24.32 25.42 26.55 26.60 25.74 25.96 - Japan 81.09 82.77 84.68 82.94 85.98 80.79 - Korea 25.87 29.06 31.94 34.37 38.64 40.47 - Luxembourg 0.51 0.55 0.57 0.57 0.57 0.56 - Mexico 14.41 15.41 16.50 17.40 17.88 19.43 - Netherlands 8.57 9.01 9.12 9.39 9.19 9.24 - New Zealand 3.06 3.22 3.35 3.29 3.36 3.32 - Norway 9.38 9.28 9.24 9.63 9.76 9.06 - Poland 8.39 9.00 9.55 10.12 10.23 10.49 - Portugal 3.57 3.84 4.11 4.16 4.29 4.16 - Slovak Republic 1.96 2.07 2.03 2.13 2.08 2.13 - Slovenia 1.01 1.08 1.13 1.10 1.03 1.08 - Spain 17.67 19.84 21.17 21.94 21.05 20.64 - Sweden 11.26 11.21 11.25 11.06 11.28 10.72 - Switzerland 4.65 4.83 4.97 5.05 5.14 5.04 - Turkey 8.73 10.29 12.16 13.71 14.61 15.80 - United Kingdom 28.67 29.15 29.69 29.40 28.28 27.35 - United States 304.29 311.39 320.18 327.90 326.97 325.93 - China 111.04 151.25 202.80 248.19 300.38 335.79 - Brazil 26.90 29.82 32.28 35.25 37.66 39.28 - India 33.75 38.34 44.95 52.64 61.19 66.53 - Indonesia 7.49 8.61 9.75 11.08 12.73 13.75 - Malaysia 5.92 6.64 7.27 7.99 9.53 9.24 - Philippines 3.32 3.79 3.93 4.23 4.75 4.83 - Russian Federation 53.17 55.52 58.60 62.39 62.50 62.68 - Singapore 2.52 2.65 2.88 3.05 3.53 3.59 - South Africa 15.41 16.19 17.14 17.37 17.41 17.79 - Thailand 8.62 9.89 10.99 11.65 12.84 12.79 - Vietnam 2.59 3.41 4.63 5.83 7.48 7.82 - IEA 712.07 737.05 758.90 772.49 779.34 771.59 - World 1 142.52 1 240.22 1 351.27 1 442.74 1 536.70 1 582.12 - EU 27 224.50 234.99 242.42 244.88 242.70 238.01 -
© O
EC
D/IE
A, 2
013

GLOSSARY
ENERGY EFFICIENCY MARKET REPORT 2013 267
GLOSSARY Definitions Co-generation Co-generation refers to the combined production of heat and power. Demand response Demand response is a mechanism by which the demand side of the electricity system shifts electricity demand over given time periods in response to price changes or other incentives, but does not necessarily reduce overall electrical energy consumption. This can be used to reduce peak demand and increase electricity system flexibility. Energy efficiency Delivery of more services for the same energy inputs or the same level of services for less energy input. Energy service company (ESCO) A natural or legal person that delivers energy services and/or other energy efficiency improvement measures in a user’s facility or premises, and accepts some degree of financial risk in so doing. The payment for the services delivered is based (either wholly or in part) on the achievement of energy efficiency improvements and on the meeting of the other agreed performance criteria. Passenger light-duty vehicles This vehicle category includes all four-wheeled vehicles aimed at the mobility of persons on all types of roads, up to nine persons per vehicle and 3.5t of gross vehicle weight. Smart grids A smart grid is an electricity network that uses digital and other advanced technologies to monitor and manage the transport of electricity from all generation sources to meet the varying electricity demands of end-users. Smart grids co-ordinate the needs and capabilities of all generators, grid operators, end-users and electricity market stakeholders to operate all parts of the system as efficiently as possible, minimising costs and environmental impacts while maximising system reliability, resilience and stability. Smart meter The European Smart Meters Industry Group (ESMG) defines four minimum functionalities of a smart meter: remote reading, two-way communication, support for advanced tariffing and payment systems and remote disablement and enablement of supply. Subsidies Any government action directed primarily at the energy sector that lowers the cost of energy production, raises the price received by energy producers or lowers the price paid by energy consumers.
© O
EC
D/IE
A, 2
013

GLOSSARY
268 ENERGY EFFICIENCY MARKET REPORT 2013
Energy intensity A measure where energy is divided by a physical or economic denominator, e.g. energy use per unit value added or energy use per tonne of cement. Total final consumption (TFC) Total final consumption (TFC) is the sum of consumption by the different end-use sectors. TFC is broken down into energy demand in the following sectors: industry (including manufacturing and mining), transport, buildings (including residential, commercial and services) and other (including agriculture and non-energy use). It excludes international marine and aviation bunkers, except at world level where it is included in the transport sector. Total primary energy supply (TPES) TPES is all energy used in a country is included, including production, imports (minus exports), international marine bunkers. A key difference between TPES and TFC is that TPES includes fuel consumed in the processing of fuel and generation of electricity, plus losses associated with transmission of all on-grid electricity. Scenarios Efficient World Scenario A scenario in the 2012 World Energy Outlook that offers a blueprint to realise the economically viable potential of energy efficiency, including the policies that governments need to enact to lower market barriers, thereby minimising transaction costs and enabling the necessary energy efficiency investments. New Policies Scenario A scenario in the World Energy Outlook which takes account of broad policy commitments and plans that have been announced by countries, including national pledges to reduce greenhouse gas emissions and plans to phase out fossil energy subsidies, even if the measures to implement these commitments have yet to be identified or announced. Regions ASEAN Brunei Darussalam, Cambodia, Indonesia, Laos, Malaysia, Myanmar, Philippines, Singapore, Thailand and Vietnam. Developing countries Non-OECD Asia, Middle East, Africa and Latin America regional groupings. OECD Americas Canada, Chile, Mexico and the United States. OECD Asia Oceania Australia, Israel, Japan, Korea and New Zealand.
© O
EC
D/IE
A, 2
013

GLOSSARY
ENERGY EFFICIENCY MARKET REPORT 2013 269
OECD Europe Austria, Belgium, the Czech Republic, Denmark, Estonia, Finland, France, Germany, Greece, Hungary, Iceland, Ireland, Italy, Luxembourg, the Netherlands, Norway, Poland, Portugal, the Slovak Republic, Slovenia, Spain, Sweden, Switzerland, Turkey and the United Kingdom. OECD OECD Asia Oceania, OECD Americas and OECD Europe regional groupings. China refers to the People’s Republic of China, including Hong Kong. Africa Algeria, Angola, Benin, Botswana, Cameroon, Congo, Democratic Republic of Congo, Côte d’Ivoire, Egypt, Eritrea, Ethiopia, Gabon, Ghana, Kenya, Libya, Morocco, Mozambique, Namibia, Nigeria, Senegal, South Africa, Sudan, United Republic of Tanzania, Togo, Tunisia, Zambia, Zimbabwe and other African countries (Burkina Faso, Burundi, Cape Verde, Central African Republic, Chad, Comoros, Djibouti, Equatorial Guinea, Gambia, Guinea, Guinea-Bissau, Lesotho, Liberia, Madagascar, Malawi, Mali, Mauritania, Mauritius, Niger, Reunion, Rwanda, Sao Tome and Principe, Seychelles, Sierra Leone, Somalia, Swaziland and Uganda). Asia Bangladesh, Brunei Darussalam, Cambodia, Chinese Taipei, India, Indonesia, Democratic People’s Republic of Korea, Laos, Malaysia, Mongolia, Myanmar, Nepal, Pakistan, Philippines, Singapore, Sri Lanka, Thailand, Vietnam and other non-OECD Asian countries (Afghanistan, Bhutan, Cook Islands, East Timor, Fiji, French Polynesia, Kiribati, Laos, Macau, Maldives, Micronesia, New Caledonia, Papua New Guinea, Palau, Samoa, Solomon Islands, Tonga and Vanuatu). Non-OECD Europe and Eurasia Albania, Armenia, Azerbaijan, Belarus, Bosnia and Herzegovina, Bulgaria, Croatia, Cyprus,1 Georgia, Gibraltar, Kazakhstan, Kyrgyzstan, Latvia, Lithuania, Former Yugoslav Republic of Macedonia, Malta, Republic of Moldova, Romania, Russian Federation, Serbia, Tajikistan, Turkmenistan, Ukraine and Uzbekistan. Non-OECD Americas Argentina, Bolivia, Brazil, Colombia, Costa Rica, Cuba, Dominican Republic, Ecuador, El Salvador, Guatemala, Haiti, Honduras, Jamaica, Netherlands Antilles, Nicaragua, Panama, Paraguay, Peru, Trinidad and Tobago, Uruguay, Venezuela, and other Latin American countries (Antigua and Barbuda, Aruba, Bahamas, Barbados, Belize, Bermuda, British Virgin Islands, Cayman Islands, Dominica, Falkland Islands, French Guyana, Grenada, Guadeloupe, Guyana, Martinique, Montserrat, St. Kitts and Nevis, Saint Lucia, Saint Pierre et Miquelon, St. Vincent and the Grenadines, Suriname, and Turks and Caicos Islands). Non-OECD Africa, Asia, China, non-OECD Europe and Eurasia, non-OECD Americas, and the Middle East.
1 1. Footnote by Turkey: The information in this document with reference to “Cyprus” relates to the southern part of the Island. There is no single authority representing both Turkish and Greek Cypriot people on the Island. Turkey recognises the Turkish Republic of Northern Cyprus (TRNC). Until a lasting and equitable solution is found within the context of United Nations, Turkey shall preserve its position concerning the “Cyprus issue”. 2. Footnote by all the European Union Member States of the OECD and the European Union: The Republic of Cyprus is recognised by all members of the United Nations with the exception of Turkey. The information in this document relates to the area under the effective control of the Government of the Republic of Cyprus.
© O
EC
D/IE
A, 2
013

GLOSSARY
270 ENERGY EFFICIENCY MARKET REPORT 2013
Acronyms, abbreviations and units of measure Abbreviations and acronyms A/C air conditioning AC alternating current ACCA accelerated capital cost allowance ACEEE American Council for an Energy Efficiency Economy ADB Asian Development Bank ADEME Agence de l’Environnement et de la Maîtrise de l’Energie AGF United Nations’ High-Level Advisory Group on Climate Change Financing ARRA 2009 American Recovery and Reinvestment Act ASAP Appliance Standards Awareness Project ASHRAE American Society of Heating, Refrigerating and Air-Conditioning Engineers BAT best available technology BAU business-as-usual BBC low-energy consumption buildings (bâtiments basse consommation) BECP Building Energy Codes Program BEE India Bureau of Energy Efficiency BMVBS Federal Ministry for Transport, Building and Urban Development BRICS Brazil Russia India China South Africa CAFE corporate average fuel economy CDC Caisse des dépôts CDM clean development mechanism CEE Certificats d’économie d’énergie CERT Carbon Emissions Reduction Target CESP Community Energy Saving Programme CFLs compact fluorescent lamps CHUEE China Utility-Based Energy Efficiency CIPEC Canadian Industry Program for Energy Conservation CO2 carbon dioxide CONAVI Mexican National Housing Commission CONUEE Mexico National Commission for Energy Efficiency CPI Climate Policy Initiative CRC Carbon Reduction Commitment Energy Efficiency Scheme CRCE Canadian Renewable and Conservation Expenses cumac cumulated and actualised DoE US Department of Energy DSM demand-side management EAS Efficient ASEAN Scenario ECO Energy Companies Obligation Eco-PLS éco-prêt logement social Eco-PTZ éco-prêt à taux zéro EE energy efficiency EEC Energy Efficiency Commitment EECA Energy Efficiency and Conservation Authority EED EU Energy Efficiency Directive EEHP Energy Efficient Homes Package
© O
EC
D/IE
A, 2
013

GLOSSARY
ENERGY EFFICIENCY MARKET REPORT 2013 271
EEO Australia Energy Efficiency Opportunities EERS energy efficiency resource standards EESL Energy Efficiency Services Limited EGAT Electricity Generating Authority of Thailand EISA Energy Independence and Security Act 2007 ELENA European Local Energy Assistance Facility EMS energy management systems EPA US Environmental Protection Agency EPAct 2005 Energy Policy Act of 2005 EPAct Energy Policy Act of 1992 EPBD EU Energy Performance of Buildings Directive EPC energy performance certificate ESCI Energy Sector Carbon Intensity ESCO energy service company ESPCs energy services performance contracts EU-ETS European Union emissions trading system FP7 EU Seventh Framework Programme gCO2/km grams of CO2 per kilometre GDFC Green Deal Finance Company GDP gross domestic product GHG greenhouse gas emissions GIB Green Investment Bank GIZ Deutsche Gesellschaft für Internationale Zusammenarbeit GS general service HGV heavy goods vehicle HID high-intensity discharge HIP Home Insulation Program ICT information and communication technology IDMU Eskom Integrated Demand Management Unit IEA International Energy Agency IECC International Energy Conservation Code IEEJ Japan Institute of Energy Economics INFONAVIT Institute for the National Workers’ Housing Fund IP internet protocol IRR internal rate of return ISO International Standards Organisation KDEDI Kentucky Department for Energy Development and Independence KEMCO Korean Energy Management Corporation km/L kilometres per litre LBNL Lawrence Berkeley National Laboratory LED light emitting diode LFMN Ley Federal sobre Metrología y Normalización LGE/100 km litres of gasoline equivalent per 100 km LNG liquefied natural gas M&V monitoring and verification MEPS minimum energy performance standards
© O
EC
D/IE
A, 2
013

GLOSSARY
272 ENERGY EFFICIENCY MARKET REPORT 2013
MoMo IEA Mobility Model databases MOTIE Ministry of Trade, Industry and Energy Mpg miles per gallon MtCO2 million tonnes of CO2 MUSH municipal, universities, schools and hospitals NAECA National Appliance Energy Conservation Act NAMA Nationally Appropriate Mitigation Action NBI National Business Initiative NDRC China National Development and Reform Commission NERSA National Electricity Regulator of South Africa NHTSA National Highway Traffic Safety Administration NPS New Policies Scenario NRCan National Resources Canada OECD Organisation for Economic Co-operation and Development PAT Perform, Achieve and Trade PEMEX Petróleos Mexicanos PPP purchasing price parity PRGFEE Partial Risk Guarantee Funding for Energy Efficiency PRONASE Mexico National Programme for Sustainable Use of Energy (Programa Nacional para
el Aprovechamiento Sustentable de la Energía PV photovoltaic R&D research and development RGGI Regional Greenhouse Gas Initiative SAVE Sensible Accounting to Value SC super critical SGCC Chinese State Grid Corporation SME small and medium-sized enterprise SOP South Africa Standard Offer Programme TFC total final consumption TPES total primary energy supply UNFCCC United Nations Framework Convention on Climate Change USC ultra super critical VAT value-added tax VCF venture capital fund VNEEP Vietnam Energy Efficiency Plan WUNZ-HS Warm Up New Zealand – Heat Smart Currency codes AUD Australian dollar CAD Canadian dollar CNY Yuan renminbi EUR Euro GBP British pound INR Indian rupee JPY Japanese yen MYR Burmese kyat
© O
EC
D/IE
A, 2
013

GLOSSARY
ENERGY EFFICIENCY MARKET REPORT 2013 273
NZD New Zealand dollar PHP Philippino peso SGD Singapore dollar THB Thai baht USD United States dollar VND Vietnamese dong ZAR South African rand Energy units b/d barrels per day boe barrels of oil-equivalent EJ exajoule (1 joule x 1018) GJ gigajoule (1 joule x 109) GW gigawatt GWh gigawatt hour kWh kilowatt hour MW megawatt MWh megawatt hour MJ megajoule (1 joule x 106) Mtoe million tonnes of oil-equivalent Mtce million tonnes of coal-equivalent (equals 0.7 Mtoe) PJ petajoule (1 joule x 1015) TJ terajoule (1 joule x 1012) tce tons of coal equivalent toe tonne of oil equivalent TWh terawatt hour
© O
EC
D/IE
A, 2
013

© O
EC
D/IE
A, 2
013

International Energy Agency • 9 rue de la Fédération • 75739 Paris Cedex 15, France
Buy IEA publications online:
www.iea.org/books
PDF versions available at 20% discount
A number of books printed before January 2012
are now available free of charge in pdf format
on our website
Onlinebookshop
Tel: +33 (0)1 40 57 66 90
E-mail: [email protected]
© O
EC
D/IE
A, 2
013

This publication reflects the views of the International Energy Agency (IEA) Secretariat but does not necessarily reflect those of individual IEA member countries. The IEA makes no representation or
warranty, express or implied, in respect to the publication’s contents (including its completeness or accuracy) and shall not be responsible for any use of, or reliance on, the publication.
This document and any map included herein are without prejudice to the status of or sovereignty over any territory, to the delimitation of international frontiers and boundaries and to the name of
any territory, city or area.
IEA Publications, 9, rue de la Fédération, 75739 Paris cedex 15
Printed in France by IEA, October 2013 (612013111P1) ISBN 9789264191228
Cover design: IEA. Photo credits: ©thermalcities.com (by thinkofthefuture.com). The thermogram was taken with a FLIR P640 infrared camera, during the winter sales, from the roof of Centre Point
Tower at London's Tottenham Court Road junction with Oxford Street.
© O
EC
D/IE
A, 2
013