Energy Efficiency Developments and Potential Energy ... · energy efficiency developments and...
106
ENERGY EFFICIENCY DEVELOPMENTS AND POTENTIAL ENERGY SAVINGS IN THE GREATER MEKONG SUBREGION
Transcript of Energy Efficiency Developments and Potential Energy ... · energy efficiency developments and...
ASIAN DEVELOPMENT BANK
ASIAN DEVELOPMENT BANK6 ADB Avenue, Mandaluyong City1550 Metro Manila, Philippineswww.adb.org
ENERG
Y EFFICIENCY D
EVELOPM
ENTS A
ND
POTEN
TIAL EN
ERGY SAVIN
GS IN
THE G
REATER MEKO
NG
SUBREG
ION
Energy Efficiency Developments and Potential Energy Savings in the Greater Mekong Subregion
This report was produced under the technical assistance project Promoting Renewable Energy, Clean Fuels, and Energy Efficiency in the Greater Mekong Subregion (TA 7679). It reports on energy efficiency targets and developments in five countries in the Greater Mekong Subregion (GMS): Cambodia, the Lao People’s Democratic Republic, Myanmar, Thailand, and Viet Nam. The GMS countries envisage substantial energy efficiency savings over the next 15 to 20 years, with overall energy efficiency savings amounting to almost 60 million tons of oil equivalent annually by 2030. Most GMS governments have established plans for reaching these targets and have implemented policy, regulatory, and program measures to lower energy intensity and achieve energy efficiency. GMS countries project that their energy needs will double or triple over the next 15 years and greater energy efficiency offers a win–win public–private sector partnership for reducing unsustainable reliance on high-carbon (coal and oil) fuels.
About the Asian Development Bank
ADB’s vision is an Asia and Pacific region free of poverty. Its mission is to help its developing member countries reduce poverty and improve the quality of life of their people. Despite the region’s many successes, it remains home to the majority of the world’s poor. ADB is committed to reducing poverty through inclusive economic growth, environmentally sustainable growth, and regional integration.
Based in Manila, ADB is owned by 67 members, including 48 from the region. Its main instruments for helping its developing member countries are policy dialogue, loans, equity investments, guarantees, grants, and technical assistance.
ENERGY EFFICIENCY DEVELOPMENTS AND POTENTIAL ENERGY SAVINGS IN THE GREATER MEKONG SUBREGION


ENERGY EFFICIENCY DEVELOPMENTS AND POTENTIAL ENERGY SAVINGS IN THE GREATER MEKONG SUBREGION
© 2015 Asian Development Bank
All rights reserved. Published in 2015.Printed in the Philippines.
ISBN 978-92-9254-829-2 (Print), 978-92-9254-830-8 (e-ISBN)Publication Stock No. RPT146840-2
Cataloguing-in-Publication Data
Asian Development Bank. Energy efficiency developments and potential energy savings in the Greater Mekong Subregion.Mandaluyong City, Philippines: Asian Development Bank, 2015.
1. Energy efficiency. 2. Energy savings. 3. Greater Mekong Subregion. I. Asian Development Bank.
The views expressed in this publication are those of the authors and do not necessarily reflect the views and policies of the Asian Development Bank (ADB) or its Board of Governors or the governments they represent.
ADB does not guarantee the accuracy of the data included in this publication and accepts no responsibility for any consequence of their use.
By making any designation of or reference to a particular territory or geographic area, or by using the term “country” in this document, ADB does not intend to make any judgments as to the legal or other status of any territory or area.
ADB encourages printing or copying information exclusively for personal and noncommercial use with proper acknowledgment of ADB. Users are restricted from reselling, redistributing, or creating derivative works for commercial purposes without the express, written consent of ADB.
Note: In this report, “$” refers to US dollars, B is baht, and € is euro.
Asian Development Bank6 ADB Avenue, Mandaluyong City1550 Metro Manila, PhilippinesTel +63 2 632 4444Fax +63 2 636 2444www.adb.org
For orders, please contact:Public Information CenterFax +63 2 636 [email protected]

iii iii
Contents
Tables and Figures vForeword viiiAcknowledgments xAbbreviations xiExecutive Summary xii
1 Introduction 12 Energy Efficiency Defined 23 Energy Efficiency Indicators 44 Types of Energy Efficiency Potential 55 Estimation of Energy Efficiency Potential 6 5.1 3rd ASEAN Energy Outlook 6 5.2 Economic Research Institute for ASEAN and East Asia: Analysis
of Energy Savings Potential in East Asia Region (2011) 7 5.3 Indicative Targets and Projected Energy Savings 7 5.4 Energy Efficiency Policy Frameworks in the Greater Mekong Subregion 86 Energy Efficiency Potential in the Greater Mekong Subregion 10 6.1 Final Energy Demand Under Business-As-Usual Conditions 10 6.2 Estimates of Energy Elasticity 12 6.3 Estimates of Energy Intensity 13 6.4 Estimated Energy Efficiency Savings Under Alternative Policy Scenarios 147 Energy Efficiency Development in Cambodia 16 7.1 Institutional Framework for the Energy Sector 16 7.2 Energy Efficiency Performance Targets 17 7.3 Energy Demand Forecast 19 7.4 Energy Efficiency Savings Potential 21 7.5 Final Energy Consumption Savings in the Industry Sector 23 7.6 Final Energy Consumption Savings in the Residential Sector 24 7.7 Energy Efficiency Programs 24 7.8 Summary of Energy Efficiency Savings Potential 268 Energy Efficiency Development in the Lao People’s Democratic Republic 27 8.1 Institutional Framework for the Energy Sector 27 8.2 Energy Efficiency Initiatives 29 8.3 Energy Demand Forecast 30 8.4 Energy Efficiency Savings Potential 33 8.5 Summary of Energy Efficiency Savings Potential 34

iv
Contents
iv
9 Energy Efficiency Development in Myanmar 36 9.1 Institutional Framework for the Energy Sector 36 9.2 Evolving Energy Efficiency Policy Framework 37 9.3 Energy Efficiency Performance Targets 38 9.4 Energy Demand Forecast 38 9.5 Energy Efficiency Indicators 40 9.6 Energy Efficiency Savings Potential 41 9.7 Summary of Energy Efficiency Savings Developments and Potential 4210 Energy Efficiency Development in Thailand 43 10.1 Institutional Framework for the Energy Sector 43 10.2 Energy Efficiency Policy Framework 44 10.3 Energy Efficiency Performance Targets 45 10.4 Energy Demand Forecast 46 10.5 Energy Efficiency Savings Potential 48 10.6 Energy Efficiency Programs and Incentives 55 10.7 Summary of Energy Efficiency Developments and Potential 5611 Energy Efficiency Development in Viet Nam 57 11.1 Institutional Framework for the Energy Sector 57 11.2 Energy Efficiency Performance Targets and Policy Framework 59 11.3 Energy Demand Forecast 61 11.4 Energy Efficiency Savings Potential 64 11.5 Energy Efficiency Programs 68 11.6 Summary of Energy Efficiency Developments and Potential 7012 Conclusions: Collective Energy Efficiency Savings Potential in the GMS
and Scope for Regional Development 72
References 77
Statistical Annexes1. Final Energy Demand: Greater Mekong Subregion 812. Comparison of Regional Macroeconomic Indicators: Greater Mekong Subregion 823. Energy Elasticity: Greater Mekong Subregion 834. Energy Intensity Comparison: Greater Mekong Subregion 845. Energy Efficiency by Industry: Viet Nam 856. Residential Energy Consumption: Viet Nam 86
v
v
Tables and Figures
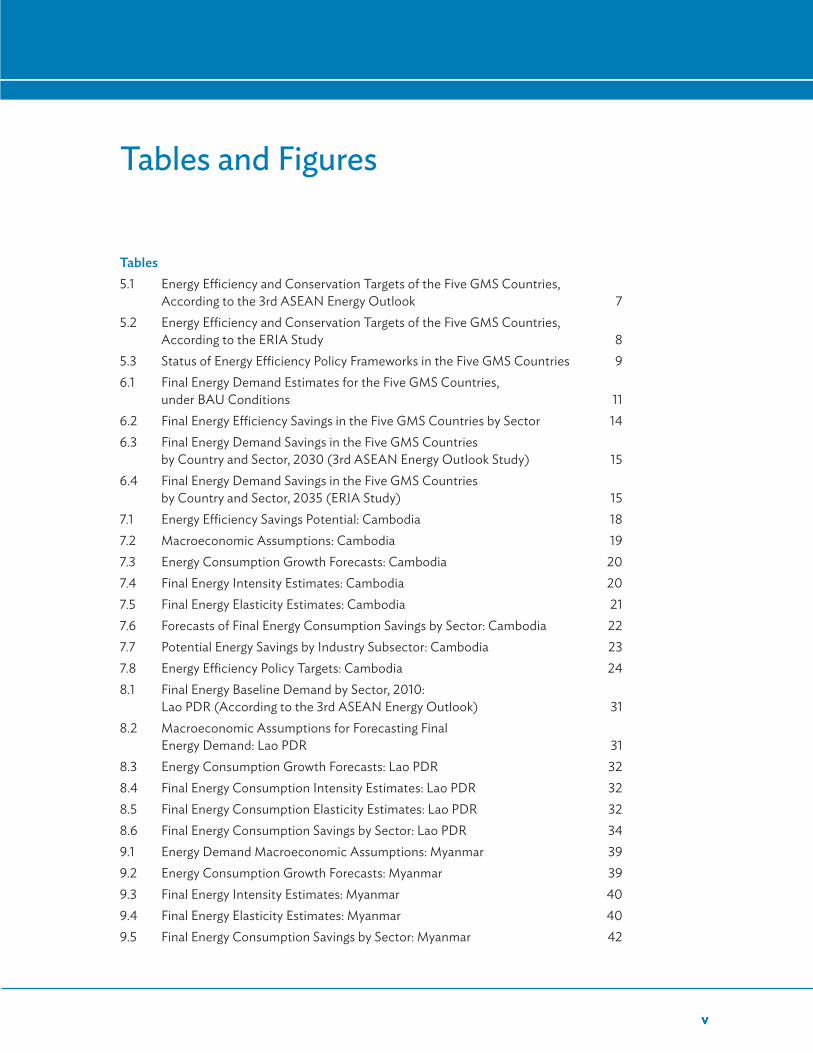
Tables5.1 Energy Efficiency and Conservation Targets of the Five GMS Countries,
According to the 3rd ASEAN Energy Outlook 75.2 Energy Efficiency and Conservation Targets of the Five GMS Countries,
According to the ERIA Study 85.3 Status of Energy Efficiency Policy Frameworks in the Five GMS Countries 96.1 Final Energy Demand Estimates for the Five GMS Countries,
under BAU Conditions 116.2 Final Energy Efficiency Savings in the Five GMS Countries by Sector 146.3 Final Energy Demand Savings in the Five GMS Countries
by Country and Sector, 2030 (3rd ASEAN Energy Outlook Study) 156.4 Final Energy Demand Savings in the Five GMS Countries
by Country and Sector, 2035 (ERIA Study) 157.1 Energy Efficiency Savings Potential: Cambodia 187.2 Macroeconomic Assumptions: Cambodia 197.3 Energy Consumption Growth Forecasts: Cambodia 207.4 Final Energy Intensity Estimates: Cambodia 207.5 Final Energy Elasticity Estimates: Cambodia 217.6 Forecasts of Final Energy Consumption Savings by Sector: Cambodia 227.7 Potential Energy Savings by Industry Subsector: Cambodia 237.8 Energy Efficiency Policy Targets: Cambodia 248.1 Final Energy Baseline Demand by Sector, 2010:
Lao PDR (According to the 3rd ASEAN Energy Outlook) 318.2 Macroeconomic Assumptions for Forecasting Final
Energy Demand: Lao PDR 318.3 Energy Consumption Growth Forecasts: Lao PDR 328.4 Final Energy Consumption Intensity Estimates: Lao PDR 328.5 Final Energy Consumption Elasticity Estimates: Lao PDR 328.6 Final Energy Consumption Savings by Sector: Lao PDR 349.1 Energy Demand Macroeconomic Assumptions: Myanmar 399.2 Energy Consumption Growth Forecasts: Myanmar 399.3 Final Energy Intensity Estimates: Myanmar 409.4 Final Energy Elasticity Estimates: Myanmar 409.5 Final Energy Consumption Savings by Sector: Myanmar 42

vi
Tables and Figures
vi
10.1 Macroeconomic Assumptions: Thailand 4710.2 Energy Consumption Growth Forecasts: Thailand 48
10.3 Final Energy Intensity Estimates: Thailand 4810.4 Final Energy Elasticity Estimates: Thailand 4910.5 Energy Efficiency Indicators: Thailand 4910.6 Estimates of Final Energy Consumption Savings by Sector: Thailand 5010.7 Comparison of Estimates of Final Energy Savings: Thailand 5110.8 Energy Savings Potential by Sector: Thailand 5210.9 Energy Consumption and Savings Potential
by Industrial Cluster, 2009: Thailand 5310.10 Electricity Savings Potential by Building Type: Thailand 5410.11 Residential Electricity Savings Potential: Thailand 5411.1 Macroeconomic Assumptions: Viet Nam 6211.2 Energy Consumption Growth Forecasts: Viet Nam 6211.3 Final Energy Intensity Estimates: Viet Nam 6311.4 Primary and Final Energy Elasticity Estimates: Viet Nam 6311.5 Comparison of Energy Demand Forecasts:
Viet Nam (3rd ASEAN Energy Outlook versus Viet Nam Power Development Master Plan) 65
11.6 Final Energy Consumption Savings by Sector: Viet Nam (3rd ASEAN Energy Outlook versus ERIA Study) 66
11.7 National Energy Efficiency Policy Estimates of Potential Energy Savings by Sector: Viet Nam 66
11.8 Energy Intensity and Savings Potential in Major Industries: Viet Nam 6711.9 Industry Energy Savings Potential by Subsector: Viet Nam 6711.10 Residential Energy Savings Potential: Viet Nam 69
Figures2.1 Some Demand-Side Energy Efficiency Measures 36.1 Forecasts of Final Energy Demand in the Five GMS Countries by Sector 116.2 Estimates of Energy Elasticity of GDP in the Five GMS Countries 126.3 Estimates of Final Energy Intensity in the Five GMS Countries 137.1 Projected Energy Demand: Cambodia, 2009–2035 187.2 Baseline Final Energy Demand Estimates: Cambodia 197.3 Estimates of Final Energy Consumption by Sector: Cambodia 228.1 Energy Sector Institutional Framework: Lao PDR 288.2 Baseline Final Energy Demand Estimates: Lao PDR 308.3 Final Energy Consumption by Sector: Lao PDR 339.1 Baseline Estimates of Final Energy Demand: Myanmar 39

vii vii
9.2 Estimates of Final Energy Consumption by Sector: Myanmar 4110.1 Energy Sector Institutional Framework: Thailand 4410.2 Baseline Final Energy Demand Estimates: Thailand 4710.3 Estimates of Final Energy Consumption by Sector: Thailand 5010.4 Final Energy Consumption (Business-As-Usual): Thailand 5111.1 Energy Sector Institutional Framework: Viet Nam 5811.2 Baseline Final Energy Demand Estimates: Viet Nam 6211.3 Estimates of Final Energy Consumption by Sector: Viet Nam 6411.4 Energy Demand Forecasts in the Master Plan
for Power Development: Viet Nam 65
Tables and Figures

viii viii
Foreword
In 2010, the Asian Development Bank (ADB) initiated the regional technical assistance project Promoting Renewable Energy, Clean Fuels, and Energy Efficiency in the Greater Mekong Subregion (GMS), to assist the countries in the GMS—Cambodia, the Lao
People’s Democratic Republic (Lao PDR), Myanmar, Thailand, and Viet Nam (the GMS countries)—in improving their energy supply and security in an environmentally friendly and collaborative manner. The Yunnan Province and Guangxi Zhuang Autonomous Region of the People’s Republic of China, which are also part of GMS, are not included in this study due to difficulties of segregation of national level data. The project was cofinanced by the Asian Clean Energy Fund and the Multi-Donor Clean Energy Fund under the Clean Energy Financing Partnership Facility of ADB.
The study prepared three reports: (i) Renewable Energy Developments and Potential in the Greater Mekong Subregion, (ii) Energy Efficiency Developments and Potential Energy Savings in the Greater Mekong Subregion, and (iii) Business Models to Realize the Potential of Renewable Energy and Energy Efficiency in the Greater Mekong Subregion.
The first report provides estimates of the theoretical and technical potential of selected renewable energy sources (solar, wind, bioenergy) in each of the countries, together with outlines of the policy and regulatory measures that have been introduced by the respective governments to develop this potential. The second report addresses the potential savings for each of the countries from improved energy efficiency and conservation measures. The third report outlines business models that the countries could use to realize their renewable energy and energy efficiency potential, including the deployment of new technologies.
The renewable energy report concludes that, apart from Thailand, the GMS countries are at an early stage in developing their renewable energy resources. To further encourage renewable energy development, the GMS countries should provide support for public and private projects investing in renewable energy. Solar energy is one which is being actively promoted in the region. While the cost of solar power is still high relative to conventional sources, it is a cost competitive alternative in areas that lack access to grid systems. Large-scale solar systems are being developed in Thailand whilst home- and community-based solar systems are increasingly becoming widespread in the GMS. Large-scale development of wind power depends on suitable wind conditions and an extensive and reliable grid system as backup; Viet Nam has the required combination and is gradually developing the potential. Biofuel production raises questions concerning the agriculture–energy nexus, but Cambodia, the Lao PDR, and other GMS countries are striving to reduce their dependence on imported oil and gas by promoting suitable biofuel crops. Biogas production from animal manure has been hampered by the difficulty of feedstock collection and the frequent failure of biodigesters. The gradual move to larger-scale farming techniques and new biodigester technologies has led to expanded biogas programs—especially for off-grid

ix
Foreword
ix
farm communities. The GMS countries have learned that maintenance and technology support is of vital importance in sustaining investments in renewable energy.
The energy efficiency report presents the steps each of the five countries has taken in this regard, noting that much greater gains in energy savings are possible while their efficiency measures are progressive. Most of the GMS countries envisage energy efficiency savings of at least 10% over the next 15–20 years except Thailand which is targeting 20%. Thailand and, to a lesser extent, Viet Nam have advanced policy, institutional, and regulatory frameworks for pursuing their energy efficiency savings targets, while Cambodia, the Lao PDR, and Myanmar are less well structured to reach their goals.
The renewable energy and energy efficiency reports chart a way for the GMS countries to become less dependent on imported fuels and more advanced in developing “green” economies. Global climate change concerns dictate greater attention to renewable energy and energy efficiency. National interests are served by both, offering a win–win outcome from investment in renewable energy and energy efficiency measures. The report on business models indicates ways in which these investments can be made through public–private partnerships, providing a basis for further dialogue among stakeholders.
In collaboration with the governments of Cambodia, the Lao PDR, Myanmar, Thailand, and Viet Nam, ADB has published these reports with the objective of helping to accelerate the development of renewable energy and energy efficiency in the Greater Mekong Subregion.
James A. NugentDirector GeneralSoutheast Asia Department
x x
Acknowledgments
The Asian Development Bank (ADB) carried out the regional technical assistance project in collaboration with the following government agencies: the Ministry of Mines and Energy, Cambodia; the Ministry of Energy and Mines, the Lao People’s
Democratic Republic; the Ministry of Energy, Myanmar; the Department of Alternative Energy Development and Efficiency, Ministry of Energy, Thailand; and the Electricity Regulatory Authority of Viet Nam.
In ADB, Jong-Inn Kim, lead energy specialist, Energy Division, Southeast Asia Department (SERD), initiated the report and gave technical advice. The peer reviewer of this report was Neeraj Jain, senior advisor, Office of the Director General, SERD and Hyunjung Lee, energy economist, Energy Division, SERD. Ma. Trinidad Nieto, associate project analyst, Energy Division, SERD, provided administrative support during the implementation of the technical assistance project. David Husband served as economics editor and Maria Cristina Pascual as publishing coordinator. James Nugent, director general, SERD, and Chong Chi Nai, director, Energy Division, SERD, provided guidance in the preparation of this report.
Lahmeyer International GmbH, headquartered in Germany, was contracted by the Asian Development Bank to assess the low-carbon renewable and energy efficiency potential in five of the Greater Mekong Subregion countries (Cambodia, the Lao PDR, Myanmar, Thailand and Viet Nam). Further, Lahmeyer International lead a series of workshops in the five countries, to share experiences and to advance technical knowledge on the opportunities and challenges. The assessment of renewable and energy efficiency potential in the subregion was based on earlier reports, secondary research, and available data. The assessment included review of business models to operationalize the identified opportunities. Because of changing weather patterns and data uncertainties, Lahmeyer recommends that the research and findings - particularly those pertaining to renewable energy - be used as indicative guidelines rather than as a basis for specific investments.

xi xi
Abbreviations
ACE – ASEAN Centre for EnergyADB – Asian Development BankAEMAS – ASEAN Energy Manager Accreditation SchemeAPS – alternative policy scenarioASEAN – Association of Southeast Asian NationsBAU – business as usualCFL – compact fluorescent lightDEDE – Department of Alternative Energy Development and Efficiency (Thailand)DSM – demand-side managementEAC – Electricity Authority of CambodiaEdL – Electricité du LaosEE – energy efficiencyEE&C – energy efficiency and conservationEEAP – Energy Efficiency Action Plan 2011–2030 (Thailand)EEDP Energy Efficiency Development Plan 2011–2030 (Thailand)EGAT – Electricity Generating Authority of ThailandENCON – Energy Conservation and Promotion Act 1992 (Thailand)ERIA – Economic Research Institute for ASEAN and East AsiaESCO – energy service companyESSPA – Energy Supply and Security Planning in the ASEANGDP – gross domestic productGEF – Global Environment FacilityGMS – Greater Mekong SubregionGWh – gigawatt-hour IEC – International Electrotechnical CommissionIEEJ – Institute of Energy Economics, JapanIPP - independent power producerktoe – kilotons of oil equivalentLao PDR – Lao People’s Democratic RepublicMEM – Ministry of Energy and Mines (Lao PDR) MIME – Ministry of Industry, Mines and Energy (Cambodia)MOE – Ministry of Energy (Myanmar, Thailand)MOIT – Ministry of Industry and Trade (Viet Nam)Mtoe – million tons of oil equivalentPJ – petajoulePPP – public–private partnershipREE – rural energy enterpriseSMEs – small and medium-sized enterprisesVNEEP – Viet Nam National Energy Efficiency Program

xii
Executive Summary
Improvements in energy efficiency are both a smart business investment and an imperative for the global community. Like investment in renewable energy sources (solar, wind, and biomass), investment in energy efficiency presents great opportunities:
more competitive industries through energy cost savings; greater outreach of energy services, to the rural poor, among others, through more efficient generation and supply; and technology and employment gains through international best practices. Most importantly, improved energy efficiency is a vital component of the global strategy to reduce the use of fossil fuels (oil, gas, and coal) and thereby help to reduce greenhouse gas emissions and the threat of climate change.
This report is on energy efficiency targets and developments in five countries in the Greater Mekong Subregion (GMS): Cambodia, the Lao People’s Democratic Republic (Lao PDR), Myanmar, Thailand, and Viet Nam. Although the beneficiary of huge hydropower potential, the region depends extensively on imported fossil fuels and the rural areas are heavily reliant on firewood and charcoal, contributing to deforestation. Further, these GMS countries anticipate a tripling in energy demand over the next 15–20 years. To meet the increased demand, they will need to do more than simply add to energy supplies, domestic and imported. Greatly improved energy efficiency must be an important part of the response.
GMS countries need to mainstream supply- and demand-side energy efficiency measures throughout all sectors of their economies. Supply-side energy savings derive largely from measures taken by public utilities and private sector investors to increase generation efficiency and to reduce transmission and distribution losses. Most demand-side energy savings, on the other hand, arise from investments by industry and commercial users in more efficient production and transportation methods and from greater use of more efficient lighting, heating, and cooling; and other appliances and transport vehicles by households. Economic instruments, notably the pricing of energy according to its market cost of supply, are likely to be the main determinant of whether or not GMS countries reach their targets for energy efficiency savings.
This report’s findings on the potential for energy efficiency savings in the GMS are based on two landmark studies:
• The 3rd Association of Southeast Asian Nations (ASEAN) Energy Outlook (2011), which set energy efficiency targets for various countries, including the five in the GMS that are dealt with in the present report. The study reviewed energy efficiency trends since 1990 and expected developments up to 2020 and 2030. It resulted in two forecasts based on business-as-usual (BAU) conditions and alternative policy scenarios (APSs) for reaching the energy efficiency targets.
xiii
Executive Summary
• The Economic Research Institute for ASEAN and East Asia (ERIA) Analysis of Energy Savings Potential in East Asia Region (2011), which also provided long-run energy efficiency and conservation targets.
The GMS countries envisage substantial energy efficiency savings over the next 15–20 years, with Thailand projected to score the highest savings, ranging from 20% to 40%, in its industry and transport sectors. For Cambodia, the Lao PDR and Myanmar, the residential and commercial sectors are expected to be the major source of savings. For Viet Nam, energy savings are expected to be greatest in the industrial sector. The national energy efficiency action plans of the five countries identify energy efficiency savings potential in the 30%–50% range for energy-intensive industries, such as the glass, cement, and steel industries. Overall energy efficiency savings for the five countries could amount to almost 60 million tons of oil equivalent (Mtoe) yearly by 2030.
Brief highlights of the country chapters follow.
CambodiaThe country’s National Energy Efficiency Policy, Strategy and Action Plan projects energy savings of 20% by 2035, that is, energy demand of 4.8 Mtoe, versus 6.0 Mtoe under BAU conditions. Yearly savings of 1.2 Mtoe would be very significant. The national action plan also forecasts the following: savings of at least 20% in the industry sector (garments), up to 50% in the household sector (household appliances), up to 80% in the energy sector (rural energy enterprises), and ranging from 30% to 50% in biomass energy (improved cook stoves and kilns). It is very much in the interest of the government and the people of Cambodia to ensure that the plan is implemented.
The institutional framework for designing and managing energy efficiency measures must be strengthened. Programs past and current have made contributions to energy efficiency, but these have been modest and far short of what is possible or needed. Cambodia lacks the technical and financial resources necessary to achieve its targeted energy savings and must receive international assistance. Energy is a fundamental building block of development, but climate change and other considerations require its efficient supply and use.
Lao PDRThe Lao PDR is at an early stage of development and implementation of an energy efficiency strategy, although it has issued energy efficiency guidelines for the residential, building, and industry sectors. Various donor-assisted programs have helped introduce energy efficiency measures, including highly practical means for improving efficiency in government buildings and the adoption of International Electrotechnical Commission (IEC) standards for selected electrical products. Public awareness efforts have also been given importance. However, without a strong institutional, policy, and regulatory framework for energy efficiency, Lao PDR has made limited progress.

xiv
Executive Summary
The government has indicated a preliminary energy savings target of 10% by 2025. The 3rd ASEAN Outlook and ERIA studies provide a start in analyzing how this target could be achieved, but a firmer basis is needed for charting an effective course of action. Even so, it is apparent that significant savings are achievable in the Lao PDR’s industrial, residential, and commercial sectors.
MyanmarThe political and economic reforms introduced by the government since 2011 have been transformational and some tentative steps have been taken to improve energy efficiency. However, the necessary legal, regulatory, and overall policy framework is still being drawn up. Currently, seven ministries have roles with respect to the energy sector; the Ministry of Industry is in charge of energy efficiency. The focus is on energy supply management. Much could also be gained from paying greater attention to energy demand management.
Elements of an energy efficiency strategy plan, including energy savings and energy efficiency targets, have been issued by the government. More analysis is needed to validate these targets and to identify how they could be realized effectively. Regional cooperation through the GMS and ASEAN programs will help solve data limitations and share best practices. The potential savings appear to be greatest in the industry sector but could also be substantial in the residential and commercial and transport sectors.
ThailandThailand is well positioned to capitalize on its considerable technical potential for energy efficiency savings. The government’s Energy Efficiency Action Plan 2011–2030 (EEAP) anticipates savings of 25% by 2030. Technology advances during the period up to 2030 are likely to contribute to reaching the target. Still, the target is ambitious and requires multidimensional support measures.
The EEAP and the Energy Efficiency Development Plan 2011–2030 together detail Thailand’s energy efficiency goals, and the regulatory and institutional frameworks to achieve these goals. To make the country less dependent on imported energy, notably oil and gas, and to reduce its greenhouse gas emissions, the government is also looking to increase the use of alternative energy sources (solar, wind, biomass, and minihydropower)—from 12% currently to 25% by 2021. Again, this is an ambitious target. Alternative sources of energy must be developed and used effectively and efficiently. Equally important will be technical and maintenance support for alternative energy investments, especially those made by households and small communities.
Supply-side efficiency is addressed by the private sector and the Electricity Generating Authority of Thailand, in the interest of cost savings and profitability. Demand-side efficiency is more challenging, as it involves society as a whole and individual decision making. Mandatory standards and labeling requirements in Thailand provide inducements to consume less energy; subsidies encourage the use of energy-saving appliances and

xv
Executive Summary
xv
machinery. However, since energy efficiency is both a public and a private good, the responsibility for it has to be shared and undertaken at both the individual and community levels. Thailand’s goal of creating a national conscience of energy saving is a vital step toward inclusive and sustainable growth.
Viet NamThe Viet Nam Power Development Master Plan, approved in 2011, foresees a tripling of energy demand over the next 15–20 years, to about 188 Mtoe by 2030 from about 55 Mtoe currently. The industry and transportation sectors are expected to be the main users. The plan sets realistic targets for energy efficiency savings, projected to amount to about 20 Mtoe a year by 2030. The plan, together with the Viet Nam National Energy Efficiency Program, identifies significant savings in the industrial and residential and commercial sectors, as well as significant improvements in energy efficiency indicators (energy intensity and energy elasticity), resulting from advances in technical standards and high-performance equipment in energy-intensive industries.
The government’s energy efficiency savings targets are achievable but, according to ADB’s Assessment of GMS Energy Sector Development (2013), Viet Nam has made little progress in implementing its Energy Conservation Law (2010) or in achieving greater energy efficiency in the economy. Viet Nam’s institutional capacity needs to be strengthened, together with the commitment of the government, state enterprises, private sector, communities, and individual households to greatly improved energy efficiency. Economic instruments, such as full-cost recovery for energy supply, would be powerful tools for achieving real progress in energy efficiency.
ConclusionThe energy efficiency recommendations of the World Energy Council are as follows:
• Make energy prices reflect real costs.• Keep consumers better informed and address consumer behavior (practices).• Implement innovative financing tools to support consumers’ investments.• Control the quality of energy-efficient equipment and services.• Enforce regulations and strengthen them regularly.• Monitor and evaluate energy efficiency policies to check their impact. • Enhance international and regional cooperation.
These recommendations provide broad guidance for GMS countries, which could result in substantial savings through more efficient use of energy. The welfare gains from such savings would help reduce poverty and contribute to the global objective of reducing the demand for carbon-based fuels. While the national development plans of the five GMS countries already include energy efficiency measures, greater commitment and dedication in the public and private sectors is needed to realize the savings.
xvi
Executive Summary
Together, ADB and the GMS governments are investing in energy efficiency and in renewable energy. ADB is also working closely with the private sector to leverage scarce financial resources in support of energy efficiency and renewable energy. In public–private partnerships (PPPs), public and private interests combine to more closely achieve what is possible and what is needed. As a knowledge bank, ADB is helping to inform key ministries and business and community leaders about international best practices and expertise concerning energy efficiency and renewable energy. As a highly operational bank with substantial technical and investment resources, ADB is helping developing member countries to reach their targets for energy efficiency savings and renewable energy.
This report on energy efficiency savings in the GMS countries gives reason for optimism: the potential for savings is considerable and increasing initiatives to develop that potential are under way. ADB is encouraging the GMS countries to step up their development efforts and has committed itself to helping them to mobilize the expertise and financial resources required. ADB’s support for energy efficiency in the GMS countries will be inclusive, ensuring that the poor benefit and that the private sector is fully engaged in the investment opportunities. ADB will also twin its support for energy efficiency with support for renewable energy.
1
Introduction1
Throughout this study, reference to the Greater Mekong Subregion (GMS) includes Cambodia, the Lao People’s Democratic Republic (Lao PDR), Myanmar, Thailand, and Viet Nam, but not the People’s Republic of China. Clearly, the latter is of a scale
and importance requiring stand-alone analysis.
Cambodia, the Lao PDR, Myanmar, Thailand, and Viet Nam share common energy security and environmental protection goals. While the Lao PDR and Myanmar have extensive hydropower resources under development, the five countries continue to depend heavily on fossil fuels. Further, firewood and charcoal are still primary energy sources in rural areas throughout the GMS. Both forms of dependence run counter to sustainable and inclusive growth, and the need to reduce greenhouse gases and deforestation. In addition, the growing reliance on energy imports—notably for transportation and industry—makes the GMS countries more vulnerable to external energy supply shocks. Compounding the problem, a doubling or tripling (or more) in energy consumption is expected for these countries over the next 15–20 years. In striving to meet the projected increase in energy demand, the GMS countries will need to do more than simply look for energy additions—domestic or imported. Rather, energy efficiency and conservation are increasingly important.
This publication reviews what is meant by energy efficiency and conservation, particularly on the demand side, and examines related energy efficiency indicators. Alternative assumptions for estimating potential energy savings from improved energy efficiency and conservation are outlined, providing different but comparable views for the five subject GMS countries. Relative to business-as-usual (BAU) conditions, the energy-saving goals and energy efficiency policies of the GMS countries support the conclusion that energy demand could be significantly reduced in these countries over the next 15 to 20 years—possibly by more than 20%.
Following a general review of energy efficiency in the GMS, the institutional and policy frameworks for energy efficiency in each of the five countries are reviewed, and each country’s potential energy efficiency savings are estimated. The volume concludes with a discussion of ways to help ensure that the energy efficiency targets of these GMS countries are met.
2
Energy Efficiency Defined2
Energy efficiency means reducing the energy required for a given level of activity—doing more with less. While improvements in transmission lines reduce electricity losses, better demand-side practices help slow the overall consumption of energy.
Energy efficiency measures are often a cost-effective alternative to increasing power supply and energy availability: for example, retrofitting industrial equipment to save a megawatt of power may cost much less than increasing coal-fired generation capacity (ADB 2011b).
A distinction can be made between energy efficiency and energy conservation. Energy efficiency measures, such as optimizing the energy use of computers, printers, photocopiers, and industrial production equipment and machinery, help save energy input while maintaining the same level of output. Switching off lights and appliances when not in use and other energy conservation measures, on the other hand, help reduce the amount of energy used. This publication, however, does not treat energy efficiency and energy conservation measures differently. Both result in energy savings.
Energy efficiency measures taken by many countries have tended to focus on supply-side improvements, in view of the unified ownership or regulation of the supply, transmission, and distribution chain by the public sector. In contrast, efforts to influence the demand side are more challenging, as they must deal with the various considerations that determine how much energy individuals, communities, and industrial users consume. But the importance of demand-side energy efficiency measures is increasingly being recognized, together with the critical influence of electricity tariffs on the effectiveness of such measures. Developing countries typically set electricity tariffs well below full cost recovery, thereby weakening the incentive to conserve energy and to invest in energy efficiency measures.
The following are illustrations of supply-side energy efficiency measures:
• increasing generation efficiency by rehabilitating, replacing, or expanding generation plants; and
• reducing technical losses by rehabilitating, replacing, or expanding transmission lines and networks.
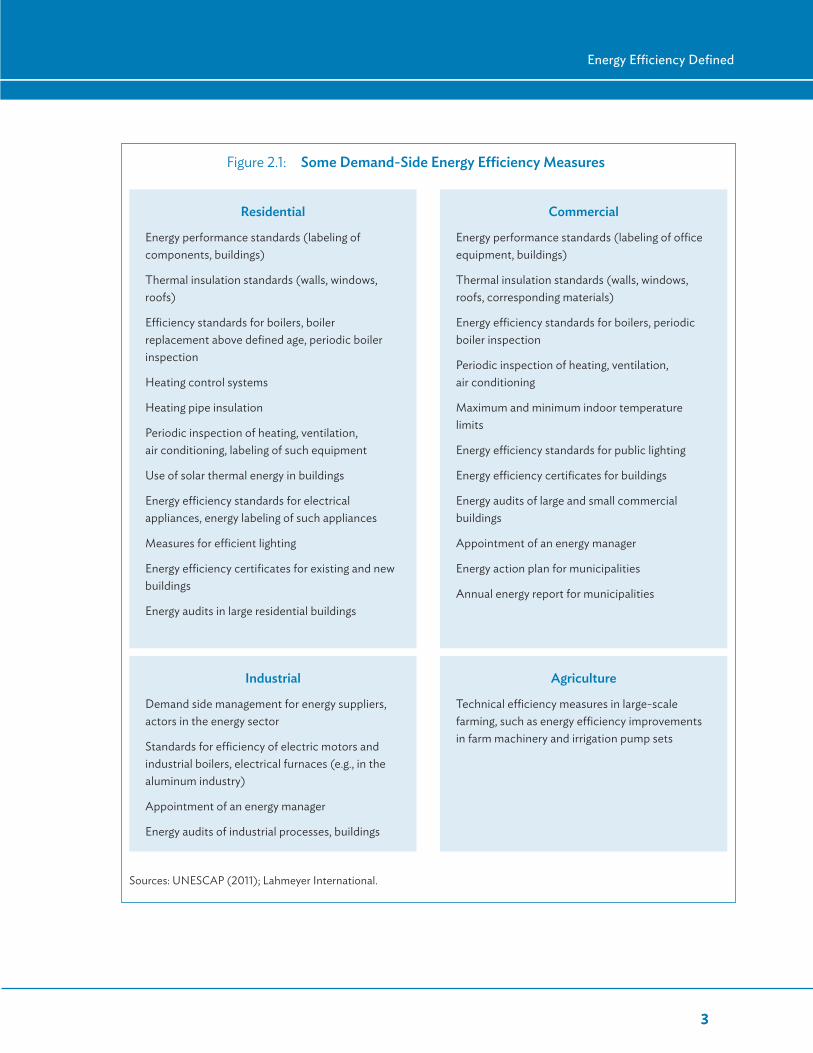
Figure 2.1 lists some demand-side energy efficiency measures. Demand-side economic instruments are just as important, if not more so. In particular, energy prices must reflect the economic cost of supply.
3
Energy Efficiency Defined
3
Figure 2.1: Some Demand-Side Energy Efficiency Measures
Sources: UNESCAP (2011); Lahmeyer International.
Residential
Energy performance standards (labeling of components, buildings)
Thermal insulation standards (walls, windows, roofs)
Efficiency standards for boilers, boiler replacement above defined age, periodic boiler inspection
Heating control systems
Heating pipe insulation
Periodic inspection of heating, ventilation, air conditioning, labeling of such equipment
Use of solar thermal energy in buildings
Energy efficiency standards for electrical appliances, energy labeling of such appliances
Measures for efficient lighting
Energy efficiency certificates for existing and new buildings
Energy audits in large residential buildings
Industrial
Demand side management for energy suppliers, actors in the energy sector
Standards for efficiency of electric motors and industrial boilers, electrical furnaces (e.g., in the aluminum industry)
Appointment of an energy manager
Energy audits of industrial processes, buildings
Agriculture
Technical efficiency measures in large-scale farming, such as energy efficiency improvements in farm machinery and irrigation pump sets
Commercial
Energy performance standards (labeling of office equipment, buildings)
Thermal insulation standards (walls, windows, roofs, corresponding materials)
Energy efficiency standards for boilers, periodic boiler inspection
Periodic inspection of heating, ventilation, air conditioning
Maximum and minimum indoor temperature limits
Energy efficiency standards for public lighting
Energy efficiency certificates for buildings
Energy audits of large and small commercial buildings
Appointment of an energy manager
Energy action plan for municipalities
Annual energy report for municipalities

4
Energy efficiency indicators are used to compare energy use by industries or at the national level. Two common indicators are energy intensity and energy elasticity.
Energy intensity is defined as the ratio of energy consumption per unit of output or activity. This indicator serves as a proxy for energy efficiency in intercountry comparisons of energy performance (UNESCAP 2011). Generally, the more intense the activity, the less energy efficient it is. At the macro level, final energy consumption is divided by gross domestic product (GDP) to arrive at energy intensity. If sector or industry data are available, final energy consumption is divided by gross value added to determine energy intensity, or energy used per unit of product.
Energy intensity at the macro level is influenced by objective and semi-objective factors (UNESCAP 2011). Objective factors include geographic and other physical parameters, as well as demographic characteristics. Large or mountainous countries with dispersed populations require more energy for transport than relatively flat, densely populated countries; other things being equal, the first category of countries will have higher energy intensities. Similarly, countries with cold climates require more energy than countries with warm climates. Semi-objective factors include the structure of the economy and the level of industrial development and per capita income.
Sector shifts influence the energy intensity of a country. Industrialization results in a shift from agriculture to energy-intensive manufacturing, whereas highly developed countries tend to shift to services. When energy intensity is used as a proxy for energy efficiency, international comparisons need to correct for differences in economic structure. The challenge is to identify measures that will help decouple economic growth from growth of energy consumption.
Energy elasticity as an indicator of energy efficiency relates the change in GDP following a change in energy consumption. To calculate it, average annual GDP growth is divided by the average annual growth in energy consumption.
Energy elasticity > 1 = more energy-intense economy
Energy elasticity < 1 = less energy-intense economy
3 Energy Efficiency Indicators
5 5
The decision to install and use energy-efficient lighting or a myriad other energy-saving appliances is based on factors such as public subsidies and current energy costs. Ultimately, the decision rests on whether the expected energy savings, over
the life of the new appliance or equipment, are sufficient to offset the cost of acquiring, installing, and maintaining the appliance or equipment. Electricity tariffs in developing countries often fall far short of their supply costs, thus giving individuals, communities, or industry groups less incentive to adopt energy efficiency measures.
According to the United States Environmental Protection Agency (EPA), there are four types of energy efficiency potential: technical, economic, achievable, and program (EPA 2006).
Technical potential relates to possible energy savings through the immediate implementation of all technically feasible efficiency gains, regardless of engineering or nontechnical constraints, including willingness to pay for such measures. Technical potential is not a static concept, as research and technological advances normally strengthen possible energy savings.
Economic potential is a subset of technical efficiency measures that are economically beneficial to the user. For example, the cost of investing in and maintaining and operating new energy savings equipment should be lower than the costs of continuing with current equipment. Awareness-raising and marketing campaigns may be necessary to promote energy efficiency measures. As noted earlier, electricity tariffs set lower than the cost of generation, transmission, and distribution may adversely affect the economic potential.
Achievable potential represents the demand-side efficiency gains that can be achieved under energy efficiency policies and programs. It may include incentives and subsidies that make a noncost-effective efficiency option cost effective for the user.
Program potential refers to energy savings resulting from the specified program design and funding levels. Program potential may be a subset of achievable potential or similar to it.
4 Types of Energy Efficiency Potential
6
The assessment of energy efficiency potential involves establishing a BAU baseline against which future savings can be estimated. Projections of energy consumption under the BAU scenario assume no change in present energy efficiency measures
or programs. Baseline consumption may be expressed in million tons of oil equivalent (Mtoe), either on a national basis or by economic sector. In forecasting future energy consumption, contributing factors must be considered, including increases in population, GDP, per capita income, and rural electrification.
Two regional studies provide baseline energy forecasts for the GMS countries, together with estimates of possible savings from energy efficiency initiatives:
• 3rd ASEAN Energy Outlook (2011), prepared by the Association of Southeast Asian Nations (ASEAN) Centre for Energy (ACE); the Institute of Energy Economics, Japan (IEEJ); and national Energy Supply and Security Planning in the ASEAN (ESSPA) teams; and
• Analysis of Energy Saving Potential in East Asia Region (2011), prepared by the Economic Research Institute for ASEAN and East Asia (ERIA) and referred to as “the ERIA study” throughout this publication.
These studies use the same basic methodology and both utilize the IEEJ World Energy Outlook Model. However, there are significant differences between the studies regarding past and future energy consumption levels,1 as well as assumptions about economic growth rates. The differences are noted in the individual country sections of this publication. Where available, country-specific studies on energy efficiency supplement information from the two regional studies.
5.1 3rd ASEAN Energy OutlookThe 3rd ASEAN Energy Outlook (2011) is the first comprehensive study in which the ASEAN member countries (including the five GMS countries reviewed here) set their energy efficiency savings targets. These targets have become the foundations for proposed energy efficiency policies and programs. The 3rd ASEAN Energy Outlook study reviews energy efficiency trends since 1990 and expected developments up to 2020 and 2030.
1 The differences in energy consumption between the studies are most likely due to the accounting method used for biomass as a fuel source.
5 Estimation of Energy Efficiency Potential
7
Estimation of Energy Efficiency Potential
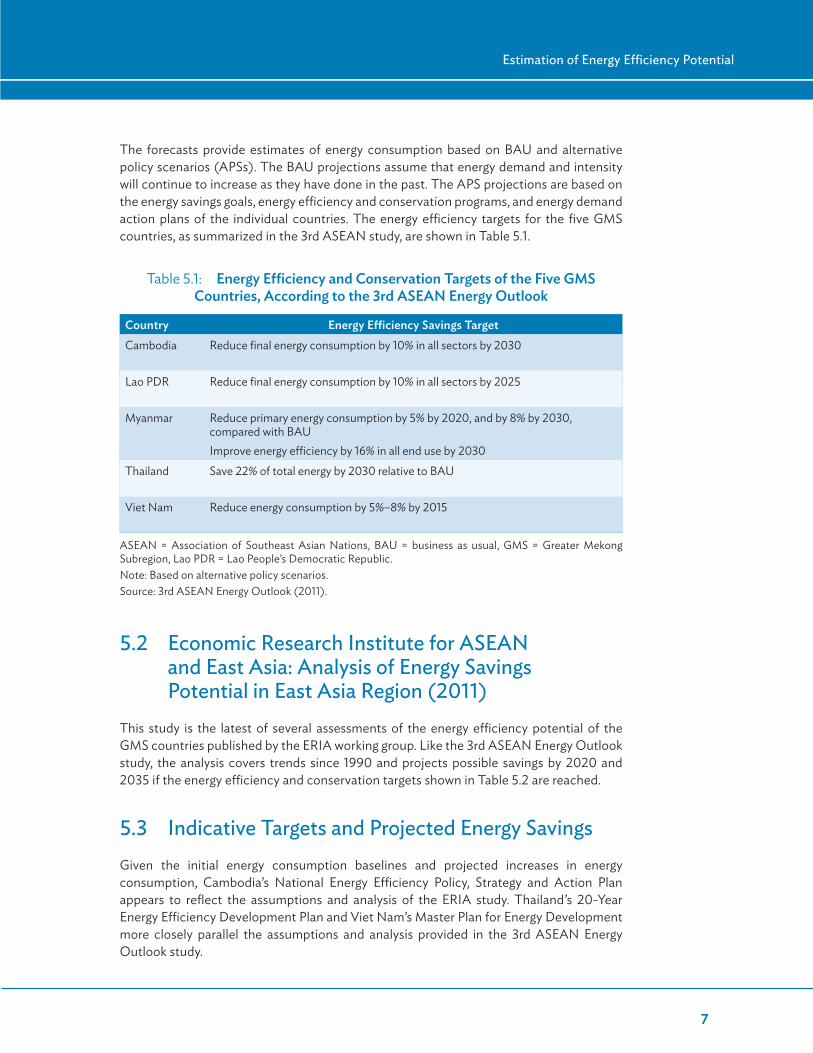
The forecasts provide estimates of energy consumption based on BAU and alternative policy scenarios (APSs). The BAU projections assume that energy demand and intensity will continue to increase as they have done in the past. The APS projections are based on the energy savings goals, energy efficiency and conservation programs, and energy demand action plans of the individual countries. The energy efficiency targets for the five GMS countries, as summarized in the 3rd ASEAN study, are shown in Table 5.1.
5.2 Economic Research Institute for ASEAN and East Asia: Analysis of Energy Savings Potential in East Asia Region (2011)
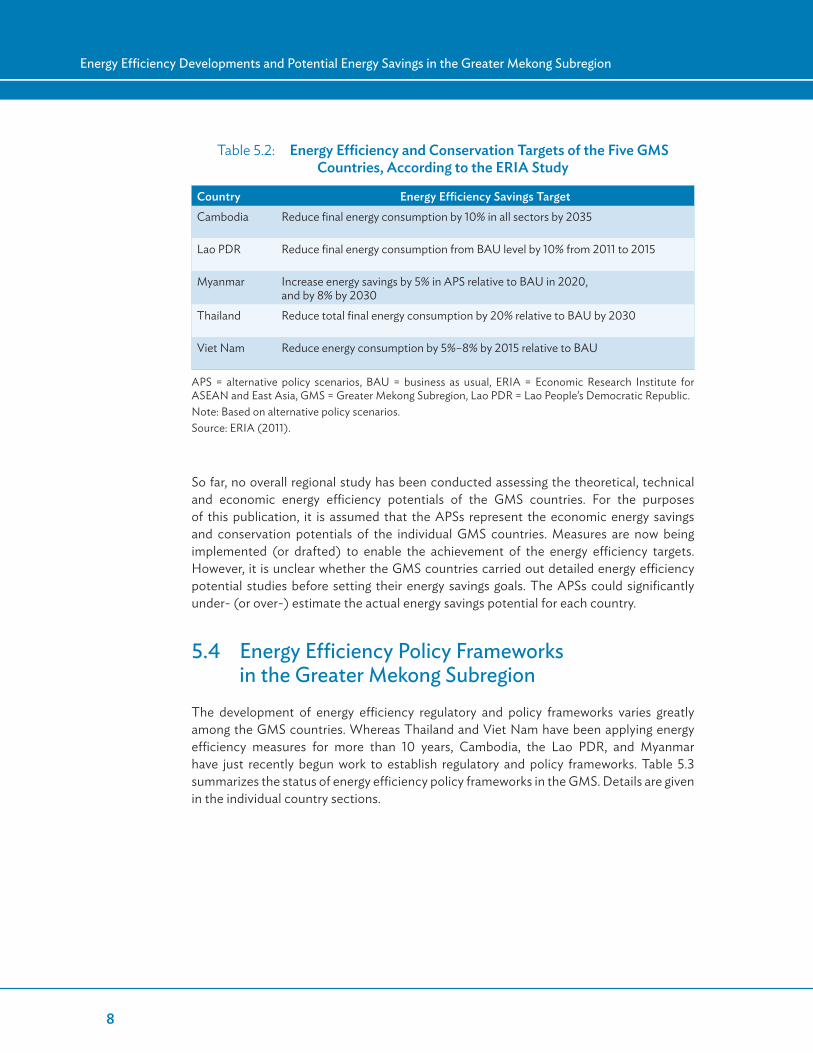
This study is the latest of several assessments of the energy efficiency potential of the GMS countries published by the ERIA working group. Like the 3rd ASEAN Energy Outlook study, the analysis covers trends since 1990 and projects possible savings by 2020 and 2035 if the energy efficiency and conservation targets shown in Table 5.2 are reached.
5.3 Indicative Targets and Projected Energy Savings Given the initial energy consumption baselines and projected increases in energy consumption, Cambodia’s National Energy Efficiency Policy, Strategy and Action Plan appears to reflect the assumptions and analysis of the ERIA study. Thailand’s 20-Year Energy Efficiency Development Plan and Viet Nam’s Master Plan for Energy Development more closely parallel the assumptions and analysis provided in the 3rd ASEAN Energy Outlook study.
Table 5.1: Energy Efficiency and Conservation Targets of the Five GMS Countries, According to the 3rd ASEAN Energy Outlook
Country Energy Efficiency Savings TargetCambodia Reduce final energy consumption by 10% in all sectors by 2030
Lao PDR Reduce final energy consumption by 10% in all sectors by 2025
Myanmar Reduce primary energy consumption by 5% by 2020, and by 8% by 2030, compared with BAUImprove energy efficiency by 16% in all end use by 2030
Thailand Save 22% of total energy by 2030 relative to BAU
Viet Nam Reduce energy consumption by 5%–8% by 2015
ASEAN = Association of Southeast Asian Nations, BAU = business as usual, GMS = Greater Mekong Subregion, Lao PDR = Lao People’s Democratic Republic.Note: Based on alternative policy scenarios.Source: 3rd ASEAN Energy Outlook (2011).
8
Energy Efficiency Developments and Potential Energy Savings in the Greater Mekong Subregion
So far, no overall regional study has been conducted assessing the theoretical, technical and economic energy efficiency potentials of the GMS countries. For the purposes of this publication, it is assumed that the APSs represent the economic energy savings and conservation potentials of the individual GMS countries. Measures are now being implemented (or drafted) to enable the achievement of the energy efficiency targets. However, it is unclear whether the GMS countries carried out detailed energy efficiency potential studies before setting their energy savings goals. The APSs could significantly under- (or over-) estimate the actual energy savings potential for each country.
5.4 Energy Efficiency Policy Frameworks in the Greater Mekong Subregion
The development of energy efficiency regulatory and policy frameworks varies greatly among the GMS countries. Whereas Thailand and Viet Nam have been applying energy efficiency measures for more than 10 years, Cambodia, the Lao PDR, and Myanmar have just recently begun work to establish regulatory and policy frameworks. Table 5.3 summarizes the status of energy efficiency policy frameworks in the GMS. Details are given in the individual country sections.
Table 5.2: Energy Efficiency and Conservation Targets of the Five GMS Countries, According to the ERIA Study
Country Energy Efficiency Savings TargetCambodia Reduce final energy consumption by 10% in all sectors by 2035
Lao PDR Reduce final energy consumption from BAU level by 10% from 2011 to 2015
Myanmar Increase energy savings by 5% in APS relative to BAU in 2020, and by 8% by 2030
Thailand Reduce total final energy consumption by 20% relative to BAU by 2030
Viet Nam Reduce energy consumption by 5%–8% by 2015 relative to BAU
APS = alternative policy scenarios, BAU = business as usual, ERIA = Economic Research Institute for ASEAN and East Asia, GMS = Greater Mekong Subregion, Lao PDR = Lao People’s Democratic Republic.Note: Based on alternative policy scenarios.Source: ERIA (2011).

9
Estimation of Energy Efficiency Potential
Table 5.3: Status of Energy Efficiency Policy Frameworks in the Five GMS Countries
Country Energy Efficiency Policy FrameworkCambodia National Energy Efficiency Policy, Strategy and Action Plan (awaiting approval)
Lao PDR National Energy Saving (EE&C) Policy (being drafted)
Myanmar Policies for Energy Efficiency and Conservation (being drafted)
Thailand Energy Conservation and Promotion Act, 1992 (ECP Act, or ENCON Act) Standard and Labeling Measures (EGAT’s No.5 Labeling Products campaign) 20-Year Energy Efficiency Development Plan (2011–2030)
Viet Nam Energy Efficiency and Conservation (EE&C) (Decree 102/2003/ND-CP) Viet Nam National Energy Efficiency Program (VNEEP) (2006–2015)Law on Energy Efficiency and Conservation (2010 EE&C law) Energy Efficiency Labeling: Decision 51/2011/QD-TTG, Decision 68/2011/QD-TTG, Circular 08/2006/TT-BCN, Circular 4142/TCHQ-QSQL
EGAT = Electricity Generating Authority of Thailand, GMS = Greater Mekong Subregion, Lao PDR = Lao People’s Democratic Republic.Source: Lahmeyer International.
10
6.1 Final Energy Demand Under Business-As-Usual Conditions
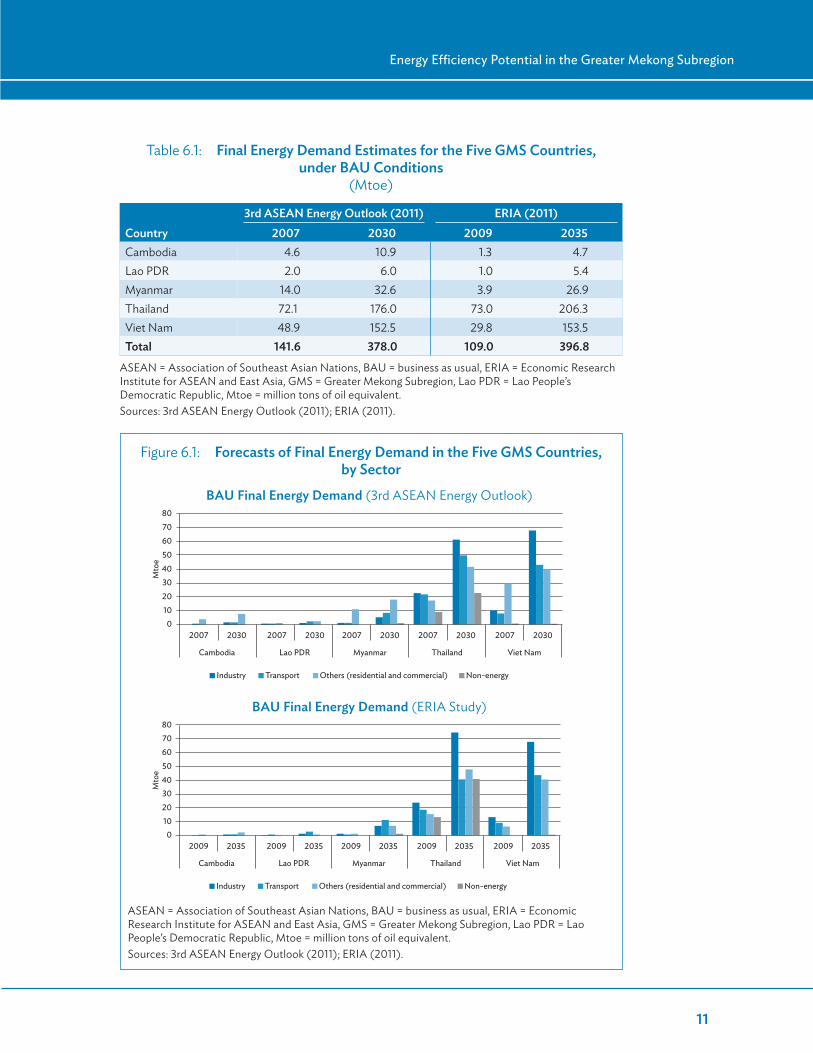
As noted earlier, energy efficiency potential is measured relative to energy demand (consumption) under BAU conditions. While the 3rd ASEAN and ERIA studies have common methodologies and essentially the same targets for energy efficiency savings (in percentage terms), their energy demand projections differ substantially, as shown in Table 6.1.2 They also differ substantially in terms of their baseline energy demand estimates for 2007 and 2009. In turn, this implies markedly different energy savings if the individual country targets are met.
The 3rd ASEAN Energy Outlook study forecasts final energy demand in the five GMS countries under the BAU case to more than double to 378 Mtoe by 2030 from 142 Mtoe in 2007. The ERIA study, on the other hand, anticipates a near-quadrupling in final energy demand, from a lower estimated starting point of 109 Mtoe in 2009 to 397 Mtoe by 2035.
Forecasts of final energy demand by sector, under BAU conditions, are shown in Figure 6.1. The industrial and transportation sectors of Thailand and Viet Nam are expected to dominate the increase in energy demand, but the residential and commercial sectors will also be major contributors. Myanmar, especially its residential and commercial sectors, is forecast to experience a jump in energy demand. Cambodia and the Lao PDR start at very low levels of demand; while large percentage increases in demand are projected for these countries, the absolute levels will remain low, even after 20 years or more.
2 Annex Table A1 gives the demand forecasts of both studies by sector.
6 Energy Efficiency Potential in the Greater Mekong Subregion
11
Energy Efficiency Potential in the Greater Mekong Subregion
Table 6.1: Final Energy Demand Estimates for the Five GMS Countries, under BAU Conditions
(Mtoe)
3rd ASEAN Energy Outlook (2011) ERIA (2011)Country 2007 2030 2009 2035Cambodia 4.6 10.9 1.3 4.7Lao PDR 2.0 6.0 1.0 5.4Myanmar 14.0 32.6 3.9 26.9Thailand 72.1 176.0 73.0 206.3Viet Nam 48.9 152.5 29.8 153.5Total 141.6 378.0 109.0 396.8
ASEAN = Association of Southeast Asian Nations, BAU = business as usual, ERIA = Economic Research Institute for ASEAN and East Asia, GMS = Greater Mekong Subregion, Lao PDR = Lao People’s Democratic Republic, Mtoe = million tons of oil equivalent.Sources: 3rd ASEAN Energy Outlook (2011); ERIA (2011).
Figure 6.1: Forecasts of Final Energy Demand in the Five GMS Countries, by Sector
ASEAN = Association of Southeast Asian Nations, BAU = business as usual, ERIA = Economic Research Institute for ASEAN and East Asia, GMS = Greater Mekong Subregion, Lao PDR = Lao People’s Democratic Republic, Mtoe = million tons of oil equivalent.Sources: 3rd ASEAN Energy Outlook (2011); ERIA (2011).
2009
Cambodia
Industry
Lao PDR
01020
Mto
e
304050607080
Myanmar Thailand Viet Nam
2035 2009 2035 2009 2035 2009 2035 2009 2035
Transport Non-energyOthers (residential and commercial)
2007
Cambodia
Industry
01020
Mto
e
304050607080
Myanmar Thailand Viet Nam
2030 2007 2030 2007 2030 2007 2030 2007 2030
Transport Non-energyOthers (residential and commercial)
Lao PDR
BAU Final Energy Demand (3rd ASEAN Energy Outlook)
BAU Final Energy Demand (ERIA Study)

12
Energy Efficiency Developments and Potential Energy Savings in the Greater Mekong Subregion
Annex Tables A2–A4 present the macroeconomic indicators on which the energy demand forecasts are based and the resulting key energy efficiency indicators, energy elasticity, and energy intensity.
6.2 Estimates of Energy ElasticityThe average energy elasticity for each of the five countries, that is, the change in GDP or output during a defined time period relative to the change in energy consumption over the same period, is shown in Figure 6.2, while Annex Table A3 contains the data on which Figure 6.2 is based. The energy elasticity values in the ERIA study are higher, as the base energy consumption levels for each of the countries (except for Thailand) are significantly lower than those in the 3rd ASEAN Energy Outlook study.
The projected energy elasticities are uniformly lower for the five GMS countries under APS conditions than under BAU conditions, consistent with the general trend of decreasing elasticity in developing economies. However, most of the economies except Thailand do not show a significant drop in energy elasticity, as they start from low levels of energy consumption typical of countries with a predominant agricultural base. The significant drop in energy elasticity for Thailand can be explained by the projected sharp drop in energy intensity stemming from more efficient use of energy in the food, beverage, and paper industries, as well as in the cement and garment industries.
Figure 6.2: Estimates of Energy Elasticity of GDP in the Five GMS Countries
APS = alternative policy scenario, ASEAN = Association of Southeast Asian Nations, BAU = business as usual, ERIA = Economic Research Institute for ASEAN and East Asia, GDP = gross domestic product, Lao PDR = Lao People’s Democratic Republic.Sources: 3rd ASEAN Energy Outlook (2011); ERIA (2011).
0.00
0.20
0.40
0.60
0.80
1.00
1.20
Cambodia Lao PDR Myanmar Thailand Viet Nam
BAU case APS case
Cambodia Lao PDR Myanmar Thailand Viet Nam
BAU case APS case
0.00
0.20
0.40
0.60
0.80
1.00
1.20
Average Final Energy Elasticity of GDP 2007–2030
(3rd ASEAN Energy Outlook)
Average Final Energy Elasticity of GDP 2009–2035
(ERIA Study)

13
Energy Efficiency Potential in the Greater Mekong Subregion
6.3 Estimates of Energy IntensityEstimates of final energy intensity (final energy consumption divided by GDP) for the five GMS countries are shown in Figure 6.3, again as projected by the 3rd ASEAN and ERIA studies.3 The significant differences in energy intensity are due to the significant differences in the estimated levels of energy consumption. The 3rd ASEAN Energy Outlook study foresees decreasing energy intensity for all countries under both the BAU and APS outcomes, but more strongly decreasing under the APS outcome. The ERIA study predicts widely varying energy intensities.
3 See Annex Table A4 for the complete final energy intensity data tables.
Figure 6.3: Estimates of Final Energy Intensity in the Five GMS Countries
APS = alternative policy scenario, ASEAN = Association of Southeast Asian Nations, BAU = business as usual, GMS = Greater Mekong Subregion, Lao PDR = Lao People’s Democratic Republic, toe = tons of oil equivalent.Sources: Compiled from 3rd ASEAN Energy Outlook (2011); ERIA (2011).
BAU
Cambodia
1990
Lao PDR
0500
1,000
1,5002,000
2,500
3,0003,500
toe/
$ m
illio
n
Myanmar Thailand Viet Nam
APS BAU APS BAU APS BAU APS BAU APS
2005 2020 20302007
BAU
Cambodia
1990
Lao PDR
0
500
1,000
1,500
2,000
2,500
3,000
3,500
toe/
$ m
illio
n
Myanmar Thailand Viet Nam
APS BAU APS BAU APS BAU APS BAU APS
2005 2020 20352007
3rd ASEAN Energy Outlook
ERIA Study

14
Energy Efficiency Developments and Potential Energy Savings in the Greater Mekong Subregion
6.4 Estimated Energy Efficiency Savings Under Alternative Policy Scenarios
In comparing final energy demand under BAU conditions with final demand under the alternative policy scenarios for the five GMS countries, the two studies reach widely different estimates of the potential energy savings. The 3rd ASEAN Energy Outlook study estimates potential energy savings of 56 Mtoe; the ERIA study, 30 Mtoe. As shown in Table 6.2, the largest energy savings can be attained in the industrial sector—tied with the transport sector, according to the 3rd ASEAN Energy Outlook study. The ERIA study appears to downplay the potential savings in the transport sector relative to those in the residential and commercial sector.
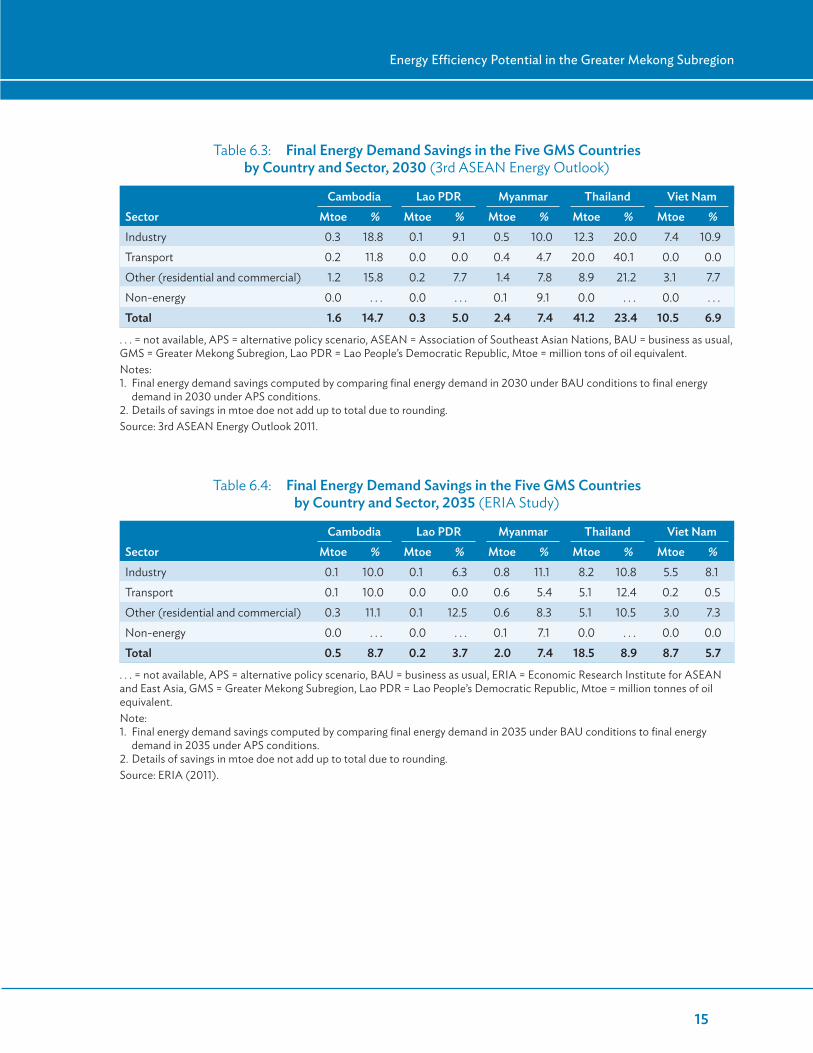
Table 6.3 shows the potential final energy demand savings, by country and by economic sector, according to the 3rd ASEAN Energy Outlook study; Table 6.4 shows the savings according to the ERIA study. The savings are expected to be largest in the transport sector, in the case of Thailand; in the residential and commercial sectors, for Cambodia, the Lao PDR, and Myanmar; and in the industrial sector, for Viet Nam.
Some of the projected savings are dramatic. The 3rd ASEAN Energy Outlook study shows energy savings in the order of 20% for Thailand’s industry sector and 40% for its transport sector. However, the ERIA study provides a more conservative outlook for energy savings, particularly with regard to the transport sector. Further analysis is needed to reconcile the differences.
Details on energy efficiency possibilities, by sector and subsector, are provided in the following individual country sections.
Table 6.2: Final Energy Efficiency Savings in the Five GMS Countries by Sector (Mtoe)
Sector2030
(3rd ASEAN Energy Outlook)2035
(ERIA)
Industry 20.6 14.7
Transport 20.6 6.0
Other (residential and commercial) 14.8 9.1
Non-energy 0.1 0.1
Total 56.0 29.9
ASEAN = Association of Southeast Asian Nations, ERIA = Economic Research Institute for ASEAN and East Asia.Sources: 3rd ASEAN Energy Outlook (2011); ERIA (2011).
15
Energy Efficiency Potential in the Greater Mekong Subregion
Table 6.3: Final Energy Demand Savings in the Five GMS Countries by Country and Sector, 2030 (3rd ASEAN Energy Outlook)
Cambodia Lao PDR Myanmar Thailand Viet NamSector Mtoe % Mtoe % Mtoe % Mtoe % Mtoe %Industry 0.3 18.8 0.1 9.1 0.5 10.0 12.3 20.0 7.4 10.9Transport 0.2 11.8 0.0 0.0 0.4 4.7 20.0 40.1 0.0 0.0Other (residential and commercial) 1.2 15.8 0.2 7.7 1.4 7.8 8.9 21.2 3.1 7.7Non-energy 0.0 . . . 0.0 . . . 0.1 9.1 0.0 . . . 0.0 . . .Total 1.6 14.7 0.3 5.0 2.4 7.4 41.2 23.4 10.5 6.9
. . . = not available, APS = alternative policy scenario, ASEAN = Association of Southeast Asian Nations, BAU = business as usual, GMS = Greater Mekong Subregion, Lao PDR = Lao People’s Democratic Republic, Mtoe = million tons of oil equivalent.Notes:1. Final energy demand savings computed by comparing final energy demand in 2030 under BAU conditions to final energy
demand in 2030 under APS conditions.2. Details of savings in mtoe doe not add up to total due to rounding.Source: 3rd ASEAN Energy Outlook 2011.
Table 6.4: Final Energy Demand Savings in the Five GMS Countries by Country and Sector, 2035 (ERIA Study)
Cambodia Lao PDR Myanmar Thailand Viet NamSector Mtoe % Mtoe % Mtoe % Mtoe % Mtoe %Industry 0.1 10.0 0.1 6.3 0.8 11.1 8.2 10.8 5.5 8.1Transport 0.1 10.0 0.0 0.0 0.6 5.4 5.1 12.4 0.2 0.5Other (residential and commercial) 0.3 11.1 0.1 12.5 0.6 8.3 5.1 10.5 3.0 7.3Non-energy 0.0 . . . 0.0 . . . 0.1 7.1 0.0 . . . 0.0 0.0Total 0.5 8.7 0.2 3.7 2.0 7.4 18.5 8.9 8.7 5.7
. . . = not available, APS = alternative policy scenario, BAU = business as usual, ERIA = Economic Research Institute for ASEAN and East Asia, GMS = Greater Mekong Subregion, Lao PDR = Lao People’s Democratic Republic, Mtoe = million tonnes of oil equivalent.Note:1. Final energy demand savings computed by comparing final energy demand in 2035 under BAU conditions to final energy
demand in 2035 under APS conditions.2. Details of savings in mtoe doe not add up to total due to rounding.Source: ERIA (2011).
16
Cambodia’s economy is growing rapidly, and growth is projected to average more than 7% yearly during the period up to 2030. Final energy consumption will increase much more rapidly, from a very low level. This section summarizes
Cambodia’s institutional structure for the energy sector and outlines the government’s energy efficiency policies and targets, before finally addressing the country’s future energy consumption and the savings possible from energy efficiency measures.
7.1 Institutional Framework for the Energy SectorThe Law on Electricity (2001), creating the Electricity Authority of Cambodia (EAC) and defining its responsibilities and those of the Ministry of Industry, Mines and Energy (MIME), provides the framework for electric power supply and services throughout the country (EAC 2012).
MIME is responsible for policy formulation, strategic planning, and technical standards for the power sector. The EAC, on the other hand, serves as the national electricity regulator for Cambodia’s electricity businesses, setting and administering the following: licensing, tariff setting, settling of disputes between producers or suppliers and consumers, accounting standards, enforcement of regulations, and review of performance.
Cambodia’s overall power sector development policy is aimed at the following (MIME, ERIA, and ACE 2012):
• providing an adequate supply of energy throughout Cambodia at reasonable and affordable prices,
• ensuring reliable and secure power supply in support of investment and national economic development,
• encouraging the exploration and environmentally and socially acceptable development of energy resources, and
• promoting the efficient use of energy.
The last-mentioned policy objective relates directly to this report. In 2013, MIME issued a policy paper on national energy efficiency for consultation.4 The paper dealt mainly
4 The policy paper was prepared in cooperation with the European Union Energy Initiative Partnership Dialogue Facility and GIZ; http://giz-cambodia.com/?p=1085
7 Energy Efficiency Development in Cambodia

17
Energy Efficiency Development in Cambodia
with energy efficiency in industry, end-user products, buildings, electricity production and distribution, and the use of biomass resources (Lieng 2013). The National Energy Efficiency Policy, Strategy and Action Plan has been drafted and is awaiting adoption by Cambodia’s Council of Ministries.
Until the absence of an approved energy efficiency and conservation policy, Cambodia also lacks a corresponding regulatory framework. While the framework is being developed, including construction and building standards, project approval and implementation processes may be protracted. Some energy efficiency projects have been completed or are ongoing, but government support and incentives are generally lacking. Institutional capacity for improving energy efficiency is inadequate and the public is not aware of the challenges involved.
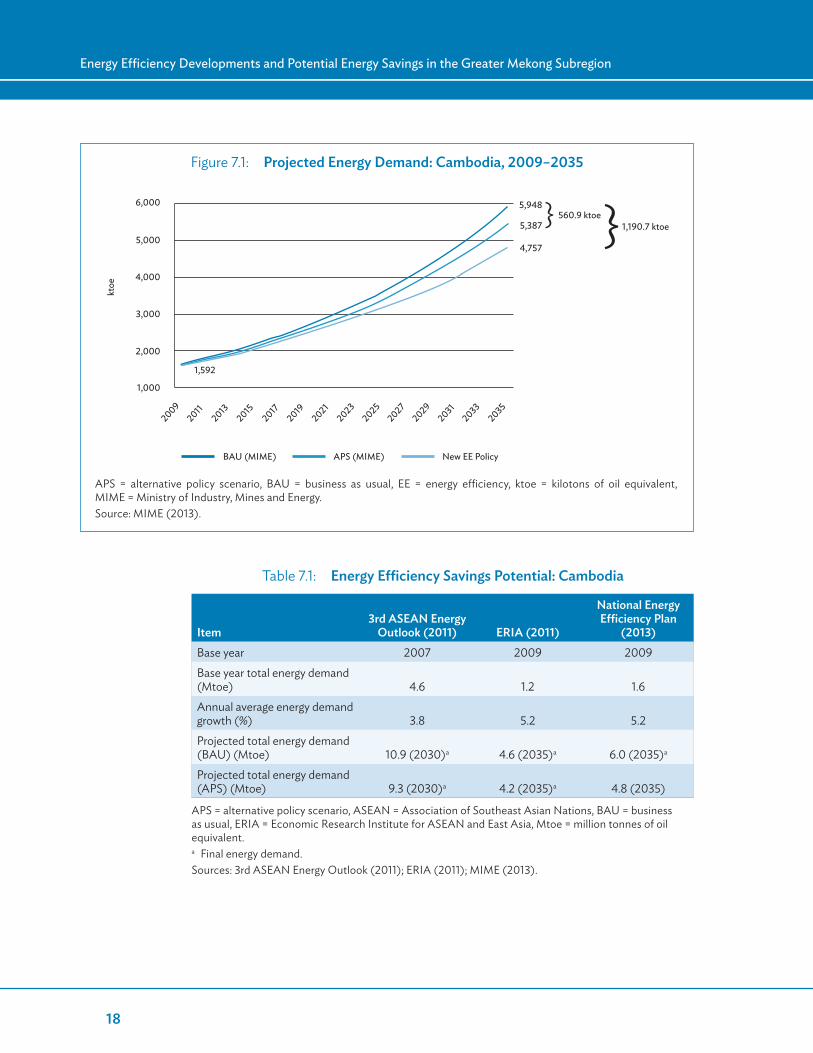
7.2 Energy Efficiency Performance TargetsSince the energy efficiency plan still has to be officially endorsed, Cambodia’s energy efficiency targets are largely indicative. In the 3rd ASEAN Energy Outlook (2011), the government’s stated energy-saving goal is 10% across all sectors by 2030. In the ERIA study, the goal is somewhat lower—just under 9% by 2035. Much more ambitious than either of these is the energy savings goal of 20% by 2035, relative to BAU energy demand, set in the proposed energy efficiency plan.
The proposed plan predicts the following energy savings:
• In the industry sector, potential savings could range from 20% (garment industry) to 70% (ice factories), depending mainly on changes in behavior and on the replacement of inefficient devices.
• For end-user products in the residential sector, energy savings of up to 50%, reflecting international experience with energy-efficient household appliances.
• For the building sector, the assumed energy savings of 20%–30% for new commercial buildings are to be achieved through the use of appropriate building materials and construction principles, with special emphasis on standardized wiring.
• The projected energy savings in rural electricity generation and distribution, resulting from a reduction in the very large generation and distribution losses of rural energy enterprises (REEs), could be as high as 80%.
• Energy savings of between 30% and 50% in the use of biomass resources for residential and industrial purposes, through the introduction of improved cookstoves and more efficient charcoal kilns and char briquettes.
Figure 7.1 compares the 3rd ASEAN demand projections with those indicated under the draft National Policy Strategy and Action Plan. Table 7.1 presents three sets of estimates, including those of the ERIA study. The sharply differing baseline assumptions call into question the degree to which the three scenarios are comparable. The following section provides the assumptions underlying the demand projections of the 3rd ASEAN and ERIA studies.
18
Energy Efficiency Developments and Potential Energy Savings in the Greater Mekong Subregion
Figure 7.1: Projected Energy Demand: Cambodia, 2009–2035
APS = alternative policy scenario, BAU = business as usual, EE = energy efficiency, ktoe = kilotons of oil equivalent, MIME = Ministry of Industry, Mines and Energy.Source: MIME (2013).
20092011201320152017201920212023202520272029203120332035
2,000
1,000
1,592
5,948560.9 ktoe
1,190.7 ktoe5,387
4,757
3,000
4,000
5,000
6,000
ktoe
BAU (MIME) APS (MIME)
} }
New EE Policy
Table 7.1: Energy Efficiency Savings Potential: Cambodia
Item3rd ASEAN Energy
Outlook (2011) ERIA (2011)
National Energy Efficiency Plan
(2013)Base year 2007 2009 2009Base year total energy demand (Mtoe) 4.6 1.2 1.6Annual average energy demand growth (%) 3.8 5.2 5.2Projected total energy demand (BAU) (Mtoe) 10.9 (2030)a 4.6 (2035)a 6.0 (2035)a
Projected total energy demand (APS) (Mtoe) 9.3 (2030)a 4.2 (2035)a 4.8 (2035)
APS = alternative policy scenario, ASEAN = Association of Southeast Asian Nations, BAU = business as usual, ERIA = Economic Research Institute for ASEAN and East Asia, Mtoe = million tonnes of oil equivalent.a Final energy demand.Sources: 3rd ASEAN Energy Outlook (2011); ERIA (2011); MIME (2013).
19
Energy Efficiency Development in Cambodia
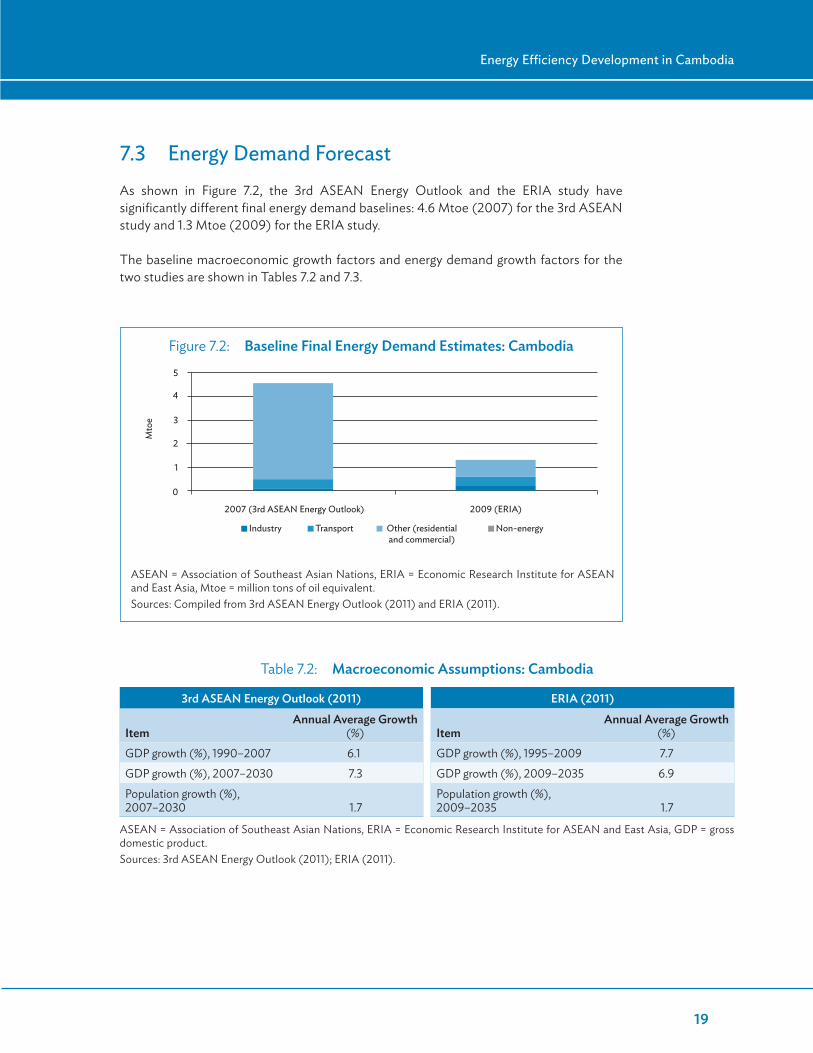
7.3 Energy Demand ForecastAs shown in Figure 7.2, the 3rd ASEAN Energy Outlook and the ERIA study have significantly different final energy demand baselines: 4.6 Mtoe (2007) for the 3rd ASEAN study and 1.3 Mtoe (2009) for the ERIA study.
The baseline macroeconomic growth factors and energy demand growth factors for the two studies are shown in Tables 7.2 and 7.3.
Figure 7.2: Baseline Final Energy Demand Estimates: Cambodia
ASEAN = Association of Southeast Asian Nations, ERIA = Economic Research Institute for ASEAN and East Asia, Mtoe = million tons of oil equivalent.Sources: Compiled from 3rd ASEAN Energy Outlook (2011) and ERIA (2011).
Table 7.2: Macroeconomic Assumptions: Cambodia
3rd ASEAN Energy Outlook (2011) ERIA (2011)
ItemAnnual Average Growth
(%) ItemAnnual Average Growth
(%)GDP growth (%), 1990–2007 6.1 GDP growth (%), 1995–2009 7.7GDP growth (%), 2007–2030 7.3 GDP growth (%), 2009–2035 6.9Population growth (%), 2007–2030 1.7
Population growth (%), 2009–2035 1.7
ASEAN = Association of Southeast Asian Nations, ERIA = Economic Research Institute for ASEAN and East Asia, GDP = gross domestic product.Sources: 3rd ASEAN Energy Outlook (2011); ERIA (2011).
2007 (3rd ASEAN Energy Outlook) 2009 (ERIA)
Mto
e
Industry Transport Other (residential and commercial)
Non-energy
1
0
2
3
4
5

20
Energy Efficiency Developments and Potential Energy Savings in the Greater Mekong Subregion
The initial energy demand and growth factors of the proposed energy efficiency plan more closely match those of the ERIA forecast (Tables 7.1 and 7.3). The 3rd ASEAN study assumes that final energy consumption will increase by 3.8% yearly from 2007 to 2030. This is a significantly lower rate of increase than the 5.2% (2009–2035) assumed in the proposed plan.
The resulting energy efficiency indicators under the BAU and APS cases are shown in Tables 7.4 and 7.5. The notably different values for energy intensity and energy elasticity are primarily due to significant differences in baseline energy demand levels.
Table 7.3: Energy Consumption Growth Forecasts: Cambodia
3rd ASEAN Energy Outlook (2011) ERIA (2011)
Period
Average Annual Primary Energy Consumption Growth
(%) Period
Average Annual Primary Energy Consumption Growth
(%)2007–2030, BAU case 4.2 2009–2035, BAU case 5.12007–2030, APS case 3.5 2009–2035, APS casea 1.7
Period
Average Annual Final Energy Consumption Growth
(%) Period
Average Annual Final Energy Consumption Growth
(%)1990–2007 2.3 1995– 2009 9.02007–2030, BAU case 3.8 2009–2035, BAU case 5.22007–2030, APS case 3.1 2009–2035, APS case 4.8
APS = alternative policy scenario, ASEAN = Association of Southeast Asian Nations, BAU = business as usual, ERIA = Economic Research Institute for ASEAN and East Asia.a The artificially low primary energy APS growth rate is due to an apparent anomaly in the primary energy data set for 2009.Sources: 3rd ASEAN Energy Outlook (2011); ERIA (2011).
Table 7.4: Final Energy Intensity Estimates: Cambodia (toe/$ million)
Data Source 1990 2005 2007 2009 2020 2030 20353rd ASEAN Energy Outlook (2011) BAU 1,233 772 657 423 311
APS 357 266ERIA (2011) BAU 154 175 164 147 110
APS 134 101National Energy Efficiency Plan BAU 143
APS 115
APS = alternative policy scenario, ASEAN = Association of Southeast Asian Nations, BAU = business as usual, ERIA = Economic Research Institute for ASEAN and East Asia, toe = tons of oil equivalent.Sources: 3rd ASEAN Energy Outlook (2011); ERIA (2011); MIME (2013).
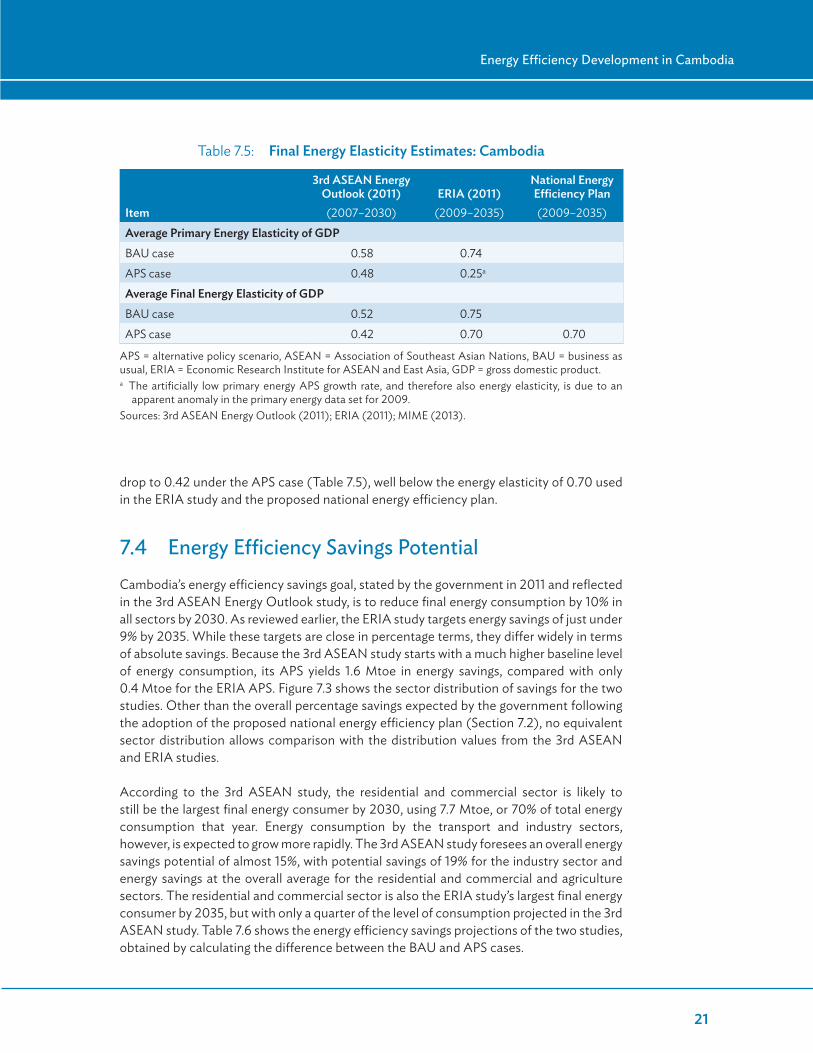
The 3rd ASEAN study estimates the energy elasticity of GDP for the period 2007–2030 under BAU conditions at 0.52, indicating that a 1% change in GDP would be paralleled by a change of about 0.52% in total final energy consumption. Energy elasticity is forecast to
21
Energy Efficiency Development in Cambodia
drop to 0.42 under the APS case (Table 7.5), well below the energy elasticity of 0.70 used in the ERIA study and the proposed national energy efficiency plan.
7.4 Energy Efficiency Savings PotentialCambodia’s energy efficiency savings goal, stated by the government in 2011 and reflected in the 3rd ASEAN Energy Outlook study, is to reduce final energy consumption by 10% in all sectors by 2030. As reviewed earlier, the ERIA study targets energy savings of just under 9% by 2035. While these targets are close in percentage terms, they differ widely in terms of absolute savings. Because the 3rd ASEAN study starts with a much higher baseline level of energy consumption, its APS yields 1.6 Mtoe in energy savings, compared with only 0.4 Mtoe for the ERIA APS. Figure 7.3 shows the sector distribution of savings for the two studies. Other than the overall percentage savings expected by the government following the adoption of the proposed national energy efficiency plan (Section 7.2), no equivalent sector distribution allows comparison with the distribution values from the 3rd ASEAN and ERIA studies.
According to the 3rd ASEAN study, the residential and commercial sector is likely to still be the largest final energy consumer by 2030, using 7.7 Mtoe, or 70% of total energy consumption that year. Energy consumption by the transport and industry sectors, however, is expected to grow more rapidly. The 3rd ASEAN study foresees an overall energy savings potential of almost 15%, with potential savings of 19% for the industry sector and energy savings at the overall average for the residential and commercial and agriculture sectors. The residential and commercial sector is also the ERIA study’s largest final energy consumer by 2035, but with only a quarter of the level of consumption projected in the 3rd ASEAN study. Table 7.6 shows the energy efficiency savings projections of the two studies, obtained by calculating the difference between the BAU and APS cases.
Table 7.5: Final Energy Elasticity Estimates: Cambodia
Item
3rd ASEAN Energy Outlook (2011)(2007–2030)
ERIA (2011)(2009–2035)
National Energy Efficiency Plan(2009–2035)
Average Primary Energy Elasticity of GDPBAU case 0.58 0.74APS case 0.48 0.25a
Average Final Energy Elasticity of GDP BAU case 0.52 0.75APS case 0.42 0.70 0.70
APS = alternative policy scenario, ASEAN = Association of Southeast Asian Nations, BAU = business as usual, ERIA = Economic Research Institute for ASEAN and East Asia, GDP = gross domestic product.a The artificially low primary energy APS growth rate, and therefore also energy elasticity, is due to an
apparent anomaly in the primary energy data set for 2009.Sources: 3rd ASEAN Energy Outlook (2011); ERIA (2011); MIME (2013).

22
Energy Efficiency Developments and Potential Energy Savings in the Greater Mekong Subregion
Table 7.6: Forecasts of Final Energy Consumption Savings, by Sector: Cambodia
3rd ASEAN Energy Outlook (2011) ERIA (2011)
Sector
Final Energy Demand Savings
(Mtoe)% Reduction (BAU-APS)
Final Energy Demand Savings
(Mtoe)% Reduction (BAU-APS)
2020 2030 2020 2030 2020 2035 2020 2035Industry 0.2 0.3 20.0 18.8 0.0 0.1 0.0 10.0Transport 0.1 0.2 11.1 11.8 0.0 0.1 0.0 10.0Other (residential and commercial) 0.9 1.2 15.5 15.6 0.2 0.3 15.4 11.1
Total 1.2 1.6 15.6 14.7 0.2 0.4 8.7 8.7
APS = alternative policy scenario, ASEAN = Association of Southeast Asian Nations, BAU = business as usual, ERIA = Economic Research Institute for ASEAN and East Asia, Mtoe = million tons of oil equivalent.Sources: 3rd ASEAN Energy Outlook (2011); ERIA (2011).
Figure 7.3: Estimates of Final Energy Consumption by Sector: Cambodia
APS = alternative policy scenario, ASEAN = Association of Southeast Asian Nations, BAU = business as usual, ERIA = Economic Research Institute for ASEAN and East Asia, Mtoe = million tons of oil equivalentSources: 3rd ASEAN Energy Outlook (2011); ERIA (2011).
Industry
2007
2030
BA
U
2030
APS
2030
BA
U
2030
APS
2007
2030
BA
U
2030
APS
2007
2030
BA
U
2030
APS
2009
2035
BA
U
2035
APS
2009
2035
BA
U
2035
APS
2009
2035
BA
U
2035
APS
2009
2035
BA
U
2035
APS
Transport Other (residential and
commercial)
Other (residential and
commercial)
Non-energy Industry Transport Non-energy
3rd ASEAN Energy Outlook (2011) ERIA (2011)
0102030405060708090
Mto
e
2007
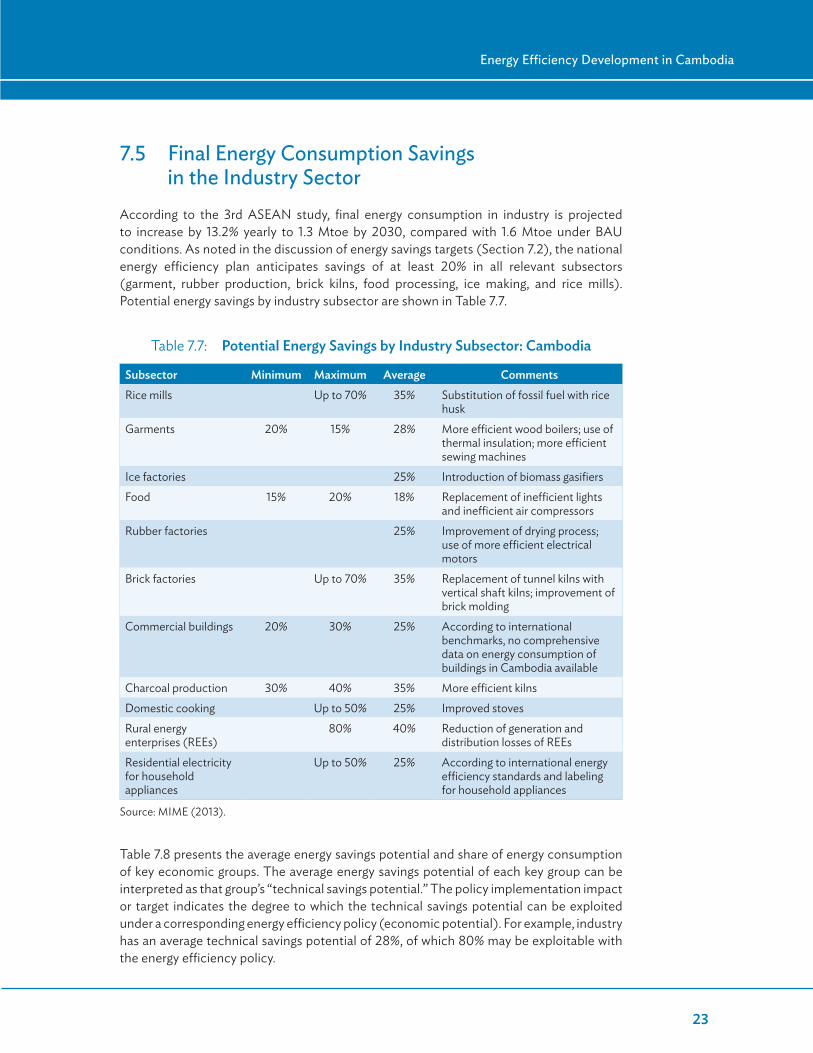
23
Energy Efficiency Development in Cambodia
7.5 Final Energy Consumption Savings in the Industry Sector
According to the 3rd ASEAN study, final energy consumption in industry is projected to increase by 13.2% yearly to 1.3 Mtoe by 2030, compared with 1.6 Mtoe under BAU conditions. As noted in the discussion of energy savings targets (Section 7.2), the national energy efficiency plan anticipates savings of at least 20% in all relevant subsectors (garment, rubber production, brick kilns, food processing, ice making, and rice mills). Potential energy savings by industry subsector are shown in Table 7.7.
Table 7.8 presents the average energy savings potential and share of energy consumption of key economic groups. The average energy savings potential of each key group can be interpreted as that group’s “technical savings potential.” The policy implementation impact or target indicates the degree to which the technical savings potential can be exploited under a corresponding energy efficiency policy (economic potential). For example, industry has an average technical savings potential of 28%, of which 80% may be exploitable with the energy efficiency policy.
Table 7.7: Potential Energy Savings by Industry Subsector: Cambodia
Subsector Minimum Maximum Average CommentsRice mills Up to 70% 35% Substitution of fossil fuel with rice
huskGarments 20% 15% 28% More efficient wood boilers; use of
thermal insulation; more efficient sewing machines
Ice factories 25% Introduction of biomass gasifiersFood 15% 20% 18% Replacement of inefficient lights
and inefficient air compressorsRubber factories 25% Improvement of drying process;
use of more efficient electrical motors
Brick factories Up to 70% 35% Replacement of tunnel kilns with vertical shaft kilns; improvement of brick molding
Commercial buildings 20% 30% 25% According to international benchmarks, no comprehensive data on energy consumption of buildings in Cambodia available
Charcoal production 30% 40% 35% More efficient kilnsDomestic cooking Up to 50% 25% Improved stovesRural energy enterprises (REEs)
80% 40% Reduction of generation and distribution losses of REEs
Residential electricity for household appliances
Up to 50% 25% According to international energy efficiency standards and labeling for household appliances
Source: MIME (2013).
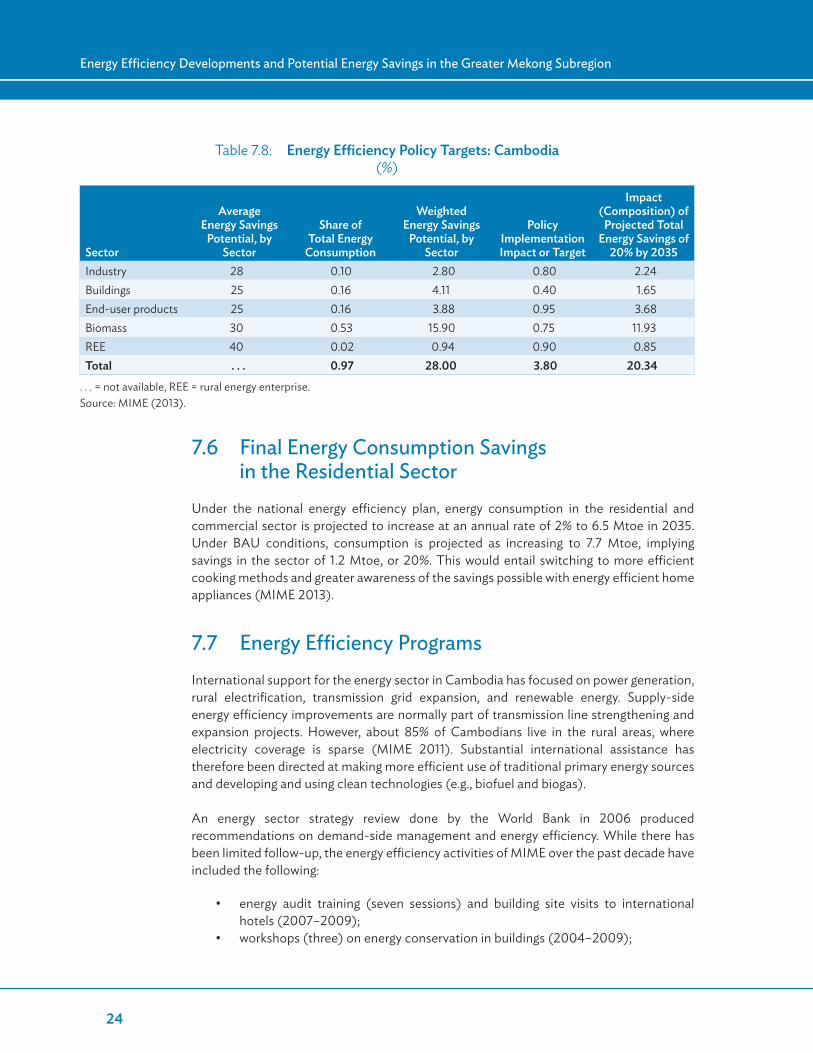
24
Energy Efficiency Developments and Potential Energy Savings in the Greater Mekong Subregion
7.6 Final Energy Consumption Savings in the Residential Sector
Under the national energy efficiency plan, energy consumption in the residential and commercial sector is projected to increase at an annual rate of 2% to 6.5 Mtoe in 2035. Under BAU conditions, consumption is projected as increasing to 7.7 Mtoe, implying savings in the sector of 1.2 Mtoe, or 20%. This would entail switching to more efficient cooking methods and greater awareness of the savings possible with energy efficient home appliances (MIME 2013).
7.7 Energy Efficiency ProgramsInternational support for the energy sector in Cambodia has focused on power generation, rural electrification, transmission grid expansion, and renewable energy. Supply-side energy efficiency improvements are normally part of transmission line strengthening and expansion projects. However, about 85% of Cambodians live in the rural areas, where electricity coverage is sparse (MIME 2011). Substantial international assistance has therefore been directed at making more efficient use of traditional primary energy sources and developing and using clean technologies (e.g., biofuel and biogas).
An energy sector strategy review done by the World Bank in 2006 produced recommendations on demand-side management and energy efficiency. While there has been limited follow-up, the energy efficiency activities of MIME over the past decade have included the following:
• energy audit training (seven sessions) and building site visits to international hotels (2007–2009);
• workshops (three) on energy conservation in buildings (2004–2009);
Table 7.8: Energy Efficiency Policy Targets: Cambodia (%)
Sector
Average Energy Savings
Potential, by Sector
Share of Total Energy
Consumption
Weighted Energy Savings
Potential, by Sector
Policy Implementation Impact or Target
Impact (Composition) of
Projected Total Energy Savings of
20% by 2035Industry 28 0.10 2.80 0.80 2.24Buildings 25 0.16 4.11 0.40 1.65End-user products 25 0.16 3.88 0.95 3.68Biomass 30 0.53 15.90 0.75 11.93REE 40 0.02 0.94 0.90 0.85Total . . . 0.97 28.00 3.80 20.34
. . . = not available, REE = rural energy enterprise.Source: MIME (2013).

25
Energy Efficiency Development in Cambodia
• energy audit training (two sessions) and industry site visits (2002–2005);• workshops (four) on energy management (2006–2010);• site visits (eight) to factories and buildings, including Electricité du Cambodge,
EAC, the Garment Manufacturers Association, and hotels; and• ASEAN Energy Awards (four) for retrofitted buildings (hotels) between 2001 and
2011.
The proposed energy efficiency plan also provides for the establishment of an energy efficiency information resource center at MIME, to manage an internet information portal for energy efficiency products, regulations, standards, reports, and government publications (MIME 2013).
The most prominent current program is Reducing Greenhouse Gas Emissions through Improved Energy Efficiency in the Industrial Sector5 (also called the Industrial Energy Efficiency Project 2011–2015). The program is funded by the Global Environment Facility (GEF) and implemented by the United Nations Industrial Development Organization (UNIDO), in collaboration with MIME and the National Cleaner Production Office–Cambodia (NCPO-C). Its primary objective is to strengthen stakeholders’ capacity for improving energy efficiency in the industry sector, particularly in five energy-intensive subsectors (food processing, garments, rubber processing, rice processing, and brick kilns). The program provides incentives throughout Cambodia for energy efficiency actions, (NCPO-C 2012), including technical assistance in the form of energy audits and project cofinancing. The program components are as follows:
• technical and financial support for the implementation of industrial energy efficiency pilot projects;
• capacity building for the implementation of industrial energy efficiency measures;• strengthening of the institutional framework for industrial energy efficiency;• promotion of energy efficiency practices and technologies; and• strengthening of the formulation and implementation of policies, regulations, and
programs in support of sustainable industrial energy efficiency.
By gathering baseline information and analyzing potential energy savings in the rice mill, brick kiln, rubber refinery, and garment industries, the program will endeavor to identify potential energy efficiency projects for cumulative savings of 45,000 tons of oil equivalent (TOEs) per year. At least 12 industry energy efficiency pilot projects will also be implemented for cumulative savings of 15,000 TOEs per year (NCPO-C 2012).
Other energy efficiency actions in Cambodia are the Energy Savings Siem Reap Energy Conservation project and the Renewable Energy and Energy Efficiency Partnership (REEEP) program. The Siem Reap project (about €370,000) is funded by the Energy and Environment Partnership Mekong and implemented by the Ministry of Environment with the support of the Technical University of Denmark and the Royal University of Phnom Penh. The main objective of the project is to raise awareness of climate change
5 UNIDO Project Number XX/CMB/09/X02.
26
Energy Efficiency Developments and Potential Energy Savings in the Greater Mekong Subregion
and the urgency of energy efficiency and conservation. It promotes energy labeling of electrical appliances, distributes fluorescent lamps, and undertakes other energy-saving measures. REEEP is backed by the OPEC Fund for International Development (OFID). In collaboration with MIME and EAC, the project provides minigrid upgrades based on the use of clean energy (solar, etc.) in rural areas.
Other funding sources are the Mekong Renewable Resources Fund (MRRF) and Maybank Investment. MRRF, sponsored by the United States government, supports renewable energy projects and power plant efficiency upgrades in Cambodia, the Lao PDR, and Viet Nam. Its demand-side activities include energy efficiency measures related to agricultural processing and industrial facilities. Maybank Investment, a $500 million fund, assists renewable energy and energy efficiency projects in Asia and the Pacific, in cooperation with the Asian Development Bank (ADB) and the International Finance Corporation.
7.8 Summary of Energy Efficiency Savings PotentialEstimates of potential savings from energy efficiency measures in Cambodia differ markedly because of limited data concerning current and future energy demand. The proposed National Energy Efficiency Policy, Strategy and Action Plan projects energy savings of 20% by 2035, that is, energy demand of 4.8 Mtoe, versus 6.0 Mtoe under BAU conditions. Savings of 1.2 Mtoe yearly would be very significant.
The 3rd ASEAN and ERIA studies provide quantitative analyses of projected savings from energy efficiency measures. Both assume a 10% savings target—the 3rd ASEAN study, by 2030; and the ERIA study, by 2035. In 2011, the government’s target was also 10%, before the proposed national plan doubled the target in 2013. Comparison of the results of the 3rd ASEAN and ERIA studies is hampered by their different assumptions about energy demand in recent years (2007 and 2009) and over the next 15–20 years. The ERIA study assumes 5.2% annual growth in energy demand, as does the national plan, while the 3rd ASEAN study assumes annual growth of only 3.8%.
But despite their widely differing assumptions, the national plan and the 3rd ASEAN and ERIA studies arrive at the same conclusion: the energy savings from energy efficiency measures are likely to be significant. The government and the people of Cambodia therefore stand to benefit from the approval and implementation of the National Energy Efficiency Policy, Strategy and Action Plan.
Little is in place for a major push for energy efficiency. The institutional framework for designing and managing energy efficiency measures has to be strengthened. Programs past and present have made modest contributions to energy efficiency but fall far short of what is needed. The country lacks the technical and financial resources required to meet the national plan target of 20% in energy savings by 2035 and needs international assistance.
While energy is a fundamental building block for development, climate change and other considerations demand its efficient supply and use. The private sector’s response will be critical and must be encouraged by a regulatory and incentive system that makes energy efficiency the favored economic choice.

27
The economy of the Lao PDR is growing at more than 7% yearly and is expected to continue growing rapidly over the next decade or even beyond. Final energy consumption is increasing even faster, reflecting the pace of industrialization,
urbanization, and rural electrification. While the country has extensive hydropower and coal resources, it depends totally on diesel and gasoline imports, hence energy efficiency and conservation in the use of transport fuel is of vital importance. The energy efficiency savings potential is considerable, and its development would contribute greatly to meeting the country’s energy needs.
8.1 Institutional Framework for the Energy SectorThe Ministry of Energy and Mines (MEM) is the main agency responsible for the energy sector of the Lao PDR (Figure 8.1). The Department of Energy draws up national policies and regulations (including those for tariffs); monitors compliance by public and private energy suppliers; and drafts strategic plans for power generation, transmission, and distribution; as well as for rural electrification, renewable energy development, and energy exporting. The Department of Energy Promotion and Development negotiates agreements and other legal documents with hydropower investors and contractors.6 MEM’s objectives include raising the country’s electrification rate to 90% by 2020, increasing government revenues from electricity exports, strengthening the grid system, and developing hydropower in an environmentally sustainable manner.
MEM oversees three state enterprises: (i) Electricité du Laos (EdL), a vertically integrated utility responsible for power generation, transmission, and distribution, and for the management of electricity imports and exports; (ii) the Lao Holding State Enterprise, a special-purpose company that holds the government’s shares in export-oriented independent power projects; and (iii) the Electrical Construction and Installation Company, a construction contractor for EdL’s distribution and transmission facilities. The Electricity Law (1997) provides the legal framework for private sector participation in the energy sector through various forms of public–private partnerships (PPPs).
EdL’s generation is mainly hydro based and exported in part to Thailand. The utility operates four independent subregional grids; although not interconnected, they are individually connected to Thailand’s power grid. Large-scale independent power producers (IPPs) are
6 But the Ministry of Planning and Investment signs the agreements.
8 Energy Efficiency Development in the Lao People’s Democratic Republic
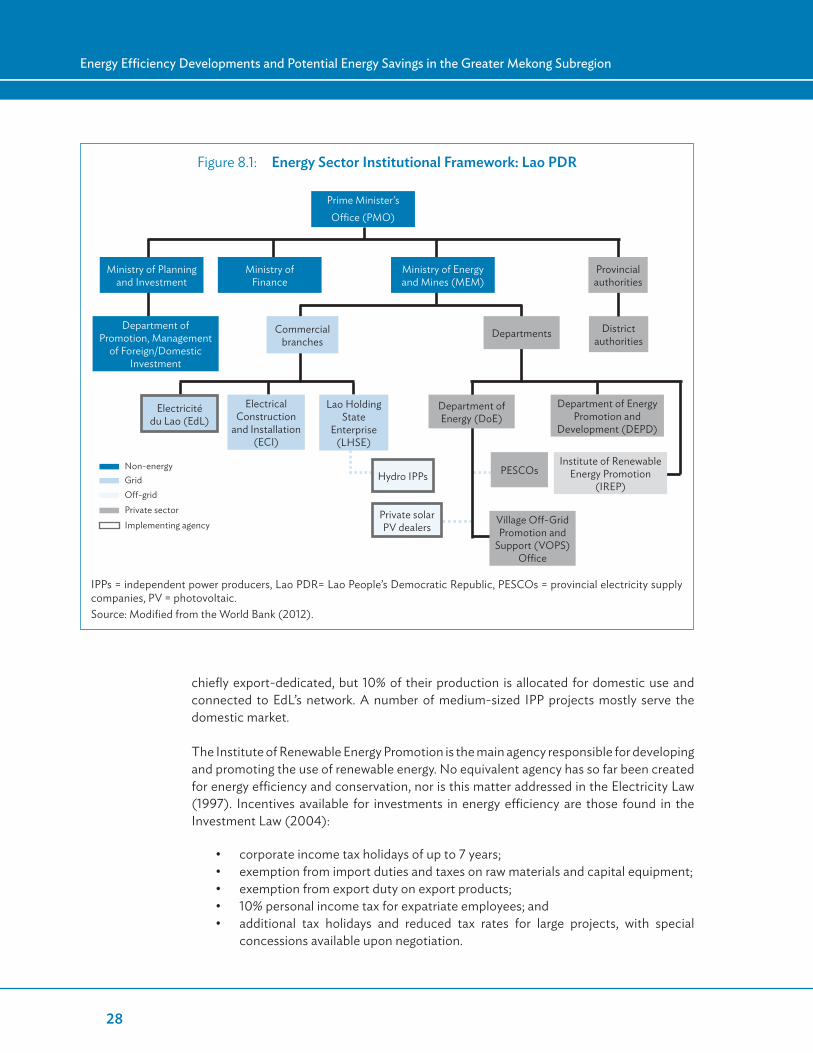
28
Energy Efficiency Developments and Potential Energy Savings in the Greater Mekong Subregion
Prime Minister’s Office (PMO)
District authorities
chiefly export-dedicated, but 10% of their production is allocated for domestic use and connected to EdL’s network. A number of medium-sized IPP projects mostly serve the domestic market.
The Institute of Renewable Energy Promotion is the main agency responsible for developing and promoting the use of renewable energy. No equivalent agency has so far been created for energy efficiency and conservation, nor is this matter addressed in the Electricity Law (1997). Incentives available for investments in energy efficiency are those found in the Investment Law (2004):
• corporate income tax holidays of up to 7 years;• exemption from import duties and taxes on raw materials and capital equipment;• exemption from export duty on export products;• 10% personal income tax for expatriate employees; and• additional tax holidays and reduced tax rates for large projects, with special
concessions available upon negotiation.
Figure 8.1: Energy Sector Institutional Framework: Lao PDR
IPPs = independent power producers, Lao PDR= Lao People’s Democratic Republic, PESCOs = provincial electricity supply companies, PV = photovoltaic.Source: Modified from the World Bank (2012).
Ministry of Energy and Mines (MEM)
Ministry of Finance
Commercial branches
Lao Holding State
Enterprise (LHSE)
Provincial authorities
Departments
Department of Energy (DoE)
PESCOsHydro IPPs
Private solar PV dealers
Village Off-Grid Promotion and
Support (VOPS) Office
Department of Energy Promotion and
Development (DEPD)
Institute of Renewable Energy Promotion
(IREP)
Electrical Construction
and Installation (ECI)
Electricité du Lao (EdL)
Ministry of Planning and Investment
Department of Promotion, Management
of Foreign/Domestic Investment
Non-energyGridOff-gridPrivate sectorImplementing agency

29
Energy Efficiency Development in the Lao People’s Democratic Republic
ADB’s 2012–2016 country partnership strategy for the Lao PDR includes the following observations on the lack of an energy efficiency policy or strategy:
In the absence of a national efficiency plan, continuous training in energy efficiency, demand management and conservation and energy auditing have not led to the expected developments in energy efficiency. As argued, such gaps come partly as a result of the absence of an institutional structure to coordinate energy efficiency work in all supply and demand subsectors. The country’s regulatory and institutional framework needs to be improved and a program launched to direct attention to appliance efficiency, energy auditing, capacity building and demand side management. A national program needs to be established to implement energy efficiency projects.
A draft strategy framework for energy efficiency and conservation prepared by MEM is being considered for approval.7 MEM is also drafting energy efficiency guidelines for the residential, building, and industry subsectors. Both documents were scheduled for completion or approval in late 2013 or early 2014. Given the lack of an officially approved energy efficiency policy or strategy, the Lao PDR has only a general energy savings target of 10% for the period up to 2025 (MEM 2012).
8.2 Energy Efficiency InitiativesDespite the lack of a formal institutional framework, various programs have been designed to promote energy efficiency and conservation in the Lao PDR (MEM 2012) The ASEAN–Japan: Promotion of Energy Efficiency and Conservation (PROMEEC) and Ayeyawady–Chao Phraya–Mekong Economic Cooperation Strategy (ACMECS) programs are raising awareness of the need to save energy through training, seminars, workshops, and energy audits.
Also noteworthy is the Demand Side Management and Energy Efficiency (DSM/EE) project funded by the World Bank/GEF and implemented by EdL.8 During phase I of the program (2007–2010), 50 government buildings underwent energy audits and energy efficiency improvements were recommended. Four government buildings were selected for the pilot implementation of low-cost energy efficiency measures, resulting in energy savings of about 4%–8% (ADB 2011b). Phase 1 activities included the expansion of the Public Sector Energy Database, the cleaning of air conditioners and the installation of timers, the installation of lamp switches, and awareness building for energy savings. Phase II (2011–2014) involves replacing some 400,000 light bulbs in the residential sector, 400,000 compact fluorescent light (CFL) lamps in the residential sector (with high-quality CFL bulbs), and lighting and airconditioner units in government buildings; and disseminating information about energy savings and conducting other awareness activities. The International Institute for Energy Conservation has concluded that EdL could save more than GWh yearly through the implementation of DSM/EE activities (IIEC).
7 Also referred to as the “new National Energy Savings (Energy Efficiency and Conservation) Law.”8 A component under the Rural Electrification Adoptable Program Lending Phase 1 Project (REP I).
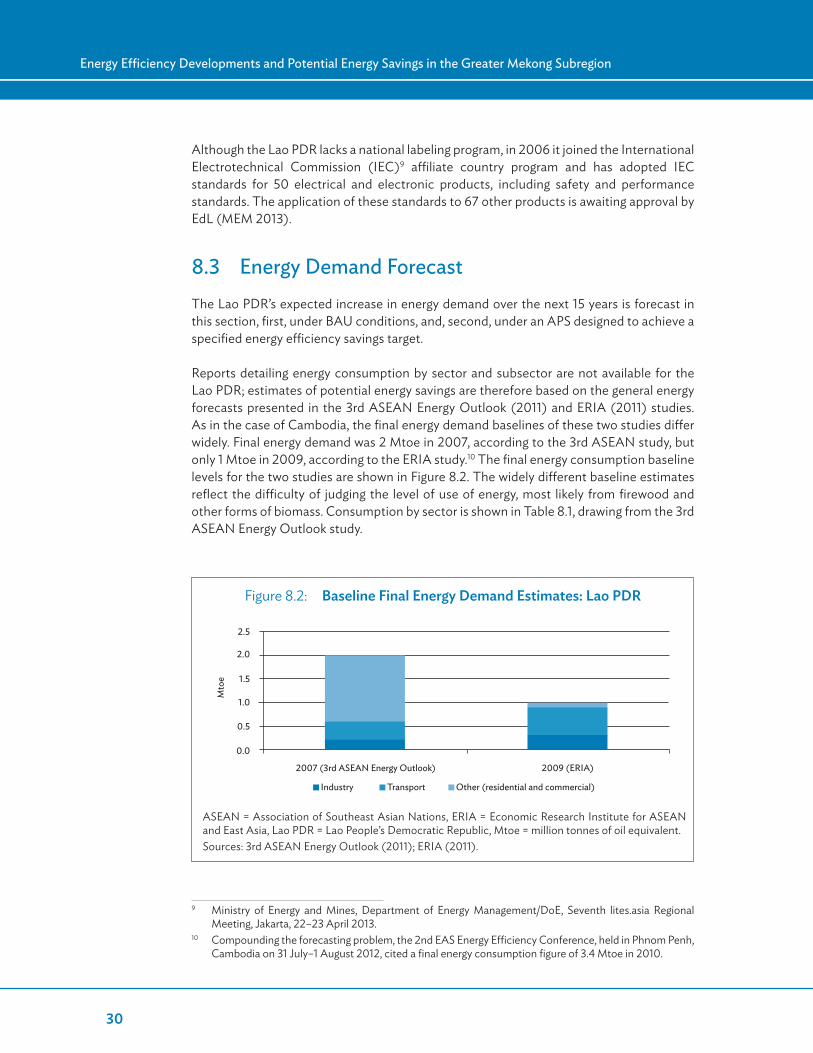
30
Energy Efficiency Developments and Potential Energy Savings in the Greater Mekong Subregion
Although the Lao PDR lacks a national labeling program, in 2006 it joined the International Electrotechnical Commission (IEC)9 affiliate country program and has adopted IEC standards for 50 electrical and electronic products, including safety and performance standards. The application of these standards to 67 other products is awaiting approval by EdL (MEM 2013).
8.3 Energy Demand ForecastThe Lao PDR’s expected increase in energy demand over the next 15 years is forecast in this section, first, under BAU conditions, and, second, under an APS designed to achieve a specified energy efficiency savings target.
Reports detailing energy consumption by sector and subsector are not available for the Lao PDR; estimates of potential energy savings are therefore based on the general energy forecasts presented in the 3rd ASEAN Energy Outlook (2011) and ERIA (2011) studies. As in the case of Cambodia, the final energy demand baselines of these two studies differ widely. Final energy demand was 2 Mtoe in 2007, according to the 3rd ASEAN study, but only 1 Mtoe in 2009, according to the ERIA study.10 The final energy consumption baseline levels for the two studies are shown in Figure 8.2. The widely different baseline estimates reflect the difficulty of judging the level of use of energy, most likely from firewood and other forms of biomass. Consumption by sector is shown in Table 8.1, drawing from the 3rd ASEAN Energy Outlook study.
9 Ministry of Energy and Mines, Department of Energy Management/DoE, Seventh lites.asia Regional Meeting, Jakarta, 22–23 April 2013.
10 Compounding the forecasting problem, the 2nd EAS Energy Efficiency Conference, held in Phnom Penh, Cambodia on 31 July–1 August 2012, cited a final energy consumption figure of 3.4 Mtoe in 2010.
Figure 8.2: Baseline Final Energy Demand Estimates: Lao PDR
ASEAN = Association of Southeast Asian Nations, ERIA = Economic Research Institute for ASEAN and East Asia, Lao PDR = Lao People’s Democratic Republic, Mtoe = million tonnes of oil equivalent. Sources: 3rd ASEAN Energy Outlook (2011); ERIA (2011).
2007 (3rd ASEAN Energy Outlook) 2009 (ERIA)
Mto
e
Industry Transport Other (residential and commercial)
0.5
0.0
1.0
1.5
2.0
2.5
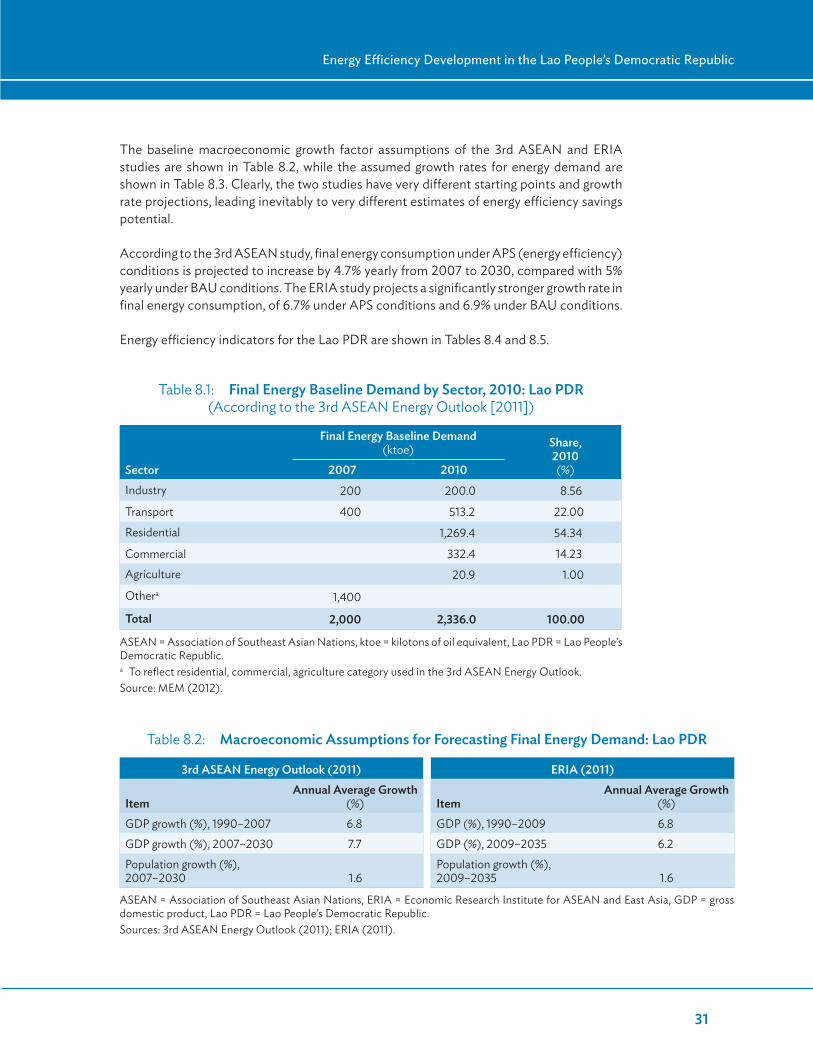
31
Energy Efficiency Development in the Lao People’s Democratic Republic
The baseline macroeconomic growth factor assumptions of the 3rd ASEAN and ERIA studies are shown in Table 8.2, while the assumed growth rates for energy demand are shown in Table 8.3. Clearly, the two studies have very different starting points and growth rate projections, leading inevitably to very different estimates of energy efficiency savings potential.
According to the 3rd ASEAN study, final energy consumption under APS (energy efficiency) conditions is projected to increase by 4.7% yearly from 2007 to 2030, compared with 5% yearly under BAU conditions. The ERIA study projects a significantly stronger growth rate in final energy consumption, of 6.7% under APS conditions and 6.9% under BAU conditions.
Energy efficiency indicators for the Lao PDR are shown in Tables 8.4 and 8.5.
Table 8.1: Final Energy Baseline Demand by Sector, 2010: Lao PDR (According to the 3rd ASEAN Energy Outlook [2011])
Sector
Final Energy Baseline Demand (ktoe) Share,
2010 (%)2007 2010
Industry 200 200.0 8.56
Transport 400 513.2 22.00
Residential 1,269.4 54.34
Commercial 332.4 14.23Agriculture 20.9 1.00
Othera 1,400
Total 2,000 2,336.0 100.00
ASEAN = Association of Southeast Asian Nations, ktoe = kilotons of oil equivalent, Lao PDR = Lao People’s Democratic Republic.a To reflect residential, commercial, agriculture category used in the 3rd ASEAN Energy Outlook.Source: MEM (2012).
Table 8.2: Macroeconomic Assumptions for Forecasting Final Energy Demand: Lao PDR
3rd ASEAN Energy Outlook (2011) ERIA (2011)
ItemAnnual Average Growth
(%) ItemAnnual Average Growth
(%)GDP growth (%), 1990–2007 6.8 GDP (%), 1990–2009 6.8GDP growth (%), 2007–2030 7.7 GDP (%), 2009–2035 6.2Population growth (%), 2007–2030 1.6
Population growth (%), 2009–2035 1.6
ASEAN = Association of Southeast Asian Nations, ERIA = Economic Research Institute for ASEAN and East Asia, GDP = gross domestic product, Lao PDR = Lao People’s Democratic Republic.Sources: 3rd ASEAN Energy Outlook (2011); ERIA (2011).

32
Energy Efficiency Developments and Potential Energy Savings in the Greater Mekong Subregion
Table 8.3: Energy Consumption Growth Forecasts: Lao PDR
3rd ASEAN Energy Outlook (2011) ERIA (2011)
Period
Average Annual Primary Energy Consumption Growth
(%) Period
Average Annual Primary Energy Consumption Growth
(%)2007–2030, BAU case 6.3 2009–2035, BAU case 8.12007–2030, APS case 6.0 2009–2035, APS case 8.0
Period
Average Annual Final Energy Consumption Growth
(%) Period
Average Annual Final Energy Consumption Growth
(%)1990–2007 3.2 1995–2009 8.72007–2030, BAU case 5.0 2009–2035, BAU case 6.92007–2030, APS case 4.7 2009–2035, APS case 6.7
APS = alternative policy scenario, ASEAN = Association of Southeast Asian Nations, BAU = business as usual, ERIA = Economic Research Institute for ASEAN and East Asia, Lao PDR = Lao People’s Democratic Republic.Sources: 3rd ASEAN Energy Outlook (2011); ERIA (2011).
Table 8.5: Final Energy Consumption Elasticity Estimates: Lao PDR
Item
3rd ASEAN Energy Outlook (2011)(2007–2030)
ERIA (2011)(2009–2035)
Average Primary Energy Elasticity of GDPBAU case 0.82 1.31APS case 0.78 1.29Average Final Energy Elasticity of GDP BAU case 0.65 1.11APS case 0.61 1.08
APS = alternative policy scenario, ASEAN = Association of Southeast Asian Nations, BAU = business as usual, ERIA = Economic Research Institute for ASEAN and East Asia, GDP = gross domestic product, Lao PDR = Lao People’s Democratic Republic.Sources: 3rd ASEAN Energy Outlook (2011); ERIA (2011).
Table 8.4: Final Energy Consumption Intensity Estimates: Lao PDR (toe/$ million)
Data Source 1990 2005 2007 2009 2020 2030 20353rd ASEAN Energy Outlook (2011) BAU 1,267 750 741 507 400
APS 479 380
ERIA (2011) BAU 222 208 313 288 362
APS 274 349
APS = alternative policy scenario, ASEAN = Association of Southeast Asian Nations, BAU = business as usual, ERIA = Economic Research Institute for ASEAN and East Asia, Lao PDR = Lao People’s Democratic Republic, toe = tons of oil equivalent.Sources: 3rd ASEAN Energy Outlook (2011); ERIA (2011).
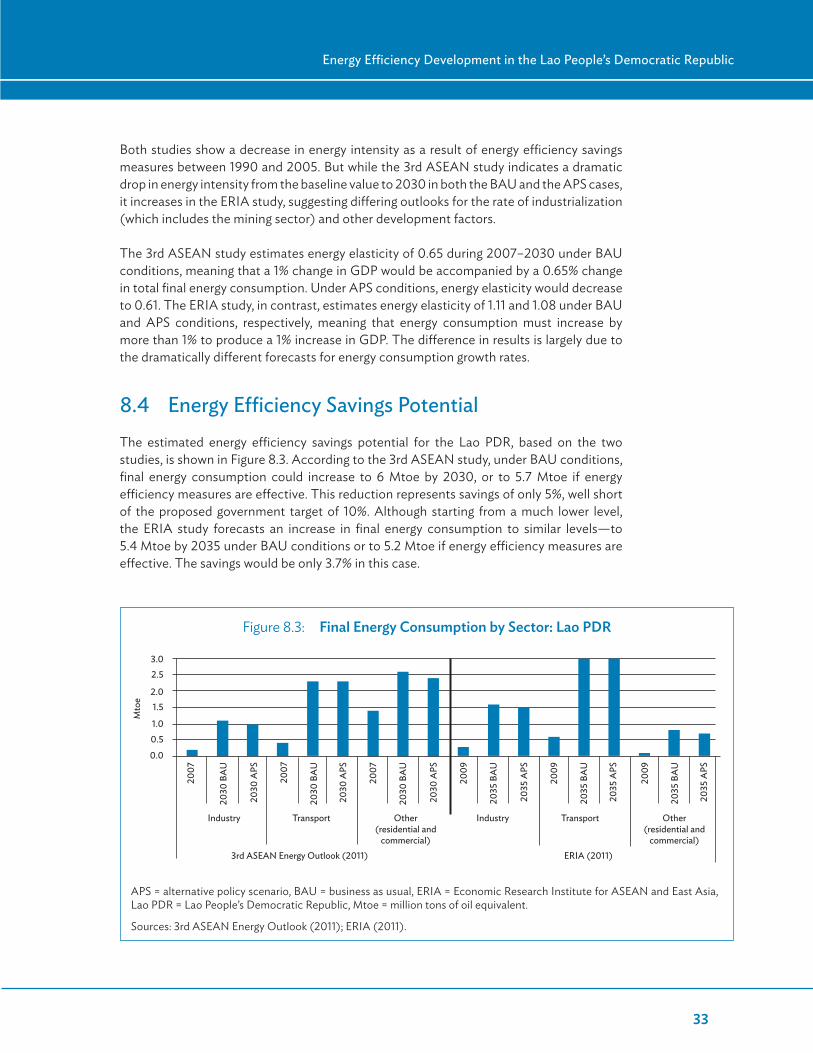
33
Energy Efficiency Development in the Lao People’s Democratic Republic
Both studies show a decrease in energy intensity as a result of energy efficiency savings measures between 1990 and 2005. But while the 3rd ASEAN study indicates a dramatic drop in energy intensity from the baseline value to 2030 in both the BAU and the APS cases, it increases in the ERIA study, suggesting differing outlooks for the rate of industrialization (which includes the mining sector) and other development factors.
The 3rd ASEAN study estimates energy elasticity of 0.65 during 2007–2030 under BAU conditions, meaning that a 1% change in GDP would be accompanied by a 0.65% change in total final energy consumption. Under APS conditions, energy elasticity would decrease to 0.61. The ERIA study, in contrast, estimates energy elasticity of 1.11 and 1.08 under BAU and APS conditions, respectively, meaning that energy consumption must increase by more than 1% to produce a 1% increase in GDP. The difference in results is largely due to the dramatically different forecasts for energy consumption growth rates.
8.4 Energy Efficiency Savings PotentialThe estimated energy efficiency savings potential for the Lao PDR, based on the two studies, is shown in Figure 8.3. According to the 3rd ASEAN study, under BAU conditions, final energy consumption could increase to 6 Mtoe by 2030, or to 5.7 Mtoe if energy efficiency measures are effective. This reduction represents savings of only 5%, well short of the proposed government target of 10%. Although starting from a much lower level, the ERIA study forecasts an increase in final energy consumption to similar levels—to 5.4 Mtoe by 2035 under BAU conditions or to 5.2 Mtoe if energy efficiency measures are effective. The savings would be only 3.7% in this case.
Figure 8.3: Final Energy Consumption by Sector: Lao PDR
APS = alternative policy scenario, BAU = business as usual, ERIA = Economic Research Institute for ASEAN and East Asia, Lao PDR = Lao People’s Democratic Republic, Mtoe = million tons of oil equivalent.
Sources: 3rd ASEAN Energy Outlook (2011); ERIA (2011).
0.0
0.51.0
1.52.0
2.53.0
Mto
e
Industry
2007
2030
BA
U
2030
APS
2030
BA
U
2030
APS
2007
2030
BA
U
2030
APS
2009
2035
BA
U
2035
APS
2009
2035
BA
U
2035
APS
2009
2035
BA
U
2035
APS
Transport Other (residential and
commercial)
Industry Transport Other (residential and
commercial)3rd ASEAN Energy Outlook (2011) ERIA (2011)
2007

34
Energy Efficiency Developments and Potential Energy Savings in the Greater Mekong Subregion
The differences in sector outcomes between the two studies suggest that an updated and more intensive review is needed for the Lao PDR. The 3rd ASEAN Energy Outlook study indicates that the residential and commercial sector will be the main consumer, followed closely by the transport sector. APS conditions result in energy savings in the residential and commercial and industry sectors, but not in the transport sector, and this same situation holds true in the ERIA study, bringing into question the effectiveness of the energy efficiency measures, particularly since the transport sector is shown to be the dominant consumer by 2035.
Table 8.6 presents the percentage savings by sector in final energy consumption. According to the 3rd ASEAN Energy Outlook study, industry could experience savings of 9%, and the residential and commercial sector, savings of 8%. According to the ERIA study, on the other hand, the final energy consumption savings could amount to 6% in the industry sector and almost 13% in the residential and commercial sector.
8.5 Summary 0f Energy Efficiency Savings PotentialThe Lao PDR is at an early stage of deployment of energy efficiency measures. A strategy and policy for energy efficiency and conservation is reportedly awaiting approval by the government. Energy efficiency guidelines have also been prepared for the residential, building, and industry sectors. Various donor-assisted programs past and present have helped introduce energy efficiency measures, including highly practical means of improving efficiency in government buildings and IEC standards for selected electrical and electronic products. Public awareness efforts have also been emphasized. However, without a strong institutional, policy, and regulatory framework for energy efficiency, “expected developments in energy efficiency have not materialized” (ADB 2011a).
Table 8.6: Final Energy Consumption Savings, by Sector: Lao PDR
3rd ASEAN Energy Outlook (2011) ERIA (2011)
Sector
Final Energy Demand Savings
(Mtoe)% Reduction (BAU-APS)
Final Energy Demand Savings
(Mtoe)% Reduction (BAU-APS)
2020 2030 2020 2030 2020 2035 2020 2035Industry 0.0 0.1 0.0 9.1 0.0 0.1 0.0 6.3Transport 0.0 0.0 0.0 0.0 0.0 0.0 0.0 0.0Other (residential and commercial) 0.2 0.2 10.5 7.7 0.0 0.1 0.0 12.5Total 0.2 0.3 5.4 5.0 0.1 0.2 4.8 3.7
APS = alternative policy scenario, ASEAN = Association of Southeast Asian Nations, BAU = business as usual, ERIA = Economic Research Institute for ASEAN and East Asia, Lao PDR= Lao People’s Democratic Republic, Mtoe = million tons of oil equivalent.Sources: 3rd ASEAN Energy Outlook (2011); ERIA (2011).
35
Energy Efficiency Development in the Lao People’s Democratic Republic
The government has set a preliminary energy savings target of 10% by 2025. By analyzing the possible savings for the Lao PDR if an APS were to be implemented rather than simply BAU conditions, the 3rd ASEAN and ERIA studies start the government off toward that target. But perhaps reflecting the current lack of an energy efficiency framework, the energy savings indicated in the two studies are far short of the 10% target. Further, the studies give mixed signals as to where the savings potential may be highest—the industry sector (according to the 3rd ASEAN study) or the residential and commercial sector (according to the ERIA study). Their differing results reflect widely differing starting points and growth estimates, including those for baseline data. A firmer basis for charting the energy efficiency savings potential of the Lao PDR is clearly needed. Even so, it is apparent that with a well-designed and well-implemented energy efficiency strategy and policy, significant savings are achievable.
36
The heavy economic sanctions imposed in the late 1980s, after Myanmar suspended civil liberties, hampered the development of the energy sector and the economy. The political and economic reforms introduced by the new government in
March 2011 have led to the lifting or easing of the sanctions and a surge in foreign direct investment (FDI) inflows, notably into the country’s rich hydropower and oil and gas sectors. But despite its energy potential, Myanmar is an example of “energy poverty” (IEA 2012). Per capita energy consumption of electricity in the country is among the lowest in Asia, with only a quarter of the general population having access to electricity services. The proportion is even lower in most rural areas, where firewood and animal dung are the primary energy sources, contributing to acute respiratory problems, onerous labor chores for women, and deforestation. Biomass accounts for almost 70% of Myanmar’s energy supply. Energy efficiency in this context needs to focus on inclusive growth and overcoming energy poverty.
Reflecting the reforms and FDI surge, Myanmar’s economy is projected to grow by about 9% yearly, on average, up to 2030. In parallel, final energy consumption is also increasing rapidly because of industrialization and increasing residential and commercial use. However, there are no publicly available reports detailing energy consumption by sector or subsector. For that reason, the estimates of potential energy efficiency savings in this section are based on the general energy forecasts in the 3rd ASEAN Energy Outlook (2011) and ERIA (2011) studies.
9.1 Institutional Framework for the Energy SectorThe Ministry of Energy (MOE) is the primary ministerial entity responsible for energy policy and coordination in Myanmar. Six other ministries are responsible for various energy-related aspects, as follows:
• Ministry of Electric Power (gas and hydropower sectors, power distribution sector),
• Ministry of Industry (energy efficiency),• Ministry of Mines (coal),• Ministry of Agriculture and Irrigation (biofuels and microhydro for irrigation),• Ministry of Science and Technology (renewable energy), and• Ministry of Environmental Conservation and Forestry (fuelwood, climate change,
environmental safeguard requirements).
9 Energy Efficiency Development in Myanmar

37
Energy Efficiency Development in Myanmar
Of particular note is the Ministry of Industry’s responsibility for energy efficiency, largely delegated to its Central Research and Development Department. Also noteworthy is the Ministry of Construction’s responsibility for energy use in buildings.11 Myanmar’s Engineering Society is working with various government groups and with international and local nongovernment organizations to raise awareness of energy efficiency and conservation.
Myanmar’s energy policy has four main objectives (ADB 2012a):
• maintain energy independence,• expand the use of new and renewable energy sources,• encourage energy efficiency and conservation, and• promote household use of alternative fuels.
Further objectives were expressed by MOE in 2011:
• control fuelwood consumption,• generate electric power efficiently and minimize distribution losses,• strengthen international cooperation in energy efficiency and conservation, and• reduce growth in energy consumption and apply energy-efficient technologies.
9.2 Evolving Energy Efficiency Policy FrameworkThe government has acknowledged the urgent need for a master plan for energy efficiency and conservation (EE&C) (MOE 2011). Accordingly, the National Energy Management Committee and the Energy Development Committee are formulating a policy framework based on Notification No. 12/2013 (Formation of National Energy Management Committee and of Energy Management Committee) with the following goals:12
• establish a legal and regulatory framework;• create a dedicated department for energy efficiency initiatives;• formulate a funding mechanism for EE&C initiatives; • develop energy-saving codes, labels, and standards;• develop training methods and materials for the effective management of EE&C;• promote public awareness and capacity building for energy efficiency;• conduct a survey of energy consumption in all enterprises and industries; • demonstrate energy audits in the most energy-intensive industries;• reduce energy cost and increase economic competitiveness;• seek to decouple energy consumption from economic growth; and • reduce greenhouse gas emissions.
The government has developed a 5-year work plan for achieving these goals and policies. EE&C-related activities so far have included workshops for institutional strengthening and
11 Regional Workshop on Strengthening Institutional Capacity to Support Energy Efficiency in Asian Countries, Bangkok, 26 March 2010
12 Supporting of the National Level Energy Efficiency Implementation Program in Myanmar, a paper presented to the SEF-7 Regional Workshop held in Vientiane, Lao PDR on 9–10 October 2013.
38
Energy Efficiency Developments and Potential Energy Savings in the Greater Mekong Subregion
capacity building, and participation in the ASEAN Energy Awards and Energy Manager accreditation programs. MOE and the Ministry of Industry have cooperated with Thailand’s Department of Alternative Energy Development and Efficiency (DEDE) in producing annual energy statistics reports and in conducting training in energy audits. Under the ASEAN Energy Management Scheme (AEMAS), 50 energy managers were certified between 2010 and 2013 (MOE 2011).
9.3 Energy Efficiency Performance TargetsA consolidated energy efficiency strategic plan has not yet been fully formulated, but some performance targets have been set by the government:
• reduce primary energy consumption by 5% by 2020, and by 8% by 2030, as compared with the 2005 level (ADB 2012b);
• improve energy efficiency by 16% in all sectors by 2030 (MOE 2013); • reduce consumption by 10% in the industry sector by 2020, by promoting and
introducing equipment and facilities with high energy conservation capacity (MOE 2011); and
• reduce consumption by 5%–8% in the commercial and residential sector by 2020 through labeling systems and other demand-side management initiatives (MOE 2011).
These are preliminary targets, unsubstantiated as yet by detailed analysis as to their achievability or as to where energy efficiency savings could most effectively be gained.
9.4 Energy Demand ForecastTo gauge where energy efficiency savings could be obtained most effectively, Myanmar’s medium- to long-term energy demand outlook must be estimated, not only in total but also by sector. As indicated in the other country sections in this report, the two primary studies available on energy efficiency savings potential in GMS are the 3rd ASEAN Energy Outlook (2011) and ERIA (2011) studies. However, as shown in Figure 9.1, the two studies have very different baseline estimates of final energy demand—14 Mtoe (2007) for the 3rd ASEAN study and 3.9 Mtoe (2009) for the ERIA study.
As shown in Tables 9.1 and 9.2, the two studies also have very different assumptions regarding the long-term rate of economic growth and the rate of increase in energy demand. The 3rd ASEAN study assumes a higher GDP growth rate than the ERIA study, but the assumed rate of increase in energy consumption is half that of the ERIA study. Final energy consumption under an APS of energy efficiency is projected to increase by 3.4% yearly between 2007 and 2030, from 14 Mtoe to 32 Mtoe, according to the 3rd ASEAN study, compared with 7.3% yearly between 2009 and 2035, from 4.7 Mtoe to 25 Mtoe, according to the ERIA study.
But the two studies agree that energy efficiency savings would result from an APS of energy efficiency, as compared with BAU.

39
Energy Efficiency Development in Myanmar
Figure 9.1: Baseline Estimates of Final Energy Demand: Myanmar
ASEAN = Association of Southeast Asian Nations, ERIA = Economic Research Institute for ASEAN and East Asia, Mtoe = million tons of oil equivalent,.Sources: 3rd ASEAN Energy Outlook (2011); ERIA (2011).
2007 (3rd ASEAN Energy Outlook) 2009 (ERIA)
Mto
e
Industry Other (residential and commercial)
Transport Non-energy
0
5
10
15
Table 9.2: Energy Consumption Growth Forecasts: Myanmar
3rd ASEAN Energy Outlook (2011) ERIA (2011)
Period
Average Annual Primary Energy Consumption Growth
(%) Period
Average Annual Primary Energy Consumption Growth
(%)2007–2030, BAU case 3.6 2009–2035, BAU case 6.22007–2030, APS case 3.2 2009–2035, APS case 5.9
Period
Average Annual Final Energy Consumption Growth
(%) Period
Average Annual Final Energy Consumption Growth
(%)1990–2007 2.4 1995– 2009 7.62007–2030, BAU case 3.7 2009–2035, BAU case 7.62007–2030, APS case 3.4 2009–2035, APS case 7.3
APS = alternative policy scenario, ASEAN = Association of Southeast Asian Nations, BAU = business as usual, ERIA = Economic Research Institute for ASEAN and East Asia.Sources: 3rd ASEAN Energy Outlook (2011); ERIA (2011).
Table 9.1: Energy Demand Macroeconomic Assumptions: Myanmar
3rd ASEAN Energy Outlook (2011) ERIA (2011)
ItemAnnual Average Growth
(%) ItemAnnual Average Growth
(%)GDP growth (%), 1990–2007 11.7 GDP (%), 1990–2009 9.1GDP growth (%), 2007–2030 9.3 GDP (%), 2009–2035 8.5Population growth (%), 2007–2030 1.7
Population growth (%), 2009–2035 1.8
ASEAN = Association of Southeast Asian Nations, ERIA = Economic Research Institute for ASEAN and East Asia, GDP = gross domestic product.Sources: 3rd ASEAN Energy Outlook (2011); ERIA (2011).

40
Energy Efficiency Developments and Potential Energy Savings in the Greater Mekong Subregion
9.5 Energy Efficiency IndicatorsThe increase in energy consumption in parallel with increasing GDP growth is reflected in the two main indicators of energy efficiency—energy intensity and energy elasticity. The energy efficiency indicators under the BAU and APS cases are shown in Table 9.3. The 3rd ASEAN study has a much higher baseline estimate for energy intensity but falling sharply over the forecast period up to 2030. The ERIA study indicates a much more moderate decrease in energy intensity. The decrease in energy intensity simply indicates that more economic output (GDP) can be gained per unit of energy input.
Table 9.3: Final Energy Intensity Estimates: Myanmar (toe/$ million)
Data Source 1990 2005 2007 2009 2020 2030 20353rd ASEAN Energy Outlook (2011) BAU 3,654 1,068 819 368 249
APS 337 230
ERIA (2011) BAU 270 346 207 204 167
APS 190 155
APS = alternative policy scenario, ASEAN = Association of Southeast Asian Nations, BAU = business as usual, toe = tons of oil equivalent.Sources: 3rd ASEAN Energy Outlook (2011); ERIA (2011).
Table 9.4: Final Energy Elasticity Estimates: Myanmar
Item
3rd ASEAN Energy Outlook (2011) (2007–2030)
ERIA (2011) (2009–2035)
Average Primary Energy Elasticity of GDPBAU case 0.39 0.73APS case 0.34 0.69Average Final Energy Elasticity of GDP BAU case 0.40 0.89APS case 0.37 0.86
APS = alternative policy scenario, ASEAN = Association of Southeast Asian Nations, BAU = business as usual, ERIA = Economic Research Institute for ASEAN and East Asia, GDP = gross domestic product.Sources: 3rd ASEAN Energy Outlook (2011); ERIA (2011).
Energy elasticity, the other main indicator of energy efficiency, indicates the tie between energy input and GDP output. As shown in Table 9.4, the 3rd ASEAN study estimates an energy/GDP elasticity of 0.40 for the period up to 2030, meaning that a 1% change in GDP would be accompanied by a change of about 0.40% in total final energy consumption. Under APS conditions, energy elasticity drops to 0.37, indicating gains in energy efficiency. The ERIA study estimates much higher energy elasticity ratios, of 0.89 for BAU and 0.86 for the APS case. The differences in estimates of energy elasticity reflect the dramatically different assumptions about increases in energy consumption and the sector distribution.
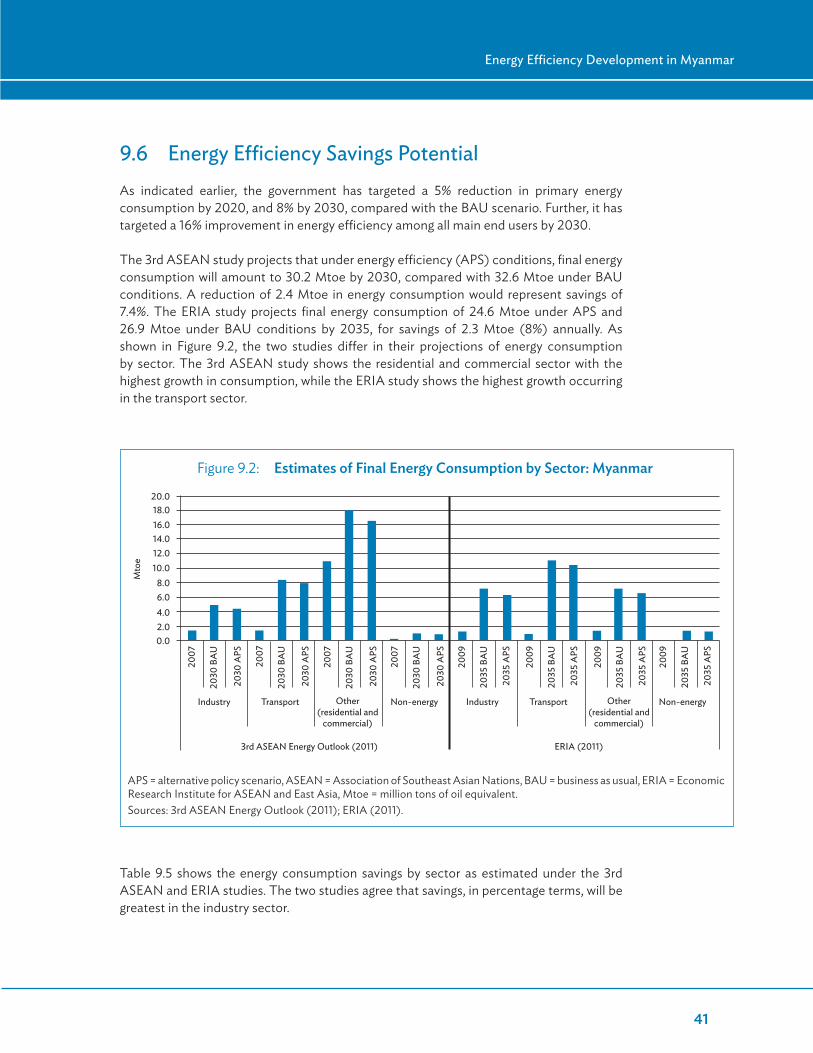
41
Energy Efficiency Development in Myanmar
9.6 Energy Efficiency Savings PotentialAs indicated earlier, the government has targeted a 5% reduction in primary energy consumption by 2020, and 8% by 2030, compared with the BAU scenario. Further, it has targeted a 16% improvement in energy efficiency among all main end users by 2030.
The 3rd ASEAN study projects that under energy efficiency (APS) conditions, final energy consumption will amount to 30.2 Mtoe by 2030, compared with 32.6 Mtoe under BAU conditions. A reduction of 2.4 Mtoe in energy consumption would represent savings of 7.4%. The ERIA study projects final energy consumption of 24.6 Mtoe under APS and 26.9 Mtoe under BAU conditions by 2035, for savings of 2.3 Mtoe (8%) annually. As shown in Figure 9.2, the two studies differ in their projections of energy consumption by sector. The 3rd ASEAN study shows the residential and commercial sector with the highest growth in consumption, while the ERIA study shows the highest growth occurring in the transport sector.
Figure 9.2: Estimates of Final Energy Consumption by Sector: Myanmar
APS = alternative policy scenario, ASEAN = Association of Southeast Asian Nations, BAU = business as usual, ERIA = Economic Research Institute for ASEAN and East Asia, Mtoe = million tons of oil equivalent.Sources: 3rd ASEAN Energy Outlook (2011); ERIA (2011).
Industry Transport Non-energy Industry Transport Non-energy
0.02.04.06.08.0
10.012.014.016.018.020.0
Mto
e
2007
2030
BA
U
2030
APS
2030
BA
U
2030
APS
2007
2030
BA
U
2030
APS
2007
2030
BA
U
2030
APS
2009
2035
BA
U
2035
APS
2009
2035
BA
U
2035
APS
2009
2035
BA
U
2035
APS
2009
2035
BA
U
2035
APS
2007
Other (residential and
commercial)
Other (residential and
commercial)
3rd ASEAN Energy Outlook (2011) ERIA (2011)
Table 9.5 shows the energy consumption savings by sector as estimated under the 3rd ASEAN and ERIA studies. The two studies agree that savings, in percentage terms, will be greatest in the industry sector.
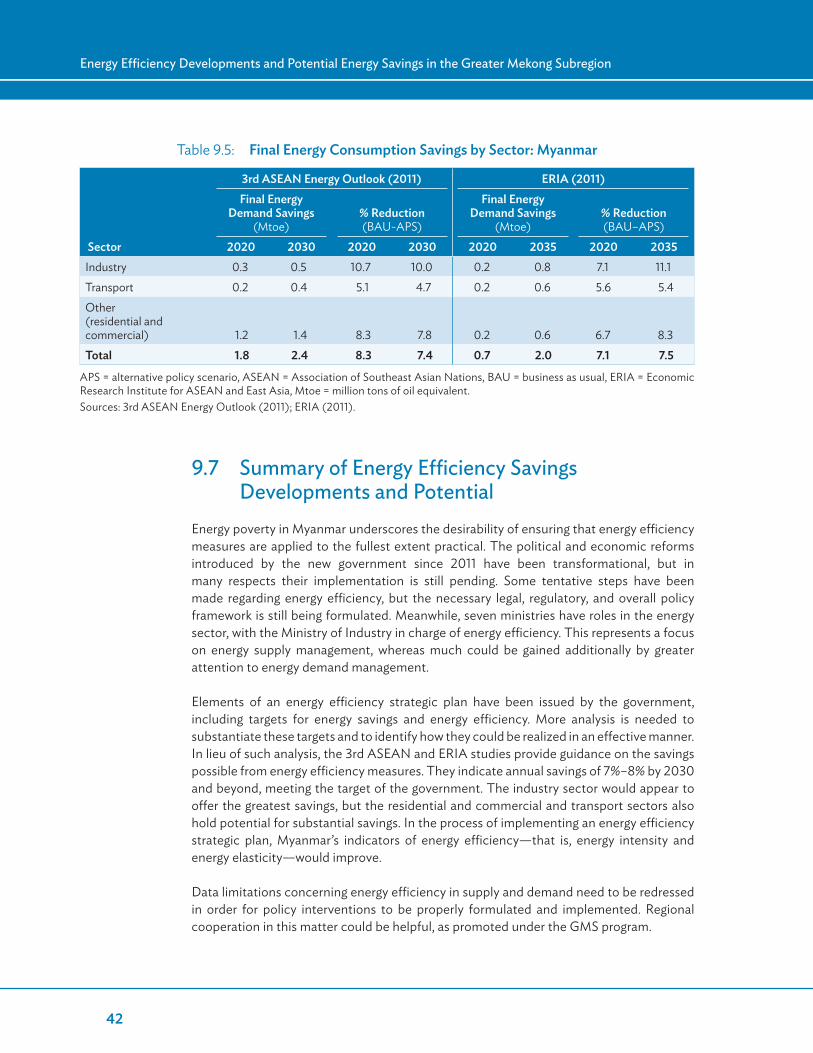
42
Energy Efficiency Developments and Potential Energy Savings in the Greater Mekong Subregion
9.7 Summary of Energy Efficiency Savings Developments and Potential
Energy poverty in Myanmar underscores the desirability of ensuring that energy efficiency measures are applied to the fullest extent practical. The political and economic reforms introduced by the new government since 2011 have been transformational, but in many respects their implementation is still pending. Some tentative steps have been made regarding energy efficiency, but the necessary legal, regulatory, and overall policy framework is still being formulated. Meanwhile, seven ministries have roles in the energy sector, with the Ministry of Industry in charge of energy efficiency. This represents a focus on energy supply management, whereas much could be gained additionally by greater attention to energy demand management.
Elements of an energy efficiency strategic plan have been issued by the government, including targets for energy savings and energy efficiency. More analysis is needed to substantiate these targets and to identify how they could be realized in an effective manner. In lieu of such analysis, the 3rd ASEAN and ERIA studies provide guidance on the savings possible from energy efficiency measures. They indicate annual savings of 7%–8% by 2030 and beyond, meeting the target of the government. The industry sector would appear to offer the greatest savings, but the residential and commercial and transport sectors also hold potential for substantial savings. In the process of implementing an energy efficiency strategic plan, Myanmar’s indicators of energy efficiency—that is, energy intensity and energy elasticity—would improve.
Data limitations concerning energy efficiency in supply and demand need to be redressed in order for policy interventions to be properly formulated and implemented. Regional cooperation in this matter could be helpful, as promoted under the GMS program.
Table 9.5: Final Energy Consumption Savings by Sector: Myanmar
3rd ASEAN Energy Outlook (2011) ERIA (2011)
Sector
Final Energy Demand Savings
(Mtoe)% Reduction (BAU-APS)
Final Energy Demand Savings
(Mtoe)% Reduction (BAU–APS)
2020 2030 2020 2030 2020 2035 2020 2035Industry 0.3 0.5 10.7 10.0 0.2 0.8 7.1 11.1Transport 0.2 0.4 5.1 4.7 0.2 0.6 5.6 5.4Other (residential and commercial) 1.2 1.4 8.3 7.8 0.2 0.6 6.7 8.3Total 1.8 2.4 8.3 7.4 0.7 2.0 7.1 7.5
APS = alternative policy scenario, ASEAN = Association of Southeast Asian Nations, BAU = business as usual, ERIA = Economic Research Institute for ASEAN and East Asia, Mtoe = million tons of oil equivalent.Sources: 3rd ASEAN Energy Outlook (2011); ERIA (2011).

43
Thailand is well advanced in the management of the energy sector and the government has charted an ambitious course for the development of renewable energy and greater efficiency in energy supply and use. Success in achieving both is
vital for inclusive and sustainable growth.
As noted in the companion publication Renewable Energy Developments and Potential in the Greater Mekong Subregion, Thailand is heavily reliant on energy imports, with imported oil accounting for 80% of domestic oil consumption. To reduce this dependence and Thailand’s greenhouse-gas emissions, the national energy policy has the underlying objective of an “energy sufficiency society.”
10.1 Institutional Framework for the Energy SectorThe Ministry of Energy (MOE) is responsible for energy policy, regulation, and development. As shown in Figure 10.1, the ministry has five departments and four state agencies. The Department of Alternative Energy Development and Efficiency (DEDE) is the main agency promoting energy efficiency. The Energy Policy and Planning Office is responsible for overall energy policy and planning, including for renewable energy and energy efficiency.
The four state agencies operationalize key MOE responsibilities. The Electricity Generating Authority of Thailand (EGAT) is responsible for power system planning and development, electric power generation and transmission, bulk electric energy sales, and demand-side management (DSM). The Metropolitan Electricity Authority carries out the distribution and retail functions in the Bangkok Metropolitan Area, as well as for the provinces of Nonthaburi and Samut Prakan. The distribution and retail functions for other provinces are carried out by the Provincial Electricity Authority. The Energy Regulatory Commission is responsible for electricity and natural gas regulation.
10 Energy Efficiency Development in Thailand
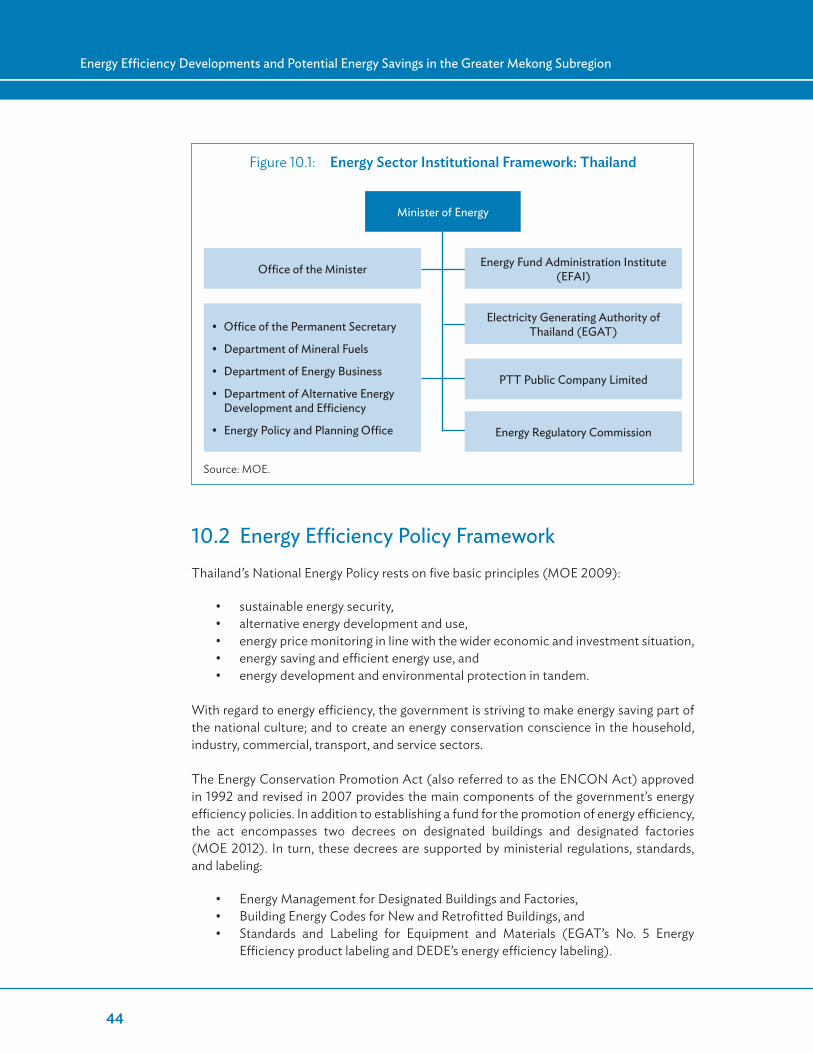
44
Energy Efficiency Developments and Potential Energy Savings in the Greater Mekong Subregion
10.2 Energy Efficiency Policy FrameworkThailand’s National Energy Policy rests on five basic principles (MOE 2009):
• sustainable energy security,• alternative energy development and use,• energy price monitoring in line with the wider economic and investment situation,• energy saving and efficient energy use, and• energy development and environmental protection in tandem.
With regard to energy efficiency, the government is striving to make energy saving part of the national culture; and to create an energy conservation conscience in the household, industry, commercial, transport, and service sectors.
The Energy Conservation Promotion Act (also referred to as the ENCON Act) approved in 1992 and revised in 2007 provides the main components of the government’s energy efficiency policies. In addition to establishing a fund for the promotion of energy efficiency, the act encompasses two decrees on designated buildings and designated factories (MOE 2012). In turn, these decrees are supported by ministerial regulations, standards, and labeling:
• Energy Management for Designated Buildings and Factories,• Building Energy Codes for New and Retrofitted Buildings, and• Standards and Labeling for Equipment and Materials (EGAT’s No. 5 Energy
Efficiency product labeling and DEDE’s energy efficiency labeling).
Figure 10.1: Energy Sector Institutional Framework: Thailand
Source: MOE.
Minister of Energy
Office of the Minister
• Office of the Permanent Secretary
• Department of Mineral Fuels
• Department of Energy Business
• Department of Alternative Energy Development and Efficiency
• Energy Policy and Planning Office
Energy Fund Administration Institute (EFAI)
Electricity Generating Authority of Thailand (EGAT)
PTT Public Company Limited
Energy Regulatory Commission

45
Energy Efficiency Development in Thailand
Designated buildings and factories require one or more energy managers and the submission of yearly energy management reports to DEDE. Currently, there are about 8,000 designated factories and buildings in the country.
Building energy codes for new buildings apply to hospitals, office buildings, hotels, department stores, theaters, academic institutes, condominiums, exhibition buildings, and entertainment centers. The code components cover the building envelope, lighting, air conditioning and hot water systems, renewable energy use, and the performance of the whole building. EGAT’s energy-efficient labeling program covers 18 types of electrical appliances (including refrigerators, airconditioners, electric fans, rice cookers, fluorescent lamps, electric water heaters, and electric irons).
Thailand’s Energy Efficiency Development Plan 2011–2030 (EEDP) is complementary to ENCON. The two main objectives of EEDP are to set short-term (5-year) and long-term (20-year) energy efficiency and conservation targets, and to provide strategies and guidelines for achieving those targets.
10.3 Energy Efficiency Performance TargetsThe EEDP, approved by the National Energy Policy Council in 2012 and endorsed by the Cabinet, is part of Thailand’s Power Development Plan for 2012–2030. It targets a 25% reduction in energy intensity (the ratio of energy consumption to GDP) (MOE 2012). More specifically, it targets energy intensity of 11.7 ktoe per billion baht (B billion) by 2030, down from 15.6 ktoe/B billion in 2010. A further objective of the EEDP is to reduce energy elasticity (the percentage change in energy consumption needed to achieve a 1% change in GDP), from an average of 0.98 up to 2010 to an average of 0.70 over the next 20 years.
The 20-Year Energy Efficiency Action Plan 2011–2030 (EEAP), paired with the EEDP, was also developed in 2011. The EEAP provides for the following strategic actions (MOE 2011):
• compulsory measures through laws, regulations, and standards, together with promotion through various incentives;
• energy measures to improve awareness, consumer behavior, entrepreneurial decision making, and market transformation via campaigns and public relations activities relevant to energy savings and climate change;
• PPP for energy conservation measures;• active involvement of relevant public and private organizations, such as power
utilities and industry associations;• engagement of professionals and energy service companies in the design and
implementation of energy efficiency projects requiring high technology; and• promotion of energy technology self-reliance, together with highly energy-
efficient products, manufacturers, and businesses.

46
Energy Efficiency Developments and Potential Energy Savings in the Greater Mekong Subregion
The EEAP is to be implemented in three phases:
• 6-year short term (2011–2016);• 6-year medium term (2017–2022); and• 8-year long term (2023–2030).
The latest power demand forecast, approved by the Thailand Load Forecast Subcommittee in 2012, includes three load forecast scenarios for energy efficiency: a base case (40% target reduction), a high case (20% target reduction), and a low case (60% target reduction). MOE has since adopted a risk-averse energy efficiency implementation plan and the corresponding high-case target.
10.4 Energy Demand ForecastA necessary first step in assessing the potential for energy efficiency savings is determining long-term energy demand trends, by sector if possible. A number of studies have been carried out to assess the energy efficiency potential of certain industries or subsectors in Thailand. As in the case of Cambodia, the Lao PDR, Myanmar, and Viet Nam, the analysis of potential savings through improved energy efficiency measures in Thailand has drawn on two studies in particular:
• the 3rd ASEAN Energy Outlook study (2011) by the ASEAN Centre for Energy (ACE); the Institute of Energy Economics, Japan (IEEJ); and national Energy Supply and Security Planning in the ASEAN (ESSPA) teams; and
• Analysis on Energy Saving Potential in East Asia Region (2011) by the Economic Research Institute for ASEAN and East Asia (ERIA).
As shown in Figure 10.2, the two studies have similar final energy demand baselines—72.1 Mtoe (2007) for the 3rd ASEAN study and 73 Mtoe (2009) for the ERIA study. Consistency in the baseline data reflects the comparatively low level of biomass in Thailand’s energy consumption and the country’s advanced statistical services.
While the two studies also have similar assumptions about GDP growth rates up to 2030 and 2035, they differ significantly with regard to expected energy savings under APS (energy efficiency) conditions versus BAU conditions. The 3rd ASEAN Energy Outlook study is more optimistic: according to it, primary and final energy consumption are expected to grow at much slower rates under energy efficiency conditions than under BAU conditions. The growth rates projected in the ERIA study are also lower, but less markedly so. Tables 10.1 and 10.2 summarize the macroeconomic assumptions and expected growth rates in primary and final energy consumption for the two studies.
As shown in Table 10.3, the two studies indicate that energy intensity will be largely unchanged or will even increase somewhat over the next 20 years, presumably because of the continued growth of the manufacturing sector. According to both studies, energy intensity is likely to be less under APS than under BAU conditions.
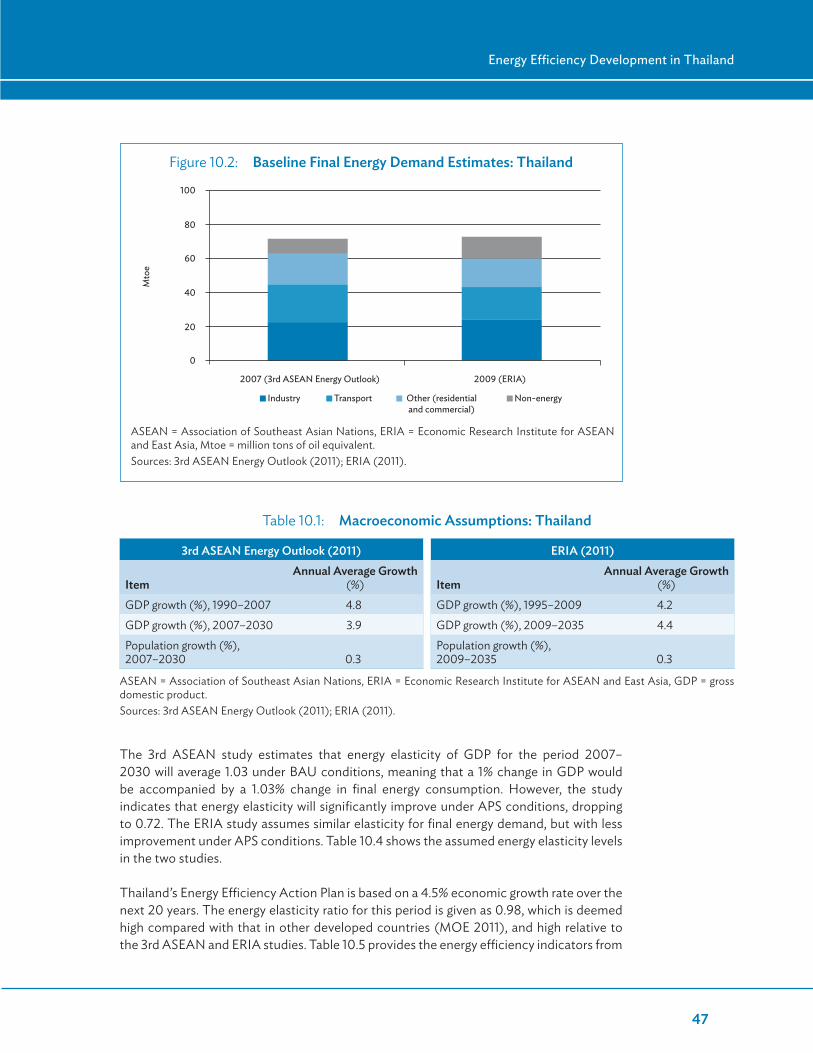
47
Energy Efficiency Development in Thailand
The 3rd ASEAN study estimates that energy elasticity of GDP for the period 2007–2030 will average 1.03 under BAU conditions, meaning that a 1% change in GDP would be accompanied by a 1.03% change in final energy consumption. However, the study indicates that energy elasticity will significantly improve under APS conditions, dropping to 0.72. The ERIA study assumes similar elasticity for final energy demand, but with less improvement under APS conditions. Table 10.4 shows the assumed energy elasticity levels in the two studies.
Thailand’s Energy Efficiency Action Plan is based on a 4.5% economic growth rate over the next 20 years. The energy elasticity ratio for this period is given as 0.98, which is deemed high compared with that in other developed countries (MOE 2011), and high relative to the 3rd ASEAN and ERIA studies. Table 10.5 provides the energy efficiency indicators from
Figure 10.2: Baseline Final Energy Demand Estimates: Thailand
ASEAN = Association of Southeast Asian Nations, ERIA = Economic Research Institute for ASEAN and East Asia, Mtoe = million tons of oil equivalent.Sources: 3rd ASEAN Energy Outlook (2011); ERIA (2011).
2007 (3rd ASEAN Energy Outlook) 2009 (ERIA)
Mto
e
Industry Transport Other (residential and commercial)
Non-energy
0
20
40
60
80
100
Table 10.1: Macroeconomic Assumptions: Thailand
3rd ASEAN Energy Outlook (2011) ERIA (2011)
ItemAnnual Average Growth
(%) ItemAnnual Average Growth
(%)GDP growth (%), 1990–2007 4.8 GDP growth (%), 1995–2009 4.2GDP growth (%), 2007–2030 3.9 GDP growth (%), 2009–2035 4.4Population growth (%), 2007–2030 0.3
Population growth (%), 2009–2035 0.3
ASEAN = Association of Southeast Asian Nations, ERIA = Economic Research Institute for ASEAN and East Asia, GDP = gross domestic product.Sources: 3rd ASEAN Energy Outlook (2011); ERIA (2011).
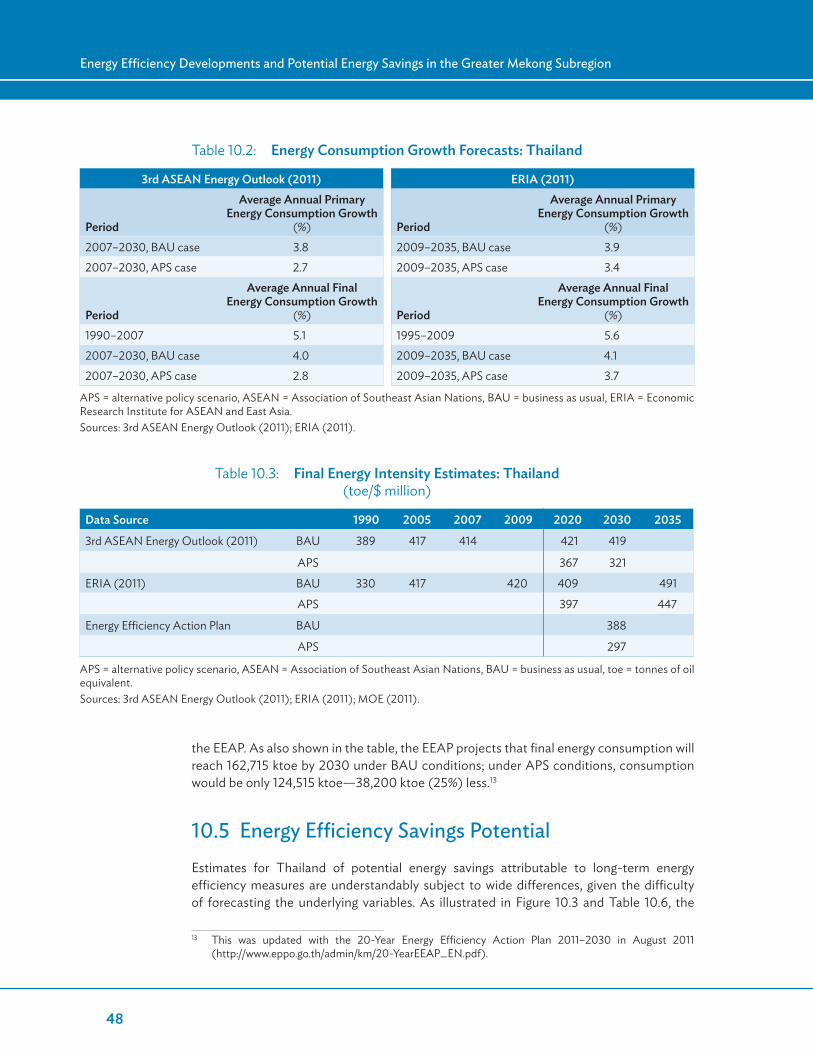
48
Energy Efficiency Developments and Potential Energy Savings in the Greater Mekong Subregion
the EEAP. As also shown in the table, the EEAP projects that final energy consumption will reach 162,715 ktoe by 2030 under BAU conditions; under APS conditions, consumption would be only 124,515 ktoe—38,200 ktoe (25%) less.13
10.5 Energy Efficiency Savings PotentialEstimates for Thailand of potential energy savings attributable to long-term energy efficiency measures are understandably subject to wide differences, given the difficulty of forecasting the underlying variables. As illustrated in Figure 10.3 and Table 10.6, the
13 This was updated with the 20-Year Energy Efficiency Action Plan 2011–2030 in August 2011 (http://www.eppo.go.th/admin/km/20-YearEEAP_EN.pdf).
Table 10.3: Final Energy Intensity Estimates: Thailand (toe/$ million)
Data Source 1990 2005 2007 2009 2020 2030 2035
3rd ASEAN Energy Outlook (2011) BAU 389 417 414 421 419
APS 367 321
ERIA (2011) BAU 330 417 420 409 491
APS 397 447
Energy Efficiency Action Plan BAU 388
APS 297
APS = alternative policy scenario, ASEAN = Association of Southeast Asian Nations, BAU = business as usual, toe = tonnes of oil equivalent.Sources: 3rd ASEAN Energy Outlook (2011); ERIA (2011); MOE (2011).
Table 10.2: Energy Consumption Growth Forecasts: Thailand
3rd ASEAN Energy Outlook (2011) ERIA (2011)
Period
Average Annual Primary Energy Consumption Growth
(%) Period
Average Annual Primary Energy Consumption Growth
(%)2007–2030, BAU case 3.8 2009–2035, BAU case 3.92007–2030, APS case 2.7 2009–2035, APS case 3.4
Period
Average Annual Final Energy Consumption Growth
(%) Period
Average Annual Final Energy Consumption Growth
(%)1990–2007 5.1 1995–2009 5.62007–2030, BAU case 4.0 2009–2035, BAU case 4.12007–2030, APS case 2.8 2009–2035, APS case 3.7
APS = alternative policy scenario, ASEAN = Association of Southeast Asian Nations, BAU = business as usual, ERIA = Economic Research Institute for ASEAN and East Asia.Sources: 3rd ASEAN Energy Outlook (2011); ERIA (2011).
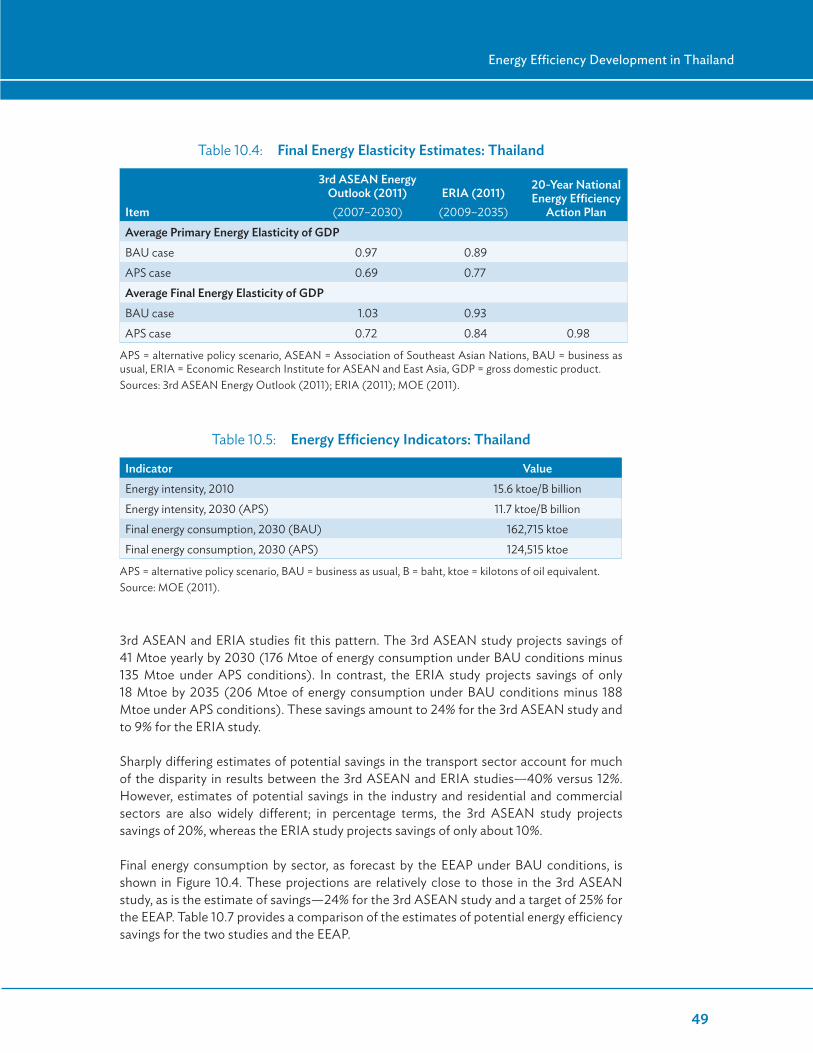
49
Energy Efficiency Development in Thailand
3rd ASEAN and ERIA studies fit this pattern. The 3rd ASEAN study projects savings of 41 Mtoe yearly by 2030 (176 Mtoe of energy consumption under BAU conditions minus 135 Mtoe under APS conditions). In contrast, the ERIA study projects savings of only 18 Mtoe by 2035 (206 Mtoe of energy consumption under BAU conditions minus 188 Mtoe under APS conditions). These savings amount to 24% for the 3rd ASEAN study and to 9% for the ERIA study.
Sharply differing estimates of potential savings in the transport sector account for much of the disparity in results between the 3rd ASEAN and ERIA studies—40% versus 12%. However, estimates of potential savings in the industry and residential and commercial sectors are also widely different; in percentage terms, the 3rd ASEAN study projects savings of 20%, whereas the ERIA study projects savings of only about 10%.
Final energy consumption by sector, as forecast by the EEAP under BAU conditions, is shown in Figure 10.4. These projections are relatively close to those in the 3rd ASEAN study, as is the estimate of savings—24% for the 3rd ASEAN study and a target of 25% for the EEAP. Table 10.7 provides a comparison of the estimates of potential energy efficiency savings for the two studies and the EEAP.
Table 10.4: Final Energy Elasticity Estimates: Thailand
Item
3rd ASEAN Energy Outlook (2011)(2007–2030)
ERIA (2011)(2009–2035)
20-Year National Energy Efficiency
Action PlanAverage Primary Energy Elasticity of GDPBAU case 0.97 0.89APS case 0.69 0.77Average Final Energy Elasticity of GDP BAU case 1.03 0.93APS case 0.72 0.84 0.98
APS = alternative policy scenario, ASEAN = Association of Southeast Asian Nations, BAU = business as usual, ERIA = Economic Research Institute for ASEAN and East Asia, GDP = gross domestic product.Sources: 3rd ASEAN Energy Outlook (2011); ERIA (2011); MOE (2011).
Table 10.5: Energy Efficiency Indicators: Thailand
Indicator ValueEnergy intensity, 2010 15.6 ktoe/B billionEnergy intensity, 2030 (APS) 11.7 ktoe/B billionFinal energy consumption, 2030 (BAU) 162,715 ktoeFinal energy consumption, 2030 (APS) 124,515 ktoe
APS = alternative policy scenario, BAU = business as usual, B = baht, ktoe = kilotons of oil equivalent. Source: MOE (2011).
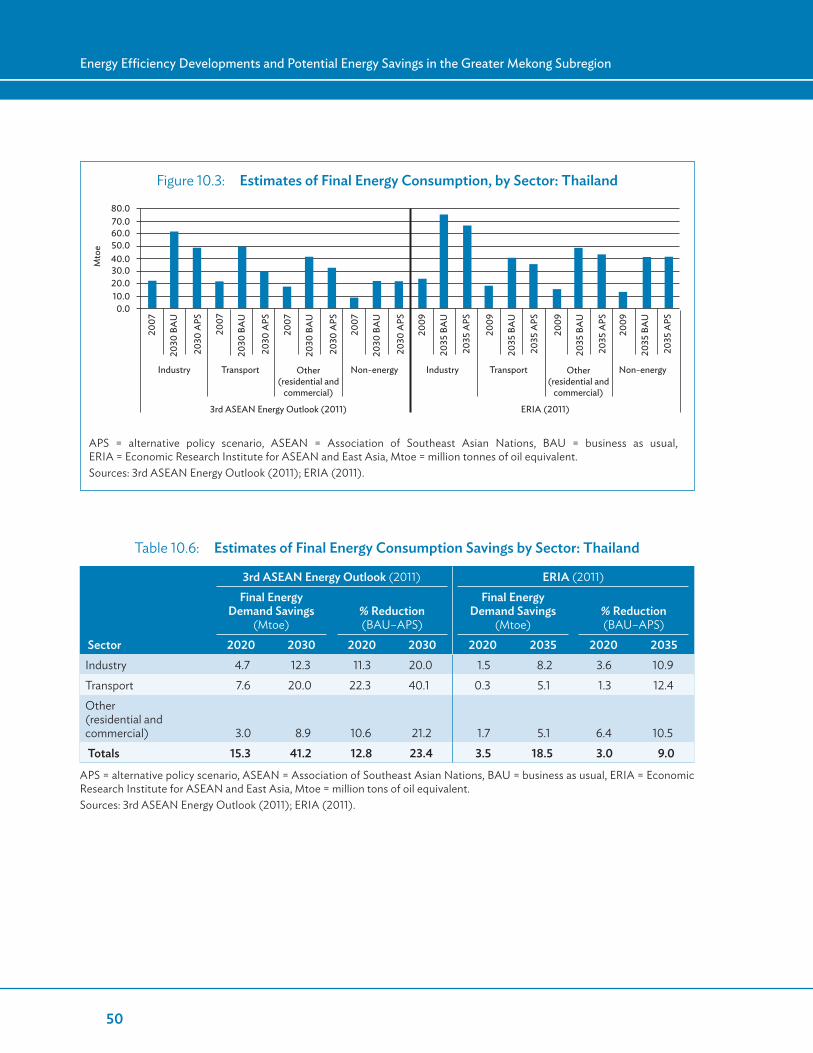
50
Energy Efficiency Developments and Potential Energy Savings in the Greater Mekong Subregion
Table 10.6: Estimates of Final Energy Consumption Savings by Sector: Thailand
3rd ASEAN Energy Outlook (2011) ERIA (2011)
Sector
Final Energy Demand Savings
(Mtoe)% Reduction (BAU–APS)
Final Energy Demand Savings
(Mtoe)% Reduction (BAU–APS)
2020 2030 2020 2030 2020 2035 2020 2035Industry 4.7 12.3 11.3 20.0 1.5 8.2 3.6 10.9Transport 7.6 20.0 22.3 40.1 0.3 5.1 1.3 12.4Other (residential and commercial) 3.0 8.9 10.6 21.2 1.7 5.1 6.4 10.5 Totals 15.3 41.2 12.8 23.4 3.5 18.5 3.0 9.0
APS = alternative policy scenario, ASEAN = Association of Southeast Asian Nations, BAU = business as usual, ERIA = Economic Research Institute for ASEAN and East Asia, Mtoe = million tons of oil equivalent.Sources: 3rd ASEAN Energy Outlook (2011); ERIA (2011).
Industry Transport Non-energy Industry Transport Non-energy
0.010.020.030.040.050.060.070.080.0
Mto
e
2007
2030
BA
U
2030
APS
2030
BA
U
2030
APS
2007
2030
BA
U
2030
APS
2007
2030
BA
U
2030
APS
2009
2035
BA
U
2035
APS
2009
2035
BA
U
2035
APS
2009
2035
BA
U
2035
APS
2009
2035
BA
U
2035
APS
2007
Other (residential and
commercial)
Other (residential and
commercial)
3rd ASEAN Energy Outlook (2011) ERIA (2011)
Figure 10.3: Estimates of Final Energy Consumption, by Sector: Thailand
APS = alternative policy scenario, ASEAN = Association of Southeast Asian Nations, BAU = business as usual, ERIA = Economic Research Institute for ASEAN and East Asia, Mtoe = million tonnes of oil equivalent. Sources: 3rd ASEAN Energy Outlook (2011); ERIA (2011).

51
Energy Efficiency Development in Thailand
Table 10.7: Comparison of Estimates of Final Energy Savings: Thailand
Sector
Final Energy Consumption Savings (Mtoe)
3rd ASEAN (by 2030)
ERIA (by 2035)
EEAP (by 2030)
Industry 12.3 8.2 16.3Transportation 20.0 5.1 15.3Other (residential and commercial) Large commercial Small commercial and residential
8.9 5.13.63.6
Total 41.2 18.5 38.9
ASEAN = Association of Southeast Asian Nations, EAAP = Energy Efficiency Action Plan, ERIA = Economic Research Institute for ASEAN and East Asia, Mtoe = million tons of oil equivalent.Sources: 3rd ASEAN Energy Outlook (2011); ERIA (2011); MOE (2011).
Figure 10.4: Final Energy Consumption (Business-As-Usual): Thailand
GDP = gross domestic product, ktoe = kilotons of oil equivalent.Source: MOE (2011).
Others
1990 1995 2000 2005 2010 2015 20252020 2030
Actual data Forecast
160,000 4%162,715
14%
10%
31%
41%
140,000
120,000
100,000
80,000
60,000
40,000
20,000
0
31,000
Fina
l Ene
rgy C
onsu
mpt
ion
(kto
e)
4.4
Population
GDP
3.9
4.34.5
Annual AverageGrowth Rate
(%)
1990–2010 2010–2030
0.9 0.3
Energy consumption
Item
71,200
6%23%5%37%29%
36%
35%
Industry
Transportation
Commercial Building
Residential
Other
8%15%6%
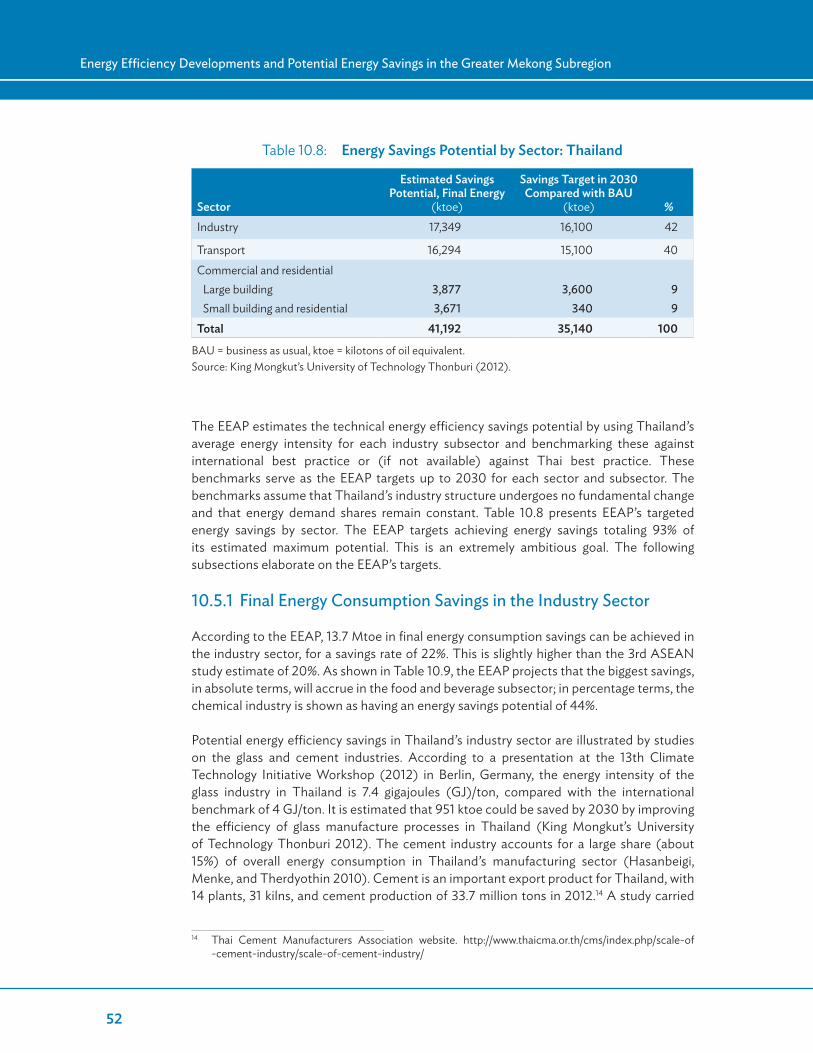
52
Energy Efficiency Developments and Potential Energy Savings in the Greater Mekong Subregion
The EEAP estimates the technical energy efficiency savings potential by using Thailand’s average energy intensity for each industry subsector and benchmarking these against international best practice or (if not available) against Thai best practice. These benchmarks serve as the EEAP targets up to 2030 for each sector and subsector. The benchmarks assume that Thailand’s industry structure undergoes no fundamental change and that energy demand shares remain constant. Table 10.8 presents EEAP’s targeted energy savings by sector. The EEAP targets achieving energy savings totaling 93% of its estimated maximum potential. This is an extremely ambitious goal. The following subsections elaborate on the EEAP’s targets.
10.5.1 Final Energy Consumption Savings in the Industry Sector
According to the EEAP, 13.7 Mtoe in final energy consumption savings can be achieved in the industry sector, for a savings rate of 22%. This is slightly higher than the 3rd ASEAN study estimate of 20%. As shown in Table 10.9, the EEAP projects that the biggest savings, in absolute terms, will accrue in the food and beverage subsector; in percentage terms, the chemical industry is shown as having an energy savings potential of 44%.
Potential energy efficiency savings in Thailand’s industry sector are illustrated by studies on the glass and cement industries. According to a presentation at the 13th Climate Technology Initiative Workshop (2012) in Berlin, Germany, the energy intensity of the glass industry in Thailand is 7.4 gigajoules (GJ)/ton, compared with the international benchmark of 4 GJ/ton. It is estimated that 951 ktoe could be saved by 2030 by improving the efficiency of glass manufacture processes in Thailand (King Mongkut’s University of Technology Thonburi 2012). The cement industry accounts for a large share (about 15%) of overall energy consumption in Thailand’s manufacturing sector (Hasanbeigi, Menke, and Therdyothin 2010). Cement is an important export product for Thailand, with 14 plants, 31 kilns, and cement production of 33.7 million tons in 2012.14 A study carried
14 Thai Cement Manufacturers Association website. http://www.thaicma.or.th/cms/index.php/scale-of -cement-industry/scale-of-cement-industry/
Table 10.8: Energy Savings Potential by Sector: Thailand
Sector
Estimated Savings Potential, Final Energy
(ktoe)
Savings Target in 2030 Compared with BAU
(ktoe) %Industry 17,349 16,100 42
Transport 16,294 15,100 40Commercial and residential Large building Small building and residential
3,8773,671
3,600340
99
Total 41,192 35,140 100
BAU = business as usual, ktoe = kilotons of oil equivalent.Source: King Mongkut’s University of Technology Thonburi (2012).
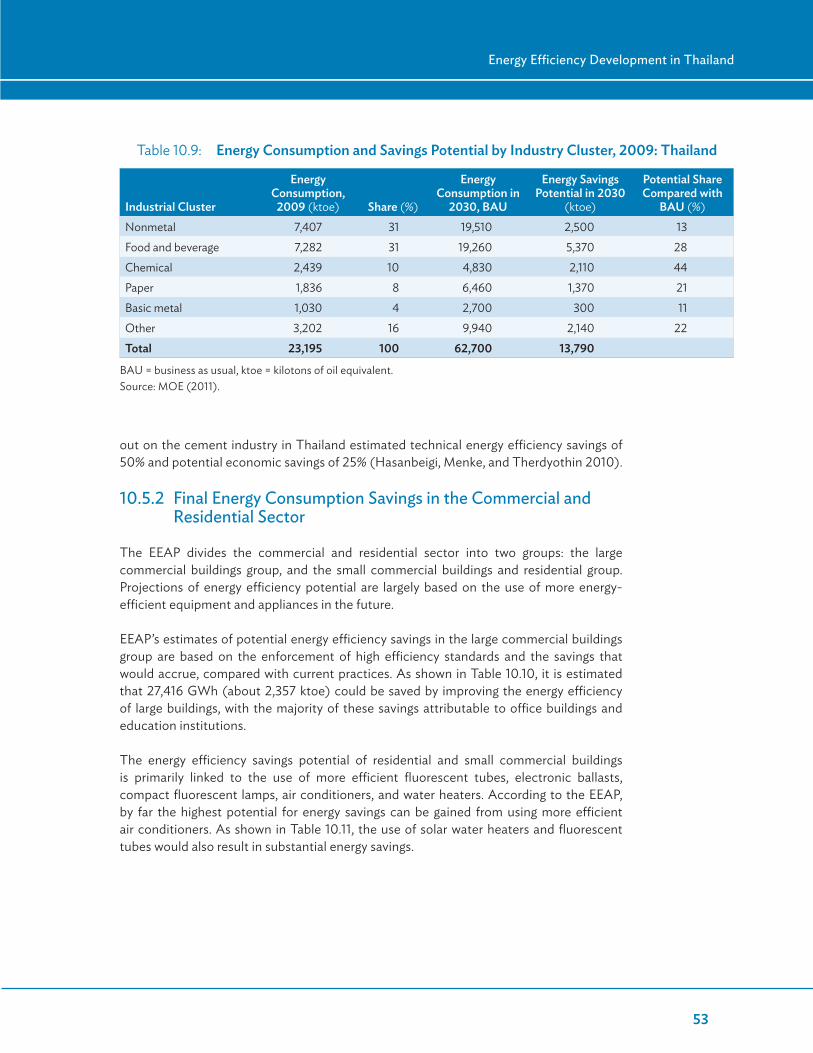
53
Energy Efficiency Development in Thailand
out on the cement industry in Thailand estimated technical energy efficiency savings of 50% and potential economic savings of 25% (Hasanbeigi, Menke, and Therdyothin 2010).
10.5.2 Final Energy Consumption Savings in the Commercial and Residential Sector
The EEAP divides the commercial and residential sector into two groups: the large commercial buildings group, and the small commercial buildings and residential group. Projections of energy efficiency potential are largely based on the use of more energy-efficient equipment and appliances in the future.
EEAP’s estimates of potential energy efficiency savings in the large commercial buildings group are based on the enforcement of high efficiency standards and the savings that would accrue, compared with current practices. As shown in Table 10.10, it is estimated that 27,416 GWh (about 2,357 ktoe) could be saved by improving the energy efficiency of large buildings, with the majority of these savings attributable to office buildings and education institutions.
The energy efficiency savings potential of residential and small commercial buildings is primarily linked to the use of more efficient fluorescent tubes, electronic ballasts, compact fluorescent lamps, air conditioners, and water heaters. According to the EEAP, by far the highest potential for energy savings can be gained from using more efficient air conditioners. As shown in Table 10.11, the use of solar water heaters and fluorescent tubes would also result in substantial energy savings.
Table 10.9: Energy Consumption and Savings Potential by Industry Cluster, 2009: Thailand
Industrial Cluster
Energy Consumption,
2009 (ktoe) Share (%)
Energy Consumption in
2030, BAU
Energy Savings Potential in 2030
(ktoe)
Potential Share Compared with
BAU (%)Nonmetal 7,407 31 19,510 2,500 13 Food and beverage 7,282 31 19,260 5,370 28 Chemical 2,439 10 4,830 2,110 44 Paper 1,836 8 6,460 1,370 21 Basic metal 1,030 4 2,700 300 11 Other 3,202 16 9,940 2,140 22Total 23,195 100 62,700 13,790
BAU = business as usual, ktoe = kilotons of oil equivalent.Source: MOE (2011).
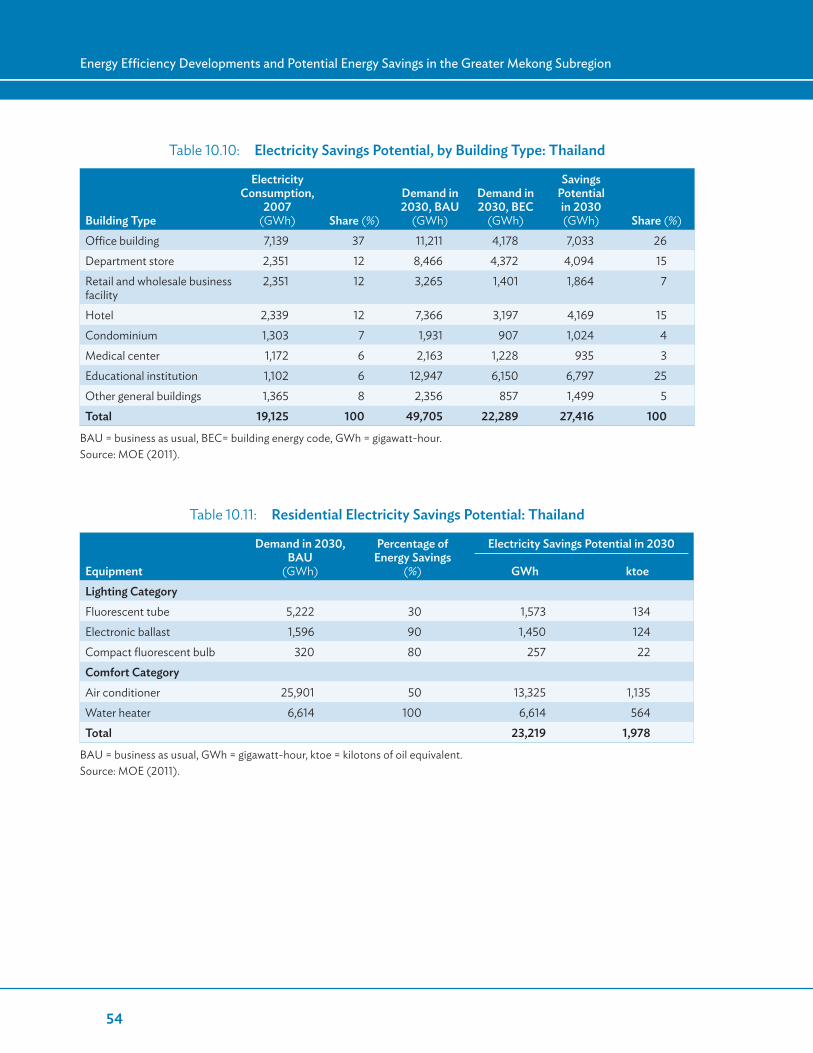
54
Energy Efficiency Developments and Potential Energy Savings in the Greater Mekong Subregion
Table 10.10: Electricity Savings Potential, by Building Type: Thailand
Building Type
Electricity Consumption,
2007 (GWh) Share (%)
Demand in 2030, BAU
(GWh)
Demand in 2030, BEC
(GWh)
Savings Potential in 2030 (GWh) Share (%)
Office building 7,139 37 11,211 4,178 7,033 26Department store 2,351 12 8,466 4,372 4,094 15Retail and wholesale business facility
2,351 12 3,265 1,401 1,864 7
Hotel 2,339 12 7,366 3,197 4,169 15Condominium 1,303 7 1,931 907 1,024 4Medical center 1,172 6 2,163 1,228 935 3Educational institution 1,102 6 12,947 6,150 6,797 25Other general buildings 1,365 8 2,356 857 1,499 5Total 19,125 100 49,705 22,289 27,416 100
BAU = business as usual, BEC= building energy code, GWh = gigawatt-hour.Source: MOE (2011).
Table 10.11: Residential Electricity Savings Potential: Thailand
Equipment
Demand in 2030, BAU
(GWh)
Percentage of Energy Savings
(%)
Electricity Savings Potential in 2030
GWh ktoeLighting CategoryFluorescent tube 5,222 30 1,573 134Electronic ballast 1,596 90 1,450 124Compact fluorescent bulb 320 80 257 22Comfort CategoryAir conditioner 25,901 50 13,325 1,135Water heater 6,614 100 6,614 564Total 23,219 1,978
BAU = business as usual, GWh = gigawatt-hour, ktoe = kilotons of oil equivalent.Source: MOE (2011).
55
Energy Efficiency Development in Thailand
10.6 Energy Efficiency Programs and IncentivesAs outlined in Section 10.2, Thailand has a well-established regulatory framework for energy efficiency, notably under the Energy Conservation and Promotion Act (ENCON Act) approved in 1992. This act led to the establishment of the Energy Conservation Promotion Fund and decrees regarding energy efficiency standards. Over the past 2 decades, Thailand has introduced several incentive mechanisms to raise awareness of, and encourage, energy efficiency, including the following:
• The Energy Efficiency Revolving Fund was introduced in 2003 to stimulate commercial financing for energy efficiency projects in partnership with government support (C. Grüning et al. 2012). About B7,000 million was allocated to the revolving fund from the Energy Conservation Promotion Fund (ENCON Fund),15 in support of soft loans. Eleven commercial banks are participating in the scheme, combining commercial capital and funds from the revolving fund. A maximum annual (on-lending) interest of 4% may be charged by the banks for a maximum loan period of 7 years. Banks pay back to the revolving fund on the basis of annual interest charges of 0.5%. Loans are limited to a maximum of B50 million per project. As of 2012, 95% of the revolving fund had been subscribed, with financing for 294 projects (C. Grüning et al. 2012).
• The Energy Service Company (ESCO) Fund is a co-investing program, with B1,000 million allocated to it from the government’s ENCON Fund. ESCO Fund co-investments with the private sector include equity investments and leasing schemes for energy efficiency measures. Investments run for 5–7 years, typically with ESCO Fund participation of 10%–50%, subject to a maximum of B50 million per project.
• Energy efficiency tax incentives have been established with the Revenue Department and the Board of Investment. These incentives include a 25% tax credit for the purchase of electrical appliances and other products labeled as meeting energy efficiency standards under the Revenue Department scheme. Energy conservation investments are supported by favorable corporate income tax and import duty provisions under the Board of Investment scheme.
• Direct subsidies at the rate of 20%–30% are extended for the purchase of designated energy efficiency products, as well as support for energy efficiency investments. Additionally, DEDE conducts awareness-raising campaigns through energy display centers, public relations initiatives, and national energy awards.
As also noted in Section 10.2, EGAT has a vital role in promoting and facilitating energy efficiency. In addition to development projects to expand the network and increase supply-side efficiency,16 EGAT has implemented and financed DSM program (ADB, USAID 2011) to promote energy efficiency and conservation. The program complements the activities of DEDE and the ENCON Fund.
15 The Energy Conservation Promotion Fund set up in 1992 subsequent to the Energy Conservation and Promotion Act is funded by a tax on petroleum products. It provides financial support to designated factories and buildings for investment in energy conservation programs and the operation of such programs.
16 See EGAT Annual Report 2011 with 14 ongoing transmission system projects and 4 transmission expansion and renovation projects at the approval stage.

56
Energy Efficiency Developments and Potential Energy Savings in the Greater Mekong Subregion
EGAT’s DSM program (up to March 2014) has resulted in estimated savings of almost 3,310 megawatts in peak demand and 19,780 GWh of electricity savings, as well as abatement of 11.70 million tons of carbon dioxide. EGAT’s energy efficiency programs and campaigns include the following:
• “Green Learning Schools” were established throughout Thailand as learning centers for energy and environmental conservation. In 2011, 24 schools met EGAT’s Green Learning School standards. These schools share their facilities and knowledge with many more schools in their respective neighborhoods.
• The use of high-efficiency electrical applicances were encouraged and supported through No. 5 Energy Efficiency labeling campaigns. For example, after successfully promoting the use of energy-efficient compact fluorescent light (CFL) bulbs to replace incandescent light bulbs, EGAT introduced the use of high-efficiency T5 fluorescent tubes and requested key business leaders to promote their use. In 2011, three more appliances were added to EGAT’s No. 5 Energy Efficiency labeling program (electric showers, irons, and spiral CFL bulbs).
10.7 Summary of Energy Efficiency Developments and Potential
Thailand is well positioned to capitalize on its considerable technical potential for energy efficiency savings. The government’s EEAP envisages savings of 25% by 2030, which would mean realizing more than 90% of the technical savings potential estimated by both the EEAP and the 3rd ASEAN Energy Outlook study. Technology advances during the period up to 2030 are likely to contribute to reaching the target. Still, the target is highly ambitious, requiring multidimensional support measures.
The EEAP 2011–2030 and the EEDP 2011–2030 together detail Thailand’s energy efficiency goals, the regulatory and institutional frameworks for achieving those goals, and the actions to be taken and the responsible centers for carrying out these actions. To make the country less dependent on imported energy, notably oil and gas, and to reduce its greenhouse gas emissions, Thailand’s national energy policy has the underlying objective of an “energy sufficiency society.” This entails the operation of both the EEAP and the Alternative Energy Development Plan (AEDP) announced in 2012. The government is targeting an increase in the use of alternative energy sources (solar, wind, biomass, and minihydropower) from 12% currently to 25% by 2021. Again, this target is highly ambitious. It will be important to ensure that alternative energy sources are developed and used effectively and efficiently. Equally important will be technical and maintenance support for alternative energy investments, notably for households and small communities.
Supply-side efficiency is addressed by EGAT and investors, in the interest of cost savings and profitability. Demand-side efficiency is more challenging, as it involves society as a whole and individual decision making. Mandatory standards and labeling provide inducements to lower energy consumption, and subsidies help favor the use of energy-saving appliances and machinery. However, energy efficiency is both a public and a private good; responsibility for it therefore has to be shared and undertaken at the individual and community levels. Thailand’s goal of creating a national conscience of energy saving is a vital step toward inclusive and sustainable growth.

57
Energy consumption is increasing at a rapid rate in Viet Nam, reflecting its strong economic growth and the improving standard of living of the population. It is expected that Viet Nam’s energy needs will triple by 2020, with petroleum, coal,
natural gas, and hydropower providing most of the additional supply. Renewable energy is targeted to provide 5% of Viet Nam’s energy needs by 2020 and 8% by 2030, but these modest levels will mean continued heavy reliance on carbon-based fuels, including widespread household use of firewood for heating and cooking. Improving energy efficiency is critical. Like other GMS countries, Viet Nam has considerable potential for energy efficiency savings. Realizing that potential requires a proactive institutional and regulatory framework, and a collective realization that energy efficiency is vital to meeting the country’s energy needs in a sustainable manner.
Viet Nam has set targets for energy savings through efficiency and conservation measures, first by 3%–5% during 2006–2010, followed by a target of 5%–8% during 2011–2015. A further target of 8%–10% in savings is expected to be achieved by 2020, relative to BAU conditions. The government monitors progress in meeting these targets largely through estimates of energy intensity—that is, energy input compared with GDP output. It is difficult to assess the degree to which Viet Nam has met the government’s energy efficiency targets. Independent of this question, it is important to evaluate the technical potential for further energy efficiency savings. To the extent that substantial additional savings are possible, the government will be strongly motivated to realize these savings, in partnership with state and private sector enterprises and households.
11.1 Institutional Framework for the Energy SectorThe Office of the Prime Minister has overall responsibility for policies, regulations, strategies, and plans concerning the energy sector. In turn, three ministries are involved in either formulating or implementing energy policies, including policies regarding energy efficiency:
• The Ministry of Industry and Trade (MOIT) is responsible for designing energy policies and national energy plans. MOIT is also responsible for managing the country’s coal, oil, gas, electricity, nuclear energy, and renewable energy supply and energy efficiency.
11 Energy Efficiency Development in Viet Nam
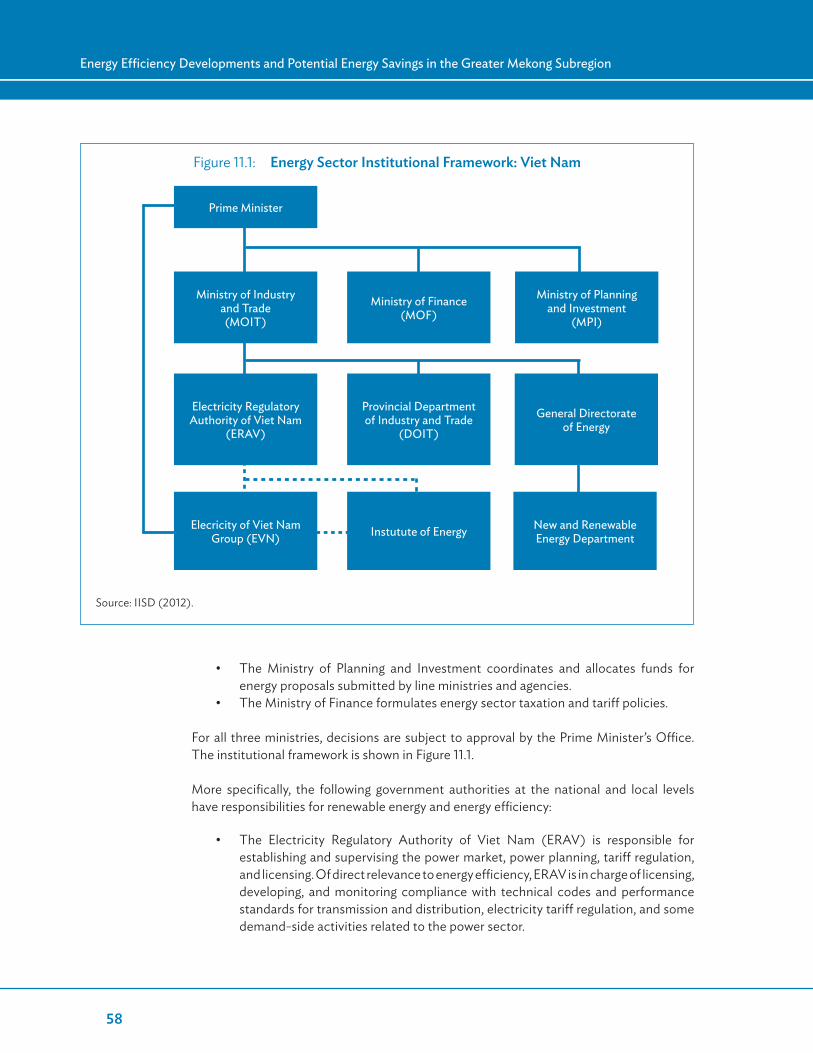
58
Energy Efficiency Developments and Potential Energy Savings in the Greater Mekong Subregion
• The Ministry of Planning and Investment coordinates and allocates funds for energy proposals submitted by line ministries and agencies.
• The Ministry of Finance formulates energy sector taxation and tariff policies.
For all three ministries, decisions are subject to approval by the Prime Minister’s Office. The institutional framework is shown in Figure 11.1.
More specifically, the following government authorities at the national and local levels have responsibilities for renewable energy and energy efficiency:
• The Electricity Regulatory Authority of Viet Nam (ERAV) is responsible for establishing and supervising the power market, power planning, tariff regulation, and licensing. Of direct relevance to energy efficiency, ERAV is in charge of licensing, developing, and monitoring compliance with technical codes and performance standards for transmission and distribution, electricity tariff regulation, and some demand-side activities related to the power sector.
Figure 11.1: Energy Sector Institutional Framework: Viet Nam
Source: IISD (2012).
Prime Minister
Ministry of Industry and Trade (MOIT)
Ministry of Finance (MOF)
Ministry of Planning and Investment
(MPI)
Electricity Regulatory Authority of Viet Nam
(ERAV)
Provincial Department of Industry and Trade
(DOIT)
General Directorate of Energy
Elecricity of Viet Nam Group (EVN) Instutute of Energy New and Renewable
Energy Department

59
Energy Efficiency Development in Viet Nam
• The General Energy Department (GDE) under MOIT is responsible for overall energy sector policy and planning. GDE includes an energy efficiency department and a renewable energy department. The Energy Efficiency and Conservation Office under MOIT is tasked to formulate, develop, and implement energy efficiency and conservation policies and programs, and to execute projects at the provincial level.
• An interministerial committee, led by MOIT, is responsible for implementing the new energy efficiency and conservation (EE&C) laws (APEC 2010).
• Provincial departments of industry and trade are responsible for implementing state management directives with respect to the energy sector, including directives related to renewable energy and energy efficiency.
• Electricity of Viet Nam (EVN) is a state-owned utility responsible for developing and managing electricity production, transmission, and distribution.
• The Institute of Energy undertakes and prepares energy sector plans, strategies, and policies.
Although Viet Nam appears to have a reasonably strong institutional framework for advancing energy efficiency, its capacity is reportedly deficient. During the 2nd Annual Asia Pacific Dialogue on Clean Energy Governance, Policy and Regulation at ADB in 2011, Viet Nam was reported to have insufficient institutional capacity to implement its EE&C laws and policies, and to continue to require technical and financial assistance from donors (ADB 2011). Further, according to ADB’s Assessment of GMS Energy Sector Development (2013), Viet Nam has made little progress in implementing its Energy Conservation Law (2010) or in achieving greater energy efficiency in the economy.
11.2 Energy Efficiency Performance Targets and Policy Framework
Viet Nam has ratified a number of laws, decrees, and programs for the promotion of energy efficiency and conservation measures:
• The Government Decree on Energy Efficiency and Conservation (2003) defines the roles and responsibilities of government and society with respect to energy efficiency. It also requests suppliers of equipment to provide information on energy consumption in user manuals and on equipment and facility labels (AFD 2012). In 2004, the MOIT issued a circular to provide guidance for the implementation of energy conservation in the industry sector (APEC 2010). In 2006, a guideline was issued regarding processes and procedures for implementing energy efficiency standards and labeling in appliances.
• The Viet Nam National Energy Efficiency Program (VNEEP), approved in April 2006, outlines EE&C improvement measures and targets for all economic sectors, in two phases (2006–2010 and 2011–2016).17 Whereas the first phase
17 Decision No. 1427/QD-TTg approving the National Targeted Program for Energy Efficiency and Conservation for the period 2012–2015 sets further specific targets for implementation by the VNEEP (http://www.tietkiemnangluong.com.vn/e).

60
Energy Efficiency Developments and Potential Energy Savings in the Greater Mekong Subregion
concentrated on education, capacity building, and studies, the second phase is focused on implementation and action plans for achieving the targets (World Bank 2011). The Energy Efficiency and Conservation Office under MOIT has a leading role in implementing the VNEEP, which has six components (APEC 2010, Anh and Lien 2009):
– strengthening the energy efficiency legislative framework, – increasing public awareness through outreach campaigns and the educational
system, – developing energy efficiency standards and labels for appliances and
equipment, – assisting industry in establishing and implementing energy efficiency
programs, – implementing energy efficiency in the design and operation of buildings, and – reducing fuel consumption and emissions in the transportation industry.
• The Law on Energy Efficiency and Conservation, which took effect in January 2011, establishes energy efficiency and conservation incentives and measures for cleaner production. The law consists of 12 chapters covering EE&C measures in a wide range of areas, including industry production, public lighting, building construction, household appliances, intensive energy users, and vehicles. The law categorizes energy users into two groups:
Group 1 consists of intensive energy consumers (e.g., industrial establishments, public buildings, transportation establishments) and government facilities (e.g., office buildings, public lighting). Adherence to the energy efficiency measures is mandatory. Consumers are required to carry out energy audits and submit annual energy-saving plans to authorities. Energy managers hired by the consumers are responsible for designing and helping to carry out the EE&C plans.
Group 2 consists of consumers using less energy, such as residential households and medium- and small-sized firms. EE&C measures are voluntary. Customers in this group are encouraged to participate in reducing power consumption during peak hours and to buy energy-efficient electrical appliances.
The Law on Energy Efficiency and Conservation also introduces four major programs: (i) Management of Designated Enterprises, (ii) Standards and Labeling and Promotion of Energy Efficiency Equipment, (iii) Financial Incentives and Support, and (iv) Institutional Arrangements.
• The List of Mandatory Labeling Equipment was issued in 2011, together with EE&C regulations on equipment purchased by state-owned enterprises. Additionally, the General Department of Viet Nam Customs gave guidance on imported equipment to ensure proper labeling and certification.
The Vietnamese Master Plan for Power Development for the period 2011–2020, with a vision to 2030 (MOIT 2011), confirms the VNEEP electricity savings target of 5%–8% for the period 2011–2015. The master plan provides a further savings
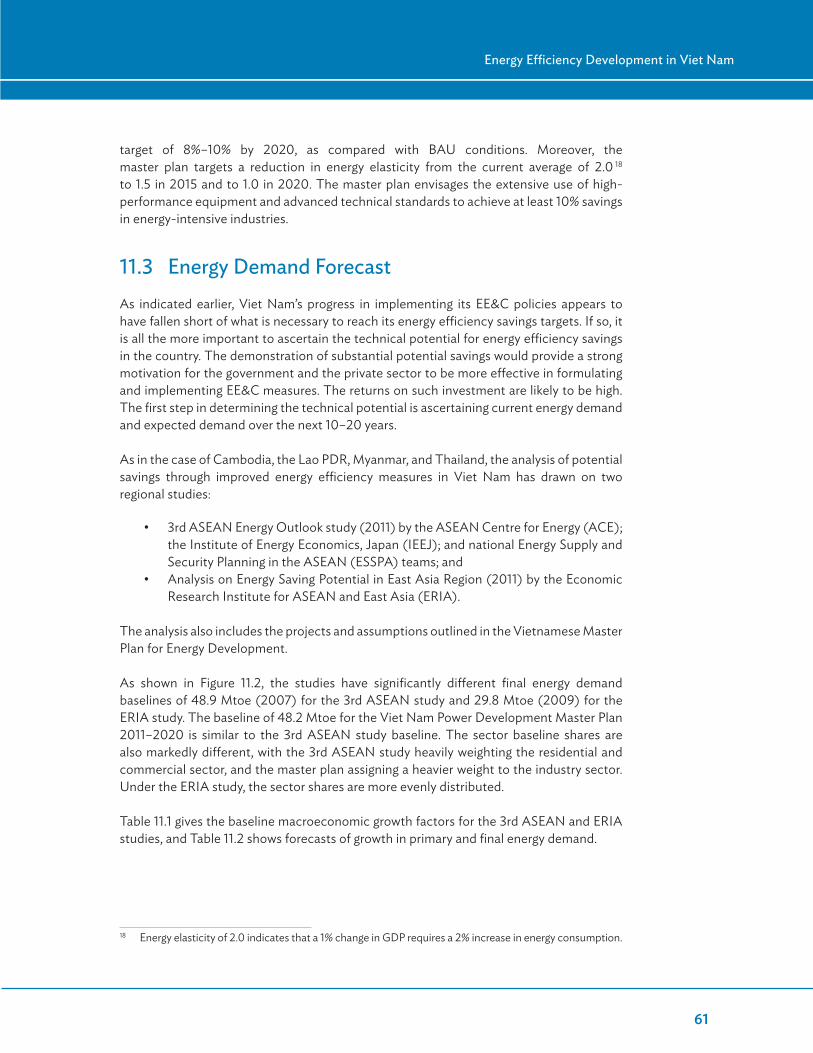
61
Energy Efficiency Development in Viet Nam
target of 8%–10% by 2020, as compared with BAU conditions. Moreover, the master plan targets a reduction in energy elasticity from the current average of 2.0 18
to 1.5 in 2015 and to 1.0 in 2020. The master plan envisages the extensive use of high-performance equipment and advanced technical standards to achieve at least 10% savings in energy-intensive industries.
11.3 Energy Demand ForecastAs indicated earlier, Viet Nam’s progress in implementing its EE&C policies appears to have fallen short of what is necessary to reach its energy efficiency savings targets. If so, it is all the more important to ascertain the technical potential for energy efficiency savings in the country. The demonstration of substantial potential savings would provide a strong motivation for the government and the private sector to be more effective in formulating and implementing EE&C measures. The returns on such investment are likely to be high. The first step in determining the technical potential is ascertaining current energy demand and expected demand over the next 10–20 years.
As in the case of Cambodia, the Lao PDR, Myanmar, and Thailand, the analysis of potential savings through improved energy efficiency measures in Viet Nam has drawn on two regional studies:
• 3rd ASEAN Energy Outlook study (2011) by the ASEAN Centre for Energy (ACE); the Institute of Energy Economics, Japan (IEEJ); and national Energy Supply and Security Planning in the ASEAN (ESSPA) teams; and
• Analysis on Energy Saving Potential in East Asia Region (2011) by the Economic Research Institute for ASEAN and East Asia (ERIA).
The analysis also includes the projects and assumptions outlined in the Vietnamese Master Plan for Energy Development.
As shown in Figure 11.2, the studies have significantly different final energy demand baselines of 48.9 Mtoe (2007) for the 3rd ASEAN study and 29.8 Mtoe (2009) for the ERIA study. The baseline of 48.2 Mtoe for the Viet Nam Power Development Master Plan 2011–2020 is similar to the 3rd ASEAN study baseline. The sector baseline shares are also markedly different, with the 3rd ASEAN study heavily weighting the residential and commercial sector, and the master plan assigning a heavier weight to the industry sector. Under the ERIA study, the sector shares are more evenly distributed.
Table 11.1 gives the baseline macroeconomic growth factors for the 3rd ASEAN and ERIA studies, and Table 11.2 shows forecasts of growth in primary and final energy demand.
18 Energy elasticity of 2.0 indicates that a 1% change in GDP requires a 2% increase in energy consumption.
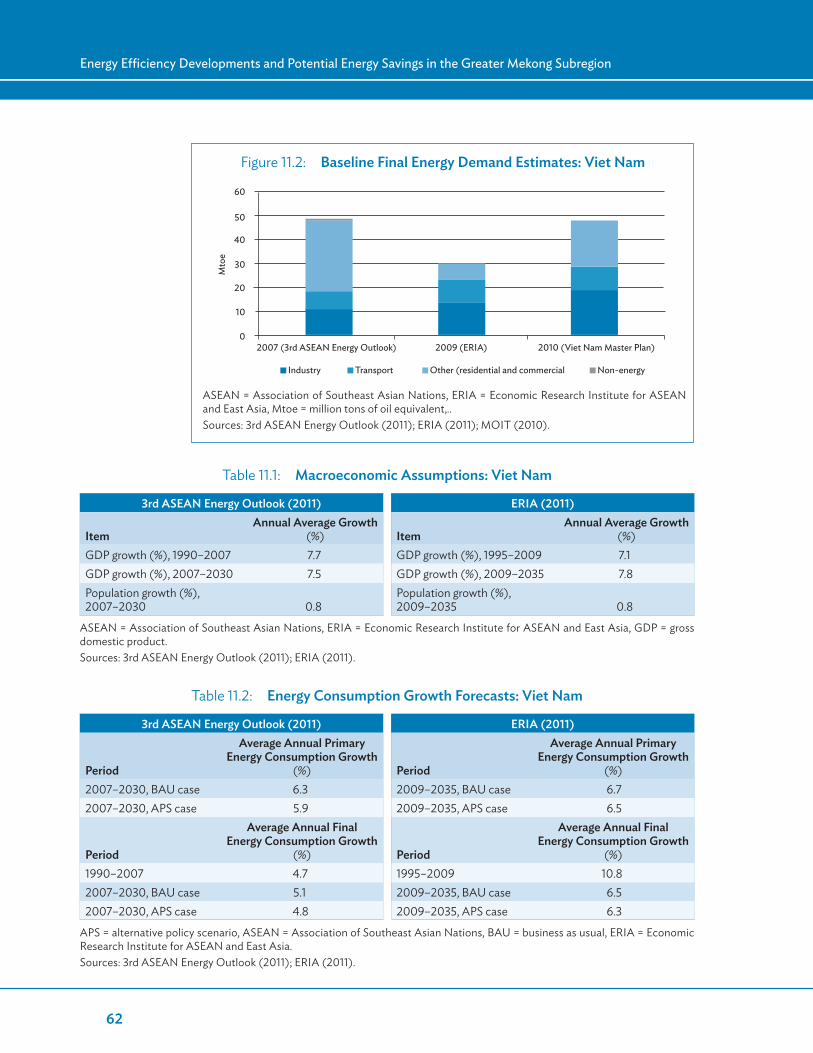
62
Energy Efficiency Developments and Potential Energy Savings in the Greater Mekong Subregion
Table 11.1: Macroeconomic Assumptions: Viet Nam
3rd ASEAN Energy Outlook (2011) ERIA (2011)
ItemAnnual Average Growth
(%) ItemAnnual Average Growth
(%)GDP growth (%), 1990–2007 7.7 GDP growth (%), 1995–2009 7.1GDP growth (%), 2007–2030 7.5 GDP growth (%), 2009–2035 7.8Population growth (%), 2007–2030 0.8
Population growth (%), 2009–2035 0.8
ASEAN = Association of Southeast Asian Nations, ERIA = Economic Research Institute for ASEAN and East Asia, GDP = gross domestic product.Sources: 3rd ASEAN Energy Outlook (2011); ERIA (2011).
Table 11.2: Energy Consumption Growth Forecasts: Viet Nam
3rd ASEAN Energy Outlook (2011) ERIA (2011)
Period
Average Annual Primary Energy Consumption Growth
(%) Period
Average Annual Primary Energy Consumption Growth
(%)2007–2030, BAU case 6.3 2009–2035, BAU case 6.72007–2030, APS case 5.9 2009–2035, APS case 6.5
Period
Average Annual Final Energy Consumption Growth
(%) Period
Average Annual Final Energy Consumption Growth
(%)1990–2007 4.7 1995–2009 10.82007–2030, BAU case 5.1 2009–2035, BAU case 6.52007–2030, APS case 4.8 2009–2035, APS case 6.3
APS = alternative policy scenario, ASEAN = Association of Southeast Asian Nations, BAU = business as usual, ERIA = Economic Research Institute for ASEAN and East Asia.Sources: 3rd ASEAN Energy Outlook (2011); ERIA (2011).
Figure 11.2: Baseline Final Energy Demand Estimates: Viet Nam
ASEAN = Association of Southeast Asian Nations, ERIA = Economic Research Institute for ASEAN and East Asia, Mtoe = million tons of oil equivalent,..Sources: 3rd ASEAN Energy Outlook (2011); ERIA (2011); MOIT (2010).
2007 (3rd ASEAN Energy Outlook) 2010 (Viet Nam Master Plan)2009 (ERIA)
Mto
e
Industry Transport Other (residential and commercial Non-energy
10
0
20
30
40
50
60
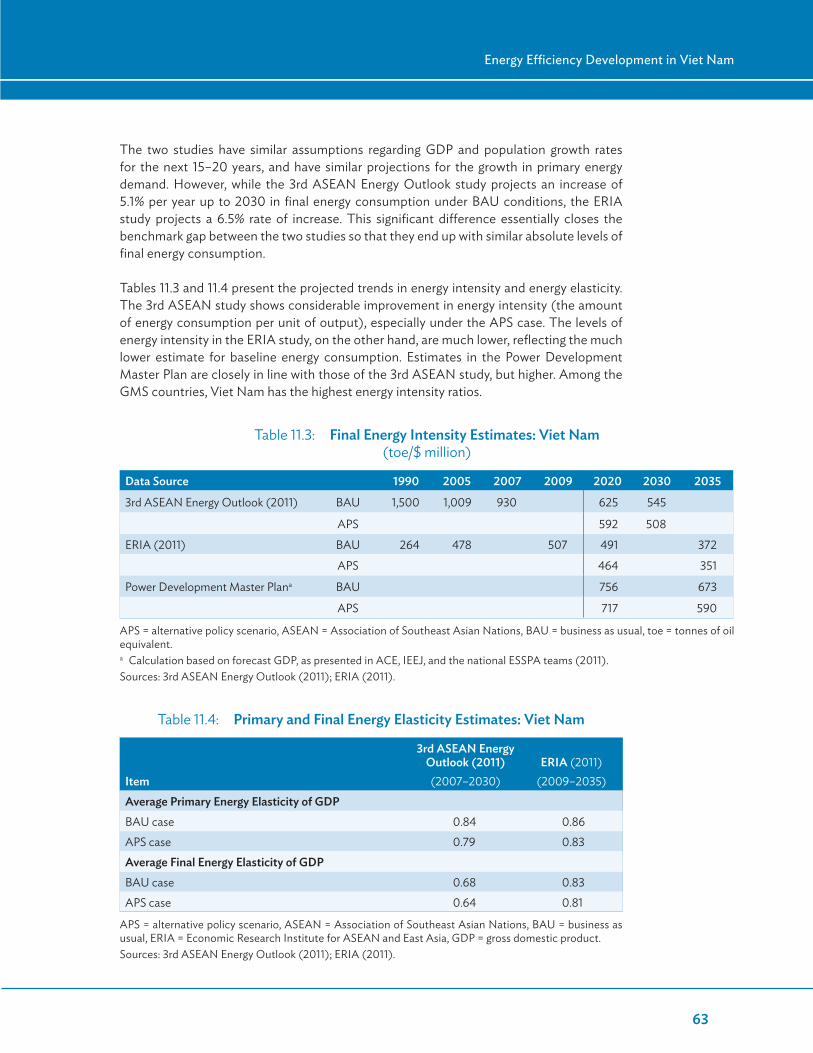
63
Energy Efficiency Development in Viet Nam
The two studies have similar assumptions regarding GDP and population growth rates for the next 15–20 years, and have similar projections for the growth in primary energy demand. However, while the 3rd ASEAN Energy Outlook study projects an increase of 5.1% per year up to 2030 in final energy consumption under BAU conditions, the ERIA study projects a 6.5% rate of increase. This significant difference essentially closes the benchmark gap between the two studies so that they end up with similar absolute levels of final energy consumption.
Tables 11.3 and 11.4 present the projected trends in energy intensity and energy elasticity. The 3rd ASEAN study shows considerable improvement in energy intensity (the amount of energy consumption per unit of output), especially under the APS case. The levels of energy intensity in the ERIA study, on the other hand, are much lower, reflecting the much lower estimate for baseline energy consumption. Estimates in the Power Development Master Plan are closely in line with those of the 3rd ASEAN study, but higher. Among the GMS countries, Viet Nam has the highest energy intensity ratios.
Table 11.3: Final Energy Intensity Estimates: Viet Nam (toe/$ million)
Data Source 1990 2005 2007 2009 2020 2030 2035
3rd ASEAN Energy Outlook (2011) BAU 1,500 1,009 930 625 545
APS 592 508
ERIA (2011) BAU 264 478 507 491 372
APS 464 351
Power Development Master Plana BAU 756 673
APS 717 590
APS = alternative policy scenario, ASEAN = Association of Southeast Asian Nations, BAU = business as usual, toe = tonnes of oil equivalent.a Calculation based on forecast GDP, as presented in ACE, IEEJ, and the national ESSPA teams (2011).Sources: 3rd ASEAN Energy Outlook (2011); ERIA (2011).
Table 11.4: Primary and Final Energy Elasticity Estimates: Viet Nam
Item
3rd ASEAN Energy Outlook (2011)(2007–2030)
ERIA (2011)(2009–2035)
Average Primary Energy Elasticity of GDPBAU case 0.84 0.86APS case 0.79 0.83Average Final Energy Elasticity of GDP BAU case 0.68 0.83APS case 0.64 0.81
APS = alternative policy scenario, ASEAN = Association of Southeast Asian Nations, BAU = business as usual, ERIA = Economic Research Institute for ASEAN and East Asia, GDP = gross domestic product.Sources: 3rd ASEAN Energy Outlook (2011); ERIA (2011).

64
Energy Efficiency Developments and Potential Energy Savings in the Greater Mekong Subregion
Energy elasticity, or the change in GDP related to a percentage change in total energy consumption, is not expected to decline significantly as a result of energy efficiency measures over the next 15–20 years. As shown in Table 11.4, the 3rd ASEAN study projects a drop in final energy elasticity to 0.64 under APS conditions, while the ERIA study projects considerably higher energy elasticity ratios throughout the period, declining only marginally to 0.81 by 2035. This implies that a 1 percentage point increase in GDP would be paralleled by a 0.81 percentage increase in final energy demand.
11.4 Energy Efficiency Savings PotentialThe 3rd ASEAN study forecasts final energy consumption to reach 152.5 Mtoe by 2030 under BAU conditions, and 142 Mtoe if energy efficiency initiatives are effective. There would thus be savings amounting to 6% yearly by 2030. Savings according to the ERIA study closely match the final energy consumption and savings percentage of the 3rd ASEAN study. Also, as shown in Figure 11.3, the forecasts of these studies for the sector distribution of the savings closely match, despite the differing baseline energy demand estimates for the residential and commercial sector.
Industry Transport Non-energy Industry Transport Non-energy
0.0
10.0
20.0
30.0
40.0
50.0
60.0
70.080.0
Mto
e
2007
2030
BA
U
2030
APS
2030
BA
U
2030
APS
2007
2030
BA
U
2030
APS
2007
2030
BA
U
2030
APS
2009
2035
BA
U
2035
APS
2009
2035
BA
U
2035
APS
2009
2035
BA
U
2035
APS
2009
2035
BA
U
2035
APS
2007
Other (residential and
commercial)
Other (residential and
commercial)
3rd ASEAN Energy Outlook (2011) ERIA (2011)
Figure 11.3: Estimates of Final Energy Consumption by Sector: Viet Nam
APS = alternative policy scenario, ASEAN = Association of Southeast Asian Nations, BAU = business as usual, ERIA = Economic Research Institute for ASEAN and East Asia, Mtoe = million tonnes of oil equivalent..Sources: 3rd ASEAN Energy Outlook (2011); ERIA (2011).
The forecast of total final energy demand in the Viet Nam Master Plan for Power Development—188 Mtoe by 2030 under BAU conditions and 165 Mtoe under APS “base case” conditions—is somewhat higher than the forecasts in the two studies. Figure 11.4 shows the progressive increase in energy demand in the master plan, with “high” denoting BAU conditions and “base” denoting APS conditions. From the figure, it is clear that the plan foresees surging energy demand in the industry and transportation sectors.
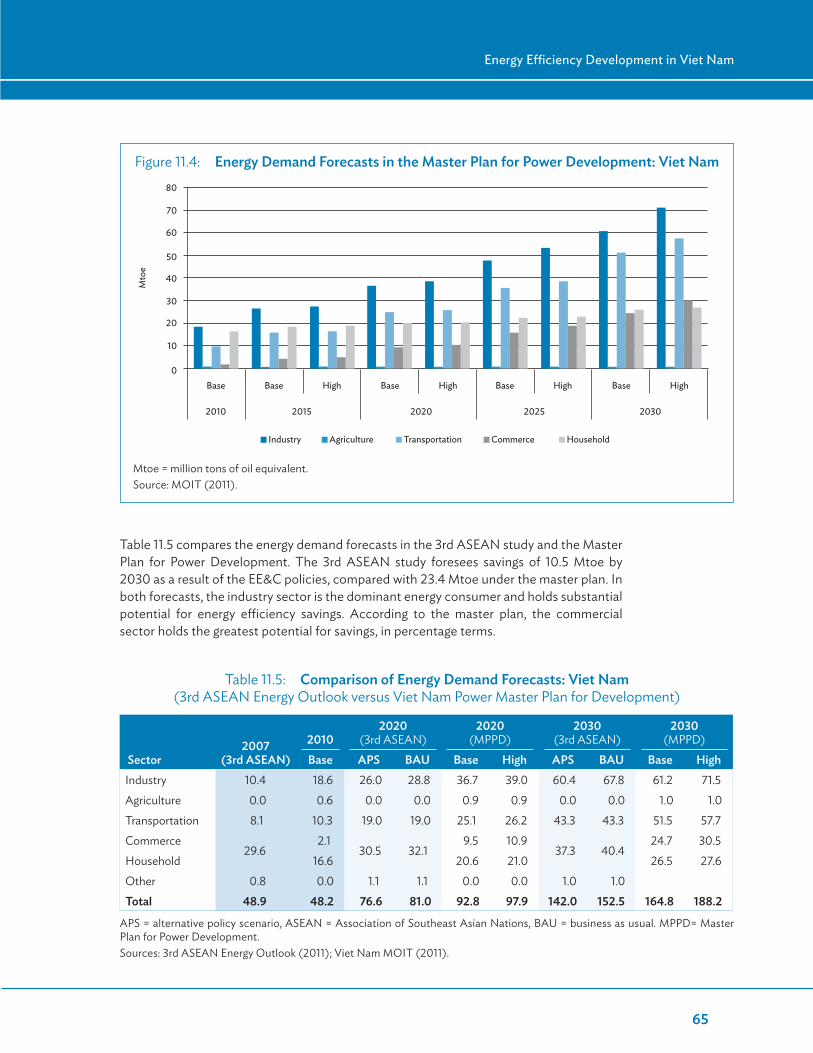
65
Energy Efficiency Development in Viet Nam
Table 11.5 compares the energy demand forecasts in the 3rd ASEAN study and the Master Plan for Power Development. The 3rd ASEAN study foresees savings of 10.5 Mtoe by 2030 as a result of the EE&C policies, compared with 23.4 Mtoe under the master plan. In both forecasts, the industry sector is the dominant energy consumer and holds substantial potential for energy efficiency savings. According to the master plan, the commercial sector holds the greatest potential for savings, in percentage terms.
0
10
20
30
40
50
60
70
80
Mto
e
2010 2015 2020 2025 2030
Base Base High Base High Base High Base High
Industry Agriculture Transportation Commerce Household
Figure 11.4: Energy Demand Forecasts in the Master Plan for Power Development: Viet Nam
Mtoe = million tons of oil equivalent.Source: MOIT (2011).
Table 11.5: Comparison of Energy Demand Forecasts: Viet Nam (3rd ASEAN Energy Outlook versus Viet Nam Power Master Plan for Development)
Sector2007
(3rd ASEAN)2010
2020 (3rd ASEAN)
2020 (MPPD)
2030 (3rd ASEAN)
2030 (MPPD)
Base APS BAU Base High APS BAU Base HighIndustry 10.4 18.6 26.0 28.8 36.7 39.0 60.4 67.8 61.2 71.5Agriculture 0.0 0.6 0.0 0.0 0.9 0.9 0.0 0.0 1.0 1.0Transportation 8.1 10.3 19.0 19.0 25.1 26.2 43.3 43.3 51.5 57.7Commerce
29.62.1
30.5 32.19.5 10.9
37.3 40.424.7 30.5
Household 16.6 20.6 21.0 26.5 27.6Other 0.8 0.0 1.1 1.1 0.0 0.0 1.0 1.0 Total 48.9 48.2 76.6 81.0 92.8 97.9 142.0 152.5 164.8 188.2
APS = alternative policy scenario, ASEAN = Association of Southeast Asian Nations, BAU = business as usual. MPPD= Master Plan for Power Development. Sources: 3rd ASEAN Energy Outlook (2011); Viet Nam MOIT (2011).

66
Energy Efficiency Developments and Potential Energy Savings in the Greater Mekong Subregion
The 3rd ASEAN and ERIA studies reach broadly consistent results, with the ERIA study somewhat less optimistic about potential energy efficiency savings (Table 11.6). The two studies indicate that the focus should be on the industry sector, where the savings in percentage terms appear to be strongest.
Viet Nam’s National Energy Efficiency Policy also provides estimates of potential energy efficiency savings, by sector and subsector, as shown in Table 11.7.19 Given the wide range of possible savings indicated, they appear to represent technical energy savings potential.
Gains in energy efficiency savings potential in the industry and residential sectors are discussed further in the following subsections.
19 The Legal framework on EE&C in Viet Nam, C.H. Quang, EECO-MOIT, Delegation of German Industry and Commerce in Viet Nam, 2012.
Table 11.6: Final Energy Consumption Savings by Sector: Viet Nam (3rd ASEAN Energy Outlook versus ERIA Study)
3rd ASEAN Energy Outlook (2011) ERIA (2011)
Sector
Final Energy Demand Savings
(Mtoe)% Reduction (BAU-APS)
Final Energy Demand Savings
(Mtoe)% Reduction (BAU-APS)
2020 2030 2020 2030 2020 2035 2020 2035Industry 2.8 7.4 9.7 10.9 2.3 5.5 7.8 8.1Transport 0.0 0.0 0.0 0.0 0.1 0.2 0.5 0.5Other (residential and commercial) 1.6 3.1 5.0 7.7 1.2 3.0 7.3 7.3Total 4.4 10.5 5.4 6.9 3.6 8.7 5.5 5.7
APS = alternative policy scenario, ASEAN = Association of Southeast Asian Nations, BAU = business as usual, ERIA = Economic Research Institute for ASEAN and East Asia, Mtoe = million tons of oil equivalent.Source: 3rd ASEAN Energy Outlook (2011), ERIA (2011).
Table 11.7: National Energy Efficiency Policy Estimates of Potential Energy Savings by Sector: Viet Nam
Sector/SubsectorSavings Potential
(%)Steel 20–25Cement 10–40Building 10–15Transport 25–28Public lighting 20–30
Source: MOIT (2006).
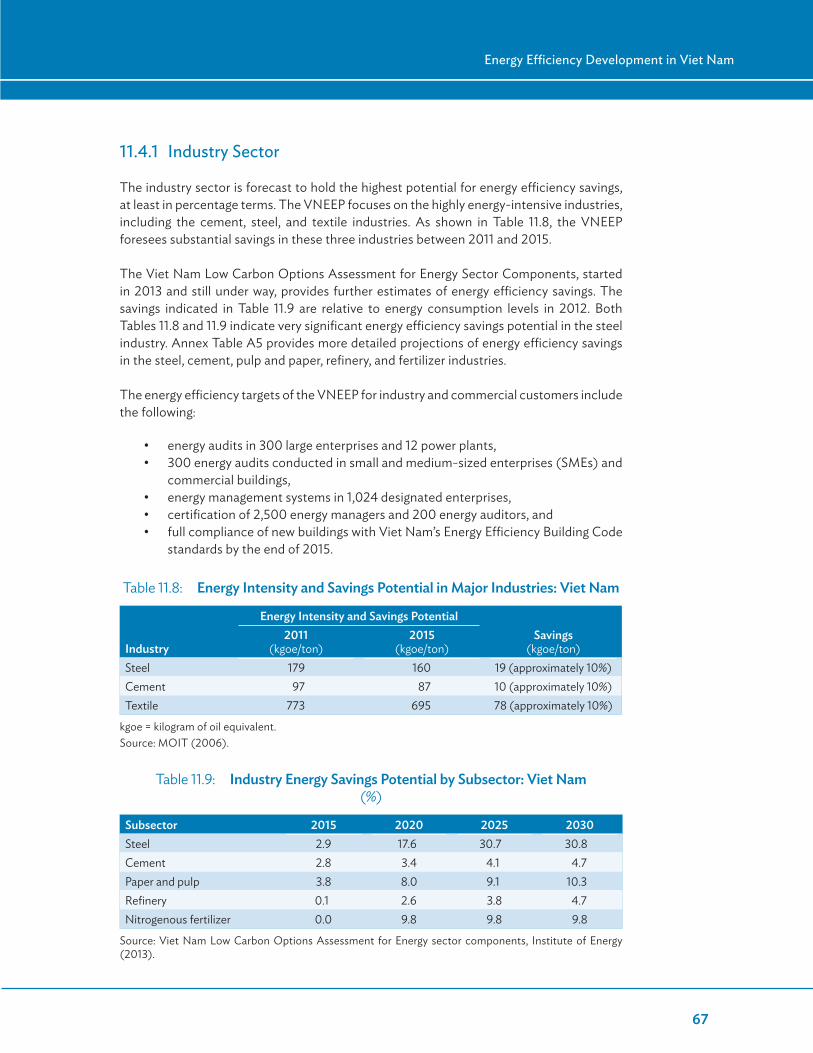
67
Energy Efficiency Development in Viet Nam
11.4.1 Industry Sector
The industry sector is forecast to hold the highest potential for energy efficiency savings, at least in percentage terms. The VNEEP focuses on the highly energy-intensive industries, including the cement, steel, and textile industries. As shown in Table 11.8, the VNEEP foresees substantial savings in these three industries between 2011 and 2015.
The Viet Nam Low Carbon Options Assessment for Energy Sector Components, started in 2013 and still under way, provides further estimates of energy efficiency savings. The savings indicated in Table 11.9 are relative to energy consumption levels in 2012. Both Tables 11.8 and 11.9 indicate very significant energy efficiency savings potential in the steel industry. Annex Table A5 provides more detailed projections of energy efficiency savings in the steel, cement, pulp and paper, refinery, and fertilizer industries.
The energy efficiency targets of the VNEEP for industry and commercial customers include the following:
• energy audits in 300 large enterprises and 12 power plants,• 300 energy audits conducted in small and medium-sized enterprises (SMEs) and
commercial buildings,• energy management systems in 1,024 designated enterprises,• certification of 2,500 energy managers and 200 energy auditors, and• full compliance of new buildings with Viet Nam’s Energy Efficiency Building Code
standards by the end of 2015.
Table 11.8: Energy Intensity and Savings Potential in Major Industries: Viet Nam
Industry
Energy Intensity and Savings PotentialSavings
(kgoe/ton)2011
(kgoe/ton)2015
(kgoe/ton)Steel 179 160 19 (approximately 10%)Cement 97 87 10 (approximately 10%)Textile 773 695 78 (approximately 10%)
kgoe = kilogram of oil equivalent.Source: MOIT (2006).
Table 11.9: Industry Energy Savings Potential by Subsector: Viet Nam (%)
Subsector 2015 2020 2025 2030Steel 2.9 17.6 30.7 30.8Cement 2.8 3.4 4.1 4.7Paper and pulp 3.8 8.0 9.1 10.3Refinery 0.1 2.6 3.8 4.7Nitrogenous fertilizer 0.0 9.8 9.8 9.8
Source: Viet Nam Low Carbon Options Assessment for Energy sector components, Institute of Energy (2013).
68
Energy Efficiency Developments and Potential Energy Savings in the Greater Mekong Subregion
Electricity prices in Viet Nam are heavily subsidized and low tariffs encourage investment in highly energy-intensive sectors, such as the cement and steel industries. As described in Section 1 (Introduction), subsidized energy prices send the wrong signals to consumers with respect to energy efficiency and conservation, and cause uneconomic use of energy. Energy and electricity prices, as regulated by the government, do not reflect the production costs (Do and Sharma 2011). As a consequence, Viet Nam’s EE&C policy fails to provide the proper incentive for investments in energy efficiency.
The Viet Nam steel industry illustrates the issue. In 2012, the industry paid $0.047 per kilowatt-hour (kWh) for electricity, compared with rates of $0.081 per kWh in Thailand. Supported by low electricity tariffs, steel producers in Viet Nam produced 6.5 million tons of steel in 2010/2011, or double the domestic demand. The steel industry is a highly energy-intensive industry where savings of more than 30% are possible.
11.4.2 Residential and Commercial Sector
According to the Viet Nam Low Carbon Options Assessment for Energy Sector Components, residential energy savings could amount to 20,000 GWh/year by 2030. As shown in Table 11.10, most of these savings would result from more efficient lighting (65.9%) and improved heating and cooling (27.4%). Annex Table A6 gives more details about the projected energy efficiency savings in Viet Nam’s residential sector.
11.5 Energy Efficiency ProgramsCurrent and recent energy efficiency programs in Viet Nam include the following:
• The Demand-Side Management and Energy Efficiency Project, funded by the World Bank and Global Environment Facility (GEF) and implemented from 2003 to 2010, supported the establishment of a DSM department in EVN, a public utility. Further, it supported the implementation of several DSM programs, the development and implementation of a pilot commercial energy efficiency program, and policy development and the capacity building of MOIT’s Energy Efficiency and Conservation Office.
• In 2011, MOIT and the World Bank undertook to implement several VNEEP activities, as part of the World Bank and GEF Viet Nam Clean Production and Energy Efficiency Project. MOIT, through its Department of Science, Technology and Energy Savings, is responsible for the implementation of the following three project components: energy efficiency action plans for key industry sectors; development of energy service providers; and capacity building for program management, and for monitoring and evaluation.
• The program Mainstreaming Energy Efficiency Through Business Innovation Support (MEET-BIS) in Viet Nam, from 2009 to 2013, was funded by the European Commission. The program had five components: (i) commercially viable clean production technologies; (ii) showcases, smart business support, and business innovation packages, in partnership with the private sector and financing institutions; (iii) commercial clean production technologies for SMEs;

69
Energy Efficiency Development in Viet Nam
(iv) sustainable, commercial viable energy efficiency technologies and services for SMEs; and (v) project and financial management, project monitoring and evaluation, procurement, and dissemination of lessons. By the second quarter of 2013, the project had promoted improved technologies among 3,000 SMEs and mobilized over 420 SME investments valued at €2.4 million.
• The European Commission–funded ASEAN Energy Managers Accreditation Scheme (AEMAS), 2010–2014, has five components: (i) establishment of the AEMAS institutional structure; (ii) training and accreditation of energy managers, and certification of energy end users; (iii) implementation and monitoring of
Table 11.10: Residential Energy Savings Potential: Viet Nam (%)
Item 2010 2015 2020 2025 2030BAU (GWh) 28,072 36,041 43,743 53,511 64,979EE (GWh) 28,072 34,335 38,773 41,579 45,150
Lighting 0 9.7 36.4 60.0 65.9Total Entertainment 0 1.8 3.6 10.9 24.4Radio 0 2.2 6.4 21.0 43.6Stereo 0 1.0 2.4 10.4 29.9CD player 0 1.5 4.1 18.7 43.2TV 0 1.8 3.5 9.8 20.8DVD / VCR 0 1.9 3.8 11.7 30.3Computer 0 6.5 12.8 25.5 36.1Printer 0 0.0 0.0 0.0 0.0White Appliances 0 3.7 7.8 17.0 25.4Refrigerator 0 5.5 13.4 30.6 45.3Washing machine 0 6.1 12.1 26.9 40.1Water pump 0 2.6 3.3 4.4 5.8Thermo pot 0 2.3 3.4 4.9 5.9Cooking pot 0 2.2 3.0 4.1 5.0Iron 0 2.4 3.4 4.9 6.0Vacuum cleaner 0 10.0 12.0 16.2 17.8Microwave 0 9.0 11.6 16.9 19.7
Heating and Cooling 0 6.8 11.5 20.5 27.4Electric water heater 0 7.5 12.4 21.3 30.1Fans 0 2.9 6.3 14.2 21.9Air conditioning 0 9.0 13.5 22.3 28.1Total 0 4.7 11.4 22.3 30.5
BAU = business-as-usual, EE = Energy Efficiency, GWh = gigawatt-hour.Source: Viet Nam Low Carbon Options Assessment for Energy sector components, Institute of Energy (2013).
70
Energy Efficiency Developments and Potential Energy Savings in the Greater Mekong Subregion
energy-saving activities; (iv) awareness promotion; and (v) project management, and monitoring and evaluation.
• The Energy Efficiency and Cleaner Production Financing Program, funded by the World Bank and the International Finance Corporation since 2010, includes: (i) advisory and investment services to selected financial institutions, (ii) technical assistance to develop the consultancy market for investments in energy efficiency, and (iii) promotional activities to increase awareness among local industries.
11.6 Summary of Energy Efficiency Developments and Potential
The Viet Nam Power Development Master Plan (MOIT 2011) foresees a tripling of energy demand over the next 15 to 20 years, increasing to about 188 Mtoe by 2030 from about 55 Mtoe currently. The industry and transportation sectors are expected to be the main users. The plan sets realistic targets for energy efficiency savings of 8%–10% compared with BAU conditions, or about 20 Mtoe annually by 2030. The plan, together with the VNEEP, identifies significant savings in the industry and residential and commercial sectors, as well as significant improvements in energy efficiency indicators (energy intensity and energy elasticity), resulting from advanced technical standards and high-performance equipment in energy-intensive industries. The focus of the plan and the VNEEP is on energy-intensive industries.
The 3rd ASEAN and ERIA studies, however, show savings of only 6% overall, or about 10 Mtoe annually by 2030. This is half the level indicated above. Both studies forecast less rapid growth in final energy demand than does the Master Plan for Power Development, with the result that smaller savings in percentage terms yield much smaller savings in absolute terms. Both studies show no savings in the transportation sector, and the master plan shows a fivefold increase in energy demand for the transportation sector by 2030, despite the assumption of 10% energy efficiency savings. This should be of great concern, as Viet Nam is highly dependent on imported transportation fuels and the projected marked increase in consumer demand runs counter to the requirement to reduce greenhouse gas emissions. The two studies underscore the importance of further analysis of the energy efficiency savings potential of Viet Nam. There is agreement with the government’s plans that significant savings are possible, but a more proactive approach will be needed to achieve the targets.
Viet Nam’s reliance on carbon-based fuels needs to be reduced as much as possible and practical. The government’s renewable energy targets are modest, as are its energy efficiency savings targets. There is all the more reason, therefore, to ensure that those targets are met. According to ADB’s Assessment of GMS Energy Sector Development (2013), Viet Nam has made little progress in implementing its Energy Conservation Law (2010) or in achieving greater energy efficiency in the economy. Viet Nam’s EE&C institutional capacity needs to be strengthened, together with the commitment of the government, state enterprises, private sector, communities, and individual households to greatly improved energy efficiency.

71
Energy Efficiency Development in Viet Nam
The Master Plan for Power Development and the VNEEP provide more detailed projections of savings possible in the industry and the residential and commercial sectors. Economic instruments such as full-cost covering tariffs could be applied as powerful tools for achieving real progress in energy efficiency. With the right economic signals, the incentive to pursue energy efficiency savings is strengthened and regulations become more effective.

72
Cambodia, the Lao PDR, Myanmar, Thailand, and Viet Nam are predicting a doubling or tripling (or more) of energy consumption over the next 15 to 20 years. To meet the increased demand, these GMS countries will need to do more than simply
add to energy supplies, domestic and imported. The imperative to reduce greenhouse gas emissions and to promote sustainable and inclusive growth, together with the need to reduce their vulnerability from overreliance on imported energy, underscores the vital importance of energy efficiency and conservation.
The industry and transportation sectors of Thailand and Viet Nam are expected to show the largest increases in energy demand, with their residential and commercial sectors not far behind. Myanmar is forecast to experience a jump in energy demand, especially in its residential and commercial sectors. Cambodia and the Lao PDR start at very low levels of energy consumption, and while they are forecast to experience large percentage increases in demand, the absolute levels will remain low.
A review of energy efficiency developments in each of the five countries provides basis for reassurance that energy savings feature in their respective policy agendas. Most of the countries envisage energy efficiency savings of at least 10% over the next 15–20 years, and Thailand foresees savings of 20%. According to the 3rd ASEAN Energy Outlook study, these savings could amount collectively to almost 60 Mtoe annually by 2030. The ERIA study also estimates substantial savings, but only half the level projected by the 3rd ASEAN study. National energy efficiency action plans of the five countries identify areas for savings in the order of 40% or more, especially with regard to energy-intensive industries such as cement and steel.
The 3rd ASEAN and ERIA studies drawn on extensively in this report follow the same general procedure for estimating potential energy efficiency savings used by ministries in the five countries. Core assumptions (e.g., the long-term rate of growth of energy demand) vary widely, but the methodology is standard. To assess energy efficiency savings potential, final energy demand under BAU conditions—that is, in the absence of new or strengthened energy efficiency measures by the governments—is first estimated. This level of demand is then compared with projected demand under conditions of stronger energy efficiency measures and effort by the government, industry, service sector, communities, and
12 Conclusions: Collective Energy Efficiency Savings Potential in the GMS and Scope for Regional Development
73
Conclusions: Collective Energy Efficiency Savings Potential in the GMS and Scope for Regional Development
individual households. The difference in estimated levels of energy demand represents a country’s energy efficiency savings potential. As noted above, Thailand has targeted savings of 20% by 2030.
However, while Thailand has a well-advanced policy, institutional, and regulatory framework for pursuing its energy efficiency savings targets, Cambodia, the Lao PDR, Myanmar, and to a lesser extent Viet Nam are much less well prepared to do what is required to reach their targets. They do not appear to have carried out detailed energy efficiency potential studies as the basis for setting their energy savings targets, or to have charted in detail the steps needed to reach their targets. The four countries, and also Thailand in some respects, must strengthen their institutional, technical, and financial capacities to be able to design and implement energy efficiency best practices. Most importantly, the nongovernment sector must be at the forefront of energy efficiency initiatives, as it is the main energy consumer.
In general, the GMS countries need better-defined action plans to mainstream investment in energy efficiency throughout all components of their economies. While subsidies and regulations are important elements of effective action plans, together with pilot projects and government programs, economic instruments are likely to be the main contributors to improved energy efficiency. As discussed below, these include energy pricing, competition policies, and tax regimes. International best practices should help guide GMS action plans, and knowledge sharing among the countries should help determine where to focus and how.
As described in this report, energy efficiency is the reduction of energy required for a given level of activity, or doing more with less. Energy conservation, such as switching off lights and appliances when not in use, is a dimension of energy efficiency. Supply-side energy savings derive largely from measures taken by public utilities and private sector investors to increase generation efficiency and to reduce transmission and distribution losses. Demand-side energy savings arise mainly from investments by industry and commercial users in more efficient production and transportation methods, and from greater use of more efficient lighting, heating and cooling, and other appliances and transport vehicles by households. GMS energy efficiency action plans need to incorporate both supply-side and demand-side measures and incentives.
Diagnostic analysis should identify the fundamental causes of supply- and demand-side inefficiencies. On the supply side, a possible cause may be institutional inertia reflecting state control of energy generation, transmission, and distribution. While Cambodia continues to have among the highest electricity rates in the world and among the lowest rates of electrification, its reforms in 2001 and following years led to the unbundling of the power sector, a start in creating a competitive wholesale power market, and greater scope for private sector participation. A 3-year review of the sector during the mid-2000s by the International Finance Corporation, ADB, and the Japan International Cooperation Agency produced recommendations for further reforms, including competitive bidding, replacement of old and outdated energy facilities, and the removal or reduction of import duties on new machinery and equipment. Importantly, electricity rates were increased to better cover the costs of generation and distribution, resulting in a much strengthened
74
Energy Efficiency Developments and Potential Energy Savings in the Greater Mekong Subregion
financial position for the Electricity Authority of Cambodia. The National Energy Efficiency Policy Plan of Cambodia now anticipates energy savings potential of up to 80% in rural electricity generation and distribution, corresponding to the reduction of the huge generation and distribution losses of the thousands of rural energy enterprises.
Similar reforms and developments can be cited for the Lao PDR, Myanmar, and Viet Nam, with Thailand more advanced in achieving supply-side energy efficiencies. However, all five countries have considerable potential for further supply-side energy savings. Although bilateral trading arrangements are a first step toward regional power trade, a competitive wholesale power market has yet to be established in the GMS, or in most of the countries. Continued technological advances in energy supply mean that GMS energy efficiency targets should be dynamic—adjusted upward in line with new international best practices. Also, renewable energy initiatives need to be integrated with supply-side energy efficiency initiatives.
Demand-side energy efficiency is equally challenging, if not more so. Since the need for action is dispersed over all energy users, including individual households, mobilizing the proper response is doubly difficult. There is a public goods dimension to energy efficiency (the social benefits are greater than the private benefits); hence, public sector interventions are needed to boost attention and commitment to energy conservation and efficiency. This applies especially to households, as they may be least aware of the benefits of energy conservation and the options for energy savings. GMS countries foresee energy savings in the order of 10% if households were to use fluorescent tube lighting, more efficient air conditioners, and the like, prompting governments to introduce programs for this purpose. Good intentions, however, can sometimes lead to misguided interventions and the refrain of economists to do no harm is wise counsel. Again, diagnostic analysis is needed to identify the main factors leading to inefficient demand-side energy use and the best ways to address these factors.
As stated above, economic instruments are likely to be the main determinant as to whether or not GMS countries reach their targets for energy efficiency savings. Three demand-side economic instruments are particularly important: the consumer price of energy, the degree of competition in the economy, and the taxation regime. GMS countries generally set energy prices much below the cost of supply, as a form of stimulus to industrial development and to assist poor households. However, the cost in terms of perpetuating energy inefficiency is counterproductive. The equity implications are also unfavorable, as higher-income members benefit the most from subsidized energy. The dilemma, though, is that raising energy prices could be disruptive to some industries and be highly unpopular with voters. Moreover, the poverty implications must be addressed; the best way would be through compensating demigrants to targeted groups, but since social welfare systems are so rudimentary in GMS countries, this could be impractical. GMS countries should study how other countries have dealt with the energy-pricing problem.
Competition is another economic instrument for encouraging demand-side energy savings. State enterprises and private sector oligopolies, often operating behind protective tariffs and other forms of favored support (e.g., credit access), may have little incentive to invest in energy-saving production and distribution processes. Opening the economy to greater
75
Conclusions: Collective Energy Efficiency Savings Potential in the GMS and Scope for Regional Development
domestic and international competition forces the industrial and commercial sectors to be much more attentive to cost savings available through energy efficiency measures. Viet Nam’s National Energy Efficiency Policy has projected savings in the range of 25% to 40% in the steel and cement industries. In Thailand, it is estimated that 950 ktoe could be saved annually by 2030 by improving the efficiency of current glass manufacturing processes. According to Cambodia’s National Energy Efficiency Policy, energy efficiency savings of almost 30% are possible in the garment and rubber industries. Globalization is both forcing industries to be increasingly energy efficient and demonstrating ways of doing so. Diagnostic analysis of this component of competition could serve as a useful knowledge product for GMS countries.
Competitive bidding is another element of competition that serves both the supply and demand sides of energy efficiency. While GMS countries have made considerable progress in implementing rules-based competitive bidding procedures, rent-seeking behavior continues to be widespread, with the result that energy efficiency is compromised. New machinery to replace old stock provides an opportunity to select energy-efficient products. So too in the case of greenfield investment. GMS countries need to clamp down hard on nontransparent practices that deflect decision making from choices aligned with the national interest.
The taxation regime also bears on both the supply and demand sides of energy efficiency. As this report has documented, investment in renewable energy and energy efficiency is generally accorded favorable treatment under the tax code. Further, imports of machinery and other components for renewable energy and energy efficiency investments are normally exempt from import duties. GMS countries, however, have heavily subsidized domestic industry in various ways—including the application of low electricity tariffs. The public goods nature of investment in renewable energy and energy efficiency warrants public support but not protectionism or artificially supported indigenous industry. The right incentive structure is critical to mainstreaming energy efficiency throughout the economy.
In 2013, the World Energy Council released a wide-ranging review of energy efficiency policies: what works and what does not (WEC 2013). The review included a survey of almost 90 countries (four in Asia) covering more than 90% of world energy consumption. According to the survey, an increasing number of countries are adopting quantitative energy efficiency targets and laws, and establishing energy efficiency agencies. Regulations are widely used to lower the consumption of specific appliances and equipment and to speed up the diffusion of energy-saving investments and practices. Economic incentives increasingly involve the private sector, notably through energy service companies, which contract with customers to provide energy savings. Industrial energy efficiency policies are focusing on mandatory energy audits, energy managers, and flexible instruments, such as voluntary agreements combined with performance-based tax benefits. Transport energy efficiency measures focus on mandatory fuel efficiency standards; tax policies reinforce the use of more efficient vehicles and trucks. The dominant role of rail transport in the People’s Republic of China and India is credited with having delinked transport consumption from GDP. Residential and nonresidential buildings represent the largest end-use sector. Tighter building codes and minimum energy performance standards for appliances have proven effective. Financial incentives in the form of subsidies and low-interest loans
76
Energy Efficiency Developments and Potential Energy Savings in the Greater Mekong Subregion
have promoted extensive retrofitting. Labeling of electrical appliances represents a cost-effective way of addressing market failures, especially when accompanied by a clear communications campaign.
The World Energy Council 2013 report makes the following recommendations:
• Make energy prices reflect real costs.• Keep consumers better informed and address consumer behavior (practices).• Implement innovative financing tools to support consumers’ investments.• Control the quality of energy-efficient equipment and services.• Enforce regulations and strengthen them regularly.• Monitor and evaluate energy efficiency policies to check their impact.• Enhance international and regional cooperation.
The findings and recommendations of the World Energy Council, and those of other leading international organizations, should be drawn on in charting the course ahead. While GMS countries have considerable potential for energy efficiency savings and ambitious targets to capture that potential over the next 15–20 years, their technical know-how and resources for realizing the potential need to be strengthened. GMS countries, through the Greater Mekong Subregion Economic Cooperation Program, are sharing knowledge to some extent, but to date the policy and regulatory impact has been limited. Cambodia, the Lao PDR, and Myanmar are at preliminary stages of energy efficiency, and although Viet Nam adopted proactive measures more than a decade ago, progress has been slow. Thailand provides a more advanced model of energy efficiency but is still lagging behind its potential, especially with regard to its energy-intensive industries. Supply and demand management for energy efficiency needs to be made a priority at the regional and national levels.
ADB is working closely with the GMS governments to invest in energy efficiency, together with investment in renewable energy. ADB is also working closely with the private sector, endeavoring to leverage scarce financial resources to gain maximum energy efficiency and renewable energy results. PPPs combine public and private interests, and are a model of cooperation essential for achieving what is possible and what is needed. As a knowledge bank, ADB is helping to inform key ministries and business and community leaders about international best practices and expertise concerning energy efficiency and renewable energy. As a highly operational bank backed by substantial technical and investment resources, ADB is helping developing member countries to achieve their targets for energy efficiency savings and renewable energy.
This report on energy efficiency savings in GMS countries provides a foundation for optimism, for the potential for savings is considerable, and increasingly initiatives are under way to develop the potential. ADB encourages the GMS countries to accelerate the tempo and commits itself to helping to mobilize the expertise and financial resources required. ADB’s support of energy efficiency in GMS countries will be inclusive, ensuring that the benefits embrace the poor and that the private sector is fully engaged in the investment opportunities. ADB will also twin its support for energy efficiency with support for renewable energy.

77
References
Anh, C.B. and T.V. Lien. 2009. Viet Nam’s Renewable Energy Potential. Country paper presented at the Regional Workshop on Opportunities and Priorities for Low Carbon Green Growth in Asia. Bangkok. 15–18 September. Tokyo: Asian Development Bank Institute. http://www.adbi.org/files/2009.09.16.cpp.day2.sess4.18.country.ppr.vietnam.pdf
Asia-Pacific Economic Cooperation (APEC). 2010. Peer Review on Energy Efficiency in Viet Nam. Final Report. Singapore.
Asian Development Bank (ADB). 2008. Sector Assistance Program Evaluation of the Energy Sector in the Greater Mekong Subregion. Manila.
———. 2011a. Lao People’s Democratic Republic: Country Partnership Strategy (2012–2016). Manila.
———. 2011b. Review of Energy Efficiency Interventions. Evaluation Knowledge Brief. Manila.
———. 2012a. Myanmar: Energy Sector Initial Assessment. Manila.
———. 2012b. Myanmar: Interim Country Partnership Strategy (2012–2014). Manila.
Asian Development Bank and the United States Agency for International Development, with World Resources Institute and The Regulatory Assistance Project. 2011. Second Annual Asia-Pacific Dialogue on Clean Energy Governance, Policy, and Regulation: Special Roundtable to Develop a Regional Action Plan for Asia-Pacific Dialogue on Clean Energy Governance, Policy, and Regulation. Manila.
Association of Southeast Asian Nations (ASEAN) Centre for Energy (ACE); Institute of Energy Economics, Japan (IEEJ); and National Energy Supply and Security Planning in the ASEAN (ESSPA) Project Teams. 2011. The 3rd ASEAN Energy Outlook. Jakarta.
Do, T.M. and D. Sharma. 2011. Viet Nam’s Energy Sector: A Review of Current Energy Policies and Strategies. Energy Policy 39 (10): 5770–5777.
European Union. Mainstreaming Energy Efficiency Through Business Innovation Support Viet Nam (MEET-BIS Viet Nam) Project. http://eeas.europa.eu/ delegations/vietnam/projects/list_of_projects/171201_en.htm
Government of Cambodia, Electricity Authority of Cambodia (EAC). 2012. Report on Power Sector of the Kingdom of Cambodia for the Year 2012. Phnom Penh.
Government of Cambodia, Ministry of Industry, Mines and Energy (MIME). 2011. Paper presentation at the 2011 Cambodia Outlook Conference: A Partnership of CDRI and ANZ Royal Bank. Phnom Penh. 16 March.
78
References
———. 2013. National Energy Efficiency Policy, Strategy and Action Plan. Phnom Penh. Government of Cambodia, MIME; ERIA; and ACE. 2012. Energy Efficiency Challenges and Opportunities. Paper presented at the 2nd East Asia Summit (EAS) Energy Efficiency Conference. Phnom Penh. 31 July–1 August.
Government of Cambodia, MIME, National Cleaner Production Office (CNCPO). http://www.cambodian-cpc.org/index.php?option=com_content&view=article&id=29 &Itemid=178&lang=en
Government of the Lao People’s Democratic Republic (Lao PDR), Ministry of Energy and Mines. 2012. Overview of Energy Efficiency and Conservation in the Lao PDR. Presentation at the 2nd EAS Energy Efficiency Conference. Phnom Penh. 2012. 31 July–1 August. http://www.eria.org/events/3.%20Mr.Bouathep%20Malaykham%20-%20Overview%20of%20Energy%20Efficiency%20and%20Conservation%20in%20the%20Lao%20PDR.pdf
Government of the Lao PDR, Department of Energy Management, Department of Energy. 2013. Energy Efficiency and Conservation (EEC) Activities and Standards and Labelling Programs in the Lao PDR. Presentation at the Seventh lites.asia Regional Meeting. Jakarta. 22–23 April 2013.
Government of Thailand, Ministry of Energy. 2009. Draft version Thailand in the 2010’s. Thailand’s Renewable Energy and its Energy Future: Opportunities and Challenges. http://nstda.or.th/pub/2012/20120523-renewable-energy-strategy-2008-2022.pdf
———. 2011. 20-Year Energy Efficiency Action Plan (2011–2030). http://www.eppo.go.th/admin/km/20-YearEEAP_EN.pdf
———. 2012. Summary of Thailand Power Development Plan 2012–2030 (PDP2010: Revision 3). Presentation. June.
Government of Viet Nam, Ministry of Industry and Trade (MOIT). 2006. Viet Nam National Energy Efficiency Program, 2005–2015. Ha Noi.
———. 2011. National Master Plan for Power Development for the 2011–2020 Period with the Vision to 2030. Ha Noi.
Grüning, C. at al. 2012. National Climate Finance Institutions Support Programme Case Study: The Thai Energy Efficiency Revolving Fund. Frankfurt, Germany: Frankfurt School of Finance & Management.
Hasanbeigi, A., C. Menke, and A. Therdyothin. 2010. The Use of Conservation Supply Curves in Energy Policy and Economic Analysis: The Case Study of Thai Cement Industry. Energy Policy 38 (1): 392–405.
International Energy Agency (IEA). 2012. World Energy Outlook. Paris.
International Institute for Energy Conservation (IIEC). http://www.iiec.org/index .php?option=com_content&view=article&id=507%3Afrom-design-to-action--demand-side-management-and-energy-efficiency-in-lao-pdr&Itemid=119

79
References
International Institute for Sustainable Development. 2012. Incentives for Renewable Energy in Southeast Asia: Case Study of Viet Nam.
Kimura, S. ed.. 2011. Analysis of Energy Saving Potential in East Asia Region. ERIA Research Project Report 2010-21. Jakarta: ERIA.
King Mongkut’s University of Technology Thonburi. 2012. Thailand’s 20-Year Energy Efficiency Development Plan. Ppresentation at the 13th Climate Technology Initiative Workshop Innovations for Climate Friendly Building Sector, Neue Malzerei, Berlin. 4–5 October. http://www.jiko-bmu.de/files/basisinformationen/application/pdf/day1_4_pattana_rakkwamsuk_thailands_20-year_energy_efficiency _development_plan.pdf
Lieng, V. 2013. Development of the National Energy Efficiency Policy, Strategy and Action Plan for the Kingdom of Cambodia. Presentation at the Asia Clean Energy Forum 2013. Manila. 25–28 June.
Nam, P.K., N.A. Quan, and Q.M.Q. Binh. 2012. Incentives for Renewable Energy in Southeast Asia: Case Study of Viet Nam. The Trade Knowledge Network Policy Brief. December. Manitoba: International Institute for Sustainable Development.
Republic of the Union of Myanmar, Directorate of Industrial Planning, Ministry of Industry. 2010. Paper presentation for the Regional Workshop on Strengthening Institutional Capacity to support Energy Efficiency in Asian Countries. Bangkok. 24–26 March.
Republic of the Union of Myanmar, Energy Planning Department, Ministry of Energy. 2011. Country Presentation on Energy Sector Development in Myanmar at the 5th Meeting of the Greater Mekong Subregion Subregional Energy Forum (SEF-5). Ho Chi Minh. 11 November.
———. 2013. Country report presentation. http://eneken.ieej.or.jp/data/5024.pdf
Southeast Asia Network of Climate Change Offices. 2011. Fourth Meeting of Southeast Asia Network of Climate Change Focal Points. Jakarta. 4–5 May. http://www.sean -cc.org/2011/05/05/fourth-meeting-of-southeast-asia-network-of-climate-change -focal-points/
Thai Cement Manufacturers Association (TCMA) http://www.thaicma.or.th/cms/index .php/scale-of-cement-industry/scale-of-cement-industry/
United Nations. Undated. Draft Cambodia Energy Sector Strategy. http://www.un.org/esa/agenda21/natlinfo/countr/cambodia/energy.pdf
United Nations Economic and Social Commission for Asia and the Pacific (UNESCAP). 2011. Guidelines for Strengthening Energy Efficiency Planning and Management in Asia and the Pacific. Bangkok.
United States Environmental Protection Agency (EPA). 2006. National Action Plan for Energy Efficiency Guidelines. www.epa.gov/eeactionplan
80
References
World Bank. 2012. Asia Sustainable and Alternative Energy Program. Lao PDR Power to the People: Twenty Years of National Electrification. Washington, DC.
World Energy Council (WEC). 2013. World Energy Perspective: Cost of Energy Technologies. Study conducted in partnership with Bloomberg New Energy Finance (BNEF). London.
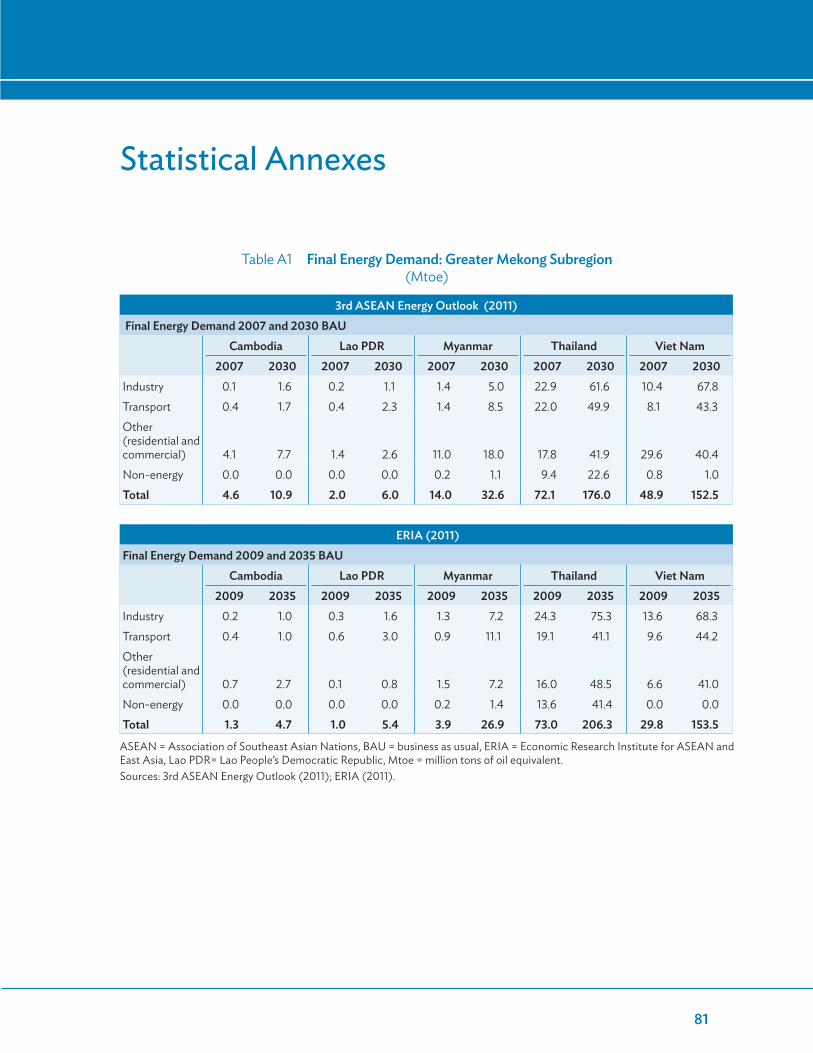
81
Statistical Annexes
Table A1 Final Energy Demand: Greater Mekong Subregion (Mtoe)
3rd ASEAN Energy Outlook (2011)Final Energy Demand 2007 and 2030 BAU
Cambodia Lao PDR Myanmar Thailand Viet Nam 2007 2030 2007 2030 2007 2030 2007 2030 2007 2030Industry 0.1 1.6 0.2 1.1 1.4 5.0 22.9 61.6 10.4 67.8Transport 0.4 1.7 0.4 2.3 1.4 8.5 22.0 49.9 8.1 43.3Other (residential and commercial) 4.1 7.7 1.4 2.6 11.0 18.0 17.8 41.9 29.6 40.4Non-energy 0.0 0.0 0.0 0.0 0.2 1.1 9.4 22.6 0.8 1.0Total 4.6 10.9 2.0 6.0 14.0 32.6 72.1 176.0 48.9 152.5
ERIA (2011)Final Energy Demand 2009 and 2035 BAU Cambodia Lao PDR Myanmar Thailand Viet Nam 2009 2035 2009 2035 2009 2035 2009 2035 2009 2035Industry 0.2 1.0 0.3 1.6 1.3 7.2 24.3 75.3 13.6 68.3Transport 0.4 1.0 0.6 3.0 0.9 11.1 19.1 41.1 9.6 44.2Other (residential and commercial) 0.7 2.7 0.1 0.8 1.5 7.2 16.0 48.5 6.6 41.0Non-energy 0.0 0.0 0.0 0.0 0.2 1.4 13.6 41.4 0.0 0.0Total 1.3 4.7 1.0 5.4 3.9 26.9 73.0 206.3 29.8 153.5
ASEAN = Association of Southeast Asian Nations, BAU = business as usual, ERIA = Economic Research Institute for ASEAN and East Asia, Lao PDR= Lao People’s Democratic Republic, Mtoe = million tons of oil equivalent.Sources: 3rd ASEAN Energy Outlook (2011); ERIA (2011).

82
Statistical Annexes
Table A2 Comparison of Regional Macroeconomic Indicators: Greater Mekong Subregion
(%)
3rd ASEAN Energy Outlook (2011) Item Cambodia Lao PDR Myanmar Thailand Viet NamAnnual Average GrowthGDP growth, 1990–2007 6.1 6.8 11.7 4.8 7.7
GDP growth, 2007–2030 7.3 7.7 9.3 3.9 7.5Population growth, 2007–2030 1.7 1.6 1.7 0.3 0.8
Average Annual Primary Energy Consumption Growth2007–2030, BAU case 4.2 6.3 3.6 3.8 6.3
2007–2030, APS case 3.5 6.0 3.2 2.7 5.9
Average Annual Final Energy Consumption Growth
1990–2007 2.3 3.2 2.4 5.1 4.7
2007–2030, BAU case 3.8 5.0 3.7 4.0 5.1
2007–2030, APS case 3.1 4.7 3.4 2.8 4.8
ERIA (2011)Item Cambodia Lao PDR Myanmar Thailand Viet NamAnnual Average Growth GDP growth, 1990–2009 7.7a 6.8 9.1 4.2 7.1
GDP growth, 2009–2035 6.9 6.2 8.5 4.4 7.8Population growth, 2009–2035 1.6 1.6 1.8 0.3 0.8
Average Annual Primary Energy Consumption Growth 2009–2035, BAU case 5.1 8.1 6.2 3.9 6.7
2009–2035, APS case 1.7 8.0 5.9 3.4 6.5
Average Annual Final Energy Consumption Growth 1990–2009 9.0a 8.7 7.6 5.6 10.8
2009–2035, BAU case 5.2 6.9 7.6 4.1 6.5
2009–2035, APS case 4.8 6.7 7.3 3.7 6.3
APS = alternative policy scenario, ASEAN = Association of Southeast Asian Nations, BAU = business as usual, ERIA = Economic Research Institute for ASEAN and East Asia, GDP = gross domestic product, Lao PDR = Lao People’s Democratic Republic, Mtoe = million tons of oil equivalent.a for period 1995–2009.Sources: 3rd ASEAN Energy Outlook (2011); ERIA (2011).

83
Statistical Annexes
Table A3 Energy Elasticity: Greater Mekong Subregion
3rd ASEAN Energy Outlook (2011) Item Cambodia Lao PDR Myanmar Thailand Viet NamAverage Primary Energy Elasticity of GDP 2007–2030BAU case 0.58 0.82 0.39 0.97 0.84
APS case 0.48 0.78 0.34 0.69 0.79
Average Final Energy Elasticity of GDP 2007–2030BAU case 0.52 0.65 0.40 1.03 0.68
APS case 0.42 0.61 0.37 0.72 0.64
ERIA (2011) Item Cambodia Lao PDR Myanmar Thailand Viet NamAverage Primary Energy Elasticity of GDP 2009–2035BAU case 0.74 1.31 0.73 0.89 0.86
APS case 0.25 1.29 0.69 0.77 0.83
Average Final Energy Elasticity of GDP 2009–2035BAU case 0.75 1.11 0.89 0.93 0.83
APS case 0.70 1.08 0.86 0.84 0.81
APS = alternative policy scenario, ASEAN = Association of Southeast Asian Nations, BAU = business as usual, ERIA = Economic Research Institute for ASEAN and East Asia, GDP = Gross Domestic Product, Lao PDR = Lao People’s Democratic Republic. Sources: 3rd ASEAN Energy Outlook (2011); ERIA (2011).

84
Table A4 Energy Intensity Comparison: Greater Mekong Subregion (toe/$ million)
3rd ASEAN Energy Outlook (2011)
Final Energy Intensity 1990 2005 2007 2020 2030Cambodia BAU 1,233 772 657 423 311
APS 357 266
Lao PDR BAU 1,267 750 741 507 400
APS 479 380
Myanmar BAU 3,654 1,068 819 368 249
APS 337 230
Thailand BAU 389 417 414 421 419
APS 367 321
Viet Nam BAU 1,500 1,009 930 625 545
APS 592 508
ERIA (2011)
Final Energy Intensity 1990 2005 2009 2020 2035Cambodia BAU 154 175 164 147 110
APS 134 101
Lao PDR BAU 222 208 313 288 362
APS 274 349
Myanmar BAU 270 346 207 204 167
APS 190 155
Thailand BAU 330 417 420 409 491
APS 397 447
Viet Nam BAU 264 478 507 491 372
APS 464 351
APS = alternative policy scenario, ASEAN = Association of Southeast Asian Nations BAU = business as usual, ERIA = Economic Research Institute for ASEAN and East Asia, toe = ton of oil equivalent.Sources: 3rd ASEAN Energy Outlook (2011); ERIA (2011).
Statistical Annexes

85
Statistical Annexes
Table A5 Energy Efficiency by Industry: Viet Nam
Projected Energy Consumption of Steel Industry in BAU Case Energy Consumption of Steel Industry in EE Case
Item Unit 2010 2015 2020 2025 2030 Item Unit 2010 2015 2020 2025 2030
Fuel Oil million tons 0.16 0.24 0.35 0.46 0.59 Fuel Oil million tons 0.16 0.23 0.32 0.38 0.48
Coal million tons 1.17 1.79 2.72 4.67 6.05 Coal million tons 1.17 1.74 2.05 2.77 3.56
Electricity GWh 3,242.60 4,926.40 7,260.80 9,290.30 11,962.40 Electricity GWh 3,242.60 4,791.60 6,989.90 9,127.60 11,948.70
Total PJ 48.10 73.50 110.40 172.50 223.10 Total PJ 48.10 71.40 91.0 119.50 154.30
Projected Energy Consumption of Cement Industry in BAU Case Energy Consumption of Cement Industry in EE Case
Item Unit 2010 2015 2020 2025 2030 Item Unit 2010 2015 2020 2025 2030
Coal million tons 8.00 10.27 13.14 14.57 16.16 Coal million tons 8.00 9.98 12.69 13.97 15.39
Electricity GWh 5,906.70 7,165.10 9,171.30 10,168.00 11,273.00 Electricity GWh 5,906.70 6,973.90 8,884.50 9,793.30 10,795.00
Total PJ 227.60 290.70 372.10 412.60 457.40 Total PJ 227.60 282.50 359.30 395.70 435.80
Projected Energy Consumption of Paper and Pulp Industry in BAU Case Energy Consumption of Paper and Pulp Industry in EE Case
Item Unit 2010 2015 2020 2025 2030 Item Unit 2010 2015 2020 2025 2030
Coal million tons 0.55 1.51 2.92 4.68 6.93 Coal million tons 0.55 1.45 2.69 4.27 6.24
Electricity GWh 604.00 1,651.70 3,186.70 5,115.20 7,578.20 Electricity GWh 604.00 1,575.00 2,894.40 4,563.00 6,641.00
Total PJ 16.40 44.90 86.70 139.20 206.20 Total PJ 16.40 43.20 79.80 126.50 185.00
Projected Energy Consumption of Refinery in BAU Case Energy Consumption of Refinery in EE Case
Item Unit 2010 2015 2020 2025 2030 Item Unit 2010 2015 2020 2025 2030
Fuel oil million tons 0.37 0.42 2.21 5.42 5.42 Fuel oil million tons 0.37 0.42 2.16 4.6 5.18
Feedstock million tons 0.15 0.17 0.89 1.93 2.18 Feedstock million tons 0.15 0.17 0.87 1.85 2.08
Total PJ 21.14 24.10 127.93 276.25 313.33 Total PJ 21.14 24.08 124.59 265.74 298.74
Projected Energy Consumption of Nitrogenous Fertilizer Industry in BAU Case Energy Consumption of Nitrogenous Fertilizer Industry in EE Case
Item Unit 2010 2015 2020 2025 2030 Item Unit 2010 2015 2020 2025 2030
Natural Gas million tons 0.51 0.83 1.13 1.38 1.66 Natural Gas million tons 0.51 0.83 1.02 1.25 1.50
Coal million tons 0.12 0.19 0.26 0.30 0.32 Coal million tons 0.12 0.19 0.24 0.27 0.29
Electricity GWh 319.40 526.18 710.18 8,04.17 872.81 Electricity GWh 319.40 526.22 641.12 725.96 787.74
Total PJ 28.52 46.98 63.41 77.93 93.46 Total PJ 28.52 46.98 57.22 70.27 84.32
BAU = business as usual, EE = energy efficiency, GWh = gigawatt-hour, PJ = petajoule.Source: Viet Nam Low Carbon Options Assessment for Energy sector components, Institute of Energy (2013).

86
Table A6 Residential Energy Consumption: Viet Nam
Total Power Consumed by Appliances
BAU Case EE Case
2010 2015 2020 2025 2030 2010 2015 2020 2025 2030
Lighting GWh 2,352.00 3,755.00 3,080.00 2,394.00 2,513.00 2,352.00 4,160.00 4,842.00 5,983.00 7,375.00
Total Entertainment GWh 5,811.00 5,338.00 4,538.00 3,552.00 2,632.00 5,811.00 5,438.00 4,708.00 3,988.00 3,481.00
Radio GWh 51.15 52.64 42.92 29.60 18.27 51.15 53.83 45.86 37.47 32.40
Stereo GWh 1,272.48 1,140.76 879.54 567.41 302.00 1,272.48 1,152.41 900.72 632.98 431.11
CD player GWh 35.61 49.37 42.19 30.90 19.82 35.61 50.12 43.98 38.00 34.87
TV GWh 2,675.09 2,888.35 2,631.52 2,232.14 1,837.20 2,675.09 2,942.40 2,727.27 2,473.91 2,318.86
DVD/VCR GWh 932.80 982.79 816.47 575.70 330.09 932.80 1,001.98 848.44 651.65 473.84
Computer GWh 794.84 196.90 115.53 107.81 115.71 794.84 210.57 132.47 144.74 180.97
Printer GWh 49.06 27.07 9.71 8.76 8.76 49.06 27.07 9.71 8.76 8.76
White Appliances GWh 15,174.00 18,804 22,506.00 24,471.00 25,620.00 15,174.00 19,536.00 24,421.00 29,494.00 34,322.00
Refrigerator GWh 4,502.23 6,417.36 8,158.81 8,349.69 7,833.91 4,502.23 6,789.04 9,420.41 12,039.59 14,329.09
Washing machine GWh 600.01 827.39 1,141.92 1,387.49 1,549.84 600.01 880.74 1,299.28 1,898.47 2,587.25
Water pump GWh 1,852.12 2,118.68 2,387.09 2,598.74 2,779.83 1,852.12 2,175.33 2,467.94 2,719.44 2,950.99
Thermo pot GWh 1,314.98 1,504.74 1,726.64 1,936.46 2,133.86 1,314.98 1,540.90 1,787.44 2,035.24 2,268.63
Cooking pot GWh 4,771.62 5,389.99 6,001.67 6,516.12 6,982.26 4,771.62 5,513.92 6,188.71 6,796.51 7,350.07
Iron GWh 1,896.17 2,172.48 2,497.42 2,806.73 3,099.18 1,896.17 2,225.30 2,586.64 2,952.36 3,296.24
Vacuum cleaner GWh 28.40 47.48 81.37 126.60 185.22 28.40 52.78 92.51 151.09 225.22
Microwave GWh 208.96 325.38 511.01 749.23 1,055.79 208.96 357.60 578.38 901.73 1,314.10
Heating and Cooling GWh 4,735.00 6,438.00 8,649.00 11,162.00 14,386.00 4,735.00 6,907.00 9,771.00 14,046.00 19,802.00
Electric water heater GWh 561.38 803.08 1,107.21 1,395.06 1,645.70 561.38 867.75 1,263.35 1,773.37 2,352.92
Fan GWh 1,952.26 2,222.15 2,367.31 2,389.39 2,410.41 1,952.26 2,288.22 2,525.46 2,783.66 3,085.18
Air-conditioning GWh 2,220.96 3,413.06 5,174.97 7,377.06 10,329.45 2,220.96 3,751.13 5,982.00 9,488.87 14,363.64
Total GWh 28,072.00 34,335.00 38,773 41,579 45,150 28,072 36,041 43,743 53,511 64,979
BAU = business as usual, EE = energy efficiency, GWh = gigawatt-hour.Source: Viet Nam Low Carbon Options Assessment for Energy sector components, Institute of Energy (2013).
Statistical Annexes

ASIAN DEVELOPMENT BANK
ASIAN DEVELOPMENT BANK6 ADB Avenue, Mandaluyong City1550 Metro Manila, Philippineswww.adb.org
ENERG
Y EFFICIENCY D
EVELOPM
ENTS A
ND
POTEN
TIAL EN
ERGY SAVIN
GS IN
THE G
REATER MEKO
NG
SUBREG
ION
Energy Efficiency Developments and Potential Energy Savings in the Greater Mekong Subregion
This report was produced under the technical assistance project Promoting Renewable Energy, Clean Fuels, and Energy Efficiency in the Greater Mekong Subregion (TA 7679). It reports on energy efficiency targets and developments in five countries in the Greater Mekong Subregion (GMS): Cambodia, the Lao People’s Democratic Republic, Myanmar, Thailand, and Viet Nam. The GMS countries envisage substantial energy efficiency savings over the next 15 to 20 years, with overall energy efficiency savings amounting to almost 60 million tons of oil equivalent annually by 2030. Most GMS governments have established plans for reaching these targets and have implemented policy, regulatory, and program measures to lower energy intensity and achieve energy efficiency. GMS countries project that their energy needs will double or triple over the next 15 years and greater energy efficiency offers a win–win public–private sector partnership for reducing unsustainable reliance on high-carbon (coal and oil) fuels.
About the Asian Development Bank
ADB’s vision is an Asia and Pacific region free of poverty. Its mission is to help its developing member countries reduce poverty and improve the quality of life of their people. Despite the region’s many successes, it remains home to the majority of the world’s poor. ADB is committed to reducing poverty through inclusive economic growth, environmentally sustainable growth, and regional integration.
Based in Manila, ADB is owned by 67 members, including 48 from the region. Its main instruments for helping its developing member countries are policy dialogue, loans, equity investments, guarantees, grants, and technical assistance.
Energy Efficiency Developments and Potential Energy Savings in the Greater Mekong Subregion