Energy Efficiency Benchmark System of Japan
18
Energy Efficiency Benchmark System of Japan March 17, 2021 Masana Ezawa Agency for Natural Resources and Energy Ministry of Economy, Trade and Industry
Transcript of Energy Efficiency Benchmark System of Japan

Energy Efficiency Benchmark System of
Japan
March 17, 2021
Masana Ezawa
Agency for Natural Resources and Energy
Ministry of Economy, Trade and Industry

1
Contents
1. Current Status of Energy Efficiency and Overview of
the Benchmark System
2. Issues with and Revision of the Benchmark System
3. Comparison with EU–ETS

2
Future Potential of Energy Efficiency
According to the IEA, when the whole world becomes carbon-neutral, energy efficiency improvements will have contributed to approx. 15% of the CO2 reduction.
Contribution to the reduction of global energy-related CO2 emissions
*Amount of reduction required to keep the global temperature increase within 2°C till 2100 (becoming carbon-neutral in 2070), on top of the emissions declared by countries as part of their NDCs under the Paris
Agreement.
Source: IEA “Energy Technology Perspectives 2020,” Figure 2.2
(100 million tonnes)
0
-100
-200
-300
-400
CO
2em
issi
ons
redu
ctio
n
■Change in demand
■Energy efficiency
■Electrification
■Hydrogen
■Biomass
■Renewable energy
■Fuel conversion
■CCUS

3
Progress of Energy Efficiency in Japan
Source: Prepared by ANRE based on the Handbook of Energy & Economic Statistics in Japan
(Energy intensity index) (FY1973: 100)
■Energy Intensities per IIP in the Industrial Sector
Japan has achieved one of the highest levels of energy efficiency in the world, but the pace of improvement in energy intensity is now slowing.
In some industries including steel, energy intensity has leveled off.
Further energy efficiency improvement is necessary.

Benchmark System
Steel
22%
Chemical
24%
Ceramics
4%Other33%
Blast furnaces, electric furnaces
Ethylene, soda, etc.
Cement
National public services
Paper, paperboard
Paper & pulp3%
Offices & buildings 5%
Wholesale & retail, department stores, supermarkets 5% Hotels & inns
2%
Leased offices
Pachinko parlors
Universities
Schools2% Amusement centers
1%
70% of the industrial and
commercial sectors covered
Hotels
Department stores
Supermarkets
Shopping centers
Convenience stores
4
To improve energy efficiency in the industrial sectors, Japan introduced the benchmark system in 2009.
The benchmarks for electric furnaces, paper, paperboard, convenience stores, and
leased offices are revised in 2020–2021.

Concept of Benchmark Indicators and Targets
Principles for the benchmark performance indicator
The indicator must:
1. Be able to cover wide scope of the energy consumed (Ex. Up-stream & Down-stream)
2. Be quantitatively measurable
3. Accurately represent the status of energy efficiency(impacts of factors other than energy efficiency must be removed as much as possiblee.g.: difference in boundaries and product types, use of renewables and waste heat, etc.)
4. Be simple and easy to understand
Concept of benchmark target levels
Benchmark target levels must:
1. Represent a “Best Available Technology”
2. Be the top 10–20% level based on the distribution of domestic companies
3. Be internationally high level (comparing with EU-ETS)
5
6
Present Target year(FY2030)
Benchmark
Target valueA level achieved by the top 10–20%of all businesses
Impro
vem
ent →
FY2020 discussion:• The benchmark indicators
should be revised to increase validity (ex. large deviation).
• The benchmark system should be checked from an international target level.
■Overview of the benchmark system revision
A benchmark target is considered for revision if a majority of companies have achieved it.
The benchmark system sets FY2030 as the target year but the target level might be revised when a majority of companies have achieved the target.
In 2020, benchmark indicators were revised considering the issues in each industry.
Reference: Idea behind the Revision of the Benchmark System

7
The benchmark system enables:
– The government to conduct inspections to businesses whose energy efficiency efforts are insufficient.
– Energy efficiency subsidies are available when a benchmark target is achieved.
Japan’s benchmark system, combining regulations and incentives, is comparable to those of international energy efficiency and CO2 reduction systems.
Regulatory measures(Energy Efficiency Act)
Incentives
Inspection Instructions & Advice Disclosure Orders Fines
Published in the government web site as the excellent companies
Energy efficiency subsidies
Improving Energy Efficiency Using the Benchmark System
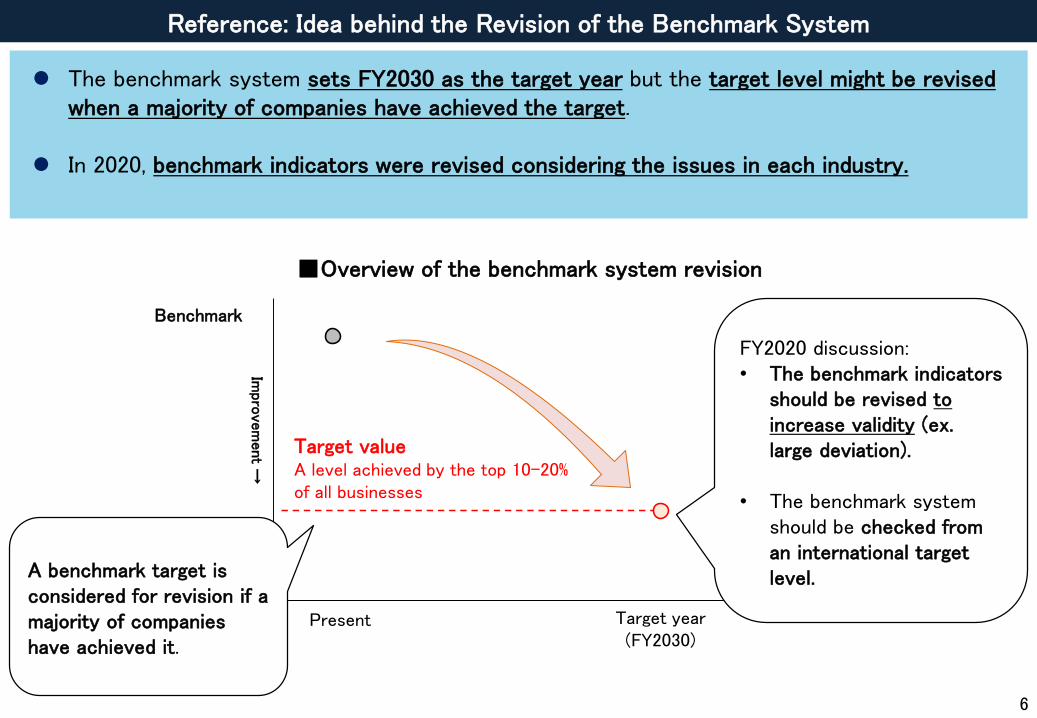
Benchmark system
Cat. Sector Benchmark performance indicator (summary) Benchmark target Introduced in:Number of companies that achieved the BM (FY2019
report)
1ASteel manuf., blast furnace
Energy consumption per unit of crude steel 0.531 kl/t or less FY20090 / 4(0.0%)
1BElectric furnace (ordinary steel)
Sum of energy intensity for upstream (energy consumption per unit of crude steel) and downstream (energy consumption per unit of steel rolled)
0.143 kl/t or less FY20095/31
(16.1%)
1CElectric furnace (special steel)
Sum of energy intensity for upstream (energy consumption per unit of crude steel) and downstream (energy consumption per unit of shipment)
0.36 kl/t or less FY20095/16
(31.3%)
2 Electricity supplierThermal power plant efficiency benchmark AThermal power plant efficiency benchmark B
BM A: 1.00 or moreBM B: 44.3% or more
FY200936/85(42.4%)
*Both A & B achieved
3Cement manufacturing
Sum of energy consumption per unit output (shipment) in the raw material, incineration, finishing, and shipment processes
3,739 MJ/t or less FY20095/16
(31.3%)
4A Paper manufacturingEnergy consumption in the paper manufacturing process per unit of paper produced
6,626 MJ/t or less FY20103/18
(16.7%)
4BPaperboard manufacturing
Energy consumption in the paperboard manufacturing process per unit of paperboard produced
4,944 MJ/t or less FY20107/32
(21.9%)
5 Oil refiningEnergy consumption per standard energy consumption for the oil refining process (sum of the oil throughput of each device in the relevant process multiplied by factors deemed appropriate)
0.876 or less FY20103/8
(37.5%)
6APetrochemical product manufacturing
Energy consumption of an ethylene production facility per unit ethylene output
11.9 GJ/t or less FY20104/9
(44.4%)
6B Soda industrySum of energy consumption per unit weight of caustic soda from the electrolytic bath in the electrolysis process and the heat from steam used per unit weight of caustic soda in the concentration process
3.22 GJ/t or less FY20108/22
(36.4%)
8*Blue font: achievement rate of 40% or more
Reference: Status of Achievement of the Benchmarks (1)
In 2021, Government of Japan revised 1B, 1C, 4A, 4B, 7, and 12

Cat. Sector Benchmark performance indicator (summary)Benchmark
targetIntroduced in:
Number of companies that achieved the BM
(FY2019 report)
7Convenience store business
The total electricity consumption by the relevant store divided by its total sales845 kWh/million
yen or lessFY2016
9/19(47.4%)
8 Hotel businessThe energy consumption of the relevant hotel divided by the average energy consumption of a hotel similar in size, services, and operational conditions
0.723 or less FY201741/231(17.7%)
9Department store business
The energy consumption of the relevant department store divided by the average energy consumption of a department store similar in size and sales
0.792 or less FY201722/81(27.2%)
10FoodsSupermarket business
The energy consumption of the relevant store divided by the average energy consumption of a store similar in size, operational conditions, and facility conditions
0.799 or less FY201859/288(20.5%)
11Shopping center business
The energy consumption of the relevant facility divided by its total floor area0.0305 kl/m2 or
lessFY2018
13/113(11.5%)
12Office lease business
The energy efficiency improvement potential of the relevant office calculated by a special tool for estimating energy efficiency potential
15% or less FY201835/216(16.2%)
13 Universities
The weighted average of the energy consumption of each campus obtained by dividing the energy used for the relevant business at the relevant campus by the sum of ① and ②① the area used by humanities and other faculties multiplied by 0.022② the area used by science and medical faculties multiplied by 0.047
0.555 or less FY2019 -
14Pachinko parlor business
The weighted average of the energy consumption of each store obtained by dividing the energy consumption of the relevant store by the sum of ① through ③① the total floor space multiplied by 0.061② the number of pachinko machines multiplied by 1/1000 of the total operating hours of the store and
then by 0.061③ the number of slot machines multiplied by 1/1000 of the total operating hours of the store and then by
0.076
0.695 or less FY2019 -
15National public services
The weighted average of the energy consumption of each office obtained by dividing the energy consumed for relevant services at the relevant office by the sum of ① and ②① the floor area multiplied by 0.023② the number of workers multiplied by 0.191
0.700 or less FY2019 -
9
Reference: Status of Achievement of the Benchmarks (2)
10
1. Current Status of Energy Efficiency and Overview of
the Benchmark System
2. Issues with and Revision of the Benchmark System
3. Comparison with EU–ETS

11
For ordinary steel production with electric furnaces, production processes vary by products, and energy intensities vary as a result.
Issues with the Benchmark (electric furnaces for ordinary steel)
Melting
Out-of-furnace refining
Ferrous scrap
Continuous casting
Heating
Upst
ream
pro
cess
Dow
nst
ream
pro
cess
Rolling A
The processes differ by products, and energy intensities vary as a result.
Not conducted
Rolling BRolling
C ・・・
Cooling, straightening
Products
・・・ Various products

The differences in production process between products result in gaps in energy intensity due to factors other than energy efficiency efforts.
Status of Achievement of the Benchmarks by Electric Furnace Steel-makers
(Electric furnace for ordinary steel) (Electric furnace for special steel)
■Distribution of performance in view of the benchmarks
Approx. 0.23 kl/tApprox. 1.50 kl/t
About 7 times
Approx. 0.20kl/t
Benchm
ark
indic
ator
(kl/
t)
Benchm
ark
indic
ator
(kl/
t)
12
Approx. 0.140kl/t
Benchmark goal: 0.143 kl/t
Low ← → HighEnergy
consumptionLow ← Energy
consumption
Benchmark goal: 0.360 kl/t
→ High
About 2 times

To prevent the worsening of energy intensity due to factors unrelated to energy efficiency efforts, such as various product line-up, and to correctly evaluate such efforts of companies, the benchmark indicators were revised as follows.
Electric furnaces for ordinary steel
Considering the differences in production processes, the formula for benchmark performance indicator was revised.
Electric furnaces for special steel
The additional energy consumption processes that only some products go through were removed or adjusted.
Formula for companies’ benchmark
performance indicators (kl/t)
Crude steel (t)
Energy consumption (kl) Energy consumption (kl)
Steel rolled, shipment (t)
Upstream Downstream
= ← revision revision←
Revision of Benchmarks for Electric Furnace Steel Industry
13

14
For revising the benchmark, surveys were sent to the manufacturing companies of the benchmark system and necessary information was collected.
① Survey
② Analysis
③ Discussion
・A survey was distributed to target companies regarding the output and energy consumption of each type of product etc.Electric furnace, ordinary steel: 32 companies (28 valid respondents)Electric furnace, special steel : 16 companies (13 valid respondents)
・Based on the survey, the energy intensity per product and energy consumption per process were analyzed.・Interviews were conducted to collect additional information.
・The expert working group decided on the proposed revisions to the benchmarks.・A decision was made to apply the new benchmarks starting with the energy consumption report for 2021.
Reference: Steps for Revision of the Benchmark Design for Electric Furnace Steel-making Sector

15
1. Current Status of Energy Efficiency and Overview of
the Benchmark System
2. Issues with and Revision of the Benchmark System
3. Comparison with EU–ETS

16
Compared to the product benchmarking for electric furnace steel-making under EU-ETS, the Japan’s benchmarks cover a wider scope, applying to both the upstream and downstream processes. Meanwhile, the gaps between companies are wider.
EU
-ETS
Comparison with EU-ETS (1)
Upstre
amD
ow
nstre
am
Refining
Electric furnaceLarge
Ferrous scrap ferroalloys
Continuous casting
Remelting
Meltin
g
Cold working
Electric furnaceSmall
Freeforging
Powder processing
Heat treat Rolling
・・・
Melting
Out-of-furnace refining
Ferrous scrap
Continuous casting
Heating
Rolling A
Not conducted
Rolling BRolling
C ・・・
Cooling,Straightening
Product
・・・
Jap
an’s B
enchm
ark system
17
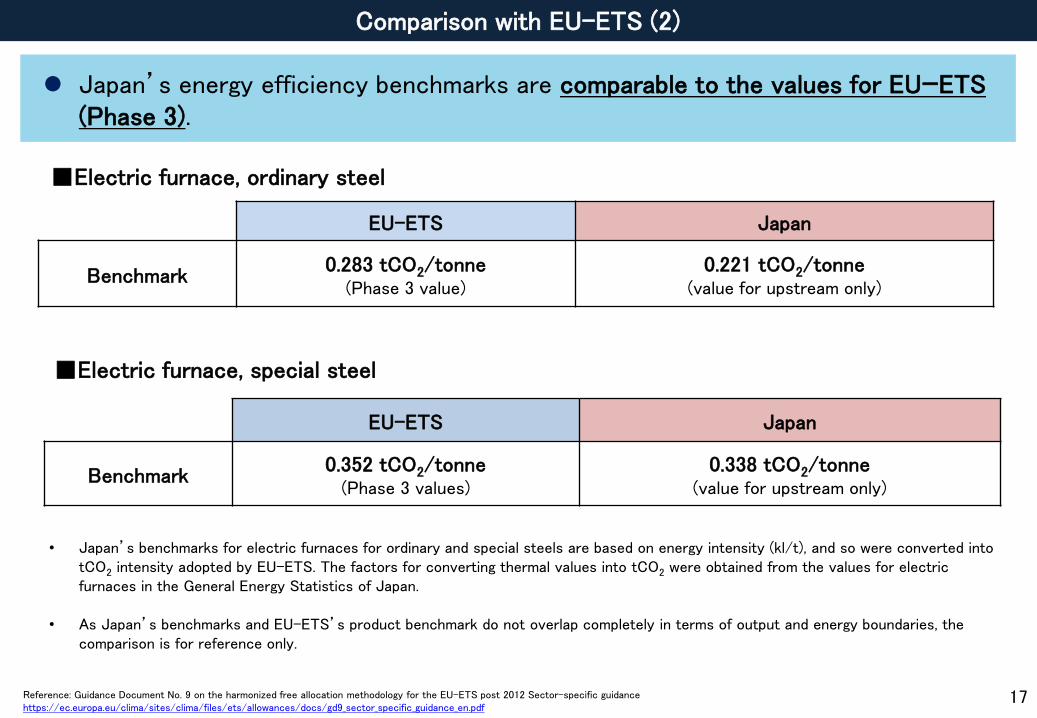
Japan’s energy efficiency benchmarks are comparable to the values for EUーETS (Phase 3).
Comparison with EU-ETS (2)
Reference: Guidance Document No. 9 on the harmonized free allocation methodology for the EU-ETS post 2012 Sector-specific guidancehttps://ec.europa.eu/clima/sites/clima/files/ets/allowances/docs/gd9_sector_specific_guidance_en.pdf
EU-ETS Japan
Benchmark0.352 tCO2/tonne
(Phase 3 values)0.338 tCO2/tonne
(value for upstream only)
• Japan’s benchmarks for electric furnaces for ordinary and special steels are based on energy intensity (kl/t), and so were converted into tCO2 intensity adopted by EU-ETS. The factors for converting thermal values into tCO2 were obtained from the values for electric furnaces in the General Energy Statistics of Japan.
• As Japan’s benchmarks and EU-ETS’s product benchmark do not overlap completely in terms of output and energy boundaries, the comparison is for reference only.
■Electric furnace, ordinary steel
EU-ETS Japan
Benchmark0.283 tCO2/tonne
(Phase 3 value)0.221 tCO2/tonne
(value for upstream only)
■Electric furnace, special steel