MobileMonday Austria - Microsofts environmental sustainability perspective
Upload
acxCategory
view
268download
24description
Energy efficiency and sustainability
Safaricom perspective
Who are we?
•A Kenyan firm with a majority Kenyan shareholding
•Provider of converged communication solutions – voice, data, SMS,
telepresence, cloud computing
•Financial inclusion
•Public Sector Support
•Driven to innovate for social development
•Driven to provide solutions for Kenyans in all realms of their lives
•Transforming lives

Energy efficiency
Why it is important to Safaricom
Reduce NOPEX.
Optimize CAPEX
Reduce Carbon Foot Print
Reduce noise and other
pollutions
Comply with regulations
Corporate responsibility
Energy security

Parts(Aircon & Genset),
3%
PM Costs, 14%
Generator Overhaul, 2%
Generator Service, 2%
Diesel(24/7 sites & Offgrid),
10%
Diesel(KPLC sites), 29%
KPLC Electricity,
33%
Security, 7%
Feb 2013 Cost Spread
10.0%
83.8%
2.8%
2.1%
0.1% 0.6%
0.2%
0.5%
Sites Power Status
KPLC No Genset
KPLC Sites
24/7 GENSET
Solar Wind
Power Cubes
Enhanced
Mini Enhancer
Diet sites
Our current energy situation
Electricity currently the highest spend on NOPEX at 43% with diesel contributing to 31%Target is to reduce diesel cost on the KPLC sites and the 24/7 genset sites 82% of the sites on KPLC, 3% of 24/7 Genset, 4% on Hybrid power and 11% sites without gensets
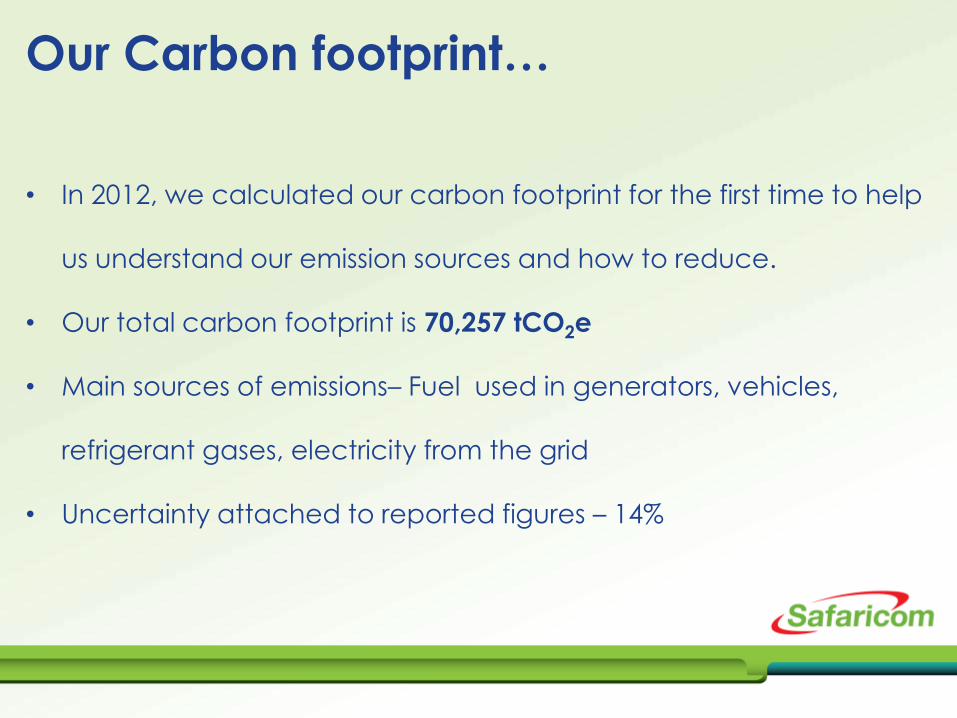
Our Carbon footprint…
• In 2012, we calculated our carbon footprint for the first time to help
us understand our emission sources and how to reduce.
• Our total carbon footprint is 70,257 tCO2e
• Main sources of emissions– Fuel used in generators, vehicles,
refrigerant gases, electricity from the grid
• Uncertainty attached to reported figures – 14%
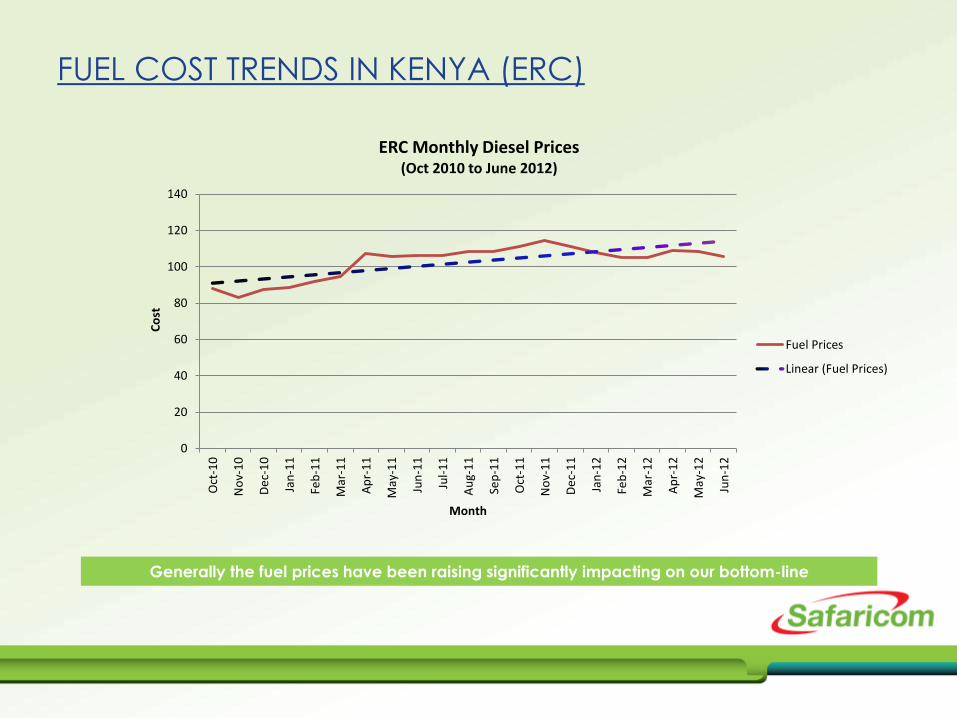
FUEL COST TRENDS IN KENYA (ERC)
0
20
40
60
80
100
120
140
Oct
-10
No
v-1
0
De
c-1
0
Jan
-11
Feb
-11
Mar
-11
Ap
r-1
1
May
-11
Jun
-11
Jul-
11
Au
g-1
1
Sep
-11
Oct
-11
No
v-1
1
De
c-1
1
Jan
-12
Feb
-12
Mar
-12
Ap
r-1
2
May
-12
Jun
-12
Co
st
Month
ERC Monthly Diesel Prices (Oct 2010 to June 2012)
Fuel Prices
Linear (Fuel Prices)
Generally the fuel prices have been raising significantly impacting on our bottom-line
Energy sustainability roadmap
Intensive staff training
In-depth analyses of our energy baseline
Thorough study of available solutions
Preparation of target infrastructure for energy efficiency,
development of articulate specifications
receiving proposals, technical analyses and commercial
appraisals.
Budgeting, project planning implementation and monitoring
LED lighting in all major facilities with automated control

Our current energy projects Aggressive grid connection
Solar installation
LV APS
The power cube
Free cooling
Network Modernization program
Deep cycle batteries, Durathon batteries, High temperature
batteries
Smart controllers
7.77.2
6.0
4.1
2.5
3.93.5
4.2
2.7
1.61.1 1.0
0.60.0
1.0
2.0
3.0
4.0
5.0
6.0
7.0
8.0
9.0
Avg
. Ge
n H
ou
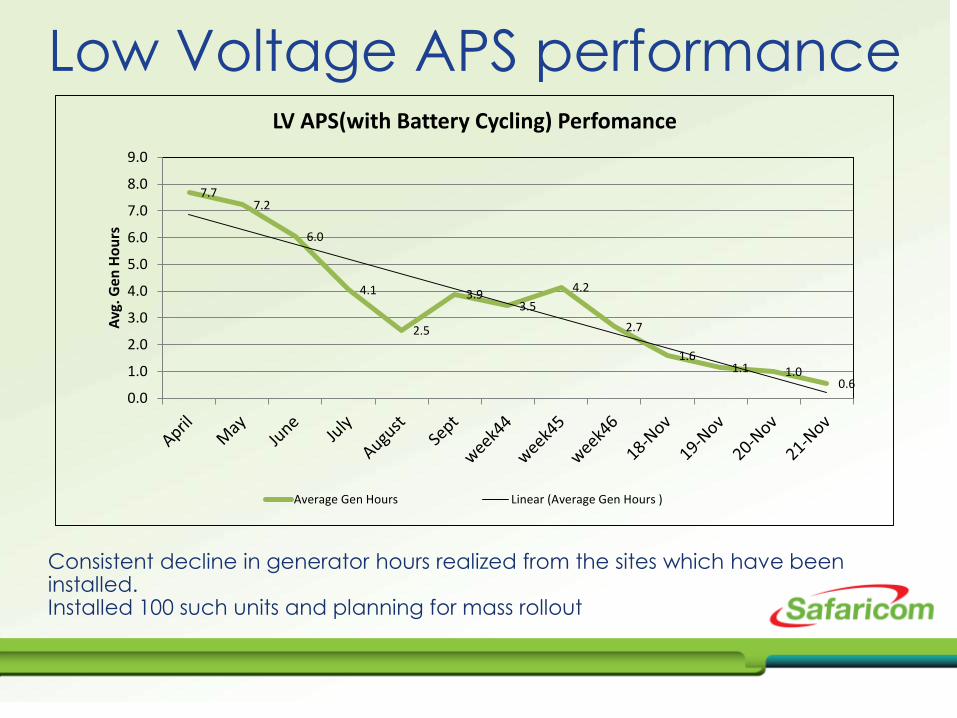
rsLV APS(with Battery Cycling) Perfomance
Average Gen Hours Linear (Average Gen Hours )
Low Voltage APS performance
Consistent decline in generator hours realized from the sites which have been installed.Installed 100 such units and planning for mass rollout
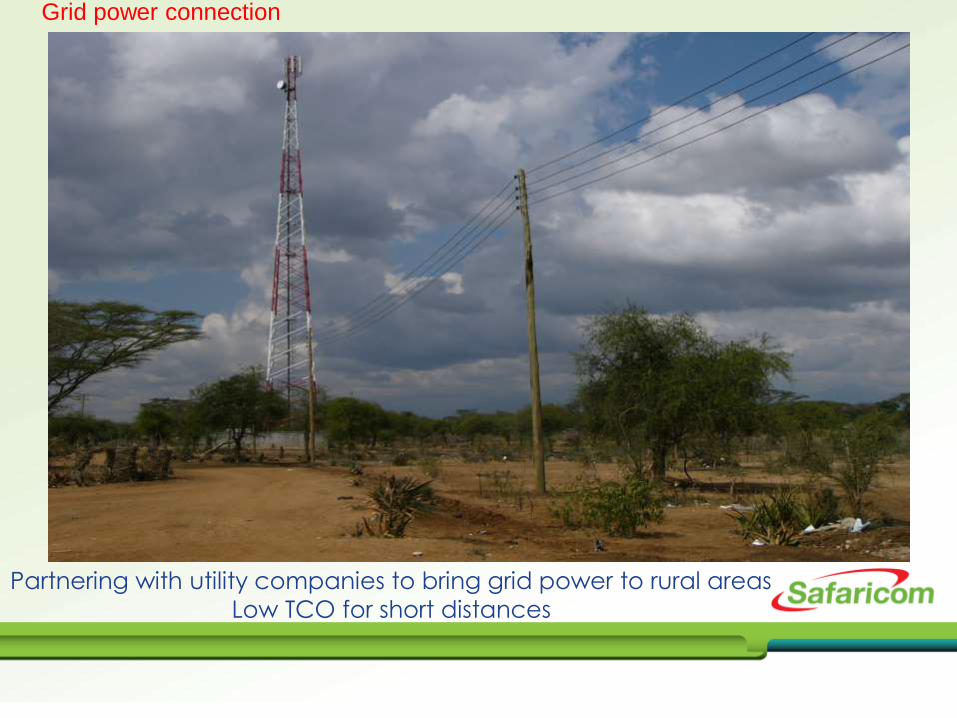
Grid power connection
Partnering with utility companies to bring grid power to rural areas
Low TCO for short distances
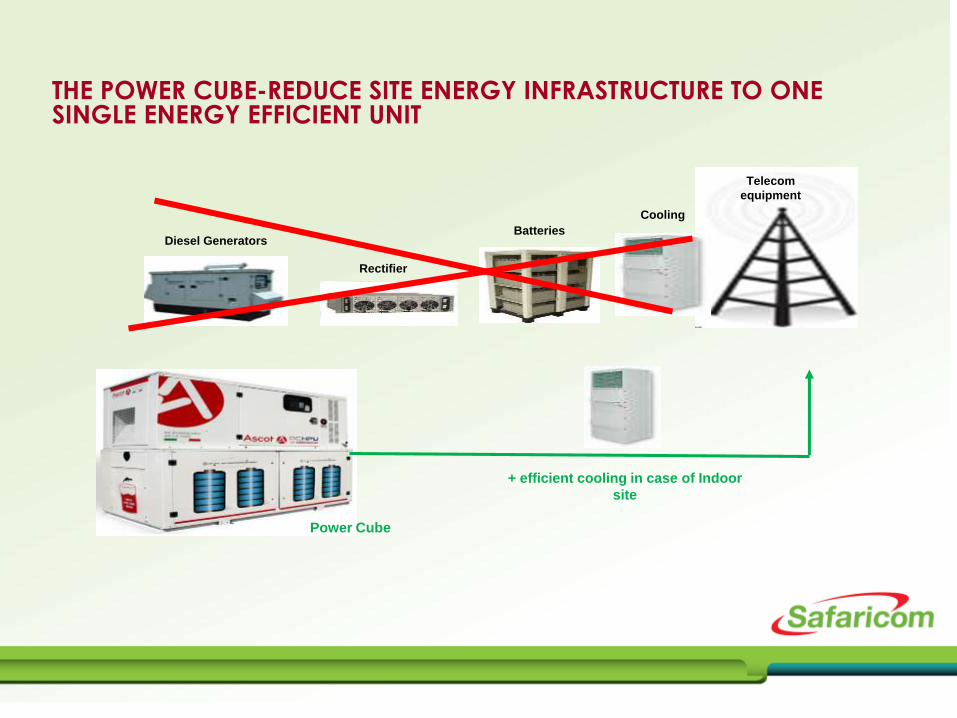
THE POWER CUBE-REDUCE SITE ENERGY INFRASTRUCTURE TO ONE SINGLE ENERGY EFFICIENT UNIT
Diesel Generators
Rectifier
Batteries
Telecom
equipment
Cooling
+ efficient cooling in case of Indoor
site
Power Cube
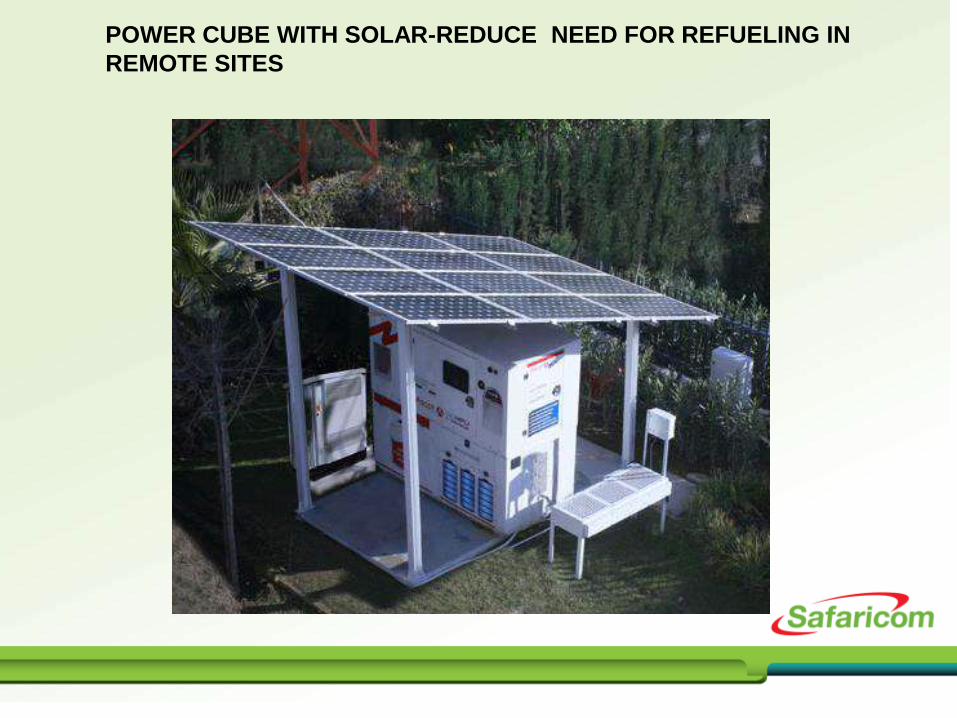
POWER CUBE WITH SOLAR-REDUCE NEED FOR REFUELING IN
REMOTE SITES

TCO-Power cube
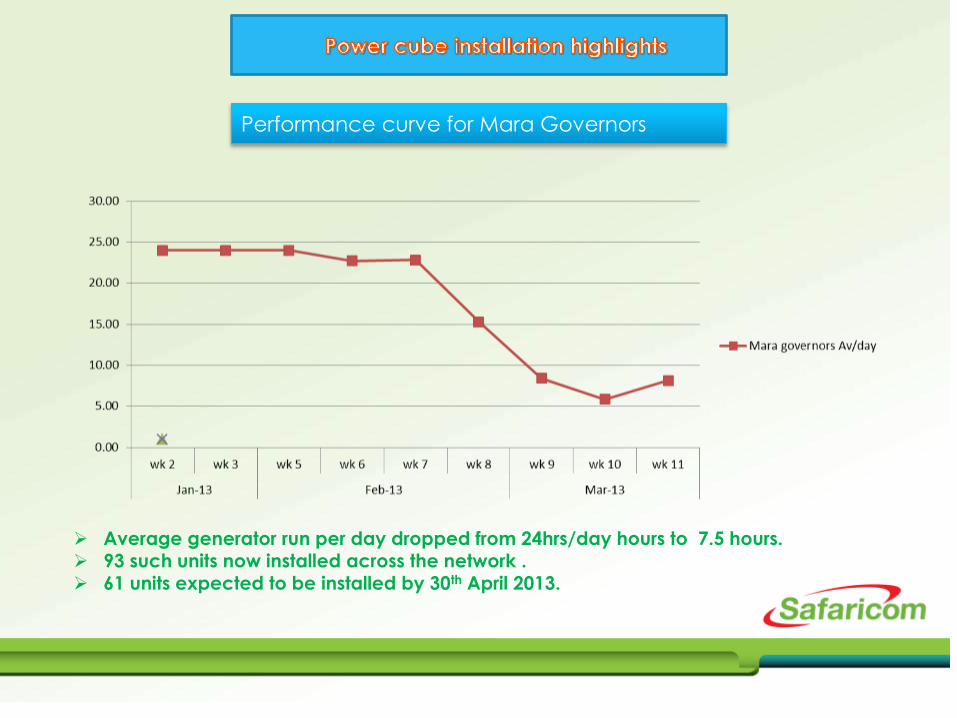
Performance curve for Mara Governors
Average generator run per day dropped from 24hrs/day hours to 7.5 hours. 93 such units now installed across the network . 61 units expected to be installed by 30th April 2013.

Free cooling allows circulation of outside cooler air into the BTS reducing use of active cooling

TCO-Free cooling
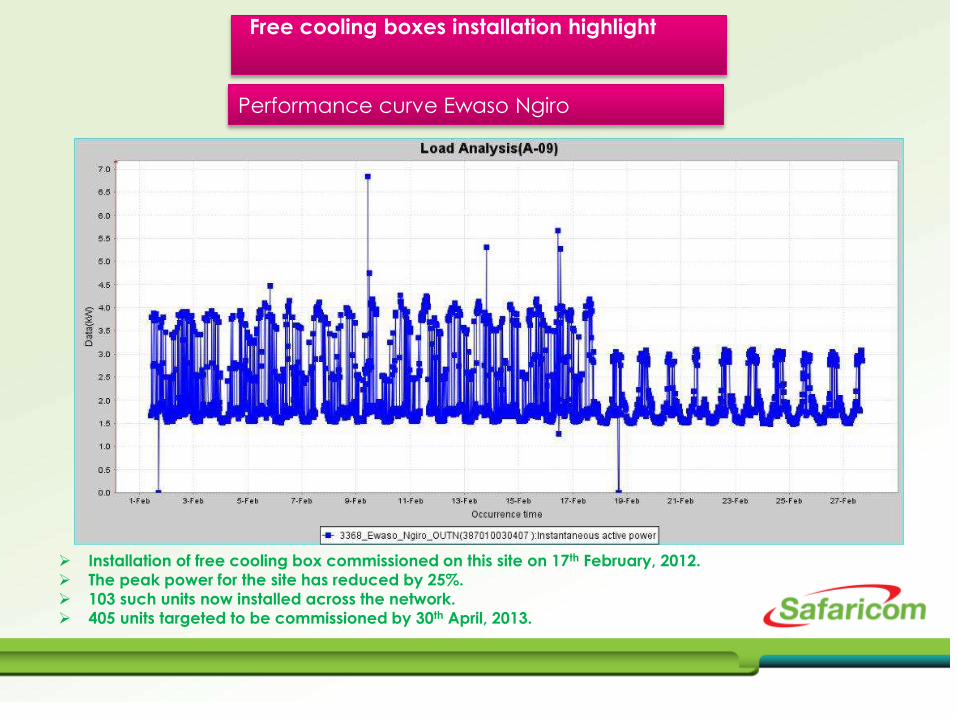
Free cooling boxes installation highlight
Performance curve Ewaso Ngiro
Installation of free cooling box commissioned on this site on 17th February, 2012.
The peak power for the site has reduced by 25%.
103 such units now installed across the network.
405 units targeted to be commissioned by 30th April, 2013.

Green Base Station
Kalongot_Site_3139 Takabba_1278
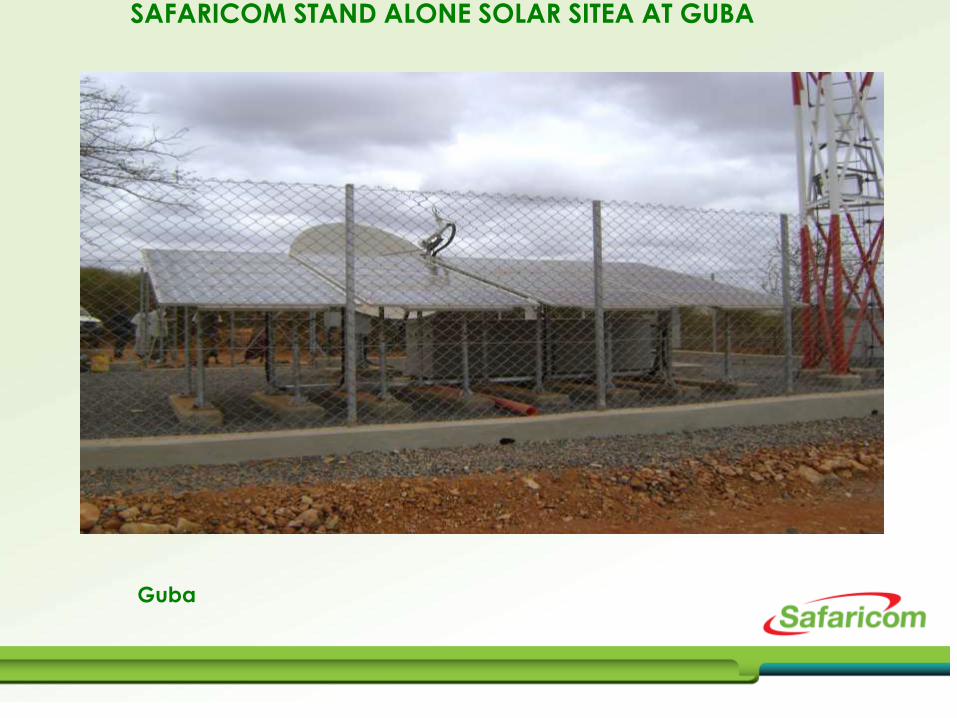
SAFARICOM STAND ALONE SOLAR SITEA AT GUBA
Guba
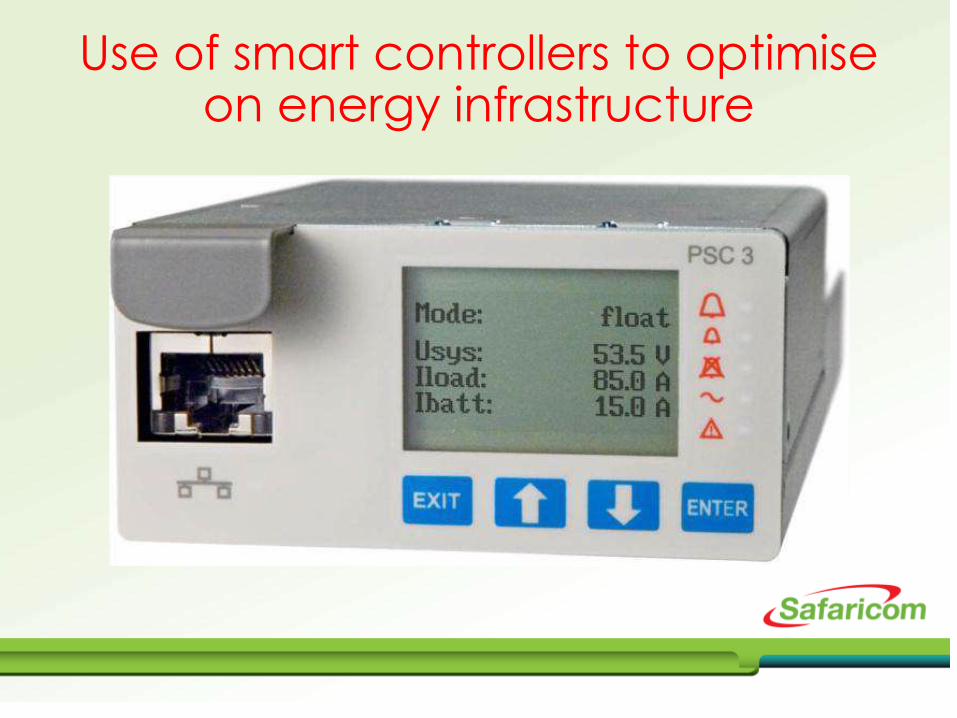
Use of smart controllers to optimise on energy infrastructure
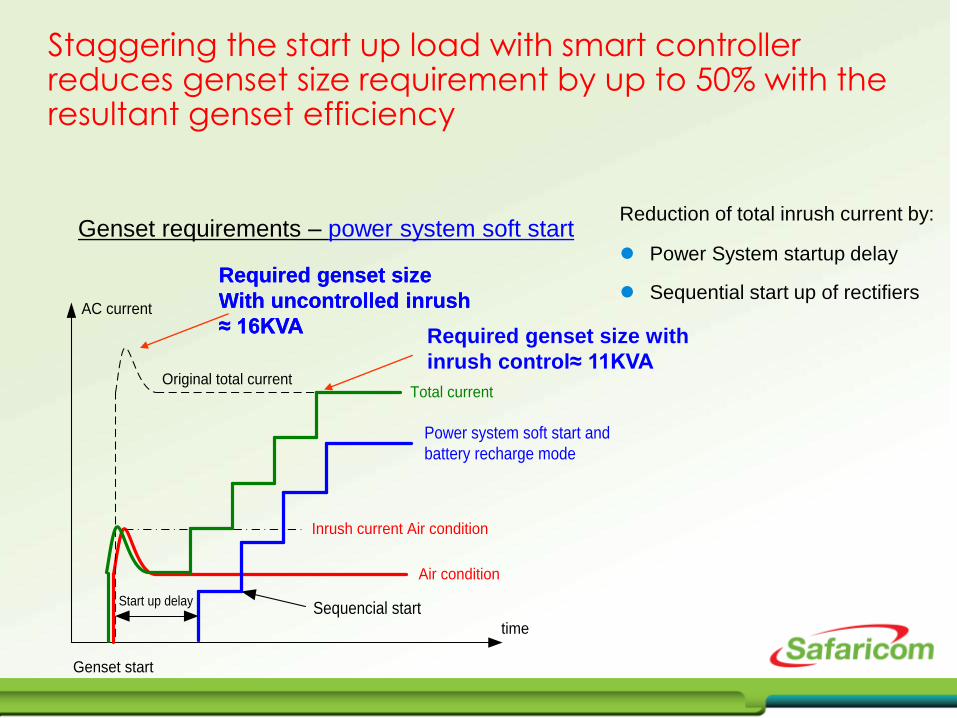
Staggering the start up load with smart controller reduces genset size requirement by up to 50% with the resultant genset efficiency
Genset requirements – power system soft start
Required genset size
With uncontrolled inrush
≈ 16KVAAC current
time
Genset start
Air condition
Inrush current Air condition
Required genset size with
inrush control≈ 11KVA
Required genset size
With uncontrolled inrush
≈ 16KVA
Original total current
Power system soft start and
battery recharge mode
Start up delaySequencial start
Reduction of total inrush current by:
Power System startup delay
Sequential start up of rectifiers
Total current

Reliable, Green Cell Sites
Safaricom innovates with advanced energy storage technology from GE

Result … less downtime + reduced carbon footprint!
Pre-Durathon Durathon Roll-Out Durathon Powered
Min
ute
s o
f Site
Do
wn
tim
e
75+%
Reduction
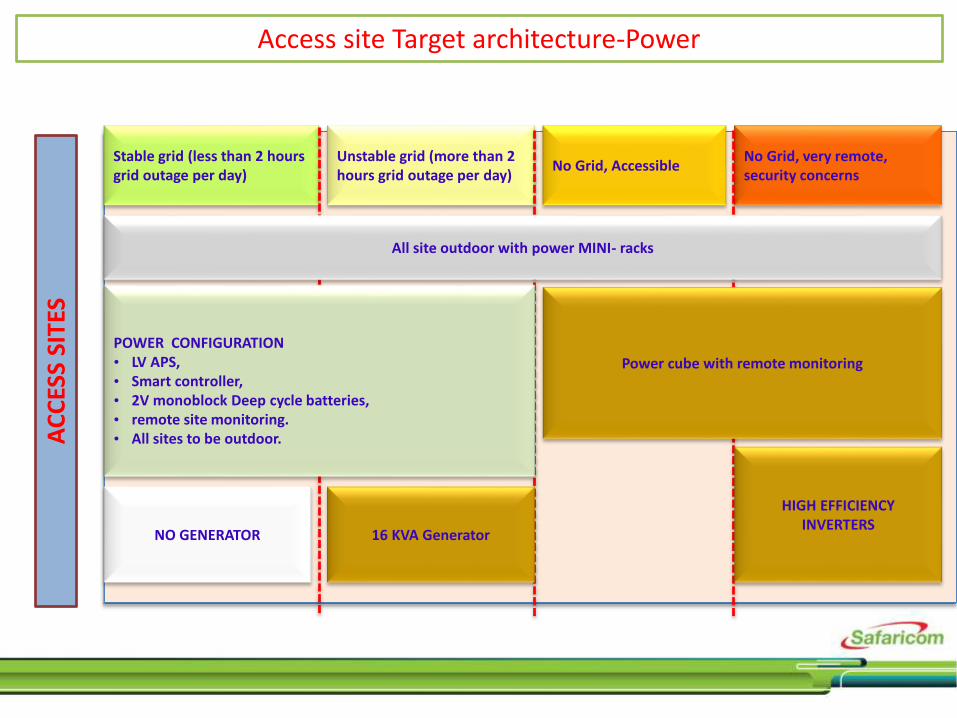
Access site Target architecture-PowerA
CC
ESS
SITE
S
Stable grid (less than 2 hours grid outage per day)
Unstable grid (more than 2 hours grid outage per day)
No Grid, AccessibleNo Grid, very remote, security concerns
All site outdoor with power MINI- racks
HIGH EFFICIENCY INVERTERS
POWER CONFIGURATION• LV APS, • Smart controller, • 2V monoblock Deep cycle batteries, • remote site monitoring. • All sites to be outdoor.
Power cube with remote monitoring
16 KVA GeneratorNO GENERATOR

Community Power Projects - Objectives
• Poor local community, cannot afford
cost of power.
• Request from the community.
•Request from donors engaged with the
community in other development projects.
• Rapid expansion of Mobile Money MPESA
services to the rural areas.
• Optimum network utilization and
improved Rate of Return (no sleeping cells)
for lack of subscriber activity.
Thank You