Energy Drinks!. By: Michael Williams, Erica Lee, Erica Kim, and Davis Song.
28
Energy Energy Drinks! Drinks!
-
Upload
aldous-greene -
Category
Documents
-
view
230 -
download
3
Transcript of Energy Drinks!. By: Michael Williams, Erica Lee, Erica Kim, and Davis Song.

Energy Energy Drinks!Drinks!

By: Michael Williams, Erica Lee, By: Michael Williams, Erica Lee, Erica Kim, and Davis SongErica Kim, and Davis Song

Goal or PurposeGoal or Purpose
Our goal is to see if there is a Our goal is to see if there is a correlation between the sex of correlation between the sex of
Castro Valley High School seniors Castro Valley High School seniors
and whether they like energy and whether they like energy
drinks or not.drinks or not.

Experimental DesignExperimental Design
-Experiment to provide evidence if there’s a -Experiment to provide evidence if there’s a difference in proportions between senior difference in proportions between senior boys and girls who prefer energy driboys and girls who prefer energy drinksnks
-Past experience- -Past experience-
-Older students prefer energy drinks -Older students prefer energy drinks than than younger studentsyounger students
-Male students prefer energy drinks -Male students prefer energy drinks more more than female studentsthan female students

ProcessProcess
- Created a poll and - Created a poll and distributed it randomly distributed it randomly to all seniors in the to all seniors in the classes we visitedclasses we visited
- Polled only seniors at Polled only seniors at CVHS in 7CVHS in 7thth period period
- Ensured that no Ensured that no student was polled student was polled twicetwice

FORMFORM
Gender (circle one) Male FemaleGender (circle one) Male Female
Preferred Beverage (circle one)Preferred Beverage (circle one)
CoffeeCoffee JuiceJuice
Energy DrinkEnergy Drink SodaSoda
WaterWater TeaTea

Process Continued…Process Continued…
-To determine whether the subjects -To determine whether the subjects preferred energy drinks we listed “energy preferred energy drinks we listed “energy drinks” among other beverages rather than drinks” among other beverages rather than asking if they like energy drinks or notasking if they like energy drinks or not
-7-7thth period classes- example: Government period classes- example: Government and Economics classes to ensure mostly and Economics classes to ensure mostly seniorsseniors
-If juniors were present, they did not receive -If juniors were present, they did not receive a forma form

Process Continued…Process Continued…
-Most students filled out forms correctly-Most students filled out forms correctly
-Collected 117 forms-Collected 117 forms
-1 filled out incorrectly-1 filled out incorrectly
-2 wrote their own drinks (“tea” and -2 wrote their own drinks (“tea” and “milk”) because 1“milk”) because 1stst preferred not preferred not presentpresent

Errors in ProcessErrors in Process
-We had to randomly select 55 -We had to randomly select 55 forms out of our 117, because our forms out of our 117, because our population was too small and our population was too small and our sample size was too big.sample size was too big.
-To do so, we used the random -To do so, we used the random numbers chartnumbers chart
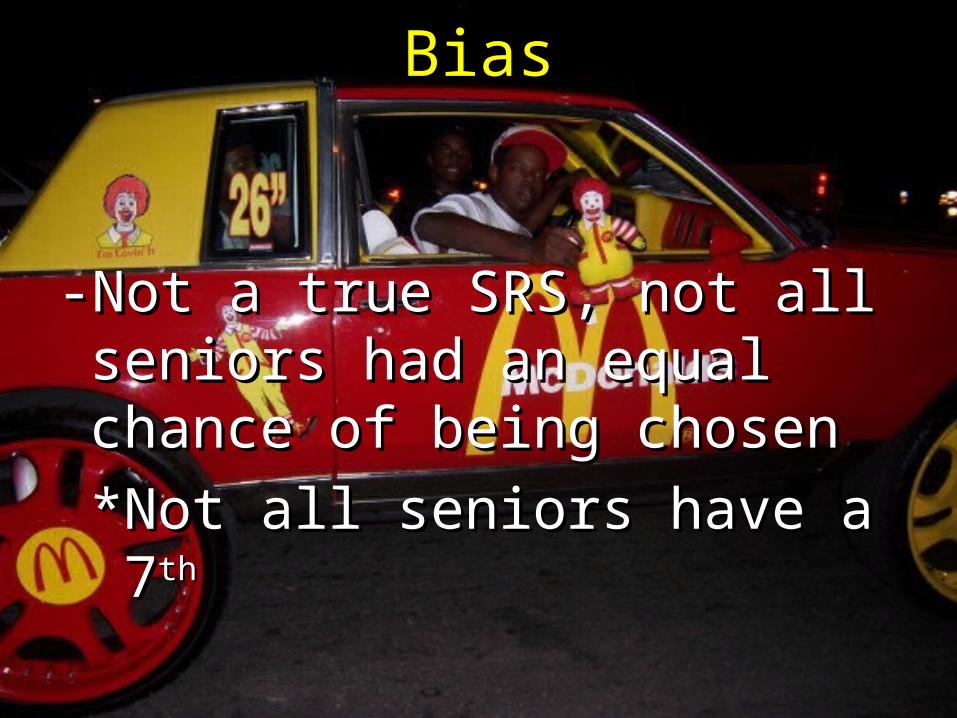
BiasBias
-Not a true SRS, not all seniors -Not a true SRS, not all seniors had an equal chance of being had an equal chance of being chosenchosen
*Not all seniors have a 7*Not all seniors have a 7thth

DataData
MaleMale FemaleFemale
CoffeeCoffee 11 44
Energy DrinkEnergy Drink 1212 55
WaterWater 55 88
JuiceJuice 44 66
SodaSoda 44 22
TeaTea 00 11
MilkMilk 11 00
TotalTotal 2727 2828
Proportion of Seniors Who prefer Energy
Drink:
Male= .4444
Female= .1786

Male seniors at CVHS who prefer EnergyDrinks
4%
43%
19%
15%
15%
0%
4%
Coffee
Energy drink
Water
Juice
Soda
Tea
Milk

Female seniors at CVHS who prefer EnergyDrinks
14%
12%
29%
35%
8%
2% 0%
Coffee
Energy drink
Water
Juice
Soda
Tea
Milk

0
2
4
6
8
10
12
MALE FEMALE
Proportion of Male and Female Seniors at CVHS's drink preferences
Coffee
Energy drink
Water
Juice
Soda
Tea
Milk

Comparison of Male vs Female seniors at CVHS who prefer energy drinks
MALE, 12
FEMALE, 5
0
2
4
6
8
10
12
14
Energy drink
MALE
FEMALE

2-Prop Z Test2-Prop Z Test
HH00: p: p1 1 = p= p2 2 where p1 = proportion of where p1 = proportion of
male seniors at Castro Valley High male seniors at Castro Valley High who prefer energy drinkswho prefer energy drinks
HHAA: p: p1 1 > p> p2 2 and p2 = proportion of and p2 = proportion of
female seniors at Castro Valley High female seniors at Castro Valley High who prefer energy drinkswho prefer energy drinks
zztesttest=-2.5036, p-value=.0123=-2.5036, p-value=.0123
Reject HReject H00 if p-value < α if p-value < α

Calculations for percentagesCalculations for percentages
1
2
ˆ 12 / 27 .4444
ˆ 5 / 28 .1786
ˆ (12 5) /(27 28) .309
p
p
pooled p
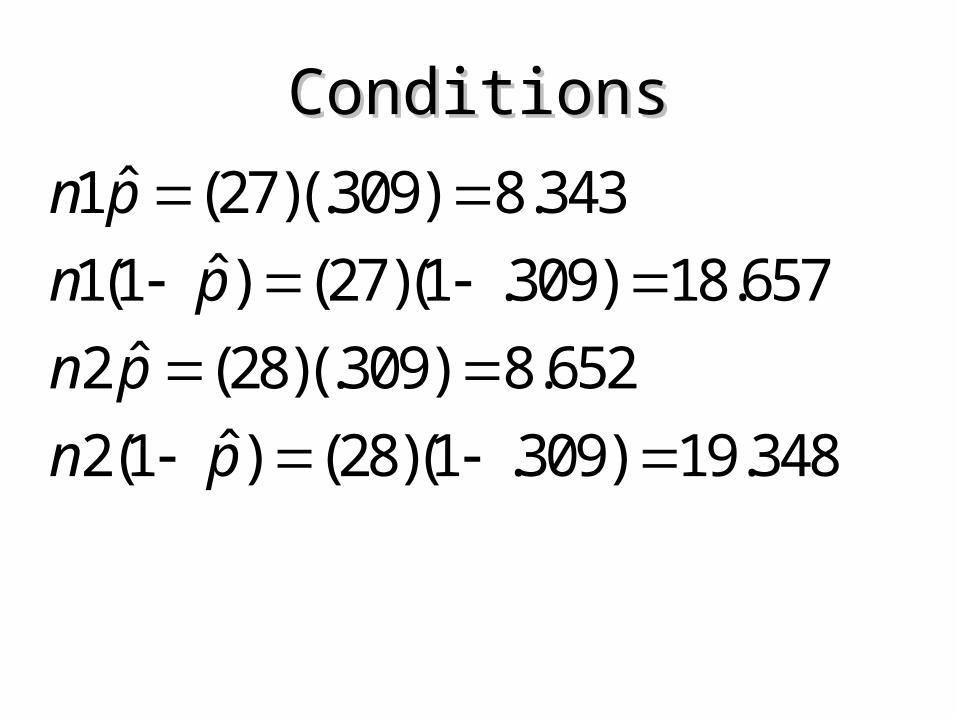
ConditionsConditions
ˆ1 (27)(.309) 8.343
ˆ1(1 ) (27)(1 .309) 18.657
ˆ2 (28)(.309) 8.652
ˆ2(1 ) (28)(1 .309) 19.348
n p
n p
n p
n p
All are 5 or larger, we are safe using a 2-sample z-procedure

ConditionsConditions
-The population is at least 10 -The population is at least 10 times as large as the sample. times as large as the sample.
Castro Valley’s senior population Castro Valley’s senior population is 554, and our sample size is is 554, and our sample size is
55.55.(55)(10)=550 (55)(10)=550
554 > 550 seniors at CVHS554 > 550 seniors at CVHS

Z-test statisticZ-test statistic
1 2 1 2ˆ ˆ ˆ ˆ( ) / (1 )((1/ ) (1/ ))
(.4444 .1786) / .309(1 .309)((1/ 27) (1/ 28)) 2.133
2.133
.01646
z p p p p n n
z
z
p

AnalysisAnalysis
We reject HWe reject H0 0 at the 5% level at the 5% level (p=.01646). (p=.01646).
If we do in fact reject HIf we do in fact reject H0 0 ,then ,then the proportion of male seniors the proportion of male seniors at CVHS prefer energy drinks at CVHS prefer energy drinks over the proportion of female over the proportion of female seniors at CVHS.seniors at CVHS.

2-prop Z Int.Conditions2-prop Z Int.Conditions
23)1786.1)(28()2ˆ1(2
0008.5)1786)(.28(2ˆ2
15)4444.1)(27()1ˆ1(1
12)4444)(.27(1ˆ1
pn
pn
pn
pn
All are 5 or larger, therefore we are safe using a 2-proportion z interval.

95% Confidence Interval95% Confidence Interval
))28/()1786.1)(1786((.))27/()4444.1)(4444((.96.1)1786.4444(.
Confidence interval: (.0308,.5009)

AnalysisAnalysis We are 95% confident that the true We are 95% confident that the true
mean proportion(Proportion of males mean proportion(Proportion of males who prefer energy drinks- Proportion who prefer energy drinks- Proportion of females who prefer energy drinks) of females who prefer energy drinks) is between .0308 and .5009.is between .0308 and .5009.

ConclusionConclusion
Our experiment to decide whether or Our experiment to decide whether or not male seniors at CVHS prefer not male seniors at CVHS prefer energy drinks more than female energy drinks more than female seniors at CVHS seemed to confirm seniors at CVHS seemed to confirm that a larger proportion or male that a larger proportion or male seniors prefer energy drinks than seniors prefer energy drinks than female seniorsfemale seniors

Conclusion Significance TestConclusion Significance Test
Significant at 5% levelSignificant at 5% levelRejected hypothesis that the two Rejected hypothesis that the two
proportions are equalproportions are equal

Conclusion Confidence IntervalConclusion Confidence Interval
-Male proportion likely to be larger -Male proportion likely to be larger because the left tail of the distribution because the left tail of the distribution not covered by the interval (2.5%) is not covered by the interval (2.5%) is still over zero meaning the male still over zero meaning the male proportion would still be larger than proportion would still be larger than the female proportion. The right tail the female proportion. The right tail would still mean a larger male would still mean a larger male proportionproportion
-This coincides with the -This coincides with the significance results of .0165significance results of .0165

Final ConclusionFinal Conclusion
-We feel the survey we created, -We feel the survey we created, distributed, and analyzed shows a distributed, and analyzed shows a greater male proportion of seniors greater male proportion of seniors over female who prefer energy over female who prefer energy drinks. drinks.
-Data could be used for marketing.-Data could be used for marketing. *More male oriented energy *More male oriented energy
drinksdrinks