Energy Division Central Files Document Coversheet
69
1 Energy Division Central Files Document Coversheet A. Document Name Today’s Date (Date of Submittal) 7/17/2017 Name: 1. Utility Name: SDG&E 2. Document Submission Frequency (Annual, Quarterly, Monthly, Weekly, Once, Ad Hoc): Annual 3. Report Name: Electric System Reliability Report 4. Reporting Interval (the date(s) covered by the data, e.g. 2015 Q1): 2016 5. Name Suffix: Cov (for an Energy Division Cover Letter), Conf (for a confidential doc), Ltr (for a letter from utility) 6. Document File Name (format as 1+2 + 3 + 4 + 5): SDG&E Annual Electric System Reliability Report 2016 Cov 7. Identify whether this filing is ☒original or ☐revision to a previous filing. a. If revision, identify date of the original filing: B. Documents Related to a Proceeding All submittals should reference both a proceeding and a decision, if applicable. If not applicable, leave blank and fill out Section C. Proceeding Number (starts with R, I, C, A, or P plus 7 numbers): R1412014 1. Decision Number (starts with D plus 7 numbers): D1601008 2. Ordering Paragraph (OP) Number from the decision: OP 1 C. Documents Submitted as Requested by Other Requirements If the document submitted is in compliance with something other than a proceeding, (e.g. Resolution, Ruling, Staff Letter, Public Utilities Code, or sender’s own motion), please explain: N/A D. Document Summary Provide a Document Summary that explains why this report is being filed with the Energy Division. This information is often contained in the cover letter, introduction, or executive summary, so you may want copy it from there and paste it here. This report has been prepared in response to CPUC Decision 16-01-008, which was approved January 20, 2016. Decision 16-01-008 established reliability recording, calculation, and reporting requirements for SDG&E. E. Sender Contact Information 1. Sender Name: Joe M c Cawley 2. Sender Organization: SDG&E 3. Sender Phone: 858-503-5302 4. Sender Email: [email protected] F. Confidentiality 1. Is this document confidential? ☒No ☐Yes a. If Yes, provide an explanation of why confidentiality is claimed and identify the expiration of the confidentiality designation (e.g. Confidential until December 31, 2020.) Click here to enter text. G. CPUC Routing Energy Division’s Director, Edward Randolph, requests that you not copy him on filings sent to Energy Division Central Files. Identify below any Commission staff that were copied on the submittal of this document. 1. Names of Commission staff that sender copied on the submittal of this Document: David Lee, Gabe Petlin
Transcript of Energy Division Central Files Document Coversheet

1
Energy Division Central Files Document Coversheet
A. Document Name Today’s Date (Date of Submittal) 7/17/2017 Name:
1. Utility Name: SDG&E 2. Document Submission Frequency (Annual, Quarterly, Monthly, Weekly, Once, Ad Hoc): Annual 3. Report Name: Electric System Reliability Report 4. Reporting Interval (the date(s) covered by the data, e.g. 2015 Q1): 2016 5. Name Suffix: Cov (for an Energy Division Cover Letter), Conf (for a confidential doc), Ltr (for a letter from utility) 6. Document File Name (format as 1+2 + 3 + 4 + 5): SDG&E Annual Electric System Reliability Report 2016 Cov 7. Identify whether this filing is ☒original or ☐revision to a previous filing.
a. If revision, identify date of the original filing: B. Documents Related to a Proceeding All submittals should reference both a proceeding and a decision, if applicable. If not applicable, leave blank and fill out Section C. Proceeding Number (starts with R, I, C, A, or P plus 7 numbers): R1412014
1. Decision Number (starts with D plus 7 numbers): D1601008 2. Ordering Paragraph (OP) Number from the decision: OP 1
C. Documents Submitted as Requested by Other Requirements If the document submitted is in compliance with something other than a proceeding, (e.g. Resolution, Ruling, Staff Letter, Public Utilities Code, or sender’s own motion), please explain: N/A D. Document Summary Provide a Document Summary that explains why this report is being filed with the Energy Division. This information is often contained in the cover letter, introduction, or executive summary, so you may want copy it from there and paste it here. This report has been prepared in response to CPUC Decision 16-01-008, which was approved January 20, 2016. Decision 16-01-008 established reliability recording, calculation, and reporting requirements for SDG&E.
E. Sender Contact Information
1. Sender Name: Joe McCawley 2. Sender Organization: SDG&E 3. Sender Phone: 858-503-5302 4. Sender Email: [email protected]
F. Confidentiality 1. Is this document confidential? ☒No ☐Yes
a. If Yes, provide an explanation of why confidentiality is claimed and identify the expiration of the confidentiality designation (e.g. Confidential until December 31, 2020.) Click here to enter text.
G. CPUC Routing Energy Division’s Director, Edward Randolph, requests that you not copy him on filings sent to Energy Division Central Files. Identify below any Commission staff that were copied on the submittal of this document. 1. Names of Commission staff that sender copied on the submittal of this Document: David Lee, Gabe Petlin

ELECTRIC SYSTEM RELIABILITY ANNUAL REPORT 2016
Prepared for
California Public Utilities Commission (Per Decision16-01-008) July 17, 2017

TABLE OF CONTENTS
EXECUTIVE SUMMARY ........................................................................................................................... - 1 - SECTION 1 - SYSTEM INDICES FOR THE LAST 10 YEARS ................................................................. - 4 - SECTION 2 – DISTRICT RELIABILITY INDICES FOR THE PAST 10 YEARS INCLUDING AND
EXCLUDING MED ............................................................................................................ - 10 - a. Summary of electric system reliability for each of SDG&E’s six Districts
(excludes Planned and ISO outages) ....................................................................................... - 10 - b. Charts for each of SDG&E’s six Districts with linear trend line
(excludes Planned and ISO outages; Includes MED) ............................................................... - 14 - c. Charts for each of SDG&E’s six Districts with linear trend line
(excludes Planned, ISO and MED) ........................................................................................... - 20 - SECTION 3 – SYSTEM AND DISTRICT INDICES BASED ON IEEE 1366 FOR THE PAST 10 YEARS
INCLUDING PLANNED OUTAGES AND INCLUDING AND EXCLUDING MED ............ - 26 - Number, date and location of planned outages in each district (2016) ......................................... - 43 -
SECTION 4 – SERVICE TERRITORY MAP INCLUDING DIVISIONS OF DISTRICTS .......................... - 44 - SECTION 5 – TOP 1% OF WORST PERFORMING CIRCUITS (WPC) EXCLUDING MED .................. - 45 - SECTION 6 – TOP 10 MAJOR UNPLANNED POWER OUTAGE EVENTS
WITHIN A REPORTING YEAR ........................................................................................ - 54 - SECTION 7 – SUMMARY LIST OF MED PER IEEE 1366 ..................................................................... - 55 - SECTION 8 – HISTORICAL 10 LARGEST UNPLANNED OUTAGES EVENTS FOR THE PAST 10
YEARS ............................................................................................................................. - 56 - SECTION 9 – NUMBER OF CUSTOMER INQUIRIES ON RELIABILITY DATA AND THE NUMBER
OF DAYS PER RESPONSE ............................................................................................. - 66 -

- 1 -
EXECUTIVE SUMMARY
Background:
The Electric System Reliability Annual Report for 2016 has been prepared in response to California
Public Utility Commission (CPUC) Decision 16-01-008 (Decision). This Decision, which is effective
January 14, 2016, established reliability recording, calculation, and reporting requirements for San Diego
Gas & Electric (SDG&E).
The data in this report is primarily presented in tabular and graphical form. All statistics and calculations
include unplanned transmission, substation, and distribution outages, and exclude planned outages and
California Independent System Operator (CAISO) mandated load curtailment outages unless otherwise
specified. Unplanned outages are those that are not prearranged. For the purposes of this report,
sustained outages are outages that lasted more than five minutes in duration, while momentary outages
are outages that lasted five minutes or less in duration.
2016 Reliability Indices Overview: SDG&E’s 2016 SAIDI and SAIFI numbers were significantly higher than in the past 12 years, with the
final indices values representing a 10% increase from 2015 values. The last time SDG&E experienced
reliability indices as high as in 2016 was in 2004, and these results were mostly attributed to fires that
were not excludable. The following is a high level summary of the major contributors to the increased
number and duration of outages in 2016:
1St Quarter: Outages attributed to El Niño related storms and to cable connector failures contributed approximately 5.0
additional SAIDI minutes compared to Q1 2015.
2nd Quarter: An increased number of equipment failures contributed an additional 1.7 SAIDI minutes compared to Q2
2015.
3rd Quarter An increase in the frequency of equipment failure related outages that were larger in nature and affected
more customers, contributed an additional 3.0 SAIDI minutes compared to Q3 2015.
4th Quarter An increase in the frequency of equipment related outages that were larger than normal, an increase in the
number of winter weather related outages, and an outage caused by an aircraft contacting electrical
equipment combined to contribute an additional 6.8 SAIDI minutes compared to Q4 2015.

- 2 -
Identified Mitigation/Efforts to Improve System Reliability Similar to SDG&E identifying and implementing lessons learned from the outages in 2004 to help mitigate
issues and to address reliability concerns on a going forward basis, so too has SDG&E reviewed the
cause of the outages in 2016 to identify applicable next steps. SDG&E has identified and already begun
implementing a two-pronged approach that it believes is the most efficient way to limit effects on
customers during the types of unplanned outages that occurred in 2016. Both of these changes to the
design and operation of the distribution system will enable quicker restoration to at least some of the
impacted customers:
• Expand the number of sectionalizing locations of the circuits via the installation of additional tie-points
and remotely operated switches. Initial results of reliability based capital improvement projects
implemented with this focus already indicate an improvement in the number customers impacted per
outage.
• Expand and enable more Fault Location, Isolation, and Service Restoration (FLISR) on the
distribution system. The technology associated with FLISR enables a fault to be autonomously
identified and isolated, thus restoring service to our customer quicker than would occur with human
intervention.
How SDG&E Measures Reliability SDG&E uses four metrics commonly used in the electric utility industry to measure reliability.
The reliability indicators that are tracked are as follows: 1. SAIDI (System Average Interruption Duration Index) - minutes of sustained outages per customer per
year. 2. SAIFI (System Average Interruption Frequency Index) - number of sustained outages per customer
per year. 3. CAIDI (Customer Average Interruption Duration Index) – is the average time required to restore
service to a utility customer.
4. MAIFI (Momentary Average Interruption Frequency Index) - number of momentary outages per customer per year.

- 3 -
Prior to 2013, the measurement of each reliability performance indicator excluded CPUC Major Event and
events that are the direct result of failures in the CAISO-controlled bulk power market, or non-SDG&E
owned transmission and distribution facilities. A CPUC Major Event is defined in CPUC Decision 96-09-
045 as an event that meets at least one of the following criteria:
(a) The event is caused by earthquake, fire, or storms of sufficient intensity to give rise to a state
of emergency being declared by the government, or (b) Any other disaster not in (a) that affects more than 15% of the system facilities or 10% of the
utility’s customers, whichever is less for each event.
Outages involving restricted access by a governmental agency that precluded or otherwise delayed
outage restoration times were also considered CPUC Major Events and excluded from reliability results.
Beginning in 2013, the measurement of each reliability performance indicator excludes Major Event Days
(MED) as defined in The Institute for Electrical and Electronic Engineers (IEEE) Guide for Electric Power
Distribution Reliability Indices, aka IEEE Std 1366, instead of CPUC Major Events. A Major Event Day is
defined in IEEE Std 1366 - 2012, Section 2 as a day in which the daily system SAIDI exceeds a threshold
value. These threshold major event days are referred to as “TMED”. Thus, any day in which the total
system SAIDI exceeds TMED is excluded from SDG&E’s reliability results. The applicable TMED value is
calculated at the end of each year using SDG&E’s daily SAIDI values for the prior five years. SDG&E’s
TMED value for 2016 was 4.36 minutes of daily system SAIDI. Other reliability indices in this report are
not calculated using methodologies or formulas exactly as described in the IEEE Std 1366.
For purposes in understanding this report, the division between Distribution equipment and Transmission
equipment is at the distribution substation power transformer high-side bus disconnect. Transmission
equipment is defined as all assets rated 69kV and above. The substation power transformer high-side
bus disconnect and all equipment on the load-side of the substation power transformer high-side bus
disconnect are defined as Distribution equipment.

- 4 -
SECTION 1 - SYSTEM INDICES FOR THE LAST 10 YEARS
SEPARATE TABLES WITH SAIDI, SAIFI, MAIFI AND CAIDI. MAJOR EVENT DAY’S (MED) INCLUDED AND EXCLUDED
Table 1-1: System Indices (MED included and excluded)
San Diego Gas & Electric System Reliability Data 2007 - 2016
MED Included MED Excluded Year SAIDI SAIFI CAIDI MAIFI SAIDI SAIFI CAIDI MAIFI 2007 180.99 0.539 335.75 0.572 54.89 0.477 115.11 0.530 2008 59.17 0.517 114.56 0.380 59.17 0.517 114.56 0.380 2009 67.06 0.542 123.74 0.380 49.71 0.466 106.60 0.362 2010 85.37 0.652 130.99 0.510 63.36 0.520 121.80 0.444 2011 567.59 1.472 385.63 0.239 53.43 0.471 113.44 0.239 2012 64.36 0.533 120.78 0.301 64.36 0.533 120.78 0.301 2013 75.03 0.561 133.84 0.211 59.96 0.472 127.03 0.211 2014 75.81 0.632 119.88 0.262 64.60 0.603 107.16 0.244 2015 58.11 0.530 109.68 0.347 57.92 0.526 110.09 0.347 2016 86.01 0.677 126.99 0.443 72.75 0.620 117.43 0.386

- 5 -
Table 1-2: Distribution System Indices (MED included and Excluded)
San Diego Gas & Electric Distribution System Reliability Data 2007 - 2016
MED Included MED Excluded Year SAIDI SAIFI CAIDI MAIFI SAIDI SAIFI CAIDI MAIFI 2007 174.53 0.506 345.09 0.542 52.86 0.459 115.18 0.505 2008 58.28 0.506 115.24 0.368 58.28 0.506 115.24 0.368 2009 61.85 0.514 120.34 0.350 48.98 0.454 107.84 0.332 2010 84.49 0.638 132.50 0.468 62.65 0.512 122.25 0.403 2011 52.87 0.435 121.63 0.216 52.11 0.433 120.47 0.216 2012 63.32 0.510 124.20 0.289 63.32 0.510 124.20 0.289 2013 54.75 0.452 121.17 0.206 54.53 0.450 121.08 0.206 2014 74.73 0.613 121.86 0.255 63.52 0.584 108.82 0.237 2015 57.90 0.525 110.28 0.323 57.71 0.521 110.70 0.323 2016 83.93 0.647 129.67 0.438 70.67 0.590 119.88 0.380
Note: Distribution System Indices includes substation distribution.

- 6 -
Table 1-3: Transmission System Indices (MED included and excluded)
San Diego Gas & Electric Transmission System Reliability Data 2007 - 2016
MED Included MED Excluded Year SAIDI SAIFI CAIDI MAIFI SAIDI SAIFI CAIDI MAIFI 2007 6.47 0.033 194.01 0.030 2.02 0.018 113.44 0.025 2008 0.89 0.011 82.84 0.013 0.89 0.011 82.84 0.013 2009 5.22 0.028 185.99 0.030 0.73 0.012 60.18 0.030 2010 0.88 0.014 62.63 0.042 0.71 0.008 92.30 0.041 2011 514.72 1.037 496.29 0.022 1.32 0.038 34.26 0.022 2012 1.04 0.023 45.11 0.012 1.04 0.023 45.11 0.012 2013 20.28 0.109 186.51 0.005 5.43 0.022 250.61 0.005 2014 1.07 0.019 56.30 0.007 1.07 0.019 56.27 0.007 2015 0.21 0.005 44.08 0.024 0.21 0.005 44.08 0.024 2016 2.08 0.030 69.15 0.006 2.07 0.030 69.09 0.005
Note: Transmission System Indices includes substation transmission.

- 7 -
System Indices (Excludes Planned, ISO and MED)
54.89
59.17
49.71
63.36
53.43
64.36
59.96
64.60
57.92
72.75
0
10
20
30
40
50
60
70
80
2007 2008 2009 2010 2011 2012 2013 2014 2015 2016
System - SAIDI
0.477
0.517
0.466
0.520
0.471
0.533
0.472
0.603
0.526
0.620
0
0.1
0.2
0.3
0.4
0.5
0.6
0.7
2007 2008 2009 2010 2011 2012 2013 2014 2015 2016
System - SAIFI
115.11
114.56
106.60
121.80
113.44
120.78
127.03
107.16110.09
117.43
95
100
105
110
115
120
125
130
2007 2008 2009 2010 2011 2012 2013 2014 2015 2016
System - CAIDI
0.530
0.380 0.362
0.444
0.239
0.301
0.211
0.244
0.347
0.386
0
0.1
0.2
0.3
0.4
0.5
0.6
2007 2008 2009 2010 2011 2012 2013 2014 2015 2016
System - MAIFI

- 8 -
Distribution System Indices (Excludes Planned, ISO and MED)
52.86
58.28
48.98
62.65
52.11
63.32
54.53
63.5257.71
70.67
0
10
20
30
40
50
60
70
80
2007 2008 2009 2010 2011 2012 2013 2014 2015 2016
Distribution - SAIDI
0.459
0.5060.454
0.512
0.433
0.510
0.450
0.584
0.521
0.590
0
0.1
0.2
0.3
0.4
0.5
0.6
0.7
2007 2008 2009 2010 2011 2012 2013 2014 2015 2016
Distribution - SAIFI
115.18 115.24
107.84
122.25120.47
124.20121.08
108.82110.70
119.88
95
100
105
110
115
120
125
130
2007 2008 2009 2010 2011 2012 2013 2014 2015 2016
Distribution - CAIDI
0.505
0.368 0.332
0.403
0.216
0.289
0.2060.237
0.3230.380
0
0.1
0.2
0.3
0.4
0.5
0.6
2007 2008 2009 2010 2011 2012 2013 2014 2015 2016
Distribution - MAIFI

- 9 -
Note: The spike in 2013 is due to the Borrego Outage events caused by extreme weather Note: The spike in 2011 is due to the Pacific Southwest Electric Outage (PSEO)
Transmission System Indices (Excludes Planned, ISO and MED)
2.02
0.89 0.73 0.71
1.321.04
5.43
1.07
0.21
2.07
0
1
2
3
4
5
6
2007 2008 2009 2010 2011 2012 2013 2014 2015 2016
Transmission - SAIDI
0.018
0.0110.012
0.008
0.038
0.0230.022
0.019
0.005
0.030
0
0.005
0.01
0.015
0.02
0.025
0.03
0.035
0.04
0.045
2007 2008 2009 2010 2011 2012 2013 2014 2015 2016
Transmission - SAIFI
113.44
82.84 60.18
92.30
34.2645.11
250.61
56.27 44.08
69.09
0
50
100
150
200
250
300
2007 2008 2009 2010 2011 2012 2013 2014 2015 2016
Transmission - CAIDI
0.025
0.013
0.030
0.041
0.022
0.012
0.0050.007
0.024
0.0050
0.005
0.01
0.015
0.02
0.025
0.03
0.035
0.04
0.045
2007 2008 2009 2010 2011 2012 2013 2014 2015 2016
Transmission - MAIFI

- 10 -
SECTION 2 – DISTRICT RELIABILITY INDICES FOR THE PAST 10 YEARS INCLUDING AND EXCLUDING MED
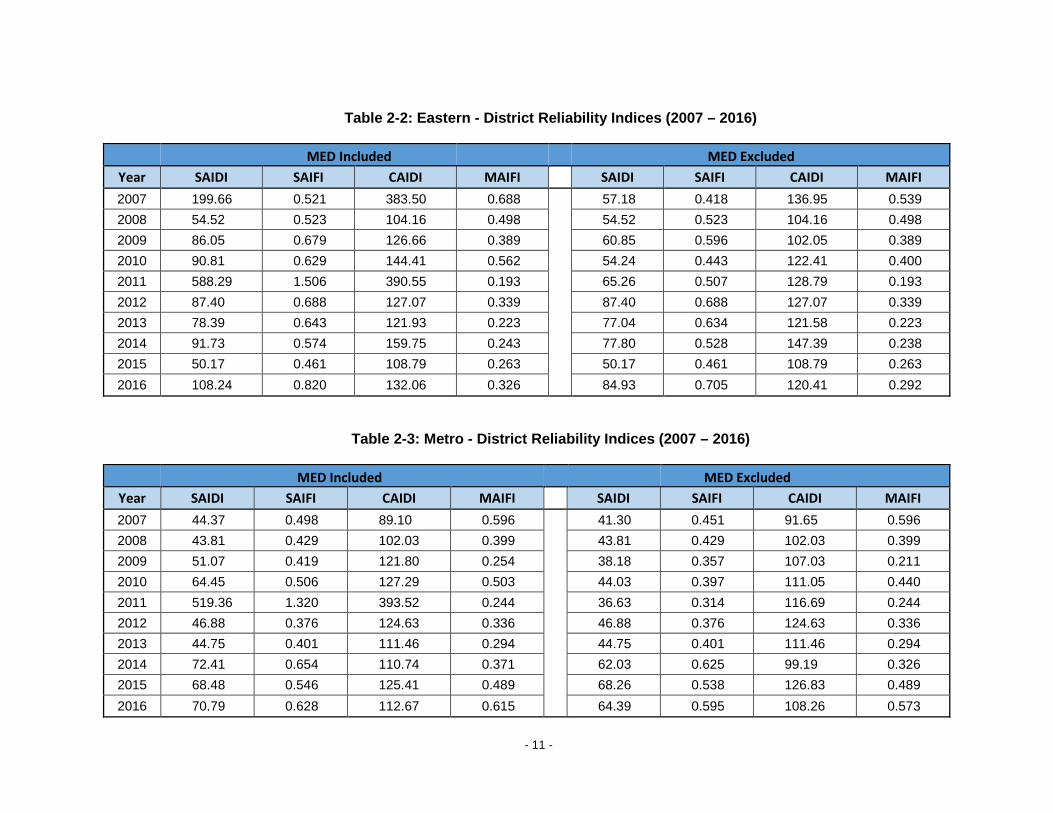
A. SUMMARY OF ELECTRIC SYSTEM RELIABILITY FOR EACH OF SDG&E’S SIX DISTRICTS (EXCLUDES PLANNED AND ISO OUTAGES) - INDICES REPRESENT THE COMBINED TRANSMISSION, SUBSTATION AND DISTRIBUTION OUTAGE IMPACTS AT THE DISTRICT LEVEL
Table 2-1: Beach Cities – District Reliability Indices (2007 – 2016)
MED Included MED Excluded Year SAIDI SAIFI CAIDI MAIFI SAIDI SAIFI CAIDI MAIFI 2007 31.86 0.300 106.12 0.424 31.85 0.300 106.16 0.423 2008 38.67 0.334 115.85 0.144 38.67 0.334 115.85 0.144 2009 46.96 0.406 115.64 0.184 33.19 0.319 103.96 0.174 2010 59.00 0.392 150.53 0.233 48.34 0.354 136.56 0.182 2011 617.86 1.396 442.58 0.243 52.01 0.396 131.17 0.243 2012 39.54 0.338 116.80 0.401 39.54 0.338 116.80 0.401 2013 34.08 0.244 139.40 0.122 34.08 0.244 139.40 0.122 2014 41.37 0.366 113.09 0.136 38.78 0.357 108.66 0.113 2015 62.80 0.514 122.18 0.349 62.76 0.513 122.28 0.349 2016 90.55 0.699 129.48 0.385 77.04 0.651 118.31 0.385
- 11 -
Table 2-2: Eastern - District Reliability Indices (2007 – 2016)
MED Included MED Excluded Year SAIDI SAIFI CAIDI MAIFI SAIDI SAIFI CAIDI MAIFI 2007 199.66 0.521 383.50 0.688 57.18 0.418 136.95 0.539 2008 54.52 0.523 104.16 0.498 54.52 0.523 104.16 0.498 2009 86.05 0.679 126.66 0.389 60.85 0.596 102.05 0.389 2010 90.81 0.629 144.41 0.562 54.24 0.443 122.41 0.400 2011 588.29 1.506 390.55 0.193 65.26 0.507 128.79 0.193 2012 87.40 0.688 127.07 0.339 87.40 0.688 127.07 0.339 2013 78.39 0.643 121.93 0.223 77.04 0.634 121.58 0.223 2014 91.73 0.574 159.75 0.243 77.80 0.528 147.39 0.238 2015 50.17 0.461 108.79 0.263 50.17 0.461 108.79 0.263 2016 108.24 0.820 132.06 0.326 84.93 0.705 120.41 0.292
Table 2-3: Metro - District Reliability Indices (2007 – 2016)
MED Included MED Excluded Year SAIDI SAIFI CAIDI MAIFI SAIDI SAIFI CAIDI MAIFI 2007 44.37 0.498 89.10 0.596 41.30 0.451 91.65 0.596 2008 43.81 0.429 102.03 0.399 43.81 0.429 102.03 0.399 2009 51.07 0.419 121.80 0.254 38.18 0.357 107.03 0.211 2010 64.45 0.506 127.29 0.503 44.03 0.397 111.05 0.440 2011 519.36 1.320 393.52 0.244 36.63 0.314 116.69 0.244 2012 46.88 0.376 124.63 0.336 46.88 0.376 124.63 0.336 2013 44.75 0.401 111.46 0.294 44.75 0.401 111.46 0.294 2014 72.41 0.654 110.74 0.371 62.03 0.625 99.19 0.326 2015 68.48 0.546 125.41 0.489 68.26 0.538 126.83 0.489 2016 70.79 0.628 112.67 0.615 64.39 0.595 108.26 0.573
- 12 -
Table 2-4: North Coast - District Reliability Indices (2007 – 2016)
MED Included
MED Excluded
Year SAIDI SAIFI CAIDI MAIFI SAIDI SAIFI CAIDI MAIFI 2007 95.54 0.552 172.95 0.342 59.85 0.503 118.90 0.324 2008 77.01 0.599 128.61 0.436 77.01 0.599 128.61 0.436 2009 75.76 0.495 153.02 0.652 41.79 0.380 109.85 0.631 2010 117.12 0.771 151.87 0.789 93.47 0.656 142.51 0.738 2011 565.06 1.515 372.88 0.292 66.49 0.516 128.89 0.292 2012 75.68 0.602 125.67 0.215 75.68 0.602 125.67 0.215 2013 60.17 0.509 118.27 0.181 59.50 0.507 117.25 0.181 2014 76.33 0.606 125.92 0.294 59.96 0.590 101.59 0.282 2015 49.79 0.439 113.49 0.275 49.78 0.438 113.78 0.275 2016 78.82 0.501 157.21 0.558 61.31 0.411 149.09 0.412
Table 2-5: Northeast - District Reliability Indices (2007 – 2016)
MED Included
MED Excluded Year SAIDI SAIFI CAIDI MAIFI SAIDI SAIFI CAIDI MAIFI 2007 688.30 0.760 905.24 0.970 82.76 0.598 138.33 0.868 2008 82.22 0.677 121.49 0.544 82.22 0.677 121.49 0.544 2009 102.02 0.851 119.85 0.583 90.74 0.800 113.50 0.569 2010 101.96 0.948 107.55 0.544 77.47 0.707 109.64 0.497 2011 612.05 1.694 361.24 0.268 59.18 0.696 84.97 0.268 2012 78.46 0.626 125.32 0.272 78.46 0.626 125.32 0.272 2013 102.07 0.708 144.08 0.213 102.06 0.708 144.09 0.213 2014 95.74 0.899 106.48 0.174 75.92 0.832 91.22 0.173 2015 63.02 0.764 82.49 0.359 62.25 0.755 82.40 0.359 2016 93.94 0.815 115.27 0.323 82.15 0.779 105.39 0.270

- 13 -
Table 2-6: Orange County - District Reliability Indices (2007 – 2016)
MED Included
MED Excluded
Year SAIDI SAIFI CAIDI MAIFI SAIDI SAIFI CAIDI MAIFI 2007 75.27 0.733 102.66 0.316 74.94 0.733 102.25 0.316 2008 75.48 0.664 113.71 0.183 75.48 0.664 113.71 0.183 2009 38.76 0.444 87.32 0.227 35.81 0.397 90.26 0.227 2010 97.15 0.852 114.00 0.395 81.24 0.738 110.05 0.395 2011 494.15 1.506 328.14 0.140 48.39 0.507 95.53 0.140 2012 75.86 0.794 95.52 0.156 75.86 0.794 95.52 0.156 2013 216.07 1.328 162.74 0.183 47.75 0.336 142.19 0.183 2014 87.79 0.752 116.68 0.334 87.74 0.752 116.63 0.334 2015 39.43 0.372 105.95 0.195 39.43 0.372 105.95 0.195 2016 80.99 0.608 133.21 0.277 71.29 0.579 123.13 0.179

- 14 -
B. CHARTS FOR EACH OF SDG&E’S SIX DISTRICTS WITH LINEAR TREND LINE (EXCLUDES PLANNED AND ISO OUTAGES; INCLUDES MED)
Note: The spike in 2011 is due to the Pacific Southwest Electric Outage (PSEO)
District Reliability Indices (Excludes Planned and ISO; Includes MED)
31.86 38.6746.96 59.00
617.86
39.5434.08
41.3762.80
90.55
0
100
200
300
400
500
600
700
2007 2008 2009 2010 2011 2012 2013 2014 2015 2016
Beach Cities - SAIDI
0.300 0.334 0.406 0.392
1.396
0.338
0.2440.366
0.514
0.699
0
0.2
0.4
0.6
0.8
1
1.2
1.4
1.6
2007 2008 2009 2010 2011 2012 2013 2014 2015 2016
Beach Cities - SAIFI
106.12115.85 115.64
150.53
442.58
116.80139.40
113.09122.18
129.48
0
50
100
150
200
250
300
350
400
450
500
2007 2008 2009 2010 2011 2012 2013 2014 2015 2016
Beach Cities - CAIDI
0.424
0.144
0.184
0.233 0.243
0.401
0.122 0.136
0.3490.385
0
0.05
0.1
0.15
0.2
0.25
0.3
0.35
0.4
0.45
2007 2008 2009 2010 2011 2012 2013 2014 2015 2016
Beach Cities - MAIFI

- 15 -
Note: The spike in 2011 is due to the Pacific Southwest Electric Outage (PSEO)
District Reliability Indices (Excludes Planned and ISO; Includes MED)
199.66
54.52 86.05 90.81
588.29
87.4078.39
91.7350.17
108.24
0
100
200
300
400
500
600
700
2007 2008 2009 2010 2011 2012 2013 2014 2015 2016
Eastern - SAIDI
0.521 0.523
0.6790.629
1.506
0.6880.643
0.5740.461
0.820
0
0.2
0.4
0.6
0.8
1
1.2
1.4
1.6
2007 2008 2009 2010 2011 2012 2013 2014 2015 2016
Eastern - SAIFI
383.50
104.16126.66
144.41
390.55
127.07 121.93159.75
108.79
132.06
0
50
100
150
200
250
300
350
400
450
2007 2008 2009 2010 2011 2012 2013 2014 2015 2016
Eastern - CAIDI
0.688
0.4980.389
0.562
0.193
0.339
0.223 0.2430.263
0.326
0
0.1
0.2
0.3
0.4
0.5
0.6
0.7
0.8
2007 2008 2009 2010 2011 2012 2013 2014 2015 2016
Eastern - MAIFI

- 16 -
Note: The spike in 2011 is due to the Pacific Southwest Electric Outage (PSEO)
District Reliability Indices (Excludes Planned and ISO; Includes MED)
44.37
43.8151.07 64.45
519.36
46.88 44.7572.41 68.48 70.79
0
100
200
300
400
500
600
2007 2008 2009 2010 2011 2012 2013 2014 2015 2016
Metro - SAIDI
0.498 0.429 0.4190.506
1.320
0.376 0.401
0.6540.546
0.628
0
0.2
0.4
0.6
0.8
1
1.2
1.4
2007 2008 2009 2010 2011 2012 2013 2014 2015 2016
Metro - SAIFI
89.10102.03
121.80127.29
393.52
124.63 111.46 110.74125.41
112.67
0
50
100
150
200
250
300
350
400
450
2007 2008 2009 2010 2011 2012 2013 2014 2015 2016
Metro - CAIDI
0.596
0.399
0.254
0.503
0.244
0.3360.294
0.371
0.489
0.615
0
0.1
0.2
0.3
0.4
0.5
0.6
0.7
2007 2008 2009 2010 2011 2012 2013 2014 2015 2016
Metro - MAIFI

- 17 -
Note: The spike in 2011 is due to the Pacific Southwest Electric Outage (PSEO)
District Reliability Indices (Excludes Planned and ISO; Includes MED)
95.5477.01
75.76117.12
565.06
75.68 60.1776.33
49.7978.82
0
100
200
300
400
500
600
2007 2008 2009 2010 2011 2012 2013 2014 2015 2016
North Coast - SAIDI
0.5520.599
0.495
0.771
1.515
0.602
0.5090.606
0.4390.501
0
0.2
0.4
0.6
0.8
1
1.2
1.4
1.6
2007 2008 2009 2010 2011 2012 2013 2014 2015 2016
North Coast - SAIFI
172.95128.61
153.02 151.87
372.88
125.67118.27 125.92 113.49
157.21
0
50
100
150
200
250
300
350
400
2007 2008 2009 2010 2011 2012 2013 2014 2015 2016
North Coast - CAIDI
0.3420.436
0.652
0.789
0.2920.215 0.181
0.294 0.275
0.558
0
0.1
0.2
0.3
0.4
0.5
0.6
0.7
0.8
0.9
2007 2008 2009 2010 2011 2012 2013 2014 2015 2016
North Coast - MAIFI

- 18 -
Note: The spike in 2011 is due to the Pacific Southwest Electric Outage (PSEO)
District Reliability Indices (Excludes Planned and ISO; Includes MED)
688.30
82.22102.02
101.96
612.05
78.46102.07 95.74
63.0293.94
0
100
200
300
400
500
600
700
800
2007 2008 2009 2010 2011 2012 2013 2014 2015 2016
Northeast - SAIDI
0.760 0.6770.851
0.948
1.694
0.626 0.708
0.899
0.7640.815
0
0.2
0.4
0.6
0.8
1
1.2
1.4
1.6
1.8
2007 2008 2009 2010 2011 2012 2013 2014 2015 2016
Northeast - SAIFI
905.24
121.49 119.85 107.55
361.24
125.32144.08
106.4882.49
115.27
0
100
200
300
400
500
600
700
800
900
1000
2007 2008 2009 2010 2011 2012 2013 2014 2015 2016
Northeast - CAIDI
0.970
0.544
0.5830.544
0.2680.272 0.213
0.174
0.3590.323
0
0.2
0.4
0.6
0.8
1
1.2
2007 2008 2009 2010 2011 2012 2013 2014 2015 2016
Northeast - MAIFI

- 19 -
Note: The spike in 2011 is due to the Pacific Southwest Electric Outage (PSEO)
District Reliability Indices (Excludes Planned and ISO; Includes MED)
75.27
75.48
38.7697.15
494.15
75.86
216.07
87.79
39.4380.99
0
100
200
300
400
500
600
2007 2008 2009 2010 2011 2012 2013 2014 2015 2016
Orange County - SAIDI
0.733 0.664
0.444
0.852
1.506
0.794
1.328
0.752
0.372
0.608
0
0.2
0.4
0.6
0.8
1
1.2
1.4
1.6
2007 2008 2009 2010 2011 2012 2013 2014 2015 2016
Orange County - SAIFI
102.66113.71
87.32
114.00
328.14
95.52
162.74
116.68 105.95
133.21
0
50
100
150
200
250
300
350
2007 2008 2009 2010 2011 2012 2013 2014 2015 2016
Orange County - CAIDI
0.316
0.183
0.227
0.395
0.140 0.1560.183
0.334
0.195
0.277
0
0.05
0.1
0.15
0.2
0.25
0.3
0.35
0.4
0.45
2007 2008 2009 2010 2011 2012 2013 2014 2015 2016
Orange County - MAIFI

- 20 -
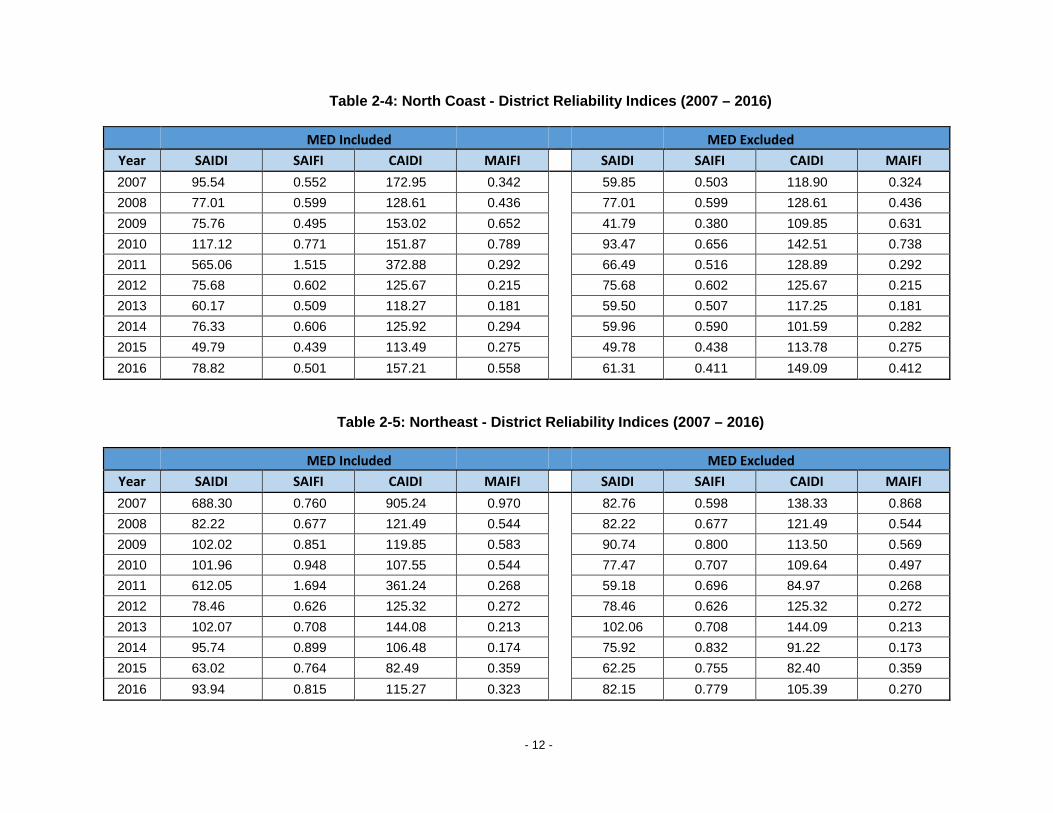
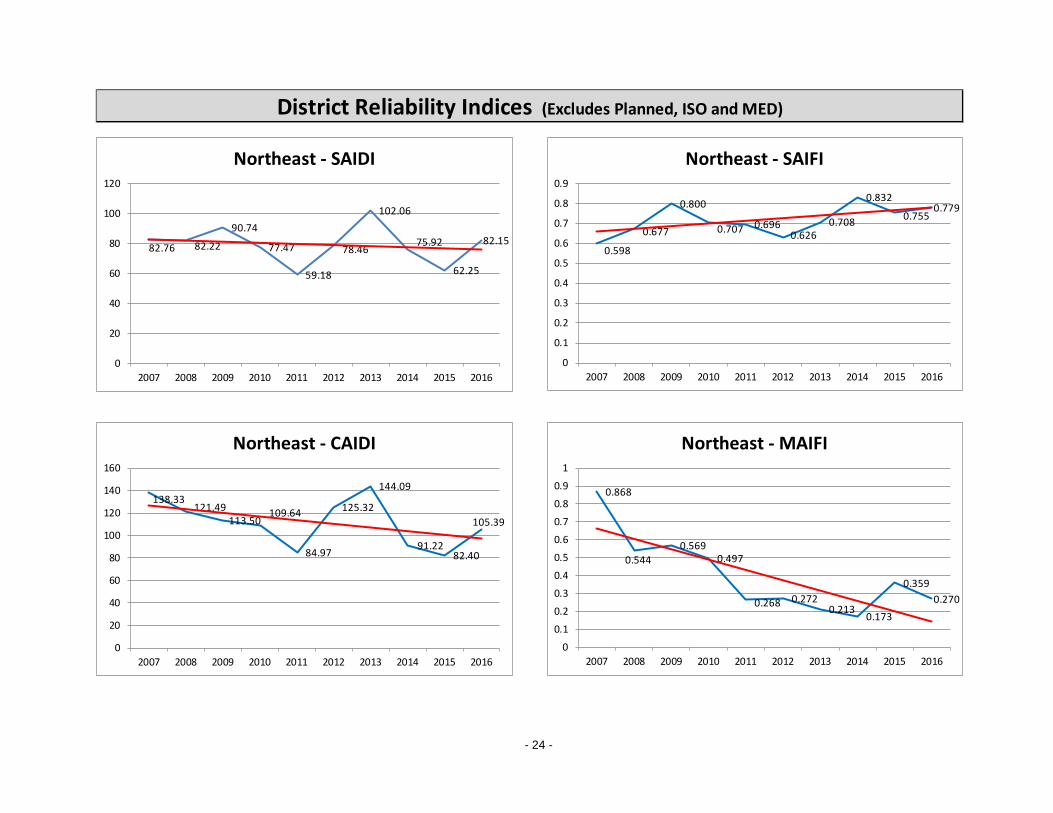
C. CHARTS FOR EACH OF SDG&E’S SIX DISTRICTS WITH LINEAR TREND LINE (EXCLUDES PLANNED, ISO AND MED)
District Reliability Indices (Excludes Planned, ISO and MED)
31.85
38.6733.19
48.3452.01
39.5434.08
38.78
62.76
77.04
0
10
20
30
40
50
60
70
80
90
2007 2008 2009 2010 2011 2012 2013 2014 2015 2016
Beach Cities - SAIDI
0.300
0.334 0.319 0.3540.396
0.338
0.244
0.357
0.513
0.651
0
0.1
0.2
0.3
0.4
0.5
0.6
0.7
2007 2008 2009 2010 2011 2012 2013 2014 2015 2016
Beach Cities - SAIFI
106.16
115.85
103.96
136.56131.17
116.80
139.40
108.66122.28
118.31
0
20
40
60
80
100
120
140
160
2007 2008 2009 2010 2011 2012 2013 2014 2015 2016
Beach Cities - CAIDI
0.423
0.144
0.174 0.182
0.243
0.401
0.122 0.113
0.3490.385
0
0.05
0.1
0.15
0.2
0.25
0.3
0.35
0.4
0.45
2007 2008 2009 2010 2011 2012 2013 2014 2015 2016
Beach Cities - MAIFI

- 21 -
District Reliability Indices (Excludes Planned, ISO and MED)
57.18 54.52
60.85
54.24
65.26
87.40
77.04 77.80
50.17
84.93
0
10
20
30
40
50
60
70
80
90
100
2007 2008 2009 2010 2011 2012 2013 2014 2015 2016
Eastern - SAIDI
0.418
0.5230.596
0.4430.507
0.688
0.634
0.528
0.461
0.705
0
0.1
0.2
0.3
0.4
0.5
0.6
0.7
0.8
2007 2008 2009 2010 2011 2012 2013 2014 2015 2016
Eastern - SAIFI
136.95
104.16 102.05
122.41 128.79 127.07121.58
147.39
108.79
120.41
0
20
40
60
80
100
120
140
160
2007 2008 2009 2010 2011 2012 2013 2014 2015 2016
Eastern - CAIDI
0.539
0.498
0.3890.400
0.193
0.339
0.223 0.2380.263
0.292
0
0.1
0.2
0.3
0.4
0.5
0.6
2007 2008 2009 2010 2011 2012 2013 2014 2015 2016
Eastern - MAIFI

- 22 -
District Reliability Indices (Excludes Planned, ISO and MED)
41.3043.81
38.1844.03
36.63
46.88 44.75
62.0368.26
64.39
0
10
20
30
40
50
60
70
80
2007 2008 2009 2010 2011 2012 2013 2014 2015 2016
Metro - SAIDI
0.451 0.429
0.3570.397
0.314
0.376 0.401
0.625
0.538
0.595
0
0.1
0.2
0.3
0.4
0.5
0.6
0.7
2007 2008 2009 2010 2011 2012 2013 2014 2015 2016
Metro - SAIFI
91.65102.03 107.03
111.05 116.69124.63
111.4699.19
126.83108.26
0
20
40
60
80
100
120
140
2007 2008 2009 2010 2011 2012 2013 2014 2015 2016
Metro - CAIDI
0.596
0.399
0.211
0.440
0.244
0.3360.294
0.326
0.489
0.573
0
0.1
0.2
0.3
0.4
0.5
0.6
0.7
2007 2008 2009 2010 2011 2012 2013 2014 2015 2016
Metro - MAIFI

- 23 -
District Reliability Indices (Excludes Planned, ISO and MED)
59.85
77.01
41.79
93.47
66.4975.68
59.5059.96
49.78
61.31
0
10
20
30
40
50
60
70
80
90
100
2007 2008 2009 2010 2011 2012 2013 2014 2015 2016
North Coast - SAIDI
0.503
0.599
0.380
0.656
0.516
0.602
0.507
0.590
0.438 0.411
0
0.1
0.2
0.3
0.4
0.5
0.6
0.7
2007 2008 2009 2010 2011 2012 2013 2014 2015 2016
North Coast - SAIFI
118.90128.61
109.85
142.51
128.89 125.67117.25
101.59
113.78
149.09
0
20
40
60
80
100
120
140
160
2007 2008 2009 2010 2011 2012 2013 2014 2015 2016
North Coast - CAIDI
0.3240.436
0.631
0.738
0.2920.215
0.181
0.282 0.275
0.412
0
0.1
0.2
0.3
0.4
0.5
0.6
0.7
0.8
2007 2008 2009 2010 2011 2012 2013 2014 2015 2016
North Coast - MAIFI
- 24 -
District Reliability Indices (Excludes Planned, ISO and MED)
82.76 82.22
90.74
77.47
59.18
78.46
102.06
75.92
62.25
82.15
0
20
40
60
80
100
120
2007 2008 2009 2010 2011 2012 2013 2014 2015 2016
Northeast - SAIDI
0.598
0.677
0.800
0.707 0.6960.626
0.708
0.832
0.7550.779
0
0.1
0.2
0.3
0.4
0.5
0.6
0.7
0.8
0.9
2007 2008 2009 2010 2011 2012 2013 2014 2015 2016
Northeast - SAIFI
138.33121.49
113.50109.64
84.97
125.32
144.09
91.2282.40
105.39
0
20
40
60
80
100
120
140
160
2007 2008 2009 2010 2011 2012 2013 2014 2015 2016
Northeast - CAIDI
0.868
0.5440.569
0.497
0.268 0.2720.213
0.173
0.3590.270
0
0.1
0.2
0.3
0.4
0.5
0.6
0.7
0.8
0.9
1
2007 2008 2009 2010 2011 2012 2013 2014 2015 2016
Northeast - MAIFI

- 25 -
District Reliability Indices (Excludes Planned, ISO and MED)
74.9475.48
35.81
81.24
48.39
75.86
47.75
87.74
39.43
71.29
0
10
20
30
40
50
60
70
80
90
100
2007 2008 2009 2010 2011 2012 2013 2014 2015 2016
Orange County - SAIDI
0.7330.664
0.397
0.738
0.507
0.794
0.336
0.752
0.372
0.579
0
0.1
0.2
0.3
0.4
0.5
0.6
0.7
0.8
0.9
2007 2008 2009 2010 2011 2012 2013 2014 2015 2016
Orange County - SAIFI
102.25
113.71
90.26
110.05
95.53 95.52
142.19
116.63105.95
123.13
0
20
40
60
80
100
120
140
160
2007 2008 2009 2010 2011 2012 2013 2014 2015 2016
Orange County - CAIDI
0.316
0.183
0.227
0.395
0.140 0.1560.183
0.334
0.1950.179
0
0.05
0.1
0.15
0.2
0.25
0.3
0.35
0.4
0.45
2007 2008 2009 2010 2011 2012 2013 2014 2015 2016
Orange County - MAIFI

- 26 -
SECTION 3 – SYSTEM AND DISTRICT INDICES BASED ON IEEE 1366 FOR THE PAST 10 YEARS INCLUDING PLANNED OUTAGES AND INCLUDING AND EXCLUDING MED
The Decision requires SDG&E to track and report planned outages on a historic running 10-year period. However, prior to the Decision, SDG&E kept and tracked planned outage data on a running three-year period, and because SDG&E started using a newly implemented outage management system in September, 2012, SDG&E has recorded planned outage data from only 2013 onward. Since the data for 2013-2015 was recorded for purposes other than as required per the Decision, the extracted data for those three years has not been reviewed and has not gone through a formal quality control process to assure accuracy of the indices in this Reliability Report.
The indices for years 2016 onward reflect an improved level of accuracy associated with using data that was recorded subject to a quality control program that was designed and implemented in 2016 to meet the Decision’s reporting requirements. Moving forward, SDG&E will maintain 10 years’ worth of planned outage data as directed per the Decision. Each year SDG&E will provide an additional years’ worth of data and in 2022 will report a running 10 years’ worth of planned outage data.
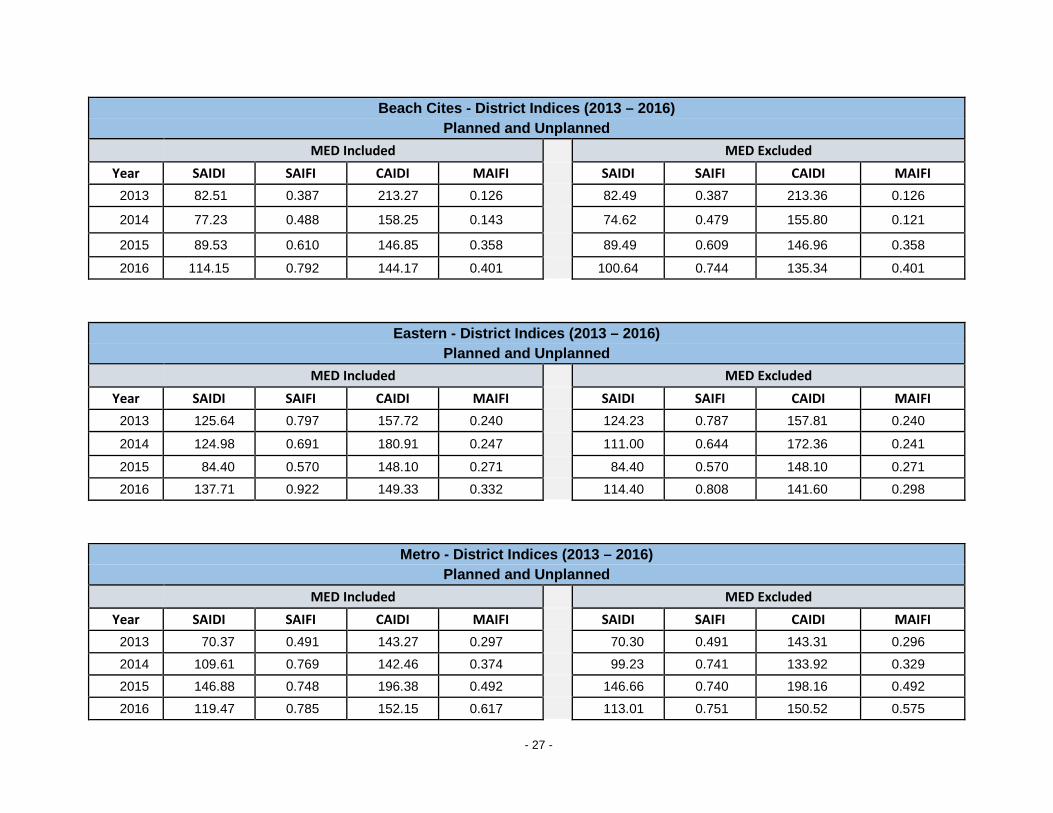
INDICES BELOW REPRESENT THE COMBINED TRANSMISSION, SUBSTATION AND DISTRIBUTION OUTAGE IMPACTS AT THE SYSTEM AND DISTRICT LEVELS.
System Indices (2013 – 2016)
Planned and Unplanned MED Included MED Excluded
Year SAIDI SAIFI CAIDI MAIFI SAIDI SAIFI CAIDI MAIFI 2013 109.16 0.682 160.07 0.231 94.05 0.593 158.58 0.231
2014 109.22 0.763 143.18 0.278 97.99 0.733 133.66 0.259
2015 103.86 0.682 152.30 0.367 103.68 0.678 152.84 0.367 2016 125.26 0.822 152.38 0.467 111.98 0.764 146.57 0.410
- 27 -
Beach Cites - District Indices (2013 – 2016)
Planned and Unplanned MED Included MED Excluded
Year SAIDI SAIFI CAIDI MAIFI SAIDI SAIFI CAIDI MAIFI 2013 82.51 0.387 213.27 0.126 82.49 0.387 213.36 0.126
2014 77.23 0.488 158.25 0.143 74.62 0.479 155.80 0.121
2015 89.53 0.610 146.85 0.358 89.49 0.609 146.96 0.358
2016 114.15 0.792 144.17 0.401 100.64 0.744 135.34 0.401
Eastern - District Indices (2013 – 2016) Planned and Unplanned
MED Included MED Excluded Year SAIDI SAIFI CAIDI MAIFI SAIDI SAIFI CAIDI MAIFI
2013 125.64 0.797 157.72 0.240 124.23 0.787 157.81 0.240
2014 124.98 0.691 180.91 0.247 111.00 0.644 172.36 0.241
2015 84.40 0.570 148.10 0.271 84.40 0.570 148.10 0.271 2016 137.71 0.922 149.33 0.332 114.40 0.808 141.60 0.298
Metro - District Indices (2013 – 2016) Planned and Unplanned
MED Included MED Excluded Year SAIDI SAIFI CAIDI MAIFI SAIDI SAIFI CAIDI MAIFI
2013 70.37 0.491 143.27 0.297 70.30 0.491 143.31 0.296 2014 109.61 0.769 142.46 0.374 99.23 0.741 133.92 0.329 2015 146.88 0.748 196.38 0.492 146.66 0.740 198.16 0.492 2016 119.47 0.785 152.15 0.617 113.01 0.751 150.52 0.575

- 28 -
North Coast - District Indices (2013 – 2016)
Planned and Unplanned MED Included MED Excluded
Year SAIDI SAIFI CAIDI MAIFI SAIDI SAIFI CAIDI MAIFI 2013 92.48 0.635 145.66 0.192 91.80 0.634 144.90 0.192 2014 106.50 0.764 139.43 0.322 90.13 0.748 120.52 0.310 2015 90.58 0.608 148.86 0.299 90.57 0.607 149.14 0.299 2016 117.94 0.686 171.98 0.584 100.43 0.596 168.62 0.438
Northeast - District Indices (2013 – 2016) Planned and Unplanned
MED Included MED Excluded Year SAIDI SAIFI CAIDI MAIFI SAIDI SAIFI CAIDI MAIFI
2013 132.14 0.827 159.79 0.265 132.12 0.827 159.80 0.265 2014 122.75 1.028 119.36 0.217 102.93 0.961 107.05 0.216 2015 96.85 0.926 104.59 0.431 96.08 0.917 104.71 0.431 2016 155.61 1.023 152.17 0.410 143.82 0.987 145.71 0.357
Orange County - District Indices (2013 – 2016) Planned and Unplanned
MED Included MED Excluded Year SAIDI SAIFI CAIDI MAIFI SAIDI SAIFI CAIDI MAIFI
2013 234.55 1.439 163.02 0.246 66.21 0.447 148.28 0.246 2014 123.79 0.917 135.02 0.349 123.74 0.917 134.98 0.349 2015 82.07 0.521 157.56 0.211 82.07 0.521 157.56 0.211 2016 100.61 0.704 142.86 0.288 90.91 0.675 134.63 0.190

- 29 -
System Indices - Planned and Unplanned (Excludes ISO; Includes MED)
109.16 109.22103.86
125.26
0
20
40
60
80
100
120
140
2013 2014 2015 2016
System - SAIDI
0.682
0.7630.682
0.822
0
0.1
0.2
0.3
0.4
0.5
0.6
0.7
0.8
0.9
2013 2014 2015 2016
System - SAIFI
160.07
143.18
152.30 152.38
130
135
140
145
150
155
160
165
2013 2014 2015 2016
System - CAIDI
0.231
0.278
0.367
0.467
0
0.05
0.1
0.15
0.2
0.25
0.3
0.35
0.4
0.45
0.5
2013 2014 2015 2016
System - MAIFI

- 30 -
System Indices - Planned and Unplanned (Excludes ISO and MED)
94.0597.99 103.68
111.98
0
20
40
60
80
100
120
2013 2014 2015 2016
System - SAIDI
0.593
0.7330.678
0.764
0
0.1
0.2
0.3
0.4
0.5
0.6
0.7
0.8
0.9
2013 2014 2015 2016
System - SAIFI
158.58
133.66
152.84
146.57
120
125
130
135
140
145
150
155
160
165
2013 2014 2015 2016
System - CAIDI
0.2310.259
0.367
0.410
0
0.05
0.1
0.15
0.2
0.25
0.3
0.35
0.4
0.45
2013 2014 2015 2016
System - MAIFI

- 31 -
District Indices - Planned and Unplanned (Excludes ISO; Includes MED)
82.51
77.23
89.53
114.15
0
20
40
60
80
100
120
2013 2014 2015 2016
Beach Cities - SAIDI
0.387
0.488
0.610
0.792
0
0.1
0.2
0.3
0.4
0.5
0.6
0.7
0.8
0.9
2013 2014 2015 2016
Beach Cities - SAIFI
213.27
158.25 146.85 144.17
0
50
100
150
200
250
2013 2014 2015 2016
Beach Cities - CAIDI
0.1260.143
0.3580.401
0
0.05
0.1
0.15
0.2
0.25
0.3
0.35
0.4
0.45
2013 2014 2015 2016
Beach Cities - MAIFI

- 32 -
District Indices - Planned and Unplanned (Excludes ISO; Includes MED)
125.64124.98
84.40
137.71
0
20
40
60
80
100
120
140
160
2013 2014 2015 2016
Eastern - SAIDI
0.7970.691
0.570
0.922
0
0.1
0.2
0.3
0.4
0.5
0.6
0.7
0.8
0.9
1
2013 2014 2015 2016
Eastern - SAIFI
157.72 180.91
148.10 149.33
0
20
40
60
80
100
120
140
160
180
200
2013 2014 2015 2016
Eastern - CAIDI
0.2400.247
0.271
0.332
0
0.05
0.1
0.15
0.2
0.25
0.3
0.35
2013 2014 2015 2016
Eastern - MAIFI

- 33 -
District Indices - Planned and Unplanned (Excludes ISO; Includes MED)
70.37
109.61
146.88
119.47
0
20
40
60
80
100
120
140
160
2013 2014 2015 2016
Metro - SAIDI
0.491
0.769 0.7480.785
0
0.1
0.2
0.3
0.4
0.5
0.6
0.7
0.8
0.9
2013 2014 2015 2016
Metro - SAIFI
143.27142.46
196.38
152.15
0
50
100
150
200
250
2013 2014 2015 2016
Metro - CAIDI
0.297
0.374
0.492
0.617
0
0.1
0.2
0.3
0.4
0.5
0.6
0.7
2013 2014 2015 2016
Metro - MAIFI

- 34 -
District Indices - Planned and Unplanned (Excludes ISO; Includes MED)
92.48106.50
90.58
117.94
0
20
40
60
80
100
120
140
2013 2014 2015 2016
North Coast - SAIDI
0.635
0.764
0.6080.686
0
0.1
0.2
0.3
0.4
0.5
0.6
0.7
0.8
0.9
2013 2014 2015 2016
North Coast - SAIFI
145.66
139.43148.86
171.98
0
20
40
60
80
100
120
140
160
180
200
2013 2014 2015 2016
North Coast - CAIDI
0.192
0.322 0.299
0.584
0
0.1
0.2
0.3
0.4
0.5
0.6
0.7
2013 2014 2015 2016
North Coast - MAIFI

- 35 -
District Indices - Planned and Unplanned (Excludes ISO; Includes MED)
132.14
122.75
96.85
155.61
0
20
40
60
80
100
120
140
160
180
2013 2014 2015 2016
Northeast - SAIDI
0.827
1.0280.926
1.023
0
0.2
0.4
0.6
0.8
1
1.2
2013 2014 2015 2016
Northeast - SAIFI
159.79
119.36104.59
152.17
0
20
40
60
80
100
120
140
160
180
2013 2014 2015 2016
Northeast - CAIDI
0.2650.217
0.4310.410
0
0.05
0.1
0.15
0.2
0.25
0.3
0.35
0.4
0.45
0.5
2013 2014 2015 2016
Northeast - MAIFI

- 36 -
District Indices - Planned and Unplanned (Excludes ISO; Includes MED)
234.55
123.79
82.07100.61
0
50
100
150
200
250
2013 2014 2015 2016
Orange County - SAIDI
1.439
0.917
0.521
0.704
0
0.2
0.4
0.6
0.8
1
1.2
1.4
1.6
2013 2014 2015 2016
Orange County - SAIFI
163.02
135.02
157.56142.86
0
20
40
60
80
100
120
140
160
180
2013 2014 2015 2016
Orange County - CAIDI
0.246
0.349
0.211
0.288
0
0.05
0.1
0.15
0.2
0.25
0.3
0.35
0.4
2013 2014 2015 2016
Orange County - MAIFI

- 37 -
District Indices - Planned and Unplanned (Excludes ISO and MED)
82.49
74.62
89.49
100.64
0
20
40
60
80
100
120
2013 2014 2015 2016
Beach Cities - SAIDI
0.387
0.479
0.609
0.744
0
0.1
0.2
0.3
0.4
0.5
0.6
0.7
0.8
2013 2014 2015 2016
Beach Cities - SAIFI
213.36
155.80146.96 135.34
0
50
100
150
200
250
2013 2014 2015 2016
Beach Cities - CAIDI
0.1260.121
0.358
0.401
0
0.05
0.1
0.15
0.2
0.25
0.3
0.35
0.4
0.45
2013 2014 2015 2016
Beach Cities - MAIFI

- 38 -
District Indices - Planned and Unplanned (Excludes ISO and MED)
124.23
111.00
84.40
114.40
0
20
40
60
80
100
120
140
2013 2014 2015 2016
Eastern - SAIDI
0.787
0.6440.570
0.808
0
0.1
0.2
0.3
0.4
0.5
0.6
0.7
0.8
0.9
2013 2014 2015 2016
Eastern - SAIFI
157.81 172.36
148.10 141.60
0
20
40
60
80
100
120
140
160
180
200
2013 2014 2015 2016
Eastern - CAIDI
0.2400.241
0.2710.298
0
0.05
0.1
0.15
0.2
0.25
0.3
0.35
2013 2014 2015 2016
Eastern - MAIFI
- 39 -
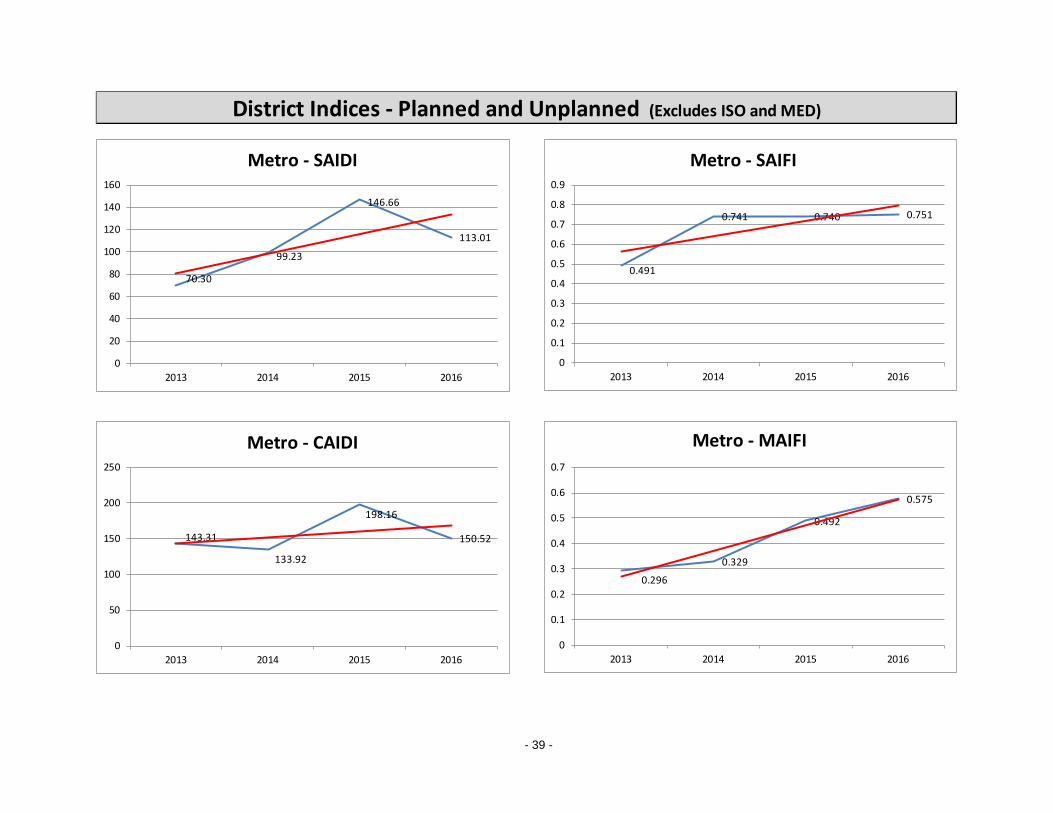
District Indices - Planned and Unplanned (Excludes ISO and MED)
70.30
99.23
146.66
113.01
0
20
40
60
80
100
120
140
160
2013 2014 2015 2016
Metro - SAIDI
0.491
0.741 0.740 0.751
0
0.1
0.2
0.3
0.4
0.5
0.6
0.7
0.8
0.9
2013 2014 2015 2016
Metro - SAIFI
143.31
133.92
198.16
150.52
0
50
100
150
200
250
2013 2014 2015 2016
Metro - CAIDI
0.296
0.329
0.492
0.575
0
0.1
0.2
0.3
0.4
0.5
0.6
0.7
2013 2014 2015 2016
Metro - MAIFI

- 40 -
District Indices - Planned and Unplanned (Excludes ISO and MED)
91.80
90.13 90.57
100.43
82
84
86
88
90
92
94
96
98
100
102
2013 2014 2015 2016
North Coast - SAIDI
0.634
0.748
0.607 0.596
0
0.1
0.2
0.3
0.4
0.5
0.6
0.7
0.8
2013 2014 2015 2016
North Coast - SAIFI
144.90
120.52
149.14
168.62
0
20
40
60
80
100
120
140
160
180
2013 2014 2015 2016
North Coast - CAIDI
0.192
0.310 0.299
0.438
0
0.05
0.1
0.15
0.2
0.25
0.3
0.35
0.4
0.45
0.5
2013 2014 2015 2016
North Coast - MAIFI

- 41 -
District Indices - Planned and Unplanned (Excludes ISO and MED)
132.12
102.93 96.08
143.82
0
20
40
60
80
100
120
140
160
2013 2014 2015 2016
Northeast - SAIDI
0.827
0.961
0.917
0.987
0.7
0.75
0.8
0.85
0.9
0.95
1
1.05
2013 2014 2015 2016
Northeast - SAIFI
159.80
107.05 104.71
145.71
0
20
40
60
80
100
120
140
160
180
2013 2014 2015 2016
Northeast - CAIDI
0.2650.216
0.431
0.357
0
0.05
0.1
0.15
0.2
0.25
0.3
0.35
0.4
0.45
0.5
2013 2014 2015 2016
Northeast - MAIFI

- 42 -
District Indices - Planned and Unplanned (Excludes ISO and MED)
66.21
123.74
82.0790.91
0
20
40
60
80
100
120
140
2013 2014 2015 2016
Orange County - SAIDI
0.447
0.917
0.521
0.675
0
0.1
0.2
0.3
0.4
0.5
0.6
0.7
0.8
0.9
1
2013 2014 2015 2016
Orange County - SAIFI
148.28
134.98
157.56
134.63
120
125
130
135
140
145
150
155
160
2013 2014 2015 2016
Orange County - CAIDI
0.246
0.349
0.2110.190
0
0.05
0.1
0.15
0.2
0.25
0.3
0.35
0.4
2013 2014 2015 2016
Orange County - MAIFI

- 43 -
NUMBER, DATE AND LOCATION OF PLANNED OUTAGES IN EACH DISTRICT (2016)
Planned Outages – 2016
Month Beach Cities Eastern Metro North Coast Northeast Orange County
January 32 67 72 53 127 21
February 42 88 89 53 107 15
March 61 77 86 89 149 27
April 61 58 83 97 161 44 May 68 78 85 98 135 33 June 50 46 93 134 175 37 July 42 38 73 101 116 51
August 53 32 60 104 127 41 September 34 39 84 63 118 32
October 60 46 64 53 122 19
November 55 43 66 54 122 28
December 24 33 65 68 121 17 Totals 582 645 920 967 1580 365
For 2016 there was a total of 5059 planned outages.

- 44 -
SECTION 4 – SERVICE TERRITORY MAP INCLUDING DIVISIONS OF DISTRICTS
MAP OF SERVICE TERRITORY WITH DIVISIONS OF DISTRICTS

- 45 -
SECTION 5 – TOP 1% OF WORST PERFORMING CIRCUITS (WPC) EXCLUDING MED
TOP 1% OF WORST PERFORMING CIRCUITS (2007-2016)
a. Per the Decision, each utility shall include the following information in its annual report for each WPC: 1) Circuit Name; 2) District/Division; 3) Customer Count; 4) Substation name; 5) Circuit-miles; 6) Percentage underground, or “% UG”; 7) Percentage overhead or “% OH”; 8) Number of mainline/feeder/backbone outages resulting in the operation of either a circuit breaker (“CB”) or automatic re-closer (“AR”); and, 9) its preferred reliability metric. As required per the Decision, SDG&E is providing a table of WPCs based on the Circuit SAIDI indices (Table 5.1) and based upon the Circuit SAIFI indices (Table 5.2). Each of these indices is based on a two-year historical period1.
Preferred Metric is Circuit SAIDI
1 As stated in Section 3.2 of D.16-01-008, each utility shall use two or three years of data, at its discretion, to flag a grouping of worst performing circuits.
- 46 -
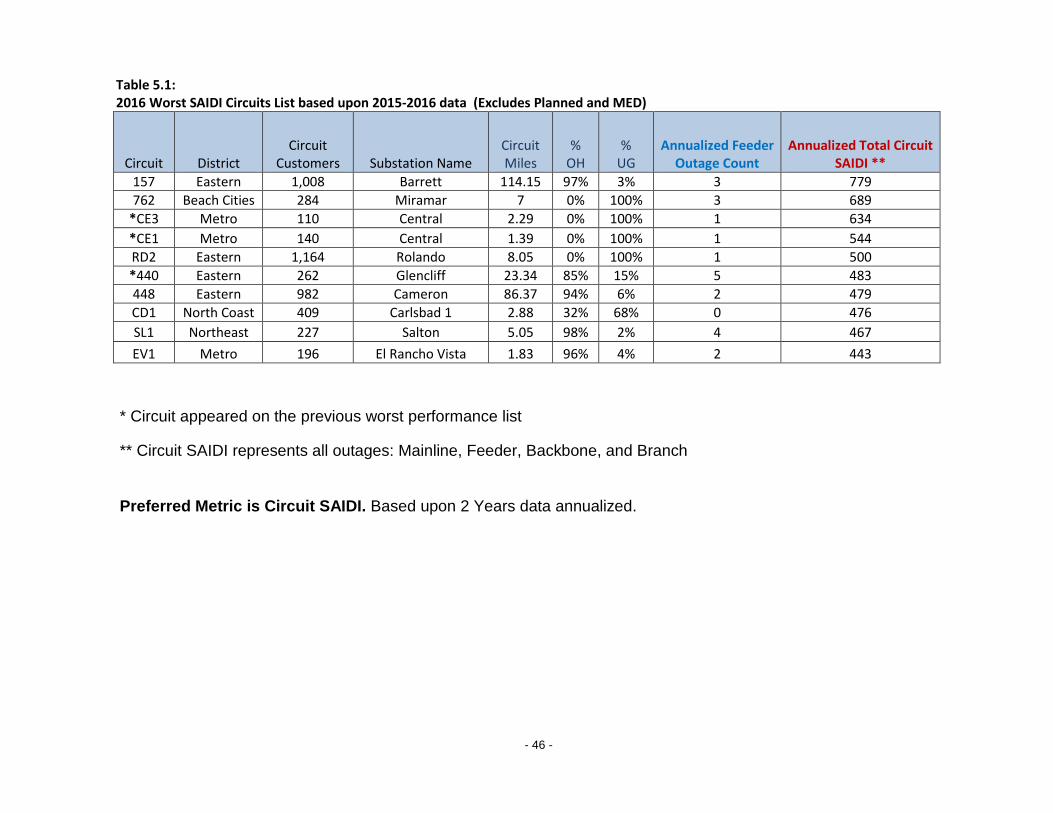
Table 5.1: 2016 Worst SAIDI Circuits List based upon 2015-2016 data (Excludes Planned and MED)
Circuit District Circuit
Customers Substation Name Circuit Miles
% OH
% UG
Annualized Feeder Outage Count
Annualized Total Circuit SAIDI **
157 Eastern 1,008 Barrett 114.15 97% 3% 3 779 762 Beach Cities 284 Miramar 7 0% 100% 3 689
*CE3 Metro 110 Central 2.29 0% 100% 1 634 *CE1 Metro 140 Central 1.39 0% 100% 1 544 RD2 Eastern 1,164 Rolando 8.05 0% 100% 1 500 *440 Eastern 262 Glencliff 23.34 85% 15% 5 483 448 Eastern 982 Cameron 86.37 94% 6% 2 479 CD1 North Coast 409 Carlsbad 1 2.88 32% 68% 0 476 SL1 Northeast 227 Salton 5.05 98% 2% 4 467 EV1 Metro 196 El Rancho Vista 1.83 96% 4% 2 443
* Circuit appeared on the previous worst performance list
** Circuit SAIDI represents all outages: Mainline, Feeder, Backbone, and Branch
Preferred Metric is Circuit SAIDI. Based upon 2 Years data annualized.

- 47 -
Table 5.2: 2016 Worst SAIFI Circuits List based upon 2015-2016 data (Excludes Planned and MED)
Circuit District Circuit
Customers Substation Name Circuit Miles
% OH
% UG
Annualized Feeder Outage Count
Annualized Total Circuit SAIFI **
440 Eastern 262 GLENCLIFF 23.34 85% 15% 5 4.5 MAN1 Northeast 104 MANZANITA 3.98 100% 0% 4 4.5
SL1 Northeast 227 SALTON 5.05 98% 2% 4 4.3 442 Eastern 856 GLENCLIFF 33.05 86% 14% 5 4.2 221 Northeast 1,113 SANTA YSABEL 93.29 94% 6% 5 4.0 OK1 Northeast 152 OAKS 1 8.60 98% 2% 4 3.9 172 Northeast 987 BORREGO 58.40 67% 33% 4 3.8 449 Eastern 621 CAMERON 32.44 96% 4% 5 3.8 170 Northeast 626 BORREGO 52.02 69% 31% 4 3.7
MOR1 Northeast 100 MOORE 4.38 66% 34% 3 3.5
** Circuit SAIFI represents all outages: Mainline, Feeder, Backbone, and Branch
Preferred Metric is Circuit SAIDI. Based upon 2 Years data annualized.

- 48 -
b. Any circuit appearing on this list of “deficient” WPC circuits that also appeared on the previous year's list would be marked by an asterisk. For each asterisked circuit, each utility shall provide the following information:
Circuit CE1
i. An explanation of why it was ranked as a "deficient" circuit, i.e., the value of the metric used to indicate its performance;
CE1 was listed as a worst circuit due to circuit SAIDI performance.
ii. A historical record of the metric; CE1: 2 Year Circuit SAIDI Data
Year 2015 2016 Circuit SAIDI 1089 0
Note: See methodology in section 5d
iii. An explanation of why it was on the deficiency list again;
Circuit CE1 is identified as a WPC in the 2016 Electric Reliability Report primarily due to having experienced two related outages in 20152, both of which are under the same outage cause description (see table below). The outages were caused by a fault on an underground cable section of this circuit and restoration of service was delayed due to SDG&E personnel requiring special protocols to access “Do Not Operate Energized” classified equipment.
Outage ID Cause Description Cause Category Start
Date Start Time
Affected Device Type
Sustained Customer
Impact
Circuit SAIDI
Circuit SAIFI
System SAIDI
System SAIFI
150605E70807 Faulted cable Equipment 6/5/2015 17:10 UG CABLE 145 1082 0.9797 0.112 0.0001
150605E70807 Faulted cable Equipment 6/6/2015 17:42 UG CABLE 145 7 0.9797 0.001 0.0001
iv. An explanation of what is being done to improve the circuit's future performance and the anticipated timeline for completing those activities (or an explanation why remediation is not being planned); and
2 Because WPCs are determined based on a SAIDI value that is calculated using two cumulative years of outage data, outages that may have been the primary reason for a circuit being classified as a WPC in the previous year’s Reliability Report may continue to be the primary reason for that same circuit being classified as a WPC in the current year’s Reliability Report.
- 49 -
SDG&E has identified a solution to improve the performance of circuit CE1; however, that solution involves replacing/repairing equipment that is classified as “Do Not Operate Energized.” Replacing this switch restores sectionalizing capability on this circuit and will minimize customer impact should further equipment failures occur. The replacement identified, requires special modifications to existing manhole infrastructure due to the vintage of the underground facilities on this circuit. SDG&E’s personnel are coordinating efforts to perform this enhancements and project completion is scheduled by Q1 2018.
v. A quantitative description of the utility's expectation for that circuit's future
performance.
Based on calculations performed on the reliability enhancements, the customers would see a circuit SAIDI enhancement of approximately 7.3 minutes and a circuit SAIFI benefit of 0.0810 per year.

- 50 -
Circuit CE3
i. An explanation of why it was ranked as a "deficient" circuit, i.e., the value of the metric used to indicate its performance; CE3 was listed as a worst circuit due to circuit SAIDI performance.
ii. A historical record of the metric;
CE3: 2 Year Circuit SAIDI Data Year 2015 2016
Circuit SAIDI 1269 0
Note: See methodology in section 5d
iii. An explanation of why it was on the deficiency list again; Circuit CE3 is identified as a WPC in the 2016 Electric Reliability Report primarily due to two significant outages that occurred in 20153.
Outage ID Cause Description Cause Category Start
Date Start Time
Affected Device Type
Sustained Customer
Impact
Circuit SAIDI
Circuit SAIFI
System SAIDI
System SAIFI
15060E70807 Faulted cable Equipment 6/5/2015 11:14 UG CABLE 135 1263 0.9247 0.129 0.0001
150608E70959 Transformer Equipment 6/8/2015 16:59 Transformer 3 6 0.0205 0.001 0.0000
iv. An explanation of what is being done to improve the circuit's future
performance and the anticipated timeline for completing those activities (or an explanation why remediation is not being planned); and SDG&E has identified a solution to improve the performance of circuit CE3; however, that solution involves replacing/repairing equipment classified as Do Not Operate Energized. SDG&E personnel are coordinating efforts to schedule this project in conjunction with the switch replacement project related to circuit CE1. The solution also involves replacing leaking and unjacketed cable.
v. A quantitative description of the utility's expectation for that circuit's future performance.
Based on calculations performed on the reliability enhancements, the customers would see a circuit SAIDI enhancement of approximately 66.51 minutes and a circuit SAIFI benefit of 0.6784 per year.
3 See footnote 2.

- 51 -
Circuit 440
i. An explanation of why it was ranked as a "deficient" circuit, i.e., the value of the metric used to indicate its performance;
C440 was listed as a worst circuit due to circuit SAIDI performance.
ii. A historical record of the metric;
C440: 2 Year Circuit SAIDI Data
Year 2015 2016 Circuit SAIDI 318 648
Note: See methodology in section 5d
iii. An explanation of why it was on the deficiency list again;
Circuit 440 is identified as a WPC in the 2016 Electric Reliability Report primarily due to several large sustained outages caused during severe weather events in 2016. The outages were related to the operation of field switches and a flashover at the substation caused by severe weather.
iv. An explanation of what is being done to improve the circuit's future
performance and the anticipated timeline for completing those activities (or an explanation why remediation is not being planned); and
As mentioned in the 2015 Reliability Report, circuit 440 is located in the Cleveland National Forrest (CNF) in San Diego County. SDG&E received approval from CPUC in 2015 to proceed with CNF Master Special Use Project. As part of this project, circuit 440 will undergo hardening in the next several years including undergrounding a portion of this circuit.
v. A quantitative description of the utility's expectation for that circuit's future
performance.
Based on calculations performed on the reliability enhancements, the customers would see a circuit SAIDI enhancement of approximately 190 minutes and a circuit SAIFI benefit of 1.34 per year.

- 52 -
c. Language to explain how the IOUs’ include a cost effectiveness review as part of their respective internal review processes for circuit remediation projects.
i. Definitions of terms, acronyms, limitations, and assumptions;
Definitions:
RAT - Reliability Assessment Team
WPC- Worst Performing Circuits
Assumptions
Our analysis excludes planned outages, TMED outages, and circuits with less than 100 customers for WPC calculation.
ii. A clear explanation of the utility’s process to determine the worst performing circuits:
Methodology used in the Annual Reliability Report The Worst Performing Circuits identified in this Report are determined by first calculating the SAIDI for each circuit based upon the previous two years of unplanned outage data, ranking those circuits highest to lowest based upon the SAIDI value, and then selecting the 1% of the circuits with the highest SAIDI value. Planned and TMED events are excluded, and circuits with less than 100 customers are also excluded. SDG&E had 1032 circuits in 2016, so this report reflects the ten WPCs.

- 53 -
iii. A clear explanation of the utility’s process to determine cost-effective remediation projects. This shall include why the utility may decide to implement a project to address one worst performing circuit issue while deciding to not implement a project to address a different worst performing circuit.
SDG&E established an internal Reliability Assessment Team (RAT) in 1997 with the charge to identify ways to improve the service reliability of our distribution system. This team is comprised of technical leaders from Distribution Operations, Engineering Standards, Regional Operations, System Protection, and Distribution Asset Management. The Reliability Assessment Team meets regularly to evaluate and authorize reliability improvement projects for areas with low circuit reliability and where customer satisfaction issues arise. The team provides strategy and guidance for continuous improvements to system reliability, integrated planning support, and budget management.
District engineers present proposals for reliability improvement projects along with a circuit analysis, cost-benefit analysis, and details on customer impact. SDG&E has implemented a practice to identify projects to be reviewed and approved by an engineering committee, and then prioritized based on the largest benefit to cost ratio to ensure the projects that create the largest proportional system benefit are realized first. In 2016, the Reliability Assessment Team approved a number of circuit improvement projects in addition to monitoring budgets, reviewing new equipment and assisting various work groups with operational issues. Ongoing RAT initiatives include:
• Improvements to worst performing circuits • Reduction in the number of customers between sectionalizing devices • SCADA Initiative for 12 kV circuits • Utilization of Branch Analysis Model and Circuit Reliability Analysis Model
The Reliability Assessment Team continues to coordinate activities with the Electric Risk Analysis team, a cross-functional team responsible for reducing risk and improving reliability in the service territory’s rural areas.

- 54 -
SECTION 6 – TOP 10 MAJOR UNPLANNED POWER OUTAGE EVENTS WITHIN A REPORTING YEAR
TOP 10 MAJOR UNPLANNED OUTAGE EVENTS (2016)
The table below captures the top 10 major unplanned outage events for 2016 including the cause and the location of the outage.
Top 10 Major Unplanned Power Outage Events
Rank Outage Date Cause Location Customer Impact SAIDI SAIFI
1 1/31/2016 1/31 - 2/1 El Nino Storm BC, CM, EA, NC, NE, OC 86963 13.35 0.061 2 7/21/2016 Mylar Balloon CM 17896 1.15 0.012 3 1/5/2016 1/5 - 1/7 El Nino Storm BC, CM, EA, NC, NE, OC 16236 0.80 0.011 4 4/3/2016 Foreign object in line EA 14630 0.61 0.010 5 3/28/2016 Crew error EA 12702 0.10 0.009 6 8/31/2016 Faulted portable cables EA 12170 0.37 0.008 7 9/21/2016 Damaged capacitor bank CM 11274 0.50 0.008 8 5/13/2016 Faulted disconnect BC 10568 0.23 0.007 9 7/9/2016 Circuit Failure EA 8645 0.40 0.006
10 11/15/2016 Tee Failure CM 7253 0.37 0.005
Based on customer impact
- 55 -
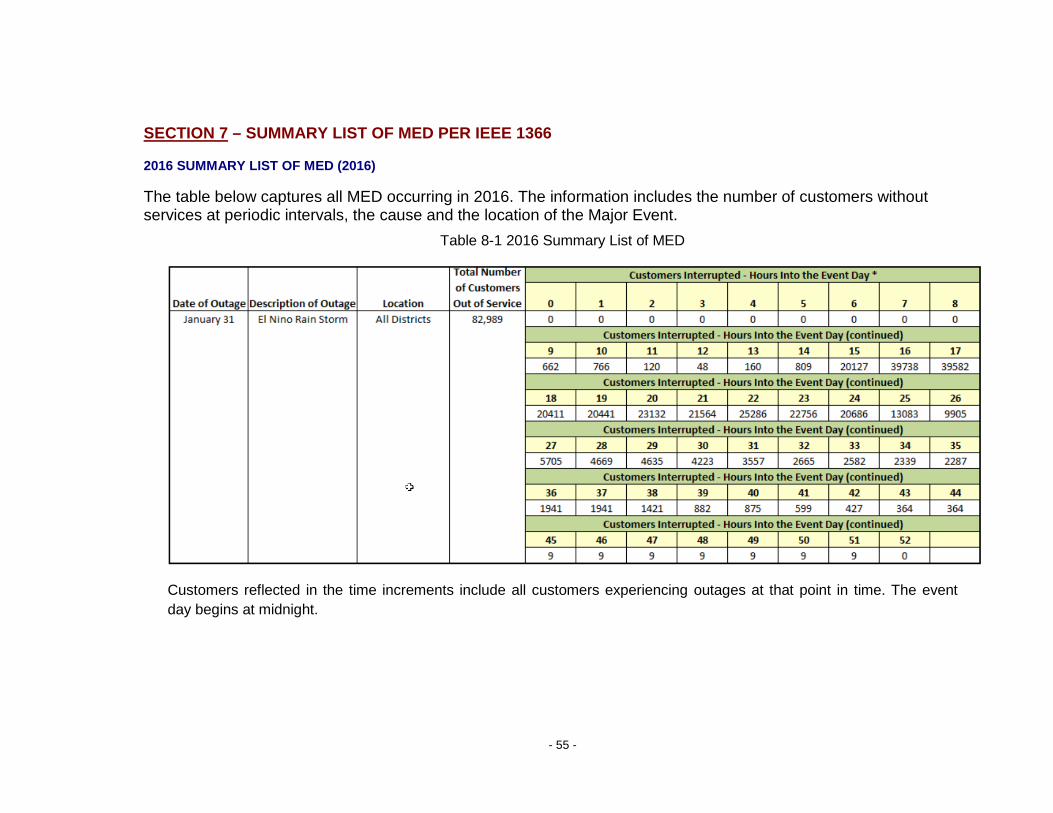
SECTION 7 – SUMMARY LIST OF MED PER IEEE 1366
2016 SUMMARY LIST OF MED (2016)
The table below captures all MED occurring in 2016. The information includes the number of customers without services at periodic intervals, the cause and the location of the Major Event.
Table 8-1 2016 Summary List of MED
Customers reflected in the time increments include all customers experiencing outages at that point in time. The event day begins at midnight.

- 56 -
SECTION 8 – HISTORICAL 10 LARGEST UNPLANNED OUTAGES EVENTS FOR THE PAST 10 YEARS
HISTORICAL LARGEST UNPLANNED OUTAGE EVENTS (2007-2016) The tables below capture the ten largest unplanned outage events for each of the years from 2016 – 2007
2016
Historical 10 Largest Unplanned Outage Events Rank Date SAIDI SAIFI Description
1 1/31/2016 13.35 0.061 1/31-2/1 El Niño Storm 2 7/21/2016 1.15 0.012 Station F – Mylar Balloon on Circuit 366 3 1/31/2016 0.99 0.003 Circuit 486 – Tree in primary 4 8/9/2016 0.93 0.002 Genesee Sub – Circuits 268 & 65 5 7/26/2016 0.88 0.002 Circuit 582 – Wire Down, faulted cable, blown switch 6 6/19/2016 0.87 0.001 Border Fire – Circuits 448 & 157 7 8/23/2016 0.84 0.003 Transmission Lines 6926 & 681 – car contact 8 11/12/2016 0.83 0.001 Circuit 198 – Pendleton Aircraft Contact 9 1/5/2016 0.80 0.011 El Niño Storm – 1/5-1/7
10 6/26/2016 0.77 0.001 Circuit RD@ - Vehicle contact w/ Trayer switch

- 57 -
2015
Historical 10 Largest Unplanned Outage Events Rank Date SAIDI SAIFI Description
1 9/20/2015 5.15 0.089 9/20 Load Curtailment 2 7/18/2015 2.26 0.016 July 18-20 Rain Storm 3 11/25/2015 1.75 0.010 Transmission Lines 641 & 642 - Montgomery Sub Outage 4 7/3/2015 1.00 0.006 Circuits 366 & BRM1 Outage 5 8/13/2015 0.67 0.001 Circuit 438 - Faulted Tee 6 4/18/2015 0.64 0.002 Circuit 821 - Tee Failure 7 9/15/2015 0.60 0.006 Circuits 1049 & 167 - Car contact w/ fuse cab 8 9/12/2015 0.59 0.003 Circuit 255 - Wire Down 9 9/9/2015 0.49 0.004 Circuit 287 - Blowing tees
10 5/12/2015 0.47 0.003 Circuit 952 - Vehicle Contact

- 58 -
2014
Historical 10 Largest Unplanned Outage Events Rank Date SAIDI SAIFI Description
1 5/13/2014 9.73 0.036 May 13 through May 18 Wind and Fire Storm
2 9/14/2014 5.30 0.018 September 14 through September 17 Heat/Rain Storm
3 4/29/2014 3.59 0.014 April 29 through May 1 Wind Storm 4 11/15/2014 2.16 0.033 Station F Substation Outage - Bank 30, 31 & 32 5 2/28/2014 1.23 0.008 February 28, 2014 Rain Storm 6 5/31/2014 0.95 0.004 Circuits 792 & 795 Exceeding 500,000 Customer Minutes 7 6/15/2014 0.90 0.004 Circuits 545 and BP1 Exceeding 500,000 Customer Minutes 8 3/9/2014 0.80 0.004 Circuit 460 Exceeding 500,000 Customer Minutes 9 11/22/2014 0.68 0.003 Circuits 362 - Cable Failure
10 1/12/2014 0.66 0.003 Circuit 163 - Exceeding 500,000 Customer Minutes

- 59 -
2013
Historical 10 Largest Unplanned Outage Events Rank Date SAIDI SAIFI Description
1 7/18/2013 14.85 0.087 Orange County Transmission Outage
2 9/3/2013 3.26 0.018 Heat and Rain Storm - Sept 3 through Sept 8
3 4/8/2013 1.76 0.002 Transmission Line 687 - De-energized for safety, poles down 4 12/26/2013 1.11 0.006 Circuits 1435, 363, & GH2 - Contractor Error/Label Error 5 6/4/2013 0.78 0.002 Transmission Line 687 Borrego Substation Outage 6 12/3/2013 0.69 0.003 Circuit 166 - Exceeding 500,000 Customer Minutes 7 11/7/2013 0.60 0.005 Circuits 209 & 205 - Exceeding 500,000 Customer Minutes 8 1/7/2013 0.57 0.001 Circuits 368 & 431 - Exceeding 500,000 Customer Minutes 9 1/10/2013 0.56 0.003 Circuits 792 & SE4- Exceeding 500,000 Customer Minutes
10 3/12/2013 0.51 0.001 Circuits 715 & 706 - Damaged Tee's and Low Gas

- 60 -
2012
Historical 10 Largest Unplanned Outage Events Rank Date SAIDI SAIFI Description
1 9/9/2012 1.64 0.019 September 9th - Storm
2 6/23/2012 1.48 0.003 Circuits 166 & 397 Exceeding 500,000 Customer Minutes
3 7/12/2012 1.45 0.014 Circuit 329 - San Mateo Substation Outage 4 5/28/2012 1.27 0.002 Circuit 166 - Outage Exceeding 500,000 Customer Minutes 5 5/6/2012 0.79 0.003 Circuit 323 - Outage Exceeding 500,000 customer minutes 6 2/27/2012 0.76 0.004 February 27 - Storm 7 4/28/2012 0.67 0.002 Circuit 582 - Outage Exceeding 500,000 customer minutes 8 3/26/2012 0.64 0.003 Point Loma Substation Bank 10 Outage 9 8/12/2012 0.63 0.003 Circuit 57 - Outage Exceeding 500,000 customer minutes
10 3/17/2012 0.62 0.004 March 17 - Storm

- 61 -
2011
Historical 10 Largest Unplanned Outage Events Rank Date SAIDI SAIFI Description
1 9/8/2011 513.4 0.999 Pacific Southwest Electrical Outage
2 6/28/2011 1.52 0.004 Circuits 486 & 487 - Multiple 12kV Outage
3 10/16/2011 0.68 0.002 Circuit 81 - Outage Exceeding 500,000 customer minutes 4 3/15/2011 0.64 0.004 Circuit 497 - Outage Exceeding 500,000 customer minutes 5 8/4/2011 0.57 0.004 Circuit 497 - Outage Exceeding 500,000 customer minutes 6 8/28/2011 0.51 0.003 August 28 - Storm 7 10/22/2011 0.48 0.004 Circuit 152 - Outage Exceeding 500,000 customer minutes 8 12/23/2011 0.45 0.001 Circuit 243 - Outage Exceeding 500,000 customer minutes 9 6/29/2011 0.44 0.002 Circuit 38 - Outage Exceeding 500,000 customer minutes
10 11/4/2011 0.43 0.006 Capistrano Substation Outage

- 62 -
2010
Historical 10 Largest Unplanned Outage Events Rank Date SAIDI SAIFI Description
1 1/18/2010 12.61 0.085 January 18 - Heavy Rain Storm - CPUC Event
2 12/20/2010 4.93 0.023 December 20 - Heavy Rain Storm - CPUC Event
3 4/1/2010 4.40 0.211 Load Curtailment 4 9/30/2010 2.88 0.036 September 30 - Heavy Rain Storm 5 1/5/2010 1.57 0.004 Circuits 703 & 1297 - Multiple 12kV Outage 6 9/26/2010 1.42 0.010 September 26 - Heat Storm 7 9/30/2010 1.34 0.004 Circuits 900 & 904 - Multiple 12kV Outage 8 10/21/2010 1.33 0.002 Circuits 222, 221 & 79 - Outage over 500,000 customer min 9 4/4/2010 1.22 0.003 Circuits 794, 170 & SW2 - Earthquake w/over customer 500,000 Min
10 10/19/2010 1.12 0.014 October 19 - Heavy Rain and Lightning Storm
- 63 -
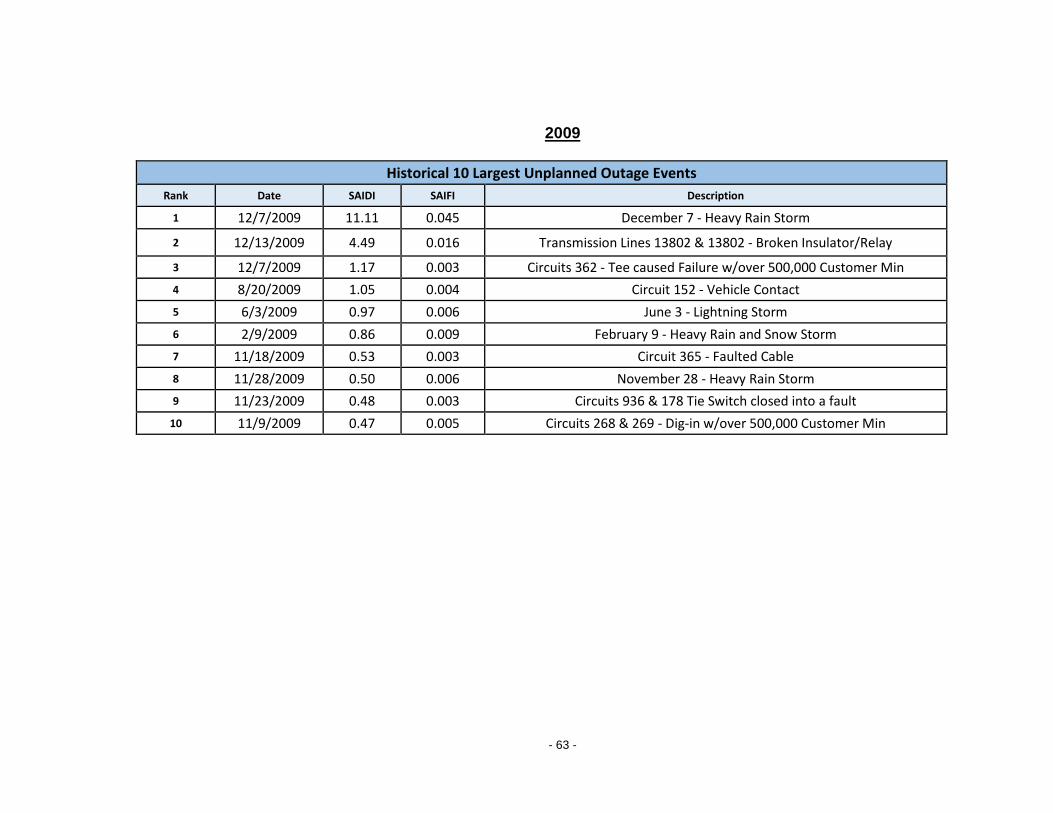
2009
Historical 10 Largest Unplanned Outage Events Rank Date SAIDI SAIFI Description
1 12/7/2009 11.11 0.045 December 7 - Heavy Rain Storm
2 12/13/2009 4.49 0.016 Transmission Lines 13802 & 13802 - Broken Insulator/Relay
3 12/7/2009 1.17 0.003 Circuits 362 - Tee caused Failure w/over 500,000 Customer Min 4 8/20/2009 1.05 0.004 Circuit 152 - Vehicle Contact 5 6/3/2009 0.97 0.006 June 3 - Lightning Storm 6 2/9/2009 0.86 0.009 February 9 - Heavy Rain and Snow Storm 7 11/18/2009 0.53 0.003 Circuit 365 - Faulted Cable 8 11/28/2009 0.50 0.006 November 28 - Heavy Rain Storm 9 11/23/2009 0.48 0.003 Circuits 936 & 178 Tie Switch closed into a fault
10 11/9/2009 0.47 0.005 Circuits 268 & 269 - Dig-in w/over 500,000 Customer Min

- 64 -
2008
Historical 10 Largest Unplanned Outage Events Rank Date SAIDI SAIFI Description
1 12/17/2008 3.51 0.010 December 17 - Heavy Rain and Snow Storm Part II
2 1/5/2008 1.33 0.011 January '08 Rain & Lightning Storm -Multiple Areas
3 12/15/2008 1.02 0.006 December 15 - Heavy Rain and Snow Storm 4 5/31/2008 0.92 0.003 Circuits 138 & HC3 Tree Contact (also affecting Circuit 139 & 4kVs) 5 10/19/2008 0.91 0.001 Circuit 213 - Damaged UG Cable 6 6/22/2008 0.67 0.002 Circuit 990 - Faulted Terminator 7 4/8/2008 0.61 0.003 Circuit 486 - Motor Vehicle Contact, Terminator, Cable Repair 8 12/25/2008 0.58 0.004 Circuits 286 & EN2- Multiple Circuits affected during Restoration 9 5/23/2008 0.56 0.002 Circuit 159 - Pothead Failure
10 9/24/2008 0.56 0.004 Bank 20 WA3, WA4, WA5 and WA6 - Bad Relay

- 65 -
2007
Historical 10 Largest Unplanned Outage Events Rank Date SAIDI SAIFI Description
1 10/21/2007 128.42 0.055 Firestorm 2007 - October - CPUC Event
2 9/1/2007 1.59 0.01 HEATWAVE 2007 (Labor Day Weekend)
3 10/22/2007 1.18 0.051 Load Curtailment during Firestorm'07 4 6/4/2007 1.15 0.016 Laguna Niguel Outages - Faulted Circuit Breaker impacted Bus 5 8/30/2007 1.09 0.003 Transmission Lines 629 & 6946 Lightning Contact on Switch 629-8 6 7/28/2007 1.01 0.002 Circuit 582 Cable Failure 7 10/11/2007 0.8 0.017 Bank 42 Paradise Substation 8 9/15/2007 0.77 0.000 Circuit 221 Pine Valley Fire - Red Flag - In Progress 9 1/12/2007 0.66 0.003 Circuits WA3, WA4, and UP1 Wire Down
10 12/25/2007 0.57 0.001 Circuit EOS2 Outage - Connector Failure

- 66 -
SECTION 9 – NUMBER OF CUSTOMER INQUIRIES ON RELIABILITY DATA AND THE NUMBER OF DAYS PER RESPONSE
CUSTOMER INQUIRIES ON RELIABILITY DATA (2016) The table below contains SDG&E’s response time for each customer reliability inquiry received in 2016.
2016 Customer Reliability Inquiry Responses
Date of Request Customer Customer Type Date Fulfilled
10/26/2016 Rady Children’s Hospital Commercial 11/10/2016