Energy Costs of Singular and Concomitant Pressure and Volume Overload Lesions
10
Energy Costs of Singular and Concomitant Pressure and Volume Overload Lesions CANEK PHILLIPS, 1 RACHAEL L. SIMON-WALKER, 1 and LAKSHMI PRASAD DASI 1,2 1 Department of Mechanical Engineering, Colorado State University, Fort Collins, CO, USA; and 2 School of Biomedical Engineering, Colorado State University, Room A103D Engineering, 1374 Campus Delivery, Fort Collins, CO 80523-1374, USA (Received 18 August 2013; accepted 26 December 2013; published online 4 January 2014) Associate Editor Ajit P. Yoganathan oversaw the review of this article. Abstract—Severity assessment in concomitant hypertension (HT) and heart valve disease or multiple heart valve disease is vague, and there exists no established severity index. The objective of this study is to propose a theoretical framework to utilize the ventricular power overhead rates of HT, aortic regurgitation (AR), aortic stenosis (AS), and mitral regur- gitation (MR) as a new means to assess severity, particu- larly under concomitant conditions. A lumped parameter model was utilized to evaluate the ventricular energy budget under normal, singular, and concomitant combinations of HT, AS, AR, and MR; and calculate energy overhead rate defined as the % increase in ventricular power output. Disease severity for each lesion was modeled at mild, moderate, and severe levels per AHA/ACC guidelines. The overhead rate for HT and AS were 15% (mild), 25% (moderate), and 45% (severe); AR and MR corresponded to 40% (moderate) and 100% (severe). The overhead rate as a function of regurgitant fraction was shown to be highly nonlinear. The overhead rate for concomitant lesions were 39% (mild HT+mild AS), 51% (mild HT+mild AR), 46% (mild HT+mild MR), 51% (mild AS+mild AR), 37% (mild AS+mild MR), and 44% (mild AR+mild MR). Power overhead under volume overload increases nonlin- early while that for pressure overload is linear. Concomitant lesions involving pressure (and volume?) overload produce a net overhead rate greater than the sum of individual lesions. Synergy in overhead rates is most with the presence of uncontrolled HT. Keywords—Energetics, Severity, Aortic stenosis, Mitral regurgitation, Hypertension, Lumped parameter model. INTRODUCTION Load induced congestive heart failure is the terminal condition secondary to chronic pressure or volume overload lesions. Specific examples of such left-sided conditions include hypertension (HT), aortic stenosis (AS), aortic regurgitation (AR), and mitral regurgita- tion (MR). Clinical guidelines have been long estab- lished to define severity for each disease and suggest treatment/management options. 2 These severity guide- lines classify each of these lesions into mild, moderate, and severe categories cbased on patient symptoms and clinical outcome. A summary of the disease severity for each scenario collected from ACC/AHA guidelines 2 as well as the HHS department is presented in Table 1. While singular pressure or volume overloading con- ditions are reasonably addressed by current guidelines, defining severity under multiple load-generating afflic- tions has been a challenge. 2 This has been primarily attributed to (1) the mechanistic differences between diverse diseases; (2) exacerbation of the manifestation of the dominant lesion by its ancillary afflictions; and (3) variance in the measures defining individual severity, e.g., pressure gradient vs. regurgitant fraction in the comparison of valvular stenosis and incompetence. Current literature points to a marked increase in mor- tality and morbidity for patients with concomitant dis- ease, 10 and argues for more aggressive approaches to preserve ventricular function. 4,12 The field of cardiac energetics has made significant progress in describing the integrative physiology of the heart and its mechanical connection to the systemic cir- culation. Fundamental to its precepts is the well-estab- lished knowledge that both pressure and volume overload increase the amount of work done by the ventricle over each heartbeat. This increase in work is a result of inherent physiological feedback mechanisms at play Address correspondence to Lakshmi Prasad Dasi, School of Biomedical Engineering, Colorado State University, Room A103D Engineering, 1374 Campus Delivery, Fort Collins, CO 80523-1374, USA. Electronic mail: [email protected] Cardiovascular Engineering and Technology, Vol. 5, No. 1, March 2014 (Ó 2014) pp. 44–53 DOI: 10.1007/s13239-013-0173-3 1869-408X/14/0300-0044/0 Ó 2014 Biomedical Engineering Society 44
-
Upload
lakshmi-prasad -
Category
Documents
-
view
214 -
download
0
Transcript of Energy Costs of Singular and Concomitant Pressure and Volume Overload Lesions
Energy Costs of Singular and Concomitant Pressure and Volume
Overload Lesions
CANEK PHILLIPS,1 RACHAEL L. SIMON-WALKER,1 and LAKSHMI PRASAD DASI1,2
1Department of Mechanical Engineering, Colorado State University, Fort Collins, CO, USA; and 2School of BiomedicalEngineering, Colorado State University, Room A103D Engineering, 1374 Campus Delivery, Fort Collins, CO 80523-1374, USA
(Received 18 August 2013; accepted 26 December 2013; published online 4 January 2014)
Associate Editor Ajit P. Yoganathan oversaw the review of this article.
Abstract—Severity assessment in concomitant hypertension(HT) and heart valve disease or multiple heart valve diseaseis vague, and there exists no established severity index. Theobjective of this study is to propose a theoretical frameworkto utilize the ventricular power overhead rates of HT, aorticregurgitation (AR), aortic stenosis (AS), and mitral regur-gitation (MR) as a new means to assess severity, particu-larly under concomitant conditions. A lumped parametermodel was utilized to evaluate the ventricular energy budgetunder normal, singular, and concomitant combinations ofHT, AS, AR, and MR; and calculate energy overhead ratedefined as the % increase in ventricular power output.Disease severity for each lesion was modeled at mild,moderate, and severe levels per AHA/ACC guidelines. Theoverhead rate for HT and AS were 15% (mild), 25%(moderate), and 45% (severe); AR and MR correspondedto 40% (moderate) and 100% (severe). The overhead rateas a function of regurgitant fraction was shown to be highlynonlinear. The overhead rate for concomitant lesions were39% (mild HT+mild AS), 51% (mild HT+mild AR), 46%(mild HT+mild MR), 51% (mild AS+mild AR), 37%(mild AS+mild MR), and 44% (mild AR+mild MR).Power overhead under volume overload increases nonlin-early while that for pressure overload is linear. Concomitantlesions involving pressure (and volume?) overload produce anet overhead rate greater than the sum of individual lesions.Synergy in overhead rates is most with the presence ofuncontrolled HT.
Keywords—Energetics, Severity, Aortic stenosis, Mitral
regurgitation, Hypertension, Lumped parameter model.
INTRODUCTION
Load induced congestive heart failure is the terminalcondition secondary to chronic pressure or volumeoverload lesions. Specific examples of such left-sidedconditions include hypertension (HT), aortic stenosis(AS), aortic regurgitation (AR), and mitral regurgita-tion (MR). Clinical guidelines have been long estab-lished to define severity for each disease and suggesttreatment/management options.2 These severity guide-lines classify each of these lesions into mild, moderate,and severe categories cbased on patient symptoms andclinical outcome. A summary of the disease severity foreach scenario collected from ACC/AHA guidelines2 aswell as the HHS department is presented in Table 1.
While singular pressure or volume overloading con-ditions are reasonably addressed by current guidelines,defining severity under multiple load-generating afflic-tions has been a challenge.2 This has been primarilyattributed to (1) the mechanistic differences betweendiverse diseases; (2) exacerbation of themanifestation ofthe dominant lesion by its ancillary afflictions; and (3)variance in the measures defining individual severity,e.g., pressure gradient vs. regurgitant fraction in thecomparison of valvular stenosis and incompetence.Current literature points to a marked increase in mor-tality and morbidity for patients with concomitant dis-ease,10 and argues for more aggressive approaches topreserve ventricular function.4,12
The field of cardiac energetics has made significantprogress in describing the integrative physiology of theheart and its mechanical connection to the systemic cir-culation. Fundamental to its precepts is the well-estab-lishedknowledge thatbothpressureandvolumeoverloadincrease the amount of work done by the ventricle overeach heartbeat. This increase in work is a result ofinherent physiological feedback mechanisms at play
Address correspondence to Lakshmi Prasad Dasi, School of
Biomedical Engineering, Colorado State University, Room A103D
Engineering, 1374 Campus Delivery, Fort Collins, CO 80523-1374,
USA. Electronic mail: [email protected]
Cardiovascular Engineering and Technology, Vol. 5, No. 1, March 2014 (� 2014) pp. 44–53
DOI: 10.1007/s13239-013-0173-3
1869-408X/14/0300-0044/0 � 2014 Biomedical Engineering Society
44

which ensure that the cardiac output is not compromisedas a result of afflictions upon the main source ofmechanical energy in the circulatory system.
The motivation for this study is the question: doesthe additional ventricular workload corresponding tosingular cases of HT, AS, AR, and MR universallycorrelate to clinically established levels of mild, mod-erate and severe (Table 1)? If currently establishedseverity levels correlate to a universal scale of work-load, it can be argued that energy or power outputrequirements of the ventricle can help unify severityassessment between single and multiple load-generat-ing diseases. Already, single lesion severity based onenergy or power expenditure has recently emerged asthe basis to form indices having greater superiorityat predicting clinical outcome in patients than theclassical measure defined in the current guidelines.5,6
Further, recently published work underscores theimportance of developing a holistic approach towardsassessing disease severity.9
The specific objectives of this paper is to (a) quantifyand characterize the additional power (in Watts) as an
overhead cost, that the ventricle needs to output to suc-cessfully counteract single and multiple left sided load-generating lesions in order to maintain the cardiac out-put. To the best of our knowledge, the relative energycosts of HT, AS, AR, and MR with respect to theirclinical severity has not been quantified to date; (b)quantify any synergistic energetic interaction in con-comitant scenarios ofHT,AS,AR, andMR.Existence ofsynergistic interactions, are significant in the context ofseverity assessment under concomitant scenarios. Fi-nally, (c) we address the motivating question, do work-loads correlate universally for the case of singular lesions?
MATERIALS AND METHODS
To quantify overhead costs in units of power forsingular and multiple pressure and volume overloadinglesions we use a simulation approach utilizing alumped parameter model of the left heart and thesystemic circulation. Briefly, the lumped parametermodel consists of the left ventricle that outputs pre-determined (i.e., prescribed) physiological aortic andmitral flow waveforms. Note that this is in contrast tomodeling the ventricle as a time-dependent elastancechamber (e.g., Refs. 1,7,11). Modeling ventricular flowoutput with prescribed waveforms helps directly cal-culate the power requirements without the need forphysiological modeling of ventricular remodeling. Theflow waveforms were parameterized such that a well-defined singular or combined aortic/mitral valve dis-ease may be imposed in a given simulation. The sys-temic vascular resistance and compliance of thesystemic circuit was parameterized to impose a well-defined state of HT. The lumped parameter simulationthen solves for the pressures developed in the ventricleand throughout the systemic circuit. Power output ofthe ventricle under normal and single/multiple diseasestates is computed through pressure–volume integra-tion. These power requirements are normalized withrespect to baseline ventricular power output (no lesioncase) to yield overhead rates of different singular andmultiple diseases above the baseline power output.
Lumped Parameter Model
A schematic of the developed lumped parametermodel of the left heart coupled to the systemic circu-lation is displayed in Fig. 1. The model is representedas a closed circuit driven by two current sources withinthe left-heart, representing the mitral and aortic flowwaveforms. The output is coupled to the systemic cir-cuit which consists of blocks representing the systemicaortic sinus (SAS), systemic arteries (SAT), systemicarteriole (SAR), systemic capillaries (SCP), and the
TABLE 1. Classifications for various pressure and volumeoverload lesions.
SBP (mmHg) DBP (mmHg)
Hypertension
Mild 120–139 80–89
Moderate 140–159 90–99
Severe ‡160 ‡100
Source: US Dept of Health and Human Services
Regurgitant fraction
Mitral regurgitation
Mild <30%
Moderate 30% < RF < 49%
Severe ‡50%
Source: ACC/AHA 2006 Pocket Guideline
Regurgitant fraction
Aortic regurgitation
Mild <30%
Moderate 30% < RF < 49%
Severe ‡50%
Source: ACC/AHA 2006 Pocket Guideline
Mean Plv � Psas
Aortic stenosis
Mild <25 mmHg
Moderate 25 mmHg < dP
< 40 mmHg
Severe ‡40 mmHg
Source: ACC/AHA 2006 Pocket Guideline
SBP systolic blood pressure, DBP diastolic blood pressure, RF
regurgitant fraction.
Energy Costs of Singular and Concomitant Pressure 45

systemic vein (SVN). Each block within the systemiccircuit is associated resistance (R), inductance (L), andcapacitance (C).
The system of governing equations for the circuit isoutlined below. The left ventricular volume, Vlv
changes with time governed by the difference betweenthe mitral and aortic flow rates:
dVlv
dt¼ Qmi �Qao; ð1Þ
where Qmi and Qao denote the instantaneous mitraland aortic flow rate and are prescribed (later de-scribed). Systolic left ventricular pressure during for-ward flow through the aortic valve is determined basedon SAS pressure, Psas, resistance of the aortic valvegoverned by the valve resistance coefficient CQao andinductance of the mass of blood between the ventricleand the aortic sinus, Lao
Plv ¼ Psas þ LaodQao
dtþQao Qaoj j
C2Qao
ð2Þ
The instantaneous ventricular systolic power outputcan be derived using the following equation:
_WlvðtÞ ¼ PlvdVlv
dt; ð3Þ
where _WlvðtÞ is instantaneous power output.The above equations are coupled to those that govern
the systemic circuit. The systemic circuit is identical tothat described in the study ofKorakianitis and Shi.7 Thesame parameter values as7 was utilized to provide rep-resentative physiological waveforms for pressures andflow in the various blocks depicted in Fig. 1.
Parametric Aortic and Mitral Valve Flow
As described earlier, the lumped parameter model isdriven by prescribed aortic and mitral flow waveforms.
The waveforms were encoded as spline curves satisfy-ing certain set physiological criteria for any prescribedlevel of regurgitation. A schematic of the waveformswith the relevant parameters is shown in Fig. 2. Forthe aortic flow curve, four parameters were used todefine the shape of the curve. These include, the sys-tolic fraction SF, the peak backflow Avpbf, the closingvolume duration fraction Avcvd, and the aortic valveconstant backflow (regurgitation flow) denoted Avbf.The waveform shape is fully defined by adding onecontrol point to define the peak aortic flow. Themagnitude of the peak is determined such that thecardiac output (average of the flow waveform) is pre-scribed. The entire waveform was generated by fitting aspline through the control points defined by theparameters. In this study, the parameters that werevaried to simulate varying degrees of AR correspondto Avpbf and Avbf. Both SF and Avcvd were fixedthroughout the study at the nominal physiologicalvalues of approximately one-thirds and one-twelfths.3
The mitral valve flow waveform is defined in asimilar manner. However, the forward portion of the
Flo
wR
ate
Aortic Flow WaveformMitral Flow Waveform
Normalized Time
FIGURE 2. Aortic and mitral flow waveform parameteriza-tion. Time axis is normalized by cycle duration. Double arrowsillustrate the geometric significance of each parameter withrespect to the flow waveforms.
Systemic Aortic sinus
Systemic ArterySystemic Arteriole
Systemic Capillary
Systemic Vein
Left Atrium and Ventricle
FIGURE 1. Schematic of the Lumped Parameter Circuit.
PHILLIPS et al.46

mitral flow is encoded with three control points tocapture the physiological shape corresponding to theE-wave and A-wave features. The reverse flow portionincludes three parameters, namely: peak mitral back-flow Mvpbf, closing volume duration fraction Mvcvd,and the mitral valve constant backflow (regurgitationflow) Mvbf. As with the aortic valve flow, the mitralvalve flow waveform was also scaled for a given car-diac output and heart rate. Table 3 lists the values ofparameter choices to achieve the clinical classificationsfor mild, moderate, and severe levels of aortic andmitral valve regurgitation.
Modeling Pressure Overload States
While the adjustment in valve flow parametersdetermine the state of volume overload, the hemody-namic effects of twopressure overloading lesions namelyHT, and AS were modeled through lumped parametersrelated to the systemic circuit and the aortic valve.Clinical states of HT were achieved by decreasing arte-rial compliance while simultaneously increasing sys-temic resistance. This resulted in higher pulse pressuresand higher systolic pressures. AS was modeled byadjusting the aortic valve orifice area coefficient CQao.Tables 2 and 4 provide the parameter values used toachieve the desired clinical classifications.
RESULTS
To address the overall goal of determining energyoverhead rates of singular and multiple pressure or
volume overload lesions, the above described modelsimulated hemodynamics on a variety of parametercombinations including the normal baseline case. Thebaseline case corresponds to typical adult hemody-namics at a heart rate of 72 bpm, cardiac output of5 L/min, and blood pressures of 120/80 mmHg. Be-yond the baseline conditions, we simulated mild,moderate, and severe levels of HT, AS, MR, and ARas singular lesions. In each simulation, the aortic andmitral flows were prescribed to maintain the normallevel of cardiac output of 5 L/min.
Figure 3 displays the overall hemodynamic condi-tions for the baseline and severe singular lesions sim-ulated. For the baseline results (Fig. 3-baseline), allwaveforms are at their respective normal physiologicallevels and the model successfully captures dynamicphysiological features such as the dicrotic notch in theaortic sinus pressure waveform. The calculated ven-tricular power output peaks at roughly 6 W with anaverage power output of about 1.03 W. For the HTcase, both aortic and ventricular pressures are higherthan baseline. Peak power output is consequentlyhigher exceeding 10 W. AS cases (Fig. 3) shows char-acteristically higher ventricular pressures with other-wise normal aortic pressures. The resultant poweroutput is again consequently higher. Waveforms forthe severe MR (Fig. 3) show significant increase inpower output in response to negative flow in the mitralflow waveform. Severe AR also results in an increase inpower output with peak power output exceeding 20 W.
Figure 4 shows hemodynamic waveforms for thecase of concomitant mild cases namely: mildHT+mild AS, mild HT+mild AR, mild HT+mildMR, mild AS+mild AR, mild AS+mild MR, andmild AR+mild MR. All waveforms confirm expectedpatho-physiological features. For instance, mildHT+mild AS results in an increase in pressure gradi-ent across the aortic valve as well as overall elevationof the aortic pressure waveform.
Figure 5 shows the corresponding pressure–volume(PV) loops generated for singular (Fig. 5a) and con-comitant cases (Fig. 5b). As with Figs. 3 and 4, the PVloop confirms that the model accurately captures thepatho-physiological effects of each of the singular andconcomitant cases correctly as far as the PV loop isconcerned.
Figure 6a depicts the average ventricular poweroutput for baseline and each singular cases. The ven-tricular energy output increased in pressure loadingconditions to a value of about 1.5 W at the clinicallysevere state. The ventricular power output increasedsubstantially for volume overloaded conditions with apeak of 2.5 W at the clinically severe regurgitationstate. The variation from mild to severe is noted to belinear for pressure loaded states, and nonlinear for
TABLE 2. Lumped parameters to simulate baseline hemo-dynamics.
Baseline lumped parameters
Parameter name Value
HR (beat/min) 72
CO (mL/s) 83.33
Systolic fraction (s/s) 0.333
Csas (mL/mmHg) 0.0004
Rsas (mmHg s/mL) 0.003
Lsas (mmHg s2/mL) 0.000744
Csat (mL/mmHg) 1.6
Rsat (mmHg s/mL) 0.05
Lsat (mmHg s2/mL) 0.0017
Rsar (mmHg s/mL) 0.5
Rscp (mmHg s/mL) 0.52
Rsvn (mmHg s/mL) 0.075
Csvn (mL/mmHg) 20.5
CQao ((s mmHg)0.5/mL) 0.006667
CQmi ((s mmHg)0.5/mL) 0.0025
All values adopted and previously validated by Korakianitis and
Shi.7
HR heart rate, CO cardiac output.
Energy Costs of Singular and Concomitant Pressure 47

FIGURE 4. Concomitant hemodynamics for cases of mild HT+mild AS, mild HT+mild AR, mild HT+mild MR, mild AS+mild AR, mildAS+mild MR, mild AR+mild MR.
FIGURE 3. Simulated hemodynamics at baseline, and severe cases of HT, AS, MR, and AR. Waveforms depict ventricular andaortic pressure, aortic and mitral flow, and ventricular instantaneous power output. Baseline waveforms are shown in all graphs forclarity as black curves.
PHILLIPS et al.48

volume overloaded cases. Figure 6b translates the rawpower outputs into the normalized energy overheadrate of each of these lesions. The peak energy overheadrate corresponding to clinically severe HT or AS wasapproximately 50%. Clinically severe regurgitationoverhead rate was 144%.
Table 5 lists the different combinations of lesionssimulated in this study. These can be classified intocombined pressure overload, combined volume over-load, and combined pressure and volume overloadrespectively. We only considered the combination ofmild levels of these diseases as clinically, these sce-narios are those that are presumably most challengingwith respect to severity assessment. As with the sin-gular lesion modeling, the relevant parameters listed in
Tables 3 and 4 were varied to achieve these states.Again the cardiac output was always maintained at5 L/min for each of the combined states. The ventric-ular power output for each of the six mild combina-tions are listed in brackets within Table 5 and rangefrom a low of 1.41 W to a high of 1.56 W. Figure 7depicts these results as the respective percent overheadrate. Figure 6 also compares the overhead rates cal-culated for these combined mild cases with the sum ofoverhead rates of individual mild cases derived fromthe singular lesion simulations. Such a comparisonhelps assess any compounding effects in the multiplelesion scenarios. It is noted that the individual sum isalways lower than concomitant overhead rate onlywhen pressure overload is present.
ΔVlv (ml)
Plv
(mm
Hg)
0 50 100 150 200
0
40
80
120
160
200BaselineSevere ASSevere ARSevere HTSevere MR
ΔVlv (ml)
Plv
(mm
Hg)
0 50 100 150 200
0
40
80
120
160
200BaselineHT+ASHT+ARHT+MRAS+ARAS+MRAR+MR
A B
FIGURE 5. Left ventricular PV loops for simulated severe singular (a) and mild concomitant scenarios (b).
A B
FIGURE 6. Raw power (a) and power overhead rates (b) for singular cases of mild, moderate, and severe HT, AS, MR, and AR.
TABLE 3. Waveform shape parameters to simulate varying degrees of aortic and MR based on AHA/ACC guidelines.
AHA/ACC regurgitation classification
Aortic and mitral flow waveform shape parameters
Avpbf Avbf Mvpbf Mvbf
Normal 0.2 0 0.2 0
Mild 0.25 0.05 0.35 0.2
Moderate 0.3 0.1 0.6 0.45
Severe 0.5 0.3 2.1 1.8
Energy Costs of Singular and Concomitant Pressure 49

DISCUSSION
The Concept of Energy Cost and Overhead Rate
This paper assesses the energetic cost of AS, AR,HT, and MR on the left ventricle in singular as well ascombined states. Before discussing the results of thisstudy, it is important to first discuss the true energycost of a lesion and its overhead rate. Figure 8 shows aschematic of a pressure overload disease scenario on aphase diagram. The normal heart can be considered asa pump that can be characterized with a performancecurve, plotted as its cardiac output on the ordinate andafterload pressure on the abscissa (analogous to phasediagram). The same plot can also represent anothercurve that describes the systemic circuit performancecurve. It is the intersection of these two curves thatdefines the operational point. A normal system oper-ational point corresponds to normal physiologicalpressure and cardiac output.
Consider now how a pressure overloaded scenariochanges the scenario of the graph. This is representedin Fig. 8 as the system curve for mild, moderate, andsevere forms of pressure overload in order ofdecreasing steepness of these curves. Notice how thepoint of intersection between the normal pump curvewith these varying degrees of systemic circuit curvesmoves from a level corresponding to normal cardiacoutput to a level below normal cardiac output. In or-der to meet the cardiac output requirement, the pumpmust remodel and shift the pump performance curveupwards. This remodeling restores cardiac output atthe expense of much elevated afterload pressures andpower output. Severe cases often result in an inabilityto meet the cardiac output demand, resulting in heart
FIGURE 7. Power overhead rate for combined mild lesionscompared to the sum of individual lesions overhead.
FIGURE 8. Illustration of Energy Cost. CO vs Pressure maybe considered as a phase diagram with the dots representing‘‘operational’’ point. The red line represents normal CO. Thefalling red dot represents shift in operational point inresponse to a pressure overload. The arrows representremodeling to restore the operational point such that normalCO is achieved (green dots). Light green dot represents anoperational point that falls short of achieving normal CO.
TABLE 4. Specific adjusted values of parameters in Table 2, to simulate non-baseline conditions corresponding to varyingdegrees of HT and AS based on AHA/ACC guidelines.
AHA/ACC regurgitation classification
Hypertension parameters Aortic stenosis
Rscp (mmHg s/mL) Csat (mL/mmHg) CQao ((s mmHg)0.5/mL)
Normal 0.52 1.6 0.00667
Mild 0.7875 1.2 0.0133
Moderate 0.8767 1.2 0.0154
Severe 1.055 0.8 0.02
TABLE 5. List of combined lesions modeled.
Combined disease cases
Pressure overload Volume overload Pressure and volume overload
Mild AS and mild HT (1.43) Mild MR and mild AR (1.48) Mild AS and mild AR (1.56)
Mild AS and mild MR (1.41)
Mild HT and mild AR (1.56)
Mild HT and mild MR (1.5)
Number in brackets is the ventricular energy output in watts.
PHILLIPS et al.50
failure. This is depicted by the failure of the ‘‘remod-eled’’ operating point to shift to the normal cardiacoutput level (seen for the severe case in Fig. 8).
Given the above arguments, the true energy cost ofa disease is defined in this study as the increase in en-ergy required to meet the demand for a normal cardiacoutput. Physiologically, it is the extra energy generatedby an ‘‘infinitely resilient heart’’ to continue meetingthe normal cardiac output demand. That extra energythus captures the severity of the energy budget insultdue to the corresponding lesion. Note that the samearguments can be made in Fig. 8, for a volume over-load scenario.
Single Lesion Scenario
The simulation results in Fig. 6 illustrate the in-crease in energy associated with increasing levels oflesion severity based on current clinical guidelines.Notice that HT and AS, both pressure overload sce-narios, have remarkably consistent clinical classifica-tion when depicted as overhead rates. Mild HTincreases ventricular workload from 15 to 30% whilemild AS increases ventricular workload from 15 to23%. Moderate classification for these disease are at 30to 46 and 23 to 42% respectively, while severe classi-fication translates to above 46 and 42% respectively.The graphs show a strikingly linear trend for overheadrates of HT (R2 = 0.99) and AS (R2 = 98) as a func-tion of their respective AHA/ACC severity classifica-tion. The consistency between these two diseasesindirectly points to the existence of an underlyingcommon property of the heart to remodel in order toovercome pressure overload and maintain a nominalcardiac output. Overall, these calculations show that anear 50% increase in workload constitutes a severeform of pressure overload in these diseases and a poorprognosis with an absence of intervention.
The energy overhead rate for volume overloadedscenarios shown in Fig. 6 depicts a nonlinear trend.Both AR and MR correspond to energy increases thatsteeply rise with mild, moderate, and severe regurgitantfractions defined by the AHA/ACC. The nonlineardependence of increased energy overhead rate toregurgitant fraction can be explained based on simple
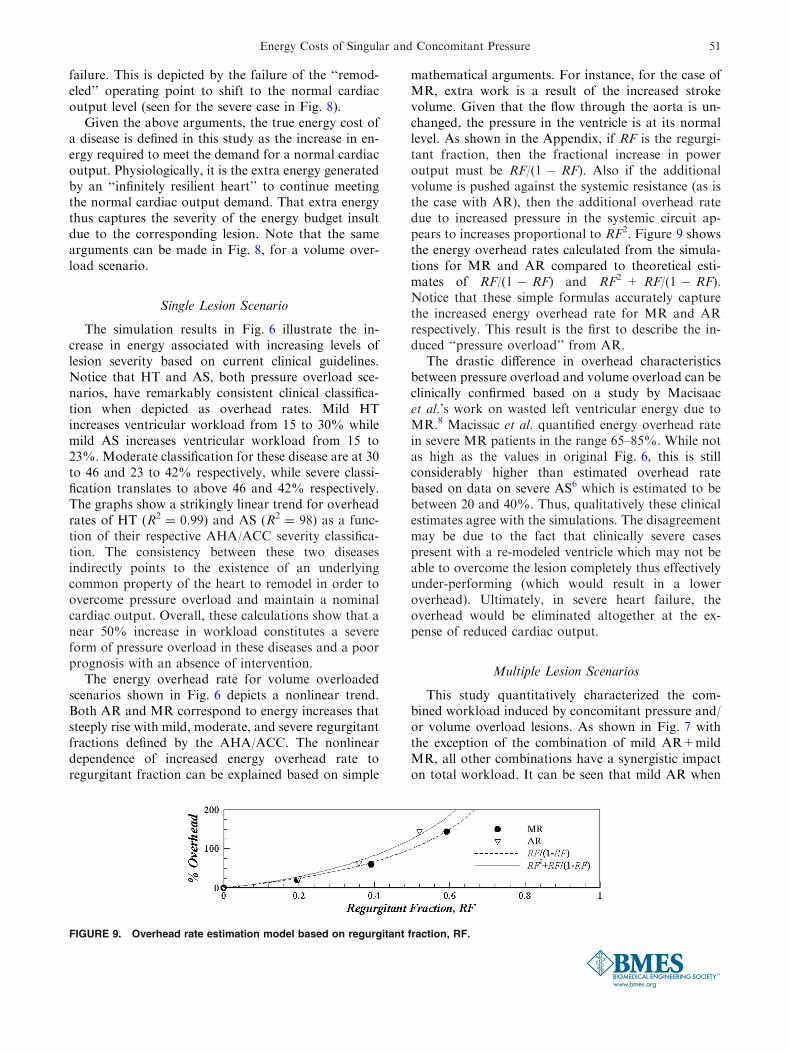
mathematical arguments. For instance, for the case ofMR, extra work is a result of the increased strokevolume. Given that the flow through the aorta is un-changed, the pressure in the ventricle is at its normallevel. As shown in the Appendix, if RF is the regurgi-tant fraction, then the fractional increase in poweroutput must be RF/(1 � RF). Also if the additionalvolume is pushed against the systemic resistance (as isthe case with AR), then the additional overhead ratedue to increased pressure in the systemic circuit ap-pears to increases proportional to RF2. Figure 9 showsthe energy overhead rates calculated from the simula-tions for MR and AR compared to theoretical esti-mates of RF/(1 � RF) and RF2 + RF/(1 � RF).Notice that these simple formulas accurately capturethe increased energy overhead rate for MR and ARrespectively. This result is the first to describe the in-duced ‘‘pressure overload’’ from AR.
The drastic difference in overhead characteristicsbetween pressure overload and volume overload can beclinically confirmed based on a study by Macisaacet al.’s work on wasted left ventricular energy due toMR.8 Macissac et al. quantified energy overhead ratein severe MR patients in the range 65–85%. While notas high as the values in original Fig. 6, this is stillconsiderably higher than estimated overhead ratebased on data on severe AS6 which is estimated to bebetween 20 and 40%. Thus, qualitatively these clinicalestimates agree with the simulations. The disagreementmay be due to the fact that clinically severe casespresent with a re-modeled ventricle which may not beable to overcome the lesion completely thus effectivelyunder-performing (which would result in a loweroverhead). Ultimately, in severe heart failure, theoverhead would be eliminated altogether at the ex-pense of reduced cardiac output.
Multiple Lesion Scenarios
This study quantitatively characterized the com-bined workload induced by concomitant pressure and/or volume overload lesions. As shown in Fig. 7 withthe exception of the combination of mild AR+mildMR, all other combinations have a synergistic impacton total workload. It can be seen that mild AR when
FIGURE 9. Overhead rate estimation model based on regurgitant fraction, RF.
Energy Costs of Singular and Concomitant Pressure 51

combined with either mild HT or mild AS compoundthe workload to an extent that the net workload is50% greater than the normal case. The combination ofmild HT+mild MR also creates a combined workloadof roughly 46%, while that of mild AS+mild MRcreates a workload of 37%. Figure 7, also depicts thegreatest synergy when mild HT is involved. All thediseases that combined with mild HT had a net com-bined workload about 43% higher than their individ-ual sum. The least synergetic combination correspondsto mild AR+mild MR. Both these diseases did notadd any additional workload from combined effects.This shows that it is the pressure overload lesions thatare capable of compounding ventricular workload.
Clinical Severity and Workload
As a final discourse, the data allows us to address thequestion raised earlier ‘‘Does workload correspondingto lesions such as HT, AS, AR, and MR universallycorrelate to clinically established levels of mild, moder-ate and severe in Table 1?’’ To address this question wearbitrarily assigned a linear clinical severity scalebetween 0 and 3, where 0 is normal, 1 stands for mild, 2stands for moderate, and 3 stands for severe. Given thislinear scale for clinical severity assessments of mild,moderate, and severe we plotted clinical severity as afunction of energy overhead rate estimates as shown inFig. 10. As seen in the Figure, pressure overload lesionsremarkably show a linear correlation between clinicalseverity and energy overhead rate. Interestingly, severityfor volume overload lesions does not show a linearcorrelation with clinical severity, yet there appears to bea clear predictable relationship. Regression analysis forclinical severity and pressure overload overhead rateyielded an R2 = 0.98. A regression between clinicalseverity and the square root of volume overload over-head rate yields an R2 = 0.97. These high regression
coefficients suggest that clinical severity indeed appearto universally correlate to energy overload. However,there appears to be an important distinction betweenhow clinical severity responds to energy overhead in apressure overload vs. volume overload scenario. Thesedifferences clearly indicate the stark contrasts and limitsof ventricular remodeling in patients with respect topressure overload and volume overload diseases.
Based on the above which is true for singular lesions,how then does severity in a concomitant scenario beevaluated? The current study cannot answer this as oneneeds true clinical severity states of patients with avariety of concomitant scenarios. However it is possibleto speculate and hypothesis here that for a concomitantscenario, the individual overhead rates, may be mappedto an overall severity index by properly accounting forthe synergistic as well as nonlinear effects. Clinicalstudies are needed to formulate the mapping towardsdeveloping a single unified approach that assesses clin-ical severity for any singular or concomitant scenario.
CONCLUSIONS
We showed a linear increase in energy overhead ratefor pressure overloading lesions compared to a non-linear increase in workload for volume overloadinglesions. We have also illustrated how energy loadcompounds in the case of mild combinations of pres-sure and/or volume overloading lesions. It is shownthat there exists a mechanistic synergy effect in allcombinations and that the presence of HT compoundsthe energy overhead rate the most. Lastly, we dem-onstrated that the established clinical severity forpressure overload lesions and volume overload lesionsare correlated to energy overhead respectively.
APPENDIX: ESTIMATING POWER OVERHEAD
FOR AR AND MR
Power Overhead for MR
Baseline: Let P be the mean ventricular pressure,and SV the stroke volume. Work done in one heartbeat equals P*SV.
MR: Now, let RF be the mitral regurgitant fraction.If the net cardiac output is the same as baseline, thenthe ventricular stroke volume equals SV/(1 � RF).Work done in one heart beat equals P*SV/(1 � RF)
Overhead rate ¼ P � SV= 1� RFð Þ � P � SVð Þ=P � SVð Þ ¼ 1= 1� RFð Þ� 1
¼ RF= 1�RFð Þ:
Overhead Rate
Seve
rity
(Mild
=1,
Mod
erat
e=
2,Se
vere
=3)
0 20 40 60 80 100 120 140 160 180 2000
1
2
3
y ∝ x (regression)y ∝ x1/2 (regression)HTASARMR
R2 = 0.98R2 = 0.97
FIGURE 10. Correlation between established clinical sever-ity and estimated energy overhead rate.
PHILLIPS et al.52
ACKNOWLEGMENT
This work was funded by the American HeartAssociation. Grant# 11SDG5170011.
CONFLICT OF INTEREST STATEMENT
Authors Canek Phillips, Rachael L. Simon-Walker,and Lakshmi Prasad Dasi declare that they have noconflict of interest.
INFORMED CONSENT STATEMENT
No human studies were carried out by the authorsfor this article.
ANIMAL STUDIES STATEMENT
No animal studies were carried out by the authorsfor this article.
REFERENCES
1Abdolrazaghi, M., M. Navidbakhsh, and K. Hassani.Mathematical modelling and electrical analog equivalentof the human cardiovascular system. Cardiovasc. Eng.10:45–51, 2010.2Bonow, R. O., B. A. Carabello, K. Chatterjee, A. C. deLeon, D. P. Faxon, M. D. Freed, W. H. Gaasch, B. W.Lytle, R. A. Nishimura, P. T. O’Gara, R. A. O’Rourke, C.M. Otto, P. M. Shah, J. S. Shanewise, S. C. Smith, A. K.Jacobs, C. D. Adams, J. L. Anderson, E. M. Antman, V.Fuster, J. L. Halperin, L. F. Hiratzka, S. A. Hunt, R.Nishimura, R. L. Page, and B. Riegel. Amer Col Cardi-ology Amer, H., 2006. ACC/AHA 2006 guidelines for the
management of patients with valvular heart disease. Cir-culation 114:E84–E231, 2006.3Chandran, K. B., A. P. Yoganathan, and S. E. Rittgers.Biofluid Mechanics: The Human Circulation. Routledge:Taylor and Francis, 2006.4Couet, J., M. Gaudreau, D. Lachance, E. Plante, E.Roussel, M. C. Drolet, and M. Arsenault. Treatment ofcombined aortic regurgitation and systemic hypertension:insights from an animal model study. Am. J. Hypertens.19:843–850, 2006.5Dasi, L. P., K. Pekkan, D. de Zelicourt, K. S. Sund-areswaran, R. Krishnankutty, P. J. Delnido, and A. P.Yoganathan. Hemodynamic energy dissipation in the car-diovascular system: generalized theoretical analysis ondisease states. Ann. Biomed. Eng. 37:661–673, 2009.6Garcia, D., P. Pibarot, J. G. Dumesnil, F. Sakr, and L. G.Durand. Assessment of aortic valve stenosis severity—anew index based on the energy loss concept. Circulation101:765–771, 2000.7Korakianitis, T., and Y. B. Shi. Numerical simulation ofcardiovascular dynamics with healthy and diseased heartvalves. J. Biomech. 39:1964–1982, 2006.8MacIsaac, A. I., I. G. McDonald, R. L. Kirsner, S. A.Graham, and D. Tanzer. Left ventricular energy in mitralregurgitation: a preliminary report. Aust. N Z J. Med.22:532–540, 1992.9Pibarot, P., and J. G. Dumesnil. Improving assessment ofaortic stenosis. J. Am. Coll. Cardiol. 60:169–180, 2012.
10Rieck, A. E., D. Cramariuc, K. Boman, C. Gohlke-Bar-wolf, E. M. Staal, M. T. Lonnebakken, A. B. Rossebo, andE. Gerdts. Hypertension in aortic stenosis implications forleft ventricular structure and cardiovascular events.Hypertension 60:90–97, 2012.
11Stergiopulos, N., D. F. Young, and T. R. Rogge. Com-puter-simulation of arterial flow with applications to arte-rial and aortic stenoses. J. Biomech. 25:1477–1488, 1992.
12Unger, P., C. Dedobbeleer, G. Van Camp, D. Plein, B.Cosyns, and P. Lancellotti. Mitral regurgitation in patientswith aortic stenosis undergoing valve replacement. Heart96:9–14, 2010.
Energy Costs of Singular and Concomitant Pressure 53