Energy Consumption in the UK (2015) - University of …e680/energy/energy_links/...ECUK (2015) –...
16
1 Energy Consumption in the UK (2015) Chapter 2: Transport energy consumption in the UK between 1970 and 2014 30 July 2015
Transcript of Energy Consumption in the UK (2015) - University of …e680/energy/energy_links/...ECUK (2015) –...
1
Energy Consumption in the UK (2015)
Chapter 2: Transport energy consumption in the UK
between 1970 and 2014
30 July 2015
ECUK (2015) – Chapter 2: Transport energy consumption
2
Energy Consumption in the UK (2015)
Transport energy consumption in the UK between 1970 and 2014
Statistician
Responsible: Liz Waters
Prepared by: Emily Wilkes
Victoria Goodright
ECUK (2015) – Chapter 2: Transport energy consumption
___________________________________________________________________________________
3
Contents
Background ................................................................................................................................ 4
Key terms used in this document ............................................................................................... 4
1. Overall transport energy consumption in 2014 ............................................................... 5
2. Transport sector energy consumption by type of transport between 1970 and 2014 ...... 6
3. Transport sector energy consumption by sector between 1990 and 2013 ...................... 9
4. Factors affecting transport energy consumption between 2000 and 2013 .................... 11
Annex A Publication timetable for ECUK Chapter 2 tables in 2015 .................................... 13
Annex B Related DECC publications .................................................................................. 15
ECUK (2015) – Chapter 2: Transport energy consumption
4
Background
This factsheet provides a brief overview of the trends and some key drivers that have influenced energy consumption within the transport sector in the UK since 1970. Analysis is based on data from DECC’s annual publication ‘Energy Consumption in the UK’ (ECUK) published on Thursday 30 July 2015: https://www.gov.uk/government/publications/energy-consumption-in-the-uk.
This factsheet looks at the change in transport energy consumption by the following sections:
Overall transport energy consumption in 2014.
Transport sector energy consumption by type of transport between 1970 and 2014.
Transport sector energy consumption by sector between 1990 and 2013.
Factors affecting transport energy consumption between 1990 and 2013.
This factsheet also contains publication plans for each table and a summary of related DECC
publications in the Annex.
Alongside the ECUK series of datasets and factsheets, a User Guide is also available which provides the reader with an overview of the content of each chapter within ECUK and explains technical concepts and vocabulary. The User Guide is not intended to offer commentary and interpretation of the data. We value feedback on the content of this factsheet and comments or related queries should be sent to [email protected].
Key terms used in this document
Million tonnes of oil equivalent (Mtoe) has been used throughout this factsheet and data tables. This can be defined as a common unit of measurement which enables different fuels to be compared and aggregated. A tonne of oil equivalent (toe) is a unit of energy.
A full glossary of terms used within the energy industry has been provided in Annex B of the DECC statistics publication ‘Digest of UK Energy Statistics’ (DUKES)1.
1 DUKES can be accessed here: https://www.gov.uk/government/collections/digest-of-uk-energy-statistics-dukes.
ECUK (2015) – Chapter 2: Transport energy consumption
5
1. Overall transport energy consumption in 2014
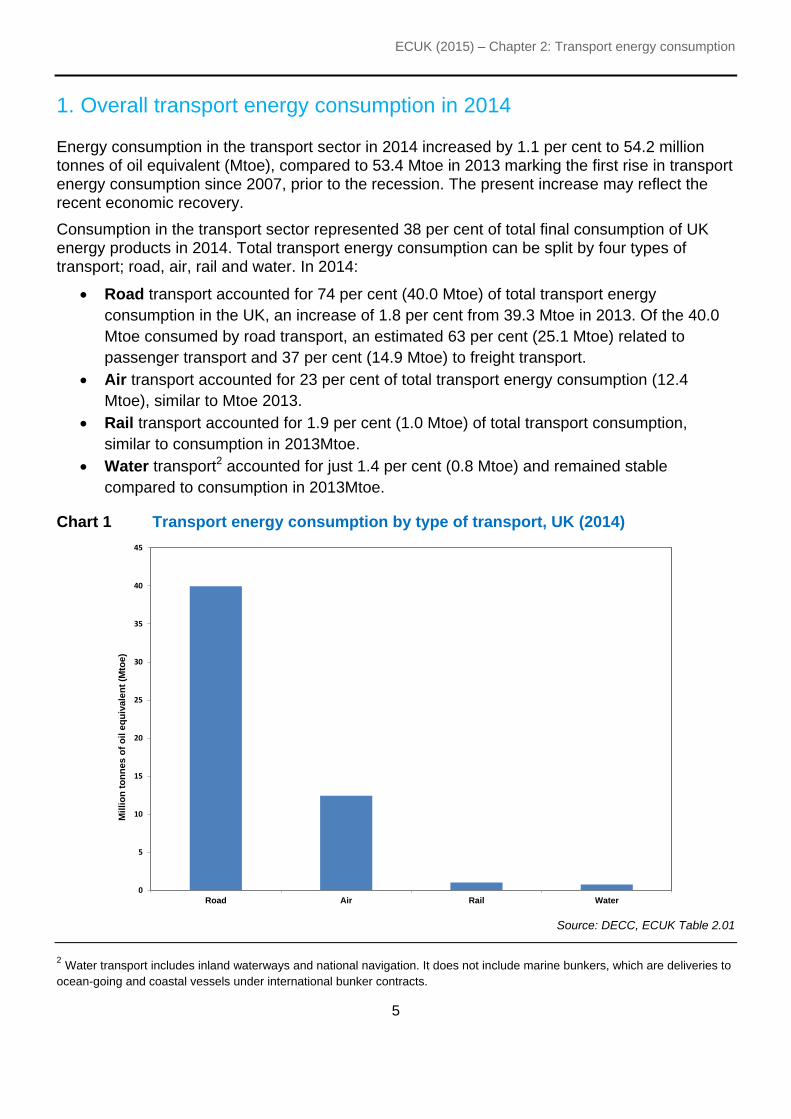
Energy consumption in the transport sector in 2014 increased by 1.1 per cent to 54.2 million tonnes of oil equivalent (Mtoe), compared to 53.4 Mtoe in 2013 marking the first rise in transport energy consumption since 2007, prior to the recession. The present increase may reflect the recent economic recovery.
Consumption in the transport sector represented 38 per cent of total final consumption of UK energy products in 2014. Total transport energy consumption can be split by four types of transport; road, air, rail and water. In 2014:
Road transport accounted for 74 per cent (40.0 Mtoe) of total transport energy
consumption in the UK, an increase of 1.8 per cent from 39.3 Mtoe in 2013. Of the 40.0
Mtoe consumed by road transport, an estimated 63 per cent (25.1 Mtoe) related to
passenger transport and 37 per cent (14.9 Mtoe) to freight transport.
Air transport accounted for 23 per cent of total transport energy consumption (12.4
Mtoe), similar to Mtoe 2013.
Rail transport accounted for 1.9 per cent (1.0 Mtoe) of total transport consumption,
similar to consumption in 2013Mtoe.
Water transport2 accounted for just 1.4 per cent (0.8 Mtoe) and remained stable
compared to consumption in 2013Mtoe.
Chart 1 Transport energy consumption by type of transport, UK (2014)
Source: DECC, ECUK Table 2.01
2 Water transport includes inland waterways and national navigation. It does not include marine bunkers, which are deliveries to
ocean-going and coastal vessels under international bunker contracts.
0
5
10
15
20
25
30
35
40
45
Road Air Rail Water
Mil
lio
n t
on
ne
s o
f o
il e
qu
iva
len
t (M
toe
)
ECUK (2015) – Chapter 2: Transport energy consumption
6
0
10
20
30
40
50
60
1970 1975 1980 1985 1990 1995 2000 2005 2010 2014
Mil
lio
n t
on
ne
s o
f o
il e
qu
iva
len
t (M
toe
)
Rail Road Water Air
2. Transport sector energy consumption by type of transport between
1970 and 2014
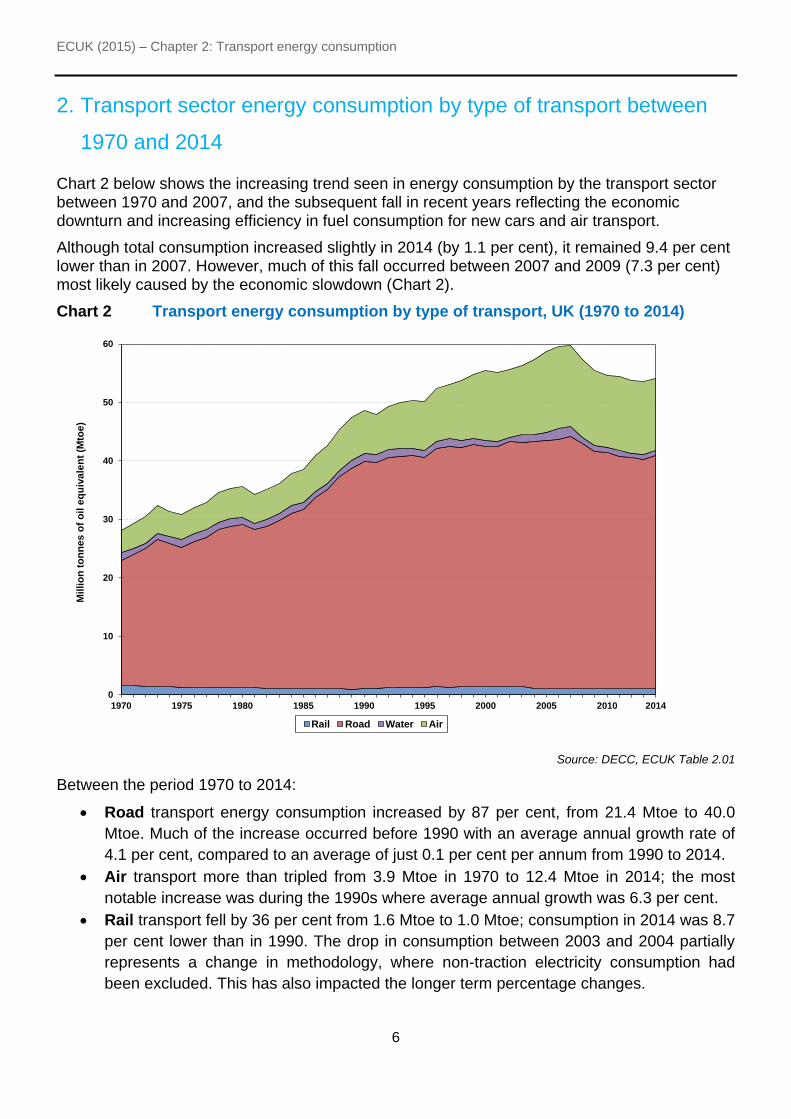
Chart 2 below shows the increasing trend seen in energy consumption by the transport sector between 1970 and 2007, and the subsequent fall in recent years reflecting the economic downturn and increasing efficiency in fuel consumption for new cars and air transport.
Although total consumption increased slightly in 2014 (by 1.1 per cent), it remained 9.4 per cent lower than in 2007. However, much of this fall occurred between 2007 and 2009 (7.3 per cent) most likely caused by the economic slowdown (Chart 2).
Chart 2 Transport energy consumption by type of transport, UK (1970 to 2014)
Source: DECC, ECUK Table 2.01
Between the period 1970 to 2014:
Road transport energy consumption increased by 87 per cent, from 21.4 Mtoe to 40.0
Mtoe. Much of the increase occurred before 1990 with an average annual growth rate of
4.1 per cent, compared to an average of just 0.1 per cent per annum from 1990 to 2014.
Air transport more than tripled from 3.9 Mtoe in 1970 to 12.4 Mtoe in 2014; the most
notable increase was during the 1990s where average annual growth was 6.3 per cent.
Rail transport fell by 36 per cent from 1.6 Mtoe to 1.0 Mtoe; consumption in 2014 was 8.7
per cent lower than in 1990. The drop in consumption between 2003 and 2004 partially
represents a change in methodology, where non-traction electricity consumption had
been excluded. This has also impacted the longer term percentage changes.
ECUK (2015) – Chapter 2: Transport energy consumption
7
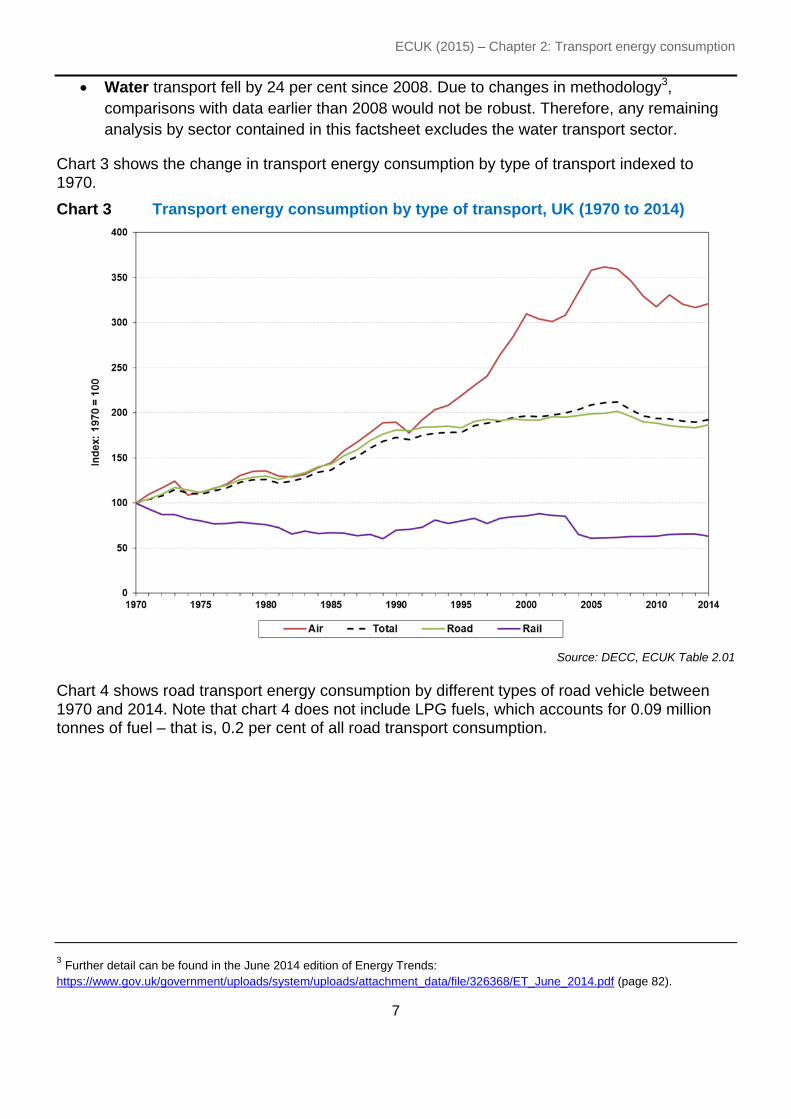
Water transport fell by 24 per cent since 2008. Due to changes in methodology3,
comparisons with data earlier than 2008 would not be robust. Therefore, any remaining
analysis by sector contained in this factsheet excludes the water transport sector.
Chart 3 shows the change in transport energy consumption by type of transport indexed to 1970.
Chart 3 Transport energy consumption by type of transport, UK (1970 to 2014)
Source: DECC, ECUK Table 2.01
Chart 4 shows road transport energy consumption by different types of road vehicle between 1970 and 2014. Note that chart 4 does not include LPG fuels, which accounts for 0.09 million tonnes of fuel – that is, 0.2 per cent of all road transport consumption.
3 Further detail can be found in the June 2014 edition of Energy Trends:
https://www.gov.uk/government/uploads/system/uploads/attachment_data/file/326368/ET_June_2014.pdf (page 82).
ECUK (2015) – Chapter 2: Transport energy consumption
8
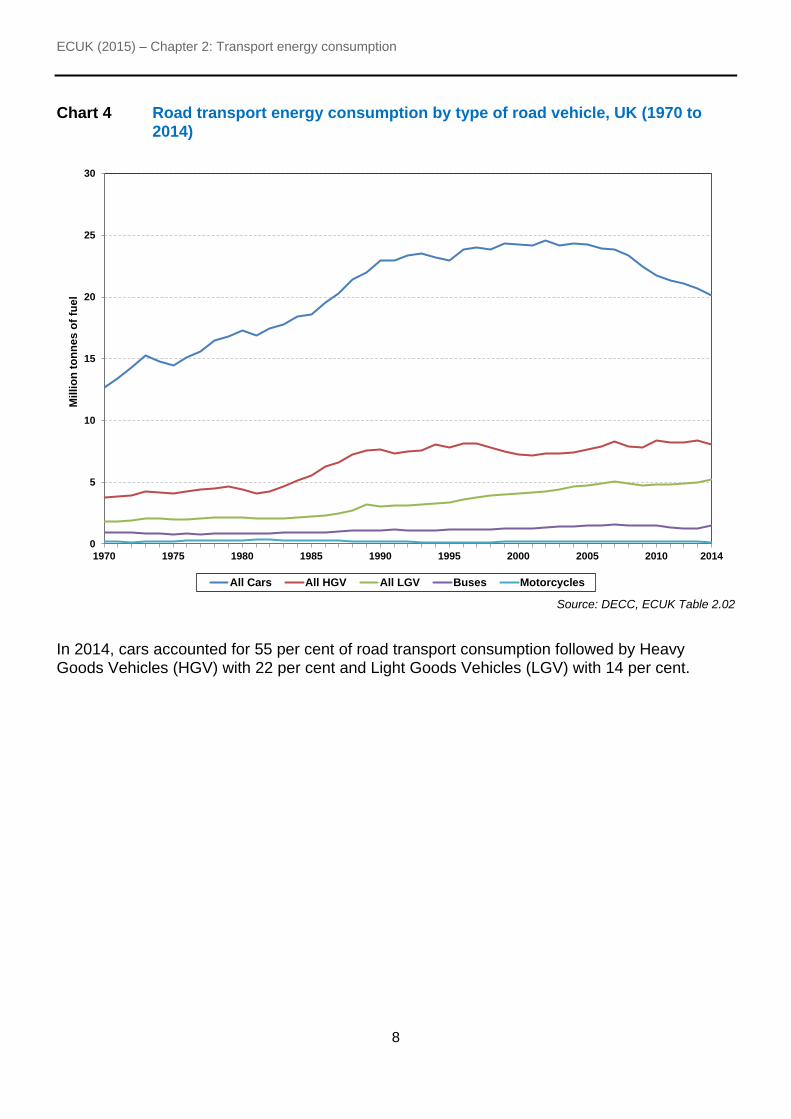
Chart 4 Road transport energy consumption by type of road vehicle, UK (1970 to 2014)
Source: DECC, ECUK Table 2.02
In 2014, cars accounted for 55 per cent of road transport consumption followed by Heavy Goods Vehicles (HGV) with 22 per cent and Light Goods Vehicles (LGV) with 14 per cent.
0
5
10
15
20
25
30
1970 1975 1980 1985 1990 1995 2000 2005 2010 2014
Mil
lio
n t
on
ne
s o
f fu
el
All Cars All HGV All LGV Buses Motorcycles
ECUK (2015) – Chapter 2: Transport energy consumption
9
0
10
20
30
40
50
60
70
1990 1995 2000 2005 2010 2013
Mil
lio
n t
on
nes
of
oil
eq
uiv
ale
nt
(Mto
e)
Industry (including energy industries) Domestic Services
3. Transport sector energy consumption by sector between 1990 and
2013
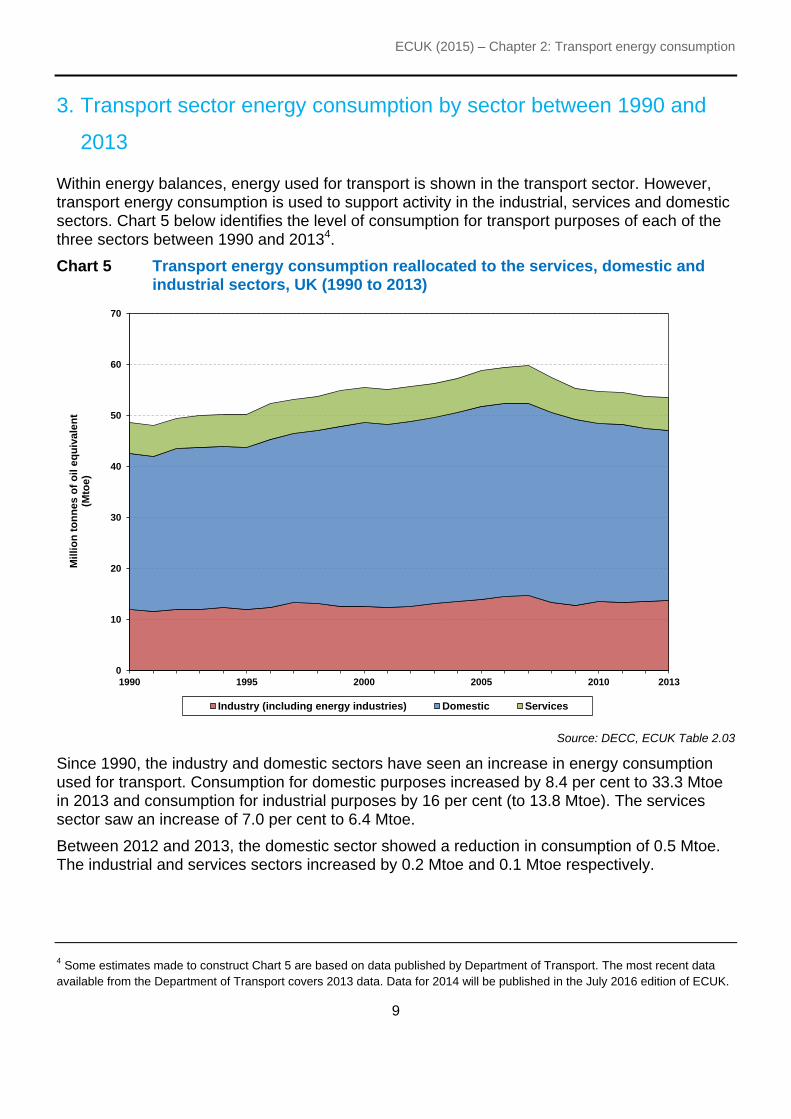
Within energy balances, energy used for transport is shown in the transport sector. However, transport energy consumption is used to support activity in the industrial, services and domestic sectors. Chart 5 below identifies the level of consumption for transport purposes of each of the three sectors between 1990 and 20134.
Chart 5 Transport energy consumption reallocated to the services, domestic and industrial sectors, UK (1990 to 2013)
Source: DECC, ECUK Table 2.03
Since 1990, the industry and domestic sectors have seen an increase in energy consumption used for transport. Consumption for domestic purposes increased by 8.4 per cent to 33.3 Mtoe in 2013 and consumption for industrial purposes by 16 per cent (to 13.8 Mtoe). The services sector saw an increase of 7.0 per cent to 6.4 Mtoe.
Between 2012 and 2013, the domestic sector showed a reduction in consumption of 0.5 Mtoe. The industrial and services sectors increased by 0.2 Mtoe and 0.1 Mtoe respectively.
4 Some estimates made to construct Chart 5 are based on data published by Department of Transport. The most recent data
available from the Department of Transport covers 2013 data. Data for 2014 will be published in the July 2016 edition of ECUK.
ECUK (2015) – Chapter 2: Transport energy consumption
10
In 2013, it was estimated that 62 per cent of all transport energy demand was from the domestic sector, 26 per cent from the industrial sector and 12 per cent from the services sector. The ratio between the three sectors has varied very little since 1990.

ECUK (2015) – Chapter 2: Transport energy consumption
11
-5
-4
-3
-2
-1
0
1
2
3
Road passengertransport
Road freighttransport
Rail Air Water All transportsectors
Mil
lio
n t
on
ne
s o
f o
il e
qu
iva
len
t (M
toe
)
Output effect Intensity effect Total change
4. Factors affecting transport energy consumption between 2000 and
2013
Energy consumption by the transport sector has decreased by 1.9 Mtoe between 2000 and 2013. Chart 6 shows how this decline in consumption may be attributed to a change in transport use (the output effect is a measurement of how much energy consumption has changed as a result of increased demand for transport) and changes in structure and efficiency/intensity (that is, energy consumed per passenger kilometre or freight tonne kilometre). The decrease seen between 2000 and 2013 was largely driven by improvements in efficiency, rather than by reduced demand for transport services.
Consumption for road freight transport increased by 2.1 Mtoe and air transport by 0.5 Mtoe), whilst there were reductions in road passenger transport (by 3.9 Mtoe), rail transport (by 0.4 Mtoe) and water transport (by 0.2 Mtoe).
Chart 6 Factors affecting change in transport energy use (between 2000 and 2013)
Source:
DECC, ECUK Table 2.10
It has been estimated5 that if there had been no efficiency savings between 2000 and 2013, energy consumption in 2013 would have been 55.1 million tonnes of oil equivalent, 1.5 million tonnes of oil equivalent higher than the actual consumption. By looking at the relationship between energy consumption and distance travelled or load carried it is possible to measure
5 Further information about this estimation is available in Chapter 2 of the User Guide, which can be accessed here:
https://www.gov.uk/government/organisations/department-of-energy-climate-change/series/energy-consumption-in-the-uk.
ECUK (2015) – Chapter 2: Transport energy consumption
12
energy intensity. For road passenger transport, energy intensity is measured in terms of consumption per passenger kilometre. To take account of the weight carried, road freight transport intensity is measured in relation to freight tonne-kilometres. Air transport energy intensity is measured as energy consumption per passenger kilometre.
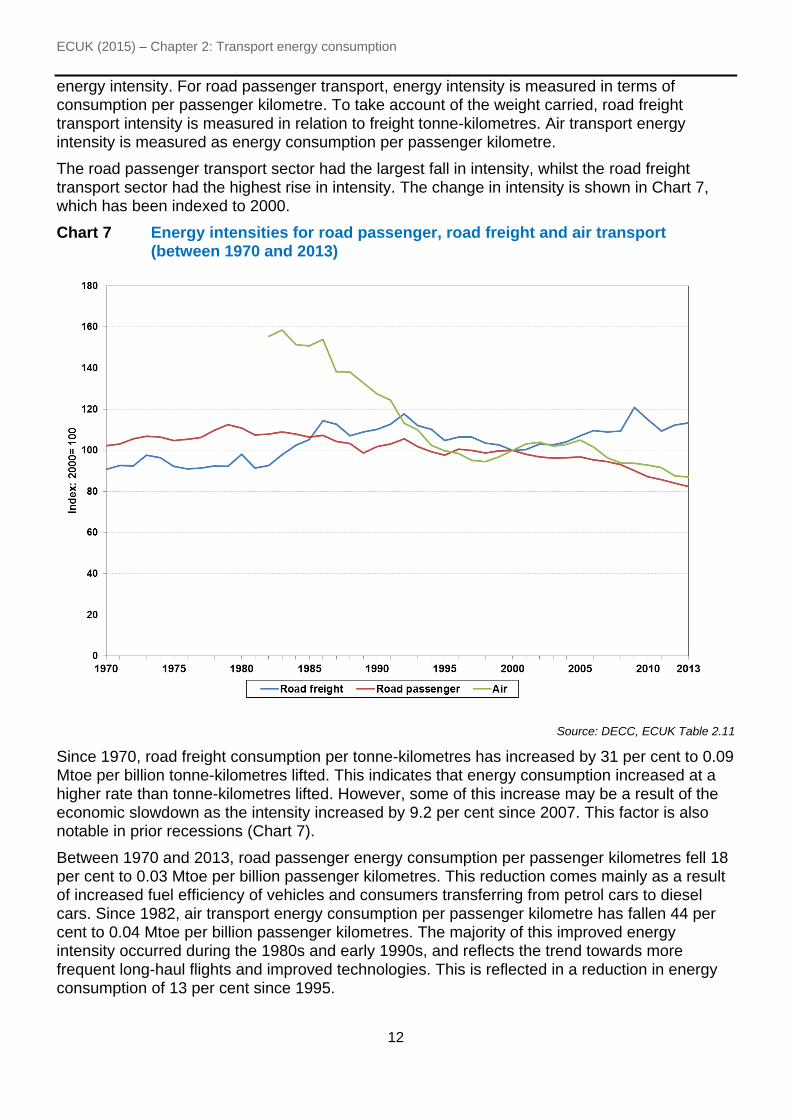
The road passenger transport sector had the largest fall in intensity, whilst the road freight transport sector had the highest rise in intensity. The change in intensity is shown in Chart 7, which has been indexed to 2000.
Chart 7 Energy intensities for road passenger, road freight and air transport (between 1970 and 2013)
Source: DECC, ECUK Table 2.11
Since 1970, road freight consumption per tonne-kilometres has increased by 31 per cent to 0.09 Mtoe per billion tonne-kilometres lifted. This indicates that energy consumption increased at a higher rate than tonne-kilometres lifted. However, some of this increase may be a result of the economic slowdown as the intensity increased by 9.2 per cent since 2007. This factor is also notable in prior recessions (Chart 7).
Between 1970 and 2013, road passenger energy consumption per passenger kilometres fell 18 per cent to 0.03 Mtoe per billion passenger kilometres. This reduction comes mainly as a result of increased fuel efficiency of vehicles and consumers transferring from petrol cars to diesel cars. Since 1982, air transport energy consumption per passenger kilometre has fallen 44 per cent to 0.04 Mtoe per billion passenger kilometres. The majority of this improved energy intensity occurred during the 1980s and early 1990s, and reflects the trend towards more frequent long-haul flights and improved technologies. This is reflected in a reduction in energy consumption of 13 per cent since 1995.
ECUK (2015) – Chapter 2: Transport energy consumption
13
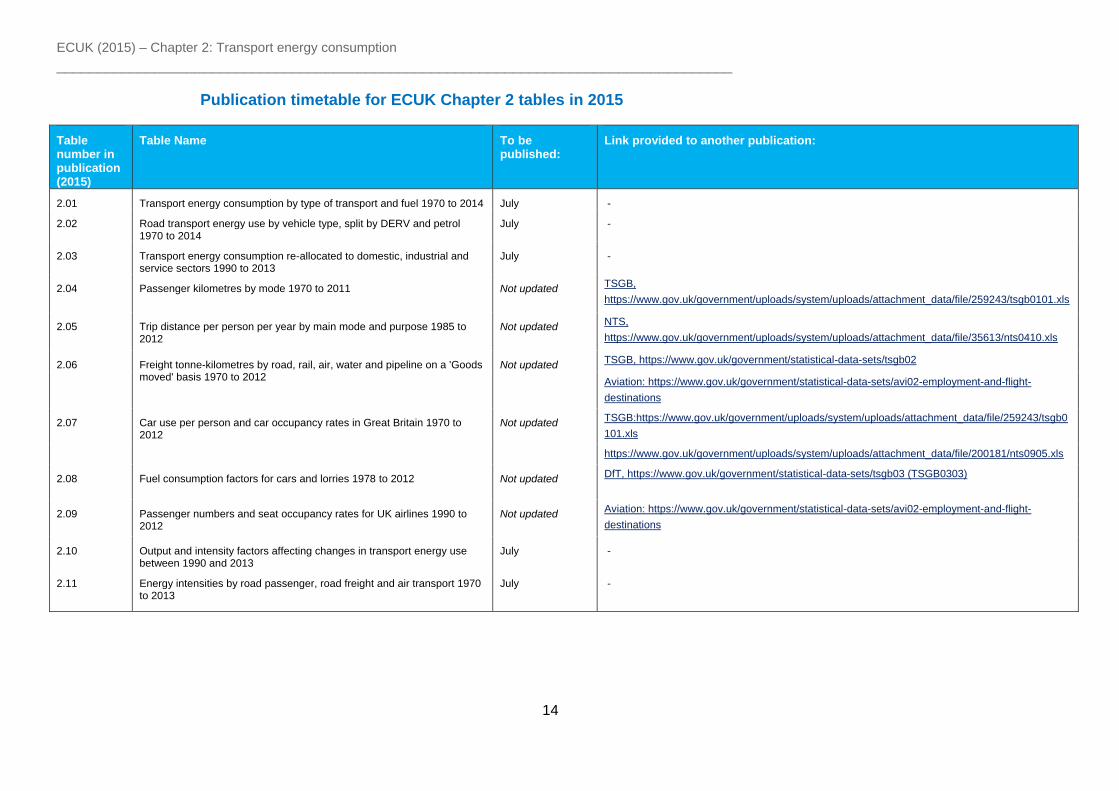
Annex A Publication timetable for ECUK Chapter 2 tables in 2015
Users should note that in this edition of ECUK tables and analysis that contain data directly available from other sources will not be updated. These tables are clearly marked and web links to the published material are provided.
The table below illustrates when each table for this chapter will be published, and if it is not going to be updated, alternate links to the data are provided.
ECUK (2015) – Chapter 2: Transport energy consumption
___________________________________________________________________________________
14
Publication timetable for ECUK Chapter 2 tables in 2015
Table number in publication (2015)
Table Name To be published:
Link provided to another publication:
2.01 Transport energy consumption by type of transport and fuel 1970 to 2014 July -
2.02 Road transport energy use by vehicle type, split by DERV and petrol 1970 to 2014
July -
2.03 Transport energy consumption re-allocated to domestic, industrial and service sectors 1990 to 2013
July -
2.04 Passenger kilometres by mode 1970 to 2011 Not updated TSGB,
https://www.gov.uk/government/uploads/system/uploads/attachment_data/file/259243/tsgb0101.xls
2.05 Trip distance per person per year by main mode and purpose 1985 to 2012
Not updated NTS,
https://www.gov.uk/government/uploads/system/uploads/attachment_data/file/35613/nts0410.xls
2.06 Freight tonne-kilometres by road, rail, air, water and pipeline on a 'Goods moved' basis 1970 to 2012
Not updated TSGB, https://www.gov.uk/government/statistical-data-sets/tsgb02
Aviation: https://www.gov.uk/government/statistical-data-sets/avi02-employment-and-flight-
destinations
2.07 Car use per person and car occupancy rates in Great Britain 1970 to 2012
Not updated TSGB:https://www.gov.uk/government/uploads/system/uploads/attachment_data/file/259243/tsgb0
101.xls
https://www.gov.uk/government/uploads/system/uploads/attachment_data/file/200181/nts0905.xls
2.08 Fuel consumption factors for cars and lorries 1978 to 2012 Not updated DfT, https://www.gov.uk/government/statistical-data-sets/tsgb03 (TSGB0303)
2.09 Passenger numbers and seat occupancy rates for UK airlines 1990 to 2012
Not updated Aviation: https://www.gov.uk/government/statistical-data-sets/avi02-employment-and-flight-
destinations
2.10 Output and intensity factors affecting changes in transport energy use between 1990 and 2013
July -
2.11 Energy intensities by road passenger, road freight and air transport 1970 to 2013
July -

ECUK (2015) – Chapter 2: Transport energy consumption
___________________________________________________________________________________
15
Annex B Related DECC publications
Energy consumption statistics are also available in:
The Digest of UK Energy Statistics (DUKES).
Much of the data contained in ECUK are based on estimates from DUKES. DUKES is an annual publication which includes tables, charts and commentary covering all the major aspects of energy, it provides a detailed and comprehensive picture of fuel production and consumption during the last three years.
The Digest is also available on the Internet. This includes some additional information including data (available in MS Excel format) from earlier years which are not contained in the printed copy publication. Available from The Stationery Office (0870 600 5522) or www.gov.uk/government/collections/digest-of-uk-energy-statistics-dukes
Energy Trends
A quarterly publication which includes tables, charts and commentary covering all the major aspects of energy, it provides a comprehensive picture of energy production and use. Available on subscription (together with Quarterly Energy Prices) from DECC (0300 068 5041).
www.gov.uk/government/collections/energy-trends
Sub-national consumption statistics
The sub-national data contain estimates at regional, local authority and MSOA/LSOA (for electricity and gas consumption statistics) geographies. However, it is worth noting that the data are not comparable with DUKES and ECUK due to differing data sources.
A full summary of the sub-national consumption datasets available, along with links to relevant datasets, is included on pages 10 and 11 of the sub-national methodology and guidance booklet, which can be accessed here: https://www.gov.uk/government/uploads/system/uploads/attachment_data/file/324877/Sub-national_methodology_and_guidance_booklet.pdf.
National Energy Efficiency Data-framework (NEED)
The National Energy Efficiency Data-Framework (NEED) was set up by DECC to provide a better understanding of energy use and energy efficiency in domestic and non-domestic buildings in Great Britain. The data framework matches gas and electricity consumption data with information on energy efficiency measures installed in homes. It also includes data about property attributes and household characteristics.
www.gov.uk/government/collections/national-energy-efficiency-data-need-framework
Comparisons between DUKES, ECUK and sub-national consumption statistics are summarised in Annex C (page 776) of the sub-national guidance and methodology booklet: https://www.gov.uk/government/uploads/system/uploads/attachment_data/file/324877/Sub-national_methodology_and_guidance_booklet.pdf.

Crown copyright 2013
rtment of Energy & Climate Change
3 Whitehall Place
London SW1A 2AW
© Crown copyright 2015
Department of Energy & Climate Change
3 Whitehall Place
London SW1A 2AW
www.gov.uk/decc
15D/375