Slide1-Current Energy Situation in Malaysia-suruhanjaya Tenaga

1
ENERGY COMMISSION
EnsuringEnergy for All
ANNUAL REPORT 2012

2
THIS ENERGY COMMISSION ANNUAL REPORT 2012 is submitted to the Ministry of Energy, Green Technology and Water in line
with Section 33(3) of the Energy Commission Act 2001, which states that “the Commission shall as soon as possible send a copy of the
statement of accounts certified by the auditors and a copy of the auditor’s report to the minister who shall cause them to be laid before
both houses of parliament, together with a report dealing with the activities of the Commission for the preceding financial year”.
© 2012 Energy Commission, All Rights Reserved
No part of this publication may be reproduced, stored in a retrieval
system or transmitted in any form or by any means, electronic,
mechanical, photocopying, recording or otherwise, without
prior permission of the Energy Commission
Published by:
ENERGY COMMISSION
No. 12, Jalan Tun Hussein, Precinct 2, 62100 Putrajaya, Malaysia
Tel: (603)8870 8500
Fax: (603)8888 8637
Email: [email protected]
Website: www.st.gov.my
Publication number: ST(P) 05/07/2013

3CHAIRMAN’S MESSAGE
CHIEF EXECUTIVE OFFICER’S REPORT
CORPORATE INFORMATION
• Background
• LogoRationale
• Vision,MissionandCoreValues
• EnergyCommissionFunctions
• StrategicObjectives
• EnergyCommissionMembers
• EnergyCommissionCommittees’Meetings
• SeniorManagement
• OrganisationalStructure
2012 AT A GLANCE
• CalendarofEvents
• STinMassMedia
ENSURING RELIABLE AND EFFICIENT ENERGY SUPPLY
AT REASONABLE PRICES
• ElectricitySupplyandDemandSituation
• GenerationSystemPerformance
• TransmissionSystemPerformance
• DistributionSystemPerformance
• ElectricitySupplyInterruptions
• PowerQualityPerformance
• ActionPlantoReducePowerQualityIncidents
• PresentSituationandDevelopmentofSupplyofNatural
Gas and Liquid Petroleum Gas (LPG) Through Pipelines
• ServicePerformanceofGasSupplyThroughPipelines
• FuelPriceMonitoringandElectricityTariff
ENSURING SECURE ENERGY SUPPLY
• ElectricitySupplySituation
• NationalFuelSupplySituationforthe
Generation Sector
• MonitoringGenerationProjects
• ProgressofEnergyGenerationProjects
• StatusofRenewableEnergyGeneration
PROMOTING TRANSPARENT AND COMPETITIVE ENERGY
INDUSTRY
• CompetitiveBiddingProcess
• GridMonitoringSystemandTransmission
• FinancialPerformanceofGenerationLicensees
• GasBillingMechanism
• DisseminationofInformationontheIndustry’sSituation
and Performance
ENSURING EFFICIENT AND SAFE CONSUMPTION OF
ENERGY
• NationalElectricityIntensity
• InitiativestoEncourageEnergyEfficiency
• EnergyEfficiencyIncentives
• ElectricalSafetyDevelopment
ENSURING LEGAL COMPLIANCE
• LicensingandAccreditationActivity
• RegistrationofInstallation
• RegistrationofContractor
• CertificationofCompetency
• ExaminationofCompetency
• RegulationofElectricalEquipment
• MonitoringofGenerationActivities
• ManagementandEngineeringAudit(M&EAUDIT)
• ImplementationofSafetyAudit
• MonitoringandEnforcementActivities
• InvestigationandProsecution
PROTECTING CONSUMERS’ INTERESTS
• EnforcementofTNB’sElectricityServices
Performance Standards
• CustomerComplaints
• PromotingCommunityAwareness
DEVELOPING A ROBUST REGULATORY FRAMEwORk
• ImplementationofThirdPartyAccess(TPA)System
• ImplementationofIncentive-BasedRegulation(IBR)
for Electricity Tariff in Peninsular Malaysia
• DevelopmentofFuelCostsPass-Through(FCPT)
Mechanism
• ImplementationofApplicableCoalPrice(ACP)
Mechanism
• CategoriesofElectricalEquipment
• GuidelinesandCircular
• Re-EvaluatingExistingStudies
• HarmonisingStandardsatRegionalLevel
STRENGTHENING ORGANISATIONAL CAPABILITIES
• EnsuringSustainabilityofOrganisation
• DevelopmentofHumanCapital
• ImprovementofDeliveryServices
• StrengtheningICTSecurity
• InternationalRelations
• CorporateSocialResponsibility
• InternalCommunicationsProgrammes
kEY PERFORMANCE INDICATORS (kPI) REPORT
• KPIAchievementStatusin2012
wAY FORwARD
FINANCIAL STATEMENTS
contents
4
8
13
14
15
15
16
17
18
20
22
24
25
26
31
35
36
38
39
42
46
47
49
51
53
53
57
58
60
63
63
64
67
68
69
70
71
72
75
76
78
78
79
81
82
84
85
85
87
92
93
94
96
98
101
103
104
104
105
109
110
116
116
117
118
120
122
124
125
126
126
128
129
130
130
131
133
134
135
141
4
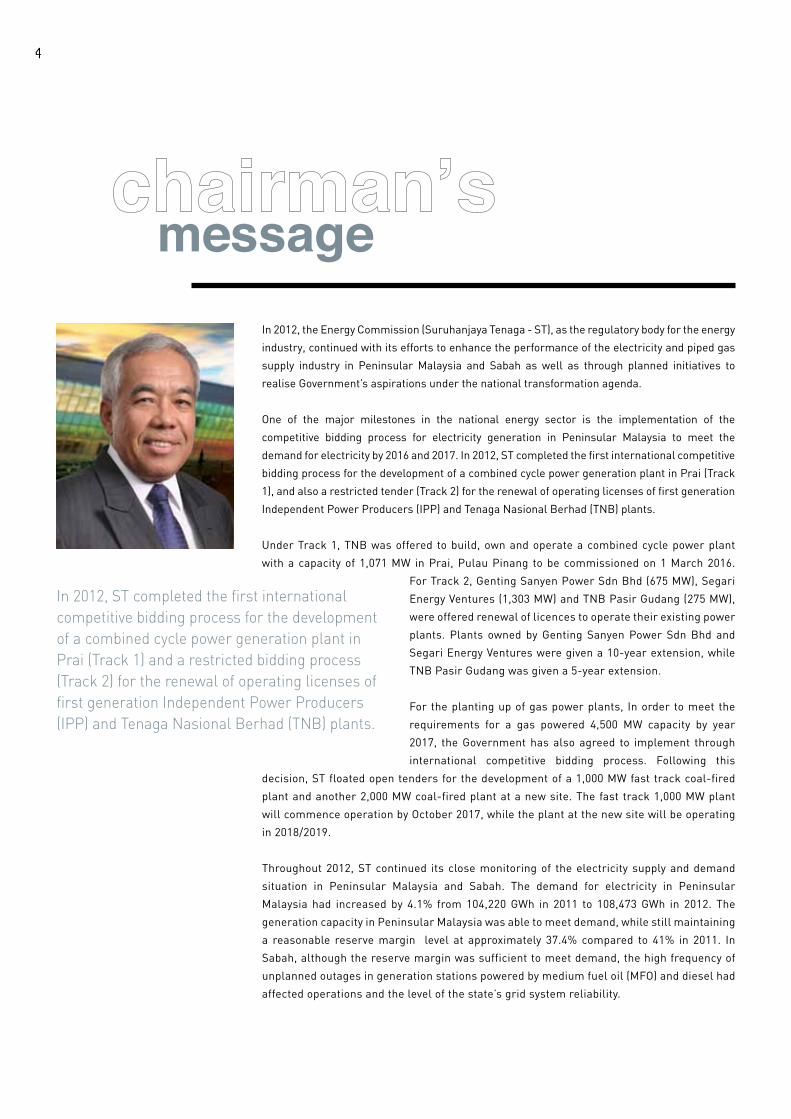
In2012,theEnergyCommission(SuruhanjayaTenaga-ST),astheregulatorybodyfortheenergy
industry, continued with its efforts to enhance the performance of the electricity and piped gas
supply industry in Peninsular Malaysia and Sabah as well as through planned initiatives to
realise Government’s aspirations under the national transformation agenda.
One of the major milestones in the national energy sector is the implementation of the
competitive bidding process for electricity generation in Peninsular Malaysia to meet the
demand for electricity by 2016 and 2017. In 2012, ST completed the first international competitive
biddingprocessforthedevelopmentofacombinedcyclepowergenerationplantinPrai(Track
1),andalsoarestrictedtender(Track2)fortherenewalofoperatinglicensesoffirstgeneration
IndependentPowerProducers(IPP)andTenagaNasionalBerhad(TNB)plants.
UnderTrack1,TNBwasoffered tobuild,ownandoperateacombinedcyclepowerplant
with a capacity of 1,071 MW in Prai, Pulau Pinang to be commissioned on 1 March 2016.
ForTrack2,GentingSanyenPowerSdnBhd(675MW),Segari
EnergyVentures(1,303MW)andTNBPasirGudang(275MW),
were offered renewal of licences to operate their existing power
plants. Plants owned byGenting SanyenPower SdnBhd and
SegariEnergyVenturesweregivena10-yearextension,while
TNBPasirGudangwasgivena5-yearextension.
For the planting up of gas power plants, In order to meet the
requirements for a gas powered 4,500 MW capacity by year
2017, the Government has also agreed to implement through
international competitive bidding process. Following this
decision,STfloatedopentendersforthedevelopmentofa1,000MWfasttrackcoal-fired
plantandanother2,000MWcoal-firedplantatanewsite.Thefast track1,000MWplant
will commence operation by October 2017, while the plant at the new site will be operating
in 2018/2019.
Throughout 2012, ST continued its close monitoring of the electricity supply and demand
situation in Peninsular Malaysia and Sabah. The demand for electricity in Peninsular
Malaysia had increased by 4.1% from 104,220 GWh in 2011 to 108,473 GWh in 2012. The
generation capacity in Peninsular Malaysia was able to meet demand, while still maintaining
a reasonable reserve margin level at approximately 37.4% compared to 41% in 2011. In
Sabah, although the reserve margin was sufficient to meet demand, the high frequency of
unplanned outages in generation stations powered by medium fuel oil (MFO) and diesel had
affected operations and the level of the state’s grid system reliability.
In 2012, ST completed the first international competitive bidding process for the development of a combined cycle power generation plant in Prai (Track 1) and a restricted bidding process (Track 2) for the renewal of operating licenses of first generation Independent Power Producers (IPP) and Tenaga Nasional Berhad (TNB) plants.
message

5
Supply performance based on System Average Interruption
Duration Index (SAIDI) for Sabah was at 556.82 minutes/
customer/year compared to the target of 650 minutes/
customer/year as determined by the Government for 2012.
Nevertheless, the electricity supply performance was below
the expectations of the consumers in Sabah. The inadequate
generation capacity in Sabah needs serious attention and
requires a more comprehensive solution, apart from the short
termmitigationmeasures being undertaken. In this regard,
on 23 April 2012, ST tabled to the Economic Council a proposal
on the strategy and initiatives to enhance the electricity supply
industry in Sabah and in principal the proposal was agreed to
be implemented.
In the peninsula, the gas supply to the electricity sector
has been experiencing constraints since 2011. Gas supply
allocation decreased from 1,250 million standard cubic feet
per day (mmscfd) in 2011 to 1,150 mmscfd in 2012. The gas
supply constraint has prolonged with the postponement
in the completion of the new Liquefied Natural Gas (LNG)
RegasificationTerminal (RGT) inSungaiUdang,Melakafrom
September 2012 to the second quarter of 2013. This new
facility is expected to alleviate the supply problem when the
new RGT starts operating.
The constraint in gas supply caused a marked increase in
electricity generation cost because MFO and distillates was
used as alternative fuels. Electricity also had to be imported
from Thailand. Following this, the Economic Council decided
that the equal sharing of costs between the Government,
PETRONASandTNBforalternativefuelsusedbyTNBhasto
continueuntil thenewLNGRGT inSungaiUdang,Melaka is
operational.
The first alternative fuel cost differential shared among the
Government, PETRONAS and TNB amounted to RM3.069
billion, for the period beginning January 2010 till October
2011. The second amount shared from November 2011 to
March 2012 amounted to RM534 million, while a total of
RM1.063 billion was shared for the period beginning April
2012 until July 2012.
Based on the Economic Transformation Programme (Oil, Gas
and Energy Sector), an expected additional gas supply of 1,230
mmscfd will be required for Peninsular Malaysia in 2020. This
is to cater for an increase of gas demand and the decline of gas
production from domestic gas fields. To ensure transparency
and fairness, ST was recommended to supervise activities for a
competitivegasmarket.STtookseveralmeasurestoimplement
the third party access (TPA) system to create a conducive,
transparent and equitable environment for the gas industry. The
TPA programme is in line with the Government’s initiative to
createanopengasmarket,whichisexpectedtobeimplemented
in Peninsular Malaysia when domestic gas prices are on par with
marketlevels.
ST’s economic regulatory programme implemented through
the Incentive-Based Regulation (IBR) for TNB’s tariff was
executed according to plan. The review of electricity tariff
in the peninsula, based on the IBR framework trial run, will
commence from financial year 2013 until 2014. The IBR
economic regulation regime will spearhead a transformation
in the reviewing and setting of electricity tariff, which will ensure
that only efficient costs are considered during a tariff review. At
the same time, a reasonable rate of return will be given to all
utility companies involved in order to upgrade the performance
of the licensees.
ST is concerned with the dissatisfaction among consumers in
the sectors under its supervision. There were a lot of complaints
regarding the replacement of old meters with digital meters
by TNB that had caused an increase in electricity bills. The
issue of TNB meter integrity that had not been calibrated by
an independent body was raised following complaints from
consumers. Inmitigating this issue,SThadtakenthe initiative
to streamline the supervision of electricity meters by providing
guidelines that set out the processes required for testing and
validatingtheintegrityofTNB’selectricitymeters.
4.1%Increased demand for electricityin Peninsular Malaysia from104.220 GWh in 2011 to108.473 GWh in 2012.

6
On the aspect of safety, ST implements strict measures by
ensuring that all electricity and piped gas competent persons
abides to the regulations. As at the end of 2012, ST had fully
revoked five certificates of competency and suspended two
others.ThisisanindicationofSTtakingstrictactionagainstany
competency certified personnel who flout the regulations.
ST does not compromise on cases involving electrical and piped
gas safety, having huge implications on public safety.
Besidestheregulationfunctions,theMalaysiaEnergyInformation
Hub (MEIH) developed by the ST in 2011 was launched in
February 2012. The MEIH aims to gather energy data and act as a
centre for disseminating and distributing information on national
energy statistics for the industry and the general public, both
local and international. The MEIH is now the point of reference
for many parties and ST aims to develop MEIH as a flagship for
national energy planning.
As for international networking, ST signed a Memorandum
of Understanding with the California Energy Resources
Conservation and Development Commission, USA on 17
May 2012. This joint cooperation programme encompasses
development of competencies in forecasting of energy supply and
demand, management of energy data, planning and development
of energy policies, and the implementation of renewable energy
and energy efficiency programmes.
To anticipate challenges and manage future issues in the national
energy industry, ST drafted a long term plan that is based on
the ST 2010-2020 Transformation Plan. This transformation
has been planned and set as a guide for ST to be a premier and
highly effective energy regulator.
OnbehalfofST,Iwouldliketorecordmysincerestappreciation
forthesupportandcooperationfromYBhg.TanSriPeterChinFah
Kui,theformerMinisterofEnergy,GreenTechnologyandWater
(KeTTHA)andofficersofKeTTHA,togetherwithofficersoffederal
agencies suchas theEconomicPlanningUnit,PEMANDU, the
PublicPrivatePartnershipUnit(UKAS),MyPOWERCorporation
and other Government agencies, including industry players who
have contributed to ST’s achievements to date.
IwouldalsoliketothanktwoformerSTmembers,YBhg.TanSri
Dr.AliHamsawhowasappointedastheChiefSecretarytothe
Governmenton24June2012,andYBhg.Dato’Ir.PuaShienTick,
for all the contribution, commitment, professional input given
and dedication shown throughout their tenure as members of ST.
My gratitude to all members of the ST for their support, together
withthemanagementandstaffofSTfortheirdedicatedworkto
ensure that ST plays an exemplary and effective role as stipulated
under the Energy Commission Act 2001.
TAN SRI DATUk DR. AHMAD TAJUDDIN ALI
Chairman, Energy Commission

7

8
The year 2012 had seen several positive developments in the national electricity and piped
gas supply sectors in the effort to ensure safe and reliable supply at reasonable prices. On
the whole, in Peninsular Malaysia, the performance of electricity supply activities in 2012
had improved with a 12.5% reduction in SAIDI to 60.46 minutes per customer per year,
compared to 69.11 minutes in 2011 and the target of 70 minutes for 2012 as determined by the
Government.
ThetotalnumberofelectricitysupplyinterruptionsinthepeninsulaintheTNBsupplysystemin
2012, decreased from 10.79 for every 1,000 customers in 2011 to 9.56 for every 1,000 customers.
This 11.4% decrease was, among other things, the result of a more detailed monitoring system
andanumberof othersystemenhancement initiatives implementedbyTNBunder theST’s
supervision.
The decline in SAIDI performance in Sabah was due to the
generation and transmission systems, which experienced a 48.2%
surge inSAIDI.However,SAIDIcausedby thedistributionsystem
was successfully reduced by 11% compared to the previous year. The
grid system performance declined drastically, with system minutes
increasing by 87.12% to 71.65 minutes compared to 38.29 minutes
in 2011. Several grid system tripping incidents that involved losses
of more than 50 MW load had occurred. On 30 April 2012, almost
the entire Sabah experienced supply interruptions, except for areas
thatwereoff-grid.Thisincidentwastheresultofanexplosionand
fireatthetransformerofthe66kVPenampang-InanamlineatPMU
Penampang.
In this regard, efforts have been stepped up to overcome the electricity supply issue in Sabah,
includingengagingTNB’sexpertisetostudythegapsintheSabahgridsystem,followedbythe
implementation of a short and medium term action plan to close these gaps. The restoration
plan produced was focused on the modification of the system’s operation procedures to minimise
theriskofoverloadingandtheenhancementoftheprotectionsystemfor11kV,33kVand66kV
linenetworks.TheimplementationofthisrestorationplanwascloselymonitoredbySTandthe
KeTTHA and had shown positive changes to the grid performance at the end of the year.
In Peninsular Malaysia, the power quality issue has to be addressed more effectively. Power
executive officer report
On the whole in Peninsular Malaysia, the performance of electricity supply activities in 2012 had improved with a 12.5% reduction in SAIDI to 60.46 minutes per customer per year, compared to 69.11 minutes in 2011 and the target of 70 minutes for 2012 as determined by the Government.

9
Government to enable any returns gained by Independent Power
Producers (IPP) as a result of current gas prices being different
from the price of gas allocated in the Power Purchase Agreement
(PPA), to be channelled to the consumers. In relation to this, the
Gas Billing Mechanism Committee chaired by ST audited the
useofgasbygas-firedgenerationplantsandendorsedasaving
of RM69.7 million or a monthly average of RM3.167 million
from March 2011 to December 2012, to be credited into the
Consolidated Fund.
In terms of demand for electricity, a 2.3% increase in maximum
demand was recorded for the grid system in Peninsular Malaysia
at 15,826 MW in 2012 compared to 15,476 MW in 2011. The overall
annual demand for energy increased 4.1% from 104,220 GWh in
2011, to 108,473 GWh in 2012. The sale of energy also increased
3.8% to 97,243 GWh compared to 93,640 GWh in 2011.
Based on the rising trend of the maximum demand in the
peninsula grid system, the additional capacity that will be required
to meet projected increases in demand and to compensate for
the operational shutdown of some existing plants, will amount
to 10,882 MW for 2015 until 2020 and 12,213 MW for 2021 until
2030. In this regard, in 2012, ST initiated a bidding process for
3,000 MW additional generation capacity, which will meet the
demand in 2017, 2018 and 2019. To meet the demand after
2020,anoptiontoimportelectricityfromSarawakat2,000MW
capacity commencing in 2021 is being considered. The overall
implementation of development projects for new plants in the
peninsula was progressing as planned.
Toensuregassupplysecurity,STledtheNationalGasTaskForce
(NGT), which monitors the operational shutdowns of upstream
gas facilities and coordinates the implementation of an action
plan to ensure that energy and non-energy sectors in the
peninsula will not be affected. ST also published online reports
regarding the daily situation of energy supply constraints and the
actionbeingtakenbyallagenciesandindustryplayersinvolved
to prevent power supply interruptions in Peninsular Malaysia and
Sabah.
InSabah,severalimmediatemeasuresweretakentoensurethat
the insufficient generation capacity issue did not affect supply
quality incidents increased 10.8% from 93 complaints in 2011 to
103complaints in2012.Several initiativeswere takenwith the
cooperation of the licensees to overcome this issue. This include
providing technical audit services to customers and studying the
baseline for power quality to be used for measuring the level of
power quality in the peninsula, which in turn will become the basis
for a review of national power quality standards. Measurements
had been carried out in 550 industrial, commercial and residential
customers’ premises in the peninsula since 2011 and several
workshopswithindustryplayerswereheldoverthefindingsof
the study.
STalsointroducedtheIBRmechanismtodeterminetheelectricity
tariffrateinPeninsularMalaysia.IBRaimstoenhanceefficiency
within the electricity supply industry by determining tariff based
on the projections of operational costs and assets, in which ST
ensuresthatthereisareasonablerateofreturnthattakesinto
account the interests of consumers and the industry. Any cost
saving by the licensee that does not affect its quality of service
will be shared between the licensee concerned and consumers,
and to be reflected in the next tariff review. On the other hand, a
level of performance that does not meet the service quality target
will be penalised with a reduction in allowable return in the next
tariff implemented. In line with that, ST issued the Regulatory
ImplementationGuidelines(RIGs)toTNBinJanuary2012,which
details11IBRelementstobecompliedwith.
For the financial year 2012, the rate of return on TNB assets
being regulated was 5.5% compared to 1% in 2011, while in
Sabah, a loss amounting to RM50 million was indicated in 2012
by Sabah Electricity Sdn Bhd (SESB), compared to a RM102
millionlossrecordedin2011.ThelossexperiencedbySESBwas
reduced following the implementation of a tariff review in July
2011 and an operational costs reduction initiative. However, the
supply cost recorded was still at a higher level than the returns
gainedthroughSESB’slatesttariff.
The implementation of a new billing mechanism for natural gas
supplied to the energy sector has been running smoothly since it
was introduced in 2011. This mechanism was introduced by the

10
security. However, an incident involving the hijack of barges
carryinggasturbinesfromTelukEwainLangkawitotheKubota
Power Generation Station in Tawau had caused the project
implementation to be postponed to 2013. On a positive note, the
situationisexpectedtoimprovewithtwogas-firedpowerstations
in Kimanis and one plant in LahadDatu coming onlinewith a
total capacity of 700 MW, besides the development of renewable
energy generation projects in the period starting from 2013 until
2016.Duringthisperiodtoo,powergenerationplantsinSabah
using diesel and MFO that are aging and of reduced reliability will
be decommissioned.
In terms of energy efficiency, the national electric intensity
increased slightly by 0.7%, from 0.151 GWh per RM million
GDPin2011to0.152GWhperRMmillionGDPin2012.Aspart
of its activities to encourage energy efficiency, ST approved
82 applications for labeling eight types of energy efficient
equipment, which covers 1,652 models compared to 1,365 models
in 2011. Additionally, a total of 33 energy efficiency projects with
electricity saving potential of 47 GWh annually, were approved
by ST to receive energy efficiency incentives by the Malaysian
IndustrialDevelopmentAuthority(MIDA).
By the end of 2012, a total of 212 Electrical EnergyManagers
were registered compared to 168 as of 2011, while 457 electrical
installations had appointed these managers compared to 249
installations as at the end of 2011. ST also prepared a draft
amendment to the Electricity Regulations 1994 to introduce
Minimum Energy Performance Standard (MEPS), to ensure that
only domestic electrical appliances that fulfill the criteria and
standard for energy efficiency are manufactured and sold in the
country. In line with the introduction of MEPS, ST with SIRIM’s
cooperation, are currently developing Malaysian Standards for a
numberofdomesticelectricalappliances.STwasalsotaskedby
the Government to register Energy Services Companies (ESCOs)
as a step to materialise the concept of implementing Energy
Performance Contracts (EPC) in Government buildings.
As an effort to tackle the issue of the accuracy of new digital
meters used by TNB to replace the oldmeters at customers’
premises, ST equipped itself with meter testing devices
calibrated and certified by SIRIM’s National Metrology
Laboratory, which will become the working standard for
conducting inspection and testing at customers’ premises.
Random meter tests conducted by ST until the end of
2012 inKlangValleyhad indicated that thenewdigitalmeters
complied with the accuracy standards being set namely, not
exceeding ±3%. Nevertheless, ST will continue to expand its
monitoring and testing programme for meters at customers’
premises in response to public complaints on the accuracy of
TNBmeters.
Additionally, ST also developed a structured mechanism for
supervising the manufacturing, testing and calibration of
electricity meters. Among others, a “Guideline for Electricity
Meter:TestingandInitialVerificationRequirements”wasissued
as a regulatory mechanism for electricity meters being used by
electricity supply licensees. Elements of the mechanism cover
the requirements for obtaining patent approval, accreditation
by the manufacturer’s laboratory, audit process, issuance of
approval certificate, introduction of product certification scheme
andtheuseofanST-SIRIMlabelforelectricitymeters.
In terms of electrical safety, the number of electrical accidents
in 2012 decreased by seven cases compared to 2011, from 62 to
55 cases. The number of fatalities for every one million users
had also decreased from 3.42 in 2011 to 3.0 in 2012. In the effort
to enhance the level of electrical safety, ST implemented safety
auditsatutility installations,withTNBPulauPinangbecoming
the first location to be audited. ST also conducted a domestic
user awareness survey on the legal requirements of electrical
safety, which involved 1,000 users in Klang Valley. The survey
showed that only 60% of users were aware of electrical safety
regulations that need to be complied with. As such, ST needs to
improve the implementation of public awareness programmes
on electrical safety regulation and practices.
With regards to regulation of the piped gas supply industry, ST
has focused on efforts to strengthen the industry’s regulatory
framework. A draft amendment to the Gas Supply Act was
prepared, which would allow implementation of economic
regulation on TPA to the importation of gas via the LNG terminal
in Peninsular Malaysia. The volume of gas supply remained at
382 mmscfd and is expected to increase after the LNG terminal

11
becomes operational, following a situation of high latent demand.
Although 2012 was a challenging year for the gas supply situation,
with good coordination at the NGT, gas supplies for consumers
distributed by the Peninsular Malaysia’s gas utility licensee were
wellundertaken.
To ensure that the electrical installations in the country are safe
and reliable in line with regulations, it has become a main priority
to certify there are sufficient numbers of competent persons.
The total electrical competency certifications issued by ST in
2012 was 6,281 compared to 4,418 in 2011. Of this total, 84.2% or
5,286 certifications were issued by accredited institutions while
the remaining 15.8% or 995 certifications were issued by ST. The
issuance of gas competent person certifications had increased
by 51 compared to the previous year.
Meanwhile, six cases were filed in the courts and three persons
found guilty were fined a total of RM71,000.00. Thirty seven
compounds amounting to RM60,000.00 had also been issued by
ST for offences committed by contractors.
Enforcement activities were focused on electricity theft cases
and investigation into complaints pertaining to the accuracy
of electricity meters at consumers’ premises. Focus was also
given to increase monitoring and issuance of warning notices on
premises of manufacturers, importers and sellers of electrical
appliances who failed to obtain the required approval or to label
their equipments.
ST will continue to enhance its enforcement activities to ensure
compliance with electricity and piped gas supply laws by all
parties concerned.
As in previous years, ST conducted thorough investigations in
solving electrical accident cases. The focus of enforcement in
2012 was more towards protection of consumers’ interests. ST
also conducted meter inspections at 328 consumers’ premises
following billing issues that were said to be caused by the change
tonewTNBdigitalmeters.
Emphasis was also on the raising of piped gas safety performance
following gas-related accidents in 2011. A task force thatwas
formed, carried out audits at about 500 outlets in 15 shopping
malls around theKlang Valley in 2012,which covered aspects
of the effectiveness of the persons in charge, daily inspection
programmes and the use of gas safety devices within the premises
audited. ST is also conducting a study on the effectiveness of the
gasodorisationsysteminthegasdeliverypipelinenetworkfor
thecommercial anddomestic sectors in theKlangValley. It is
hoped that the findings of this study will contribute to the increase
ofsafetylevelsforpipedgasconsumersespeciallyinhigh-rise
buildings. In relation to this, ST will continue to enhance its
enforcement activities to ensure compliance with electricity and
piped gas supply laws by all parties concerned.
ST continued to organise promotions and information
dissemination programmes aimed at industry players,
students, the mass media and the general public. The channel
for information dissemination was also expanded. Apart from
extensive coverage via interviews on electronic media programs,
a number of the print media had also featured specific coverage
on topics such as the international bidding process, fraudulent
energy saving devices, electrical safety measures and energy
efficiencypromotion.Forthefirsttime,STpublishedBULETINST
inJuneandDecember2012,asanenergyindustrymagazinethat
focuses on ST’s major initiatives and programmes implemented.
Furthermore, 107 seminars and 63 dialogues were jointly
organisedbySTandotherpartiessuchasTNB,SESB,KPDNKK,
SIRIM, NGOs and local authorities.
In line with ST’s effort to enhance its organisational capability
to be in line with the latest developments, a service delivery
enhancement initiative was implemented through the
development of an Online Application System, which offers
thee-Gasande-Electricity systems for convenience in licence
application and application for competency certification.
Lastbutnot least, I take thisopportunity toconveymyutmost
appreciation for the commitment and support from the Minister
andDeputyMinisterofEnergy,GreenTechnologyandWaterand
theSecretaryGeneralandstaffofKeTTHA.Myappreciationas
welltoallSTMembersfortheirguidanceandsupport.Thankyou
alsotoallSTstafffortheirhardwork.TheachievementsofSTin
2012 as reported here would not have been possible without their

12
cooperation and full support. I hope all the efforts that we have
strived for will be raised to a new level in the future so that we
may together achieve the vision of ST becoming an effective and
capable regulatory body in energy matters.
Thankyou.
DATUk IR. AHMAD FAUZI HASAN
Chief Executive Officer, Energy Commission

13
ST is a statutory body responsible for regulating the energy
sector particularly the electricity and piped gas supply industries
in Peninsular Malaysia and Sabah. ST ensures safe and reliable
supply of electricity and piped gas to consumers at reasonable
prices.
CorporateInformation

14
information
In its efforts to further enhance the performance of the energy
supply industry, the Malaysian Government had established
ST under the Energy Commission Act 2001 on 1 May 2001. The
Commission became fully operational on 1 January 2002 and
assumedalltheresponsibilitiesoftheDepartmentofElectricity
and Gas Supply which was dissolved on the same date.
The energy sector in Malaysia had undergone significant
changes since the 1990s, driven by the Government’s aim to
enhance energy supply security, improve efficiency and quality in
utility services and increase the private sector’s participation in
infrastructure development.
The Commission’s responsibilities are outlined in the Energy
Commission Act 2001 and other acts and regulations as follows:
• ElectricitySupplyAct1990.
• GasSupplyAct1993.
• LicenseeSupplyRegulations1990.
• ElectricityRegulations1994.
• GasSupplyRegulations1997.
• ElectricitySupply(CompoundingofOffences)
Regulations 2001.
• GasSupply(CompoundableOffences)Order2006.
• EfficientManagementofElectricalEnergy
Regulations 2008.
BACkGROUND

15
LOGO RATIONALE
The logo of the Energy Commission (ST) was created from the alphabets ‘S’ and ‘T’
modified and pictured as a dominant logo type. The swift curves of the combined
alphabets represent the dynamic and critical role of the ST in the industry and the
national economy.
Thesemi-circleshapeof‘S’and‘T’symbolisesreadinessofSTtocontrolandprotect
the industry and consumers towards achieving a level of quality as envisioned by the
ST. The chosen colour of rusty red portrays natural resource that produces energy,
strength and determination of excellence. The chosen cobalt blue represents the
trust and confidence towards ST.
VISION, MISSION AND CORE VALUES
ST strives to be a highly effective energy regulator as well as the
authority on energy matters.
ST aims to balance the needs of consumers and providers of
energy to ensure safe and reliable supply at reasonable prices,
protect public interest, and foster economic development and
competitivemarketsinanenvironmentallysustainablemanner.
Core values that are being upheld in all our operations and
activities are:
• Excellence.
• Reliability.
• Senseoffairnessandfairplay.

16
THE ENERGY COMMISSION FUNCTIONS
• To advise the Minister on all matters pertaining to the
objectives of the national energy supply policy, and supply
and use of electricity and piped gas.
• To implement, enforce and review laws on energy supply
(namely the Electricity Supply Act 1990 and the Gas Supply
Act 1993).
• To encourage efficiency, economy and safety in the supply
and use of electricity and piped gas.
• To encourage and protect competition, ensure a fair and
efficientmarketandpreventthemisuseofmonopoly.
• Toencouragetheusageofrenewableenergyandconservation
ofnon-renewableenergy.
• Toencourageresearch,developmentand theusageofnew
techniques in supplying and using of electricity and piped gas.
• To encourage the development of electricity and piped gas
supply industry.
• Topromoteself-regulationintheindustry.
MONITORING AND ENFORCEMENT ACTIVITIES
• Monitoring
- licenseeserviceperformanceandaccreditation.
- statusofelectricity,pipedgasandgenerationfuelsupply.
• Inspectionandaudit
- supplierandconsumerinstallations.
- licenseesandaccreditation.
- equipmentmanufacturers,importersandsellers.
- competencytraininginstitutes.
• Competencytests(written,oralandpractical).
• Reviewoftariffandchargesforelectricity/pipedgasand
generation fuel prices.
• Investigationoncomplaints,accidentsandoffences.
• Legalaction.
• Arbitrationofdisputes.
• Raisingofawareness.
Licensing and Accreditation Activity
ST issues the following licence and accreditation to the electricity
and piped gas supply industry:
• Licenceforelectricityandpipedgassupplytoothersand/or
own consumption.
• CertificateofCompetencyforcompetentpersons.
• Registrationofcontractorfirms.
• Commissioningofcompetencytraininginstitutes.
• Registrationofenergyefficiencymanagers.
• Equipmentapproval.
• Registrationofelectricalinstallations.
• Pipedgasinstallationapprovals.
• Registrationofenergyservicesfirms.

17
Planning and Development Activity
• Legalrequirementsandindustrialpractices
- Acts, regulations, licence terms and performance
standards.
- Codes,guidelines,circularsanddirectives.
• Regulatoryframework
- incentivebasedelectricityandpipedgastariff.
- TPAtogasinfrastructure.
• NationalEnergyDatabase
- PublicationoftheNationalEnergyBalanceReport.
• Powergenerationcapacity
- Preparationofnewpowergenerationcapacitydevelopment
plans.
- Selectionofpowergenerationdevelopersviaopenbidding
process.
• Resolution of issues and enhancement of industry
performance.
• Electricitysupplyindustryreformationprogramme.
STRATEGIC OBJECTIVES
• Ensuringareliableandefficientenergysupplyatreasonable
prices.
• Ensuringenergysupplysecurity.
• Encouragingatransparentandcompetitiveenergyindustry.
• Ensuringefficientandsafeenergyconsumption.
• Ensuringlegalcompliance.
• Protectingconsumerinterest.
• Developingarobustregulatoryframework.
• Enhancingorganisationalcapability.
18
commission members
19
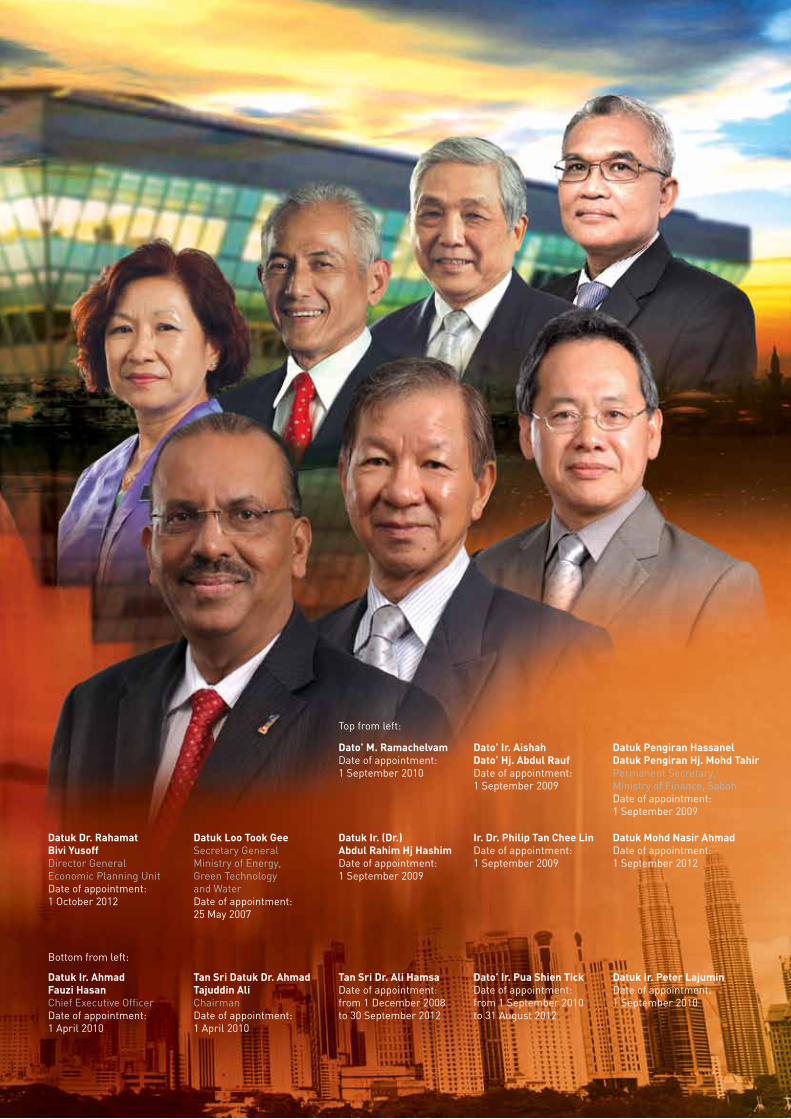
Datuk Dr. RahamatBivi YusoffDirectorGeneralEconomic Planning Unit Dateofappointment:1 October 2012
Datuk Mohd Nasir AhmadDateofappointment:1 September 2012
Dato’ Ir. AishahDato’ Hj. Abdul RaufDateofappointment:1 September 2009
Datuk Loo Took GeeSecretary General Ministry of Energy, Green Technology and Water Dateofappointment:25 May 2007
Dato’ M. RamachelvamDateofappointment:1 September 2010
Ir. Dr. Philip Tan Chee LinDateofappointment:1 September 2009
Datuk Pengiran Hassanel Datuk Pengiran Hj. Mohd TahirPermanent Secretary,Ministry of Finance, SabahDateofappointment:1 September 2009
Datuk Ir. (Dr.)Abdul Rahim Hj HashimDateofappointment:1 September 2009
Top from left:
Datuk Ir. AhmadFauzi HasanChief Executive OfficerDateofappointment:1 April 2010
Dato’ Ir. Pua Shien TickDateofappointment:from 1 September 2010to 31 August 2012
Tan Sri Dr. Ali HamsaDateofappointment:from1December2008to 30 September 2012
Datuk Ir. Peter LajuminDateofappointment:1 September 2010
Tan Sri Datuk Dr. AhmadTajuddin AliChairmanDateofappointment:1 April 2010
Bottomfromleft:

AN
NU
AL
REP
OR
T 20
1220
energy commission meetings
Energy Commission MeetingsNo. Date Day Time Venue
1/2012 20 January 2012 Friday 9.30 am ST Meeting Room, Putrajaya
2/2012 19 March 2012 Monday 9.30 am ST Meeting Room, Putrajaya
3/2012 15 June 2012 Friday 9.30 am ST Meeting Room, Putrajaya
4/2012 20 July 2012 Friday 3.00 pm ST Meeting Room, Putrajaya
5/2012 7 September 2012 Friday 3.00 pm ST Meeting Room, Putrajaya
6/2012 5 November 2012 Monday 2.30 pm ST Meeting Room, Putrajaya
Energy Commission Special MeetingsNo. Date Day Time Venue
1/2012 3 February 2012 Friday 8.30 am CempakaRoom,HyattRegencySabah, KotaKinabalu
2/2012 20 February 2012 Monday 11.30 am ST Meeting Room, Putrajaya
3/2012 9 March 2012 Friday 2.30 pm ST Meeting Room, Putrajaya
4/2012 29 March 2012 Thursday 4.00 pm ST Meeting Room, Putrajaya
5/2012 17 April 2012 Tuesday 5.00 pm ST Meeting Room, Putrajaya
6/2012 24 May 2012 Thursday 3.30 pm ST Meeting Room, Putrajaya
7/2012 8 August 2012 Wednesday 5.30 pm ST Meeting Room, Putrajaya
8/2012 14December2012 Friday 3.00 pm ST Meeting Room, Putrajaya
energycommision committees’ meetings
Joint Licensing Committee Meeting (Management and Energy Commission) No. Date Day Time Venue
1/2012 16 January 2012 Monday 9.30 am ST Meeting Room, Putrajaya
2/2012 6 March 2012 Tuesday 9.30 am ST Meeting Room, Putrajaya
3/2012 24 May 2012 Thursday 9.30 am ST Meeting Room, Putrajaya
4/2012 11 July 2012 Wednesday 9.30 am ST Meeting Room, Putrajaya
5/2012 24 October 2012 Wednesday 10.00 am ST Meeting Room, Putrajaya
6/2012 27December2012 Thursday 2.30 pm ST Meeting Room, Putrajaya
Management Members DirectorofElectricitySupplyandMarketRegulationDirectorofEnforcementandRegionalCoordinationDirectorofEnergyManagementandIndustryDevelopmentDirectorofGasSafetyandSupplyRegulation
OFFICE BEARERS:
Chairman Dato’Ir.AishahDato’HajiAbdulRauf
MembersDatukIr.AhmadFauziHasan DatukIr.PeterLajumin Dato’Ir.PuaShienTick(Up to 31 August 2012)
DatukMohdNasirAhmad(Commencing 7 November 2012)

21
Energy Commission Finance and Audit Committee Meeting (as of 17 April 2012)No. Date Day Time Venue
1/2012 24 February 2012 Friday 3.00 am ST Meeting Room, Putrajaya
OFFICE BEARERS:
Chairman DatukIr.(Dr.)AbdulRahimHajiHashim
Members Dato’Ir.AishahDato’HajiAbdulRauf Ir.Dr.PhilipTanCheeLin
Invited Member DatukIr.AhmadFauziHasan
Energy Commission Audit Committee Meeting 2012 (formed on 17 April 2012)No. Date Day Time Venue
1/2012 5 June 2012 Tuesday 10.30 am ST Meeting Room, Putrajaya
2/2012 3December2012 Monday 9.30 am ST Meeting Room, Putrajaya
Invited Member DatukIr.AhmadFauziHasan
Members DatukIr.PeterLajumin(Commencing 7 November 2012)
Dato’M.Ramachelvam Dato’Ir.PuaShienTick(Up to 31 August 2012)
OFFICE BEARERS:
Chairman DatukIr.(Dr.)AbdulRahimHajiHashim DatukIr.PeterLajumin(Up to 7 November 2012)
Energy Commission Finance and Tender Committee Meeting 2012 (formed on 17 April 2012)No. Date Day Time Venue
1/2012 2 May 2012 Wednesday 2.30 pm ST Meeting Room, Putrajaya
2/2012 2 August 2012 Thursday 2.00 pm ST Meeting Room, Putrajaya
3/2012 24 October 2012 Wednesday 2.30 pm ST Meeting Room, Putrajaya
4/2012 27December2012 Thursday 10.00 am ST Meeting Room, Putrajaya
Chairman DatukMohdNasirAhmadHashim DatukIr.(Dr)AbdulRahimHajiHashim (Up to 7 November 2012))
MembersDatukIr.AhmadFauziHasan Dato’Ir.AishahDato’HajiAbdulRauf Ir.Dr.PhilipTanCheeLin
OFFICE BEARERS:
Remuneration and Nomination Committee Meeting No. Date Day Time Venue
1/2012 9 March 2012 Friday 10.30 am ST Meeting Room, Putrajaya
2/2012 9 July 2012 Monday 3.00 pm ST Meeting Room, Putrajaya
3/2012 17 October 2012 Wednesday 11.30 am ST Meeting Room, Putrajaya
4/2012 14 November 2012 Wednesday 4.30 pm ST Meeting Room, Putrajaya
Chairman TanSriDatukDr.AhmadTajuddinAli
MembersDatukIr.AhmadFauziHasan Dato’M.Ramachelvam Ir.Dr.PhilipTanCheeLin
OFFICE BEARERS:

22
Datuk Ir. Ahmad Fauzi HasanChief Executive Officer
Ir. Azhar OmarSeniorDirectorElectricity Supply andMarketRegulationDepartment
Mohd. Elmi Anas DirectorEnergy Management and Industry DevelopmentDepartment
Ir. Othman OmarDirectorEnforcement and Regional CoordinationDepartment

23
Ir. Abdul Rahim IbrahimDirectorElectrical Safety RegulationDepartment
Asma Aini Mohd NadzriDirectorCorporate Services Department
Ir. Ahmad Nornadzmi Datuk Dr. DzulkarnainDirectorGas Safety and Supply RegulationDepartment
management team

AN
NU
AL
REP
OR
T 20
1224
structure
ELECTRICITY SUPPLY AND
MARkET REGULATION
ENERGY MANAGEMENT AND INDUSTRY DEVELOPMENT
ENFORCEMENT AND
REGIONAL COORDINATION
CHIEF EXECUTIVE OFFICER
INTERNAL AUDIT
COMMISSION SECRETARY
LEGAL
LICENSING FINANCEENERGY
RESOURCE DEVELOPMENT
ELECTRICAL EQUIPMENT
GAS SUPPLYAND
PRICING
INVESTIGATION AND
PROSECUTION
CAPACITY PLANNING
HUMANRESOURCE
DEMAND SIDE MANAGEMENT ELECTRICAL
COMPETENCY
GASCOMPETENCYENFORCEMENT
SUPPLY AND MONITORING
SERVICES
ADMINISTRATION AND FACILITIES MANAGEMENT
PROMOTION ANDCOMMUNICATION
ENERGYINFORMATION
ELECTRICITY SAFETY
DEVELOPMENT
GASSAFETY
ELECTRICITY MARkET
OPERATION
kNOwLEDGE MANAGEMENT AND
TECHNOLOGY
EXTERNAL RELATIONS AND COMPLAINTS
MANAGEMENT
INDUSTRY DEVELOPMENT
GAS SAFETYAND SUPPLY
DEVELOPMENT
ELECTRICITY PRICING
REGIONAL OFFICENEGERI
SEMBILAN AND
MELAkA
REGIONAL OFFICE
SELANGOR, wP kL AND PUTRAJAYA
REGIONAL OFFICEJOHOR
REGIONAL OFFICEPULAU
PINANG, kEDAH AND
PERLIS
REGIONAL OFFICEPERAk
REGIONAL OFFICE
PAHANG
REGIONAL OFFICE
kELANTAN AND
TERENGGANU
REGIONAL OFFICEwEST
SABAH
REGIONAL OFFICE
EAST SABAH
PROCUREMENT
CHAIRMAN
ELECTRICAL SAFETY
REGULATION
GAS SAFETYAND SUPPLY REGULATION
CORPORATESERVICES

25
2012At a Glance

AN
NU
AL
REP
OR
T 20
1226
11 January 2012MeetingwithUniversitiTeknologiMalaysia(UTM) to initiate cooperation between ST and Research Alliance (RA) UTM
17 January 2012Meeting on the installation of protection device for water heating equipment with manufacturers and importers of water heaters.
17 February 2012A group of 30 ST staff received the Excellent Service Award 2011 during the ST Appreciation Night.
28 February 2012‘National Energy Security Conference’ organised by ST with the theme ‘Closing the EnergySupply-DemandGap’
16 March 2012Interview segment on RTM’s ‘Selamat Pagi Malaysia’withIr.OthmanOmar,STDirectorof Enforcement and Regional Coordination Department.
10 March 2012AdelegationfromAsia-PacificEconomicCooperation(APEC)visitedtheSTDiamondBuilding.
March 2012STtabledaworkingpaperatthe‘EnergyRegulation and the Promotion of Energy Conservation’,conferenceinBangkok,Thailand.
january february march
calendar

27
18 April 2012Piped Gas Safety Seminar themed ‘Prevention isBetterThanCure’organisedbyST.
24 April 2012BrainstormingsessiononReviewofEligibilityCriteria for Special Industrial Tariff by stakeholders(KeTTHA,PEMANDU,MyPowerandTNB).
31 May 2012STopeneditsboothattheCIDBAwarenessSeminar On Green Technology.
17 May 2012Memorandum of Understanding signing ceremony between ST and California Energy ResourcesConservationandDevelopmentCommission (CEC), USA.
23 May 2012ST opened an exhibition booth at the ‘One Million Youths Gathering 2012’ organised by the Ministry of Youth and Sports, Malaysia.
april may june
16 June 2012BriefingonmeterreadingbyTenagaNasionalBerhadforSTOfficers.
2-4 June 2012STparticipatedintheKuenChengHighSchoolScience Camp exhibition to raise students’ awareness on electrical and piped gas safety.
5 June 2012BriefingonmeterreadingbyTenagaNasionalBerhadforthefirstbatchofSTOfficers.
AN
NU
AL
REP
OR
T 20
1228
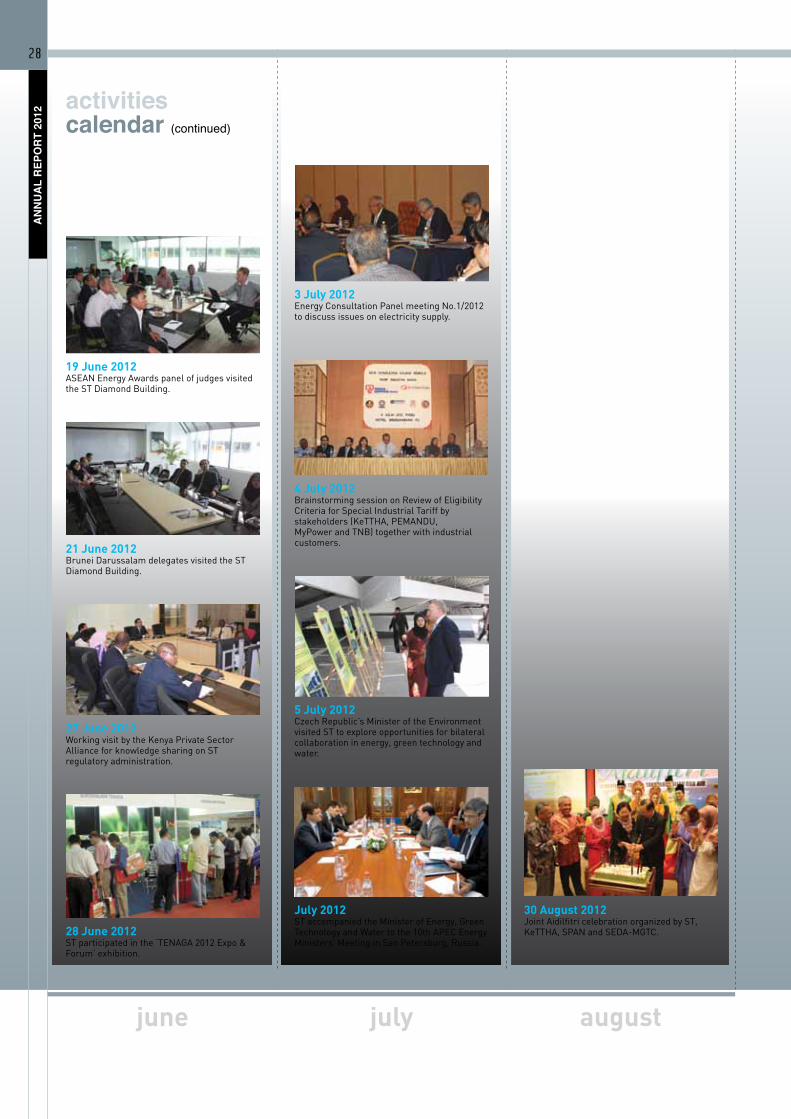
3 July 2012Energy Consultation Panel meeting No.1/2012 to discuss issues on electricity supply.
July 2012ST accompanied the Minister of Energy, Green Technology and Water to the 10th APEC Energy Ministers’ Meeting in San Petersburg, Russia.
5 July 2012CzechRepublic’sMinisteroftheEnvironmentvisited ST to explore opportunities for bilateral collaboration in energy, green technology and water.
4 July 2012BrainstormingsessiononReviewofEligibilityCriteria for Special Industrial Tariff by stakeholders(KeTTHA,PEMANDU,MyPowerandTNB)togetherwithindustrialcustomers.
june july august
30 August 2012JointAidilfitricelebrationorganizedbyST,KeTTHA,SPANandSEDA-MGTC.28 June 2012
STparticipatedinthe‘TENAGA2012Expo&Forum’ exhibition.
27 June 2012WorkingvisitbytheKenyaPrivateSectorAllianceforknowledgesharingonSTregulatory administration.
21 June 2012BruneiDarussalamdelegatesvisitedtheSTDiamondBuilding.
19 June 2012ASEAN Energy Awards panel of judges visited theSTDiamondBuilding.
activitiescalendar (continued)

29
september september october
9 October 2012VisitorsfromVietnamattheSTDiamondBuilding.
2 October 2012VisitbyUpperAustria’sMinisterofEconomytotheSTDiamondBuilding.
9 October 2012Media conference announcing the selected bidderfortheInternationalOpenBidding(Track1)andtheFirstGenerationIPP/TNBLimitedBidTrack2).
13 September 2012STorganisedaone-dayMeetTheCustomersDayinTawau,Sabah.
11 September 2012Energy Supply Law Training Programme for ST Officers.
12 September 2012ST’sDiamondBuildingsecuredthemostenergy-efficientbuildingaccoladefor‘NewandExistingBuildings’attheAseanEnergyAwards(AEA) 2012 in Phnom Penh, Cambodia.
12 September 2012STjoinedtheKeTTHAdelegationtothe30thAsean Ministers on Energy Meeting (AMEM) and its Associated Meetings in Phnom Penh, Cambodia.
27 September 2012STorganisedaone-dayMeetTheCustomersDayinKuantan,Pahang.
25 September 2012DialoguebetweenSTandTNBtodiscussthe quality and level of service for electricity supply provided by utilities.
19 September 2012User Requirement Specification (URS) ECOS OnlineSystemworkshop.

AN
NU
AL
REP
OR
T 20
1230
october november
21 November 2012Courtesy call from the Ministry of Energy, RepublicofKenya.
19 December 2012Stakeholders‘EngagementonPowerQualityManagement’workshop.
19 December 2012Seminar on Energy Efficiency initiatives for Government buildings.
14 December 2012Energy Consultation Panel meeting No.2/2012 to discuss issues on electricity supply.
8 December 2012FamilyDayatZooNegara,KualaLumpur.
december
23 October 2012STparticipatesintheEastAsiaSummit-EnergyMarketDeregulationForum,Singapore.
23 October 2012VisittoJimahEnergyVenturesinPortDicksonby members of the ASEAN Agreement on Coal Use and Trading (ACUT).
21 October 2012VisitbytheSeniorPolicyAdvisorfromthePrimeMinister’sDepartmentoftheBahamastotheSTDiamondBuilding.
13 October 2012Exhibition at the 3rd International GreenTech and Eco Products Exhibition and Conference Malaysia (IGEM 2012) and Malaysia GreenTech Awards.
activitiescalendar (continued)

31
in mass media

AN
NU
AL
REP
OR
T 20
1232
STin mass media (continued)

33
34

35
ST balances the interests of society with industry players in
ensuring that the national energy supply progresses in line
with global trends. The following report presents the national
electricity supply and demand situation, and covers the systems
for power generation, transmission and distribution; quality of
power; supply of piped natural gas and Liquefied Petroleum Gas
(LPG), including monitoring of fuel prices and electricity tariff.
ENSURINGRELIABLEANDEFFICIENTENERGY SUPPLY AT REASONABLEPRICES

AN
NU
AL
REP
OR
T 20
1236
ELECTRICITY SUPPLY AND DEMAND SITUATION
Peninsular MalaysiaThe maximum demand on the Peninsular Malaysia grid system
in 2012 had increased by 2.3% to 15,826 MW, as recorded at
16:00, 20 June 2012 compared to 15,476 MW in 2011. The highest
daily energy demand, at 328.72 GWh, was recorded on the same
day – an increase of 3.2% from 318.40 GWh in 2011.
GENERATION PROFILE ON 20 JUNE 2012 (wEDNESDAY)
Time
18,000
16,000
14,000
12,000
10,000
8,000
6,000
4,000
2,000
0
Max
imum
dem
and
0:00
1:30
3:00
4:30
6:00
7:30
9:00
10:3
0
12:0
0
13:3
0
15:0
0
16:3
0
18:0
0
19:3
0
21:0
0
22:3
0
Mw
S.Rsv
IC
Distillate
ST-Oil
ST-Gas
Co-Gen
OCGT
Hydro
CCGT
Coal
The overall annual energy demand increased approximately
4.1% from 104,220 GWh in 2011 to 108,473 GWh in 2012. Energy
sales also increased to 97,243 GWh, or a 3.8% rise compared to
93,640 GWh in 2011.
Generation capacity had decreased to 21,749 MW following the
relocation of a 68MW gas turbine from the Teluk Ewa power
station in Langkawi to Tawau, Sabah. Of the overall installed
generationcapacity,41.7%(9,072MW)iswholly-ownedbyTenaga
NasionalBerhad(TNB),comprising1,911MWfromhydroelectric
stations, 5,061 MW from thermal stations and 2,100 MW from
coal-fired stations. Meanwhile, Independent Power Producers’
(IPP) plants contributed 58.3% (12,677 MW) to the overall power
generation capacity in Peninsular Malaysia.
INSTALLED GENERATION CAPACITY AND MAXIMUM DEMAND
IN PENINSULAR MALAYSIA 2012
BasedontheTestedAnnualAvailableCapacity(TAAC)ofallpower
generation stations, the capacity stood at 21,369 MW. A total
of8,828MWor41.3%of thiscapacitywasrecorded fromTNB
wholly-ownedpowerstations,withtheremaindercontributedby
independent power producers’ stations.
The generation capacity in Peninsular Malaysia had met demand
sufficiently for 2012 and the system’s reserve margin remained
at a satisfactory 37.4% compared to 41% in 2011.
BREAkDOwN OF INSTALLED CAPACITY BASED ON GENERATOR
TYPE
Type Main Fuel Mw
Solid Cycle Gas Turbine Gas 9,373
Conventional Thermal Coal 7,170
Conventional Thermal Gas 840
Open Cycle Gas Turbine Gas 2,455
Open Cycle Gas Turbine Distillate -
Hydroelectric Hydro 1,911
Total Installed Capacity 21,749
SabahThe decreased generation capacity in Sabah requires attention.
This decrease had resulted from the outage of the Sandakan
Power Corporation’s (SPC) 32 MW power generator station on
May 2012, following serious damage of its diesel engine.
The situation was exacerbated by the frequency of unplanned
outages at the 47.5 MW ARL Power station and company cash
flow issues, which had affected the supply of fuel and lubricant to
the Stratavest station.
Moreover, several SESB power generation stations had also
ensuring reliable and efficient energy supply at reasonable prices
2010 2011 2012
25,000
20,000
15,000
10,000
5,000
0
15,072
21,817
15,476
21,817 21,749
Mw
15,826
14,7
77
7,04
0 12,6
77
9,07
214,7
77
7,04
0
TNB Generation Capacity Generation Capacity IPP
Total Generation Capacity Maximum Demand
Year

37
recorded low levels of readiness and reliability. In 2012, the highest
maximum demand on the grid system in Sabah was recorded at
828.4 MW on 24 May 2012, which is a 0.2% decrease as compared
to 830.1 MW in 2011.
MAXIMUM DEMAND AND DAILY OPERATIONAL RESERVE IN
SABAH 2012
The total installed capacity in Sabah, which stood at 1,265 MW, had
decreased by 32 MW following the outage at SPC. To boost capacity,
existing stations such asRanhill Powertron I andSepangarBay
Power Corporation contributed a total of 14 MW in July 2012,
besides capacity acquisition exercise and enhancement of diesel
poweredgeneratorsownedbySabahElectricitySdnBhd(SESB).
Taking into account derated capacity and constraints on the
generation system at Sabah power stations, the reliable capacity
stood at 1,130 MW. Of this total, 673.5 MW comprised generation
capacity owned by IPPs, 417.3 MW by SESB and 39.5 MW by
renewable energy power stations.
RELIABLE GENERATION CAPACITY AND MAXIMUM DEMAND IN
SABAH 2012
0.0%
1.0%
2.0%
3.0%
4.0%
5.0%
6.0%
7.0%
8.0%
9.0%
Dec
Nov
Oct
Sep
Aug
Jul
Jun
May
Apr
Mar
Feb
Jan
Gas Hydro Distillate Renewable Energy
Percentage
Month
2010 2011 2012
Generation Capacity Maximum Demand
1400
1200
1000
800
600
400
200
0
Mw
1,168 1,130
779.7830.1 828.4
Year
1,111
Operational Reserve Maximum Demand Reliable Capacity Installed Capacity
Date
1400
1200
1000
800
600
400
200
0
Installed Generation1,265 MW
Maximum Demand828.4 MW
24 May 2012
Outage SPC 32 MW
Reliable Generation 1,130 MW
29 J
an
25 M
ar
20 M
ay
1 Ju
l
9 Se
p
4 N
ov
12 F
eb
22 A
pr
17
Jun
12 A
ug
7 O
ct
2 D
ec
15 J
an
1 Ja
n
26 F
eb
11 M
ar
6 M
ay
8 A
pr
3 Ju
n
15 J
ul29
Jul
23 S
ep
18 N
ov
26 A
ug
21 O
ct
16 D
ec30
Dec
Mw
Although the generation reserve margin in Sabah was sufficient
to meet demand, the high frequency of unplanned outages for
Medium Fuel Oil (MFO) and diesel-fired stations had affected
operations and reliability of the grid system in Sabah.
Transitioning to a more efficient generation system, almost 50%
of power generation in Sabah is seen moving towards natural gas
for fuel. The development of renewable energy projects in Sabah
had also contributed to the increase in capacity and reduced
dependence on diesel as fuel for power generation.
INSTALLED GENERATION CAPACITY (SABAH)
Fuel
Installed Generation
Capacity (Mw)
Reliable Capacity (Mw)
Sabahwest Coast(Mw)
SabahEast
Coast(Mw)
Total(Mw)
Percentage(%)
Gas 641 599 0 599 53%
MFO 152 47 96 143 13%
Diesel 356 79 200 279 25%
Hydro-electric
76 74 2 76 7%
Biomass 40 0 33 33 3%
Total 1,265 799 331 1,130 100%
A total of 5,478 GWh was generated in Sabah, of which 3,816 GWh
(69.6%) was generated from gas; 1,068 GWh (19.5%) generated
from MFO and diesel; 414.4 GWh (7.6%) from hydro power and
179.6 GWh (3.3%) generated from renewable energy in 2012.
POwER GENERATION COMBINATION BASED ON FUEL TYPE
2012

AN
NU
AL
REP
OR
T 20
1238
IPP 2011
IPP 2012
SESB 2011
SESB 2012
Effic
ienc
y (%
)
Combined Cycle Diesel
Types of Plant
40.00
35.00
30.00
25.00
20.00
15.00
10.00
5.0
0
1,168
38.0
5
38.7
2
24.9
0
26.7
3
38.6
9
38.2
0
29.0
6
27.7
2
Solid Cycle
OpenCycle
Conventional (Coal)
Types of Plant
Conventional (Oil&Gas)
Hydro
20
16
12
8
4
0
EUO
F (%
) IPP 2011
TNB 2011
IPP 2012
TNB 2012
3.95 5.
53.
27 3.48
0.71 0.98 1.
711.
32
10.6
1
6.07
5.62
17.5
32.
960.
46 0.93 1.
90
Solid Cycle
Open Cycle
Conventional (Coal)
Conventional (Oil&Gas)
Hydro
100
80
60
40
20
0
EAF
(%) IPP 2011
TNB 2011
IPP 2012
TNB 2012
88.5
784
.95 95
.10
94.1
4
94.5
397
.56
95.1
094
.14
80.5
2
84.1
8
87.4
382
.46
85.4
288
.53
92.3
4
90.7
7
Types of Plant
GENERATION SYSTEM PERFORMANCE
Peninsular Malaysia
Thermal Efficiency
Overall, power generation stations in Peninsular Malaysia had
shown consistent performance and increase in average thermal
efficiency, while performance among conventional generation
stations owned by TNB that use oil or gas had decreased
compared to 2011 because of the age factor and degradation.
AVERAGE THERMAL EFFICIENCY
Efficiency performance for combined cycle gas-fired power
stationshadincreasedslightlyespeciallyforTNBownedstations,
following the implementation of a scheduled maintenance
programme that was conducted throughout the year, apart from
a prevailing high level of average capacity factor. The records
showthatgasuseamonggas-firedpowerplantsin2012wasat
372,739 mmscf (million standard cubic feet) compared to 337,151
mmscf in 2011.
Equivalent Availability Factor (EAF)
An increase of 7% and 10% in EAF was achieved by power
generation stations in Peninsular Malaysia. All combined cycle
power stations recorded an average EAF of 94% to 95%, while
theaverageEAFforcoal-firedstationswasthelowestataround
84%.
PLANT EQUIVALENT AVAILABILITY FACTOR (EAF)
Equivalent Unplanned Outage Factor (EUOF)
With the increase in EAF as stated earlier, the EUOF recorded in
2012 had also improved.
The lower EUOF recorded was closely linked to the better
performance in gas supply for 2012, which had enabled gas and
coal-firedpowerstationstoimplementscheduledmaintenance
as planned, hence improving station reliability and reducing
unplanned outages.
EQUIVALENT UNPLANNED OUTAGE FACTOR (EUOF)
Sabah
Thermal Efficiency
In 2012 power stations in Sabah demonstrated a better average
thermal efficiency compared to 2011, except for diesel powered
stationsownedbySESBthathadshownaslightdecrease.
Gas-firedpowerstations,especiallythoseownedbySESB,had
achieved better performance following a high level of operations
at all times to compensate for a reduced generation capacity.
THERMAL EFFICIENCY
ensuring reliable and efficient energy supply at reasonable prices (continued)
Types of Plants
Solid Cycle
Open Cycle
Conventional (Coal)
Conventional (Oil&Gas)
50
40
30
20
10
0
IPP 2011
TNB 2011
IPP 2012
TNB 2012
43.9
8
27.0
9
40.8
4
22.3
0
43.9
6
26.7
7
44.3
4
26.2
9
35.1
1
35.5
3
30.5
827
.27 32
.34
26.6
0
Ave
rage
The
rmal
Effi
cien
cy (%
)

39
The rate of EUOF in 2012 had improved compared to 2011
whencombinedcycleanddiesel-firedpowerstationsrecorded
significant decreases. The EUOF for diesel power stations had
decreased from a rate of 30.8% to 20.8%, while the EUOF for
combined cycle power stations had decreased from 11.5% to
6.6%. However, these rates were still high and were above those
that were determined based on engineering best practices.
TRANSMISSION SYSTEM PERFORMANCE
Peninsular Malaysia
System Reliability
TheoverallTNBtransmissionsystemperformanceinPeninsular
Malaysia had shown that theDeliveryPointUnrealibility Index
(DePUI)forthenationalgridremainedatasatisfactoryleveland
did not breach the set target of 1 minute.
DELIVERY POINT UNREALIBILITY INDEX (DEPUI)
–SYSTEM MINUTES
In 2012 four tripping incidents occured in the transmission
system in Peninsular Malaysia with a loss of load of more than 50
MW, compared to five incidents 2011.
Considering that the decrease was only by one incident (20%)
compared to 2011, the transmission system performance in
Peninsular Malaysia remained at the same level as that in 2011.
No load-shedding incidents were reported while unsupplied
energy had decreased to 212.7 MWh compared to 225.2 MWh
in 2011.
Syst
em M
inut
es
Year
1.20
1.00
0.80
0.60
0.40
0.20
0.002011
0.86
2012
0.95
Equivalent Availability Factor (EAF)
However, EAF indicators for electricity generation stations in
Sabah had decreased by an average of 2% and 11%. This was
caused by the frequency of outages in power stations that had
encountered problems. The EAF for hydroelectric generation
had declined due to a generator flashover incident that had
required the shutdown of Unit 1 at the Tenom Pangi station from
June toAugust. Theoutageof the stationownedbySandakan
PowerCorporationSdnBhd (SPC) had also contributed to the
EAF decline.
STATION EQUIVALENT AVAILABILITY FACTOR
Equivalent Unplanned Outage Factor (EUOF)
Based on engineering best practices, EUOF target is normally
set at 4% for combined cycle and open cycle power stations, and
6% for thermal stations using oil, gas and coal as fuel.
EQUIVALENT UNPLANNED OUTAGE FACTOR
IPP 2011
IPP 2012
SESB 2011
SESB 2012
100
90
80
70
60
50
40
30
20
10
0Diesel Hydro
Types of Plant
Combined Cycle
95.1
993
.92
70.9
173
.43
71.7
274
.57
58.5
360
.76
90.6
886
.23
EAF
(%)
35
30
25
20
15
10
5
0
IPP 2011
IPP 2012
SESB 2011
SESB 2012
Combined Cycle Diesel Hydro
Types of Plant
3.31
1.88
11.4
96.
59
27.0
623
.66
30.7
920
.77
0.94
10.3
4
EUO
F (%
)
AN
NU
AL
REP
OR
T 20
1240
2008 2009 2010 2011 2012
7
6
5
4
3
2
1
0
Num
ber
of In
cide
nts 6
6
0 0 0
1
0
2
2
4 4
No. of Trips No. Shedding No. Incidents
4 4
5
4
Year
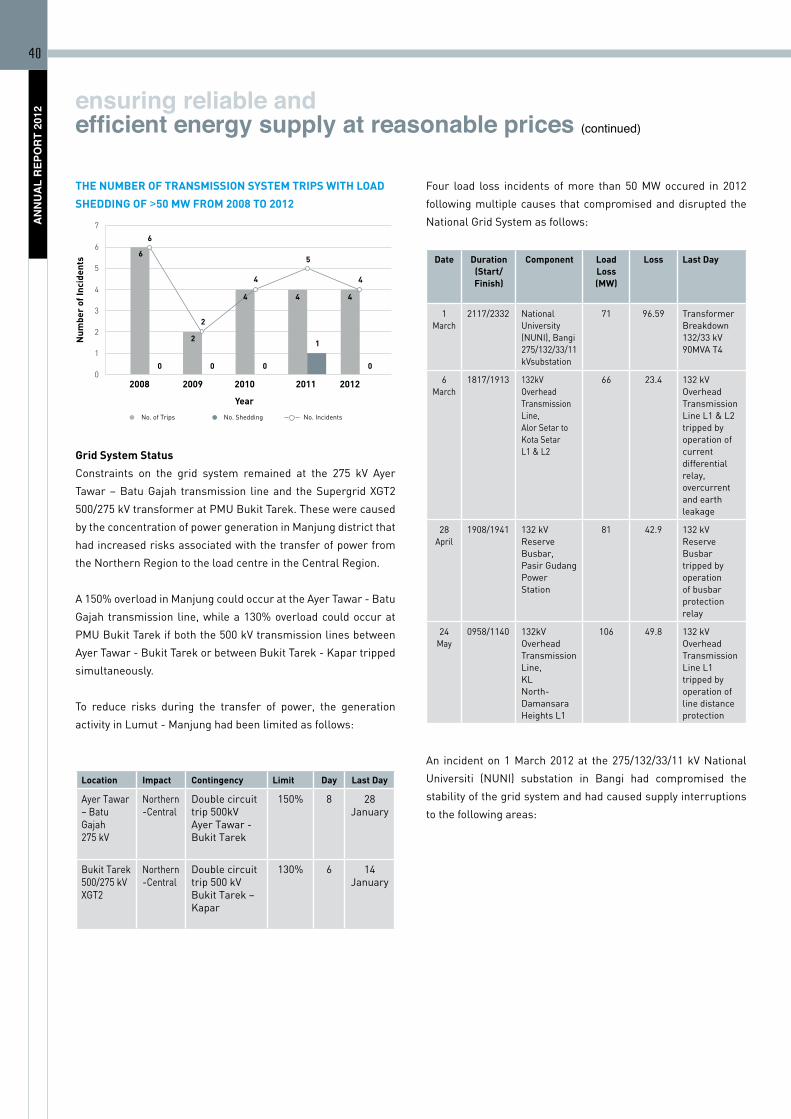
THE NUMBER OF TRANSMISSION SYSTEM TRIPS wITH LOAD
SHEDDING OF >50 Mw FROM 2008 TO 2012
Grid System Status
Constraints on the grid system remained at the 275 kV Ayer
Tawar–BatuGajah transmission lineand theSupergridXGT2
500/275kVtransformeratPMUBukitTarek.Thesewerecaused
by the concentration of power generation in Manjung district that
hadincreasedrisksassociatedwiththetransferofpowerfrom
the Northern Region to the load centre in the Central Region.
A150%overloadinManjungcouldoccurattheAyerTawar-Batu
Gajah transmission line, while a 130% overload could occur at
PMUBukitTarekifboththe500kVtransmissionlinesbetween
AyerTawar-BukitTarekorbetweenBukitTarek-Kapartripped
simultaneously.
To reduce risks during the transfer of power, the generation
activityinLumut-Manjunghadbeenlimitedasfollows:
Location Impact Contingency Limit Day Last Day
Ayer Tawar –BatuGajah 275kV
Northern -Central
Doublecircuittrip500kVAyerTawar-BukitTarek
150% 8 28 January
BukitTarek500/275kVXGT2
Northern -Central
Doublecircuittrip500kVBukitTarek–Kapar
130% 6 14 January
Four load loss incidents of more than 50 MW occured in 2012
following multiple causes that compromised and disrupted the
National Grid System as follows:
Date Duration (Start/Finish)
Component Load Loss(Mw)
Loss Last Day
1March
2117/2332 National University (NUNI),Bangi275/132/33/11 kVsubstation
71 96.59 Transformer Breakdown132/33kV90MVAT4
6March
1817/1913 132kVOverhead Transmission Line, Alor Setar to KotaSetarL1&L2
66 23.4 132kVOverhead Transmission LineL1&L2tripped by operation ofcurrent differential relay, overcurrent and earth leakage
28 April
1908/1941 132kVReserve Busbar,Pasir Gudang Power Station
81 42.9 132kVReserve Busbartripped by operation of busbar protection relay
24 May
0958/1140 132kVOverhead Transmission Line, KLNorth-DamansaraHeights L1
106 49.8 132kVOverhead Transmission Line L1 tripped by operation of line distance protection
An incidenton1March2012at the275/132/33/11kVNational
Universiti (NUNI) substation in Bangi had compromised the
stability of the grid system and had caused supply interruptions
to the following areas:
ensuring reliable and efficient energy supply at reasonable prices (continued)

41
In 2012, several tripping incidents in the Sabah grid system that
had caused load shedding of 50 MW and above were recorded.
A major incident occurred on 30 April 2012 with a load shedding of
475 MW and 163,351.8 MW min of unsupplied power contributed
196.79 to the system minutes in Sabah. The incident was the
resultofatransformerfireatthe66kVPenampang–Inanamline
at PMU Penampang, which caused almost the whole of Sabah
tolosepowersupplyexceptforareasthatwereoff-gridsuchas
Telupid.
Meanwhile, a voltage surge incident was reported on 1 May 2012
with a load shedding of 89.56 MW.
DELIVERY POINT UNRELIABILITY INDEX (DEPUI)
– THE SYSTEM MINUTES FOR SABAH GRID
Planned and Unplanned Outage
SabahstilllackspowergenerationcapacityespeciallyinitsEast
Coast area. This is due to the frequent breakdowns of aging
diesel powered generation stations and continuous operations
that had forced maintenance to be deferred.
StratavestSdnBhd(Stratavest)andSandakanPowerCorporation
(SPC) are among the major power generation in the Sabah East
Coast. Stratavest is still facing financial constraints that had
affected the supply of MFO and cylinder lubricant for its power
generation unit. Meanwhile, SPC’s generation unit has been
out of commission since 2011 and the company had stopped its
operations in May 2012.
300
250
200
150
100
50
0
Min
ute
2011
38.29
2012
71.65
268.44
Including Major Incidents Not Including Major Incidents
Note:Datafor2011until2012followsSESBcalendar
Year
Transmission Line Area Involved
Serdang–AbuBakarBaginda132kVLine1&Line 2
Serdang
NationalUniversiti–BangiHeight132kVLine2
Bangi
Arab Malaysian Industrial – NilaiLine1132kV
Arab Malaysian Industrial
Sg.SemenyihWaterWorks–NationalUniversity132kVLine 2
Sg.SemenyihWaterWorks
Kajang–CherasJaya132kVLine 1
Bothsides(Kajang&CherasJaya)
BusCoupler i) Kajang132kVii) AbuBakarBaginda11kViii)AbuBakarBaginda33kViv) AbuBakarBaginda132kVv) NationalUniversiti33kVvi) NationalUniversiti11kV
Sabah
System Reliability
Reduced generation capacity and low reliability levels remained
a challenge for Sabah in 2012.
This was due to the age factor of existing power stations and
outages at high capacity power stations, which also exposed the
Sabah electricity supply system to load management and load
shedding incidents.
The System Minutes for the Sabah grid in 2012 had shown a
substantial increase of 87.12% to 71.65 minutes compared to
38.29 minutes in 2011, excluding major incidents. The increase
indicated that the average performance of the transmission
systemownedbySabahElectricitySdnBhd(SESB)haddeclined
compared to the previous year and had exceeded the annual
target of 25 minutes for 2012.

AN
NU
AL
REP
OR
T 20
1242
These incidents had affected the overall generation capacity in
Sabah in 2012 when power generation stations in the West Coast
had to compensate for the decreased capacity in the East Coast.
In 2012, planned outages amounting to 52.3 MW or 5% of reliable
capacity and forced outages amounting to 203.5 MW or 18% of
reliable capacity had occurred in Sabah. Meanwhile, the yearly
average generation capacity experienced a deration during grid
operation at 33.2 MW or 3%. This meant that only 841 MW or 74%
ready capacity was available for meeting the rising maximum
demand in Sabah in 2012.
Demand Side Management - DSM and Under Frequency Load
Shedding - UFLS
In2012,SESBhadtoexecuteDSMandUFLSmorefrequentlyto
prevent a wider interruption to the overall grid system in Sabah.
AnincreaseinDSMandsignificantloadsheddingwererecorded
after Ranhill Powertron I station encountered problems with its
GT1Agenerationuniton5December2012.ThisDecember2012
incidenthadrecorded thehighestaccumulatedannualDSMand
load shedding at 53.3 MW and 59.3 MW respectively. The highest
UFLS in 2012 was on 8 March 2012 that involved a load shedding
of72.3MW.Thisfollowedthetrippingofthe132kVPenampang–
Beaufortlineandthe132kVPenampang–Paparline,whichhad
compromised the transmission of power from generation stations
in Sabah.
DSM AND UNDER FREQUENCY LOAD
SHEDDING IN SABAH 2012
110.0
100.0
90.0
80.0
70.0
60.0
50.0
40.0
30.0
20.0
10.0
0
Mw
Load Shedding
DSM
Date
1 Ja
n 11
Jan
21 J
an31
Jan
10 F
eb
20 F
eb1
Mar
11 M
ar21
Mar
31 M
ar10
Apr
20 A
pr30
Apr
10
May
20
May
30
May
9 Ju
n 19
Jun
29
Jun
9
Jul
19 J
ul
29 J
ul
8 A
ug
18 A
ug28
Aug
7 Se
p 17
Sep
27
Sep
6
Nov
16
Nov
26
Nov
6
Dec
16 D
ec
26 D
ec
Generation Unit Outage Incident
On5December2012,aforcedoutageofgenerationunitGT1Aat
theRanhillPowertronIstationwascausedbythebreakdownof
several components in its compressor and stator blades.
Following the incident, Sabah lost 99.5 MW from a reliable
capacity of 1,130 MW, which had destabilised the grid system
due to Ranhill Powertron I being one of the major generation
stations in Sabah West Coast. The situation had forced all power
generation stations to operate at full capacity to prevent a grid
system collapse. At the same time, a high percentage of outage
at 256.4 MW (23%) in Sabah did not help to alleviate the situation.
As the available capacity was lower than the system demand,
electricity supply was disrupted in several areas in the Sabah
West Coast following inadequate generation capacity.
The available capacity andmaximum demand on 5 December
2012 stood at 803 MW and 774 MW respectively, while operating
reserve was only at 29 MW or 2.6%. Operating the grid at that
level of available capacity and a slim margin of operating reserve
hadcompelledSESBtoexecuteDSMandUFLSmorefrequently
in order to stabilise the system. As a result of the damage, the
situation was expected to continue until early 2013.
The volume of energy generated on the day of the incident was
3,957 MWh (25%) from diesel, 10,144 MWh (63%) from gas, 1,386
MWh (8% ) from hydro and 524 MWh (3%) from biomass.
DISTRIBUTION SYSTEM PERFORMANCE
SAIDI (System Average Interruption Duration Index)
Peninsular Malaysia
Overall,themonthlySAIDIin2012hadshownadecreasingtrend
compared to the monthly SAIDI in 2011, except for the SAIDI
in June, September, November and December. The SAIDI for
Decemberwas the highest compared to othermonths at 6.32
minutes/customer, due to the increase in interruptions in the
medium voltage system.
ensuring reliable and efficient energy supply at reasonable prices (continued)

43
Month
Jan Feb Mar Apr May Jun Jul Aug Sep Oct Nov Dec Accumulation(Jan-Dec)
70
60
50
40
30
20
10
0
Min
ute/
cust
omer
7.22 6.95 6.76 6.89 6.33 6.32
69.11
4.65 4.654.94 4.994.425.41 5.29 5.385.57 5.57 5.844.67 4.874.27 4.194.18 3.906.31
Enhanced TOMS2011 Enhanced TOMS2012
60.46
COMPARISON OF MONTHLY AND YEARLY SAIDI IN PENINSULAR MALAYSIA IN 2011 AND 2012
Onthewhole,TNBelectricitysupplyperformancefor2012had
improved with a 12.5% decrease in SAIDI to 60.46 minutes/
customer/year compared to 69.11 minutes/customer/year in
2011andthesetSAIDItargetof70minutes/customer/year.
SAIDI (MINUTES/CUSTOMER/YEAR) IN PENINSULAR
MALAYSIA FROM 2008 TO 2012
Year
100.0
80.0
60.0
40.0
20.0
0
TOMS
Enhanced TOMSSA
IDI
87.3
2008 2009
66.1
2012
60.46
2010
96.25
62.9
2011
69.11
The medium voltage system remained the biggest contributor
totheoverallSAIDIcomparedtolowandhighvoltagesystems.
Nevertheless, the medium voltage system SAIDI in 2012 had
shown a decreasing trend to 49.30 minutes/customer/year
compared to 63.25 minutes/customer/year in 2011.
Action Plan to Reduce SAIDI
Peninsular Malaysia
In2012,TNBhadimplementedseveralactionplanstoreducethe
maincausesofSAIDInamely,interruptionstolowandmedium
voltage systems for every state in the peninsula. Interruption
to low voltage systems caused by damaged Insulating Piercing
Connectors (IPC) still recorded the highest percentage compared
to other causes.
Inordertotacklethisproblem,TNBhadfocusedonstatesand
areaswithhighinstancesofdamagetotheIPC.Actionstakenby
TNBincluded:
•Morestringentchecksduringhandoverofnewprojects;
•Providing refresher courses to supervisors and contractors;
and
•Evaluationofengineeringpractices(handholdinginitiative).
Apartfromthat,themainfocusofTNB’sactionplanwastargeted
at the reduction of interruptions at the medium voltage supply
system, which contributed more than 90% to the TNB SAIDI
index. Attention was given to the underground cable systems,
cable connections, third party damage and termination of cables,
which accounted for more than 70% of the medium voltage
supply system interruptions.

AN
NU
AL
REP
OR
T 20
1244
Year
3,000
2,500
2,000
1,500
1,000
500
0
SAID
I
Distribution Transmission&Generation TotalSAIDI
2008
1,07
877
81,
856
2009
739
2,12
92,
868
2010
434 68
725
4
2012
267
55728
9
2011
19529
9
495
Sabah
Continuous monitoring of Sabah’s electricity supply system
performancewascarriedoutin2012toensurethatthesetSAIDI
targetswere achievable. TheSAIDI achievements inSabah for
2012 were as follows:
2012 target(minutes/customer)
2012 Achievement
(minutes/customer)
2011 Achievement
(minutes/customer)
Sector 1 400 376.62 307.66
Sector 2 700 677.78 632.28
Sector 3 700 1,048.67 990.80
Overall 650 556.82 494.66
Throughout 2012 there were several critical issues that had
affected the electricity supply system in Sabah:
• The failure of several high capacity generation stations to
operateduetobreakdowns.
• ThefragiletransmissionlinegridsystemnetworkinSabah
that is prone to outages as a result of aging equipment.
Asof31December2012,theSAIDIforthewholeofSabahstood
at 556.82 minutes/customer/year, representing a 12.5% increase
from 495 minutes/customer/year achieved in 2011.
Thiswastheresultofa48.2%increaseinSAIDIinthegeneration
andtransmissionsystemsin2012comparedto2011.TheSAIDI
for the distribution system had decreased by 11% compared to
the previous year.
ANNUAL SAIDI (MINUTES/CUSTOMER/YEAR) FOR SABAH
FROM 2008 TO 2012
Some short term measures that have been implemented for
every state in Peninsular Malaysia were as follows:
• Cableinsulationtesting;
• PartialDischargeTestforundergroundcables;
• Replacing high risk old cable with Paper Insulated Lead
Cover (PILC) cables; and
• Replacingoldcablesendterminationswithnewones.
In2012,TNBcontinuedwith its implementationofa longterm
measure involving system improvement projects in every state in
Peninsular Malaysia as follows:
• Upgrading of cable sizes, such as from 25mm2 PILC to
150mm2CrossLinkedPolyEthyleneCable(XLPE);
• Installing new feeders from Main Intake Substations/Main
DistributionSubstations;
• Replacingmedium voltage cables havingmany joints as a
result of frequent damages;
• Constructionofnewsubstationstoovercomelowvoltages;
• Replacingmediumvoltagecablesthatcausebottlenecks;
• Creatingaringsystembetweensubstations;
• ReplacingRingMainUnits(RMU)atsubstationswithVacuum
CircuitBreakers(VCB);
• ReplacingPILCcableswithXLPEorAerialBundledCable
(ABC)formediumvoltageoverheadlines;
• Enhancingtransformercapacity;
• Installingauto-recloserswitchgears toovercome frequent
system trips due to transient faults;
• ReplacingoldswitchgearswithnewRMUs;
• Changing cable routes affected by development and road
widening; and
• Replacingsubstationsonpoleswiththoseonlandtoexpedite
repairs and restoration of supply during interruptions.
ensuring reliable and efficient energy supply at reasonable prices (continued)

45
Among constraints faced by SESB during transmission line
rentice clearing operations were as follows:
• Reluctance among farm/private land owners to cut trees,
especially oil palm trees, fearing that this will affect the
growth of other healthy trees.
• Landownersintentionallyplantingtreesclosetotherentice
line in the hope of being compensated in the event these
trees were cut.
• Areasovergrownwithbambooplantsthatwereplantedasa
measure against landslides.
• Treesoutside the rentice line fallingon transmission lines
during landslides/soil movement.
kulim Hi-Tech Park (kHTP)
SAIDIat theKHTP in2012as reportedbyNURDistributionSdn
Bhdhad increasedto33.23minutes/customer/yearcomparedto
7.88 minutes/customer/year in 2011. This increase was the result
ofthree11kVcablefaultincidentsinApril2012(2incidents)and
September 2012 (1 incident), which involved a large number of
consumers. This had contributed 29.2 minutes/customer/year or
88%oftheoverallyearlySAIDIfor2012.However,noincidentswas
reportedforhighvoltageindustryconsumersattheKHTPin2012.
TOTAL SAIDI (MINUTES/CUSTOMER/YEAR) AND SAIDI FOR
INDUSTRY (HIGH VOLTAGE CONSUMERS ONLY) FOR kULIM
HI-TECH PARk FROM 2008 TO 2012
2008 2009 2010 2008 2012
40.00
35.00
30.00
25.00
20.00
15.00
10.00
5.00
0.00
SAID
I
0 00.852
33.23
0.1542.50 3
0
TotalSAIDI IndustrySAIDI
8.84 7.88
Therewerethree11kVcablefaultincidentsinApril 2012 (2) and September 2012 (1), which
involved a large number of consumers
Year
Among the number of action plans for reducing Sabah Electricity
Sdn Bhd’s (SESB) SAIDI was the creation of a Handholding
TaskGroupInitiativebetweenTNBandSESB,whichcomprised
short and medium term initiatives for resolving electricity
supply interruption issues, especially those involving SESB
transmission, distribution and generation. Short term initiatives
includedcreatingaradialconfigurationfor66kVlines,expediting
distance protection, reviewing of Under Frequency Load
Shedding(UFLS)system,reviewingofblackstartoperationand
generation restoration system, plus the review of distribution
feederprotectionsystem.MediumterminitiativesinvolvedVAR
Management Control for Sabah’s grid system, a scheme for
overhead transmission lines protection system and intensifying
the Condition Base Maintenance (CBM) regime for medium
voltage overhead transmission lines. These activities were fully
completed in September 2012, bringing improvements especially
in the transmission sector.
Additionally, SESB had also given a major focus on reducing
electricity supply interruptions caused by trees, which amounted
to 19% of the total electricity supply interruptions in Sabah.
TheactionplancarriedoutbySESBforcurtailinginterruptions
caused by trees were as follows:
• ReplacementofbareconductorcableswithAerialBundled
Cable(ABC)forhighvoltageandPVCInsulatedConductorfor
low voltage system. A total of RM5.9 million was allocated for
the project to replace bare conductor cables with insulated
ones for the 2013 financial year.
• Installationofauto-recloser(AR)tominimisethedurationof
interruptions.
• Creation of new injection points to minimise the
number of consumers affected in any interruption.
• Intensifyingclearingoftransmissionlinerentice.
• Targetinga9%reductionininterruptionsandSAIDIcausedby
foliage for the 2013 financial year.
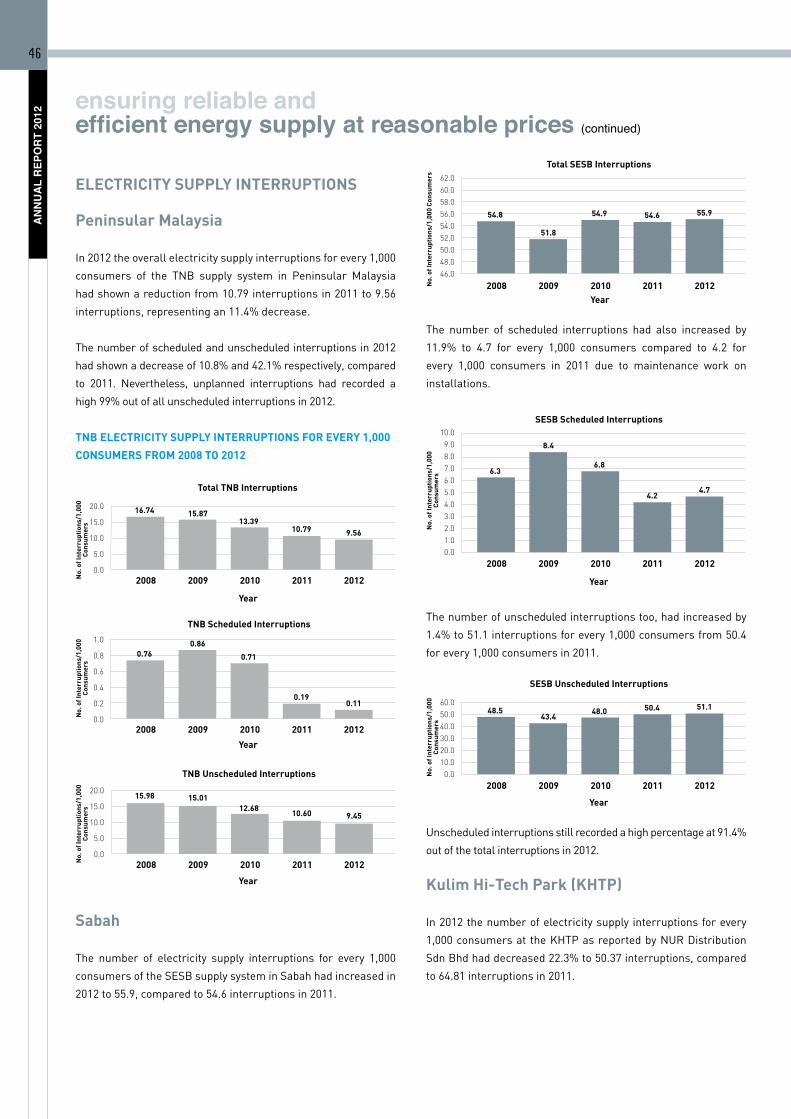
AN
NU
AL
REP
OR
T 20
1246
2008 2009 2010 2011 2012
62.060.058.056.054.052.050.048.046.0
51.8
54.9 54.6 55.9
Total SESB Interruptions
Year
No.
of I
nter
rupt
ions
/1,0
00 C
onsu
mer
s
54.8
The number of scheduled interruptions had also increased by
11.9% to 4.7 for every 1,000 consumers compared to 4.2 for
every 1,000 consumers in 2011 due to maintenance work on
installations.
2008 2009 2010 2011 2012
10.09.08.07.06.05.04.03.02.01.00.0
6.3
8.4
6.8
4.24.7
SESB Scheduled Interruptions
Year
No.
of I
nter
rupt
ions
/1,0
00
Con
sum
ers
The number of unscheduled interruptions too, had increased by
1.4% to 51.1 interruptions for every 1,000 consumers from 50.4
for every 1,000 consumers in 2011.
SESB Unscheduled Interruptions
2008 2009 2010 2011 2012
60.050.040.030.020.010.0
0.0
48.543.4
48.0 50.4 51.1
Year
No.
of I
nter
rupt
ions
/1,0
00
Con
sum
ers
Unscheduled interruptions still recorded a high percentage at 91.4%
out of the total interruptions in 2012.
kulim Hi-Tech Park (kHTP)
In 2012 the number of electricity supply interruptions for every
1,000consumersat theKHTPasreportedbyNURDistribution
SdnBhdhaddecreased22.3%to50.37interruptions,compared
to 64.81 interruptions in 2011.
ELECTRICITY SUPPLY INTERRUPTIONS
Peninsular Malaysia
In 2012 the overall electricity supply interruptions for every 1,000
consumers of the TNB supply system in Peninsular Malaysia
had shown a reduction from 10.79 interruptions in 2011 to 9.56
interruptions, representing an 11.4% decrease.
The number of scheduled and unscheduled interruptions in 2012
had shown a decrease of 10.8% and 42.1% respectively, compared
to 2011. Nevertheless, unplanned interruptions had recorded a
high 99% out of all unscheduled interruptions in 2012.
TNB ELECTRICITY SUPPLY INTERRUPTIONS FOR EVERY 1,000
CONSUMERS FROM 2008 TO 2012
No.
of I
nter
rupt
ions
/1,0
00
Con
sum
ers
Total TNB Interruptions
Year
2008 2009 2010 2011 2012
16.74 15.8720.0
15.0
10.0
5.0
0.0
13.3910.79 9.56
No.
of I
nter
rupt
ions
/1,0
00
Con
sum
ers
TNB Scheduled Interruptions
Year
0.86
2008 2009 2010 2011 2012
1.0
0.8
0.6
0.4
0.2
0.0
0.190.11
0.76 0.71
No.
of I
nter
rupt
ions
/1,0
00
Con
sum
ers
TNB Unscheduled Interruptions
2008 2009 2010 2011 2012
15.98 15.01
Year
20.0
15.0
10.0
5.0
0.0
12.6810.60 9.45
Sabah
The number of electricity supply interruptions for every 1,000
consumersoftheSESBsupplysysteminSabahhadincreasedin
2012 to 55.9, compared to 54.6 interruptions in 2011.
ensuring reliable and efficient energy supply at reasonable prices (continued)

47
Total NUR Distribution Sdn Bhd Interruptions
2008 2009 2010 2011 2012
41.63
80.0
60.0
40.0
20.0
0.0
43.27
64.8150.37
YearNo.
of I
nter
rupt
ions
/1,0
00 C
onsu
mer
s
51.60
The number of unscheduled and scheduled interruptions for
every 1,000 consumers had also decreased by 38.7% and
11.6% respectively, compared to 2011. However, scheduled
interruptions had recorded a higher percentage of 69% compared
to unscheduled interruptions, which contributed 31% of the total
number of interruptions.
POwER QUALITY PERFORMANCE
Peninsular Malaysia
In Peninsular Malaysia, power quality performance is measured by the SARFIX index whereby (x) is the maximum level of recorded cases.
For example, SARFI90 means the average number of voltage dip incidents with voltage dipping below 90% of the normal value.
TomonitorSARFIperformance,atotalof150powerqualityrecordingdeviceswereinstalledin2012atmainintakestations(PMU)in
several states in Peninsular Malaysia. Industrial consumers submitted complaints about voltage dips that were recorded at these 150
Primary Substations installed with power quality recorders. Statistics for average voltage dip incidents that were reported according to
voltage levels for states in the peninsula are shown below.
SARFIX FOR 11 kV, 22 kV, 33 kV VOLTAGE LEVEL AND OVERALL SYSTEM FOR
PENINSULAR MALAYSIA STATES IN 2012
StateSARFIx - System 11 kV SARFIx - System 22 kV SARFIx - System 33 kV SARFIx - Overall System
90 80 70 50 40 10 90 80 70 50 40 10 90 80 70 50 40 10 90 80 70 50 40 10
Johor 5.60 2.90 1.80 0.50 0.20 0.10 8.38 6.08 4.15 0.77 0.31 0.15 6.00 2.50 1.50 - - - 6.16 4.16 2.84 0.60 0.24 0.12
Kedah 7.20 3.80 1.80 0.80 0.40 - - - - - - - 14.86 8.57 6.29 0.71 0.57 0.14 10.69 6.08 4.00 0.54 0.38 0.08
Kelantan - - - - - - - - - - - - 58.33 35.67 28.67 3.33 2.67 1.67 58.33 35.67 28.67 3.33 2.67 1.67
Melaka 5.63 4.38 2.75 0.75 0.50 0.13 - - - - - - - - - - - - 5.63 4.38 2.75 0.75 0.50 0.13
N. Sembilan 4.89 2.33 1.78 0.44 0.22 - - - - - - - 13.00 5.00 3.00 1.00 - - 5.70 2.60 1.90 0.50 0.20 -
Pahang 9.13 4.63 2.63 1.38 1.13 0.13 - - - - - - - - - - - - 8.11 4.11 2.33 1.22 1.00 0.11
P. Pinang 1.75 0.50 0.50 0.25 0.25 - - - - - - - 7.14 2.29 1.43 0.86 0.71 0.14 5.18 1.64 1.09 0.64 0.55 0.09
Perak 9.44 5.78 3.11 1.56 1.00 0.22 - - - - - - 10.86 4.71 2.14 - - - 8.53 4.53 2.35 0.82 0.53 0.12
Perlis 19.00 13.00 6.00 2.00 1.00 - - - - - - - 16.00 8.00 6.00 3.00 1.00 - 13.00 8.50 5.00 2.50 1.00 -
Selangor - - - - - - - - - - - - 3.88 1.33 0.83 0.33 0.29 0.21 3.72 1.28 0.80 0.32 0.28 0.20
Terengganu 11.29 6.14 3.29 1.86 1.43 0.43 - - - - - - 8.00 4.00 3.00 2.00 2.00 - 10.63 5.75 3.25 1.88 1.50 0.38
K.Lumpur 3.33 2.00 0.67 - - - - - - - - - 4.58 1.83 1.17 0.67 0.42 0.25 3.73 1.53 1.00 0.53 0.33 0.20
Putrajaya/Cyberjaya
10.33 3.67 2.33 1.67 1.33 - - - - - - - 18.00 7.00 4.00 2.00 2.00 - 9.25 3.50 2.25 1.25 1.25 -
TNB 6.32 3.72 2.13 0.90 0.63 0.12 7.79 5.64 3.86 0.71 0.29 0.14 8.13 4.13 2.94 0.61 0.46 0.22 6.77 3.85 2.57 0.71 0.50 0.17
Note : x = the maximum level for number of cases recorded
NUR Distribution Sdn Bhd Scheduled Interruptions
2008 2009 2010 2011 2012
50.0
40.0
30.0
20.0
10.0
0.0
39.2034.67
25.62 25.8630.29
Year
No.
of I
nter
rupt
ions
/1,0
00 C
onsu
mer
s
NUR Distribution Sdn Bhd Unscheduled Interruptions
2008 2009 2010 2011 2012
12.98
30.0
20.0
10.0
0.0
18.0325.61
15.7016.01
YearN
o. o
f Int
erru
ptio
ns/1
,000
Con
sum
ers

AN
NU
AL
REP
OR
T 20
1248
The following chart shows the comparison of accumulated
SARFIX for11kV,22kV,33kVsystemsandtheoverallsystem
in2012,wherethe33kVsystemhadrecordedahigherlevelof
SARFI90thanthe11kVand22kVsystems.Fortheoverallsystem
SARFI90 had recorded a high incident average of 6.8.
SARFIX FOR 11 kV, 22 kV AND 33 kV SYSTEMS IN PENINSULAR
MALAYSIA IN 2012
9.0
8.0
7.0
6.0
5.0
4.0
3.0
2.0
1.0
0.0
SARFI 90
SARFI 80
SARFI 70
SARFI 50
SARFI 40
SARFI 10
6.3
3.7
2.1
0.90.60.1
7.8
5.6
3.9
0.70.30.1
8.1
4.1
2.9
0.60.50.2
11 kV 22 kV 33 kV
SAR
FI
Voltage
SARFIX FOR THE OVERALL SYSTEM IN 2012
9.0
8.0
7.0
6.0
5.0
4.0
3.0
2.0
1.0
0.0
6.8
3.9
2.6
0.7 0.5 0.2
SARFI 90
SARFI 80
SARFI 70
SARFI 50
SARFI 40
SARFI 10
SAFRIx for Overall System
SAR
FI
A total of 103 power quality complaints from 48 industrial
consumers were recorded in 2012, an increase of 10.8% when
compared to 93 complaints in 2011.
TotacklepowerqualityincidentsthatoftenoccurinPeninsular
Malaysia’sindustrialareas,TNBhadalsoprovidedconsultancy
services for the consumers involved to gather feedback and
initiate the appropriate follow up action.
The Distribution Division of TNB had appointed TNB Energy
Services to carry out power quality services at consumers’
premises upon any request from them for equipment testing.
Additionally, the cost for the consultancy services was fully borne
byTNB’sDistributionDivision.In2012,atotalof32majorpower
consumers in Peninsular Malaysia states were provided with
power quality services. They were located in Johor (9), Kedah
(1),KualaLumpur(1),Melaka(1),NegeriSembilan(3),Perak(3),
Pulau Pinang (3), Selangor (10) and Terengganu (1).
Of the 32 consumers who filed complaints on power quality, 14
werefullyprovidedwithpowerqualityservicesbyTNB.
POwER QUALITY COMPLAINT STATISTICS RECORDED
ACCORDING TO PENINSULAR STATES IN 2012
State No. of Voltage
Dip Incident
No. of Con-
sumersInvolved
ConsultancyServices
Power Quality Services(TNBES)
Com-pliant
Com-pleted
(%) No. Com-pleted
(%)
K.Lumpur 56 6 13 13 100.0 1 - -
Putrajaya/Cyberjaya
37 - - - - - - -
Selangor 93 16 27 27 100.0 10 3 30.0
Johor 154 7 14 14 100.0 9 5 55.6
Melaka 45 2 4 4 100.0 1 - -
N. Sembilan
57 3 3 3 100.0 3 - -
Kelantan 175 - - - - - - -
Pahang 73 1 1 1 100.0 - - -
Terengganu 85 1 1 1 100.0 1 1 100.0
Kedah 139 - - - - 1 1 100.0
Perak 145 5 15 15 100.0 3 - 33.3
Perlis 26 - - - - - - -
P. Pinang 57 7 25 25 100.0 3 3 100.0
Total 1,016 48 103 103 100.0 32 14 43.8
Nota : The total number of voltage dip incidents was not the sum of every state’s
total unique incidents. Some incidents were similarly reported in several
states.
The comparison of the number of power quality complaints
recorded in 2011 and 2012 showed that voltage dip incidents
reported in 2012 had increased. The increase was due to more
recording devices being installed; from 100 units in 2011 to 150
units in 2012.
The installation of additional recording devices meant that more
voltage dip incidents could be recorded compared to the previous
year.
ensuring reliable and efficient energy supply at reasonable prices (continued)

49
ACTION PLAN TO REDUCE POwER QUALITY INCIDENTS
Peninsular Malaysia
To address power quality problems that occur often in major
industrialareas inPeninsularMalaysia,TNBhas implemented
an action plan that include conducting several seminars or
dialogues with the users and programmes to reduce the causes
of power quality events. The purpose of the seminar and
dialogueistoenhancetheknowledgeandunderstandingofthe
management of consumers on power quality problems.
Several activities and initiatives were carried out by TNB to
reduce the causes of power quality events, namely:
a) Action plan to reduce damage of underground cables;
Initiatives undertaken include conducting tests on
cable insulation through thePolarity Index/Dielectric
AbsorbtionRatio (PI/DAR)andPartialDischarge (PD)
test through Oscilating Wave Test Set (OWTS). This
ConditionBasedMaintenance(CBM)techniqueenables
the potential damage to be repaired to avoid further
damage. There were also replacements of old cables
withrepeateddamagerecordsandsmallsizedcables.
b) Action plan to reduce transient interference;
Initiatives undertaken include conducting CBM
activities, tracking using Transient Earth Voltage
(TEV)andUltrasoundmethodforswitchgears,besides
conducting CBM for medium voltage overhead line
installations.
kulim Hi-Tech Park (kHTP)
Generally, power quality problems such as voltage dips will
cause power failure for several milliseconds and thus affect the
sensitive operations at the industrial premises.
The main causes that contributed to the voltage dips were
lightning, transmission system faults, switching activities, and
thirdpartyinterferencebydredgingworkcausingcabledamage.
The incident can occur in the line or cable that is located many
miles away from the involved consumers.
COMPARISON OF POwER QUALITY COMPLAINTS
IN 2011 AND 2012
Year Number of Voltage
Dips
Consumers Involved
Consulting Services Power Quality Services
Complaints Complete (%) No. Complete (%)
2012 1,016 48 103 103 100 32 14 44
2011 750 46 93 93 100 35 19 54
The main causes of voltage dips caused by (U) other sources/
unknown have recorded the highest number from overall
causes.
THE CAUSES OF VOLTAGE DIPS RECORDED IN 2012
600
500
400
300
200
100
0
(U) O
ther
s / U
nkno
wn
(T) O
ther
s /U
nkno
wn
(D) O
ther
s/U
nkno
wn
(T) C
able
Dam
age
(D) S
witc
h B
oard
Dam
age
(C) E
quip
men
t
(C) I
nter
nal D
amag
e
(D) E
ncro
achm
ent/
Anim
al
(T) v
anda
lism
& T
hird
Par
ty
(D) V
anda
lism
& T
hird
Par
ty
(T) A
uto
Rec
lose
r
(D) A
uto
Rec
lose
r
(U) C
able
Dam
age
(T) F
lash
over
(D) F
lash
over
(T) L
ight
ning
594
96 65
12 9
231
12 14
3 2
106
15 1369
Num
ber
Nota : The descriptions of each category for specified causes for the above
voltage dip graph are as follows:
(U)Others/Unknown i) Unsure/unidentified cause (no supply interruption record)ii) Incipient/transient fault that did
not become permanent damage
(T)Others/Unknown Apart from flash, cable,flashover, third party/ vandalism and Auto Recloser in transmission system
(D)Others/Unknown Apart from cable, flashover, the third party/vandalism, Auto Recloser, encroachment on the Distributionsystem
(T)Flashover/(D)Flashover
Damagetoswitchgearsandtransformer in the transmission system(T)anddistribution(D)
T TNBtransmissionsystem
D TNBdistributionsystem

AN
NU
AL
REP
OR
T 20
1250
Incidents such as the tripping of transmission line, cable
damage, switching or auto reclosing, transient or lightning
damage and others are the main causes that triggered voltage
dip incidents in TNBgrid system.The causesof the incidents
from NUR Distribution Sdn Bhd distribution system involved
online trips, cable damage, switchgear, transformers and other
equipment damages.
Inotherwords,anyincidentinthenorthernTNBgridsystemor
distributionsystemforNURDistributionSdnBhd inKHTPwill
also affect the supply of electricity to consumers, especially
for those with equipment for precision – based manufacturing
process.
STATISTICS OF VOLTAGE DIP INCIDENTS INVOLVING
CONSUMERS AND NOT INVOLVING CONSUMERS IN 2008 TO
2012 YEAR.
Year
353025201510
50
Number Of Voltage Dip Without Consumers Involvement
Number Of Voltage Dip With Consumers Involved
2008
18
9
2009
26
5
2010
14
6
2011
15
2
2012
15
5
Num
ber
of In
cide
nts
The number of voltage dips involving consumers in 2012 had
increased from two to five incidents in 2011. However, the number
of voltage dip incidents not involving consumers reported no
increase and remained at 15 incidents.
Power Quality Baseline Study
ThePowerQualityBaselineStudythatbeganinApril2010had
been extended till February 2013 to obtain the recorded data by
PQMonitorsup to January 2013 for theCentral andSouthern
areas.
The study was conducted to assess the level of Malaysian power
quality to enable the formulation of related standards of power
quality. Data collection for Power Quality Baseline Study of
ElectricitySupplyinthepeninsulathroughtheinstallationofPQ
Monitors for the year had been completed at 25 locations in the
NorthandtheEastCoast.PQInstallationMonitorsat25locations
for Central and Southern area was also done and recorded data
up to January 2013 will be obtained.
KHTP is an industrial area which houses international
companies that carry out high technology activities. In 2012, 20
incidents of voltage dips were reported, an increase of 17.6%
from the 17 incidents in 2011.
The number of consumers involved in voltage dip incidents
also had significantly increased from 9 consumers in 2011
to 54 consumers. The most number of consumers involved
was reported in October 2012, where there were 34 major
high technology industry consumers whose operations were
affected in KHTP. This increase was caused by two tripping
incidents in October 2012, due to TNB transmission system,
namely:
• Trippingof275kVlinefromJunjongtoBukitTengah;and
• Trippingof132kVlinefromKualaKetiltoGuthrie.
These two trips were caused by lightning and each involved 17
consumers.
NUMBER OF VOLTAGE DIPS AT THE kULIM HI - TECH
PARk REPORTED BY NUR DISTRIBUTION SDN BHD
2008 TO 2012
Num
ber
of In
cide
nts
and
Con
sum
ers
Invo
lved
2008 2009 2010 2011 2012
Year
60
40
20
0
27
47
31
2017
2025 27
9
54
No of voltage dip incident No of consumers involved
The year 2012 showed 18 incidents reported due to the supply
system and 2 incidents involving NUR internal systems.
STATISTICS OF VOLTAGE DIP INCIDENTS THAT AFFECTED
SUPPLY TO CONSUMERS IN 2008 TO 2012
Num
ber
of In
cide
nts
Year
30
20
10
02011
17
0
2008
26
1
2009
29
2
2010
16
4
2012
18
2
Due to the TNB transmission system Due to NUR distribution system
ensuring reliable and efficient energy supply at reasonable prices (continued)

51
The quantity of natural gas supplied by GMB increased by
2.21% to127,380,253MMBtu in2012compared to124,628,939
MMBtuin2011.Theindustrialsectorwasthemajornaturalgas
consumerusing126,364,815MMBtuequivalentto99.20%ofthe
totalconsumption.Thecommercialsectorused990.892MMBtu
(0.78%)and24.546MMBtu(0.02%)wasusedbytheresidential
sector.
TOTAL NATURAL GAS CONSUMPTION IN
PENINSULAR MALAYSIA
140,000,000
120,000,000
100,000,000
80,000,000
60,000,000
40,000,000
20,000,000
0
96,7
29,5
58
200610
6,36
9,91
02007
111,
625,
214
2008
107,
313,
116
2009
117,
606,
162
2010
124,
628,
939
2011
127,
380,
253
2012
Year
Use
of N
atur
al G
as,
MM
Btu
The following graph shows that the food, beverages and tobacco
sub-industryhad thehighest total consumptionof34,421,384
MMBtu.
NATURAL GAS CONSUMPTION BY SUB-INDUSTRY
CATEGORY IN PENINSULAR MALAYSIA
IN THE YEAR 2012
The number of natural gas consumers in the peninsula showed
an increase in all the three sectors. The total number of
consumers for all the three sectors were 709 for the industry,
565 for the commercial and 11,392 for the residential sector.
Collection of data through data logger installation for 500
installations had been completed throughout Peninsular Malaysia.
Data collected up to October 2012 have been analysed and
presented at a Power Quality StakeholdersWorkshop held on
October 22, 2012.
Addressing Power Quality Issues
DuringthePEMUDAHmeetingNo.10/2012heldon6November
2012 and chaired by the National Chief Secretary AMCHAM,
a white paper about consumers’ concerns on current trends
related to power quality, especially voltage dip incidents that
affected the semiconductor factories’ operations was presented,
followed by a recommendation that the matter should be
addressed promptly.
AWorkingGrouponPowerQualitywassetupon19November
2012, and a meeting was held to discuss on power quality
issues faced by AMCHAM and their companies. The meeting
wasattendedbyAMCHAM,TexasInstruments,WesternDigital,
FreescaleSemiconductor,TNBandGTIM(ST’sconsultantforthe
PQBaselineStudy).
Fromthenon,STorganisedaStakeholderEngagementonPower
QualityManagementWorkshop’ at theHotelEquatorialBangi.
Theworkshopwasattendedby40participantsrepresentingST,
KeTTHA,MIDA,TNB,AMCHAMandtheindustry,NURandGTIM,
with the aimed of sharing information on the current situation
related to power quality, identifying power quality related issues
aswellasfindingpossiblesolutionstoreducetherisksrelated
to power quality.
Severalsolutionswererecommendedduringtheworkshop,all
ofwhichwillbepresentedatthenextPEMUDAHmeeting.
PRESENT SITUATION AND DEVELOPMENT OF SUPPLY OF NATURAL GAS AND LIQUEFIED PETROLEUM GAS (LPG) THROUGH PIPELINE
Peninsular Malaysia
In 2012, the volume of natural gas supplied by Gas Malaysia
Bhd(GMB)tothenon-energysectorremainedthesameat382
mmscfd. The total supply of natural gas is expected to increase in
mid 2013 with an additional 500 mmscfd after the RGT at Sungai
Udang,Melakabecomefullyoperational.
35,000,000
30,000,000
25,000,000
20,000,000
15,000,000
10,000,000
5,000,000
0
12,3
22,7
33
11,3
18,1
85
2,00
,274
243,
448
32,8
75,6
65
34,4
21,3
84
3,74
9,10
9
9,46
7,37
7
7,79
3,64
2
12,1
73,0
28
Use
of N
atur
al G
as,
MM
Btu
Food, Beverage & Tobacco Metal Fabrication Chemicals Glass Others
Non-metallic mineral products Basic metals Electrical & Electronics Machinery & Equipment
Rubber
Year 2012

AN
NU
AL
REP
OR
T 20
1252
NUMBER OF LPG CONSUMERS IN PENINSULAR MALAYSIA
2006 2007 2008 2009 2010 2011 2012
30,000
25,000
20,000
15,000
10,000
5,000
0
Tota
l LP
G U
sers
in P
enin
sula
r M
alay
sia
1 1 713
463
0 0 0 0 01,
170
1,12
5
948
778
850
23,3
21
22,6
61
21,5
31
20,7
60
21,0
5825,6
04
25,7
04
YearIndustrial Commercial Residential
Sabah and the Federal Territory of Labuan
The introduction to the Virtual Pipeline System project by
the Sabah Energy Corporation Sdn. Ltd. (SEC) is expected to
encourage the growth in the natural gas industry there. The
project will supply compressed natural gas to premises that
operateoutsideKKIP.Theproposedvirtualtechnologypipeline
system is based on the mother–daughter station concept. In
2012, two (2) new customers signed an agreement with SEC and
gassupplythroughtheMother-Daughterarrangementandare
expected to start operations in March 2013.
TOTAL NATURAL GAS CONSUMPTION IN SABAH AND LABUAN
2006 2007 2008 2009 2010 2011 2012
200,000
180,000
160,000
140,000
120,000
100,000
80,000
60,000
40,000
20,000
0
Tota
l Nat
ural
Gas
Con
sum
ptio
n , M
MB
tu
171,
598
00 0 0
185,
388
52,3
35
62,2
36
66,7
95
74,6
840000 00 0 0 0 0
178,
551
YearIndustrial Commercial Residential
NUMBER OF NATURAL GAS CONSUMERS IN PENINSULAR
MALAYSIA
2006 2007 2008 2009 2010 2011 2012
12,000
10,000
8,000
6,000
4,000
2,000
0
Tota
l Nat
ural
Gas
Use
rsin
Pen
insu
lar
Mal
aysi
a
657
642
438
335
6,67
9
YearIndustrial Commercial Residential
8,88
7
630
640
686
704
709
565
536
489
464
456
7,03
2
7,96
0
10,4
33
10,5
41
11,3
92
The quantity of LPG supplied by GMB was 260.431MMBtu, an
increase of 2.17% in 2012 compared to the 254.904MMBtu in
2011. The commercial sector was the main consumer with the
use of 205.912 MMBtu equivalent to 79.07% of the total LPG
consumption.Meanwhile,thehousingsectorused54.009MMBtu
(20.74%)andtheindustrialsectorused510MMBtu(0.19%).
TOTAL LPG CONSUMPTION IN PENINSULAR MALAYSIA
2006 2007 2008 2009 2010 2011 2012
250,000
200,000
150,000
100,000
50,000
0
Num
ber
of U
sers
LPG
,MM
Btu
1,84
179
,358
64,5
21
656
50511
2,02
4
134,
143
153,
218
171,
299
199,
050
205,
912
56,5
10
57,7
60
57,3
06
55,4
39
54,0
09
445
322
415 51
0
64,4
31
YearIndustrial Commercial Residential
The number of LPG consumers in the housing sector in the
peninsula increased by 1.44% from 20.760 users in the 2011 to
21,058 consumers in 2012. The commercial sector also experienced
an increase of 4.00% from 1,125 consumers in 2011 to 1,170
consumers in 2012, while there were no LPG industry consumers
since 2008.
ensuring reliable and efficient energy supply at reasonable prices (continued)

53
SERVICE PERFORMANCE OF GAS SUPPLY THROUGH PIPELINES
Continuity of Gas Supply
Overall, the performance of the gas supply has decreased
comparedto2011,wherebyGMB’sSAIDIincreasedduetohigh
long periods of supply disruptions reaching 16,000 hours in
November2012andthatmadetheSAIDItoincreaseby0.7489
fortheyear.Themajorityofthedisruptionsandleaksoccurred
in the housing sector as it has the highest number of consumers
compared to the industrial and commercial consumers.
To overcome this problem, the licensee has raised the level
of inspection and maintenance, besides identifying and
implementing more effective preventive measures.
GMB PERFORMANCE INDICATORS (UNTIL NOVEMBER 2012)
Guidance Performance
Unit Index2010
Index 2011
Index 2012
SAIDI Minutes/customer
/Year
0.6299 0.3630 0.7489
SAIFI Interruptions/customer
/Year
0.0037 0.0039 0.0029
CAIDI Minutes /interference
169.27 90.96 260.90
Leakagealongthe gas
pipe for every 1000Km
Number ofleakages/1000Km
7.2343 0.003827 0.0037
Leakageatstation
&premisesofconsumers
for every 1000 customer
Number ofleakages
/1000 customer
6.7983 0.003615 0.0050
Note:SAIDI=SystemAverageInterruptionDurationIndex
SAIFI = System Average Interruption Frequency Index
CAIDI=CustomerAverageInterruptionDurationIndex
Supply Service Quality
In 2012, 272 complaints were received by Gas Consumption
Licensees. Complaints regarding the service of gas supply
through pipelines were delivered directly to the licensee. All
complaints received were divided into two categories i.e supply
interruptionsandleakages.
Gas supply interruptions occurring at the consumers’ premises
are caused by closed valves, faulty meters or pressure
regulators. The licensee had repaired the conditions within
the stipulatedperiod. Thegas leakageswere causedby faulty
pipe connections especially at the union connections, meters
andpressureregulators.Allthereportedleakageswereminor
leakages that occurred at the consumers’ premises and were
repaired promptly.
In 2012, a total of 29,640 inquiries about the gas bills, bills
payments, gas prices, billing complaints, new customer
registrations and reconnections had been recorded.
NUMBER OF COMPLAINTS RECEIVED BY LICENSEE
Supply Interruption Supply Leakage
Industrial Commercial Domestic Industrial Commercial Domestic Total
Natural gas
3 4 21 28 7 27 90
LPG 0 19 51 0 27 83 180
Total 2 23 72 28 34 110 270
FUEL PRICE MONITORINGAND ELECTRICITY TARIFF
world Oil and Fuel Prices Flow
The internationally used indicator for world crude oil prices i.e
theBrentSpotPricerecordedvaluesaboveUSD100abarrel
during the financial year of 2012. The highest level was recorded
inMarchwithUSD125perbarrel.However,theNewcastleFree
OnBoard(FOB)andRichardBaycoalpricedeclinedin2012due
tothelowerexchangerateoftheUSD,lowerrateofbunkerand
higher demand of coal supply compared to the demand in the
year.Thus,thepriceofcoaltradedbelowUSD100pertonneas
shown in the diagram.

AN
NU
AL
REP
OR
T 20
1254
LNG-CIF Japan (USD/MT) LNG-ex-Bintulu (USD/MT)
Difference in Gas Price (Formula) and the Government Stipulated Gas Prices for the Electrical Sector
The last electricity tariff adjustment was made in June 2011 during which the average tariff rate in Peninsular Malaysia was adjusted
from31.31cents/kWhto33.54cents/kWh,anincreaseof7.12%.Inmaintainingtheaverageelectricitytariffatastablelevelof33.54
sen/kWh,Governmenthadallocated a discount gasprice of 72% from thegasprice (formula) to thepower sector. This subsidy
allocation helped to alleviate the problem of people and the industry.
GAS PRICE (FORMULA) AND GAS PRICES (GOVERNMENT) FOR THE ELECTRICITY SECTOR
Theex-BintuluLNGprice,showedadownwardtrendat theendof2012, fromapeak inJuly2012atUSD920/tontoUSD680/ton in
December2012.
AVERAGE PRICE OF wORLD FUEL
USD/MT
2000
2001
2002
2003
2004
2005
2006
2007
2008
2009
2010
Jan
11
Mar
11
May
11
Jul 1
1
Sep
11
Nov
11
900
800
700
600
500
400
300
200
100
0
MonthYear
Brent Spot Price (USD/bbl) Coal FOB Newcastle (USD/MT) Coal FOB Richards Bay (USD/MT) Delivered Cost of Coal (USD/MT)
Feb
11
Apr
11
Jun
11
Aug
11
Oct
11
Dec
11
Jan
12
Mar
12
May
12
Jul 1
2
Sep
12
Nov
12
Feb
12
Apr
12
Jun
12
Aug
12
Oct
12
Dec
12
USD/bbl
140
120
100
80
60
40
20
0
Feb
08
FORMULA PRICE(1.04 x MFO)
72% discount fromformula price
GOVERNMENT PRICE
RM 14.31/MMBtu
RM 6.40/MMBtuRM 10.70/MMBtu
Month
100
90
80
70
60
50
40
30
20
10
0
Jan
08
Mar
08
Apr
08
May
08
Jun
08Ju
l 08
Aug
08
Sep
08O
ct 0
8N
ov 0
8D
ec 0
8Ja
n 09
Feb
09M
ar 0
9A
pr 0
9M
ay 0
9Ju
n 09
Jul 0
9A
ug 0
9Se
p 09
Oct
09
Nov
09
Dec
08
Jan
10Fe
b 10
Mar
10
Apr
10
May
10
Jun
10Ju
l 10
Aug
10
Sep
10O
ct 1
0N
ov 1
0D
ec 1
0Ja
n 11
Feb
11M
ar 1
1A
pr 1
1M
ay 1
1Ju
n 11
Jul 1
1A
ug 1
1Se
p 11
Oct
11
Nov
11
Dec
11
RM 13.70/MMBtu
Jan
12Fe
b 12
Mar
12
Apr
12
May
12
Jun
12Ju
l 12
Aug
12
Sep
12O
ct 1
2N
ov 1
2D
ec 1
2
Pri
ce (R
M/M
MB
tu)
ensuring reliable and efficient energy supply at reasonable prices (continued)

55
Natural Gas Tariff And Price of LPGin Peninsular Malaysia
The price of natural gas supplied by Petronas to GMB (the
licensee) remained unchanged from the 2011 level. Throughout
2012theaveragenaturalgastariffwasRM16.07/MMBtu.
Total Rate Category
Gas Consumption
(mmBtu/tahun)
Fare (RM/mmBtu)
A 0 19.52
B 0-600 20.61
C 601-5000 13.98
D 5001-50,000 14.61
E 50,001-200,000 16.07
F 200,001-750,000 16.07
G 750,001 16.45
Liquefied Petroleum Gas (LPG) prices for the housing sector
suppliedbyGMBisdividedintothreecategories.LPGpricefor
low-costhousingpremisescategoryweresetwithapricesubsidy
of12kgor14kgLPGpercylinderstipulatedbytheGovernment.
The price of LPG for the the medium cost categories and high
cost categories at resedential premises are based onmarket
prices.
Natural Gas Price and LPG priceIn Sabah and Labuan
The price of natural gas supplied in Sabah and Labuan are based
on sales and purchase gas agreement between the licensee, SEC
and the user based on Section 18 of the Gas supply Act in 1993
due to limited demand.
Difference in Gas Price (Formula) and the Government Stipulated Gas PricesNon-Electrical Sector (GMSB)
Forthenon-electricalsector,thegaspricehadincreasedfromRM11.05/MMBtutoRM14.05/MMBtuduringtheelectricitytariffrevision
inJune2011.Similartotheelectricalsector,thenon-electricalsectoralsoenjoyedthediscountonthegaspriceof72%(formula)as
shown in the diagram below to assist the industry in facing the uncertain global economic situation.
GAS PRICE (FORMULA) AND GAS PRICES (GOVERNMENT) FOR THE NON ELECTRICAL SECTOR
Feb
08
FORMULA PRICE(1.07x MFO)
72% discount fromformula price
GOVERNMENT PRICE
RM 17.99/MMBtu
RM 9.40/MMBtu RM 11.05/MMBtu
Month
100
90
80
70
60
50
40
30
20
10
0
Jan
08
Mar
08
Apr
08
May
08
Jun
08Ju
l 08
Aug
08
Sep
08O
ct 0
8N
ov 0
8D
ec 0
8Ja
n 09
Feb
09M
ar 0
9A
pr 0
9M
ay 0
9Ju
n 09
Jul 0
9A
ug 0
9Se
p 09
Oct
09
Nov
09
Dec
08
Jan
10Fe
b 10
Mar
10
Apr
10
May
10
Jun
10Ju
l 10
Aug
10
Sep
10O
ct 1
0N
ov 1
0D
ec 1
0Ja
n 11
Feb
11M
ar 1
1A
pr 1
1M
ay 1
1Ju
n 11
Jul 1
1A
ug 1
1Se
p 11
Oct
11
Nov
11
Dec
11
RM 14.05/MMBtuJa
n 12
Feb
12M
ar 1
2A
pr 1
2M
ay 1
2Ju
n 12
Jul 1
2A
ug 1
2Se
p 12
Oct
12
Nov
12
Dec
12
Pri
ce (R
M/M
MB
tu)

AN
NU
AL
REP
OR
T 20
1256
Trial-Run of Incentive-Based Regulation (IBR) As The New Policy For Electricity Tariff Setting in Peninsular Malaysia
In 2012, ST actively implemented the trial run to review
electricity tariffs in Peninsular Malaysia based on the IBR
financialyearframeworkof2013to2014.Theimplementation
ofIBRtrial-runwasinitiatedwiththefollowingactions:
• Issuance of Final Rule Implementation Guidelines
(ElectricityRegulatoryImplementationGuidelines-Rigs)on
13February,2012toTNBaspreparationfortheadoptionof
IBRframework;
• Finalisingtheprincipleoffuelcostpassthroughmechanism
(Imbalance Cost Pass-Through-ICPT) and measuring
servicestandardofTNBKeyPerformanceIndicators(KPI)
underIBRregimewithstakeholdersthroughaconsultation
session held in June 2012;
• As a result of the consultation process and the
arrangements of ICPT, the revised fuel cost pass through
for the first half year (December 2011-May 2012) was
approved by ST top management and forwarded to the
Minister for consideration and information;
• Finalising TNB Key Performance Measures proposed
according to the Regulatory Implementation Guideline No 6
forTNBdistributionandtransmissionbusinessentity;and
• TNBalsoproposeditsfirstelectricitytariffrevisionbased
onIBRon30November2012throughTNB’sIBRReportand
Tariff Review Submission FY 2014 – FY 2017 prepared in
accordance with RIGs guidelines.
Iftheresultofthetrial-runelectricitytariffrevisionbasedon
IBRresolutioniswellreceivedbyconsumersandGovernment,
the duration of September 2013 to August 2014 would be
the period for improving the process of IBR before full
implementation beginning in September 2014 until the end of
August 2017 or any date as determined by the Government.
The IBR concept will be pioneering the new change in
reviewing, making and determination of electricity tariff
that ensures only cost-efficient processes are included in
the revised electricity tariff proposal. At the same time, a
reasonable rate of return will be given to the utility so that the
incentive for performance will be improved. It also stimulates
transparency in the Government decision making, tariff
mechanism and formulation and provide clear guidance to the
utilities. Indirectly it also gives guidance to consumers and the
Government to be informed about any tariff adjustments from
time to time.
Revised Study on Connection Charges of Tenaga Nasional Berhad
Introduced since 1995, the connection charges imposed by
TNBuponelectricityusershasyettoberevieweduptodate,
taking into account price change and the current inflation
rate. The last revision study was submitted by TNB in the
tariff restructuring proposal in 2009. However, the connection
charges revision proposal was postponed to give way for the
adjustment of the electricity tariff in Peninsular Malaysia that
was decided in June 2011.
To ensure that the rates charged to consumers is in line with
thecost tobebornebyTNB, theCommissionhas initiateda
reviewoftheconnectionchargesofTNBconsumersbeginning
early2012.Forthis,TNBhassubmittedadraftoftheconsumer
connection charges proposal in March 2012. At the end of 2012,
discussionswithTNBontheproposalwerestillongoing.The
study is expected to be completed in 2013 and will be brought
to the Government for consideration and approval.
ensuring reliable and efficient energy supply at reasonable prices (continued)

57
Ensuring Secure Energy SupplyST is ever facing challenges in ensuring that the country’s
energy supply is sufficient and secure. Apart from monitoring
generation activities, ST puts serious attention towards
supplying electricity and fuel for the generation sector.

AN
NU
AL
REP
OR
T 20
1258
To ensure diversification of energy sources, the Government is
considering electricity supply options through online transmission
ofHighVoltageDirectCurrent(HVDC)fromSarawakwithatotal
capacity of 2,000 MW for operation from the year 2021.
The option of nuclear power stations development requires an
in-depthstudyandremainsasatechnologyoptiontomeetthe
long-termdemandinthefuture.Therefore,gasandcoalbased
generation are still preferred options for the short and medium
terms.
Thegenerationcapacitydevelopmentplanhastakenintoaccount
the maximum gas supply provisions at 1,350 mmscfd with gas
pricesgradually increasinguntilmarketpricesareachieved in
2016.
PROJECTION OF GENERATION MIX
IN PENINSULAR MALAYSIA 2013 TO 2030
Hydro Gas Coal Nuclear Interconnection
100%
80%
60%
40%
20%
0%
4%49
%47
%
46% 50
%
35%
61%
22%
54%
10%
10%
9% 9%4% 4% 4% 4%21
%57
%
2013 2015 2020 2025 2030
Per
cent
age
Year
Sabah
In Sabah, besides power supply issues, the problems caused
by most of the diesel power stations and low quality MFO has
resulted in a decline in generation capacity due to the cessation
of operations of the power station owned by Sandakan Power
Corporation Sdn. Bhd (SPC). In addition, there were IPP
power stations which suffered cash flow problems resulting in
interruptions to fuel supply and thus limiting the generation from
the station.
SPC with a capacity of 32 MW has filed a notice to terminate its
PPA on 15 October, 2011. According to SPC, the termination had
tobedoneduetosafetyfactors,lackofinsurancecoverageand
weak financial position. Following the cessation of operations,
the licence was terminated on 29 May, 2012 while the Power
PurchaseAgreementbetweenSPCandSESBwasterminatedon
16 October 2012.
ELECTRICITY SUPPLY SITUATION
Peninsular Malaysia
The generation capacity development plan for the peninsula
was presented to the Electricity Supply and Tariff Planning
and ImplementationWorkingCommittee (JPPPET) onOctober
2012. The Gross Domestic Product (GDP) growth rate and the
maximum demand of electricity used were as follows:
GDP GROwTH RATE AND THE MAXIMUM
DEMAND OF ELECTRICITY
Duration October 2012 projection
GDP (%) Maximum Requirement (%)
2012-2015 5.7 3.6
2016-2020 5.9 3.3
2021-2030 6.2 1.6
Based on the projected electricity requirements approved by
JPPPET, the required additional generation is 10,882 MW for
2015 to 2020 and a total of 12.213 MW for 2021 to 2030.
ADDITIONAL GENERATION CAPACITY UNTIL 2020
Year
2015 Coal based generation station Manjung 4 1,010 MW
ConnaughtBridgeRepoweringStation 343 MW
2016 HydrogenerationstationofTNBHuluTerengganu 265 MW
HydrogenerationstationofTNBUluJelai 372 MW
CoalbasedgenerationstationTanjungBinEnergy 1,000 MW
CombinedcyclegenerationstationPraiSdnBhd 1,071 MW
Operation extension of combined cycle generation station Genting Sanyen
675 MW
2017 Cogeneration PETRONAS generation station, Pengerang 400 MW
Operation extension of combined cycle generation SegariEnergyVenture
1,303 MW
Operation extension of combined cycle generation TNBPasirGudang
275 MW
Coal based generation station through bidding process Track3
1 x 1,000 MW
2018 Additional capacity for hydro generation station of Chenderoh 5
12 MW
Coal based generation station through bidding process Track3
1 x 1,000 MW
2019 HydrogenerationstationTekal 156 MW
Coal based generation station through bidding process Track3B
1 x 1,000 MW
2020 Combined cycle gas generation station 1 x 1,000 MW
Total 10,882 Mw
ensuring secureenergy supply

59
Mitigation measures have been taken in the short term to
overcome this problem, such as new capacity creation and
implementation of initiatives to improve reliability of available
power stations.
COMPARISON OF SABAH SUPPLY SITUATION
west coast East Coast Total
Peak demand (Mw) 472.8 280.0 752.8
Potential capacity (Mw) 799.0 331.0 1130.0
Reserve margin (%) 68.9 18.2 50.1
Existing capacity (Mw) 670.2 164.6 834.8
Operation Reserve (%) 41.8 -41.2 10.9
In addition, the implementation of generation power projects
in Kimanis (385 MW) and Lahad Datu (300 MW) will increase
the capacity of gas-based power generation from 585 MW to
1,270MWin2016.Byhavingthesestations,mostofthediesel
generating capacity may be discontinued with consumption
of MFO being reduced. Several generation projects based on
Renewable Energy sources with a capacity of 73.2 MW have also
beenapproved tostartwork in2013-2016.Thiswill contribute
to a more reliable, environmentally friendly and cost effective
supply.
However,over-relianceongasresourcesshouldbereduced.The
output of the RE stations are often uncertain as it depends on fuel
supplies, particularly oil palm waste. Long term planning should
also consider resource diversification. Options to acquire supply
fromSarawakwith a huge potential of hydroelectric power, is
being studied at utility level. For this purpose, new transmission
lines construction and upgrading of the existing transmission
system need to be done first.
Forlong-termplanning,thenewpowerstationprojectsapproved
by JPPPET are as follows:
COMPARISON OF SUPPLY SITUATION IN SABAH
Project Capacity Fuel Target Year
S.J kubota, Tawau (Relocation) 64 MW Gas January 2012
SREP kalansa 6.5 MW Biomass 2013
SREP Cash Horse 12 MW Biomass 2013
SREP Afie Power 8.2 MW Hydro 2013
SREP Eco-Biomass 20 MW Gas 2013
SREP Tawau Green Energy 30 MW Geothermal 2014
S.J Batu Sapi (Rehabilitation) 20 MW Gas 2013
S.J Tenom Pangi (Upgrade) 8 MW Hydro 2014
SPR Energy(M) Sdn Bhd 100 MW Gas 2013
kimanis Power Sdn Bhd 300 MW Gas 2013 – 2014
Eastern Sabah Power Consortium Sdn Bhd (ESPC)
300 MW LNG 2015 – 2016
Upper Padas Hydroelectric 180 MW Hydro 2018
Withtheoperationofnewgaspoweredstationsin2013-2016,the
consumption of diesel and MFO connected to the grid is expected
to be reduced. To ensure optimal fuel mix, channeling of energy
from Sarawak is required while the use of Renewable Energy
usingBiomassandGeothermalenergywillbefurtherintensified.
Considering these factors, the generation mix projection will be
as follows:
GENERATION MIX PROJECTION IN SABAH 2013 UNTIL 2030
100%
80%
70%
60%
50%
40%
30%
20%
10%
0%
3%8%
16% 19
%
55%
2013
3%9% 9%
6%1%
72%
2015
5%18
%8%
3% 2%
64%
2020
2%13
%13
%2%
7%
63%
2030
Gas Biomass Hydro MFO Diesel Geothermal Sarawak HydroLNG
Per
cent
age
Year

AN
NU
AL
REP
OR
T 20
1260
NATIONAL FUEL SUPPLY SITUATIONFOR THE GENERATION SECTOR
Gas Supply to Electricity Generation Sector in Peninsula
2012 witnessed the continued reliance on gas and coal as the
primary fuel source for generation. The percentage of generation
mix in 2010, 2011 and 2012 were as follows:
GENERATION MIX PERCENTAGE
Fuel 2010 2011 2012
Gas 52.8 42.7 45.4
Coal 41.6 44.7 45.7
Hydro 5.1 5.6 5.0
Others 0.4 7.0 3.9
Thepercentageincreaseincoal-basedgenerationisduetogas
supply shortage to the energy sector from PETRONAS.
GENERATION MIX YEAR 2012
5.04% 1.96% 1.93%
45.67%45.40%
Coal
Gas
Hydro electric
MFO
Distillate
IC
0.00%
Gas supply to the electricity sector had experienced significant
reductions in 2011 and 2012 due to the fire that occurred at the
gasplatforminBekokCon14December2010.
Gas supply had reduced from 1,250 mmscfd in 2011 to 1,150
mmscfd in 2012 as decided by the Economic Council meeting
on 10 January 2012. The gas supply situation was exacerbated
by unscheduled downtime incidents at Terengganu gas offshore
platforms from time to time.
To accommodate the lower domestic gas supplies, PETRONAS
hastakenstepstoimportgasintheformofLNGfromoverseas.
Forthatpurpose,theLNGRGTinSungaiUdang,Melakahasto
operate from September 2012.
ensuring secureenergy supply (continued)
NOMINATION, ALLOCATION AND GAS USE FOR 2012
Gas Nomination Gas Allocation Gas Consumption
mmscfd
Month
1 J a n 2 Fe b 1 M a r 1 A p r 1 M a y 1 J u n 1 J u l 1 A u g 1 S e p 1 O c t 1 N ov 1 D e c
NOMINATION FOR 2010, 2011 AND 2012
2010 2011 2012
mmscfd
Date
1 Ja
n8
Jan
15 J
an22
Jan
29 J
an5
Feb
12 F
eb19
Feb
26 F
eb5
Mar
12 M
ar
19 M
ar26
Mar
2 A
pr9
Apr
16 A
pr23
Apr
30 A
pr7
May
14 M
ay21
May
28 M
ay4
Jun
11 J
un18
Jun
25 J
un2
Jul
9 Ju
l16
Jul
23 J
ul30
Jul
6 A
ug13
Aug
20 A
ug27
OA
ug3
Sep
10 S
ep17
Sep
24 S
ep1
Oct
8 O
ct15
Oct
22
Oct
29 O
ct5
Nov
12 N
ov19
Nov
26 N
ov3
Dec
10 D
ec17
Dec
24 D
ec31
Dec
During 2012, the energy sector received an average of 1,018
mmscfd of gas from PETRONAS compared to the daily average
nominationof1,100mmscfdbyTNB.Thenominationaverage
for 2011 was 1,050 mmscfd while for 2010 it was 1,224 mmscfd.
This share declined due to the increase in curtailment from
194 days in 2011 to 299 days in 2012. Out of that, 46 days
had scheduled interruptions and 253 days had unscheduled
interruptions.
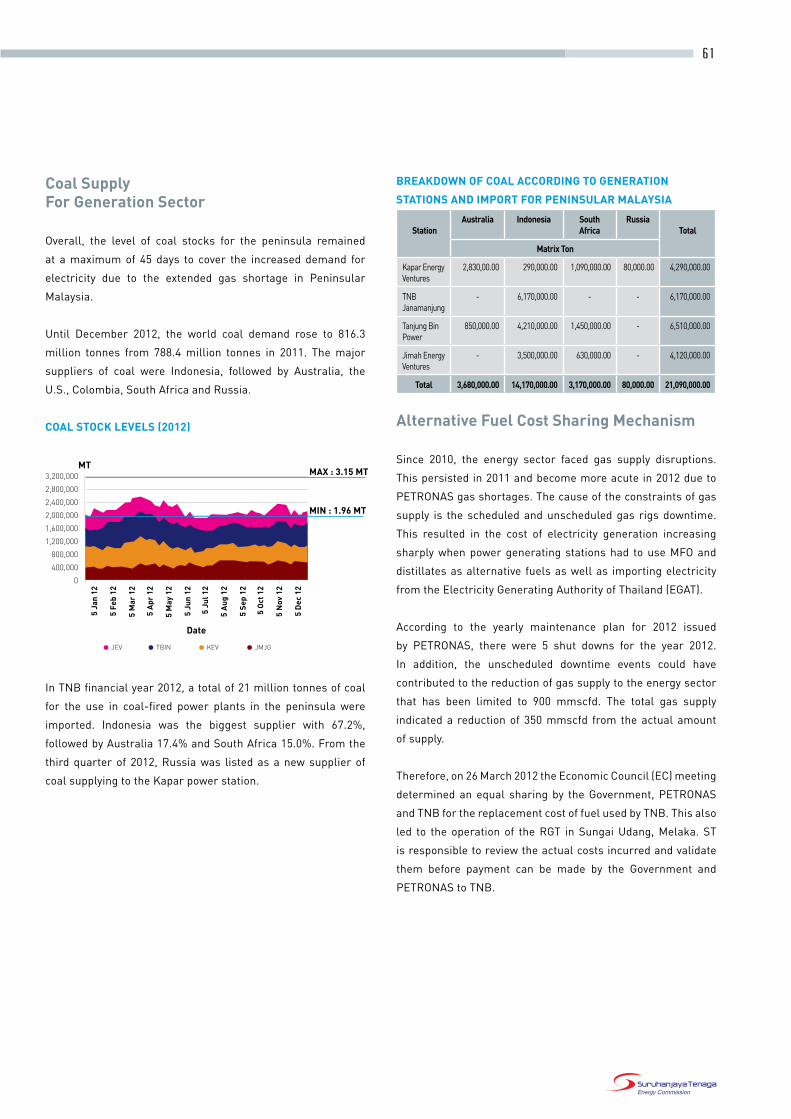
61
BREAkDOwN OF COAL ACCORDING TO GENERATION
STATIONS AND IMPORT FOR PENINSULAR MALAYSIA
StationAustralia Indonesia South
AfricaRussia
Total
Matrix Ton
KaparEnergyVentures
2,830,00.00 290,000.00 1,090,000.00 80,000.00 4,290,000.00
TNBJanamanjung
- 6,170,000.00 - - 6,170,000.00
TanjungBinPower
850,000.00 4,210,000.00 1,450,000.00 - 6,510,000.00
Jimah EnergyVentures
- 3,500,000.00 630,000.00 - 4,120,000.00
Total 3,680,000.00 14,170,000.00 3,170,000.00 80,000.00 21,090,000.00
Alternative Fuel Cost Sharing Mechanism
Since 2010, the energy sector faced gas supply disruptions.
This persisted in 2011 and become more acute in 2012 due to
PETRONAS gas shortages. The cause of the constraints of gas
supply is the scheduled and unscheduled gas rigs downtime.
This resulted in the cost of electricity generation increasing
sharply when power generating stations had to use MFO and
distillates as alternative fuels as well as importing electricity
from the Electricity Generating Authority of Thailand (EGAT).
According to the yearly maintenance plan for 2012 issued
by PETRONAS, there were 5 shut downs for the year 2012.
In addition, the unscheduled downtime events could have
contributed to the reduction of gas supply to the energy sector
that has been limited to 900 mmscfd. The total gas supply
indicated a reduction of 350 mmscfd from the actual amount
of supply.
Therefore, on 26 March 2012 the Economic Council (EC) meeting
determined an equal sharing by the Government, PETRONAS
andTNBforthereplacementcostoffuelusedbyTNB.Thisalso
led to the operation of theRGT in SungaiUdang,Melaka. ST
is responsible to review the actual costs incurred and validate
them before payment can be made by the Government and
PETRONAStoTNB.
Coal SupplyFor Generation Sector
Overall, the level of coal stocks for the peninsula remained
at a maximum of 45 days to cover the increased demand for
electricity due to the extended gas shortage in Peninsular
Malaysia.
Until December 2012, the world coal demand rose to 816.3
million tonnes from 788.4 million tonnes in 2011. The major
suppliers of coal were Indonesia, followed by Australia, the
U.S., Colombia, South Africa and Russia.
COAL STOCk LEVELS (2012)
Date
3,200,000
2,800,000
2,400,000
2,000,000
1,600,000
1,200,000
800,000
400,000
0
5 Ja
n 12
5 A
pr 1
2
5 Ju
l 12
5 O
ct 1
2
5 Fe
b 12
5 M
ay 1
2
5 A
ug 1
2
5 N
ov 1
2
5 M
ar 1
2
5 Ju
n 12
5 Se
p 12
5 D
ec 1
2
MT
JEV TBIN KEV JMJG
MAX : 3.15 MT
MIN : 1.96 MT
InTNBfinancialyear2012,atotalof21milliontonnesofcoal
for the use in coal-fired power plants in the peninsula were
imported. Indonesia was the biggest supplier with 67.2%,
followed by Australia 17.4% and South Africa 15.0%. From the
third quarter of 2012, Russia was listed as a new supplier of
coal supplying totheKaparpowerstation.

AN
NU
AL
REP
OR
T 20
1262
ALTERNATIVE FUEL COST DIFFERENTIAL - AFCD
AFCD #1(Jan 2010 > Oct 2011)= RM3.069 bil
AFCD #2(Nov 2011 > Mar 2012)= RM534 bil
AFCD #3(Apr 2012 > Jul 2012)= RM1.063 bil
New RGT operation schedule of July 2013
AFCD will continue until RGT is in operation
Original RGT operation schedule of September 2012
Thetotalalternativefuelcostdifferential(AFCD)tobeshared
by the Government, PETRONAS and TNB for the first time
amounted to RM3.069 billion for the period of January 2010 to
October 2011 and for the second time from November 2011 to
March 2012, it amounted to RM534 million and RM1.063 billion
for the third period from April 2012 to July 2012.
Study on Framework forGeneration Fuel Mix in the Peninsula
The National Energy policy has objectives such as supply security,
reasonable tariff while minimising the effect on the environment.
Duetorising fuelcostsparticularly forgas, the fuelmixbasis
had to be reevaluated to ensure that the country’s energy policy
objectives are met.
For this purpose, efforts to formulate this policy through a study
on the framework for the generation fuel mix in Peninsular
Malaysia had been implemented by the Ministry of Energy, Green
TechnologyandWater(KeTTHA)andMyPOWER.Thescopeofthe
studycoversthesafety,adequacy,efficiency,cost-effectiveness,
sustainability and quality of supply; rationalisation of subsidies
on the electricity supply chain; efficient use of energy; minimising
the negative impact on the environment and 7 Energy Security
(ES) parameters.
Nota: HHI – Herfindahl Hirshman Index LOLP – Loss of Load Probability R/P – Reserves to production ratio
Proposed7EnergySecurity(ES)parametersthathasbeenidentifiedasaframeworktobeappliedinthelongtermdevelopmentplan
inPeninsularMalaysia.Italsotakesintoaccountfactorssuchasavailability,accessibility,affordabilityandacceptabilityoffuel.The
proposedframeworkisshownbelow:
PROPOSAL FRAMEwORk FOR ELECTRICITY SUPPLY SECURITY AND FUEL MIX
# Perimeter Current Situation Target Action
ES1 Global reserve to production ratio of gas, coal and oil
Gas – 60 yearsCoal – 120 years
Tocheckwhetherproductionofcoal,gas and oil could be maintained with the global reserve to production ratio > 60 years throughout planning period
• EnsuringcurrentR/Pratiosufficientforcoalandgas• RequirementformonitoringR/Pratioofdomesticgas
ES2 Reserved margin for generation sector
LOLP <1 day Reserved margin = 32%
LOLP <= 1 day • UseLOLPasaguidanceinJPPPETplanning• Useofreservedmarginratioatleast22%asaguidancefor developed countries
ES3 HHI for fuel mix (eg gas, coal, diesel, hydro) for generation sector
HHI = 0.48 HHI < = 0.5 towards 2020HHI <= 0.4 towards 2025
• UseofHHIasaguidanceinJPPPETplanning
ES4 HHI for fuel supplier (based on supplier country) for generation sector
HHI = 06 (Coal)HHI = 0.5
(Domesticgas)
HHI , 0.5 (for coal) • Encouragingutilityfuelsuppliertodiversifycoalsourceinapractical way by means of pass through mechanism
ES5 NetEnergyImportDependency(NEID)forgas,coalandoilforthegeneration sector
NEID(Coal)=100%NEID(Gas)=80%
IrrelevantNEIDratioES4HHI• WhenNEID–ve:HHInotrelevant• WhenNEID+ve:HHI< 0.5
• Diversificationofsourcerequiredtoensureexistingfuelimport
ES6 Stockofgas,coalandoilforgeneration sector
Gas = Negative reserveCoal = 45 days
Gas = reserved margin of 15%Coal = 90 days towards 2018
• Encouraginginvestmentfordevelopmentofstockandfuel capacity• Toencourageinvestment,implementationofcostcritical
pass through is critical
ES7 CO2 release intensity for generation sector
0.64t/MWh Current situation =<0.7t/MWh2020 and further on = <0.62t/MWh2025 and further on = <0.52/MWh
• UsedasguidanceinJPPPETplanning• EncouragingtheimplementationofRE,energyefficiency (EE),importingenergyfromSarawakand/ornuclear
ensuring secureenergy supply (continued)

63
MONITORING GENERATION PROJECTS
Special Committee To AddressSabah Electricity Supply Problem
SThassetupaspecialcommitteetoidentifykeyissuesfacedby
SESBandIPPandfindsolutionstoovercometheproblemsfaced
to ensure that the electricity supply industry in Sabah is more
sustainable and reliable.
Severaldiscussionswereheldwiththeinterestedpartiestoseek
their views on the problems encountered. Next, suggestions to
address this problem were refined at the Special Committee
before being endorsed by ST to be submitted to the Minister
and Economic Council. A summary from the Special Committee
meeting was presented in the Economic Council meeting on 23
April 2012.
PROGRESS OF ENERGY GENERATION PROJECTS
Monitoring of all power projects is done to ensure that it is
implemented as planned. ST always monitors closely the
progress of the projects through periodical reports submitted
by the project developers, site visits and discussions from time
to time.
For the peninsula, on the whole, the implementation of the
project is on schedule where the coal powered plant projects
were implemented as scheduled while gas station projects
were still in the early stage of implementation. Nevertheless,
there was a delay in the implementation of the hydroelectric
projects in Hulu Terengganu and Ulu Jelai. However, the
scheduled commercial operation date–(SCOD) can still be
achieved and is unchanged from the original target.
The implementation of generation projects in Sabah is entirely
unsatisfactory, particularly for RE projects and projects under
SESB that use Government funds. The implementation of the
Feed in Tariff (FIT) scheme currently is being extended to existing
RE power stations in Sabah. This matter has caused RE projects
under construction to suffer delay because the developers are
still waiting for a decision on whether they are eligible to be
considered for the FIT scheme.
The incident where the barges carrying GT1 turbine gas from
Gulf Ewa, Langkawi to SJ Kubota, Tawau were hijacked had
obstructed the project implementation with a delay of 7 months.
The short term mitigation project is expected to be operational
in February 2013 compared to the initial target of August 2012.
As for projects under the IPP scheme in Sabah, theKimanis
Power project was implemented more smoothly than the SPR
project. This correlates to the fact that the Kimanis Power
developer has more experience in implementing big scale
project and also is in a strong financial position. The SPR
project was delayed from the start because its original main
shareholder is a newcomer to the industry and did not have
strong financial support. The acquisition of the original SPR
owner’sequitybyJAVABerhadalso took time toobtainprior
approval from the Government. This resulted in a delay to the
financial close of the project which then contributed to negative
impacts on project schedule.
In addition, SPR faced problems to build the gas pipeline to the
power station. Recognising the importance of this project in
solving the problem of electricity supply in Sabah, a solution
isbeingworkedout toensure that the implementationof the
project is not delayed from the scheduled commisioning date.
In general, the projects in the peninsula are excuted more
smoothly than in Sabah. Many RE projects, which do not rely on
goverment policies are developed and implemented in Sabah.
The implementation of RE projects in the peninsula, relative
to the size of the system, is much smaller than large-scale
hydroelectric and coal fired projects.
TNB, as the utility and hydroelectric project developer in the
peninsulaisinastrongfinancialpositiontofinancelarge-scale
projects.TheoppositesituationexitsinSabahwhereSESBneeds
to get Government funds to finance the short-termmitigation
projects and feasibility study of the Ulu Padas hydroelectric
project.
For power generation projects under the IPP scheme, the
involvement of the private sector in the electricity generation
sector is seen as a positive move. However, the developers
need to be strong financially because the power generation
projects require long construction periods and intense capital
requirements. The delay in the implementation of the SPR
project was due to the original developer not having the required
experienceanditsweakfinancialstandingcomparedtoprojects
inTanjungBinEnergyandKimanisPowerledbycompanieswith
experience and large capital positions.

AN
NU
AL
REP
OR
T 20
1264
STATUS OF RENEwABLE ENERGY GENERATION
Based on the incentives for promoting the development of
renewable energy, 77 applications for sales tax exemption and
import duties for Renewable Energy equipment for photovoltaic
solar systems (solar panel, inverter, DC cable) have been
received and evaluated.
STATISTICS FOR RE EQUIPMENT 2012
Subject 2012
Total applications received 77
Total solar system equipment (solarpanel,inverter,DCcable) approved
706
PROMOTING RENEwABLE POwER GENERATION
Licensing for Installations UsingPhotovoltaic System Under Electricity Supply Act 1990 and Exemption Under Section 54, Government Gazette of August 7, 2008
Photovoltaicinstallationslessthan24kW(singlephase)and72
kW (three phase), do not require to be licensed in accordance
to the exemption granted by the Minister of Energy, Green
TechnologyandWaterbasedon theGazetteofAugust7,2008.
The number of photovoltaic installations and their capacities
exempted under Section 54 are as follows:
NUMBER & CAPACITY OF SOLAR PHOTOVOLTAIC
INSTALLATIONS EXEMPTION UNDER SECTION 54
Number of Installations Capacity of Installations (kw)
150
120
90
60
30
04
2439.8
146.1
Business Residential
Num
ber/
kw
Granting of Public Licence to Generation Station Using Renewable Energy
A total of 42 public licences with 135.61 MW capacity were given
to power plants using renewable energy in the peninsula and
SabahuntilDecember2012.Thetotalcapacityofpubliclicences
issued to power plants using renewable energy is as follows:
TOTAL CAPACITY OF PUBLIC LICENCES ISSUED
TO POwER PLANT USING
RENEwABLE ENERGY (Mw)
65.40
27.70
26.44
16.07 Biogas
Solar Photovoltaic
Mini-Hyro
Biomas
TOTAL ELECTRICITY GENERATION BY POwER PLANTS
USING RENEwABLE ENERGY
Biomass Mini-Hydro Biogas Solar Photovoltaic
300,000270,000240,000210,000180,000150,000120,000
90,00060,00030,000
0.0
270,568.95
70,513.56
40,069.84
2,592.81
Mwj
Energy Renewable
Generation using biomass resources is the highest recorded
in 2012. Generation by the three main power stations in Sabah
is the major contributor to this generation, besides supplying
power to the Sabah Grid. Based on the information by the
MalaysianPalmOilBoard(MPOB),Sabahhasthelargestareaof
oil palm plantations in Malaysia, 1.43 million hectares or 28.6%
ofthetotalareaofthestate,makingpalmoilasthemajorfuel
for electricity generation in Sabah.
ensuring secureenergy supply (continued)
65
The lowest generation recorded was from photovoltaic solar
systems as the number of licensees in operation was only
three, while the rest are still under development. Licences for
generation using photovoltaic solar systems were only issued for
thepeninsula.Meanwhile,biogaspowerstationsandmini-hydro
respectively accounted for 11% and 19% respectively of the total
generation.
There were several issues faced by power stations using
renewable energy such as the weather, fuel supply and major
engine damages. For example,mini-hydro power stations rely
heavily on climatic factors where the dry weather in the third
quarter of the year affected the performance of the stations.
The damage to the boiler is one of the causes that halted the
operations of a station. Uncontrollable high temperatures in
boilers not meeting specifications of the system design can
cause the insulation material in the boiler to fail.
In addition, the high moisture content in the methane gas
derived from biogas/landfill gas is also among the causes that
contributedtothebiogas-basedpowerstationsbeingunableto
show a good electricity generation performance.
In 2012, there were a number of power stations that have
been successfully commissioned, including the power station
at Sungai Rek which began operating in August 2012. The
station contributed 4% of electricity generation from the total
generationbyminihydropowerstations.BesidesSungaiRek,
SuriaKLCCalsocommisionedaSolarPVsystem inFebruary
2012while2morebiogaspowerplantsatCyparkSuria(Negeri
Sembilan)andSolarCypark (Pajam)commencedcommercial
operations in June 2012.

66
67
Promoting a Transparent and Competitive Energy Industry
ST is putting in place programmes to promote transparency of
the energy industry besides ensuring its competitiveness in the
localaswellasintheinternationalmarket.
Among the steps that have been and are being implemented
include a competitive bidding process, grid monitoring and
delivery system, monitoring of the financial performance of
generation licensees, establishing gas billing mechanisms
and disseminating information pertaining to the situation and
industry performance in an appropriate and effective manner.

AN
NU
AL
REP
OR
T 20
1268
COMPETITIVE BIDDING PROCESS
New Capacity in Prai and Restricted Tender for Licence Renewal for The First Generation Independent Power Producer Plants (IPP)
ST has successfully implemented the international competitive
bidding process (Track 1) for new capacities in Prai and
also a restricted tender (Track 2) for licence renewal of the
first generation Independent Power Producers and Tenaga
Nasional Berhad (TNB) plants on 9 October 2012. This is
aimed at meeting the requirements for generation capacity in
Peninsular Malaysia for the year 2016/2017 as proposed by ST
to the Government.
Shortlisted companies for the implementation of a new power
plantwithanettcapacityof1,000MW-1,400MWhavesignedan
Integrity Pact for the international bidding which was conducted
on 5 June 2012. The ceremony was witnessed by the Minister of
Energy,GreenTechnologyandWater togetherwithYBhgDato‘
HajahSutinahSutan, theDeputyDirector-General (Prevention)
oftheMalaysianAnti-CorruptionCommission.
The objective of the Integrity Pact is to improve transparency in
Government procurement and thus reducing and eradicating
corruption.
The following are the results of Track 1 and Track 2 projects
based on the evaluation of lowest (levelised) tariff that meets all
the requirements of the bid:
Track 1
TenagaNasionalBerhadwasofferedtobuild,ownandoperatethe combined cycle plant with a capacity of 1,071 MW in Prai, Pulau Pinang to commence operations on 1 Mar 2016. The power plant will use 2 units of Siemens brand H class gas turbines which should achieve around 60% efficiency.
Track 2
GentingSanyenPowerSdnBhd,SegariEnergyVenturesandTNBPasirGudangwereofferedrenewaloflicencetooperatetheir existing power plants capacity, with a levelised tariff and extendedperiodasfollows:-
Genting Sanyen Power SdnBhd
675 MW; extension for 10 years
SegariEnergyVentures 1,303 MW; extension for 10 years
TNBPasirGudang 275 MW; extension for 5 years
New Bidding Processes
BasedonthepresentationsattheJPPPETmeetingNo.2/2012,
the meeting agreed for ST to implement the competitive bidding
process for the procurement of a new capacity of 3,000 MW.
The implementation of the competitive bidding process for the
construction of coal power plants with a capacity of 1,000 MW
(Project 3A) on a fast track basis began at the end of 2012.
These coal powered plants are scheduled to be operating in
October 2018 to meet the increasing electricity demand and to
replacethecapacityofTNB’sPakapowerstationwhichwillbe
decommissioned.
Another bidding for the construction of coal power plants with
a capacity of 2 x 1,000 MW (Project 3B) on a greenfield site
will be done simultaneously and the plants will be operating
progressively in October 2018 for unit 1 and April 2019 for unit 2.
AworkingcommitteeatSTlevel,chairedbytheChiefExecutive
Officer was formed to implement the international bidding
process.
The selection of consultants to assist in the bidding process was
made, as follows:
LIST OF CONSULTANTS FOR THE INTERNATIONAL BIDDING
PROJECT
Consultant Scope of work
Price Waterhouse Coopers Capital SdnBhd
Financial Advisor
SinclairKnightMerz SdnBhd
Technical Advisor
Messrs.ChristopherLee&CoSdnBhd
Legal Advisor
promoting a transparent and competitive energy industry

69
Thepreparation for thepre-qualificationprocessbasedon the
stipulatedcriteriaintheRFQdocumenthasbeenorwillbeheld
as follows:
IMPLEMENTATION SCHEDULE FOR THE INTERNATIONAL
BIDDING PROCESS
ACTIVITY Date
1000 Mw Fast Track Project 3A
2000 MwProject 3B
ProductionofRFQDocument
18December2012 18December2012
ClosingDateforSubmissionofRFQ
21 January 2013 11 March 2013
Announcement of ShortlistedBidder
6 February 2013 1 April 2013
IssueofRFPDocument 8 February 2013 15 April 2013
BriefingonRFPDocument 8 March 2013 15 May 2013
Clarification Process 8 – 30 April 2013 1July-1August2013
ClosingDateforSubmissionof RFP
20 May 2013 30 September 2013
BidEvaluation 20 May – 30 June 2013
30September-30 November 2013
Consultation Process 1-22July2013 1-31December2013
Project Award 31 July 2013 31 January 2014
FinancialCloseDate 2 January 2014 31 July 2014
ExpectedDateforCommercial Operation
1 October 2017 1 October 2018 (Unit 1)1 April 2019 (Unit 2)
MONITORING OF GRIDAND TRANSMISSION SYESTEM
Grid System Operator Portal for Peninsular Malaysia
The Malaysian Grid Code Committee meeting had decided that a
workinggroupledbyST,istobesetuptodiscussthepreparation
of the Grid System Operator (GSO) portal in compliance with
clause 6.8 on General Condition in the Peninsular Grid Code. The
portal displays issues of the grid system including maximum
demand, fuel mix, current status of the grid system and relevant
documents. A link to the portal (http://www.gso.org.my/) was
loaded on to the ST portal for information and general reference.
GRID SYSTEM OPERATOR PORTAL
Establishment of the Planning Committee for the Development of Transmission System for Peninsular Malaysia and Sabah
The committee was formed to study the transmission system
requirements as well as for monitoring the implementation of
related projects in the peninsula and Sabah as agreed in the Pre
-JPPPETmeetingsforpeninsulaNo.2/2011inJuly2011.
The establishment of this committee also aims to:
• ensure sufficient capacity of the transmission system to
accommodate the increased load, increase of generation,
capacity, system strengthening and minimising constraints
in the system;
• ensurethatthedevelopmentof thetransmissionsystemis
implemented as a planned and orderly manner and comply
with the regulatory and legislative requirements; and
• monitor the progress of the transmission system being
developedandplannedbyTNBandSESBaswellasassisting
in the resolution of issues that arise.
ThetransmissionsystemDevelopmentandPlanningCommittee
for Peninsular Malaysia and Sabah will sit and discuss at least
twice a year and will be chaired by ST and comprise as members
TNB, SESB, Ministry of Energy, Green Technology and Water,
Public Private Cooperation Unit, Economic Planning Unit and
Sabah Economic Planning Unit.

AN
NU
AL
REP
OR
T 20
1270
Sabah Electricity Sdn Bhd (SESB)
SESB’s financial performance has yet to recover, despite the
Government’s decision on the tariff adjustment in Sabah in July
2011.SESBrecordedalossofRM50millionin2012followinga
loss of RM102 million in 2011 (restated). This is due to the supply
cost incurred by SESB being higher than the revenue income
earned through the sale of electricity.
Thus, the total equity of SESBcontinues to be in a deficit due
toyearly losses.The total long-termSESBliabilities increased
by4%in2012from2011.SESB’scurrentassetswereunableto
coveritscurrentliabilitiesduetoworkingcapitaldeficit.
Independent Power Producers – IPPs
Peninsular Malaysia
For the financial year of 2011, the average return on assets
(ROA) rate for the first generation IPPs was 18.8%, 6.5% for the
second generation IPPs while for the third generation IPPs it was
1.1% .The low return rate for third generation IPPs was due to
thefinancialpositionofJimahEnergyVenturesSdnBhdwhich
recorded a loss of 1.8%.
The first generation IPPs obtained a higher return rate than the
othergenerations, in linewith thenecessary risk takenat the
beginning of the IPP program in 1993 due to the low confidence
of the financiers, unproven capability of the local developers’ and
uncertainties in the implementation process. With the experience
andknowledgegained,thetermsforsecondandthirdgeneration
IPPs were tightened accordingly and reasonably. As a result, the
ROA of second and third generation IPPs were in the range of
10% to 11% in the 2011 financial year.
FINANCIAL PERFORMANCE OF LICENSEESGENERATION LICENCE HOLDERS
The review of the financial performance of the main generation
licensees is carried out each year to monitor their technical and
financial performance. The analysis is done through information
in the audited financial statements submitted to ST by the
generation licensees as stipulated in the terms and conditions
of the licence.
Tenaga Nasional Berhad (TNB)
Inthe2012financialyear,TNBrecordedanetprofitofRM3.12
billion, an increase by 439% from the 2011 FY (restated) (RM578
million). The sudden profit increase is due to the injection of funds
amounting to almost RM3.15 billion received by TNB through
the adjustment of alternative fuel cost-sharing mechanism.
Therefore, TNB’s return on ratebase (RoRB) in 2012 is in the
range of 5.5%, compared to 1% in 2011.
Note : RoRB Formula = (Sales Revenue – Operating Expenses – Depreciation – Consumer Deposits Interest – Regulatory Tax)
(Property, Power Stations & Equipment – Deferred Income – Consumer Deposits)
Fromtheaspectofdebttoequityratio,TNBrecordedadecline
from 0.9 in 2011 to 0.7 in 2012. This is due to the loan decrease
of 5% to RM24 billion compared to the previous financial year
(RM25 billion).
promoting a transparent and competitive energy industry (continued)

71
LIST OF IPPS BASED ON THEIR IMPLEMENTATION STAGE
IN PENINSULAR MALAYSIA
List of IPPs in Peninsular Malaysia Installation Capacity (Mw)
First Generation
1.GentingSanyenPowerSdnBhd 762
2.PDPowerBhd 440
3.PowertekBhd 440
4.SegariEnergyVenturesSdnBhd 1,303
5.YTLPowerSdnBhd 1,212
Second Generation
6.PanglimaPowerSdnBhd 650
7.PahlawanPowerSdnBhd 640
8.GB3SdnBhd 720
9.KaparEnergyVenturesSdnBhd 2,420
10.PraiPowerSdnBhd 334
11.TNBJanamanjung 2,100
12.TTPCSdnBhd 350
Third Generation
13.TanjungBinPower 2,100
14.JimahEnergyVentures 1,400
Sabah
Compared to the financial performance of the IPPs in the
peninsula, the IPPs in Sabah recorded different return rates and
do not have different power purchase aggreements for IPPs of
different implementation stages.
On average, for the 2011 financial year, IPPs in Sabah recorded a
return rate in the range of 2.6% ROA, including ARL Tenaga Sdn
Bhdwhichsufferedaloss.
IPP LIST BASED ON GENERATION IN SABAH
List of IPPs in Sabah Installation Capacity (Mw)
ARLPowerSdnBhd 50
RanhillPowertronSdnBhd 190
SepangarBayPowerCorporationSdnBhd 100
SerudongPowerSdnBhd 36
StratavestSdnBhd 60
GAS BILLING MECHANISM
In 2012, the implementation of the new mechanism for gas
billing continued as a step in the improvement towards
creating a sustainable electricity industry. This mechanism was
introduced to address the unintended gains by the independent
power producers (IPPs) that generated electricity using natural
gas as fuel source.
Forthispurpose,aCommitteeforGasBillingmechanismwasset
up in 2011 and chaired by the ST and as the secretariat to oversee
the calculations of the savings and certify the revenue from the
said gas savings to the Consolidated Fund. The members for the
Gas Bill Mechanism Committee were the Economic Planning
Unit,MinistryofEnergy,GreenTechnologyandWater,TNBand
PETRONAS with MyPOWER Corporation, acting as an observer.
With the implementation of the new gas billing mechanism,
PETRONAS will produce two types of bills as follows:
• BillstoIPPatRM6.40permmBtubasedonthequantityof
gas supplied as fuel to the power generation stations; and
• BillstoTNBonthecurrentgaspricedifferentialsofRM6.40
per mmBtu, based on the quantity of gas supplied to the
independent generators.
The savings obtained by TNB as a result of the reduction of
fuel payments to the IPPs were channeled to the Consolidated
Fund at the Ministry of Energy, Technology Green and Water
(KeTTHA).Onthewhole,thevalueofthesavingsfromthenew
billing mechanism had recorded RM69.7 million or an average of
RM3.167millionamonthfromMarch2011tillDecember2012.
The revenue earned from the savings mechanisms of new gas
billing fromMarch 2011 until December 2012 is shown in the
diagram overleaf.

AN
NU
AL
REP
OR
T 20
1272
VALUE OF SAVINGS FROM THE GAS BILLING MECHANISM
Total till December 2012 = RM69.7 million7.00
6.00
5.00
4.00
3.00
2.00
1.00
0
RM
Mill
ion
1.82 2.08
1.35
2.93 2.88 2.96 2.91 3.07 3.11 2.95
3.98
4.80
3.98
2.57
4.81
4.14
3.17
3.96
2.98 2.82
Mar2011
Apr2011
May2011
Jun2011
Jul2011
Aug2011
Sep2011
Oct2011
Nov2011
Dec2011
Jan2012
Feb2012
Mar2012
Apr2012
May2012
Jun2012
Sep2012
Oct2012
Aug2012
Jul2012
Nov2012
Dec2012
2.70
3.69
Month
DISSEMINATION OF INFORMATION ONAND PERFORMANCE OF INDUSTRY
Malaysia Energy Information Hub (MEIH)
The Malaysia Energy Information Hub (MEIH) is a comprehensive
nationalone-stopdatacentreaimedatdisseminatinginformation,
data and statistics pertaining to energy in Malaysia. The hub
consistsofdatacollectedbytheNationalEnergyBalance(NEB)
publication, electrical data information, statistics regarding
industrial energy and piped gas distribution in Malaysia.
MEIH PORTAL
MEIH was developed specifically for policy makers, industry
players and analysts to share relevant information and planning
concepts and energy prices which later can be used as a useful
reference. It also helps ST gather and conduct internal research
or in collaboration with domestic and foreign regulators.
InDecember2012, thisportalhad recordednearly15,000users
and visitors from Malaysia, India, United States, Europe and several
Asian countries .
Publication of Electricity Supply IndustryOutlook 2013 for Peninsular Malaysia
Thepublicationof theElectricitySupply IndustryOutlook2013
is aimed at providing a clear and updated information regarding
the electricity supply situation, current supply system and future
industry direction. It could be a useful source of reference for
interested investors in the electrical supply infrastructure
development, financial analysts to evaluate the reputable
companieslistedinBursaMalaysiaandanypartiesinterestedin
the industry development.
This initiative is also to improve transparency in the planning
of the additional generation capacity in future and as an effort
to encourage potential investors to execute new generation
projects in Malaysia.
InformationintheOutlookreportcoversthefollowingmatters:
• Current electricity supply situation for maximum demand,
generation etc;
• GenerationdevelopmentplanasagreedbyJPPPET;and
• InformationbasedonthelateststudiesconductedbySTand
MyPower.
promoting a transparent and competitive energy industry (continued)

73
Harmonisation of Definitions of Levels of Supply Voltages for Use in the Electricity Supply Industry
The harmonisation of the voltage level definitions was approved
by ST on 5 November 2012, based on recommendations by
the Grid Code Committee, the Peninsular Distribution Code
Committee and the Panel for Sabah and Labuan Grid Code.
Subsequently, ST will amend the Electricity Supply Act 1990
and Electricity Regulations 1994 to include the harmonised
definitions.
AMENDMENTS OF VOLTAGE LEVEL DEFINITION
Voltage level Amendment Justification
Extra Low Voltage V≤ 50 Maintain definition on ESA 1990/ER 1994
Low Voltage 50 <V≤ 1kV Same as above
Medium Voltage 1kV<V≤50kV The maximum value of the existing medium voltage level is maintained. Clause 5.4.4 oftheDistributionCodeis referred to.
High Voltage 50kV<V≤230kV Minimum level of high voltage as the continuation for maximum level ofmedium voltage whilemaximum level of high voltage as in MSIEC 60038:2006
Extra High Voltage 230kV<V BasedonMSIEC60038:2006
74

75
Ensuring Efficient and Safe Consumption of EnergyST not only ensures that the country’s energy supply is secure
but also that it is used efficiently and safely.
To achieve this objective, ST monitors the nation’s electricity
intensity besides implementing Energy Efficiency promotional
programmes involving industry players and the community.

AN
NU
AL
REP
OR
T 20
1276
NATIONAL ELECTRICITY INTENSITY
Electricity is the primary energy source for the development
and economic growth of a country. Malaysia’s vision of becoming
a developed and high income nation by 2020 is certainly going
through a rapid development phase whereby it would involve
an increase in the electricity demand in the country, especially
in the industrial sector. Normally, electricity demand is
associated with the country’s economy. The efficiency of a
country’s electricity consumption is measured through energy
intensity indicators. Electricity energy intensity is the electrical
energy used to produce one unit of gross domestic product
(GDP).
what is Electricity Intensity?Electricity Intensity is the electrical energy used to
produce a unit of Gross Domestic Product (GDP).
Electricity intensity is used as one of the indicators to
measure the efficiency of electrical energy consumption
in the country.
what is the Gross Domestic Product ( GDP )?GDP is a way to measure the national economy of a
country. GDP means the total market value of goods
and final services within a country for a year (usually in
thecalendaryear).It isalsotakesintoaccountthetotal
value added in each stage of production of goods and final
services produced in a country and is given in currency
value.GDPcanbemeasuredbythreeapproachesnamely
product approach (or output), the income approach
and the expenses approach. In principle, all the three
approaches give the same results .
Every year the intensity of electricity is used as an efficiency
measurement for the electricity consumption in the country.
The generated electrical energy is used in a various sectors
such as the industrial, commercial, service and domestic
sectors. The enhancement of GDP growth, the increasing
number of population and the current lifestyle which heavily
depends on electrical equipment are among the factors that
influence electricity consumption in the country. Logically,
countrieswithhigherGDPwillusehigherelectricalenergy.
Anassumption ismade thatcountries thathaveahighGDP
and have lower intensity, are considered to be efficient in
consuming energy.
However, energy intensity indicators do not fully reflect the
level of energy efficiency due to fluctuations in energy intensity
which are not only influenced by increasing the process
efficiency and equipment but by other factors that contribute
to the increase or decrease of energy consumption but are
irrelevant to energy efficiency. Energy consumption may be
influenced by structural changes, behavior and weather.
Structural changes in the economy is the main mover of the
economycompositionandinanyend-usesectorsthataffects
the energy intensity but not associated with an increase in
energy efficiency. In the industrial sector, changes in the
manufacturing sector from the energy-intensive industries
such as primary metals, chemicals and forest products to
lessenergy-intensiveindustriessuchastransportequipment
or food will cause a decrease in the energy intensity index, do
not necessarily reflect improvement in energy efficiency. In
a similar context, if the population shift from cold climate to
warmer climate, the intensity of heating for the commercial
and residential sectors in winter decrease, but the intensity
for air conditioning in summer may be increased. Similarly,
if the number of people in a household changes, the overall
energyconsumptionwillbelikelytochange.
Energy efficiency refers to the activity or product that
can be produced with a given amount of energy, for
example, tons of steel can be melted by megawatt hours
of electricity.
Changes in national energy consumption per unit of gross
domestic product due to behavioral factors do not reflect
increase in energy efficiency. Its quite difficult to distinguish
between behavioral and structural changes as sometimes
demographic changes such as aging population may contribute
to behavioral change that affect energy consumption. Thus,
detailed calculation of energy intensity according to types
of economic activities carried out for each main sectors are
more accurate to reflect the level of energy efficiency. It also
makes it easier for the Government to plan the necessary
actionstobetakenbyenergyefficiencyprogramsforenergy
conservation and effectively prevent energy wastage.
ensuring efficient and safe consumption of energy

77
ENERGY INTENSITY, GwH/GDP AT CONSTANT 2005 PRICE
(RM MILLION )
Gw
h/R
M M
illio
n
0.180
0.160
0.140
0.120
0.100
0.080
0.060
0.040
0.020
02002 2003 2004 2005 2008 2009 2010 2011 201220072006
0.15
1
0.15
0
0.15
2
0.14
8
0.14
7
0.14
6
0.14
5
0.15
3
0.15
4
0.15
1
0.15
5
Year
In 2012, the country’s energy intensity increased by as much as
2.65% from 0.151 GWh per RM million in 2011 to 0.155 GWh per
RM million. The amount of electrical energy consumption for
2012 was 116.350 GWh, an increase of 8:40% compared to the
previousyear,whilethecountry’sGDPalsoincreasedin2012
comparedin2011byasmuchas5.64%.TheGDPforallsectors
showed improvement. For the year 2012, the manufacturing
sector indicated an increase of 4.78% compared to the year
2011.
Since energy intensity is often associated with efficient electricity
consumption and in line with ST’s responsibility in promoting
energyefficiency,theSThastakenvariousstepsandinitiated
energy efficiency promotion activities in Malaysia including
promoting energy saving among consumers by incentives to
manufacturers who provide energy efficient equipment or any
energy efficient product that fulfills the criteria set by ST. This
effort can directly promote energy efficiency and encourage
the manufacturer to supply energy efficient equipment in the
country. Among the qualifying equipment are refrigerators,
domestic electric fans, ballasts for fluorescent lights, air
conditioners,electriclights,televisions,high-efficiencymotors
and insulation material.
These incentives are to encourage efficient energy equipment
being provided and widely distributed. This will facilitate easy
access by the consumers if they wish to change to using energy
efficient equipment in their daily lives.
Apart from the above efforts, ST also enforced the Efficient
Management of Electrical Energy Regulations 2008 (EMEER
2008) where the firm that uses electrical energy equivalent to or
morethan3millionkWhin6consecutivemonthshavetoappoint
an Electrical Energy Manager (EEM) registered with ST. With
the enforcement of these regulations, ST will be able to monitor
and ensure that the installation involved reports electricity
consumption on a regular basis to the ST.
Inaddition,theGovernmenthasalsotakenstepstoinitiatethe
“lead by example” program in which a circular has been issued
for all Government buildings to maintain its indoor temperature
at 24°C. These measures are taken in accordance with the
Government‘s efforts to reduce and use electricity efficiently
without incurring any cost. It also ensures that the Government
sets a good example and is aimed at motivating others to also
takethesamestep.Apartfromtheabovementionedinitiatives,
the Government also plans to revise the fuel prices for the
generation sector every 6 months until it reaches market
levels. This will thus influence the country’s electricity tariff
settingprocess.Afterreviewingandreflectingmarketprices,
the electricity tariff will in turn act as a guide for consumers to
use electricity more efficiently.

AN
NU
AL
REP
OR
T 20
1278
INITIATIVE TO ENCOURAGE ENERGY EFFICIENCY
Efficient Management of Electrical Energy Regulations (EMEER) 2008
In2012,53applicationswerereceivedbyST.During theperiod,
11 interview sessions for Electrical Energy Manager (EEM) were
conducted and 44 candidates had passed the interview and
subsequently registered as Electrical Energy Managers. The total
number registered for EEM in 2012 was 212 compared to 168
registered in 2011.
STATISTIC OF EEM REGISTERED UNDER EMEER 2008
Item 2011 2012
Applications received 72 53
Applications rejected 0 7
Interview sessions 10 11
Interviewed applicants 72 46
Successful candidates 32 44
Unsuccessful candidate 40 2
Appointment of Registered EEM by Installation Owners
As of 2012, a total of 1,423 installations have been identified as
using more than 3 GWh of electricity within 6 months. 208 owners
of such installations have appointed EEM in 2012.
STATISTIC OF REGISTERED EEM APPOINTMENT
Subject 2011 2012
Total number of installations affected by the Efficient Management of Electrical Energy Regulations 2008
1,490 1,423
Number of installations that have appointed EEM
249 457
Enforcement and Visit to Premises
Enforcement and visits to premises that have not appointed
EEM were carried out during the year 2012. It included sending
notices and reminders to each premise or installation which
were subjected to EMEER 2008. A total of 25 enforcement visits
were conducted throughout 2012 and all premise owners were
informed on the requirement to comply with EMEER 2008.
ENERGY EFFICIENCY INCENTIVES
In 2012, ST intensified efforts to evaluate energy efficiency
incentives and equipment applications as follows:
ENERGY EFFICIENCY AND EQUIPMENT INCENTIVES
Category Incentive
Energy Efficient Equipment •SalesTaxExemption•ImportDutyExemption
Energy Efficiency and Generation Projects
•InvestmentTaxAllowance•PioneerStatus•SalesTaxExemption•ImportDutyExemption
Energy Efficient Equipment
A total of 82 applications covering 1,652 energy-efficient
equipment models such as televisions, refrigerators, air
conditioners, fans, lighting, insulation materials, ballasts and
high efficiency motors had been assessed technically and
approved in 2012.
STATISTICS OF ENERGY EFFICIENT ELECTRICAL EQUIPMENT
AND MATERIAL APPROVED
Type of Product
Total 2011
Total 2012
Total Approved Model (according to star rating)
3-Star 4-Star 5-Star
Air Conditioner 282 340 - 100 240
Refrigerator 51 45 - 1 44
Fan 254 362 4 77 281
Television 430 592 - 7 585
Insulation Material
27 17
Ballast 23 44
High Efficiency Motor
287 215
Light Emitting Diode(LED)Lamp
11 37
Total 1,365 1,652
ensuring efficient and safe consumption of energy (continued)

79
Energy Efficiency and Conservation Projects
In 2012, 35 applications involving 56 energy efficiency projects
had been received and evaluated. 33 projects had been approved
by ST. The evaluation reports were submitted to the Malaysian
Investment Development Authority (MIDA) for obtaining
investment tax exemption.
STATISTICS OF ENERGY EFFICIENCY PROJECT IN 2012
Subject 2012
Total applications received 35
Total proposed projects 56
Total approved projects 33
Total unsuccessful projects 23
Estimatedenergysavingsperyear(kWh) 46,989,664
ELECTRICAL SAFETY DEVELOPMENT
Statistics of Electrical Accident Cases
In 2012, electrical accidents decreased by seven cases compared
to 2011, from 62 to 55 cases.
NUMBER OF ACCIDENT CASES PER MILLION ELECTRICITY
USER/CONSUMERS OF TNB AND SESB 2002-2012
Consumer (Million) Non Fatal (Million) Fatal (Million)
14.00
12.00
10.00
8.00
6.00
4.00
2.00
0.002002 2003 2004 2005 2006 2007 2008 2009 2010 2011 2012
5.80 6.
07
2.24 3.
623.80 4.
616.
35 6.60
5.45
3.18
6.84
5.11
7.45
7.07
5.51 6.
50 7.33 7.60 7.87 8.19
3.42
3.36
3.003.
798.
33
3.944.08
2.90
4.36 5.
59
5.59
3.47
4.89
Year
No. of Case
The fatal accident rates per million consumers also decreased
from3.79in2011to3.0in2012andnon-fatalaccidentrateper
million consumers decreased from 3.42 in 2011 to 3.36 in 2012.
Total utility consumers in 2012 was 8.33 million.
ELECTRICAL ACCIDENT CASES 2008 – 2012
2012
2735
28
62
55
90
80
70
60
50
40
30
20
10
0
20
32
5148
12
2002 2003 2004 2005 2006 2007 2008 2009 2010 2011
30
1830
3423
3049
3441
2941
29 27
33 36
21
Fatal Non Fatal Total
57
7975
70
56
69
YearTo
tal c
onsu
mer
s an
d ra
te
Location Of Electrical Accidents
ELECTRICAL ACCIDENT LOCATION (2008-2012)
Location 2008 2009 2010 2011 2012
Residence (domestic) 11 9 8 16 6
School 1 1 0 0 0
Institution of Higher Learning
1 0 0 2 0
Factory (industry) 5 7 8 6 5
Local Government Council 1 1 3 2 2
Government Premise 2 1 0 0 2
Private Premise (commercial)
7 4 10 4 4
Construction Site 0 1 2 1 0
LVOverheadUtilityCable 10 12 10 11 13
HVOverheadUtilityCable 8 5 6 4 13
Electric Utility Substation 22 12 17 13 7
Underground Utility Cable 2 1 3 2 2
Plantation 0 2 2 1 1
Mines 0 0 0 0 0
Total 70 56 69 62 55
Basedontheaccidentanalysisoflocationsin2012,zeroaccidents
were recorded for schools, institutions of higher learning,
construction sites, and the mining areas. School locations
have recorded zero accidents for three years consecutively.
For domestic installations, the number of accident cases had
reduced by 10 cases compared to the year 2011. This was a result
of the awareness campaign s conducted by ST and other related
agencies.
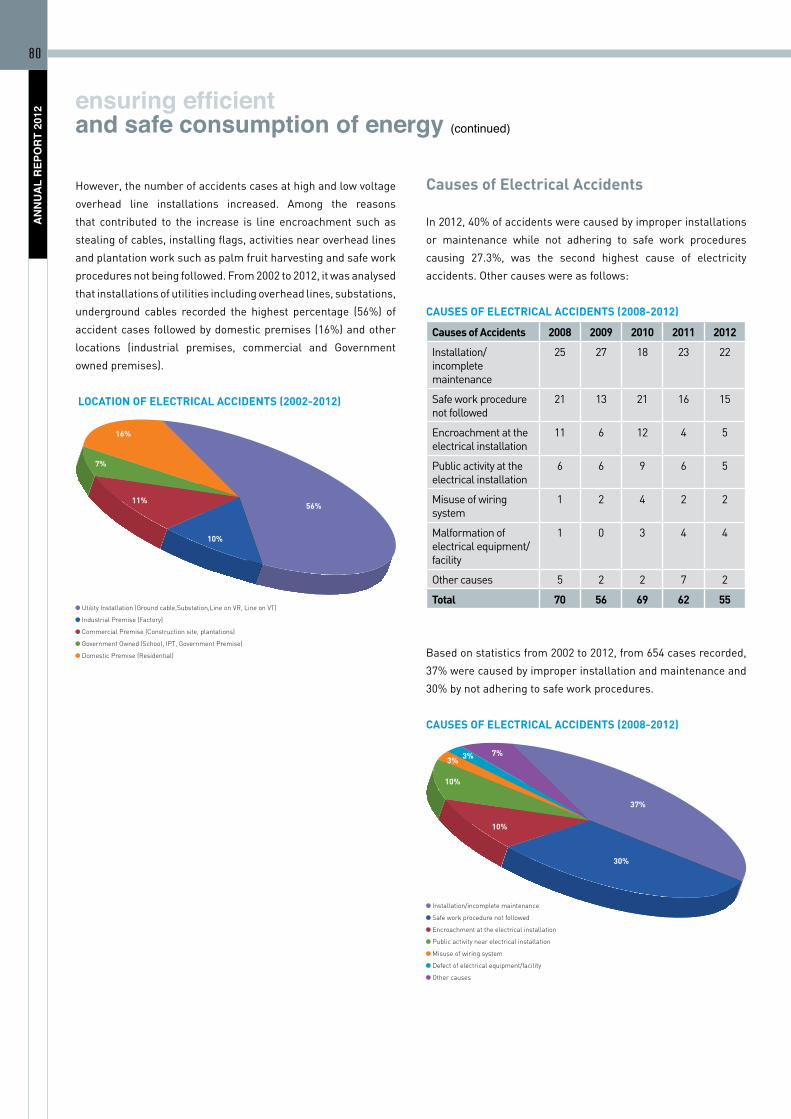
AN
NU
AL
REP
OR
T 20
1280
ensuring efficient and safe consumption of energy (continued)
However, the number of accidents cases at high and low voltage
overhead line installations increased. Among the reasons
that contributed to the increase is line encroachment such as
stealing of cables, installing flags, activities near overhead lines
andplantationworksuchaspalmfruitharvestingandsafework
procedures not being followed. From 2002 to 2012, it was analysed
that installations of utilities including overhead lines, substations,
underground cables recorded the highest percentage (56%) of
accident cases followed by domestic premises (16%) and other
locations (industrial premises, commercial and Government
owned premises).
LOCATION OF ELECTRICAL ACCIDENTS (2002-2012)
56%
10%
11%
7%
16%
Utility Installation (Ground cable,Substation,Line on VR, Line on VT)
Industrial Premise (Factory)
Commercial Premise (Construction site, plantations)
Government Owned (School, IPT, Government Premise)
Domestic Premise (Residential)
Causes of Electrical Accidents
In 2012, 40% of accidents were caused by improper installations
or maintenance while not adhering to safe work procedures
causing 27.3%, was the second highest cause of electricity
accidents. Other causes were as follows:
CAUSES OF ELECTRICAL ACCIDENTS (2008-2012)
Causes of Accidents 2008 2009 2010 2011 2012
Installation/incomplete maintenance
25 27 18 23 22
Safeworkprocedurenot followed
21 13 21 16 15
Encroachment at the electrical installation
11 6 12 4 5
Public activity at the electrical installation
6 6 9 6 5
Misuse of wiring system
1 2 4 2 2
Malformation of electrical equipment/facility
1 0 3 4 4
Other causes 5 2 2 7 2
Total 70 56 69 62 55
Basedonstatisticsfrom2002to2012,from654casesrecorded,
37% were caused by improper installation and maintenance and
30%bynotadheringtosafeworkprocedures.
CAUSES OF ELECTRICAL ACCIDENTS (2008-2012)
37%
30%
10%
10%
3% 3% 7%
Installation/incomplete maintenance
Safe work procedure not followed
Encroachment at the electrical installation
Public activity near electrical installation
Misuse of wiring system
Defect of electrical equipment/facility
Other causes

81
Ensuring Legal Compliance
ST believes that the formulation of policy must be accompanied
by monitoring the enforcement so as to ensure legal
compliance.
Electrical and gas installations must be registered with ST,
and installation maintenance must be done by Competent
Personnel.BesidesconductingManagementandEngineering
Audits, equipment and generation activities are also monitored.
Thosewhobreakthelawscanbeinvestigatedandprosecuted.

AN
NU
AL
REP
OR
T 20
1282
15. UniversitiTelekomSdnBhd-UniversitiMultimediaCyberjaya
Distribution 5.10
16. UniversitiTelekomSdnBhd-UniversitiMultimediaMelaka
Distribution 8.00
17. Sagajuta(Sabah)SdnBhd Distribution 3.22
18. MalaysiaLandedSdnBhd Distribution 3.00
19. EraBaruSdnBhd Distribution 5.95
20. Mammoth Empire Estate SdnBhd
Distribution 8.48
21. GCHRetail(Malaysia)SdnBhd-GiantSetapakHypermarket
Distribution 2.72
22. GCHRetail(Malaysia)SdnBhd-GiantKualaPilahSupermarket
Distribution 2.04
23. GCHRetail(Malaysia)SdnBhd-GiantSubangJayaHypermarket
Distribution 4.25
24. MustEhsanDevelopmentSdnBhd
Distribution 8.55
25. PrestigeScaleSdnBhd Distribution 8.50
26. Joint Management CouncilQueensbayMall
Distribution 20.00
27. EsquireCollectionSdnBhd Distribution 1.00
28. PastiAnggunSdnBhd Distribution 3.44
29. MCTGreenTechnologySdnBhd Distribution 10.16
30. WizePlatinumSdnBhd Distribution 3.00
31. GentingSimonSdnBhd Distribution 4.08
32. GCHRetail(Malaysia)SdnBhd-GiantHypermarketRawang
Distribution 1.28
33. AtriaDamansaraSdnBhd Distribution 11.50
34. PetronasGasBerhad-MukimTanggaBatu,Melaka
Distribution 5.95
35. AmtrusteeBerhad-EastCoastMall,Kuantan
Distribution 10.0
36. MinesWaterfrontBusinessParkSdnBhd
Distribution 4.80
37. Mines2SdnBhd Distribution 3.20
38. NusajayaLifestyleSdnBhd Distribution 3.40
39. GCHRetail(Malaysia)SdnBhd-GiantHypermarketCheng,Melaka
Distribution 2.10
40. SEOEnergySdnBhd Generation-Private
(Renewal)
1.20
41. JanaLandfillSdnBhd Generation-RE
1.07
42. CyparkSuria(Negeri Sembilan) SdnBhd
Generation-RE
3.00
43. CyparkSuria(Pajam)SdnBhd Generation-RE
5.00
LICENSING AND ACCREDITATION ACTIVITIES
Issuance of Public and Private Electrical Licences
Application for public licences issued by ST in 2012 recorded a
sharp increase compared to previous years due to aggressive
efforts in reorganising and licensing renewable energy activities
approved under the Feed in Tariff scheme.
Two public generation licences (IPP), 37 public distribution
licences, 22 public licences for renewable energy generation
and a cogeneration public licence were issued. In addition, ST
also issued 59 provisional public licences with a total capacity of
158.75 MW. ST issued six private licences for capacity of 5 MW
and above as well as 2,264 private licences less than 5 MW (1,200
in the peninsula and 1,064 in Sabah).
LIST OF PUBLIC LICENCES ISSUED IN 2012
No License Holder Licensed Activity
Capacity(Mw)
1. TanjungBinEnergySdnBhd Generation -IPP
1,000
2. TNBJanamanjungSdnBhd Generation -IPP
1,010
3. JelasPuriSdnBhd Distribution 6.50
4. WismaMiramaSdnBhd Distribution 1.44
5. AEONCo.(M)Bhd-AEONRawang
Distribution 8.50
6. SuriaKLCCSdnBhd Generation 0.69
7. SungeiWangPlazaManagement Corporation
Distribution 20.00
8. GCHRetail(Malaysia)SdnBhd-MukimKlang,Selangor
Distribution 1.53
9. Universiti Tenaga NasionalSdnBhd-CampusUnitenPutrajaya
Distribution 3.83
10. Universiti Tenaga Nasional Sdn Bhd-CampusUnitenSultanHaji Ahmad Shah, Pahang
Distribution 2.98
11. GCHRetail(Malaysia)SdnBhd-GiantHypermarketBanting
Distribution 3.40
12. GCHRetail(Malaysia)SdnBhd-GiantCherasHypermarket
Distribution 3.40
13. AmtrusteeBerhad-JalanBukitBintang/JalanRajaChulan,KualaLumpur
Distribution 22.10
14. ECAlamjayaSdnBhd Distribution 5.84
ensuringlegal compliance
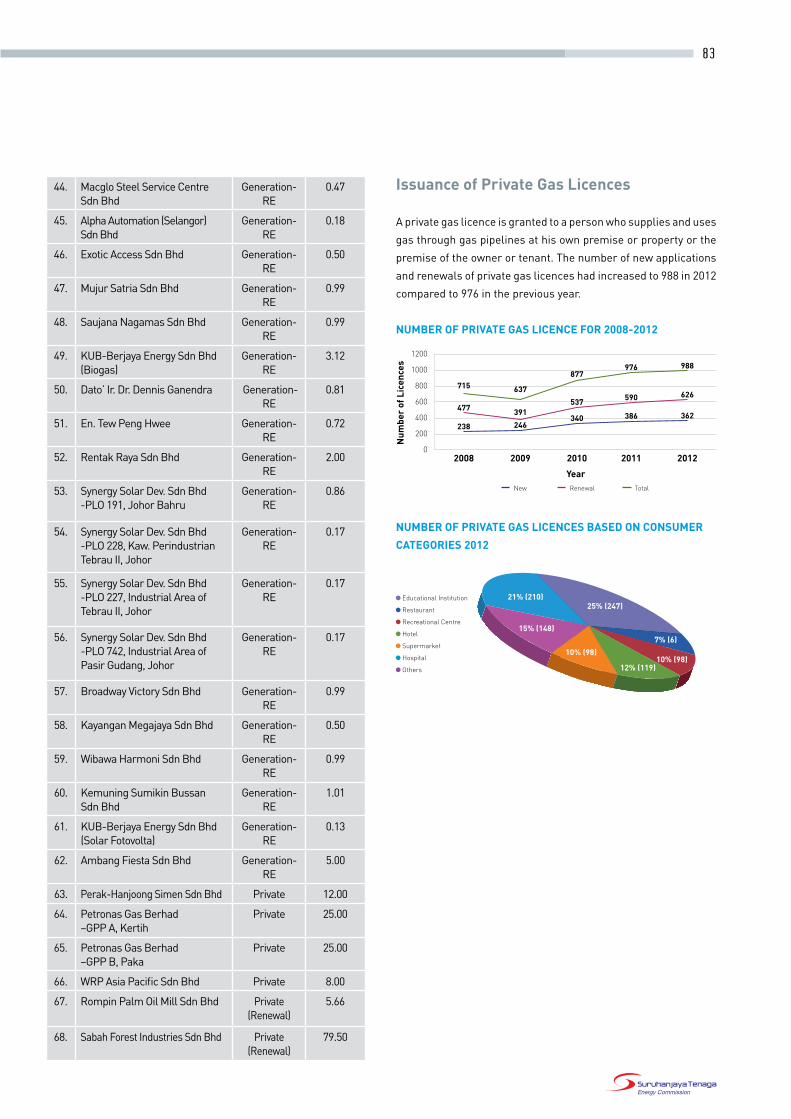
83
Issuance of Private Gas Licences
A private gas licence is granted to a person who supplies and uses
gas through gas pipelines at his own premise or property or the
premise of the owner or tenant. The number of new applications
and renewals of private gas licences had increased to 988 in 2012
compared to 976 in the previous year.
NUMBER OF PRIVATE GAS LICENCE FOR 2008-2012
1200
1000
800
600
400
200
0
238 246340
2008 2009 2010 2011 2012
TotalRenewalNew
386 362477 391
537 590 626
988976877
637715
Year
Num
ber
of L
icen
ces
NUMBER OF PRIVATE GAS LICENCES BASED ON CONSUMER
CATEGORIES 2012
25% (247)21% (210)
12% (119)10% (98)
10% (98)
15% (148)7% (6)
Educational Institution
Restaurant
Recreational Centre
Hotel
Supermarket
Hospital
Others
44. Macglo Steel Service Centre SdnBhd
Generation-RE
0.47
45. Alpha Automation (Selangor) SdnBhd
Generation-RE
0.18
46. ExoticAccessSdnBhd Generation-RE
0.50
47. MujurSatriaSdnBhd Generation-RE
0.99
48. SaujanaNagamasSdnBhd Generation-RE
0.99
49. KUB-BerjayaEnergySdnBhd(Biogas)
Generation-RE
3.12
50. Dato’Ir.Dr.DennisGanendra Generation-RE
0.81
51. En. Tew Peng Hwee Generation-RE
0.72
52. RentakRayaSdnBhd Generation-RE
2.00
53. SynergySolarDev.SdnBhd-PLO191,JohorBahru
Generation-RE
0.86
54. SynergySolarDev.SdnBhd-PLO228,Kaw.PerindustrianTebrau II, Johor
Generation-RE
0.17
55. SynergySolarDev.SdnBhd-PLO227,IndustrialAreaofTebrau II, Johor
Generation-RE
0.17
56. SynergySolarDev.SdnBhd-PLO742,IndustrialAreaofPasir Gudang, Johor
Generation-RE
0.17
57. BroadwayVictorySdnBhd Generation-RE
0.99
58. KayanganMegajayaSdnBhd Generation-RE
0.50
59. WibawaHarmoniSdnBhd Generation-RE
0.99
60. KemuningSumikinBussanSdnBhd
Generation-RE
1.01
61. KUB-BerjayaEnergySdnBhd(Solar Fotovolta)
Generation-RE
0.13
62. AmbangFiestaSdnBhd Generation-RE
5.00
63. Perak-HanjoongSimenSdnBhd Private 12.00
64. PetronasGasBerhad–GPPA,Kertih
Private 25.00
65. PetronasGasBerhad–GPPB,Paka
Private 25.00
66. WRPAsiaPacificSdnBhd Private 8.00
67. RompinPalmOilMillSdnBhd Private (Renewal)
5.66
68. SabahForestIndustriesSdnBhd Private (Renewal)
79.50

AN
NU
AL
REP
OR
T 20
1284
REGISTRATION OF INSTALLATION
Certification of Electrical Installation Registration
For registration of electrical installations in 2012, there was an
increase of 10.2% compared to 2011. A total of 11,068 electrical
installations had been registered in 2012 compared to 10,045
installations in 2011.
REGISTRATION CERTIFICATION OF ELECTRICAL
INSTALLATIONS IN 2012
States Total
Perlis 23
Kedah 370
Pulau Pinang 850
Perak 600
Selangor 2,756
WilayahPersekutuanKualaLumpur and Putrajaya
2,090
Negeri Sembilan 356
Melaka 322
Johor 1,463
Kelantan 178
Terengganu 252
Pahang 447
West Coast of Sabah 740
East Coast of Sabah 621
Total 11,068
Approval of Gas Installation
Total applications for Approval to Install (ATI) and Approval
to Operate (ATO) for both natural gas and LPG installations
increased slightly to 1,865 applications in 2012 compared to 1,817
in 2011. The approvals issued include approval to install metering
stations, distribution stations and additional gas installations.
The approval are classified as Class I, II and III based on the
maximum operating pressures of the gas installations.
APPROVALS FOR INSTALLING & OPERATING OF NATURAL GAS
INSTALLATIONS
Approval Category 2008 2009 2010 2011 2012
Installing (ATI)
Industry 61 41 88 33 60
Commercial 87 48 51 65 77
Residential 34 14 11 10 9
Total 182 103 150 108 146
Operating (ATO)
Industry 83 39 73 41 38
Commercial 77 79 45 70 58
Residential 27 37 15 20 6
Total 187 155 133 131 102
APPROVALS FOR INSTALLING & OPERATING OF LPG
INSTALLATIONS
Approval Category 2008 2009 2010 2011 2012
Installing (ATI)
Industry 0 0 0 0 1
Commercial 636 601 846 850 885
Residential 22 28 35 19 20
Total 658 629 881 869 906
Operating (ATO)
Industry 0 0 0 0 1
Commercial 549 404 660 678 694
Residential 31 21 19 31 16
Total 580 425 679 709 711
APPROVALS FOR INSTALLING & OPERATING OF GAS
INSTALLATIONS BASED ON CLASS OF INSTALLATIONS
Gas Installation
Approval to Install (ATI)
Approval to Operate (ATO)
Class I
ClassII
Class III
Class I
Class II
Class III
Natural Gas 47 15 84 24 15 63
LPG 4 36 466 3 30 678
ensuringlegal compliance (continued)

85
REGISTRATION OF CONTRACTOR
Electrical Contractor Registration
The number of electrical contractors that were registered by ST
in 2012 was 3,528 (new and renewal of registration). This number
is a slight decrease compared to 2001 in which 3,787 electrical
contractors were registered with ST.
ELECTRICAL CONTRACTOR REGISTRATIONS IN 2012
States Total
Perlis 47
Kedah 251
Pulau Pinang 260
Perak 256
Selangor 759
WilayahPersekutuanKualaLumpur and Putrajaya
355
Negeri Sembilan 153
Melaka 142
Johor 450
Kelantan 184
Terengganu 170
Pahang 208
West Coast of Sabah 212
East Coast of Sabah 91
Total 3,538
Gas Contractor Registration
Gas contractors are divided into four categories, Class A, Class
B,ClassCandClassD.Eachclasshasdifferentworkscopeof
gas installations. In 2012, 3 new gas contractors were registered
compared to 6 gas contractors in 2011. Overall, the gas
contractors registered in 2012 was 121 compared to 132 in 2011.
NUMBER OF REGISTERED GAS CONTRACTORS IN 2012
Type of Application
Class A Class B Class C Class D Total
Renewal 42 52 19 5 118
New 2 1 0 0 3
CERTIFICATION OF COMPETENCY
Issuance of Electrical Certificate of Competency
In 2012, the total number certificate of competency issued was
6,281. From that amount, 84.2% or 5,286 certificates were issued
by the accredited institutions while the remaining 15.8% or 995
certificate were issued the by ST.
TOTAL OF ELECTRICAL COMPETENCY CERTIFICATES
ISSUED IN 2012
Certificate Category
Pw Endorsed PJ Certificate Replacement
Pk PE JPE JEk Total
Through ST
240 85 522 106 7 5 4 26 995
Through accreditedinstitution
3,676 0 1,606 1 0 0 0 0 5,286
Total 3,916 85 2,131 107 7 5 4 26 6,281
ELECTRICAL COMPETENCY CERTIFICATES ISSUE THROUGH
ACCREDITED INSTITUTIONS IN 2012
InstitutionCertificate category
Pw Endorsed PJ Certificate Replacement
Pk PE JPE JEk Total
ABM 199 - 17 0 0 - - - 216
IKM 980 - 754 1 0 - - - 1,735
ILP/ADTEC 887 - 209 0 0 - - - 1,096
GIAT 924 - 11 0 0 - - - 935
INSTEP 0 - 33 0 0 - - - 33
INPENS 62 - 0 0 0 - - - 62
IKTBNS 0 - 83 0 0 - - - 83
KKBNP 79 - 0 0 0 - - - 79
YBK 0 - 0 0 0 - - - 0
IKBN 438 - 431 0 0 - - - 869
KEDA 16 - 0 0 0 - - - 16
KYM 52 - 56 0 0 - - - 108
ILSAS 0 - 0 0 0 - - - 0
BAITULMAL 12 - 0 0 0 - - - 12
KISMEC 0 - 15 0 0 - - - 15
ITYNS 27 - 0 0 0 - - - 27
TESDEC 16 - 0 0 0 - - - 16
IKB 14 - 0 0 0 - - - 14
Total 3,676 0 1,606 1 0 0 0 0 5,286

AN
NU
AL
REP
OR
T 20
1286
Comparison of Issuance of Competency Certificates by ST and Accredited Institutions
NUMBER OF CERTIFICATES ISSUED BY ST 2007 - 20123,0002,5002,0001,5001,000
5000
Total CertificationsYear
No.
of c
erti
ficat
es
2011
2012
2008
2009
2010
2007
TOTAL CERTIFICATES ISSUED BY INSTITUTIONS 2007 - 20126,0005,0004,0003,0002,0001,000
0No.
of c
erti
ficat
es
2011
2012
2008
2009
2010
2007
Total CertificationsYear
STATISTICS OF ELECTRICAL CERTIFICATES OF COMPETENCY
ISSUED BY ST
YearCompetency Certification Category
Pw Endorse PJ ReplaceCert.
Pk PE JPE JEk Total
2007 416 265 792 79 1 4 6 18 1,581
2008 470 198 734 64 8 10 5 15 1,504
2009 250 250 788 63 2 15 6 22 1,396
2010 222 121 675 116 9 0 6 30 1,179
2011 185 94 654 120 6 8 7 20 1,094
2012 240 85 522 106 7 5 4 26 995
STATISTICS OF ELECTRICAL CERTIFICATES OF COMPETENCY
ISSUED THROUGH ACCREDITED INSTITUTIONS
YearCompetency Certification Category
Pw Endorse PJ ReplaceCert.
Pk PE JPE JEk Total
2007 3,044 0 1,383 29 28 0 0 0 4,484
2008 2,592 0 1,240 13 0 0 0 0 3,845
2009 2,696 0 1,403 4 0 0 0 0 4,103
2010 3,917 0 1,705 7 0 0 0 0 5,629
2011 2,362 0 884 1 77 0 0 0 3,324
2012 3,676 0 1,606 1 0 0 0 0 5,286
STATISTICS OF ELECTRICAL CERTIFICATES OF COMPETENCY
ISSUED (OVERALL)
YearCompetency Certification Category
Pw Endorse PJ ReplaceCert.
Pk PE JPE JEk Total
2007 3,460 265 2,175 108 29 4 6 18 6,065
2008 3,062 198 1,974 77 8 10 5 15 5,349
2009 2,946 250 2,191 67 2 15 6 22 5,499
2010 4,139 121 2,380 123 9 0 6 30 6,808
2011 2,547 94 1,538 121 83 8 7 20 4,418
2012 3,916 85 2,128 107 7 5 4 26 6,278
STATISTICS OF ELECTRICAL CERTIFICATES OF COMPETENCY
ISSUED 2007 – 2012
2007 2008 2009
Year
2010 2011 2012
8,000
7,000
6,000
5,000
4,000
3,000
2,000
1,000
0
No.
of c
andi
date
s
ST Institution Total
This total number consists of 219 Electrical Services Engineer
(ESE) certificates of competency, 1109 Electrical Competent
Engineers (ECE), 196 Electrical Supervisors (ES), 38,514
Chargemen (C), 56,142 Wiremen (W) and 312 Cable Jointers (CJ).
Issuance of Gas Competent Person Certificates
Until the end of 2012 the number of certified gas competent persons
produced was 769 (an increase of 51 from 718 in 2011) certifications
which comprises the categories of Gas Engineers, Gas Engineering
Supervisors and Gas Fitters.
The total number of competent persons registered with ST in
2012 was 320 which is 42% of the 769 certifications issued by the
end of 2012.
ensuringlegal compliance (continued)

87
NUMBER OF NEw GAS COMPETENT PERSON
REGISTRATION CERTIFICATIONS
Qualification Till 2006
2007 2008 2009 2010 2011 2012
Gas Engineer 73 3 0 0 3 0 0
Gas Engineering Supervisor 227 6 6 5 11 9 6
Gas Fitters – Class I 151 14 15 4 2 7 3
Gas Fitters – Class II 85 3 2 0 1 0 0
Gas Fitters – Class III 55 6 6 8 7 9 12
Total 591 32 29 17 24 25 21
NUMBER OF RENEwALS OF GAS
COMPETENT PERSON CERTIFICATIONS
Qualification 2007 2008 2009 2010 2011 2012
Gas Engineer 32 37 35 30 32 25
Gas Engineering Supervisor 74 83 86 100 110 101
Gas Fitters – Class I 91 93 99 119 106 123
Gas Fitters – Class II 31 48 39 42 31 32
Gas Fitters – Class III 60 6 10 12 14 18
Total 199 267 269 303 293 299
EXAMINATION OF COMPETENCY
Electrical Competency Examination
ST issues certificate of competence for candidates who are
eligible by having the relevant experience and have undergone
an assessment process conducted by ST or by accredited
institutions. This is to meet the requirements of Section
23 of the Electricity Supply Act 1990, which requires that an
electrical installation shall be handled or worked under the
supervision of a competent person.
The types of competency certificates issued are as follows:
• ElectricalServicesEngineer;
• CompetentElectricalEngineer;
• ElectricalSupervisor;
• Chargeman;
• Wireman;and
• CableJointer.
In 2012, 8 competency examinations for Electrical Services
Engineers, Electrical Engineers and Competent Electrical
Supervisors were conducted. 37 eligible applicants had sat
for the examinations in 2012 and 28 candidates passed the
examinations.
Meanwhile the competency examinations (theory) for Wireman
and Electrical Chargeman in 2012 session were conducted
on 27 and 28 March 2012. A total of 3,000 private candidates
had sat for the examinations simultaneously throughout the
peninsula and Sabah.
NUMBER OF PRIVATE CANDIDATES FOR COMPETENCY EXAMINATION (THEORY) FOR ELECTRICAL wIREMAN
AND CHARGEMAN IN 2012 ACCORDING TO ST REGIONAL OFFICES
Area PwI Pw3 A0 A0 A4-2 A4-1 A4 B0-2 B0-1 B0 TNB
B0 B1 B4 Total
Johor 31 18 110 110 52 12 9 11 5 11 9 1 0 297
MelakaandNegeriSembilan 11 22 30 30 9 4 23 1 0 7 18 0 0 127
SelangorandWilayahPersekutuan 3 219 373 373 23 9 162 13 8 15 138 0 3 1,017
Perak 7 61 96 96 15 10 8 4 3 6 11 1 4 249
Kedah,PerlisandPulauPinang 20 97 229 229 37 8 44 14 3 17 76 0 1 568
KelantanandTerengganu 1 44 6 6 0 0 20 0 0 10 24 0 0 154
Pahang 6 43 58 58 7 4 24 3 0 9 13 0 0 180
KotaKinabalu 10 52 61 61 4 1 17 1 0 0 1 2 0 160
Sandakan 26 32 99 99 1 2 40 0 1 1 9 1 0 213
TNBD/G - - - - - - - - - 15 - - - 15
INSTEP - - - - - - 8 - - 5 7 - - 20
Total 115 588 1,062 1,062 148 50 355 47 20 96 306 5 8 3,000

AN
NU
AL
REP
OR
T 20
1288
STATISTICS OF PRIVATE CANDIDATES FOR COMPETENCY EXAMINATION FOR ELECTRICAL
wIREMAN AND CHARGEMAN FROM 2008 TO 2012
YearCategory
TotalPw1 Pw3 A0 A1 A4-2 A4-1 A4 B0-2 B0-1 B0 TNB
B0 B1 B4
2008 212 674 1,187 210 114 54 424 53 31 13 201 3 12 3,180
2009 149 823 1,209 191 90 40 364 41 21 197 231 1 11 3,345
2010 215 676 1,190 210 113 55 432 53 22 119 258 4 28 3,375
2011 177 578 1,137 232 148 70 460 58 24 134 327 2 10 3,357
2012 115 588 1,062 200 148 50 355 47 20 96 306 5 8 3,000
wM - wIREMAN
Category Restriction
PW1 Phase 1
PW2 Phase1&testendorsement
PW3 Phase 3
PW4 Phase3&testendorsement
PW5 Phase3&signage
PW6 Phase3&signage&testendorsement
CM - CHARGEMAN
Category Restriction
AO Lowvoltagesystem(w/outaerialline&generatorstation)
A1 Low voltage system (w/out generator system)
A4-2 Lowvoltagesystem(w/outaerialline&synchronisinggenerators)
A4-1 Low voltage system (w/out synchronising generators)
A4 Low voltage system
BO2 Above low voltage system (w/out aerialline&generatorstationabovelowvoltage&w/outlowvoltagegeneratorsynchronising&lowvoltageaerialline)
BO-1 Abovelowvoltagesystem(w/outaerialline&abovelowvoltagegeneratorsystem&w/outlowvoltagegenerator synchronising)
BO Abovelowvoltagesystem(w/outaerialline&generatorstationofabovelowvoltage)
B1 Above low voltage system (w/out generator station of above low voltage)
B4 Highvoltagesystemupto33kV
CJ -CABLE JOINTER
Category Restriction
PK1 upto1kV
PK2 upto11kV
PK3 PK3upto22kV/33kV
PK4 upto66kV
PK5 upto132kV
PK6 upto75kV
ensuringlegal compliance (continued)
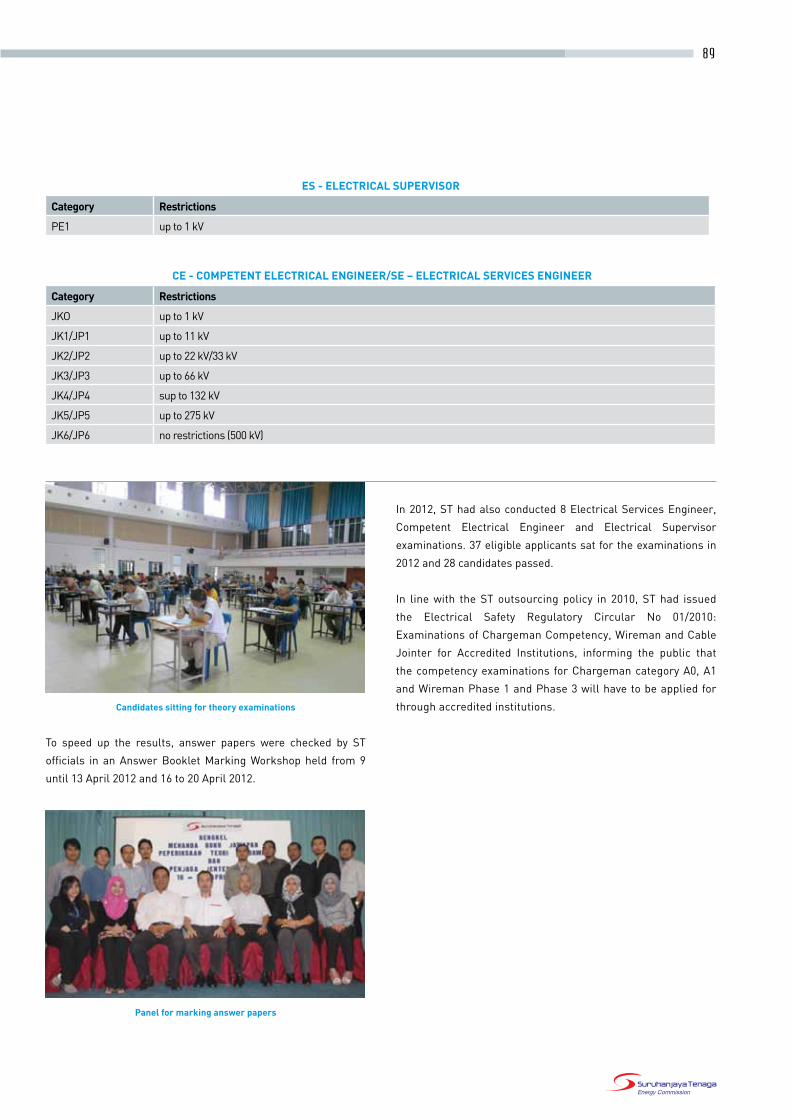
89
Candidates sitting for theory examinations
To speed up the results, answer papers were checked by ST
officials in anAnswerBookletMarkingWorkshop held from9
until 13 April 2012 and 16 to 20 April 2012.
Panel for marking answer papers
ES - ELECTRICAL SUPERVISOR
Category Restrictions
PE1 upto1kV
CE - COMPETENT ELECTRICAL ENGINEER/SE – ELECTRICAL SERVICES ENGINEER
Category Restrictions
JKO upto1kV
JK1/JP1 upto11kV
JK2/JP2 upto22kV/33kV
JK3/JP3 upto66kV
JK4/JP4 supto132kV
JK5/JP5 upto275kV
JK6/JP6 norestrictions(500kV)
In 2012, ST had also conducted 8 Electrical Services Engineer,
Competent Electrical Engineer and Electrical Supervisor
examinations. 37 eligible applicants sat for the examinations in
2012 and 28 candidates passed.
In line with the ST outsourcing policy in 2010, ST had issued
the Electrical Safety Regulatory Circular No 01/2010:
Examinations of Chargeman Competency, Wireman and Cable
Jointer for Accredited Institutions, informing the public that
the competency examinations for Chargeman category A0, A1
and Wireman Phase 1 and Phase 3 will have to be applied for
through accredited institutions.

AN
NU
AL
REP
OR
T 20
1290
STATISTICS OF ELECTRICAL CHARGEMAN AND wIREMAN
COMPETENCY EXAMINATION (THEORY) 2008 – 2012
2008 2009 2010
Year
2011 2012
4,000
3,500
3,000
2,500
2,000
1,500
1,000
500
0
Num
ber
of c
andi
date
s
Candidates
3,15
5 3,34
9
3,37
5
3,35
7
3,00
0
1,11
0
593 71
3 978
731
Passed
The transition period of a half year ended in July 2012. However,
in2012candidateshadbegunto taketheexaminationthrough
the accredited institutions, showing a reduction of candidates by
10.6%. The number of candidates is expected to increase in 2013
when ST no longer conducts private competency examinations
for the above categories.
Gas Competent Personnel Examination
During the year 2012, ST had organised the gas competent
personnel examination consisting of written examination and
oral exam (interview). Written examination must be taken by
candidates who do not meet the specified exemption criteria.
Candidates who pass the written examination will be called
for an interview for the purpose of issuance of a Certificate of
Competency.
In addition, candidates qualified to attend an interview consists
of candidates who have been excluded from the requirement of
written examination or who have passed the pipeline gas courses
conducted by recognised institutions.
A written examination session was conducted in 2012 in which
four candidates sat for the examination held on 6 November
2012. 2 candidates in the Gas Fitter Class I category passed the
exam while 1 candidate of Engineering Supervisor and Gas Fitter
Class III category failed. 24 interview sessions were conducted
and 68 candidates attended the interview.
NUMBER OF CERTIFIED COMPETENT GAS PERSONNEL
Competent Gas Personnel Examination
Until 2006
2007 2008 2009 2010 2011 2012
Written Examination
17 3 2 1 3 1 4
Oral Examination(interview)
182 16 18 4 11 60 68
Till the end of 2012, there were no new accreditation for gas
competency courses and the accreditation for 6 courses from 3
institutions remained.
ACCREDITATION OF GAS COMPETENCY INSTITUTIONS
2006 - 2012
Accreditation of Competency Institutions
Until 2006
2007 2008 2009 2010 2011 2012
Number of Institution of Learning
2 1 - - - - -
The total certifications issued to gas competent personnel was
769 (an increase of 51 from the 718 in 2011) certifications that
include Gas Engineers, Gas Engineering Supervisors and Gas
Fitters.
The total number of registered competent personnel with ST in
2012 was 320 which is 42% from the 769 certification that have
been issued until the end of 2012.
NUMBER OF NEw CERTIFICATIONS FOR REGISTRATION OF
COMPETENT GAS PERSONNEL
Approval Until 2006
2007 2008 2009 2010 2011 2012
Gas Engineer 73 3 0 0 3 0 0
Gas Engineering Supervisor 227 6 6 5 11 9 6
Gas Fitters – Class I 151 14 15 4 2 7 3
Gas Fitters – Class II 85 3 2 0 1 0 0
Gas Fitters – Class III 55 6 6 8 7 9 12
Total 591 32 29 17 24 25 21
ensuringlegal compliance (continued)

91
NUMBER OF RENEwALS OF CERTIFIED GAS COMPETENT
PERSONNEL
Approved 2007 2008 2009 2010 2011 2012
Gas Engineer 32 37 35 30 32 25
Gas Engineering Supervisor 74 83 86 100 110 101
Gas Fitter – Class I 91 93 99 119 106 123
Gas Fitter – Class II 31 48 39 42 31 32
Gas Fitter – Class III 60 6 10 12 14 18
Total 199 267 269 303 293 299
Institutional Accreditation
Toincreasethenumberandtheskillsofcompetentelectrical
certificate holders and to meet the needs of the industry,
ST also accredits training institutions that train and assess
candidates. Successful candidates will be recommended by
ST and recommendations will be validated in a Competency
Examination Committee meeting chaired by the ST Chief
Executive Officer.
In 2012, a total of 38 new approvals (including new institutions
and existing accredited institutions) were given permission to
run competency courses and examination. ST stipulates that
the training institutions have to meet the criteria set before any
accreditation is given. Among them:
• Educationalequipmentinsuitableratiowiththenumberof
students;
• Limitednumberofstudentsinanyonesession;
• Thetotal timefortheory learning,practicaland industrial
training;
• Adequatenumberofteachersatalltimes;
• Studentintakeinlinewiththerequirementsofthe
Electricity Regulations 1994; and
• Compliancetootherpoliciesstipulatedfromtimetotime.
LIST OF TRAINING INSTITUTIONS ACCREDITED IN 2012 BASED
ON CATEGORIES
Institution Category Date of Accreditation
ILP Jitra PW2 (FT) – Increase number of trainees to 30
5 April 2012
GIATMARA Raub PW2 (FT/PT) 5 April 2012
ILP Pasir Gudang PW4 (FT/PT) – Increase number of trainees to 30
5 April 2012
ILP Pasir Gudang A4 (FT/PT) 5 April 2012
ILP Pasir Gudang ModulJKSVR–(FT/PT) 5 April 2012
GIATMARABatu PW2 (FT/PT) 5 April 2012
ILSAS Malim Nawar ModulTAVT(FT/PT) 5 April 2012
GIATMARA Maran PW2 (FT/PT) 5 April 2012
PUSPATRI Johor PW2 (FT/PT) 23 May 2012
ILSASBangi ModulTAVT(FT/PT) 23 May 2012
ILSASBangi ModulJKSVT–(FT/PT) 23 May 2012
ILSAS Malim Nawar PK1(FT) 23 May 2012
ILSAS Malim Nawar PK2(FT) 23 May 2012
ILSAS Malim Nawar PK3(FT) 23 May 2012
PSDCKuantan PW2 (FT/PT) 14 August 2012
PSDCKuantan PW4 (FT/PT) 14 August 2012
PSDCKuantan A0 (FT/PT) 14 August 2012
IKBNBukitMertajam A1 (FT) – Increase number of trainees to 40
14 August 2012
ILPKuantan PW4 (FT) – Increase number of trainees to 50
14 August 2012
ILPKuantan A0 (PT) – Increase number of trainees to 30
14 August 2012
ILP Labuan PW2 (FT) – Increase number of trainees to 30
14 August 2012
ILP Labuan PW2 (PT) 14 August 2012
ILP Labuan PW4 (FT/PT) 14 August 2012
ILPKotaKinabalu PW2 (PT) 14 August 2012
INSTEP ModulJKSVR–(FT/PT) 14 August 012
INSTEP ModulJKSVT–(FT/PT) 14 August 2012
ILSASBangi A1(Restricted)toSESBofficer 14 August 2012
ILP Ipoh PW2 (FT) – Increase number of trainees to 40
1 October 2012
ILP Ipoh PW2 (PT) 1 October 2012

AN
NU
AL
REP
OR
T 20
1292
REGULATION OF ELECTRICAL EQUIPMENT
Issuance of Certificates of Approval (COA) for Electrical Equipment
In 2012, ST had issued 9,381 Certificates of Approval and Letters of Release for electrical equipment, an increase of 1,078 certificates
compared to 2011.
TOTAL CERTIFICATES OF APPROVAL AND LETTERS OF RELEASE FOR ELECTRICAL EQUIPMENT 2001 - 2012
Letter of Release From CUSTOMS Custody
YearCOA
ImportingCOA
ManufacturingCOA
Exhibition
Importing and Manufacturing COA Renewal Control Item
Uncontrolled Item Total
2001 2,214 913 19 3,670 1,224 514 8,554
2002 2,030 791 15 2,608 2,315 1,023 8,782
2003 3,113 1,334 15 3,327 955 334 9,078
2004 3,150 891 38 5,076 935 363 10,453
2005 3,786 450 43 2,562 822 222 7,885
2006 2,813 902 29 1,757 881 115 6,497
2007 2,797 944 37 1,921 1,039 374 7,112
2008 1,913 689 37 2,263 913 321 6,136
2009 3,046 972 58 2,538 527 367 7,508
2010 2,587 693 61 2,557 570 337 6,805
2011 3,557 1,187 36 2664 518 341 8,303
2012 3,957 1,069 17 3,041 815 482 9,381
ensuringlegal compliance (continued)
The issuance of COA for importing had increased by 10.1%
in 2012 compared to 2011. Imported goods from China (65%)
led the goods of other countries such as Thailand (24%),
Germany (3%), Taiwan (3%) and other countries (5%). COA for
manufacturing had reduced 11:04% in 2012 compared to 2011.
CATEGORY OF EQUIPMENT FOR MANUFACTURING (2001 -
2012)
10%
28%
24%
28%
10%
Fluorescent Lamp Fitting
Television
Wire/Cable/Cord
Switch & Dimmer
Other products
For exhibitions, only approved equipment by ST is allowed to be
displayed during the the exhibition period. After the exhibition,
theequipmentshouldbesentbacktothecountryoforigin.
TYPE OF EQUIPMENT FOR EXHIBITION 2001 - 2012
37%
22%
16%
14%
11%
Television
Hi-Fi Set
Kettle including heating element
Power Tools
Other products
Purpose of Letter of Release
A COA is required for controlled equipment. However in certain
situations, a letter of release from Customs custody is issued.
A letter of release for uncontrolled items is issued when the
equipment is:

93
• notinthelistof34controlleditems.
• notusedathomebutonlyusedatindustrialorcommercial
premises. Examples of uncontrolled equipment are street
lights,large-sizedvacuumcleanersetc.
• operatedbyspecialisedskilledpeople.
Release letter for uncontrolled equipment by ST had increased
by 41.34% in 2012 compared to the previous year. To improve its
customer service, ST has developed an online application system
for importing and manufacturing electrical equipment. Since 1
October, 2010, all applications are processed online through the
e-PermitsystemoperatedbyDagangNetTechnologiesSdnBhd
(DNT).
Issuance of Certifications of Approval for Gas Fittings, Appliances and Equipment
In the year 2012, 2 applications for gas equipment manufacture,
2 for importing equipment and 43 for gas appliances had been
approved. The total number of approval for gas appliances that
had been issued until 2011 for all three categories were 41,112
and 736 respectively.
Approved gas appliances include gas installation components
such as pipes and fittings, polyethylene fittings, meters, ball
valves,pressureregulatorsandgas-leakdetectors.
NUMBER OF APPROVALS FOR MANUFACTURER INSTALLATION
OR GAS FITTING IMPORTER OR GAS EQUIPMENT
Type of Approval Until 2006
2007 2008 2009 2010 2011 2012
Approval for installation or gas fitting, appliances, or equipment manufacturer
32 5 0 0 1 1 2
Approval for gas fittings, appliances and equipment importer
82 3 1 14 5 5 2
Total 114 8 1 14 6 6 4
NUMBER OF APPROVALS FOR GAS FITTINGS, APPLIANCES
AND EQUIPMENT
Type of Approval Until 2006
2007 2008 2009 2010 2011 2012
Approval for gas fittings, appliances, and equipment
428 32 11 83 29 110 43
MONITORING OF GENERATION ACTIVITIES
Inspection of Premises for Regularisation Cases
The regularisation of unlicensed installations was continued with
constant inspections of premises that are supplying electricity
for their own use or to third parties.
Inspection of premises that were listed in the regularisation files
had been implemented as one of the steps to determine whether
the premises are complying with the licensing requirements.
STATUS OF CASES FOR REGULARISATION
Year 2011 Updating Cases Year 2012
1. UniversitiTenagaNasionalSdnBhd Already licensed
2. TescoStores(M)SdnBhd Already licensed
3. MagnificentDiagraph(Carrefour)SdnBhd
Already licensed
4. GCHRetail(M)SdnBhd Already licensed
5. Nineteen Management Services SdnBhd(RhythmAvenueMall)
Already licensed
6. BrunsfieldPropertiesManagementSdnBhd(SubangAvenueMall)
Already licensed
7. EconsaveCash&CarrySdnBhd In progress of whitening
Among the issues raised during the inspections were:
• Licencerequirementsfordistributionactivity inaccordance
with the Electricity Supply Act 1990;
• Inspectiononinstallationcapacityatthepremise;
• Inspectionofdocumentssuchastenantbillsandapplicable
tariff; and
• Safetyinspectiononinstallationsandpremisesespeciallyin
the meter and installation rooms.
AN
NU
AL
REP
OR
T 20
1294
Inspection of Licensee Activities
STalsoundertakesrandominspectionsonlicensedinstallations.
Among the problems identified were:
• Change of ownership of complex and electricity supplier
buildings;
• Revocationoflicenceorlicenseesoperationsterminated;
• Bulksupplyproblemswithutilities;
• Increaseofareafordistribution;
• Reviewofconsumerbillsandsupplycontract;
• Latepaymentoflicencefees;and
• Compliance with laws, regulations and related license
conditions.
MANAGEMENT AND ENGINEERING AUDIT(M & E AUDIT)
BasedontotherequirementsofthelicenceissuedbySTtopublic
licensees,ManagementandEngineering(M&E)Auditsshould
be conducted once every four years or at intervals as stipulated.
Among the objectives of the audit are as follows:
• Conducting independent and detailed evaluation of the
performance of the licensee;
• Assessingtheachievementofthelicenseeontheaspectof
engineering, finance and management of generator stations
or licensed activity;
• Ensuringthatthelicenseemeetstheconditionsofthelicence
issued by ST; and
• Recommendingimprovementsonservicesandperformance
of the licensee.
Tenaga Nasional Berhad (TNB)
Subsequent to the audit by TNB for the period 2004 to 2008,
continuous monitoring of the audit recommendations was
conducted. Apart from the submission of the monitoring report
formattoTNB,ameetingwasheldon11May,2012toupdatethe
implementation status of the recommendations.
The next audit of TNB is for the period from financial year
2009/2010 to 2011/2012. Up to 5 October, 2012, 97.8 % of the
auditrecommendationswereimplementedbyTNB.
ensuringlegal compliance (continued)
Sabah Electricity Sdn Bhd
For monitoring the audit recommendation, ST has provided
a report monitoring format and requested SESB to report
periodically. SESB had submitted the follow-up report on 6
March, 2012.
In view of the fact that several matters required further clarification
fromSESB,SThadameetingwithSESBmanagementon17May,
2012.
Based on the audit findings, SESB was required to prepare
Service Level Agreements (SLA) between SESB and SESB
ownedpowerplants.Apart from that,SESBwasalso required
to conduct special training programmes for young executives
without affecting the power stations operations, so as to enhance
their technical experience.
IPP in Peninsula
M & E Audits for the following IPPs have been implemented
since 27 October, 2011 and continued in 2012. The report of audit
findings and consultants’ recommendations were finalised on 28
August, 2012 .
AUDIT PERIOD FOR IPP STATIONS
No. IPP Station Audit Period
i PowertekBerhad Feb 2006 – Jan 2011
ii PahlawanPowerSdnBhd Feb 2006 – Jan 2011
iii PanglimaPowerSdnBhd Feb 2006 – Jan 2011
iv GentingSanyenPowerSdnBhd Jul 2005 – Jul 2010
v PortDicksonPowerSdnBhd Jan 2006 – Jun 2011
vi TeknologiTenagaPerlisPowerConsortiumSdnBhd
Apr 2005 – Apr 2010
vii YTLPowerSdnBhd Nov 2005 – Nov 2010
viii NURGenerationSdnBhd May2006–Dec2010
ix NURDistributionSdnBhd Jan2006–Dec2010
In general, the audit findings indicated that IPPs of the peninsula
operate properly and comply with the requirements of the
licences and PPAs. Suggestions for improvement from the
consultants were used as a reference to improve and enhance
future IPP performance.

95
Centralised Utility Facility (CUF), PETRONAS
TheM&EAuditonCUFwasundertakenby theconsultanton
15 October, 2012. The first draft of the report of the audit for the
period from financial year 2006/2007 to 2009/2010 was presented
to ST on 21 June, 2012.
The second draft of the report was presented to ST on 1
November, 2012, after taking into account the comments and
viewsfrom ST.
ThefinalreportwassubmittedtoSTon6December,2012.The
results and recommendations from the consultant would be
the industry benchmark of electricity generation through co-
generation .
The audit findings indicate that CUF is at a good and satisfactory
level for theaspectsofoperationsandmaintenanceof theco-
generation plant, financial management, safety practices as well
as personnel management .
kapar Energy Ventures (kEV)
KEV had already submitted the follow-up reports on 1March,
2012 as well the latest update on the follow-up report on 27
August,2012.Thesitevisiton19September,2012toKEVhad
indicated that about 20% of the consultant’s proposals were
stillintheimplementationprocess.Duringthemeeting,among
the improvements that were still in the process include the
upgradingofthefinancialsystemofMAXIMO&SUNtothelatest
version which is still in the tender stage.
In addition, KEV was still awaiting the decision from Allianz,
the insurance company, to allow them to improve the gas-air
pre-heater protection system. Apart from that, the seawater
siltfiltrationrecoverysystemworkundertakenbyKEVsuffered
somedamagesanduntilnow,KEVisstillindiscussionswiththe
supplier to repair the damage.
TNB Janamanjung
In early February 2012, ST hasmet TNB Janamanjung on the
follow up action to improve the performance of the power station.
Amongthefollowupactionstobetakenwerethepowerquality
test,workinstructionprioritised,fuelandmaterialmanagement,
workinstructionprocedures,routineislandtestingandothers.
On11,May2012,TNBJanamanjunghadpresentedthefollowup
actionstakenandon4September,2012theyhavecompletedall
theproposedfollow-upactions.
Other Generation Licensees
TheauditonSepangarBayPowerCorporationandMusteqHydro
Inc. will begin in early 2013 in which both parties have appointed
consultantstoimplementtheM&EAudit.
Meanwhile the audit terms of reference for TNB, TNB
Janamanjung, KEV and KKIP Power have been finalised and
submitted to the parties concerned.
AUDIT PERIOD FOR IPP STATION
No. IPP Station Audit Period
i MusteqHydroSdnBhd Jan2004–Dec2012
ii SepangarBayPowerCorporationSdnBhd
Dec2008–Jan2012
iii TNBJanamanjung Sept 2008 – Aug 2012
iv TenagaNasionalBerhad Sept 2008 – Aug 2012
v KKIPPowerSdnBhd Jan2008–Dec2011
vi KaparEnergyVenture Sept 2008 – Aug 2012
vii SabahEnergySdnBhd Sept 2008 – Aug 2012
viii JimahEnergyVentures Jan2009–Dec2012
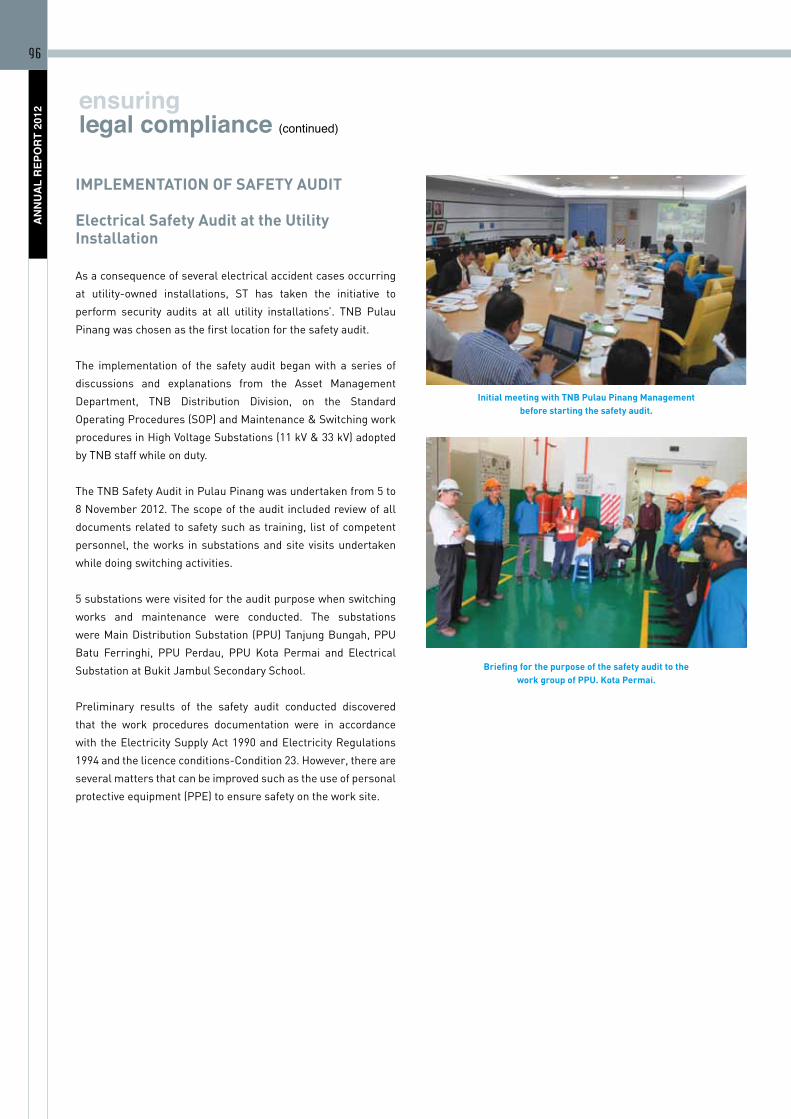
AN
NU
AL
REP
OR
T 20
1296
IMPLEMENTATION OF SAFETY AUDIT
Electrical Safety Audit at the Utility Installation
As a consequence of several electrical accident cases occurring
at utility-owned installations, ST has taken the initiative to
perform security audits at all utility installations’. TNB Pulau
Pinang was chosen as the first location for the safety audit.
The implementation of the safety audit began with a series of
discussions and explanations from the Asset Management
Department, TNB Distribution Division, on the Standard
OperatingProcedures(SOP)andMaintenance&Switchingwork
proceduresinHighVoltageSubstations(11kV&33kV)adopted
byTNBstaffwhileonduty.
TheTNBSafetyAuditinPulauPinangwasundertakenfrom5to
8 November 2012. The scope of the audit included review of all
documents related to safety such as training, list of competent
personnel, theworks insubstationsandsite visitsundertaken
while doing switching activities.
5 substations were visited for the audit purpose when switching
works and maintenance were conducted. The substations
wereMainDistributionSubstation (PPU)TanjungBungah,PPU
Batu Ferringhi, PPU Perdau, PPU Kota Permai and Electrical
SubstationatBukitJambulSecondarySchool.
Preliminary results of the safety audit conducted discovered
that the work procedures documentation were in accordance
with the Electricity Supply Act 1990 and Electricity Regulations
1994andthelicenceconditions-Condition23.However,thereare
several matters that can be improved such as the use of personal
protectiveequipment(PPE)toensuresafetyontheworksite.
ensuringlegal compliance (continued)
Initial meeting with TNB Pulau Pinang Management before starting the safety audit.
Briefing for the purpose of the safety audit to the work group of PPU. kota Permai.

97
Study on Domestic Consumers’ Level of Compliance to Electrical Regulations in 2012
The main purpose of the study was to assess fellow consumers’ level of compliance to electrical regulations, particularly in relation to
domesticelectricalwiringaswellaselectricalequipmentusage.Thestudywasconductedupon1,000domesticconsumersintheKlang
Valley,includingthosefromtraditionalvillages,residentialareaandmulti-storeyhouses.
RESULTS OF STUDY ON THE LEVEL OF COMPLIANCE TO ELECTRICAL LEGAL COMPLIANCE REQUIREMENTS
BY DOMESTIC CONSUMERS (1,000 RESPONDENT)
Among the Matters Studied Most Response Extra Response
Awareness on electricity law 62% (162 respondent) understand something on electricity law
38% respondent unsure
Awareness on appointing registered electrical contractor
74% aware of appointing non registered electrical contractor is against the law
11%unaware/knownothing
15% unsure
Method of getting services from registered electrical contractor
64%didnotknowhowtogetservicesfromregistered electrical contractors
36%know(refertoTNBportal)
Safety level of electrical installation 95% aware that their home electrical wiring is safe
5% quite sure
Situation that need re wiring 65%didnotknowofconditionsrequiringre wiring.
35%respondentsawareanddependonage&test
Respondents repairing wiring or connecting by themselves
67%awarethatactionwillbetakeniftheydoriskywiringathome
33% respondents unaware or ignorant
Enforcement on sale of electrical equipment
60%(606respondents)didnotknowthatthe
ST enforces provisions on sales of electrical
equipment
17% (174 respondent) unsure
22%(225respondent)awareandknowthatSTenforces provisions on sales of electrical equipment
Method to test Residual Current Devices
64% unsure on the easy way to test Residual CurrentDevices
36% aware and experienced in testing Residual CurrentDevices
CheckonSIRIM-STlabelonelectrical equipment
94%respondentcheckforSIRIM-STlabelbefore purchasing
6% less aware of this matter
In conclusion, the level of consumer compliance, understanding, attitudes and practices on electrical safety is moderately high and
require strategies by ST and related agencies to increase consumer awareness.

AN
NU
AL
REP
OR
T 20
1298
Gas safety audit in progress by ST officers
ensuringlegal compliance (continued)
MONITORING AND ENFORCEMENT ACTIVITIES
Inspection of Electrical Installations
To address the current issues relating to the supply of electricity and prevalent electricity theft incidents, ST had intensified enforcement
activities to ensure compliance with the laws.
ST ENFORCEMENT ACTIVITIES IN 2012
State Installation Inspection
Contractor Inspection
Inspection of Sales/Importer/ Manufacturer Premises
Total
Perlis 10 0 5 15
Kedah 34 0 19 53
Pulau Pinang 29 0 9 38
Perak 13 7 10 30
Selangor 80 5 0 85
FederalTerritoryofKualaLumpurandPutrajaya
63 2 0 65
Negeri Sembilan 28 9 3 40
Melaka 41 11 4 56
Johor 37 11 4 52
Kelantan 31 4 4 39
Terengganu 7 0 4 11
Pahang 78 17 5 100
West Coast of Sabah 70 27 11 108
East Coast of Sabah 146 17 11 174
Total 667 110 89 866
Enforcement activity of house construction under 33kV high voltage cable kubang Rawa,
Salor, kelantan
Gas Installation Inspection by ST Officers

99
Monitoring of Accredited Institutions
Monitoring of accredited institutions is implemented through
monitoring of examinations, implementation of audits at the
accredited institutions through an Institutional Level Examination
Committee chaired by ST.
24 inspections were made on ongoing competency examinations
at the accredited institutions in 2012. The monitoring was aimed
at ensuring that all competency examinations are done according
to the correct procedures as determined to ensure the quality of
the holders of the Certificate of Competency.
Monitoring cable man competency examination
Monitoring charge man competency examination
A total of 11 audits on accredited institutions had been conducted
in 2012. The audit was aimed at ensuring that institutions comply
with all the terms of accreditation such as learning facilities,
students intake, adequate number of competent teachers and
otherconditionsthathavebeenmadeknowntotheinstitutions
from time to time.
Audited institutions were given reprimands and advice to upgrade
the facilities available in their respective institutions.
Through the Institutional Level Examination Committee chaired
by ST, the emerging issues pertaining to accreditation activities
and competency examinations were discussed. The committee
was responsible for ensuring that all accredited institutions
always comply with the accreditation conditions .
In addition, ST held 4 seminars, briefings and dialogues
throughout 2012. These were aimed as enhancing the teaching
staff understanding on policies, procedures and implementation
of the learning activities as prescribed by ST officials.
Inspection of a motor starter by ST Officers
A briefing on a generator set to ST officer by the teaching staff of the institution
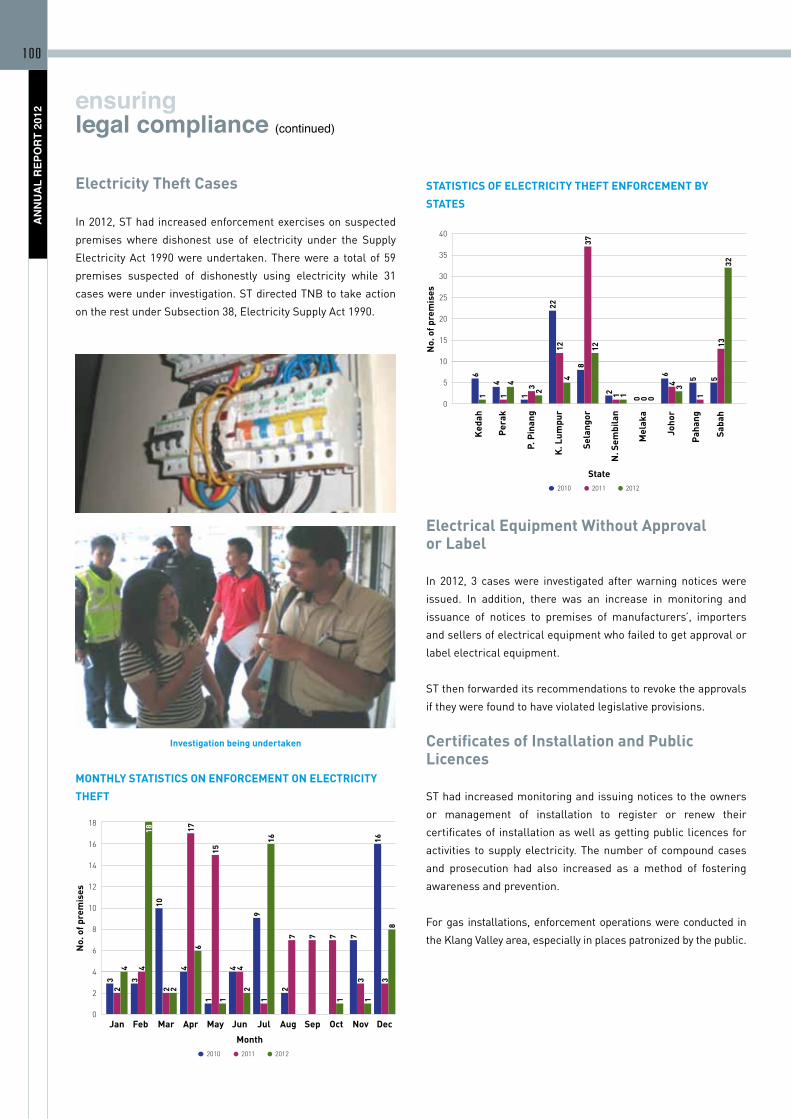
AN
NU
AL
REP
OR
T 20
12100
Electricity Theft Cases
In 2012, ST had increased enforcement exercises on suspected
premises where dishonest use of electricity under the Supply
ElectricityAct1990wereundertaken.Therewerea totalof 59
premises suspected of dishonestly using electricity while 31
caseswereunderinvestigation.STdirectedTNBtotakeaction
on the rest under Subsection 38, Electricity Supply Act 1990.
Investigation being undertaken
MONTHLY STATISTICS ON ENFORCEMENT ON ELECTRICITY
THEFT
Jan Feb Mar Apr May Jun Jul Aug Sep Oct Nov Dec
18
16
14
12
10
8
6
4
2
0
3
4 418 17
15
16 16
10
4
6
4 4
9
2 2 2
1 1 1 1 1
2 27 7 7 7
8
33 3
2010 2011 2012
Month
No.
of p
rem
ises
ensuringlegal compliance (continued)
STATISTICS OF ELECTRICITY THEFT ENFORCEMENT BY
STATES
ked
ah
Per
ak
P. P
inan
g
k. L
umpu
r
Sela
ngor
N. S
embi
lan
Joho
r
Pah
ang
Saba
h
Mel
aka
40
35
30
25
20
15
10
5
0
61
1222
4
13 2 12 1
378
12
00 0
3
64
15 5
1332
144
2010 2011 2012
State
No.
of p
rem
ises
Electrical Equipment without Approvalor Label
In 2012, 3 cases were investigated after warning notices were
issued. In addition, there was an increase in monitoring and
issuance of notices to premises of manufacturers’, importers
and sellers of electrical equipment who failed to get approval or
label electrical equipment.
STthenforwardeditsrecommendationstorevoketheapprovals
if they were found to have violated legislative provisions.
Certificates of Installation and Public Licences
ST had increased monitoring and issuing notices to the owners
or management of installation to register or renew their
certificates of installation as well as getting public licences for
activities to supply electricity. The number of compound cases
and prosecution had also increased as a method of fostering
awareness and prevention.
For gas installations, enforcement operations were conducted in
theKlangValleyarea,especiallyinplacespatronizedbythepublic.

101
INVESTIGATION AND PROSECUTION
Investigation
In 2012, ST had investigated 71 new cases of offences under the
Electricity Supply Act 1990, Electricity Regulation Act 1994, Gas
Supply Act 1993 and Gas Supply Regulations 1997.
INVESTIGATED CASES IN 2012
Pah
ang
Mel
aka
ked
ah
kel
anta
n
Joho
r
N. S
embi
lan
k. k
inab
alu
Sand
akan
P. P
inan
g
Per
ak
k. L
umpu
r
Sela
ngor
1816141210
86420
2 2
12
34
9
3 3 3
7
5
18
Num
ber
of c
ase
State
ST’s target was to shorten the investigation period of the cases
and improve the quality of investigations. ST conducts audits to
achieve the targets from time to time.
For high profile cases, ST had established a special committee to
ensurethatthe investigationscanbe implementedquicklyand
efficiently.
BREAkDOwN OF INVESTIGATED CASES IN 2012
3%
40%
55%
1%
1%
Electrical Accident Case
Installation
Electrical Equipment
Dishonest Use of Electricity
Electricity Supply Interruptions
Prosecution
In 2012, 6 investigated cases were registered in court and 3
persons involved (Persons Charged) were penalised for offences
committed by the company. The total fines imposed by the court
was RM71,000.00. The Companies punished were as follows:
• BehIceEnterprise.
• BrightRimsManufacturingSdnBhd.
• Gen-ColorTechnologySdnBhd.
Compounding
In 2012, 37 compounds were issued by ST amounting to
RM60,500.00 and the entire compound were paid to the ST.
Almost half of the compounds issued by ST involved offences by
contractors.
COMPOUNDS IN 2012
49%
8%
11%
19%
11%
Contractor
Individual
Equipment
TNB
SESB

102

103
Protecting Consumers’ Interests ST always ensures that consumers’ interests are protected.
Among the initiatives that have been and are being established
include enforcement of Performance Standards of Tenaga
NasionalBerhad(TNB)ElectricityServices,effectivelyhandling
customer complaints and improving community awareness
about energy consumption through the mass media, dialogues,
seminars and publications.
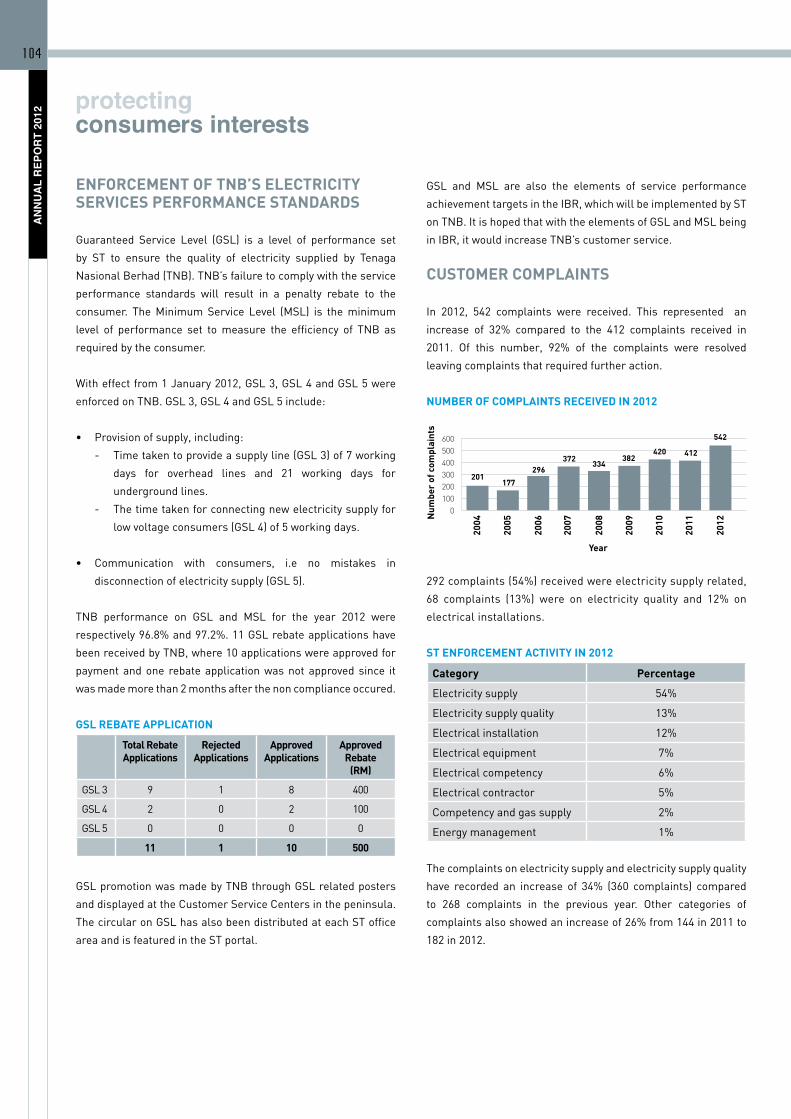
AN
NU
AL
REP
OR
T 20
12104
GSL and MSL are also the elements of service performance
achievementtargetsintheIBR,whichwillbeimplementedbyST
onTNB.ItishopedthatwiththeelementsofGSLandMSLbeing
inIBR,itwouldincreaseTNB’scustomerservice.
CUSTOMER COMPLAINTS
In 2012, 542 complaints were received. This represented an
increase of 32% compared to the 412 complaints received in
2011. Of this number, 92% of the complaints were resolved
leaving complaints that required further action.
NUMBER OF COMPLAINTS RECEIVED IN 2012
2006
2004
2008
2007
2005
2009
2010
2011
2012
600500400300200100
0
201177
296372
334382
420 412
542
Year
Num
ber
of c
ompl
aint
s
292 complaints (54%) received were electricity supply related,
68 complaints (13%) were on electricity quality and 12% on
electrical installations.
ST ENFORCEMENT ACTIVITY IN 2012
Category Percentage
Electricity supply 54%
Electricity supply quality 13%
Electrical installation 12%
Electrical equipment 7%
Electrical competency 6%
Electrical contractor 5%
Competency and gas supply 2%
Energy management 1%
The complaints on electricity supply and electricity supply quality
have recorded an increase of 34% (360 complaints) compared
to 268 complaints in the previous year. Other categories of
complaints also showed an increase of 26% from 144 in 2011 to
182 in 2012.
ENFORCEMENT OF TNB’S ELECTRICITY SERVICES PERFORMANCE STANDARDS
Guaranteed Service Level (GSL) is a level of performance set
by ST to ensure the quality of electricity supplied by Tenaga
NasionalBerhad(TNB).TNB’sfailuretocomplywiththeservice
performance standards will result in a penalty rebate to the
consumer. The Minimum Service Level (MSL) is the minimum
level of performance set tomeasure the efficiency of TNB as
required by the consumer.
With effect from 1 January 2012, GSL 3, GSL 4 and GSL 5 were
enforcedonTNB.GSL3,GSL4andGSL5include:
• Provisionofsupply,including:
- Timetakentoprovideasupplyline(GSL3)of7working
days for overhead lines and 21 working days for
underground lines.
- Thetimetakenforconnectingnewelectricitysupplyfor
lowvoltageconsumers(GSL4)of5workingdays.
• Communication with consumers, i.e no mistakes in
disconnection of electricity supply (GSL 5).
TNB performance on GSL and MSL for the year 2012 were
respectively 96.8% and 97.2%. 11 GSL rebate applications have
beenreceivedbyTNB,where10applicationswereapprovedfor
payment and one rebate application was not approved since it
was made more than 2 months after the non compliance occured.
GSL REBATE APPLICATION
Total Rebate Applications
Rejected Applications
Approved Applications
Approved Rebate
(RM)
GSL 3 9 1 8 400
GSL 4 2 0 2 100
GSL 5 0 0 0 0
11 1 10 500
GSLpromotionwasmadebyTNBthroughGSLrelatedposters
and displayed at the Customer Service Centers in the peninsula.
The circular on GSL has also been distributed at each ST office
area and is featured in the ST portal.
protectingconsumers interests

105
COMPLAINTS ON SUPPLY, QUALITY OF ELECTRICITY SUPPLY
AND OTHER CATEGORIES (2008–2012)
2008 2009 2010 2011 2012
400350300250200150100
500
312346 334
268
360
182
14486
3622
Supply and Quality of Electricity Supply Others
Year
Num
ber
of c
ompl
aint
s
Therearethreesub-categoriesonthecomplaintsonElectricity
Supply namely billing, supply interruptions, meter tampering,
public lighting and consumer affairs, transmission lines rentice,
dangerous wiring/installation, supply connection, licensing and
electricity prices.
Meter Reading and Replacement Issue
142 (33%) billing complaints which were recorded was the
highest in the subcategories. This was followed by the issue of
consumer dissatisfaction with TNB bimonthly meter reading
system which often created confusion among consumers. In
addition, it was driven by the programme to replace old meters,
which were said to be the cause of dramatically rising bills after
the change of meters .
TNBhastakenstepstostopthereplacementofoldmeterssince
the middle of October 2012 except for cases of defective meters
and tampering of meters. In addition, estimated bill readings
(e-billposted)werestoppedinstagesfromNovember2012.TNB
followed up by updating the new Standard Operating Procedure
(SOP) and encouraging a more comprehensive and responsive
communications plan while providing transparent and friendly
services to the consumers.
Until 31 December, 2012, 498 or 92% of the complaints were
successfully attended to and 44 complaints or 8% were still in the
processofactionbeing takenand investigationby therelevant
officers.
PROMOTING COMMUNITY AwARENESS
Display in Mass Media
Duringtheyear2012,STactivelycontinuedinspreadingnews
and information through Radio Television Malaysia (RTM) and
Media Prima station network including local print media.
Among thetopics or news angle emphasised were:
• Energy-efficientmethodsandpractices.
• Dishonestuseofelectricity.
• SalesofelectricalequipmentwithoutST-SIRIMlabel.
• Installationsthatwerenotregistered.
• Contractorswhowerenotregistered.
• Failure in appointing Competent Personnel by the
contractors.
• MeterInspection.
• Pipedgasinspection.
• EncroachmentofTNBoverheadlinerentice.
ST disseminated information through the print and electronic
media and internet through Paid Advertorials, Exclusive Editorials
and appearance in forums such as ‘Selamat Pagi 1Malaysia’ on
TV1,TV3’s‘MalaysiaHariIni’and‘NasiLemakKopiO’onTV9.
Director of Regulatory Electrical Safety being interviewedin Selamat Pagi 1Malaysia
ST also received several media coverage in its operations to reduce
theft of electricity and the issue electrical equipment without
ST-SIRIM labels through ‘999 plan‘ of TV3. In addition to the
enforcement aspects, features about the ST’sDiamondBuilding
were also featured in several local print media.

AN
NU
AL
REP
OR
T 20
12106
ST, with the Ministry of Energy, Green Technology and Water
(KeTTHA)andtheNationalWaterServicesCommission(SPAN)
had launched a media campaign “Save Water, Save Energy“
from September 2012 to November 2012.
Extensive media monitoring was done daily so that the news,
issues and complaints regarding the local energy industry can be
dealt with appropriately.
Dialogue Between ST and TNB
The dialogue between ST and TNB is an annual event held to
discuss issues of electricity supply in Peninsular Malaysia. The
dialogueisnotonlyheldatthehighestleveloftheSTandTNB
butincludesthosebetweenSTregionalofficesandstateTNBs.
In 2012, the dialogue between ST and TNB at the corporate
level was held on 25 September, 2012. Besides discussing
issues of electricity supply, the latest developments related to
the electricity supply industry were also discussed. Among the
matters discussed in the dialogue were:
• BoundryManagementGuidelinesandMaintenanceofElectrical
Installations and Piped Gas Systems approved for use;
• Reviewofincentivesforhighpowerfactor;
• TheissueofHorizontalDirectionalDrilling(HDD);
• Chargesforreconnectionofelectricitysupply;
• Bimonthlymeterreading;
• Conversionofelectricmeters;
• Testingofelectricitymeters;
• EnforcementoftheGSLandMSL;
• Substationlandarea;
• SAIDIimprovementinseveralstates;
• Registrationofacompetentpersonnel;
• SafetyAudits;
• Electricalaccidentcases;
• Chargemencompetencycertificates;
• Overvoltageincidents;
• Harmonicpollutionandvoltagedips;
• TheneedtorestructureTNBgeneration;
• BulkSupplyTariff;
• Thecurrentstatusofcompetencyprogrammesconductedby
ILSAS;
• Wayleaveissues;and
• Encroachmentissues.
Industry Bulletin Publication
For thefirst timeSTpublished theBULLETINSTonJuneand
followedupwithasecondissueonDecember2012.Thisenergy
industrymagazinefocusesonkey initiativesandtheST’smain
programmes that have been and are being implemented to
improve efficiency, security and transparency in the energy
sector of Malaysia. In addition, it is a platform for industry players
to submit ideas and suggestions for improvement on the duties
and roles of the ST as a regulatory body.
The first issue of Bulletin ST,released in June 2012
The second issue of Bulletin ST,released in December 2012
Apart from being distributed to Government agencies, industry
playersandnon-governmentalorganisations(NGOs),theywere
also distributed to foreign embassies, public universities and
private training institutions.
Organising Seminars, workshops and Dialogues
Throughout 2012, ST was committed to the conducting of
seminars,workshopsanddialoguesonelectricitysafety to the
public, industry and school students.
A total of 107 seminars and 63 dialogues were organised
throughout 2012 in collaboration with other agencies such as
TNB, Sabah Electricity Sdn Bhd (SESB), Ministry of Domestic
Trade, Cooperatives and Consumerism (Ministry), SIRIM, NGOs
and Local Authority Councils.
protectingconsumers interests (continued)

107
SEMINARS, wORkSHOPS AND DIALOGUES IN STATES
ked
ah
Per
ak
P. P
inan
g
k. L
umpu
r
Sela
ngor
N. S
embi
lan
Joho
r
Pah
ang
Saba
h
Mel
aka
30
25
20
15
10
5
0
2010 2011 2012
61
1222
4
13 2 1 12
00 0
3
64
15
144
No.
of S
emin
ars,
wor
ksho
ps a
nd D
ialo
gues
State
00 0 00 0
As a result of organising such programmes, the electrical
accident cases recorded a decline especially among school
students, institutions of higher education and construction sites.
Domesticaccidentscaseshavealsoshownareductionfrom16
cases in 2011 to 6 cases in 2012.
Executive Talk: Risk Management in the Power Sector
An Executive Talk Programme titled ‘RiskManagement in the
Power Sector’ was held on 7 May, 2012. The program was funded
by theElectricitySupply IndustryTrustAccount (AAIBE)where
itwasaninitiativeofMEGTWtoincreaseknowledge,skillsand
industry professionalism in the industry in performing the duties
and responsibilities in the field of energy.
The main objective of organising the talks was to improve
exposure of participants in risk management developments
and operation of electricity power generation projects. The
programme was participated by nearly 100 participants from
amongtheenergyindustrystakeholdersincludingthetechnical
and asset management of companies and electricity suppliers,
policymakersandmembersoftheMESITA.
Seminar Co-organised with Local Agency
During 2012, ST had been harnessing the efforts of several
agencies, industry representatives, educational institutions and
non-governmental organisations (NGOs) to organise seminars
and conferences or participated in exhibitions. Among the
seminars organised with other organisations were:
• APEC Energy Working Group on 13 January, 2012 jointly
organisedwithKeTTHA.
• National Energy Security Conference 2012: “Closing the
Energy Supply-Demand Gap“ on 28 February, 2012 jointly
organisedwithKeTTHAandIEPRe,UNITEN.
• InternationalConstructionWeekon14-17February2012by
CIDB.
A Day with Consumers Programme
In an effort to increase public awareness towards the role of ST in
aspects such as efficient energy consumption as well as supply
ofsafeelectricityandpipedgas,aDaywithConsumersprogram
(DCP)washeldinSabah,Johor,PerakandPahang.
Venue Date
CempakaSariHall,Ipoh,Perak 5 July 2012
JubliIntanHall,Kluang,Johor 12 July 2012
Library Auditorium, Tawau, Sabah 13 September 2012
MahkotaTradeComplex,InderaMahkota,Kuantan,Pahang
27 September 2012
In addition to the dissemination of information, this programme
also had counter services to provide relevant advice on issues
facedbythecustomers.DWCalsogotcooperationfromvarious
groups, including TNB, SESB, Fire and Rescue Services,
DepartmentofHealthandPusatGiatMara.The targetgroups
were the public and students.
‘A Day with Customers’ programme with the visitors at kluang, Johor.

108

109
DevelopingaRobustRegulatory FrameworkSTstrivestoensurethatallregulatoryactivitiesundertakenare
basedonasolid framework.Among the initiativesundertaken
includeTPASystemtoNaturalGas,Incentive-BasedRegulation
(IBR)forfixingthetariffinPeninsularMalaysia,thefuelcostpass
through mechanism development, designation of Applicable
Coal Price (ACP), preparation of guidelines and circulars as well
as the harmonisation of regional standards.

AN
NU
AL
REP
OR
T 20
12110
developing a robust regulatory framework
IMPLEMENTATION OF THIRD PARTY ACCESS (TPA) SYSTEM
Currently, the Gas Supply Act 1993 (Act 501 ) is used on natural
gas supply activities in the distribution sector downstream of
the city gate station to consumers. The economic aspects in
the upstream natural gas supply activities from the production
platform to the city gate station is under the jurisdiction of
PETRONAS in accordance to the provisions of the Petroleum
DevelopmentAct1974(notincludingsecurityaspects).
This year, the quantity of natural gas in Peninsular Malaysia
regulated by ST through the Gas Supply Act 1993 was 380 million
cubic feet per day, comprising 18% of the total overall gas supply
in the peninsula compared to 70 million cubic feet per day in 2002,
while the quantity of gas regulated by PETRONAS through the
PetroleumDevelopmentAct1974 is farhigherat1,750million
cubic feet per day or 82% of total gas supply in the peninsula.
Basedon theEconomicTransformationProgram (Oil,Gasand
Energy Sector), an additional gas supply of 1,230 million cubic
feet per day was expected to be required in Peninsular Malaysia
in 2020 as shown in the following diagram. The additional gas
supply is to meet the growing gas demand besides the decline in
gas production from domestic gas fields.
DEMAND AND SUPPLY OF GAS IN PENINSULAR MALAYSIA
2010 2015 2020 2025
3
2
1
0
New Industry
Fuel Switching
Consumption2
Domestic Gas Supply1bc
f/da
y
The regional gas supply is not able to support additional consumption.
A
B
C
Approx. 270 mmscfd3 in 2020 of unrealised industrial activity (glass, plastic, etc) due to unavailability of gas, but able to pay liberalised, unsubsidised market prices.
Approx. 260 mmscfd3 in 2020 equivalent of diesel being used as industrial fuel; switching to natural gas at liberalised, unsubsidised price makes economic sense (assumes 50% switching factor).
Approx. 700 mmscfd in 2020 supply-demand deficit.
1. Includes JDA and Indonesia.2. Growth is based on 2001 - 2010 gas consumption from power at 1.5%.3. Growth rate of 6% assumed on the 2010 volume based on historical GDP growth. In 2010, demand from new industries and fuel switching is 150 and 180 mmscfd respectively.
A
B
C
Duetothedeclineingasproductionfromthedomesticgasfields
and constraints in increasing imported gas through the pipeline,
one of the alternatives to meet the gas shortage was to bring
inLNG fromSarawakor importedLNG from foreigncountries
through the RGT. In line with this, the Government, through
PETRONAS,will develop the facility in Sungai Udang,Melaka;
LahadDatu,SabahandPengerang,Johor.
TPA System Concept
DefinitionofTPAisasfollows:
“A party other than the asset owner/operator gaining
access to and using the excess capacity in the natural
monopoly infrastructure of the asset owner”.
TPA system allows entities other than PETRONAS to
bring in LNG using RGT and channel the gas through the
transmission pipeline system or online distribution pipeline
system for supplying gas to the users’ premises. This would
create competition among gas suppliers, thus promoting
growth of the country’s gas industry. Among the factors
that contribute to the success of the implementation of the
TPA concept is the creation of a conducive, transparent and
fair gas industry environment. The TPA concept is in line
withtheGovernment’seffortstocreateanopengasmarket
which is expected to be implemented in the peninsula when
thepriceofdomesticgasachievesmarketprices.
In ensuring that the gas market is administered
transparently and fairly, ST has been recommended to
implement regulatory activities related to the competitive
gasmarket.
Measures Taken toImplement TPA System
i. Gas Supply Act Amendments (GSA), 1993
Basedontheanalysisconducted,theexistingGasSupplyAct
1993 needs to be amended to allow TPA system for the RGT,
the transmission and distribution system to be implemented
and monitored by ST.

111
From the safety aspect, ST is responsible for regulating
downstream activities from the city gate station while upstream
activities are still regulated by the Occupational Safety and
HealthDepartmentundertheprovisionsoftheFactoriesand
Machinery Act 1967 and the Petroluem (Safety Measures) Act
1984.
In the process of preparing the proposed amendments to the
Gas Supply Act 1993, ST held a series of consultations with the
stakeholders in the gas industry including related agencies/
bodies, the gas facilities operator, gas suppliers and major gas
consumersintheenergyandnon-energysectors.
Overall, based on the feedback given, the Government’s
decision to implement the TPA system for the gas facilities
which include RGT, the gas transmission and distribution
system was supported as it was a good step to develop the
country’s gas industry.
The proposed draft amendments to the Gas Supply Act 1993
were submitted to the Economic Planning Unit to be finalised
and tabled in the Parliament in 2013.
ii. Development of the Code, Guidelines and the Tariff Structure
for TPA
In accordance with the provisions of the proposed amendments,
ST is empowered to provide the codes, guidelines and
instructions for carrying out the provisions contained in the Act,
includingMalaysia’sgasmarketcompetitionaspectsandthird
parties access system for the supply of natural gas systems in
Peninsular Malaysia and Sabah .
Withregardstotheabove,ArthurD.Little,astheleadconsultant
withSkrine&BakerBottshavebeenappointed for12weeks to
achieve the identified deliverables as follows :
• Development of the Competition Guidelines for
Malaysiangasmarketinaccordancewiththeprovisions
of the proposed amendments to GSA 1993.
• DevelopmentofTPACodeforRGT,andgastransmission
and distribution.
• DevelopmentofthetariffstructurefortheuseofRGT
infrastructure, and the gas delivery and distribution
systems.
The Competition Guidelines and TPA Code draft for the gas
transmission and distribution were circulated to the interested
parties(stakeholders)forgettingfeedbackbeforethedocuments
were finalised.
Meanwhile, the tariff structure for the use of RGT, the gas
transmission and gas distribution systems infrastructure is still
in progress and is expected to be completed in early 2013.
ii (a). Competition Guidelines for the Malaysian Gas Market
The preparation of the Competition Guidelines for the
MalaysianGasMarketaimsto:
• Provide more detailed definitions and explanations of
provisions relating to competition found in the GSA 1993
proposed amendments.
• Ensuringalevelplayingfieldamongindustryplayers.
• Increasingtheconfidenceofnewindustryplayersinthe
Malaysiagasmarket.
• Reducinguncertaintiesinthegasmarketlaws.
• Increasingtransparencyintheenforcementcarriedout
by the regulatory officers.
The Competition Guidelines document was developed
based on the following methodology:
•ReferencetotheMalaysianCompetitionAct2010.
• Referrence to the Competition Guidelines provided by
the Malaysian Competition Commission.
• Reference to the GSA 1993 proposed amendments
especiallyPartVI(A)-GeneralCompetitionPractices.
• Studyontheuniquefeaturesofthecurrentgasindustry
structure.
• Providingabenchmarkfortheprovisionofcompetition
being implemented in other countries to ensure that
bestimplementationmeasuresareundertaken.

AN
NU
AL
REP
OR
T 20
12112
IMPORTANT ITEMS IN THE COMPETITION GUIDELINES
Chapter Topic Summary
A MarketandRelevantMarket
• Themarket and relevantmarket concept is introduced to identify parties thatcompeteinthesamemarket,assesstheagreementwhichhaveanti-competitiveeffectsandassessmarketpoweraswellasthedominantpartiesinvolved.
•Themethodfordeterminingtherelevantmarket,namelyHypotheticalMonopolistTest(HMT)andSmallButSignificantIncreaseInPrice(SSNIP)isdescribedintheguidelines.
B Anti-CompetitiveAgreement
•Section12CoftheamendmenttoGSA1993draftprohibitsanyagreements(verticalandhorizontalagreement)withtheobjectiveoreffectofwhichcansignificantlyprevent or restrict competition.
•Thedefinitionoftheagreementintheguidelinesisbroad,andcanincludewrittenand oral agreements and attendance at meetings to discuss a decision.
• Themarket share of the party thatmade the agreement serves as a guide todetermine whether an agreement has the objective or significant effect.
•ProposedSafeHarbourThresholdsislessthan20%ofthetotalmarketshareforthesamerelevantmarketandlessthan25%ofthemarketshareforeachoftherelevantmarketsinvolved.
•Amongtheagreementthatcanbecategorisedasanti-competitiveisfixingprices,sharingmarkets,restrictingoutputandfalsifyingbids.
•Provisionforliabilityreliefmaybegrantedinaccordancewithsection12DoftheGSA 1993 amendment draft which includes exemptions for individuals or groups.
C AbuseofDominantPosition • Section12Gof theamendment toGSA1993draftprohibitsanenterprise frombeing involved in the act/behavior and abuse of dominant position.
•Measuresto investigatewhetheranenterprisehasabusedadominantpositionare as follows:-Identify relevantmarketsinvolved.- Determine whether the enterprise is in a dominant position in the relevant
identifiedmarkets.Amongthemethodsofdeterminationisbasedonthemarketshare.Ifthemarketshareismorethan60%,thecompanyisdominant.Ifthemarketshareislessthan40%,theprobabilityforthecompanytobedominantis low.
-Determinewhethertheabuseofdominantpositionhasbeendoneandamongthe acts categorised as abuse are price discrimination, exclusive business dealing,predatoryaction,refusaltosupply,squeezingprofitandbondingandmerging.
•Theguidelinesalsolistthejustificationsthatallowabusiveactioninaccordancewith Section 12G (3).
developing a robust regulatory framework (continued)

113
Recommended Malaysian TPA Regime
Third PartyAccess Code
Level 1:• PreparedbyST• InclusionofTPAprinciples• ApprovedbytheMinister
AccessArrangement
Level 2:• ProvidedbySystemOperator(SO)• ApprovedbyST• Providedetailsonprocedures,relevanttermsandconditionson
the use of respective infrastructure
Facility AccessAgreement
Gas ConnectionAgreement
Level 3:• AgreedbetweenShipperandSystemOperator• Providedetailedinformationonoperationandworklevel• STabletoreviewthedocumentifrequired
Documentation Structure for TPA System
Infrastructure Regasification Terminal Transmission System DistributionSystem
TPA Code Regasification Code Transmission Code DistributionCode
Access Arrangement DevelopmentbyRegasificationTerminal Operator DevelopedbyTransporter DevelopedbyDistributor
Facility Access Agreement Regasification Agreement (RGTA)
Gas Transmission Agreement (GTA)
GasDistributionAgreement(GDA)
Gas Connection AgreementGas Connection Agreement signed between various connected parties. (e.g.betweenTransporterandDistributor,TransporterandEnd-user,
Transporter and Terminal Operator,etc.)
ii (b). TPA Code for the Gas Transmission and
Distribution System in Malaysia
The objective of the TPA Code is to provide a regulatory
frameworkfor:
• Promoting the development of competitive gas
marketwiththedevelopmentofsimilarprinciplesfor
the operators and users of the gas transmission and
distribution system;
• Ensuring transparency, fairness and non-
discrimination in the use of the system;
• Preventing abuse of dominant position and anti-
competitive acts; and
• Ensuringasafeandreliablegassupply.
The TPA Code was developed based on the following
methodology:
• ReferencetotheproposeddraftoftheamendedGSA
1993.
• Reference to the Network Code for Peninsular Gas
Utilisation Transmission System document published
byPETRONASGasBerhadinDecember2011.
• Provision of benchmarks in relation to TPA system
being implemented in other countries to ensure best
operating practices.
The following diagram shows the proposed TPA system where it
consists of 3 levels:
(Level 1) TPA Code, (Level 2) Access Arrangement
dan(Level3)Party-to-PartyOperationalAgreements:

AN
NU
AL
REP
OR
T 20
12114
Among the important characteristics in the TPA Code are as follows:
Principle Description
Capacity Allocation Mechanism
• Basedonthefirst-come-first-servedbasis.• Fixedcapacitywithaminimumbookingof12monthsperiod.• STcanissuedirectivestoamendtheminimumbookingperiod.
Constraints Management • InterruptibleCapacitywithminimumbookingperiodof12months.• Allocationbasedonuse-it-or-lose-itprinciple.• Allowableswitchingofspecialfixedcapacity.Transferofallocatedfixedcapacityisallowed.• Rentalofcapacityisnotallowed.• Shippermaybuildnewfacilityasadditiontotheexistingsystemwiththepermissionfromthesystem
operator (SO). The facility has to be transferred to the SO.• OpenSeasonprocedure-SOneedstoimplementOpenSeasoniftherearephysicalconstraintsor
every 5 years.
Metering • SOshouldprepareMeteringPhilosophies.• SOshouldmeasurethegasquantityatallentryandexitpoints.• SOshouldmeasuregasqualityatallpointsofentrybutneednotmeasurethegasqualityatallexit
point.• SOtoensurereliabilityandaccuracyofthegasqualitymeasurementsobtained.
GasQuality • GasqualityspecificationsneedtobeclarifiedintheAccessArrangement.• ProvisionforhandlingOff-SpecificationGas.
BalancingMechanism • IsacriticalelementintheTPAsystem.• Linepackhas tobeownedby theSOandSO is responsible tomanageand implement linepack balancing on the gas transmission/distribution system.• SOcangetbackthecostofgasusedtostartthepreparationofthelinepackthroughtheapplicable
tariff.
Internal Gas Consumption (IGC)
• SOmanagesIGCtoensureareliableandsafegassupply.• ThegascostforIGCmaybeincludedaspartofthetariffcalculation.
Penalty and Surcharge • Shippermustensurethatthegasquantityattheentryandexitpointisequal(balanced).• SOwillimposesurchargesandpenaltiesiftheshipperfailstorebalancetheirgasportfolios.• Thereare3typesofsurchargesimposed: - Imbalance - Variance - Overrun
Maintenance • SOisresponsibleforpreparationofaplanforscheduledmaintenance.• SOcanperformunscheduledmaintenanceifmaintenanceisrequiredforensuringtheintegrityand security of the system.
GasTransportDay • NominationandIntra-dayprocedure.
GasQuantityAllocation • Calculationformulaforgasquantityallocationtobedistributedattheentryandexitpointswhereonemeter can be shared by more than one Shipper.
Others • Relatedtocommunicationsandconfidentiality,liabilityanddamagesaswellasdisputeresolutionprocess.
developing a robust regulatory framework (continued)

115
Current Status and way Forward
TheCompetitionGuidelinesfortheMalaysiannaturalgasmarket
has been distributed to interested parties on November 2, 2012.
Subsequently, the Malaysian Competition Commission (MyCC)
has expressed their agreement to the guidelines, while TNB,
PETRONAS,PGBandMyPowerhavesubmittedtheirrespective
comments and suggestions for the reference of the ST. The
guidelines have also been presented and approved at the ST Top
Management meeting on November 7, 2012. Subsequently, on
December 7, 2012 an internal briefingwas held to expose ST
employees to the contents and concepts in the guidelines.
FortheTPACodes,aseriesofdiscussionswereheldwithPGB
andGMBas the infrastructure owner of the gas transmission
and distribution systems in Malaysia before the briefing on the
codetointerestedpartiesonDecember12,2012.Followingthat,
the draft codes have been distributed to interested parties on
December19,2012togettheirfeedback.
The feedback received will be reviewed before the codes are
finalised and submitted to the Prime Minister for approval.
However, the approval from the Honourable Prime Minister will
only be applied after the Gas Supply Act (Amendment) 1993 is
approvedandgazetted.
In addition, in the effort to enhance the ability of the ST in
regulating the TPA system, a series of visits were held in 2012
as follows:
8-9 March 2012:
Technical visit to the LNG Regasification Terminal at Sungai
Udang,Melakatolookattheprogressoftheprojectdeveloped
byPETRONASGasBerhad.

AN
NU
AL
REP
OR
T 20
12116
2-4 October 2012:
TechnicalvisittothePetronasLNGComplexinBintulu,Sarawak
to study the LNG production process.
IMPLEMENTATION OF INCENTIVE- BASED REGULATION (IBR) FOR ELECTRICITY TARIFF IN PENINSULAR MALAYSIA
In 2012, ST actively conducted a trial-run to implement the
revisedtariffinPeninsularMalaysiabasedontheIBRframework
for the financial year of 2013 till 2014. The implementation of the
IBRtrial-runwasinitiatedwiththefollowingactions:
• Issuance of the Final Rule Implementation Guidelines
(Electricity Regulatory Implementation Guidelines-RIGs)
onFebruary13,2012toTNBforthepreparationoftheIBR
framework.
• Finalising the principle of fuel cost relief mechanism
(Imbalance Cost Pass-Through-ICPT) and TNB Key
Performance Indicator (KPI) under IBR regime with
stakeholders through a consultation session held in June
2012.
• Obtaining approval of the Minister of Energy, Green
Technology and Water on the of fuel cost pass through review
ofthefirsthalfyear(Dec2011-May2012)asaresultofICPT
negotiation and arrangement process being implemented.
• Finalising the proposed TNB Key Performance Indicators
based on the Regulatory Implementation Guideline No. 6 for
TNB‘stransmissionanddistributionbusinessentity.
TNBhasalsosubmitted itsfirstrevisedproposalonelectricity
tariffrevisionbasedonIBRrequirementsonNovember30,2012
through‘TNB-IBRandTariffReviewSubmissionFY2014-FY2017‘
prepared in accordance with the RIGs guidelines.
If the result of revised electricity tariff trial-run based on IBR
resolution is well received by consumers and the Government,
the period from September 2013 to August 2014 can be the period
to improve the process for IBR full implementation beginning
in September 2014 till the end of August 2017 or any date as
determined by the Government.
The IBR concept will be the pioneer of a new change in the
review and determination of electricity tariff where only efficient
costs will be included in the proposed revisions of the electricity
tariff. At the same time, a reasonable rate of return will be
given to the utility to incentivise their performance. It will also
strenghtentransparency in theGovernment’sdecisionmaking,
the formulation of the mechanism and provide clear guidance to
utilities. This also indirectly guides the consumers and for the
Government to inform of any tariff adjustments made from time
to time.
DEVELOPMENT OF FUEL COSTS PASS- THROUGH (FCPT) MECHANISM
In principle, the Government has approved the principle for the
adjusted fuel cost pass through mechanism to consumers to
be done every 6 months. With regards to this, ST has initiated
arrangements for determing the cost of fuel from December
2011 to May 2012, for the review of electricity tariffs for the
period from 1 June 2011 to 30 November 2012.This initiative is
among the steps taken towards implementing the IBR, which
has been agreed upon by the Government on October 18, 2011
as the new tariff fixing policy in Peninsular Malaysia. One of the
components in the IBR implementation is the implementation
developing a robust regulatory framework (continued)

117
of the Imbalance Cost Pass-Through mechanism, which
determines principles and the formula to calculate actual fuel
costforelectricitygenerationwhichisbeyondTNB’scontrolthat
needtopass-throughtoconsumersthroughtheelectricitytariff.
This estimate was made by using the assumption of an increase
in gas prices ofRM3/mmBtu every 6months according to the
subsidy rationalisation plan and also taking into account the
increaseofcoalpricefortheentireperiodofDecember2011to
May2012.Inmakingthisrevision,SThasmadeanin-depthstudy
into the fuelcostpass throughcalculation, taking intoaccount
only efficient costs of electricity generation. The study included:
• Least-costdispatchschedulingintheGridCodeforelectricity
generation so that only efficient costs will be considered for
fuel cost pass through;
• Heat rate performance recorded by each power station,
especiallyTNB’sstations;
• Actual gas volume used for each gas based generation
station;
• Quantityandpriceofcoalusedforeachcoalbasedgeneration
station; and
• Calculationtobebasedonapredeterminedformulainthe
IBRguidelines.
IMPLEMENTATION OF APPLICABLE COAL PRICE (ACP) MECHANISM
The year 2012 witnessed the scenario of a decline in the world
coal price due to abundance of supply compared to demand.
Specifically, there were no high demands from the Asia major
coal buyers China and India, where the countries’ domestic coal
supply was able to accommodate their industrial needs. This
was coupled with the passive purchases of coal by the United
States and Japan .
The matter was discussed in the coal price and cost monitoring
committee that was established in 2011, to monitor pricing and
coal acquisition especially on matters related to supply and
pricing mechanism from time to time .
Compared to the year 2011, ACP began to decline begining
at the second quarter till the fourth quarter of 2012. In 2012,
the average ACP at the second quarter was RM14.15 /GJ,
RM12.73/GJ for the third quarter and the RM12.01/GJ at the
fourth quarter. For the first time since the ACP mechanism was
implemented, the average coal price in the third quarter year
of 2012 was RM12.01/GJ, that is, lower than the price of gas for
the power generation at RM 12.99/GJ. With regards to this, the
coal consumption in the fuel mix was the maximum since the
third quarter year of 2012 for optimising the generation cost in
Peninsular Malaysia.
Jan-12 Feb-12 Mar-12 Apr-12 May-12 Jun-12 Jul-12 Aug-12 Sep-12 Oct-12 Nov-12 Dec-12
TNBJ 13.61 13.61 13.61 13.35 13.35 13.35 11.97 11.97 11.97 11.24 11.24 11.24
TBIN 14.78 14.78 14.78 14.47 14.47 14.47 13.03 13.03 13.03 12.31 12.31 12.31
KEV 15.28 15.28 15.28 14.95 14.95 14.95 13.48 13.48 13.48 12.77 12.77 12.77
JEV 14.78 14.78 14.78 14.47 14.47 14.47 13.03 13.03 13.03 12.31 12.31 12.31
Gas Price 12.99 12.99 12.99 12.99 12.99 12.99 12.99 12.99 12.99 12.99 12.99 12.99
COAL FIXED PRICE
RM
/GJ
KEV
TNBJ
JEV&TBIN
16.00
15.00
14.00
13.00
12.00
11.00
10.00
9.00

AN
NU
AL
REP
OR
T 20
12118
The price determination based on the ratio of different types of
coal in the PPA is as follows:
Station Bituminous Sub-Bituminous
Kapar 100% -
Manjung - 100%
TanjungBin 70% 30%
Jimah 70% 30%
Theworldcoalpriceindices,NEWCandArgusMcCloskeyCoal
Price Index (API # 4) continuously showed a decrease of 10.4%
and 9% respectively caused by the softer world economy and
coalmarketsintheEurope.Thishasimpactedtheworldmarket
and influence the coal price determinantion to be lower in the
generation sector.
MARkET TREND INDEX
USD
Jan-
12
Feb-
12
Mar
-12
Apr
-12
May
-12
Jun-
12
Jul-
12
Aug
-12
Sep-
12
Oct
-12
Nov
-12
Dec
-12
130
120
110
100
90
80
70
60
NEwC API#4
Month
The cost of coal shipments in the first and second quarter
indicated a little increase based on the Bunker Adjustment
Factor where it increased to 7%. However, in the third and fourth
quarters of 2012, the Bunker Adjustment Factor showed an
overall decrease of 8% thus lowering the shipment cost. This
price determination is based on long-term contracts agreed
betweenTNBFwithcoalsuppliers.
CATEGORIES OF ELECTRICAL EQUIPMENT
In line with the increasing rapid development of technologies,
production of electrical equipment also increased with a variety
of designs with new technologies. Consequently, ST has added
new electrical equipment categories and sub-categories of
equipment that need to be controlled from 31 categories to 34
categories.
The 3 new categories of electrical equipment to be controlled
bySTincludeElectricMassageMachines,Air-Conditionersand
Adapters. In addition, among the sub-category of equipment
addedwereLEDlights,doorbellswitchesandchimes,portable
cable reels, Edison screw lamp holders, night lamps integral
with direct in plug, portable LED lamps, bottle warmers,
sterillisers, water dispensers/filters, dish washers, decorative
fans, bladeless fans, ionic facial steamers, audio/video recorders
(up to 4 channels ).
The notice on the additional category of Electrical Equipment
Requiring Certificates of Approval has been made known to
interested parties such as the Royal Malaysian Customs which
controls theentryofgoodsat theentrypointsandSIRIMQAS
which deal with manufacturers and importers.
The announcement notice was also made through ST portal
on15June2012andthroughlocalnewspaperssuchasBerita
Harian and the New Straits Times on 18 August, 2012 .
developing a robust regulatory framework (continued)

119
PRINT MEDIA NOTICE ANNOUNCEMENT ON ADDITIONAL TYPE OF EQUIPMENT

AN
NU
AL
REP
OR
T 20
12120
developing a robust regulatory framework (continued)
ADDED EQUIPMENT SUB CATEGORIES
The additional new electrical equipment categories has been
widelymadeknownin2012tointerestedpartiesasfollows:
BRIEFING ON ADDITIONAL ELECTRICAL EQUIPMENT
Interested Parties Briefing Date
TEEAM,MEADA&PERKEM 5 June 2012
SIRIMQASInternational 1-17October2012
Malaysian Air Conditioning &RefrigerationAssociation(MACRA)
18 October 2012
Sabah Royal Malaysian Custom 18December2012
GUIDELINES AND CIRCULARS
Electrical Meter Guidelines
AsaresultofactionbeingtakenbyTNBtochangetheoldmeters
of more than 15 years of age, consumer complaints were received
resulting from the high increase in electricity bills. Consumers
had questioned the accuracy of the installed meters and also had
begun to raise up the issue of the party responsible for testing
and verifying the meters. Looking at the scenario then, a lot
of electrical meter complaints made were on the consumers’
level of trust towards the integrity of the meter itself. The many
complaints pointed to the need for an independent body with the
responsibility to conduct more effective verification of meters.
Inearly2012,STtooktheinitiativetostreamlinetheprocessof
monitoring the electrical meters and began developing electrical
meters guidelines which set out the necessary processes to test
and verify electrical meters. The development of the electrical
meters guidelines is in line with the ST responsibilities as an
independent body to monitor the use of electrical meters to
improve transparency in the approval, testing and calibration of
electrical meters by an independent, competent party.
At present, the testing and calibration of electric meters
complies with EN ISO/IEC 17025:2005-General Requirements
for the Competence of Testing and Calibration Laboratories
under the Laboratory Accreditation Scheme of Malaysia (SAMM).
This scheme is supervised by the Department of Standards
Malaysia, Ministry of Science, Technology and Innovation which is
responsible for accrediting testing and calibration laboratories.
All electric meters laboratories of meter manufacturers including
TNB vendors have been accredited under this accreditation
scheme. These laboratories have been accredited for testing and
calibrating of electrical meters process based on the following
standards:
• MSIEC62053-11:Electromechanicalmetersforactive
energy (classes 0.5, 1 and 0.2).
• MSIEC62053-21:StaticMetersforactiveenergy
(classes 1 and 2).
• MSIEC62053-22:StaticMetersforactiveenergy
(classes 0.2S and 0.5S).
• MSIEC62053-23:StaticMetersforreactiveenergy
(classes 2 and 3).
• MSIEC62052-11:Electricitymeteringequipment(AC)–
General requirements, tests and test conditions
– Part 11: Metering equipment.
The implementation of the electrical meter guidelines, would
emphasise more on the integrity of the electrical meters from
a legal perspective (legal requirement). Three new process
were introduced to enhance the regulation of electrical meters
namely:
• Patent Approval-handled by the National Metrology
Laboratory (NML), SIRIM Berhad or in the National
Measurement System Act 2007 being interpreted as the
National Measurement Standards Laboratory ;
• Product Certification - conducted by International SIRIM
QASastheCertificationBodythatpossessthecompetency
levels for conducting the Product Certification process; and
• LabellingofelectricalmeterswithSIRIM-STlabels.

121
By April 2013, new electrical meters used by TNB will be
equipped with SIRIM-STlabels when approved in the process
that is stipulated in the existing electrical meter guidelines.
Guidelines on the Boundry for Management and Maintenance of Electricity and Piped Gas System Installation
Frequent disputes are raised by consumers, owners and
management of installations in relation of the management and
maintenance responsibilities of electrical and gas installations
at the consumer premises, especially in high rise buildings.
There are ambiguities in the boundry of responsibilities
between the utility with the management and the owners of
their respective installations.Theguidelines for theBoundry
for Management and Maintenance of Electrical and Piped Gas
System Installations was developed to set the boundaries of
responsibility between the parties involved with electrical and
piped gas installations within building and was first adopted on
March 19, 2012.
Electrical Safety Circular
ST has also issued a circular, entitled “Use of 1.5mm2 Copper
Power Cable For Lighting Circuit Wiring”, which is aimed at
explaining to all consultants, electrical contractors, competent
personnel, cable manufacturers and importers as well as all
the other parties involved in the design and installation of
wiring and electrical systems, on the need of at least 1.5mm2
copper cable for lighting circuit in wiring systems in buildings.
The installation of 1.5mm2 copper wiring for lighting circuits was
stipulated in the Guidelines for Electrical Wiring in Residential
BuildingsthathasbeenissuedbySTandtheguidelineswere
developed in accordance with the requirements of the following
Malaysian standards:
• MSIEC60364- ElectricalInstallationsofBuildings;
• MS1936:2006-ElectricalInstallationsofBuildings
-GuidetoMSIEC60364;and
• MS1979:2007-ElectricalInstallationsofBuildings
-CodeofPractice.
These guidelines have also been made mandatory through
ST’s Circular No. ST. 2/2008 of 1 July, 2008. However, ST has
discoveredthattherewerestillcablesofsizelessthan1.5mm2
used for lighting circuits in buildings. ST has also found that
there are local cable manufacturers still producing 1:25mm2
sizedcoppercablesforpermanentwiring.
Action To Be Taken
Consultants, electrical contractors, competent personnel
and all other parties involved should ensure that copper
cablewiringwithasizeofat least1.5mm2 only are used for
permanent wiring lighting circuits. The following sources of
informationandmarkingscanbeusedtoidentifywhetherthe
cable used is in compliance with the set standards:
• informationofthecableinthelabelonthecablepackage;
• embossedmarksonthecablethatstatethesize,standard
and the relevant accredited cable testing laboratory; and
• directphysicalexaminationofacrosssectionof thecable
which shows the number of cable strands, type of conductor
and insulation.
Cable standards used for permanent wiring is MS 2112:2009.
Theuse of copper cablewith the size of at least 1.5mm2 for
lighting circuits is to avoid the occurrence of overheating,
voltage drop or damage to the cable insulation. Wiring system
for lighting circuits should use copper cable of at least 1.5mm2
throughout the installation (from the fuse or MCB) at the
distribution board up to the light point without any joints in
between.
Enforcement Actions
All consultants, electrical contractors, competent personnel,
cable manufacturers and importers and all parties involved in
the design and installation of electrical wiring installations are
reminded to adhere to the ST Circular No. 2/2008. Stern action
couldbetakenagainstanypartieswhofailtocomplywiththe
circular.

AN
NU
AL
REP
OR
T 20
12122
developing a robust regulatory framework (continued)
RE-EVALUATING EXISTING STUDIES
Study on Effectiveness of Gas Odorant System in Gas Transmission Pipeline for Commercial and Residential Sectors in Peninsular Malaysia
Recently, several gas explosion accidents had caused loss of life
and damage to property at commercial and residential premises.
One of the possible factors that contributed to the accidents is
the ineffectiveness of the gas odorant system.
Subsequently, ST had conducted a Study on the Effectiveness
of the Gas Odorant system in Gas Transmission Pipelines For
Commercial and Residential sectors in Peninsular Malaysia
starting from May 2012 which aimed to determine the
effectiveness of the Gas Odorant in Gas Transmission Pipelines.
The Gas Technology Centre (GASTEG), UTM was appointed to
carry out the study.
Among the main objectives of this study were as follows:
• To determine the odorant level in predetermined locations
from the city gate stations till the gas consumers, particularly
in commercial and residential premises.
• Todeterminewhetherthecurrentodorantlevelscomplywith
local standards and standards practised internationally.
• Toassessthesuitabilityofdifferenttypesofodorantsusedin
the odorant system.
• To determine the cause of inadequate odorant levels and
non uniform odorant diffusion and to provide suitable
recommendations to achieve an effective odorant level at all
times to ensure the safety of the gas installation.
In this study, the measurement of odorant levels were conducted
at several locations in the identified area such as condominiums,
terrace houses, bungalows, hotels and shopping complexes.
Among the locationsareHampshireParkCondominium,Kiara
CondominiumGreen,Berjaya TimesSquare, theNationalGolf
Club and others. Odorant level reading were also obtained at
the city gate stations of Capital Station Glenmarie and Serdang
and district, regional and service gas stations. 3 types of odorant
level measuring devices had been used namely Electrochemical
Sensors(SewerinExTECOD4),LengthofStainTubeandSuction
Pump (Gastech) and Odorator System (Health Tech Odorator).
Odorant level measurement using
Electrochemical Sensors and reading example
After the measurement of odorant levels was carried out, the
simulation process to study the spread of the gas molecules was
carried out by using the Flame Acceleration Simulator (FLACS)
software while the odorant flow patterns simulation process in
the pipeline were carried out by using the Computational Fluid
Dynamics(CFD)software.Thedataobtainedfromtheresultsof
the measurement of odorant levels were used in the simulation
processes.
Based on the measurement of the odorant levels and the
simulations conducted, the conclusions that could be drawn are
as follows:
• The amount of odorant in the gas transmission pipeline
system at the city gate station is sufficient.
• The composition of TBM and DMS respectively of 80% and
20% that were found in the gas transmission pipeline system
is effective and suitable for the use in the natural gas odorant
system.
• Therearetwofactorsthatdirectlyaffectthelossofodorant
namely the gas flow rate and altitude. However, the gas flow
rate is the bigger factor for the odorant loss.
• Atlowgasconsumptionrates,thelossofodorantishigherin
the high rise residential buildings such as condominiums.
Basedonthestudyconducted,itwasfoundthatgasusersinhigh-
rise residential buildings have very low rates of gas consumption.
This would affect the effectiveness of the natural gas odorant
and it is feared that gas leakageswould not be sensed in the
premises. In this connection, GASTEG has recommended the
following to improve gas system safety particular for consumers
inhigh-riseresidentialbuildings:

123
• Due to the low rate of gas consumption in the high-rise
residences, installation of natural gas leakage tracking
system is highly recommended in each consumer unit.
• Back-CheckValveinstallationalongthethegastransmission
pipelines in high-rise residences is also recommended to
maintain the level of odorant at higher altitudes.
• The addition of odorant into the gas transmission pipeline
system in residential building of over 15 stories is also needed
and may be done at building roof tops.
• Increase the rate of gas consumptionamong consumers in
high-riseresidencesthroughcontinualpromotionontheuse
of gas as well as awareness of safety aspects.
• Have continuous monitoring of the level of the odorant
especiallyinhigh-riseresidentialbuildings.
Study on Revision of Tenaga Nasional Berhad Reconnection Charges
The imposition of consumer connection charges by TNB has
first introduced in 1995. As of today, the charge rates have
yettoberevisedtakingintoaccountthechangeinpricesand
the current inflation rates. The last proposal to revise the
connection charges was submitted by TNB in the electricity
tariff restructuring proposal in 2009. However, the proposed
revision of connection charges was postponed to enable the
adjustment of electricity tariff in Peninsular Malaysia which
was decided in June 2011.
To ensure the rates to be charged to consumers is in line with
thecosts tobebornebyTNB,SThas initiatedsteps tostudy
TNBreconnectionchargesfromearly2012.Forthis,TNBhas
sent a consumer connection charges proposal in March 2012.
Tilltheendof2012,discussionswithTNBontheproposalwere
still ongoing. This study is expected to be completed in 2013
and will be brought to the Government for consideration and
approval.
Study on Power Quality Baseline in Peninsular Malaysia
APowerQualityBaselineStudywhichstartedinApril2010has
been extended till February 2013 to obtain the recorded data
byPQMonitorstillJanuary2013fortheCentralandSouthern
areas. This study was conducted to measure the level of power
quality in the Malaysian environment to be incorporated in
the related power quality standards. Data collection for the
ElectricitySupplyQualityBaselineStudyinPeninsularMalaysia
throughtheinstallationofPQMonitorsforaperiodofoneyear
have been completed for 25 locations in the Northern and
the Eastern Coast. PQ Monitor Installations at 25 locations
for the Southern and Central region has been completed and
willrecordthedatatillJanuary2013.Datacollectionthrough
the installation of data logger has already been done for 500
installations across Peninsular Malaysia.
The data collected up to October 2012 have been analysed and
presentedinthePowerQualityStakeholdersWorkshopwhich
washeldonOctober22,2012atPWTC,KualaLumpur.Atotalof
167participantsattendedtheworkshop.
Addressing the Issue of Power QualityAdvocated by the American Chamber ofCommerce (AMCHAM)
In PEMUDAH meeting No. 10/2012 on 6 November 2012
chaired by the Chief Secretary, AMCHAM had presented a white
paper on their concerns on current trends relating to power
quality especially on voltage dips that affect the operation of
semiconductor factories and recommended that this matter be
attended to immediately.
On 19 November 2012, theWorking Group on Power Quality
was set up and held meetings to discuss power quality issues
faced by AMCHAM and companies under their fold. The meeting
wasattendedbyAMCHAM,TexasInstruments,WesternDigital,
FreescaleSemiconductor,TNBandST.
Subsequently, ST had organised the Stakeholder Engagement
Workshop on Power Quality Management at Equatorial
Hotel, Bangi. This workshop was attended by 40 participants
representingST,KeTTHA,MIDA,TNB,AMCHAMandtheindustry,
NURandGTIM(STconsultantforthestudy).Theworkshopwas
held to share current information on power quality, identify
related issues on power quality and possible solutions to reduce
risksassociatedwithpowerquality.Fromtheworkshop,several
recommendations were made and these will be discussed with
PEMUDAH.

AN
NU
AL
REP
OR
T 20
12124
HARMONISING STANDARDS AT REGIONAL LEVEL
Electrical and Electronics Equipment Standard for ASEAN Region
ST has been involved in several meetings at ASEAN level
in 2012. Among other things, the Joint Sectoral Committee
on Electrical and Electronic Equipment (JSC EEE) standard
discussed the harmonising of standard of electrical equipment
testing, laboratories acceptance and certification of electrical
equipment in promoting free trade between the countries in
the ASEAN region. Throughout 2012, JSC EEE meeting were
conductedatPhnomPenh,Cambodiaon30-31May,2012andat
Yogyakarta,Indonesiaon20-22November,2012.
developing a robust regulatory framework (continued)

125
ST consistently ensures that its organisational capabilities are
being upgraded in line with present requirements, current
situation and technological changes. The strategies are always
updated for developing a sustainable organisation, and human
capital, and improving the delivery of services and enhance the
security of its ICT system.
In addition, a partnership in the international arena was established
besides strengthening organisational branding through
Corporate and Social Responsibility and internal communication
programmes.
Strengthening Organisational Capabilities

AN
NU
AL
REP
OR
T 20
12126
ENSURING SUSTAINABILITY OF ORGANISATION
Revised Fees and Charges
ST has undertaken an analysis on the fees and charges for
certifications under the Electricity Supply Act 1990 and the Gas
Supply Act 1993. The analysis was executed after considering the
impact of the increased operating expenses for the sustainability
ofSTbytakingintoaccounttheincreasingST’sresponsibilities
since a few years ago and which is expected to increase further
when the program under the Malaysian Electricity Supply
Industry (MESI) Reforms being prepared by MyPOWER is fully
implemented.
Furthermore, most of the fees and charges that are being
imposedatpresenthavenotbeenrevisedsinceitbeinggazetted.
In 2000, several fees and charges have in fact been reduced by
fifty percent based on the directive from the National Economic
Action Council (NEAC) following the financial crisis that hit Asian
region in 1998 and the fees and charges have remained till now.
DEVELOPMENT OF HUMAN CAPITAL
Human Capital Development Framework
TheST’sHumanCapitalDevelopmentFrameworkwasfirstdevelopedin2011anditsinitiativeshavebeenimplementedsince2012.The
frameworkisusedasthemainguidelineforthepreparationofpolicies,mainactivitiesandalsoproceduresrelatedtothemanagement
anddevelopmentofhumancapital inST.PreparationofSTHumanCapitalDevelopmentFrameworkisbasedon4keyconcepts,as
follows:
OBJECTIVETo achieve the highest
availability level for competent,wellskilledand
motivated human capital
CONCEPT 1 ASCERTAININGAND
AQUSITIONOFHUMANCAPITAL
CONCEPT 2 HUMAN CAPITAL DVELOPMENT
CONCEPT 3MOTIVATION
CONCEPT 4 ENVIRONMENTAND
ORGANISATION DYNAMICS
InlinewiththemainobjectiveofSTHumanCapitalDevelopmentFrameworkwhichaimstoprovidecompetent,welltrainedandhighly
motivated human capital, several initiatives have been implemented starting in 2012. These initiatives were aimed at creating a robust
and comprehensive guidelines about the policies, activities and procedures that need to be improved or to be established to develop
humancapitalinamorecomprehensiveandwell-structuredmanner.
strengtheningorganisational capabilities

127
Development of Training Policy of Energy Commission
To strengthen the planning and implementation of human
resource development programmes in ST, ST Training Policy
has been formulated and developed based on the need to fully
implement ST functions and is aimed to provide competencies
for each staff towards achieving the ST Transformation Plan.
This policy is used as the main guideline in developing staff
knowledgeandskillsinthetechnicalandbehavioralaspects
in a comprehensive and well-organised manner. It also
sets the duties and responsibilities of all parties involved
in the development of human capital in ST, including duties
and responsibilities of the superiors and the employees
themselves. Through this policy, the minimum training
man days for Executives is set at 7 days in a year while the
minimum number of days for training of support staff has
been set for at least 4 days a year.
Implementation of Management Performance Based on key Performance Indicators
In linewith the effort to create a performance basedwork
culture, annual performance evaluation of the staff is being
implemented based on the achievements in terms of the
annualKeyPerformanceIndicators(KPI)oftheST.Thefirst
phase of the process involved the evaluation of staff in the Top
and Middle Management beginning in 2011 and was continued
in 2012. From 2012, all employees at both levels are required
to use the computerised performance management system
(e-PMS)inmonitoringtheachievementsofthemselvesfrom
time to time. This system which was developed from 2010
started operating since early 2011, allowing staff performance
to be evaluated objectively whereby both the aspects of the
taskandalsoappropriatecompetencyaspectsareevaluated
by the superiors and reviewed by a higher officer. The system
alsoallowsself-appraisalbythepersonnelthemselveswho
will assess themselves while providing an opportunity for the
employeestodisplayandinformtheirsuperioronthetasks
that have been implemented in a more detailed and personal
manner .
Development of Career Development Mechanism
To provide promotional opportunities for good performing staff
but not given the opportunity to be promoted to vacant posts,
an initiative to develop their career development mechanism
began in 2012. This mechanism allows eligible employees to be
considered to undergo evaluation to determine whether they can
be raised to a higher level of their career without the need to fill
any higher vacancies. The guidelines for the initiative has been
completed and the initiative has been implemented in 2012 for
staff in the Support Group .
Review of Termsand Conditions of Service
In 2012, ST had completed a study on the existing Terms and
Conditions of Service including the conditions of service,
entitlements and salary and grading structure in ST as well
as the grade and salary structure in ST. It was also to ensure
that the ST could provide a set of competitive and up to date
Terms and Conditions of Services, in line with the roles and
responsibilities of ST, as a body to monitor the supply and
security of electricity and piped gas which is becoming more
challenging. This is to ensure that the services package
provided by the ST can retain and attract talents which are
of high competency and expertise with positive attitudes.
The proposal on the revision of the terms and conditions of
the Energy Commission has been approved by the Energy
Commission and the Minister of Energy, Green Technology and
Water for implementation in 2013.
At the same time, following the announcement of a salary
increase by the Prime Minister on 8 March, 2012 in which
an increase of salary of between 7% to 13% was given to
Government servants based on categories of the posts, ST also
took a similar step in implementing a salary increase of the
employees effective of 1 January 2012, upon the approval from
the Minister of Energy, Green Technology and Water. However,
the increase only involved the employees’ gross salary and do
not involve the amending of the existing wage structures. This
was because the ST is in the process of reviewing the Terms
and Conditions of Services including revising the existing
grade structures and salaries.
AN
NU
AL
REP
OR
T 20
12128
Competency Development and Training
To further enhance the capacity and capabilities of the ST, in the
year 2012, the total (100%) of the budget for implementing training
programs and competency development training, comprising 99
programmes was used. The development programme involved
staff participation in local and overseas programmes, including
participation in seminars, meetings and discussions concerning
the regulatory functions of the energy industry.
The training programmes attended by ST staff in 2012 included
6 programmes in the field of law and the regulatory process, 75
technical programmes, 12 programmes in related regulatory
practices and 6 programmes on effective personal image.
Among the training programmes organised in 2012 were:
• WorkshoponUnderstandingandInterpretingtheElectricity
Supply Act (1990) and the Electricity Supply Regulations.
• Electricity Supply Regulations Training - organised with
cooperationofKEMAConsultingGMBH.
• WorkshoponthePowerPurchaseAgreementStudy.
• Official Document Writing Training - conducted by Dewan
BahasadanPustaka.
• InductionandTeambuildingProgram.
In addition, the staff were also sent to training programmes
organised by external parties.
IMPROVEMENT OF DELIVERY SERVICES
Online Application System Services
A portal providing Online Application System (OAS) has been
developed and put into operation in 2012. The OAS portal includes
e-Gas and e-Electricity systems. The e-Gas system provides
services for Gas Licence Application, Equipment Approval, Gas
Lines and Installations Approval, and Gas Competent Personnel
and Gas Contractor Registrations. The e-Electricity system
provides for the application of Public Licence, Private Licence (5
MWabove)andUtilityLicence.Thee-Gassystemhasbeen fully
operationalfromAugust2012whilethee-Electricitywasreadyfor
pilottestinDecember2012.
Automated Financial Services
ST Electronic Fund Transfer (EFT) enhances the payment process
where payment through cheques to the ST service provider and
staff can be reduced. Instead, payment is made directly to the
accounts of the company and staff. Indirectly it avoids delay in
claims payment. EFT implementation at the head office has been
fully implemented.
To improve service delivery, the online payment services involved
permits for electrical equipment made through the e-Permit
system.ThisserviceisintheformofBusinesstoBusiness(B2B)
while services improvement efforts forBusiness to Consumer
(B2C)willbeimplementedin2013.
Energy Commission Operating System (ECOS) Online
The ECOS system has been used through the intranet involving
the head office and 9 ST regional offices for the last 10 years.
ST had appointed a consultant company to improve the on-
line application services system. The on-line system, that is
still in the development phase, will assist and accelerate the
administrative process for the applications for the examinations
for a certificate of electrical competency, competent personnel
registration, registration of private licence below 5 MW,
contractor registration, registration of electrical installations,
energy manager registration and monitoring of ST certification
registration as a whole.
Data Sharing with SIRIM
The integration of information on consignment tests between
ST and SIRIM in relation to COC had been approved by ST. This
assisted SIRIM in undertaking consignment test for electrical
equipment received from the applicants. Information on the
consignments will be sent to the ST through web services which
will facilitate easy monitoring of approved electrical equipment
with SIRIM labels. The integration of SIRIM consignment
information was implemented in March 2012.
Strengthening ICT SECURITY
Cyber Security
In 2012, ST had received several directives and reminders from
the National Security Council on ensuring that the electricity
andgassupplysystemsarenotaffectedbyhackers hacking
the Malaysian portal. Upon receiving such directives, all of
the Critical National Information Infrastructure–(CNII) under
the control of ST will be informed about the matter. All CNII
are required to constantly monitor the electricity and gas
generation and supply systems so that they are under control
and alerted against any attempt of cyber assault.
strengtheningorganisational capabilities (continued)

129
Thefollowingweresomeoftheattacksthattookplacein2012:
Date Matter
13 Feb 2012 HadreceivedemailfromMKNonprobableDDOSattack.Allpartieswererequired to be on alert.
14 Nov 2012 MKNhadreceivedinformationthathackershavelaunchedattacksontheMalaysian portal. Several portals were paralysedbytheattacks.
16 Nov 2012 Thehackershadlaunchedasecondattack.Thehackerssuccessfullyextracted information from several attackedportalapplicationdatabases.
So far, the supply of electricity and gas operations are not
affected by the attacks. CNII has taken vigilant steps and
monitored the respective systems to avoid the invasion.
The Implementation of MS ISO/IEC 27001:2007 Information Security Management System-ISMS )
In accordance with the decision made by the Cabinet on
February 24, 2010 that all CNII organisations should get ISMS
certification within 3 years, ST will monitor the implementation
of CNII under its jurisdiction.
Until December 2012, there were 20 organisations regulated
by ST implementing ISMS to get the certification within the
prescribed period. At present, only Jimah Energy Ventures
Sdn Bhd and Malakoff Berhad were successful to obtain the
certification. There are several organisations that are in the audit
process and the rest are still in the implementation of ISMS at
their respective organisation.
ICT Security Policy
The increase of IT data management and ICT security was
enhanced by an ICT security policy draft which was initiated in
early 2012. The ICT Security Policy will be first launched and
implemented in the second quarter of 2013 so as to improve the
delivery services.
Recognition for Information Security System Management
Beinganagencyresponsible foracritical infrastructure in the
energy sector, ST has beenworking to obtain theMS ISO IEC
27001: 2007 certification for ISMS. By focusing on effective
delivery services to customers, the initiative towards quality
assurance of the information technology management system
had started. The study and requirements for the Information
SecurityManagement System - (ISMS) certification have been
implemented in April 2012.
Off-Site Backup
To increase productivity and an efficient operational approach
onICTinfrastructure,thesettingupofanOff-SiteBackup(Cold
Site) for application and ST system servers has already been
implemented. This is in line with the ST security requirements
to prepare for an ICT Disaster Recovery Plan and Business
Continuity Plan to ensure that the ST data systems, files and ICT
operating system (OS) are safe and can be continued to be used
in the event of damage and unexpected disasters. The storing of
duplicates or copies of existing data external to the ST premises
is aimed at protecting all assets (data) in the central server and
forittobemoresecureandsafe.ThepreparationfortheOff-Site
Backupisinthedevelopmentstageandwillbefullyimplemented
during the quarter second of 2013.
INTERNATIONAL RELATIONS
Memorandum of Understanding between the Energy Commission and the California Energy Resources Conservation and Development Commission
To strengthen ST as a regulatory body, a Memorandum of
Understanding (MoU) between ST and the California Energy
ResourcesConservation andDevelopmentCommission (CEC)
on cooperation on energy related policies and programmes,
had been signed on 17 May, 2012 in Sacramento, United States.
Among the focus in the memorandum is to develop cooperation
between both sides on energy policies and energy efficiency and
renewable energy programmes.

AN
NU
AL
REP
OR
T 20
12130
Visit by Foreign Agencies
In addition, ST has received visits from foreign public agencies
and companies aimed at deeper understanding of the energy
industry and the role of ST in regulating the energy sector. Among
the visits received were:
Date Overseas Agencies
19 April 2012 Russian Energy Agency.
19 June 2012 BoardofJudgesRenewableEnergyProject Competition for ASEAN Energy Awards 2012.
21 June 2012 Ministry of Communication and Prime MinisterDepartment,Brunei.
27 June 2012 KenyaPrivateSectorAlliance(KEPSA).
05 July 2012 TYT Thomas Chalupa, Environment Minister,CzechRepublic.
24 August 2012 Thailand Government Officers.
02 October 2012 TYTViktorSigly,EconomyMinisterGovernment of Upper Austria.
09 October 2012 Electricity Regulatory Authority of Vietnam (ERAV).
20 October 2012 Bahamas.
21 November 2012 MinistryofEnergy,RepublicofKenya
Overseas Meetings and working Visits
Overseas meetings and overseas working visits that the ST
participated in 2012 include:
• HitachiYoungLeadersInitiativeon9January,2012inHanoi,
Vietnam.
• Asian Energy Regulators Network on 2 March, 2012 in
Bangkok,Thailand.
• Workshopon“DevelopingaHarmonisedElectricalEquipment
RegulatoryRiskAssessmentTool”on15 to16May2012 in
Singapore.
• 5th World Forum on Energy Regulation 17 May, 2012 in
QuebecCity,Canada.
• 17th Meeting of the Asia Pacific Economic Cooperation
(APEC) Joint Regulatory Advisory Committee (JRAC) For
Mutual Recognition Arrangement (MRA) on Conformity
Assessment for Electrical and Electronic Equipment (EEE)
on May 17 to 18 2012 in Singapore.
• Accompanying the Minister of Energy, Green Technology
and Water to attend the APEC Energy Ministers 10th at St.
PetersburgandaworkingvisittoMoscowon25June,2012.
• AccompanyingtheMinisteronthevisittoBruneion5July,
2012.
• ParticipatingintheMalaysiandelegationtothe30thASEAN
Ministers On Energy on 11 September, 2012 in Phnom Penh,
Cambodia.
• 76th InternationalElectrotechnical IECGeneralMeetingon
October 5, 2012 in Oslo, Norway.
• EastAsiaSummitEnergyMarketDeregulationForumon23
October, 2012 in Singapore.
• AccompanyingtheMinisterforaworkingvisitonNovember
2012 to Algeria and France.
CORPORATE SOCIAL RESPONSIBILITY
Recognising that apart from unsafe wiring,most electrical
accidents among the public is due to the failure of protection
device(circuitbreaker)tooperate,aTouchPointprogramwas
organised to create awareness on the above factors. Chosen
locationsweretemples,“tahfiz”/religioncenters,housesinrural
areas, old shop houses and others.
Among the free services provided throughout this ST program
included:
• Checkingonsafetyofelectricalwiring.
• Checkingonearthingarrangements.
• Distributingenergyefficientlighting.
• Changingearthleakagescircuitbreakers.
A receipient of the Touch Point program at Pondok Tahfiz, Sandakan
strengtheningorganisational capabilities (continued)

131
Some of the occupants from 34 homes who received contributions
from the Touch Point program
Mr Jesudian J. Isaac from Taman Permata,
Ipoh received an earth leakage circuit breaker and a wiring system
inspection at his home.
En Said Abdul Rashid from Tanjong Rambutan,Ipoh received a safe wiring
system at his home during the Touch Point program
INTERNAL COMMUNICATIONS PROGRAMMES
ST had organised several internal and external events to
strengthen the organisation’s branding besides improving the
perception of employees, customers and the media on ST’s roles
and responsibilities. Among them:
• Energy Commission Appreciation Night 2012 was held on
17February,2012 tohonorSTcitizenswhohadcompleted
their services besides giving recognition to employees who
have performed excellently throughout 2011. A total of 25
staff received Outstanding Services Award and 4 staff who
completed their services also received appreciation from
YBDatukSeriPeterChinFahKui,MinisterofEnergy,Green
Technology and Water .
• 9MonthlyAssemblysessionsforthestaffwereheldduringthe
year 2012 as a platform for the Chairman and Chief Executive
Officer (CEO) to express their intentions, ST mandate and the
current administrative development status and regulation of
the energy industry directly to the employees from time to
time.
• Innovation Project Competition ‘Excellence for Customers‘
hadbeen implementedwhereaproposalentitled ‘QRCode
for Labeling‘ for improving the control of electrical equipment
marketwasdeclaredtheultimatewinner.

132

133
KeyPerformanceIndicators(KPI)ReportST centres its activities and efforts on ensuring that the Key
PerformanceIndicators–(KPIs)forthefollowingeightstrategic
objectives are implemented effectively:
• EnsuringReliableandEfficientEnergySupplyatReasonablePrices.
• EnsuringSecureEnergySupply.
• EncouragingTransparencyandCompetitivenessintheEnergy Industry.
• EnsuringEfficientandSafeConsumptionofEnergy.
• EnsuringLegalCompliance.
• ProtectingConsumers’Interests.
• DevelopingaRobustRegulatoryFramework.
• UpgradingOrganisation’sCapabilities.

AN
NU
AL
REP
OR
T 20
12134
kPI ACHIEVEMENT STATUS IN 2012
InlinewiththeGovernment’sdesiretomeasuretheperformanceofpublicsectoragenciesusingmethodssuchasOutcomeBased
Approach(OBA)andOutcomeBasedBudget(OBB),SThasimplementeditsperformancemeasurementbasedonKeyPerformance
Indicators(KPIs)from2009.TheKPIoutlines8strategicobjectivesbasedonEnergyCommissionTransformationPlan.
Atotalof71KPIshadbeensetfortheyear2012ascomparedto51KPIsfor2011.Theincreaseisinlinewiththecurrentrequirements,
the development of the industry and the rapid technology development.
TOTAL kPI FOR STRATEGIC OBJECTIVES (71 kPI)
7 kPI10%
7 kPI10%
15 kPI21%
5 kPI7%
10 kPI14%
3 kPI4%
9 kPI13%
15 kPI21%
Ensuring reliable and efficient energy supply at reasonable prices.
Ensuring secure energy supply.
Encouraging transparency and competitiveness in the energy industry.
Ensuring efficient and safe consumption of energy.
Ensuring legal compliance.
Protecting consumers’ interests.
Developingarobustregulatorydevelopmentframework.
Upgrading organisational capabilities.
Overall,amajority,thatis53outofthe71KPIsfortheyear2012hasrecordedanachievementofabove80%.Basedonthisachievement,
44KPIsrecordedanachievementof90%to100%(62%),while27KPIswereatthelevelof50%to89%(38%).ThisKPIachievementat
alowerpercentage,amongothers,isduetothepostponementofseveralinitiatives,suchastheimplementationofIncentives-Based
Regulation(IBR)forgas,wheretheimplementationhasbeenpostponedto2014.TheotherKPIs,havealreadybegunandwillcontinue
to be implemented and will be completed in early 2013.
kPI ACHIEVEMENT STATUS IN 2012
Achievement Rate
50
45
40
35
30
25
20
15
10
5
0
Tota
l kP
I
90% - 100%
44 kPI(62%)
50% - 89%
27 kPI(38%)
key performance indicators (kpi)report

135
WayForward

AN
NU
AL
REP
OR
T 20
12136
ACHIEVEMENT STATUS OF ENERGY COMMISSION TRANSFORMATION PLAN
ThetransformationPlanofEnergyCommissionhasoutlinedtheimplementationofhighimpactinitiativesunder3sub-plansforthe
period beginning in 2010 till 2020.
ECONOMIC, TECHNICAL AND SAFETY REGULATORY PLAN
Thefirstsub-plancontainsatotalof35initiatives.Amongthelistoftargetedinitiativesin2012,56%havebeenimplementedwhile
44% are still under implementation.
Theinitiativesthatarestillunderimplementationintheyear2012includethedevelopmentandimplementationofseveralframeworks
forthesupplyandsafetyintheelectricalandgassectors,openaccesstothegasnetworkandcooperationamongtheagenciesand
associations related to regulatory activities.
Year Initiative Status
2010
InternationalBiddingforNewCapacity
AccountunbundlingunderIBR
TechnicalandFinancialBenchmarking
Proposal on Electricity Tariff Review Analysis
TransparencyinDispatching
2011
Industry Awards Program
EnergyDataBase(MEIH)
Industry Performance Monitoring Programme
Implementation of New Applicable Coal Price Mechanism
DevelopmentofIndustryCodeofPracticeandGuidelines
GridandDistributionCodeEnforcement
2012
Implementation of Service Standards Monitoring
IssuanceofRegulatoryImplementationGuidelines(RIGS)-Electrical
SingleBuyer(SB)FrameworkandGridSystemOperator(GSO)-Electrical
OperatingaMoreTransparentandWellManagedElectricalandGasMarket
ImplementingaNewFrameworkforElectricalandGasSupplyandSafety
HavingaFrameworkforCooperationamongAgenciesandAssociationsinRegulatoryRelated Activities
LegalandRegulatoryFrameworkforOpenAccesstoGasNetwork
EstablishmentofRegulatoryFrameworkforElectricityMetering
Implementing Initiatives for Increasing the Reliability of the Electricity Supply Industry in Sabah
wayforward

137
Year Initiative Status
2013
OperationalisingtheRegulatoryFrameworkforOpenAccesstoGasNetwork
TrialImplementationofIBR-Gas
TrialImplementationofIBR-Electrical
SBRegulationandFencingofSBandGSOFunction
CompetitiveBiddingforNewCapacity
NationalElectricitySupplyandDemandForecastFramework
ContinuationoftheDevelopmentofIndustryCodeofPracticeandGuidelines
DevelopmentofPolicyandLegalFramework
Implementation of Industry Studies
2014ImplementationofCompetitiveBiddingandDevelopmentPlanbyRing-FencedSB
Initial Implementation of IBR-Electrical
2015 Implementation of IBR-Gas
2016- 2019
DevelopmentofRegulatoryandLegalFrameworkforCompetitiveEnergyMarket
EstablishmentofElectricalMarketAuthority
2020 OperationalisingLiberalmarket
Legend: Complete In Implementation Not Started

AN
NU
AL
REP
OR
T 20
12138
CORPORATE DEVELOPMENT PLAN
TheThirdSubPlan that is,CorporateDevelopmentPlancovers29key initiativesand isaimedatstrengthening thecapabilityof
theorganisationand isdivided into3main focus,namelyhumanresourcedevelopment, re-engineeringofbusinessprocessand
increasing financial sustainability. For the year 2012, 22% of these initiatives have been completed, while 78% were still in progress.
RATIONALISATION PLAN FOR REGULATORY FRAMEwORk
ThesecondsubplanthatisRationalisationPlanforRegulatoryFrameworkcontains23majorinitiativesandaimsatoptimisingthe
use of organisational resources. 61% of these initiatives involve either outsourcing the activities or the realignment of organisational
functions with other relevant regulatory agencies. 39% of it are initiatives and new function that have been implemented by the
organisation.
Functions Implemented by the Institutions/Industry and Monitored by ST Status
Electrical Competency Examination by Institutions
Endorsement of Electrical Equipment Test Reports
MonitoringofElectricalEquipmentMarket
Capacity Planning
CompetitiveBidding
Approval Process to Install and Approval to Operate Gas Pipes (ATI and ATO)
Promotional Activities
Realignment of Functions with the other Related Regulatory Agencies
Energy Efficiency and Renewable Energy Incentives Processing
Renewable Energy Activities
Accident Investigation
Fire Investigation
Electricity and Gas Theft
Contractor Registration
Cancellation of Functions
Registration of Licensed Installations
New Functions Implemented by ST
CompetitiveBidding
IBR-ElectricityandGas
Malaysia Energy Information Hub (MEIH)
RegulationofTPA-Gas
Registration of Energy Service Company (ESCO)
Promotion and Legislation related to Energy Efficiency
CheckingandApprovalofElectricalMeters
NationalGasTaskForceOperation
Registration of Test Laboratories, Manufacturers and Importers of Electrical Equipment
wayforward (continued)

139
Year Initiative Status
Human Resource Development
2010 Organisational Restructuring
2011DevelopmentofHumanCapitalManagementFramework
Review of Terms and Conditions of Services
Implementation of on Line Performance Management
2012DevelopmentofHumanCapitalManagement
RedistributionofHumanResourcesBasedonPriorities
2013DevelopmentofReplacementPlanningProgramme
Establishment of Information Management System
DevelopmentofSTLearningCentrePlan
2014 Establishment of ST Learning Centre
2015 Review of Terms and Conditions of Services
Process Re Engineering
2011
Rationalisation of Head Office and Regional Office Functions
Computerisation of Processes
Customer Charter Review
Centralising of Acquisition Process
Outsourcing of Event Management
2012
ImplementationofOnlineBankingandOnlinePayment
Outsourcing of Salary Process
DevelopmentofICTMasterPlan
Monitoring of Compliance to Customer Charter
Outsourcing of Law Services
Upgrading ICT Security System
2013
Review of Complaints Management
DataCentreVirtualisation
DevelopmentofStrategicCommunicationsFramework
Online Payment Implementation
2014 Review of Organisational Structure and Human Resource Requirements
Upgrading Finance Sustainability
2011 Review of Financial Plan
2012 Review of Licence and Certification Fees and Charges
Legend: Complete In Implementation Not Started

140

141
Financial Statements

AN
NU
AL
REP
OR
T 20
12142
financialstatements

143
AN
NU
AL
REP
OR
T 20
12144
financialstatements (continued)

145
STATEMENT OF INCOME AND EXPENDITUREFORTHEYEARENDED31DECEMBER2012
Note 2012 2011
RM RM
Revenue
Fees and Charges 3 63,378,691 61,775,403
Interest Income 5,917,193 4,965,326
Other Income 582,243 83,998
69,878,127 66,824,727
Expenditure
Staff Cost 4 29,154,368 22,587,993
Administration Expenses 17,765,069 16,301,448
Depreciation 839,392 739,477
Other Operating Expenses 270,576 336,621
48,029,405 39,965,539
Surplus Before Taxation 5 21,848,722 26,859,188
Taxation 6 (1,442,955) (1,300,716)
Surplus For The Year 20,405,767 25,558,472
Energy Commission has no profit and loss other than the surplus net income for the current financial year.

AN
NU
AL
REP
OR
T 20
12146
Nota 2012 2011
RM RM
Property, Fittings and Equipment 7 93,860,092 94,332,617
Current Assets
Other Receivables 8 1,749,009 1,601,588
Cash and Cash Equivalents 9 210,703,788 187,717,422
212,452,797 189,319,010
Current Liabilities
Other Payables 10 8,634,290 6,542,440
Tax Payable 1,443,825 1,280,180
10,078,115 7,822,620
Net Current 202,374,682 181,496,390
296,234,774 275,829,007
Financed by:-
Accumulated Funds 296,234,774 275,829,007
BALANCE SHEETASAT31DECEMBER2012
financialstatements (continued)

147
STATEMENT OF ACCUMULATED FUNDSASAT31DECEMBER2012
2012 2011
RM RM
At 1 January 275,829,007 248,899,018
SurplusBeforeTaxation 21,848,722 26,859,188
Taxation (1,442,955) (1,300,716)
Adjustment of Accumulated Funds — - 1,371,517
At31December 296,234,774 275,829,007

AN
NU
AL
REP
OR
T 20
12148
STATEMENT OF CASH FLOw FORTHEYEARENDED31DECEMBER2012
2012 2011
RM RM
Cash Flows from Operating Activities
SurplusIncomeBeforeTax 21,848,722 26,859,188
Adjustmentfor:-
Accumulative Funds — - 1,371,517
Interest Income (5,917,193) (4,965,326)
Depreciation 839,392 739,477
OperatingSurplusBeforeWorkingCapitalChanges 16,770,921 24,004,856
WorkingCapitalChanges:
Other Receivables (147,421) 602,014
Other Payables 2,091,850 2,000,181
18,715,350
Cash Generated from Operating Activities 26,607,051
Income Tax Paid (1,279,310) (1,033,349)
Net Cash from Operating Activities 17,436,040 25,573,702
Cash Flow from Investing Activities
Purchase of Property, Fitting and Equipment (366,867) (1,722,260)
Interest income received 5,917,193 4,965,326
Net Cash from Investing Activities 5,550,326 3,243,066
NetIncrease/(Decrease)inCashandCashEquivalent 22,986,366 28,816,768
CashandCashEquivalentattheBeginingoftheYear 187,717,422 158,900,654
Cash and Cash Equivalent at the End of the Year 210,703,788 187,717,422
Cash and Cash Equivalent Consists of:
CashandBankBalance 9,036,058 5,936,061
DepositwithLicensedBanks 201,667,730 181,781,361
210,703,788 187,717,422
financialstatements (continued)

149
NOTES TO FINANCIAL STATEMENT
1. Principal Activities
The Energy Commission is a statutory body operating at No.12, Jalan Tun Hussein, Precinct 2, 62100 Putrajaya.
Energy Commission is the sole regulatory agency for the monitoring and development of the energy sector. The Energy Commission
is directly responsible for supervising and monitoring energy generation activities, which includes regulating each licensed person
under the Energy Commission Act, 2001.
2. Significant Accounting Policies
The following accounting policies have been adopted by the Energy Commission and remain consistent with the policies adopted in
the previous year.
(a) Basis of Accounting
The financial statements were prepared under the historical cost convention and in compliance with approved accounting
standards for private entities in Malaysia.
(b) Property, Fitting and Equipment and Depreciation
Property, fitting and equipment are stated at cost less accumulated depreciation and impairment, if any.
Depreciationofproperty,fittingandequipmentaredepreciatedonastraight-linebasisontheestimatedusefullifeofthe
asset. Property, fitting and equipment under construction are not depreciated until the said asset are fully handed over.
The annual rates of depreciation are as follows:
Office equipment 15%
Application systems and computers 33 1/3%
Motor vehicles 20%
Furniture, fittings and renovations 20%
The residual values, useful life and depreciation method are reviewed at each financial year end to ensure the amount,
method and period of depreciation are consistent with previous estimates and expected pattern of consumption of the future
economic and benefits embodied in the items of property, fitting and equipment.
(c) Receivables
Other receivables are stated at cost and deduction for doubtful debts, if any.
(d) Cash and Cash Equivalents
Cashandcashequivalentscompriseofcashandbankbalances includingfixeddepositswith licensedbanks,whichhigh
liquidityrateswithinsignificantrisksofchangesinvalue.

AN
NU
AL
REP
OR
T 20
12150
2. Significant Accounting Policies (continued)
(e) Payables
Other payables are stated at fair value to be paid for goods and services that had been received.
(f) Impairment
The carrying amount for the Energy Commission’s assets and financial assets are reviewed at each balance sheet date
to determine whether there is any indication of impairment. If any such indication of exist, the recoverable amount is
estimated.Animpairmentlossisrecognisedwheneverthecarryingamountofanasset’sorthecash-generatingunitto
which it belongs exceeds its recoverable amount. Impairment losses are recognised in the income statement unless the
asset is carried at a revalue amounts in which case the impairment loss is charged to equity.
Recoverable amount is the greatest of the asset’s net selling price and its value in use. In assesing value in use, estimated
futurecashflowsarediscountedtothepresentvalueusingapre-taxdiscountratethatreflectscurrentmarketassessment
ofthetimevalueofmoneyandtheriskstotheasset.Foranassetthatdoesnotgeneratelargelyindependentcashflows,
therecoverableamountisdeterminedforthecash-generatingunittowhichtheassetbelongs.
In respect of other assets, an impairment loss is reversed if there has been a change in the estimates used to determine
the recoverable amount.
An impairment loss is reversed only to the extent that the asset’s carrying amount does not exceed the carring amount that
would have been determined, net of depreciation or amortisation, if no impairment loss had been recognised. The reversal
isrecognisedinthestatement,unlessitreversesandimpairmentlossontoarevalueasset,inwhichcaseitistakento
equity.
(g) Taxation
Tax on the income statement for the year comprises current and deferred tax. Income tax is recognised in the income
statement except to the extent that is relates to items recognised directly in equity, in which case is recognised in equity.
Current tax expenses is the expected tax payable on taxable income for the current year, using tax rates enacted or
substantially enacted at the balance sheet date, and any adjustment to tax payable in respect of previous years.
Deferredtaxisprovided,usingtheliabilitymethod,ontemporarydifferencesaraisingbetweenthetaxratebasesofassets
and liabilities and their carrying amounts in the financial statements. Temporary differences are not recognised for goodwill
not deductible for tax purposes, and the initial recognition of assets or liabilities that at the time of transaction, affects
either accounting nor taxable profit. The amount deferred tax provided is based on the expected manner of realisation or
settlement of the carrying amount of assets and liabilities, using tax rate enacted or substantially enacted at the balance
sheet date.
financialstatements (continued)

151
2. Significant Accounting Policies (continued)
(g) Taxation (continued)
A deferred tax asset is recognised only to the extent that is probable that future taxable profits will be available against
which the asset can be utilised.
(h) Employee Benefits
i) Short-term employee benefits
Wages, salaries and bonuses are recognised as an expenses in the year in which the associated services are
rendered by the employees of Energy Commission. Short term accumulating compensated leaves such as paid
annual leave are recognised when services are rendered by employees that increase their entitlement for the
futurecompensatedleaveandshorttermnon-accumulatingleavesuchassickleavearerecognizedwhenleave
occur.
ii) Defined contribution plan
According to the law, qualified employers in Malaysia are obliged to contribute a fixed contribution to the Employees
Provident Fund. The contributions towards defined contribution plans are recognised as expenses in the income
statement. Liability for the defined contribution plan is recognised as current expenses in the income statement.
(i) Recognition of Income and Expenses
Income from fees and charges are calculated on cash basis which are considered cash in view of licence holders’
responsibilitytomakeannualpayment.Meanwhile,interestincomeandallexpensesarerecognisedonaccrualbasis.
3. Fees and Charges
2012 2011
RM RM
Private and Public License 46,167,057 45,571,801
Registration/Renewal of Operating Fee 14,813,305 14,025,255
Other Operating Fees 2,398,329 2,178,347
63,378,691 61,775,403

AN
NU
AL
REP
OR
T 20
12152
financialstatements (continued)
4. Staff Cost
2012 2011
RM RM
Salary,AllowanceandotherFinancialBenefits 23,448,092 18,037,010
Statutory Contribution 3,225,455 2,444,435
Travel and Subsistence Cost 2,480,821 2,106,548
29,154,368 22,587,993
Included in the Statutory Contribution is contribution to the Employee Provident Fund of RM3,090,737 (2011:RM2,329,119)
andcontributiontoPERKESO/SOCSORM134,718(2011:RM115,316).ThenumberofemployeeoftheEnergyCommissionat31
December2012is274(2011:262persons).
5. Surplus Before Taxation
Thefollowingamountswereincludedinobtainingthesurplusbeforetaxation:-
2012 2011
RM RM
Employee Cost (Note 4) 29,154,368 22,587,993
Audit Fee 18,150 16,500
Professional and Consultant Fee 8,664,916 6,311,277
Association Membership 18,259 21,174
CostofDevelopmentandPerformanceManagement 384,039 544,539
Hospitality, Communication and Utility Cost 1,951,071 1,990,437
SystemDevelopmentandMaintenanceCost 1,755,716 1,319,752
MaintenanceofEquipmentandOfficeBuilding 1,955,815 2,397,573
Printing and Office Supplies 901,036 1,555,775
Rental of Office and Facilities 1,985,040 2,018,040
DepreciationofProperty,FittingandEquipment(Note7) 839,392 739,477
ContributionstoResearch,SponsorshipsandDevelopment 270,576 336,621
Other expenses 131,027 126,380

153
6. Taxation
2012 2011
RM RM
Tax Expenses
-Currentyear 1,443,825 1,300,716
-Over/underprovisionfromprioryears (870) —-
Total 1,442,955 1,300,716
Reconciliation of Effective tax rate adjustment
Surplus before tax 21,848,722 26,859,188
Tax rate at 26% 5,680,668 7,251,980
Tax Exemption Income (4,236,843) (5,951,264)
1,443,825 1,300,716
Over provision from prior years (870) — -
Tax Expenses 1,442,955 1,300,716
The Energy Commission obtained income tax exemption under Section 127(3)b Income Tax Act 1967 as given by the Ministry of
Finance on 19 October 2004. The exemption applies on statutory income as follows:
i. income received from the Federal Government or State Government in the form of grant or subsidies;
ii. income received in connection with any amount chargeable or collectable from anybody or person under the Act, which govern
the statutory body; and
iii. donations or contributions received.
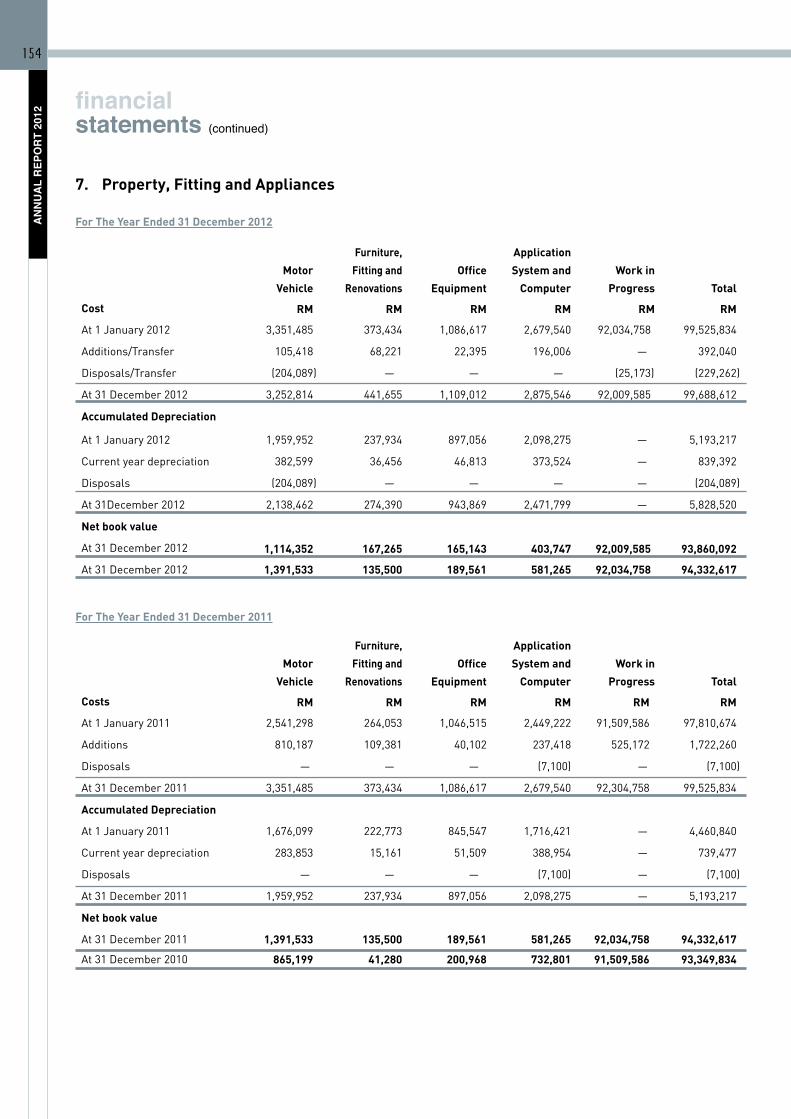
AN
NU
AL
REP
OR
T 20
12154
7. Property, Fitting and Appliances
For The Year Ended 31 December 2012
Motor
Vehicle
Furniture,
Fitting and
Renovations
Office
Equipment
Application
System and
Computer
work in
Progress Total
Cost RM RM RM RM RM RM
At 1 January 2012 3,351,485 373,434 1,086,617 2,679,540 92,034,758 99,525,834
Additions/Transfer 105,418 68,221 22,395 196,006 — - 392,040
Disposals/Transfer (204,089) — - — - — - (25,173) (229,262)
At31December2012 3,252,814 441,655 1,109,012 2,875,546 92,009,585 99,688,612
Accumulated Depreciation
At 1 January 2012 1,959,952 237,934 897,056 2,098,275 — - 5,193,217
Current year depreciation 382,599 36,456 46,813 373,524 — - 839,392
Disposals (204,089) — - — - — - — - (204,089)
At31December2012 2,138,462 274,390 943,869 2,471,799 — - 5,828,520
Net book value
At31December2012 1,114,352 167,265 165,143 403,747 92,009,585 93,860,092
At31December2012 1,391,533 135,500 189,561 581,265 92,034,758 94,332,617
For The Year Ended 31 December 2011
Motor
Vehicle
Furniture,
Fitting and
Renovations
Office
Equipment
Application
System and
Computer
work in
Progress Total
Costs RM RM RM RM RM RM
At 1 January 2011 2,541,298 264,053 1,046,515 2,449,222 91,509,586 97,810,674
Additions 810,187 109,381 40,102 237,418 525,172 1,722,260
Disposals — - — - — - (7,100) — - (7,100)
At31December2011 3,351,485 373,434 1,086,617 2,679,540 92,304,758 99,525,834
Accumulated Depreciation
At 1 January 2011 1,676,099 222,773 845,547 1,716,421 — - 4,460,840
Current year depreciation 283,853 15,161 51,509 388,954 — - 739,477
Disposals — - — - — - (7,100) — - (7,100)
At31December2011 1,959,952 237,934 897,056 2,098,275 — - 5,193,217
Net book value
At31December2011 1,391,533 135,500 189,561 581,265 92,034,758 94,332,617
At31December2010 865,199 41,280 200,968 732,801 91,509,586 93,349,834
financialstatements (continued)

155
7. Property, Fitting and Appliances (continued)
Work InProgress is theHeadOfficeBuildingof theEnergyCommissionatPersint2,PutrjayaworthRM95,186,596.Thefinal
payment will be paid in year 2013 amounting to RM3,177,011. The ownership of the building will be fully transferable to the Energy
Commission in the year 2013.
8. Other Receivables
2012 2011
RM RM
Staff Advances 8,800 3,150
AccruedInterestFixedDeposit 1,421,850 1,273,589
DepositofRentalandParking 227,359 233,849
ClubMembershipDeposit 91,000 91,000
TOTAL 1,749,009 1,601,588
9. Cash and Cash Equivalents
2012 2011
RM RM
CashandBankBalance 9,036,058 5,936,061
DepositswithLicensedBanks 201,667,730 181,781,361
TOTAL 210,703,788 187,717,422
10. Other Payables
2012 2011
RM RM
Other Payables 6,745,311 3,823,310
Malaysian Electricity Supply Industries Trust Account 1,161,443 2,164,843
(MESITA)/(AAIBE)*
Cash Award in Lieu of Accumulated Leave 692,886 537,787
Audit Fee 34,650 16,500
TOTAL 8,634,290 6,542,440
* Otherpayables forAAIBE is the fundgivenby theMinistryEnergy,GreenTechnologyandWater (KeTTHA) to theEnergy
Comissionforthepurposeofpurchasingthedataloggersandconsultationserviceofthe“PowerQualityBaselineStudy”in
Peninsular Malaysia.

AN
NU
AL
REP
OR
T 20
12156
11. Capital Commitment
2012 2011
Property, Fitting and Equipment RM RM
Approved and contracted 261,783 105,417
financialstatements (continued)