Energy Benchmark Results District of Columbia Public ...
25
Energy Benchmark Results District of Columbia Public Buildings FY 2009 Office of Policy and Sustainability District Department of the Environment Nov. 30, 2010
Transcript of Energy Benchmark Results District of Columbia Public ...

Energy Benchmark Results District of Columbia Public Buildings
FY 2009
Office of Policy and Sustainability District Department of the Environment
Nov. 30, 2010

Energy Benchmark Results - District of Columbia Public Buildings: FY 2009 DDOE
Energy Benchmark Results District of Columbia Public Buildings: FY 2009
A major portion of energy use in the District of Columbia is tied to the operations of buildings. The District’s Inventory of Greenhouse Gas Emissions found that buildings are responsible for 75% of the greenhouse gas emissions within the District of Columbia. Further, energy utility costs such as purchases of electricity and natural gas account for a significant part of buildings’ operating budgets. Understanding and managing buildings energy use is key to managing their environmental impact and to reducing building operations budgets. The District is taking a proactive approach to reducing energy use and its related consumption of fossil fuels in public and private buildings. The Green Building Act of 2006 (GBA) and the Clean and Affordable Energy Act of 2008 (CAEA) establish legislative requirements for buildings’ environmental performance. As mandated by the GBA and the CAEA, the District is benchmarking energy use in public buildings 10,000 square feet (sq ft) in size or larger starting with Fiscal Year 2009 (FY 2009: Oct. 1, 2008 – Sept. 30, 2009). The benchmarking tool selected for District benchmarking is ENERGY STAR Portfolio Manager (Portfolio Manager). District Use of ENERGY STAR Portfolio Manager
The ENERGY STAR Portfolio Manager software tool was created by the U.S. Environmental Protection Agency (EPA) to help building owners track and manage energy use in their buildings. Portfolio Manager is the national industry standard for benchmarking energy performance in commercial buildings, and also has applications for building types such as schools and libraries in the pubic sector. Building owners can benchmark the energy performance of their buildings by entering utility information (typically electricity and natural gas usage) and building characteristics such as size, hours of operation and occupancy into the Portfolio Manager software tool. Portfolio Manager calculates a key benchmark figure: energy use intensity per square foot (EUI) in kBTU*/sq ft, for a building over a select period of time. Arriving at an EUI makes it possible to compare its energy use to previous periods, to other buildings within a portfolio, and to similar buildings nationwide (energy use intensity data is weather-normalized). The average EUI for libraries nationwide, for example, is 246 kBTU/sq ft, very close to the District’s average EUI of 250 kBTU/sq ft for its library buildings. The EUI measure takes into account only a building’s size and energy use, and a limited number of other physical characteristics. The number of occupants and hours of operation are not taken into account. The District, like EPA, uses “source” energy use information for comparison, which accounts for the total amount of raw fuel that is required to operate the building. It incorporates all transmission, delivery, and production losses, thereby enabling a complete assessment of energy efficiency in a building. * kBtu/sf represents 1,000 British thermal units per square foot, and is a standard conversion measure for various types of energy such as electricity and natural gas that may need to be compared or considered together.
2

Energy Benchmark Results - District of Columbia Public Buildings: FY 2009 DDOE
National EUI averages are established by the US Department of Energy’s Energy Information Administration Commercial Building Energy Consumption Survey (CBECS). EPA also has established an energy rating score for a number of building types such as office buildings, schools, and warehouses, on a 0 to 100 scale. These “ratable” buildings have a larger sample of buildings to be compared against nationally, and the rating takes into account more detailed building information including the number of occupants and operating hours. The energy rating score offers a more finely tuned result that takes into account how a building is used. An energy rating score of 50 designates a building that performs at exactly the national average for its type, with 50% of buildings performing better and 50% performing more poorly for energy use. Building owners whose buildings earn an energy rating score of 75 or above can earn the ENERGY STAR label, indicating that they are in the top 25th percentile for energy performance nationwide. The Reeves Center complex, for example, has an energy rating score of 65, placing it well above the national average for office buildings but not efficient enough in its energy use to earn an ENERGY STAR label. Local municipal buildings such as those in the District portfolio are quite different from the large, newer commercial buildings typically benchmarked with Portfolio Manager. A community center, for example, may include multiple uses such as gathering spaces, computer labs, training rooms, and kitchens with or without refrigerators. It may, like a school, combine an array of after-school activities ranging from library operations to boys and girls clubs. Such complex and rich uses in buildings made the Portfolio Manager benchmark process more lengthy and cumbersome, but District staff was able to arrive at reasonable results for most buildings. Some municipal buildings, such as the DC Armory, police training centers, fueling stations, fleet maintenance facilities and the DC Jail do not have categories or national averages under Portfolio Manager. These were incorporated into a “Warehouses and Other” category which includes EUI numbers but no comparisons. Benchmark results will be followed up with building condition assessments and energy audits to reach more comprehensive results for energy efficiency. FY 2009 Public Buildings Benchmark Results
The District launched the annual benchmarking of its public buildings with FY 2009 following an FY 2008 pilot phase. In all 194 public buildings were benchmarked. Benchmark results for FY 2009 show that overall, public buildings in the District of Columbia perform below average compared to similar buildings nationwide. Libraries and office buildings perform at just below the national average, while District police stations use 2.5 times more energy than their counterparts nationwide. The District’s recreation buildings and community centers also use approximately 2.5 times more energy than similar facilities nationwide. District fire stations use about 60% more energy than average. Data from the District’s schools remains incomplete. However, initial benchmark results show a public schools building portfolio that is in the 29th percentile among schools nationwide for energy performance.
3

Energy Benchmark Results - District of Columbia Public Buildings: FY 2009 DDOE
ENERGY STAR Benchmark ResultsDistrict Public Buildings (Ratable)
Energy Rating Scores 0 to 100
0 20 40 60 80 100
Office
School
National Avg. Rating DC Avg. Rating
ENERGY STAR Benchmark ResultsDistrict Public Buildings (Non‐Ratable)
Energy Use Intensity (EUI)
0 50 100 150 200 250 300 350 400 450
Library
Parks & Recreation
Police Station
Fire Station
Other
DC Average (kBtu/SF) National Average (kBtu/SF)
As seen in the two graphs above, FY 2009 benchmarking of District buildings reports energy performance using an energy rating score of 0 to 100 for office buildings and schools, and the less precise but useful EUI measure for “non-ratable” buildings including libraries, parks and
4

Energy Benchmark Results - District of Columbia Public Buildings: FY 2009 DDOE
recreation facilities, fire stations, police stations, and “other” various building types. FY 2009 benchmarking results of public buildings highlight many opportunities for energy improvement as well as the need for more accurate data and performance tracking of buildings overall. Some District public buildings, especially schools and parks and recreation facilities, do not have readily available information about building characteristics, operating schedules, and occupancy. Building-specific utility meter information is not always available. District staff is working to update and refine buildings information for FY 2010 benchmarking. FY 2009 Public Buildings Benchmark Results by Building Type
The FY 2009 public buildings benchmark process provided comprehensive benchmark information for a variety of building types within the District’s portfolio. This section provides benchmark information on the following building types:
• District Office Buildings • District Police Stations • District Fire Stations • District Libraries • District Parks and Recreation Buildings • District Public Schools • District Warehouses and Other Facilities
In accordance with GBA and CAEA requirements, the District Department of the Environment requested energy benchmark data from the University of the District of Columbia, the Walter E. Convention Center, and DC Water. Additionally, the Washington Metropolitan Area Transit Authority (WMATA) voluntarily benchmarked three of its facilities located in the District of Columbia. Results from this query will follow. Office Buildings The District has seven government office buildings that are 10,000 square feet or larger and for which consistent data was available for FY 2009. Portfolio Manager provides an energy rating score of 0 to 100 for benchmarked office buildings, making it possible to compare a building’s energy performance to that of others around the country based on building characteristics as well as use. A rating score of 50 indicates a building that performs at the national average. Average energy use intensity (EUI) per square foot is also available.
5
Energy Benchmark Results - District of Columbia Public Buildings: FY 2009 DDOE
District Office Buildings Benchmark Results Energy Rating Scores (0 ‐ 100)
0
1020
30
40
5060
70
80
John A. Wilson Building
Grimke Building
Frank D. Reeves Center
Henry Daly Building
One Judiciary Square
Recorder of Deeds
DPR Headquarters
Current Rating National Average 1‐100 Rating
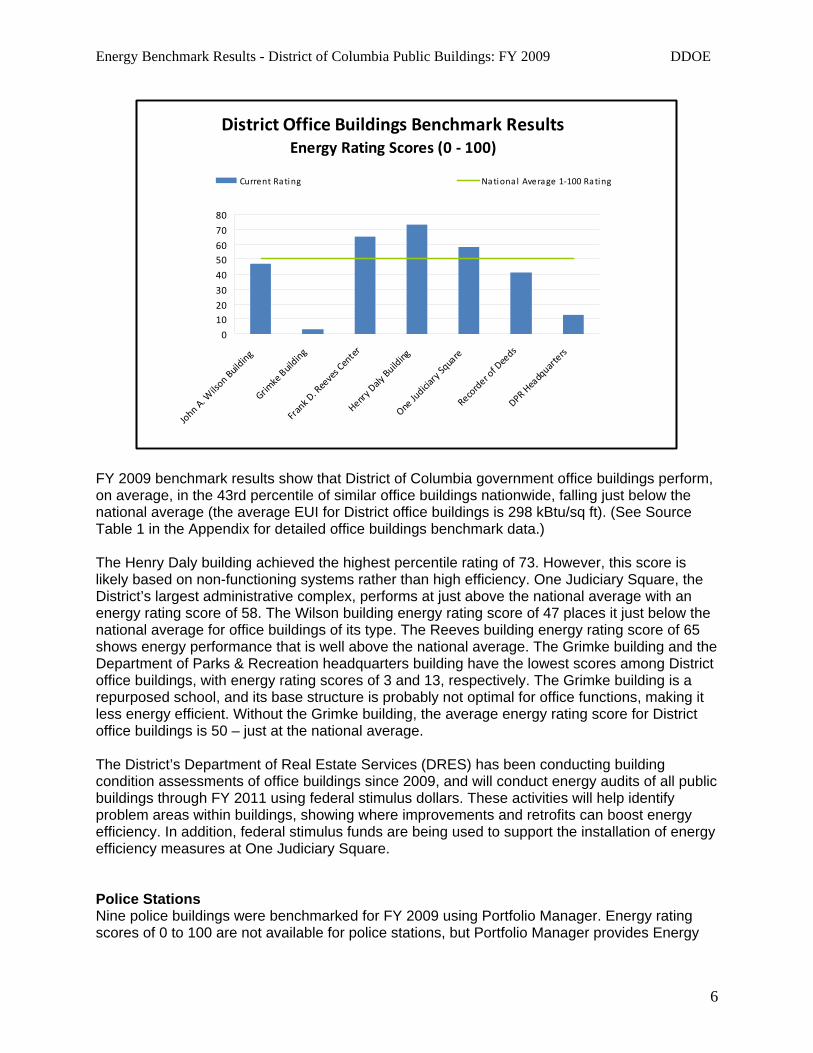
FY 2009 benchmark results show that District of Columbia government office buildings perform, on average, in the 43rd percentile of similar office buildings nationwide, falling just below the national average (the average EUI for District office buildings is 298 kBtu/sq ft). (See Source Table 1 in the Appendix for detailed office buildings benchmark data.) The Henry Daly building achieved the highest percentile rating of 73. However, this score is likely based on non-functioning systems rather than high efficiency. One Judiciary Square, the District’s largest administrative complex, performs at just above the national average with an energy rating score of 58. The Wilson building energy rating score of 47 places it just below the national average for office buildings of its type. The Reeves building energy rating score of 65 shows energy performance that is well above the national average. The Grimke building and the Department of Parks & Recreation headquarters building have the lowest scores among District office buildings, with energy rating scores of 3 and 13, respectively. The Grimke building is a repurposed school, and its base structure is probably not optimal for office functions, making it less energy efficient. Without the Grimke building, the average energy rating score for District office buildings is 50 – just at the national average. The District’s Department of Real Estate Services (DRES) has been conducting building condition assessments of office buildings since 2009, and will conduct energy audits of all public buildings through FY 2011 using federal stimulus dollars. These activities will help identify problem areas within buildings, showing where improvements and retrofits can boost energy efficiency. In addition, federal stimulus funds are being used to support the installation of energy efficiency measures at One Judiciary Square. Police Stations Nine police buildings were benchmarked for FY 2009 using Portfolio Manager. Energy rating scores of 0 to 100 are not available for police stations, but Portfolio Manager provides Energy
6

Energy Benchmark Results - District of Columbia Public Buildings: FY 2009 DDOE
Use Intensity (EUI) data that captures average energy use intensity per square foot in kBTU/sq ft. The EUI can be compared to a national average based on building type, size, and a limited number of other physical building characteristics. Benchmarking results for FY 2009 indicate extremely high energy use intensity in District police stations. The average EUI in police stations nationwide is 157 kBtu/sq ft, while the average in District police stations is 406 kBtu/sq ft – more than 2.5 times the national average. (See Source Table 2 in the Appendix for detailed police stations benchmark data.)
District Police Stations Energy Use Intensity (EUI)
0100200300400500600700800900
1000
MPD 1st D‐sub
MPD 2nd District
MPD 3rd D
Sub‐station
MPD 3rd District
MPD 4th District
MPD 5th District
MPD 6th District
MPD 7th D station
MPD ROC N
orth
Source Energy Intens i ty (kBtu/Sq. Ft.) Nationa l Average Source EUI
The Metropolitan Police Department (MPD) 2nd District headquarters showed the highest energy use at 900 kBtu/ sq ft – almost six times the national average. This facility is an older facility with inefficient lighting systems and no motion detection systems in the offices or meeting rooms. Heating, ventilation, and air conditioning (HVAC) systems are not maintained and work poorly. The MPD 7th District Station and MPD Regional Operations Command (ROC), North (now known as Patrol Services Security Bureau (PSSB)), use energy at closest to the national average, at just under 250 kBtu/sq ft. Like many District buildings, police stations have gone through several generations of use and alterations, and many basic improvements and updates have been deferred. (Police stations in the District may also have a different or more high-intensity use than stations in other parts of the country.) In FY 2011 the District will conduct energy audits to help identify problem areas and opportunities for improvement. Police stations are a high priority target group for energy and building retrofits pending funding availability. Fire Stations Twenty fire stations and the FEMS Ready Reserve building were benchmarked for FY 2009 using Portfolio Manager. Energy rating scores of 0 to 100 are not available for fire stations, but Portfolio Manager provides Energy Use Intensity (EUI) data that captures average energy use
7

Energy Benchmark Results - District of Columbia Public Buildings: FY 2009 DDOE
intensity per square foot in kBTU/sq ft. The EUI can be compared to a national average based on building type, size, and a limited number of physical building characteristics.
District Fire Stations Energy Use Intensity (EUI)
0
50
100
150
200
250
300
350
400
Engine Co. 1
Engine Co. 11
Engine Co. 12
Engine Co. 13
Engine Co. 15
Engine Co. 16
Engine Co. 18
Engine Co. 2
Engine Co. 20
Engine Co. 21
Engine Co. 24
Engine Co. 3
Engine Co. 31
Engine Co. 32
Engine Co. 33
Engine Co. 4
Engine Co. 6
Engine Co. 7
Engine Co. 8
Engine Co. 9
Ready Reserve building
Source Energy Intens ity (kBtu/Sq. Ft.) Nationa l Average Source EUI
FY 2009 benchmark results for fire stations show high energy use intensity. The average EUI for District fire stations is 254 kBtu/sq ft, 60% above the national average of 157 kBtu/sq ft. Engine Company numbers 12 and 13 show the highest energy use at 351 and 349 kBtu/sq ft respectively. Engine Company 2 showed the lowest energy use intensity with an EUI of 158 kBtu/sq ft or almost exactly at the national average. Just behind in energy performance were Engine Company numbers 21 and 16, with energy use of 164 and 171 kBTU/sq ft, respectively. (See Source Table 3 in the Appendix for detailed fire stations benchmark data.) Like many District buildings, fire stations have gone through several generations of use and alterations, and many basic improvements and updates have been deferred. The average age of fire stations in the District is 60 years old, with some being over 100 years old. FEMS has initiated a “Buff, Scrub and Green” program to make fire stations more energy efficient. This program includes replacement of light fixtures, installation of motion sensors and installation of new, energy efficient windows and doors. In FY 2011 the District Department of Real Estate Services will conduct energy audits to help further identify problem areas and opportunities for improvement. Major station renovations and new construction projects will incorporate rigorous energy performance standards and USGBC LEED design standards. Libraries Twelve libraries were benchmarked for FY 2009 using Portfolio Manager. Energy rating scores of 0 to 100 are not available for libraries, but Portfolio Manager provides Energy Use Intensity (EUI) data that captures average energy use intensity per square foot in kBTU/sq ft. The EUI
8

Energy Benchmark Results - District of Columbia Public Buildings: FY 2009 DDOE
can be compared to a national average based on building type, size, and a limited number of other physical building characteristics. Benchmarking results for FY 2009 show that the District’s libraries perform at about the national average. The EUI average for libraries nationwide is 246 kBtu/sq ft. The average EUI for District libraries is 250 kBtu/sq ft. Cleveland Park Library shows the lowest EUI at 81 kBtu/sq ft. The highest EUIs are shown at Lamond-Riggs and Martin Luther King Jr. libraries, at 341 kBtu/sq ft and 334 kBtu/sq ft, respectively. Martin Luther King Jr. Library is the single highest user of energy among District libraries, accounting for about 75% of the District libraries’ energy budget for FY 2009. At 400,000 square feet it is also the largest library facility in the District of Columbia. District staff plans to review energy data for Cleveland Park Library, as the library’s building type and operating hours would not suggest such a low EUI.
District Libraries Energy Use Intensity (EUI )
0
50
100
150
200
250
300
350
400
Capital View Library
Chevy Chase Library
Cleveland Park Library
Lamond‐Riggs Library
Martin Luther King Jr. Library
Northeast Library
Palisades Library
Petworth Library
Shepherd Park Library
South W
est Library
West End Library
Woodridge Library
Source Energy Intens ity (kBtu/Sq. Ft.) National Average Source EUI
(See Source Table 4 in the Appendix for detailed libraries benchmark data.) In FY 2011, the District will conduct energy audits to help identify problem areas and opportunities for improvement in existing libraries. A significant portion of the District’s library portfolio is undergoing major renovation and new construction projects are also underway. These projects will reflect new, more rigorous energy performance standards. Parks and Recreation Buildings Twenty-one parks and recreation buildings were benchmarked for FY 2009 using Portfolio Manager. Energy rating scores of 0 to 100 are not available for parks and recreation buildings, but Portfolio Manager provides Energy Use Intensity (EUI) data that captures average energy
9

Energy Benchmark Results - District of Columbia Public Buildings: FY 2009 DDOE
use intensity per square foot in kBTU/sq ft. The EUI can be compared to a national average based on building type, size, and a limited number of other physical building characteristics. Benchmarking results for FY 2009 show that the District’s parks and recreation buildings use about 2.5 times more energy than similar facilities nationwide. The EUI average for parks and recreation facilities nationwide is 136 kBtu/sq ft. The average EUI for District facilities is 341 kBtu/sq ft. The Anacostia Recreation Center, with an EUI of 511 kBtu/sq ft; the Turkey Thicket Recreation Center, with an EUI of 514 kBtu/sq ft; the Therapeutic Center with an EUI of 487 kBtu/sq ft; and the Takoma Recreation Center with an EUI of 470 kBTU/sq ft are the highest energy users among the facilities benchmarked in FY 2009. The Columbia Heights Community Center has the lowest EUI of 74 kBtu/sq ft, followed by the Benning Stoddert Recreation Center with an EUI of 121 kBtu/sq ft and the Banneker Recreation Center with an EUI of 157 kBtu/sq ft. These good results reflect recent renovations with energy efficiency improvements in those buildings. (See Source Table 5 in the Appendix for detailed parks and recreation buildings benchmark data.)
District Parks & Recreation Buildings Energy Use Intensity (EUI)
0
100
200
300
400
500
600
Anacostia Rec Ctr (Pool)
Banneker Rec Ctr
Benning Stoddert Rec Ctr
Chevy Chase Comm Ctr
Colum
bia Hgts Comm Ctr
Emery Rec Ctr
Fort Davis Rec Ctr
Harry Thomas Rec Ctr
Hillcrest Rec Ctr
Kennedy Rec Ctr
King Greenleaf Rec Ctr
Lamond Rec Ctr
Langdon Rec Ctr
North Michigan Park
Riggs Lasalle Rec Ctr
Sherwood Rec Ctr
Takoma Rec Ctr
Therapeutic Center
Trinidad Rec Ctr
Turkey Thicket Rec Ctr
Wm. Rumsey Aquatic Ctr
Source Energy Intens i ty (kBtu/Sq. Ft.) Nationa l Average Source EUI
Like many District buildings, parks and recreation facilities as well as community centers are often repurposed buildings and have gone through several generations of use and alterations. Many basic improvements and updates have been deferred. In FY2011 the District will conduct energy audits to help identify problem areas and opportunities for improvement. DC Public Schools DC Public Schools (DCPS) comprise the largest portion of the District’s public buildings stock, with 125 schools currently in the DCPS portfolio. They are also the District’s most challenging buildings group, both in terms of buildings quality and energy information. The Office of Public
10

Energy Benchmark Results - District of Columbia Public Buildings: FY 2009 DDOE
Education Facilities Modernization (OPEFM) is leading a major improvements and construction effort to improve the public schools building stock. For FY 2009, 106 school buildings had sufficient energy utility data and building information for benchmarking. Portfolio Manager provides a rating score of 0 to 100 for benchmarked school buildings, making it possible to compare a school building’s energy performance to that of others across the country based on building characteristics as well as use. A rating score of 50 indicates a building that performs at the national average. Average energy use intensity (EUI) per square foot is also available. (See Source Table 6 in the Appendix for detailed schools benchmark data.) Overall, the District public schools building portfolio ranked in the 29th percentile of schools in the U.S., indicating low performance for energy. (The average EUI for District school buildings is 207 kBtu/sq ft.) Benchmark results show a large number of extremely high and extremely low scores (0 to 5 and 95 to100), indicating likely problems with data accuracy. District staff estimates that about 50% of the benchmark results for schools merits further examination. Nevertheless, the overall measure of DCPS buildings’ energy performance is reasonable, pointing to both the need and an opportunity for improvement. Energy use in schools accounted for $30 million of the District’s $79 million facilities energy budget in FY 2009.
District Public School Buildings Benchmark ResultsEnergy Rating Scores (0 ‐ 100)
0
20
40
60
80
100
120
Barnard Elem
entary
Bell‐Lincoln Multi‐Cu
ltural
Birney Elementary
Deal Jr High
Eliot Jr High
Luke C M
oore Acade
my
Orr Elementary
Oyster Elem
entary
Park View Elementary
POWELL‐ELEM
ENTA
RY
Scho
ol W
ithou
t Walls
Shaed Elem
entary
Sharpe
Health
Ann
ex Charter
Slow
e Elem
entary
STODDERT‐ELEM
ENTA
RYWest Elementary
Brightwoo
d Elem
entary
Green
Elementary
Hearst Elementary
LaSalle Elementary
Stanton Elem
entary
Garnet P
atterson
Jr High
Marie Reed Elem
entary
Simon
Elementary
Sousa Jr High
Noyes Elemen
tary ‐ GA
Peabod
y Elem
entary
Ketcham Elementary
Thom
son Elem
entary
Cleveland Elem
entary
RANDLE‐HIGHLAND‐ELEMEN
TARY
Ronald Brown Jr High
Ludlow
‐Taylor Elem
entary
DUKE
‐ELLINGTO
N‐SR‐HIGH
Seaton
Elementary
Thom
as Elementary
Langdo
n Elem
entary
Plum
mer Elementary
Tubm
an Elementary
Hyde Elem
entary
Smothers Elementary
Truesdell Elementary
Leckie Elementary
Bunker Hill Elementary
Hendley Elementary
Kelly M
iller M
iddle
M.L. K
ing Elem
entary
Malcolm
X Elementary
Stua
rt‐Hob
son Jr High
Kenilworth Elementary
Takoma Educ
ation Center ( Elem
entary)
Hou
ston
Elementary
Ross Ann
ex
Gibbs Elementary
God
ing/Prospect Learning Center (E
lementary)
River Terrace Elem
entary
Raym
ond Elem
entary
Garfield Elementary
M C Terrell Elem
entary
Francis Jr High
Mam
ie D. Lee Schoo
l
Maury Elementary
Burrville Elementary
Emery Elem
entary
STEVEN
S‐ELEM
ENTA
RY
Garrison Elem
entary
H.D. Coo
ke Elementary
Lafayette Elem
entary
Hart Jr High
Harrison Elem
entary
Miner Elementary
Shadd Elem
entary
Whittier Elem
entary
Kimball Elem
entary
Woo
drow
Wilson
Sr High
Coolidge Sr High
Savoy Elem
entary
Shepherd Elementary
Mann Elem
entary
John
son Jr. H
igh
MacFarland Jr. H
igh
Watkins Elementary
Drew Elementary
Burrou
ghs Elem
entary
McG
ogney Elem
entary
S. M
ontgom
ery Elem
entary
Cardozo Sr High
Davis Elementary
Dou
glass Jr High
Current Rating
National Average 1‐100
OPEFM and agencies including DRES, DDOE, and DCPS are working to improve the overall quality of District public school buildings. OPEFM new construction and major renovation projects (modernizations) are designed and built to meet LEED for Schools certification standards. Less major renovations incorporate improvements for energy efficiency. The District is investing more than $11 million in federal stimulus funds to retrofit schools with energy and water conservation improvements. Warehouses and Other Facilities A significant portion of the District’s public buildings do not fall under typical ratable Portfolio Manager building categories. These types of buildings include warehouses, shelters, data
11

Energy Benchmark Results - District of Columbia Public Buildings: FY 2009 DDOE
centers, repurposed schools, fueling stations, maintenance shops, laboratories, corrections facilities, the DC Armory, and police and fire training centers. Often these facilities have unique, multiple, and unconventional uses that meet community needs but are not easily categorized. National average comparisons are generally not available. The “Warehouses and Other Facilities” group captures benchmark results for 18 of these buildings. Square footage for buildings in this grouping varies greatly, from the MPD Special Operations building at 10,530 sq ft to 449,295 sq ft at the DC Jail. Energy use intensity is equally varied, from 15 kBtu/sq ft at the Unified Communications Center and 17 kBtu/sq ft at a Bryant Street Department of Public Works facility to 962 kBtu/sq ft at the MPD Special Operations building (this facility was in the District’s portfolio for these FY 2009 report, but has recently been disposed of) and 1,454 kBtu/sq ft at the OCTO Warehouse and Data Center. (See Source Table 7 in the Appendix for detailed warehouse and other facilities benchmark data.)
Warehouses and Other FacilitiesEnergy Use Intensity (EUI)
0
200
400
600
800
1000
1200
1400
1600
CCNV Shelter
MPD First District (Bowen)
Central Maintenance Facility and Lab
Central Operations Building
Fueling Station
Southeast Tennis & Learning Ctr
OCTO Data Center and W
arehouse
Unified Communications Center
DC Armory
Walter E. Washington Convention Center
MPD Special Operations
MPD Youth Center
DPW Maintenance Shop
DPW Sweeper Storage
MPD Fleet M
aintenance
DC Records Center
Warehouse at 2200 Adams Place
DPR W
arehouse and FM
DC Jail
Source Energy Intens i ty (kBtu/Sq. Ft.)
Many of the buildings in this group have gone through several generations of use and alterations, and basic improvements have been deferred. In FY 2011, the District will conduct energy audits to help identify problem areas and opportunities for improving performance. Affiliated Public Agencies Benchmark Results University of the District of Columbia The University of the District of Columbia did not submit energy use data to DDOE for FY 2009.
12

Energy Benchmark Results - District of Columbia Public Buildings: FY 2009 DDOE
Convention Center The Walter E. Convention Center did not submit energy use data to DDOE for FY 2009. DC Water DC Water, formerly known as the DC Water and Sewer Authority (DC WASA), manages a series of diverse facilities including the Blue Plains Advanced Wastewater Treatment Plant and water pumping, sewer pumping, and storm water pumping facilities across the District. Two DC Water facilities were benchmarked for FY 2009: the Central Maintenance Facility and the Central Operations Facility. ENERGY STAR rating scores are not available for such multi-use buildings—which in this case include a combination of maintenance facilities, workshops, laboratories, a data center, and office space—but energy benchmarking using Portfolio Manager shows a source EUI of 830 kBtu/sq ft for the Central Operations Facility and a source EUI of 311 kBtu/sq ft for the Central Maintenance Facility. DC Water will undertake a detail analysis of the electrical services being provided from the Central Operations Facility to insure delineation of energy usage for process operations verses offices services and to improve energy efficiency, especially at the energy-intensive Central Operations Facility. Once a benchmarking protocol is developed for advanced wastewater treatment plants larger than 150 million gallons per day by EPA, it will be possible to benchmark Blue Plains Advanced Wastewater Treatment Plant, a 370 million gallon-per-day plant, against similar facilities across the country. DC Water is completing a comprehensive energy audit of all its major facilities and processes. The results of this audit will help guide DC Water in project investment and operations to continue improvements in energy efficiency. DC Water has improved the efficiency of its Blue Plains Advanced Wastewater Treatment Plant nitrification mixing process and aeration injection system saving more than 50 million kilowatt hours annually. As a part of its biosolids management program, DC Water will be constructing a Combined Heat and Power Plant that will operate primarily on biogas. It is estimated that more than 71 million kilowatts hours of energy will be generated annually when fully operational. A planned replacement of HVAC equipment and enhanced controls for the Central Operations Facility will yield additional energy savings. As upgrades to DC Water sewer and water pumping stations and piping systems continue to be implemented, energy efficiency is being realized. (See Source Table 8 in the Appendix for detailed DC Water benchmark data.) WMATA Volunteer Benchmark Data The Washington Metropolitan Area Transit Authority (WMATA) voluntarily benchmarked three facilities located within the District of Columbia. These include the Stone Straw building, the Jackson Graham building, and the Marlon Francisco Morales building—all office buildings. Portfolio Manager energy rating scores of 0 to 100 are available for these facilities, with a score of 50 indicating average performance among buildings of its type. The Stone Straw building showed an energy performance score of 31, Jackson Graham a score of 1—an extremely low performance score due possibly to an energy-intensive data center in the building—and the Marlon Francisco Morales building, completed a few years ago as a LEED Silver project—showed an energy rating score of 92, indicating excellent energy performance in the top ten percent of office buildings nationwide.
13

Energy Benchmark Results - District of Columbia Public Buildings: FY 2009 DDOE
Opportunities for Energy Improvement
Benchmark results for FY 2009—the first year that comprehensive energy benchmarking was undertaken by the District—show that overall, public buildings in the District of Columbia perform below average compared to similar buildings nationwide. This suggests many opportunities for saving energy through improvements. With an annual energy budget of $79 million for District buildings, even modest energy performance improvements can lead to significant budget savings. Energy performance can be improved in buildings through:
• Improvements to the core building and its systems • Facilities management that supports energy efficiency • Energy-wise behavior by building occupants
While transforming a large and varied set of buildings such as those owned by the District into an energy-efficient, high-performance building portfolio is a long-term project, building improvements are based on a handful of common-sense steps:
• Collect accurate energy performance information based on reliable building data • Identify specific building problem areas through building condition assessments,
submetering, energy audits, and permanent building monitoring systems • Assess and evaluate improvements costs based on performance and financial benefits
over time • Invest in strategic buildings improvements that produce best energy savings results for
money invested • Track building performance over time
For facilities that have already undergone building condition assessment, the District is undertaking low-cost improvements that have a track record of improving energy performance:
• Weatherization of buildings including insulation and sealing of air leaks • Replacement of inefficient lighting with efficient new lighting • De-lighting where lighting is redundant • Installation of motion sensors • Education of facilities staff and building occupants on common-sense energy
conservation, with incentives for individual and agency actions
In FY 2011, the District will conduct approximately 260 energy audits in public buildings to identify problem areas and opportunities for improvement. Over $1.8 million in federal stimulus dollars is being deployed for this purpose. The One Judiciary Square complex will be benefiting from $7.5 million in federal stimulus funds for a building monitoring system and energy efficiency measures. The District is working in cooperation with Pepco to install smart meters throughout the District public buildings system. Data Tracking Issues in Public Buildings
Many District public buildings, especially schools and parks and recreation facilities, do not have readily available information for building characteristics, operating hours, and number of
14

Energy Benchmark Results - District of Columbia Public Buildings: FY 2009 DDOE
occupants. This is especially true for older facilities that have gone through several generations of occupancy, without a central repository of building information. Some District buildings have broken meters or meters for which a building’s space use of energy is hard to determine. Portfolio Manager provides default values when certain space characteristics are not available, and these were used for some buildings in FY 2009 benchmarking. District staff is working to update and refine building information for FY 2010 benchmarking. Some buildings in the District’s portfolio appear to be efficient on paper, but upon closer examination reveal outdated, non-functioning lighting and HVAC systems, thus resulting in illusory energy efficiency. Energy audits will help to identify buildings for which this may be the case.
15

Energy Benchmark Results - District of Columbia Public Buildings: FY 2009 DDOE
Appendix: Source Data Tables for FY 2009 Benchmark Graphs
SOURCE TABLE 1
Office Buildings
District Office Facility
FY 2009 Energy Rating Score
Weather Normalized,
Source
Energy Use Intensity (EUI)
(kBtu/sq ft)
Total Floor Space
(sq ft)
Total GHG Emissions (MtCO2e)
Site Electric Use
(kWh)
Site Natural Gas
Use (therms)
Energy Cost US $
(per sq ft)
John A. Wilson Building 47 278 278,150 3,525 6,785,653 na $3.14
Grimke Building 3 490 46,100 1,042 1,779,450 22,038 $3.70
Frank D. Reeves Center 65 229 512,000 5,135 9,882,248 na $2.32
Henry Daly Building 73 212 576,544 5,561 10,700,096 na $3.57 One Judiciary Square 58 277 850,000 10,813 20,811,203 na $3.09 Recorder of Deeds 41 222 46,530 471 905,930 na $1.86 DPR Headquarters 13 376 13,600 232 377,188 6,721 $4.21
16

Energy Benchmark Results - District of Columbia Public Buildings: FY 2009 DDOE
SOURCE TABLE 2
Police Stations
District Police Facility
Weather Normalized,
Source
Energy Use Intensity (EUI)
(kBtu/sq ft)
Total Floor Space
(sq ft.)
Total GHG Emissions (MtCO2e)
Site Electric Use
(kWh)
Site Natural Gas Use (therms)
Energy Cost US $
(per sq ft)
MPD 1st District Sub Station 273 10,017 131 198,880 5,168 $3.67 MPD 2nd District Station 900 36,852 1,520 2,759,502 16,199 $4.62 MPD 3rd District Sub Station 297 13,793 194 238,400 13,228 $3.76 MPD 3rd District Station 544 38,852 972 1,708,800 15,713 $3.90 MPD 4th District Station 393 45,013 817 1,386,300 18,132 $4.27 MPD 5th District Station 370 36,888 635 1,045,920 16,360 $4.00 MPD 6th District Station 391 37,935 692 1,035,040 28,828 $4.52 MPD 7th District Station 248 43,190 492 868,050 7,705 $2.69 MPD ROC North 237 41,300 476 597,300 31,042 $3.18
17

Energy Benchmark Results - District of Columbia Public Buildings: FY 2009 DDOE
SOURCE TABLE 3
Fire Stations
District Fire Station
Weather Normalized,
Source
Energy Use Intensity (EUI)
(kBtu/sq ft)
Total Floor Space (sq ft)
Total GHG Emissions (MtCO2e)
Site Electric Use
(kWh)
Site Natural Gas Use (therms)
Energy Cost US $
(per sq ft)
Engine Co. 1 279 15,788 203 255,440 13,275 $3.17 Engine Co. 11 272 14,000 179 244,800 9,656 $3.54 Engine Co. 12 351 14,330 230 439,360 258 $3.10 Engine Co. 13 349 11,150 187 211,560 14,421 $4.98 Engine Co. 15 248 12,720 149 188,440 9,558 $2.88 Engine Co. 16 171 25,032 210 287,700 11,417 $2.44 Engine Co. 18 242 10,100 120 147,660 8,068 $4.31 Engine Co. 2 158 35,000 268 384,120 12,857 $2.19 Engine Co. 20 284 13,472 181 229,760 11,505 $3.41 Engine Co. 21 164 12,800 100 120,240 6,918 $2.22 Engine Co. 24 284 17,638 227 319,520 11,423 $3.57 Engine Co. 3 207 12,431 118 153,864 7,073 $2.39 Engine Co. 31 206 11,720 113 157,731 5,873 $2.09 Engine Co. 32 285 10,300 138 191,000 7,232 $3.52 Engine Co. 33 273 15,000 193 258,320 10,981 $2.99 Engine Co. 4 273 19,000 243 345,600 11,858 $2.91 Engine Co. 6 300 17,280 246 306,240 16,240 $3.57 Engine Co. 7 216 60,000 613 745,680 42,305 $3.06 Engine Co. 8 261 10,080 124 169,620 6,651 $3.17 Engine Co. 9 268 10,476 132 175,680 7,678 $3.38 Ready Reserve Building 63 16,442 50 42,580 5,246 $0.94
18

Energy Benchmark Results - District of Columbia Public Buildings: FY 2009 DDOE
SOURCE TABLE 4
Libraries
District Library Facility
Weather
Normalized, Source
Energy Use Intensity (EUI)
(kBtu/sq ft)
Total Floor Space
(sq ft)
Total GHG Emissions (MtCO2e)
Site Electric Use
(kWh)
Site Natural Gas Use (therms)
Energy Cost US $
(per sq ft)
Capital View Library 269 21,000 258 301,320 19,109 $3.00
Chevy Chase Library 232 24,618 272 380,280 14,032 $2.86
Cleveland Park Library 81 21,318 77 72,802 7,361 $1.99
Lamond‐Riggs Library 341 17,927 276 338,400 18,858 $2.89 Martin Luther King Jr. Library 334 400,000 6,098 11,736,752 0 $3.20
Northeast Library 316 13,900 206 292,160 10,119 $3.08
Palisades Library 198 20,110 188 244,800 11,371 $2.60
Petworth Library 276 19,304 250 347,040 13,052 $2.89
Shepherd Park Library 236 19,000 207 345,120 5,191 $2.53
South West Library 255 21,600 259 351,240 14,362 $2.71
West End Library 220 20,700 211 338,960 6,522 $2.72
Woodridge Library 238 20,812 248 268,480 20,244 $3.20
19

Energy Benchmark Results - District of Columbia Public Buildings: FY 2009 DDOE
SOURCE TABLE 5
Parks and Recreation Buildings
District Parks and Recreation
Facility
Weather Normalized,
Source
Energy Use Intensity (EUI)
(kBtu/sq ft)
Total Floor Space
(sq ft)
Total GHG Emissions
(MtCO2e)
Site Electric Use
(kWh)
Site Natural Gas Use
(therms)
Energy Cost US $
(per sq ft)
Anacostia Rec Ctr 511 11,643 273 385,691 13,651 $7.67
Banneker Rec Ctr 157 12,400 93 108,599 6,933 $1.99
Benning Stoddert Rec Ctr 121 12,180 65 1,423 12,102 $1.77
Chevy Chase Comm Ctr 374 13,947 234 246,092 20,006 $4.95
Columbia Hgts Comm Ctr 74 47,395 156 22,726 27,066 $0.81
Emery Rec Ctr 318 20,230 291 316,103 23,870 $3.88
Fort Davis Rec Ctr 413 13,555 255 490,855 na $3.74
Harry Thomas Rec Ctr 398 10,000 183 350,450 na $3.00
Hillcrest Rec Ctr 325 21,003 288 552,511 na $3.65
Kennedy Rec Ctr 284 17,500 226 333,481 9,947 $3.33
King Greenleaf Rec Ctr 323 28,890 425 754,527 6,156 $3.58
Lamond Rec Ctr 374 14,738 250 421,208 5,866 $3.12
Langdon Rec Ctr 348 22,206 353 560,791 11,529 $3.88
North Michigan Park 281 15,224 193 249,605 11,866 $3.44
Riggs Lasalle Rec Ctr 338 15,000 229 326,427 11,234 $3.82
Sherwood Rec Ctr 220 22,000 290 354,408 7,776 $2.55
Takoma Rec Ctr 470 43,900 944 1,124,766 67,576 $5.89
Therapeutic Ctr 487 28,861 657 963,426 29,366 $4.96
Trinidad Rec Ctr 218 20,600 204 309,770 8,045 $2.83
Turkey Thicket Rec Ctr 514 30,000 702 1,351,835 na $5.23
Wm. Rumsey Aquatic Ctr na 19,600 na na na $6.18
20

Energy Benchmark Results - District of Columbia Public Buildings: FY 2009 DDOE
SOURCE TABLE 6
DC Public Schools
District School Facility
FY 2009 Energy Rating Score
Weather Normalized,
Source
Energy Use Intensity (EUI)
(kBtu/sq ft)
Total Floor Space (sq ft)
Total GHG Emissions (MtCO2e)
Site Electric Use (kWh)
Site Natural Gas
Use (therms)
Energy Cost US $
(per sq ft)
Dunbar Senior High na na 343,400 na na na $2.48
Eastern Senior High na na 288,800 na na na $1.61
Eaton Elementary na na 49,100 na na na $2.38
Ferebee‐Hope Elementary na na 193,800 na na na $3.12
Fletcher‐Johnson Elementary na na 302,000 na na na $2.88
Hamilton Junior High na na 180,700 na na na $1.94
Hine Junior High na na 131,300 na na na na
Janney Elementary na na 43,400 na na na $2.31
Jefferson Junior High na na 109,000 na na na $2.84
Key Elementary na na 17,400 na na na $6.44
Lewis Elementary na na 49,500 na na na $1.72
Moten Elementary na na 99,700 na na na $0.76
Shaw Junior High na na 230,400 na na na $2.05
Turner Elementary na na 77,500 na na na $1.08
Tyler Elementary na na 69,600 na na na $2.14
Wilkinson Elementary na na 144,900 na na na $2.75
Winston Education Center na na 137,700 na na na $2.22
Barnard Elementary 1 290 72,500 958 1,844,177 na $2.19
Bell‐Lincoln Multi‐Cultural 1 306 325,217 4,607 6,043,094 275,796 $3.75
Birney Elementary 1 188 86,800 783 749,828 73,979 $2.45
Deal Junior High 1 380 143,700 2,497 4,686,656 11,563 $2.68
Eliot Junior High 1 240 155,100 1,688 1,682,145 153,087 $2.73
Luke C Moore Academy 1 686 27,482 872 1,295,954 37,306 $7.40
Orr Elementary 1 396 75,900 1,369 2,197,704 42,713 $2.36
Oyster Elementary 1 459 47,984 1,029 1,147,262 81,408 $6.01
Park View Elementary 1 214 82,200 849 766,668 84,623 $2.75
Powell Elementary 1 244 38,500 451 426,867 43,154 $2.76
School Without Walls 1 280 35,680 455 875,620 0 $3.53
Shaed Elementary 1 302 67,200 940 1,538,354 26,442 $2.52
Sharpe Health Annex Charter 1 989 17,413 776 921,465 55,801 $10.47
Slowe Elementary 1 208 54,500 514 476,141 50,011 $2.25
21
Energy Benchmark Results - District of Columbia Public Buildings: FY 2009 DDOE
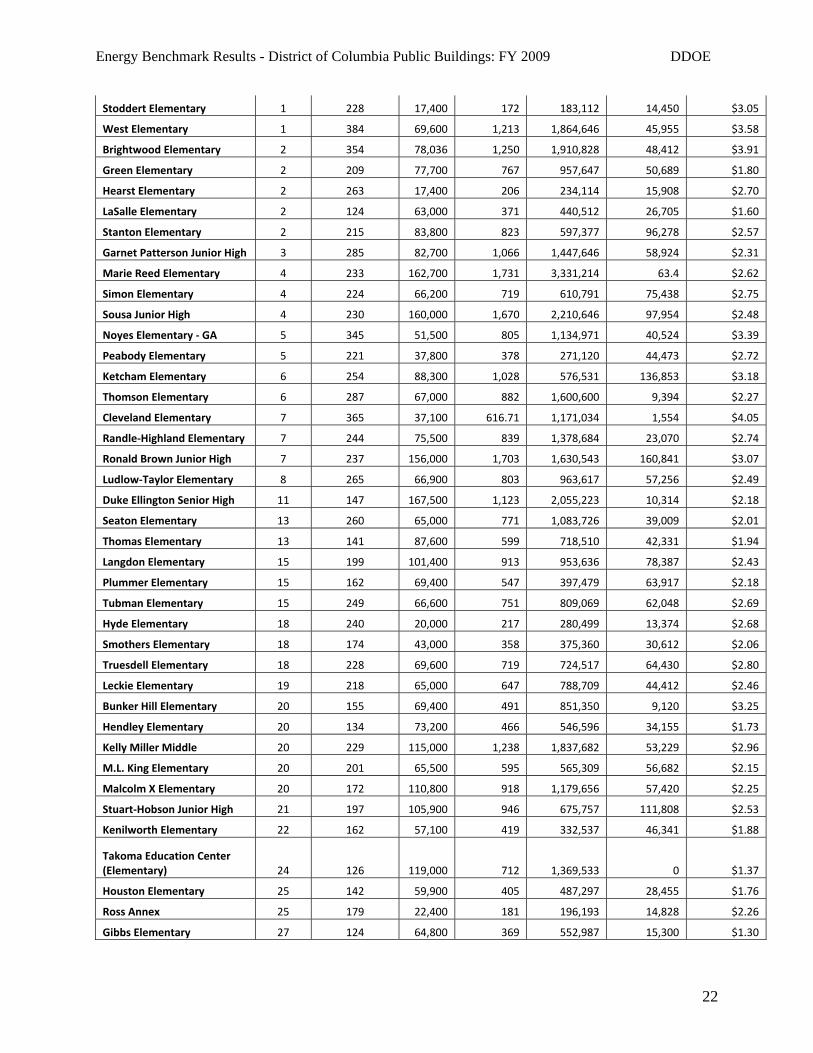
Stoddert Elementary 1 228 17,400 172 183,112 14,450 $3.05
West Elementary 1 384 69,600 1,213 1,864,646 45,955 $3.58
Brightwood Elementary 2 354 78,036 1,250 1,910,828 48,412 $3.91
Green Elementary 2 209 77,700 767 957,647 50,689 $1.80
Hearst Elementary 2 263 17,400 206 234,114 15,908 $2.70
LaSalle Elementary 2 124 63,000 371 440,512 26,705 $1.60
Stanton Elementary 2 215 83,800 823 597,377 96,278 $2.57
Garnet Patterson Junior High 3 285 82,700 1,066 1,447,646 58,924 $2.31
Marie Reed Elementary 4 233 162,700 1,731 3,331,214 63.4 $2.62
Simon Elementary 4 224 66,200 719 610,791 75,438 $2.75
Sousa Junior High 4 230 160,000 1,670 2,210,646 97,954 $2.48
Noyes Elementary ‐ GA 5 345 51,500 805 1,134,971 40,524 $3.39
Peabody Elementary 5 221 37,800 378 271,120 44,473 $2.72
Ketcham Elementary 6 254 88,300 1,028 576,531 136,853 $3.18
Thomson Elementary 6 287 67,000 882 1,600,600 9,394 $2.27
Cleveland Elementary 7 365 37,100 616.71 1,171,034 1,554 $4.05
Randle‐Highland Elementary 7 244 75,500 839 1,378,684 23,070 $2.74
Ronald Brown Junior High 7 237 156,000 1,703 1,630,543 160,841 $3.07
Ludlow‐Taylor Elementary 8 265 66,900 803 963,617 57,256 $2.49
Duke Ellington Senior High 11 147 167,500 1,123 2,055,223 10,314 $2.18
Seaton Elementary 13 260 65,000 771 1,083,726 39,009 $2.01
Thomas Elementary 13 141 87,600 599 718,510 42,331 $1.94
Langdon Elementary 15 199 101,400 913 953,636 78,387 $2.43
Plummer Elementary 15 162 69,400 547 397,479 63,917 $2.18
Tubman Elementary 15 249 66,600 751 809,069 62,048 $2.69
Hyde Elementary 18 240 20,000 217 280,499 13,374 $2.68
Smothers Elementary 18 174 43,000 358 375,360 30,612 $2.06
Truesdell Elementary 18 228 69,600 719 724,517 64,430 $2.80
Leckie Elementary 19 218 65,000 647 788,709 44,412 $2.46
Bunker Hill Elementary 20 155 69,400 491 851,350 9,120 $3.25
Hendley Elementary 20 134 73,200 466 546,596 34,155 $1.73
Kelly Miller Middle 20 229 115,000 1,238 1,837,682 53,229 $2.96
M.L. King Elementary 20 201 65,500 595 565,309 56,682 $2.15
Malcolm X Elementary 20 172 110,800 918 1,179,656 57,420 $2.25
Stuart‐Hobson Junior High 21 197 105,900 946 675,757 111,808 $2.53
Kenilworth Elementary 22 162 57,100 419 332,537 46,341 $1.88
Takoma Education Center (Elementary) 24 126 119,000 712 1,369,533 0 $1.37
Houston Elementary 25 142 59,900 405 487,297 28,455 $1.76
Ross Annex 25 179 22,400 181 196,193 14,828 $2.26
Gibbs Elementary 27 124 64,800 369 552,987 15,300 $1.30
22
Energy Benchmark Results - District of Columbia Public Buildings: FY 2009 DDOE
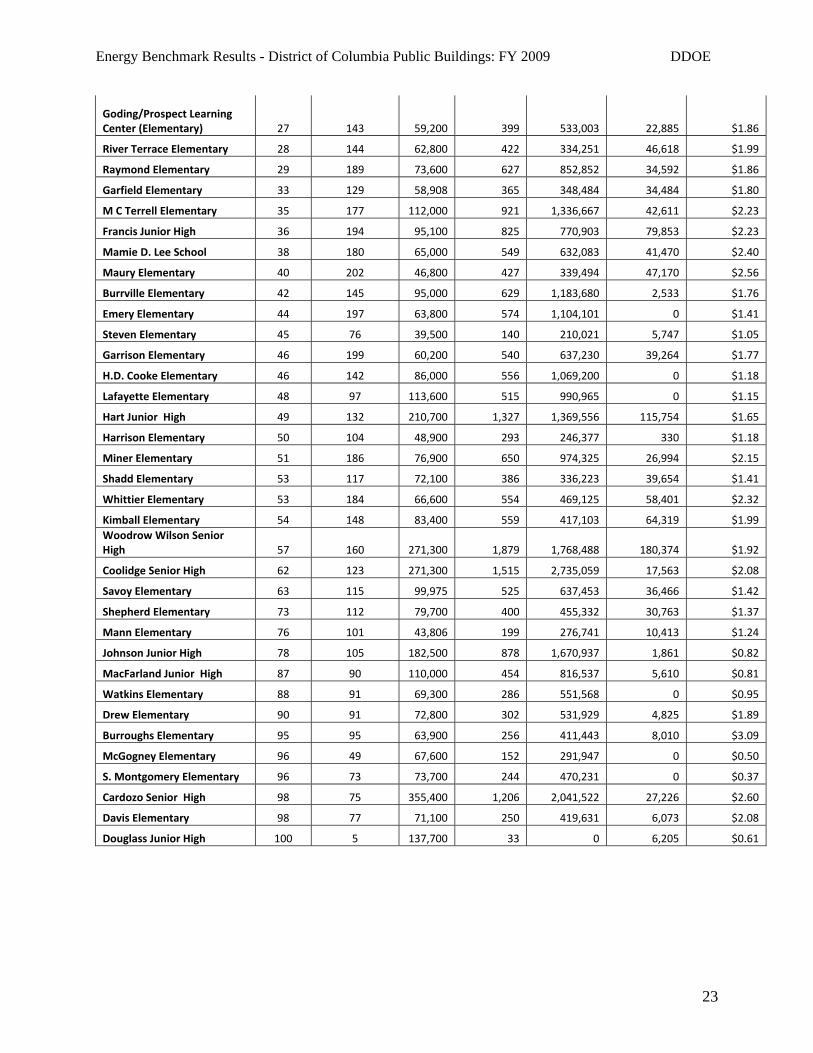
Goding/Prospect Learning Center (Elementary) 27 143 59,200 399 533,003 22,885 $1.86
River Terrace Elementary 28 144 62,800 422 334,251 46,618 $1.99
Raymond Elementary 29 189 73,600 627 852,852 34,592 $1.86
Garfield Elementary 33 129 58,908 365 348,484 34,484 $1.80
M C Terrell Elementary 35 177 112,000 921 1,336,667 42,611 $2.23
Francis Junior High 36 194 95,100 825 770,903 79,853 $2.23
Mamie D. Lee School 38 180 65,000 549 632,083 41,470 $2.40
Maury Elementary 40 202 46,800 427 339,494 47,170 $2.56
Burrville Elementary 42 145 95,000 629 1,183,680 2,533 $1.76
Emery Elementary 44 197 63,800 574 1,104,101 0 $1.41
Steven Elementary 45 76 39,500 140 210,021 5,747 $1.05
Garrison Elementary 46 199 60,200 540 637,230 39,264 $1.77
H.D. Cooke Elementary 46 142 86,000 556 1,069,200 0 $1.18
Lafayette Elementary 48 97 113,600 515 990,965 0 $1.15
Hart Junior High 49 132 210,700 1,327 1,369,556 115,754 $1.65
Harrison Elementary 50 104 48,900 293 246,377 330 $1.18
Miner Elementary 51 186 76,900 650 974,325 26,994 $2.15
Shadd Elementary 53 117 72,100 386 336,223 39,654 $1.41
Whittier Elementary 53 184 66,600 554 469,125 58,401 $2.32
Kimball Elementary 54 148 83,400 559 417,103 64,319 $1.99 Woodrow Wilson Senior High 57 160 271,300 1,879 1,768,488 180,374 $1.92
Coolidge Senior High 62 123 271,300 1,515 2,735,059 17,563 $2.08
Savoy Elementary 63 115 99,975 525 637,453 36,466 $1.42
Shepherd Elementary 73 112 79,700 400 455,332 30,763 $1.37
Mann Elementary 76 101 43,806 199 276,741 10,413 $1.24
Johnson Junior High 78 105 182,500 878 1,670,937 1,861 $0.82
MacFarland Junior High 87 90 110,000 454 816,537 5,610 $0.81
Watkins Elementary 88 91 69,300 286 551,568 0 $0.95
Drew Elementary 90 91 72,800 302 531,929 4,825 $1.89
Burroughs Elementary 95 95 63,900 256 411,443 8,010 $3.09
McGogney Elementary 96 49 67,600 152 291,947 0 $0.50
S. Montgomery Elementary 96 73 73,700 244 470,231 0 $0.37
Cardozo Senior High 98 75 355,400 1,206 2,041,522 27,226 $2.60
Davis Elementary 98 77 71,100 250 419,631 6,073 $2.08
Douglass Junior High 100 5 137,700 33 0 6,205 $0.61
23

Energy Benchmark Results - District of Columbia Public Buildings: FY 2009 DDOE
SOURCE TABLE 7
Warehouses and Other Facilities
District Warehouse or “Other” Facility
Weather Normalized,
Source
Energy Use Intensity (EUI)
(kBtu/sq ft)
Total Floor Space
(sq ft)
Total GHG Emissions
(MtCO2e)
Site Electric Use
(kWh)
Site Natural Gas Use
(therms)
Energy Cost US $
(per sq ft)
CCNV Shelter 104 350,000 1,742 3,126,002 22,160 $1.25 MPD First District Headquarters (former Bowen Elementary) na 70,800 na na na $2.86 Central Maintenance Facility and Lab 311 209,979 2,986 5,037,690 69,192 na
Central Operations Building 830 72,960 2,761 5,314,600 na naFueling Station 593 78,550 2,579 1,734,436 267,386 $8.85 Southeast Tennis & Learning Center 778 15,000 628 377,132 71,319 $10.88 OCTO Warehouse and Data Center 1,454 29,961 1,986 3,821,652 na $15.96 Unified Communications Center 15 138,000 94 180,840 na $0.19
DC Armory 128 588,000 3,539 4,674,170 208,630 $1.51 MPD Special Operations 962 10,530 465 841,800 5,100 $8.59 MPD Youth Center 335 10,762 170 224,280 10,052 $4.53
DPW Maintenance Shop 591 78,550 2,254 1,791,280 248,710 $8.53 DPW Sweeper Equipment Storage Center 17 64,998 50 96,840 na $0.21 MPD Fleet Maintenance Facility 59 144,000 397 611,840 14,755 $0.58 DC Records Center 205 21,875 208 325,333 7,385 $2.25 Warehouse at 2200 Adams Place, NE 160 178,015 1,324 1,984,920 54,919 $1.71 DPR Warehouse and FM Operations 340 16,290 251 354,040 12,599 $4.05
DC Jail 287 449,295 5,872 11,300,781 na $3.02
24

Energy Benchmark Results - District of Columbia Public Buildings: FY 2009 DDOE
25
SOURCE TABLE 8
DC Water
DC Water Facility
Weather Normalized,
Source
Energy Use Intensity (EUI)
(kBtu/sq ft*)
Total Floor Space
(sq ft)
Total GHG Emissions
(MtCO2e)
Site Electric Use
(kWh)
Site Natural Gas Use
(therms)
Energy Cost US $
(per sq ft)
Central Maintenance Facility and Lab 311 209,979 2,986 5,037,690 69,192 na
Central Operations Building 830 72,960 2,761 5,314,600 na na