Energy and National Security
31
Energy Security: Energy Security: Emerging Global Trends Emerging Global Trends Dr. Theresa Sabonis-Helf Dr. Theresa Sabonis-Helf National War College National War College RCNSC – July 2009 RCNSC – July 2009
Transcript of Energy and National Security

Energy Security: Energy Security: Emerging Global TrendsEmerging Global TrendsDr. Theresa Sabonis-Helf Dr. Theresa Sabonis-Helf National War College National War College
RCNSC – July 2009RCNSC – July 2009

Regional primary energy consumption patterns 2007
coal
hydronuclear
gas
oil
From BP Statistical Review of World Energy 2008

Germany is a world leader in wind and solar energy. Solar is currently 0.5% of Germany’s electricity mix, Wind is currently 6%. Germany is committed to making 12.5% of its electricity renewable by 2010, 20% by 2020.
OECD Wind and Solar Electricity Generation Capacity, 2004
41% of OECD
43% of OECD

Oil consumption per capitaOil consumption per capita
From BP Statistical Review of World Energy 2008
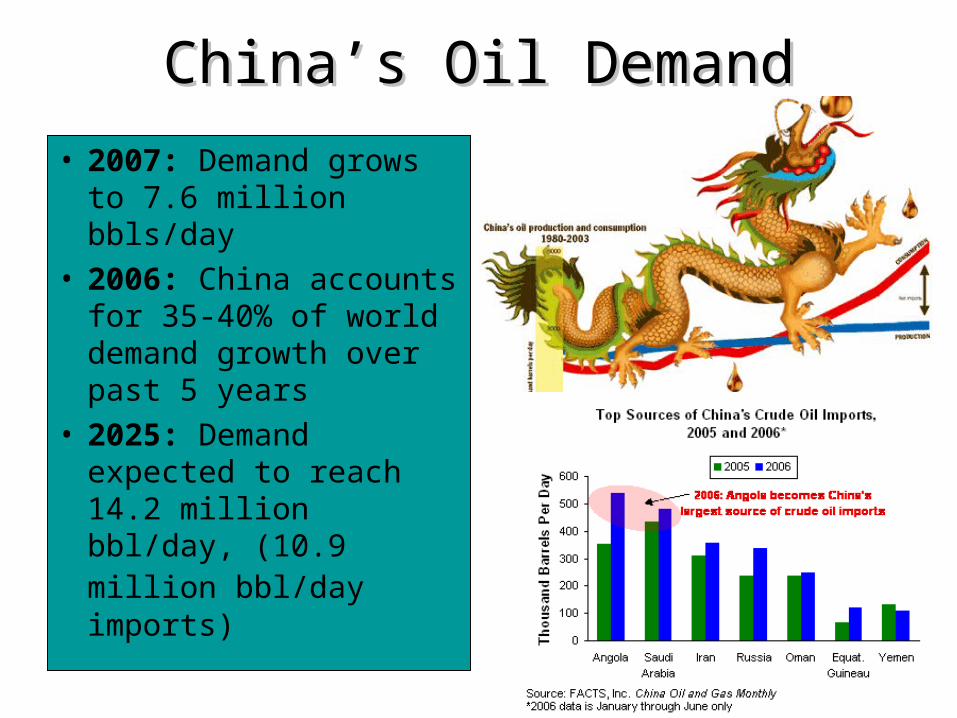
China’s Oil DemandChina’s Oil Demand
• 2007: Demand grows to 7.6 million bbls/day
• 2006: China accounts for 35-40% of world demand growth over past 5 years
• 2025: Demand expected to reach 14.2 million bbl/day, (10.9 million bbl/day imports)

Africa
Non-OECD Europe and Eurasia
Middle East
Central & South AmericaOECD Asia
OECD Europe
Non-OECD AsiaNorth America
25.227.9
15.330.8
15.516.0
8.69.2
5.57.8
5.99.5
4.86.9
2.94.3
World Fuel Consumption: 2005 & 2030
Million Barrels of Oil Equivalent per Day
Fuel Liquids only. 2008 Projections: Data from EIA International Energy Outlook 2008
20052030


Distribution of proven oil reserves
in billion barrels
1987: 910.2
1997: 1069.3
2007: 1237.9 From BP Statistical Review of World Energy 2007

Angola joined OPEC in December 2006
Ecuador & Gabon left the OPEC cartel in the 1990s, Ecuador rejoined in 2007
Indonesia became a net importer in 2004
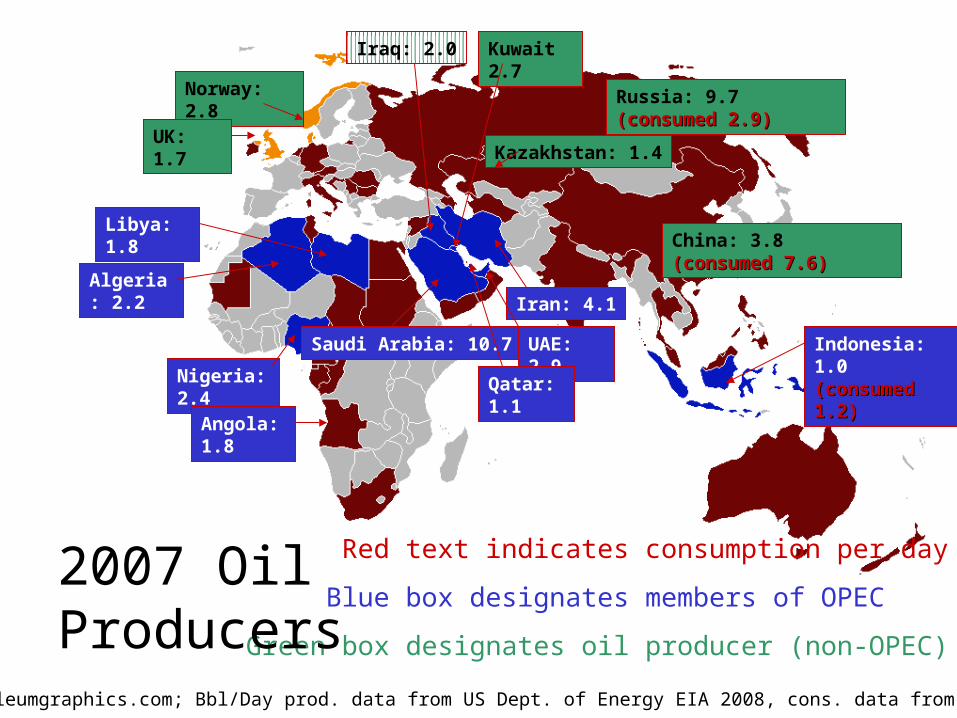
Red text indicates consumption per day
Blue box designates members of OPEC
Green box designates oil producer (non-OPEC)
China: 3.8 (consumed 7.6)(consumed 7.6)
Russia: 9.7 (consumed 2.9)(consumed 2.9)
Kazakhstan: 1.4
Nigeria: 2.4
Angola: 1.8
Libya: 1.8
Norway: 2.8
Saudi Arabia: 10.7
Iran: 4.1
Iraq: 2.0
Algeria: 2.2
Kuwait 2.7
UAE: 2.9 Indonesia: 1.0 (consumed 1.2)(consumed 1.2)
Qatar: 1.1
2007 Oil Producers (mil bbl/day)
UK: 1.7
Base map:www.petroleumgraphics.com; Bbl/Day prod. data from US Dept. of Energy EIA 2008, cons. data from Nationmaster.com

Mexico: 3.7 (consumed 2.1)(consumed 2.1)
Canada: 3.3 (consumed 2.4 )(consumed 2.4 )
United States: 8.3 (consumed 20.7)(consumed 20.7)
Venezuela: 2.8 (consumed 0.7)(consumed 0.7)
2007 Oil Producers (mil bbl/day)
Base map: www.petroleumgraphics.com; Bbl/Day prod. data from US Dept. of Energy EIA 2008, cons. data from Nationmaster.com
Brazil: 2.2 (consumed 2.4)(consumed 2.4)
Ecuador: 0.5 (consumed 0.2)(consumed 0.2)
Blue box designates members of OPEC
Green box designates oil producer (non-OPEC)
Red text indicates consumption

Swing Capacity

Bab el-Mandab 3.0Bosporus/Turkish Straits 3.1Strait of Hormuz: 17
Strait of Malacca 11.7 Russia 2.0 Suez Canal/Sumed: 4.2 Panama Canal: 0.6
7
2
3
4
5
6
7
5
6
1
1
2
3
4
Oil Chokepoints (Millions of Barrels per Day)
Data from US Dept of Energy EIA 2005 (2004 estimates)

Where are the Hydrocarbons?
Proven Oil Reserves 2006Proven Oil Reserves 2006 Proven Nat. Gas Reserves Proven Nat. Gas Reserves 20062006
From BP Statistical Review of World Energy 2007

Major gas trade movements
From BP Statistical Review of World Energy 2008
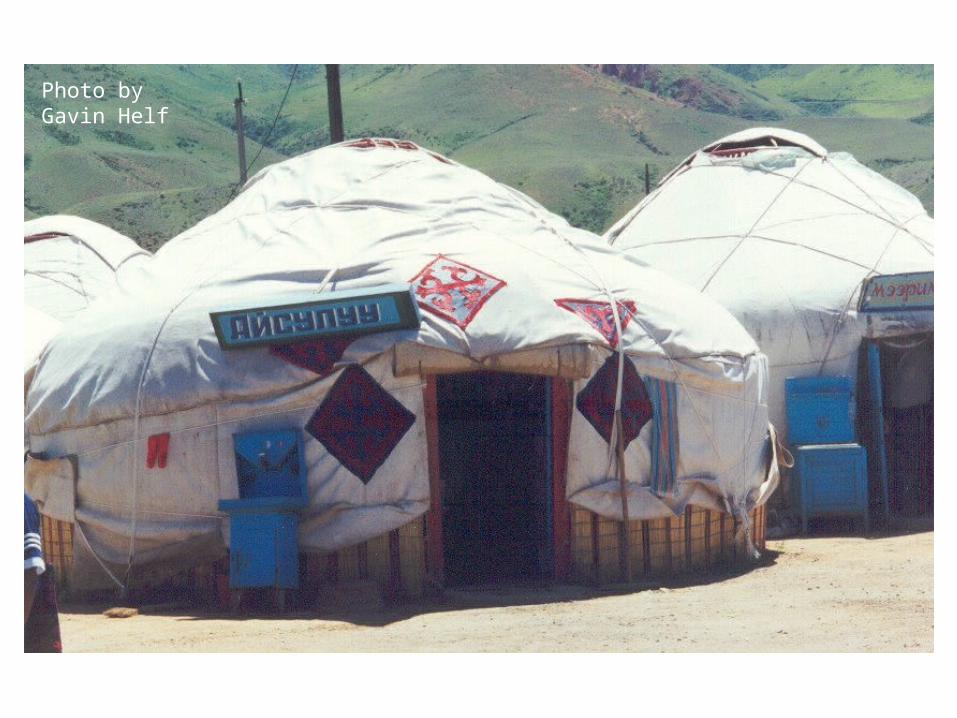
Photo by Gavin Helf

Canada’s OilDomestic Impacts of Oil Domestic Impacts of Oil WealthWealth
● Boom and bust economic cycles ● Dutch Disease● No taxation, no representation syndrome● Economic and political development of petrostates has had limited success● High levels of corruption are endemic● State incurs obligations that are hard to rescind

Thomas Friedman’s First Law of
Petropolitics
From Foreign Policy May/June 2006

European Reliance on Russian Natural Gas (2006-
2007)RankRank Country Country
(bcf in 2007)(bcf in 2007)2006 % of 2006 % of
Dom. Cons.Dom. Cons.
1 Germany (1,378 bcf)
36%
2 Turkey (827 bcf) 64%
3 Italy (742 bcf) 25%
4 France (346 bcf) 20%
5 Czech Rep (247) 79%
6 Poland (247 bcf) 47%
7 Hungary (226 bcf) 54%
8 Slovakia (223 bcf) 100% Data from EIA Russia Country Report 2008
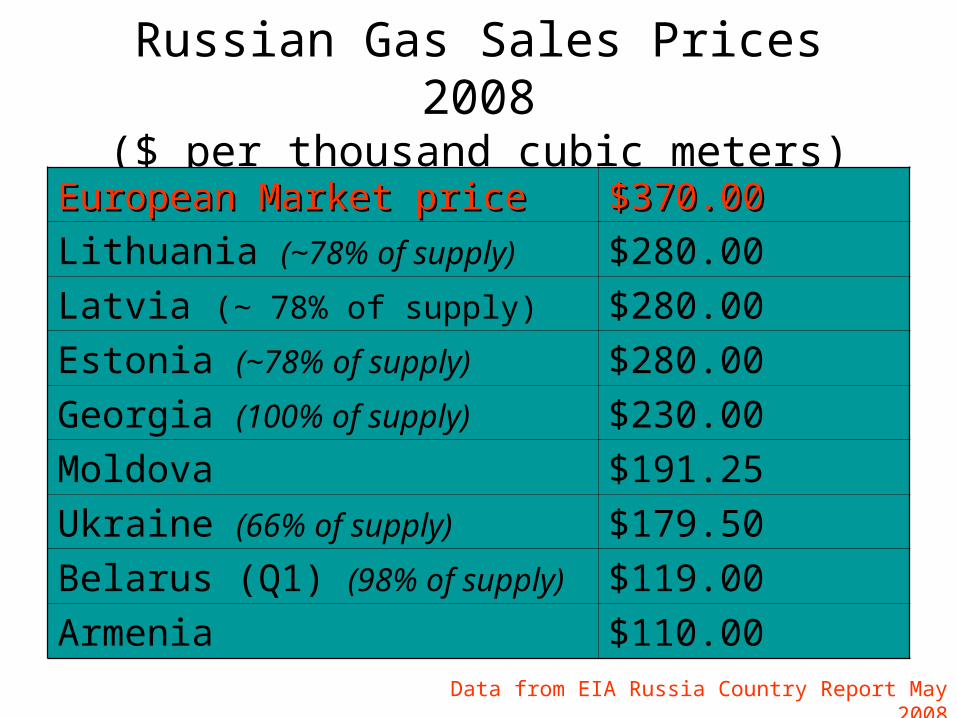
Russian Gas Sales Prices 2008($ per thousand cubic meters)
European Market priceEuropean Market price $370.00$370.00
Lithuania (~78% of supply) $280.00
Latvia (~ 78% of supply) $280.00
Estonia (~78% of supply) $280.00
Georgia (100% of supply) $230.00
Moldova $191.25
Ukraine (66% of supply) $179.50
Belarus (Q1) (98% of supply) $119.00
Armenia $110.00Data from EIA Russia Country Report May 2008

Russian Oil and Gas Pipelines to Europe: Actual & Proposed
Data from US Dept of Energy EIA 2008

Russian Nord Stream Natural Gas Pipeline Facts
Route: Portovaya Bay, Russia to coast Germany (underwater) – Baltic Sea
Capacity: 27.5 billion cubic meters (2010); 55 bcm (2012 – 2nd pipeline)
Length: 1,200 km (World’s largest underwater natural gas pipeline – max depth: 210 meters)
Cost Estimate: 5 Billion Euros (60% Increase – 8 Billion Euros) – Cost 2.2 Billion Euros if built on land
Supply: Shtokman gas field (estimated reserves of 3.7 trillion cubic meters – 2010 available)
Shareholders: Gazprom (51%), BASF (24.5%), E.ON (24.5%)
Contracts: Wingas – German Gas Co. – 9 bcm for 25
yrsDONG – Danish Co. – 1 bcm for 20 yrsE.ON – German Co. – 4 bcmGaz de France – 2.5 bcm Slide courtesy of Nelson Dodd, NWC Elective 5404

Canada’s OilWhat’s a National Security What’s a National Security Strategist to Do? Some Strategist to Do? Some Options to Consider…Options to Consider…
● Manage Demand● Seek New Traditional Supply● Seek Non-Traditional Supply● Change Relationship Between Buyers & Sellers● Change Relationship Between States & Markets

Questions?

Retail price: $4.06/gallon
(July 2008)
9.8
75.8 %
11.2%9.8%
Crude Oil
Refining 3.2%
Distribution & MarketingTaxes
Retail Price: $1.79/gallon
(January 2009)
What You Pay for in a Gallon of GasWhat You Pay for in a Gallon of Gas
Image and data from Dept of Energy Jan 2009
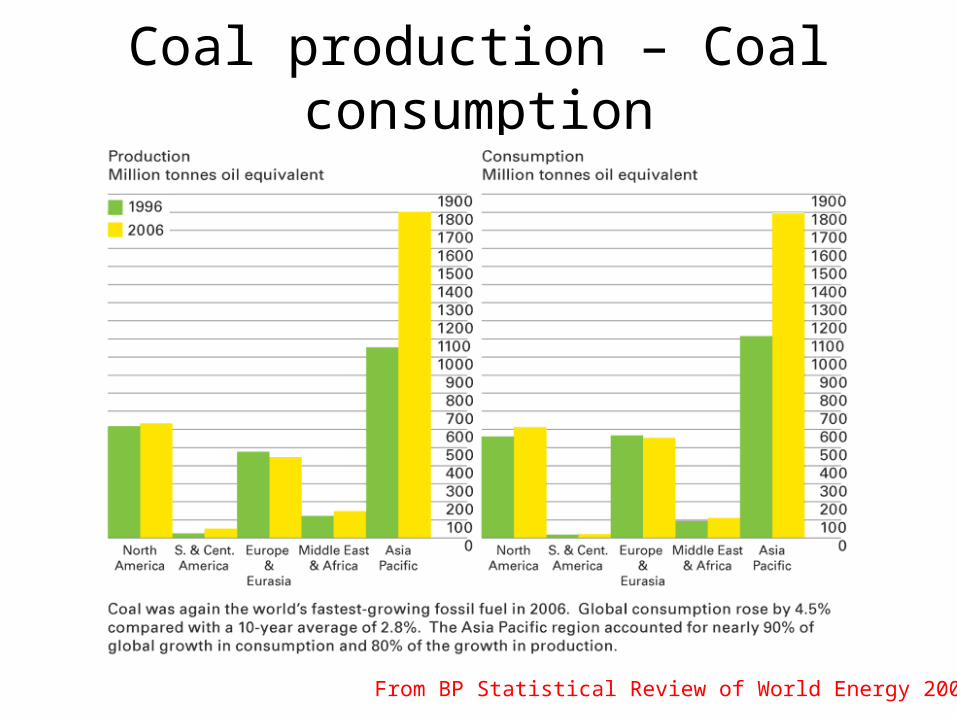
Coal production – Coal consumption
From BP Statistical Review of World Energy 2007

Nuclear energy consumption by area
From BP Statistical Review of World Energy 2007

-
5
10
15
20
25
30
1950 1960 1970 1980 1990 2000 2010 2020
EIA, Annual Energy Outlook 2001; "Potential Oil Production from the Coastal Plain of ANWR,“
- EIA Reserves & Production Division
US Oil Consumption (Million Bbls/day)US Oil Consumption (Million Bbls/day)
Total Oil Demand
Transportation Demand
Domestic Oil Production
Domestic Oil Production w/ANWR
1960 1970 1980 1990 2000 2010
5
10
15
20
25
30
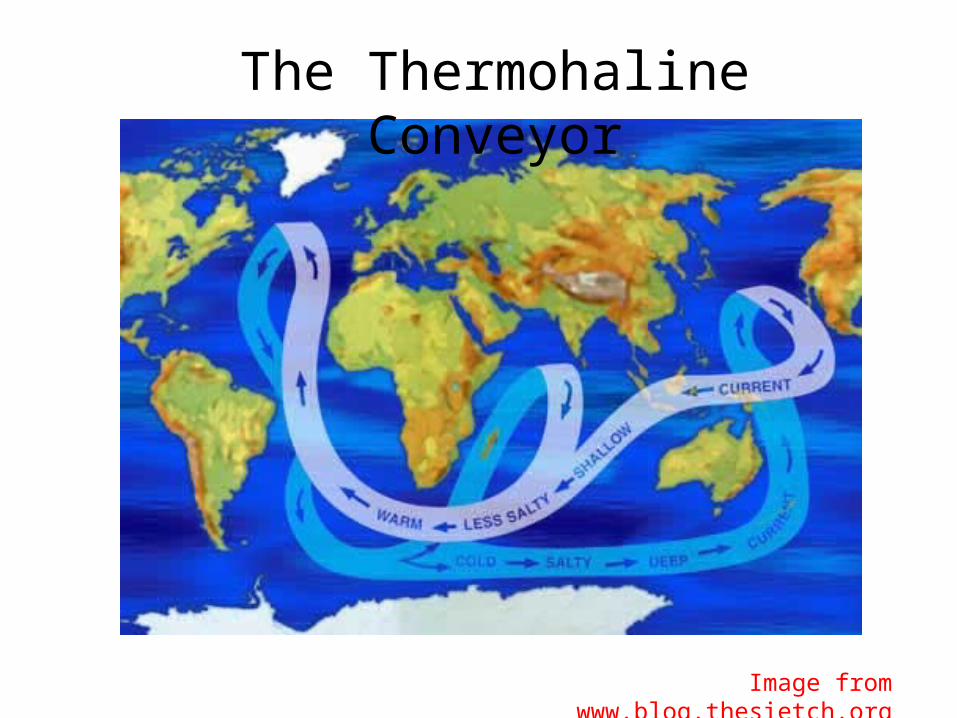
The Thermohaline Conveyor
Image from www.blog.thesietch.org

Canada’s OilCanada’s OilCanada’s Oil
○ Claims 178.8 billion bbls in proven reserves (second only to Saudi Arabia), but much of this is Alberta oil sands. ○ Canadian traditional oil is in decline. Oil sands supply approx. 50% of its production.○ In most months Canada is largest single supplier of USA, with approx 1.6 million bbl/day○ 2005 – Canada produced 3.1 million bbl/day.