Energy Absorption Performance of Eco-Core -...
9
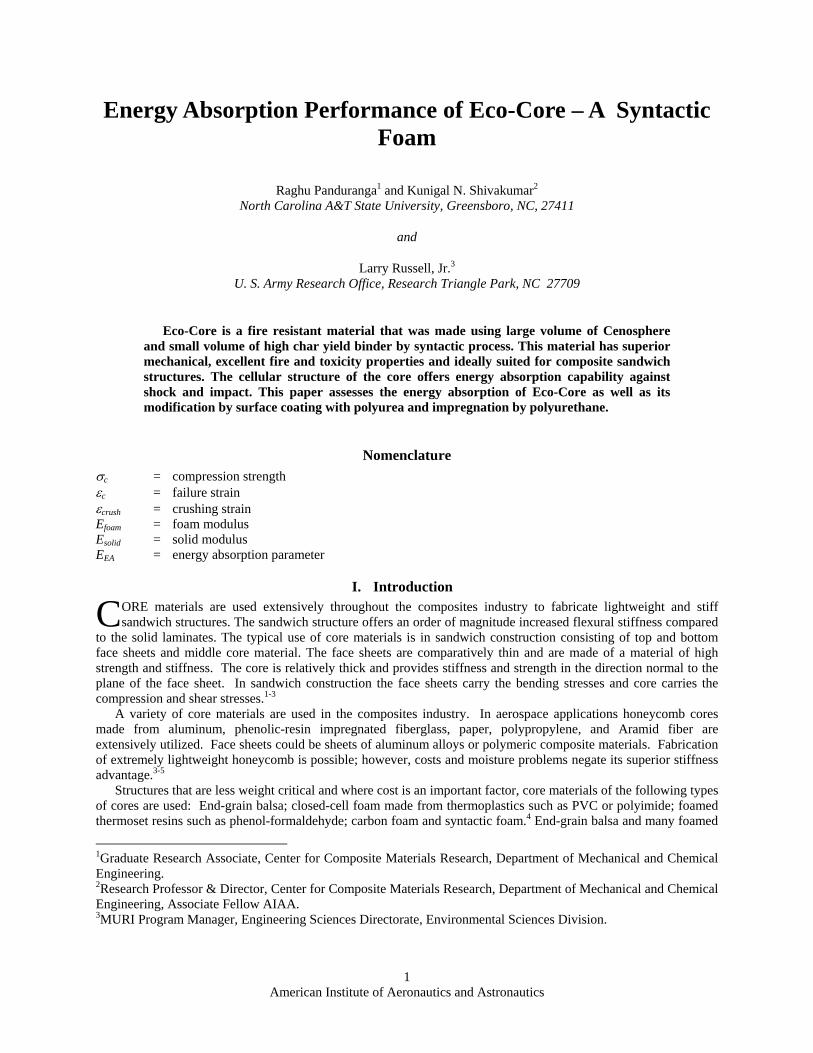
American Institute of Aeronautics and Astronautics 1 Energy Absorption Performance of Eco-Core – A Syntactic Foam Raghu Panduranga 1 and Kunigal N. Shivakumar 2 North Carolina A&T State University, Greensboro, NC, 27411 and Larry Russell, Jr. 3 U. S. Army Research Office, Research Triangle Park, NC 27709 Eco-Core is a fire resistant material that was made using large volume of Cenosphere and small volume of high char yield binder by syntactic process. This material has superior mechanical, excellent fire and toxicity properties and ideally suited for composite sandwich structures. The cellular structure of the core offers energy absorption capability against shock and impact. This paper assesses the energy absorption of Eco-Core as well as its modification by surface coating with polyurea and impregnation by polyurethane. Nomenclature σ c = compression strength ε c = failure strain ε crush = crushing strain E foam = foam modulus E solid = solid modulus E EA = energy absorption parameter I. Introduction ORE materials are used extensively throughout the composites industry to fabricate lightweight and stiff sandwich structures. The sandwich structure offers an order of magnitude increased flexural stiffness compared to the solid laminates. The typical use of core materials is in sandwich construction consisting of top and bottom face sheets and middle core material. The face sheets are comparatively thin and are made of a material of high strength and stiffness. The core is relatively thick and provides stiffness and strength in the direction normal to the plane of the face sheet. In sandwich construction the face sheets carry the bending stresses and core carries the compression and shear stresses. 1-3 A variety of core materials are used in the composites industry. In aerospace applications honeycomb cores made from aluminum, phenolic-resin impregnated fiberglass, paper, polypropylene, and Aramid fiber are extensively utilized. Face sheets could be sheets of aluminum alloys or polymeric composite materials. Fabrication of extremely lightweight honeycomb is possible; however, costs and moisture problems negate its superior stiffness advantage. 3-5 Structures that are less weight critical and where cost is an important factor, core materials of the following types of cores are used: End-grain balsa; closed-cell foam made from thermoplastics such as PVC or polyimide; foamed thermoset resins such as phenol-formaldehyde; carbon foam and syntactic foam. 4 End-grain balsa and many foamed 1 Graduate Research Associate, Center for Composite Materials Research, Department of Mechanical and Chemical Engineering. 2 Research Professor & Director, Center for Composite Materials Research, Department of Mechanical and Chemical Engineering, Associate Fellow AIAA. 3 MURI Program Manager, Engineering Sciences Directorate, Environmental Sciences Division. C
Transcript of Energy Absorption Performance of Eco-Core -...
American Institute of Aeronautics and Astronautics
1
Energy Absorption Performance of Eco-Core – A Syntactic Foam
Raghu Panduranga1 and Kunigal N. Shivakumar2 North Carolina A&T State University, Greensboro, NC, 27411
and
Larry Russell, Jr.3 U. S. Army Research Office, Research Triangle Park, NC 27709
Eco-Core is a fire resistant material that was made using large volume of Cenosphere and small volume of high char yield binder by syntactic process. This material has superior mechanical, excellent fire and toxicity properties and ideally suited for composite sandwich structures. The cellular structure of the core offers energy absorption capability against shock and impact. This paper assesses the energy absorption of Eco-Core as well as its modification by surface coating with polyurea and impregnation by polyurethane.
Nomenclature σc = compression strength εc = failure strain εcrush = crushing strain Efoam = foam modulus Esolid = solid modulus EEA = energy absorption parameter
I. Introduction ORE materials are used extensively throughout the composites industry to fabricate lightweight and stiff sandwich structures. The sandwich structure offers an order of magnitude increased flexural stiffness compared
to the solid laminates. The typical use of core materials is in sandwich construction consisting of top and bottom face sheets and middle core material. The face sheets are comparatively thin and are made of a material of high strength and stiffness. The core is relatively thick and provides stiffness and strength in the direction normal to the plane of the face sheet. In sandwich construction the face sheets carry the bending stresses and core carries the compression and shear stresses.1-3 A variety of core materials are used in the composites industry. In aerospace applications honeycomb cores made from aluminum, phenolic-resin impregnated fiberglass, paper, polypropylene, and Aramid fiber are extensively utilized. Face sheets could be sheets of aluminum alloys or polymeric composite materials. Fabrication of extremely lightweight honeycomb is possible; however, costs and moisture problems negate its superior stiffness advantage.3-5 Structures that are less weight critical and where cost is an important factor, core materials of the following types of cores are used: End-grain balsa; closed-cell foam made from thermoplastics such as PVC or polyimide; foamed thermoset resins such as phenol-formaldehyde; carbon foam and syntactic foam.4 End-grain balsa and many foamed
1Graduate Research Associate, Center for Composite Materials Research, Department of Mechanical and Chemical Engineering. 2Research Professor & Director, Center for Composite Materials Research, Department of Mechanical and Chemical Engineering, Associate Fellow AIAA. 3MURI Program Manager, Engineering Sciences Directorate, Environmental Sciences Division.
C

American Institute of Aeronautics and Astronautics
2
plastics are not suitable for complex shape constructions because of problems with shaping. Furthermore, many of these foams are subjected to rotting and/or degradation of property due to moisture ingression and thermal cycles. Plastic foams could emit noxious gases when exposed to fire.6 Syntactic foams are made by embedding preformed hollow microspheres in a resin matrix. The lightweight hollow microspheres reduce the density of the resin and create a thick mixture that can be applied by hand or sprayed or can be compression molded. Syntactic foams are used in many applications, such as underwater buoyancy aids, aerospace plug manufacturing, ship hulls and bulkheads.7-9 North Carolina A&T State University’s Composite Materials Research Center has developed10 a production method for syntactic foam made from a waste product generated by the utility industry. A component of the the fly ash, a byproduct of coal combustion in electric power plant that is already exposed to high temperatures of >1000oC, called Cenosphere is in the form of hollow ceramic bubbles and is normally collected in the filter bag houses to reduce the particulate emissions from the thermal power plants. The fly ash contains some lime and gypsum that are products of desulfurization used to minimize SO2 emissions. The fly ash needs to be classified to separate the heavier components from it. By utilizing the treated fly ash and combining with an appropriate resin that has a high char value (contributes minimum fuel value in case of a fire), a low-cost syntactic foams can be produced with properties tailored to the specific applications. Phenol-formaldehyde or other suitable high-temperature thermoset resins that have a low fuel value and a high char yield can be employed as binders. Fire resistant syntactic foams can be produced using phenol based thermoset resins with low binder percentages. In the event of a fire this foam generates little or no flame, smoke and emits no toxic gases, a factor that would be of great importance to military applications as well as building constructions. This new syntactic foam is called Eco-Core. A prime difference between the Eco-Core and other syntactic foams are surface coating of the bubbles by high char binder and controlled packing to achieve point-to-point contact between the bubbles. Processing, mechanical and fire characterization of eco-core are presented in Refs. 11 and 12 and toughness properties are presented in Ref. 13. One of the potential of the cellular foams like Eco-Core is its energy absorption capabilities. This research explores the energy absorption capacity of Eco-Core and its modification to enhance this property. An approach of modifying the Eco-Core is by coating with polyurea and/or impregnation of polyurethane. The energy absorption parameters are investigated for both unmodified and modified eco-core foams.
II. Energy Absorption Mechanism in Cellular Foams All foam materials have energy absorption properties.14 Particularly, Eco-Core, which has superior fire resistance
and large compressibility, could offer protection against blast and/or impact. Figure 1 shows a static compression stress-strain response of a typical cellular foam material.14 The critical parameters are compression strength (σc), failure strain (εc), crushing strain (εcrush) and the two moduli, namely, foam modulus Efoam and solid modulus Esolid. When all the foam cell walls are collapsed, modulus of the solid material is Esolid. Efoam is related through σc and εc while Esolid has no role to perform in the energy absorption mechanism. An energy absorption parameter is defined by EEA=1/2σcεc+σcεcrush, and it is used for comparison of different materials. The first part is the strain energy of the foam at failure and the second part is the crushing energies. As a first approximation, we can write EEA= σcεcrush because εc << εcrush. One can improve EEA by increasing σc and εcrush.
The εcrush depends on the void fraction of the foam while σc depends on the properties of the binder that encapsulates the microscopic voids and microbubbles. Material developers have to weigh both parameters in the contest of application to design materials. This paper explores engineering of eco-core to enhance EEA.
A
B C
D
Figure 1. Typical compression stress-strain response of foam material.

American Institute of Aeronautics and Astronautics
3
III. Materials and Processing A class of fly ash known as Cenosphere or Recyclosphere grade SG 300 obtained from Sphere Services Inc. was used in the formulation of the eco-core material.11 The binder resin was a phenol-formaldehyde resole resin, Durite SC 1008 supplied by Borden Chemical Co. Polyurea Aliphatic type RAP 1567 (manufactured and supplied by Stuart Smith of Engineered Polymers, International, LLC of Conyers, GA) is used to coat eco-core panels. Smooth-On Clear Flex 95 aliphatic type unfilled-low viscosity polyurethane resin (manufactured and supplied by Smooth-On, Inc. of Easton, PA) is used to impregnate eco-core panel
A. Baseline Eco-Core The fly ash materials were treated to remove contaminants by a dilute HCL acid (pH ~ 4) wash and the heavier
than water fraction of the as-received fly ash was separated and removed by settling. The lighter floating fraction material was further washed with water for about 3-4 times and was separated by filtration from the water. It was thoroughly dried at 110oC in a convection oven. Subsequently, the treated fly ash was treated with a aminoalkyl triethoxysilane coupling agent, as per the instructions from the silane manufacturer. The coupling agent is expected to improve the bonding property. The fly ash after silane treatment was dried in an oven to attain a free-flowing material. The treated and dried fly ash was admixed with resole resin diluted with suitable solvents in a low-shear planetary motion mixer to uniformly coat the fly ash particles. The volatile solvents from the fly ash mixture were removed while mixing in a stream of warm air. The coated fly ash mix was subsequently charged into a compression mold of 152x152x25 mm dimensions and then it was compacted by a laboratory hot press, cured at a pressure of 2.07 MPa and at a temperature of 163oC for 30 minutes. It was found that to achieve reproducibility from sample to sample the void fraction in the foam panels had to be controlled at an as low a value as possible. The foam samples were finally post cured in hot air circulating oven at 163oC for 4 ½ hours. Specimen extracted from these panels are labeled as baseline.
B. Coated Eco-Core The eco-core panel is placed on a flat surface and the spacers of required thickness are positioned on edges of
panel using adhesive tapes. Polyurea (PU) precursors (part A and part B) are mixed as per the manufacturer’s procedure. The mix is then uniformly spread over the coating area using brush and doctor blade. The coating is allowed to cure at room temperature for 24 hours. The same procedure is followed for coating on the other side of the eco-core panel. In a similar manner, Eco-Core panels with near-zero, 10, 20 and 40 mil thick PU coating are prepared. Specimens extracted from these panel are marked as EPU0, EPU10, EPU20 and EPU40 for near-zero, 10 mil, 20 mil and 40 mil thick PU coating respectively.
C. Impregnated Eco-Core Eco-core panels are impregnated with polyurethane (PUR) resin by three methods to check distribution of the
resin through the thickness. First method is by vacuum impregnation. Second method is by pressure impregnation and third method is by both vacuum and pressure impregnation. In vacuum impregnation, polyurethane precursors (part A and part B) are mixed as per the manufacturer’s procedure and the required quantity of mix is transferred to the aluminum tray. Then the eco-core panel is placed in the tray over which a dead weight is placed. The entire assembly is transferred to the vacuum chamber and 750mm of Hg vacuum is applied for about 20 minutes. After impregnation the panel is oven cured at about 71 oC for 1 hour. In pressure impregnation, polyurethane soaked eco-core panel assembly is transferred to the pressure chamber and 0.48 MPa positive pressure is applied for about 20 minutes. Then the impregnated panel is oven cured at about 71oC for 1 hour. In vacuum-pressure impregnation, polyurethane soaked eco-core panel assembly is first transferred to the vacuum chamber and 750mm of Hg vacuum is applied for about 5 minutes. Then the assembly is transferred to the pressure chamber and 0.48 MPa positive pressure is applied for about 15 minutes. After impregnation, the panel is oven cured at about 71oC for 1 hour. Specimens extracted from this panel are marked as EPUR.
IV. Testing Two types of tests were conducted, namely, unconfined and confined compression using a cylindrical specimen
shown in Figure 2(a). The unconfined compression tests were conducted to measure the compression strength and failure modes. The confined compression test was to measure the compression strength (σc), failure strain (εc) and energy absorption of the material. The specimen configuration for both the unconfined and confined compression
American Institute of Aeronautics and Astronautics
4
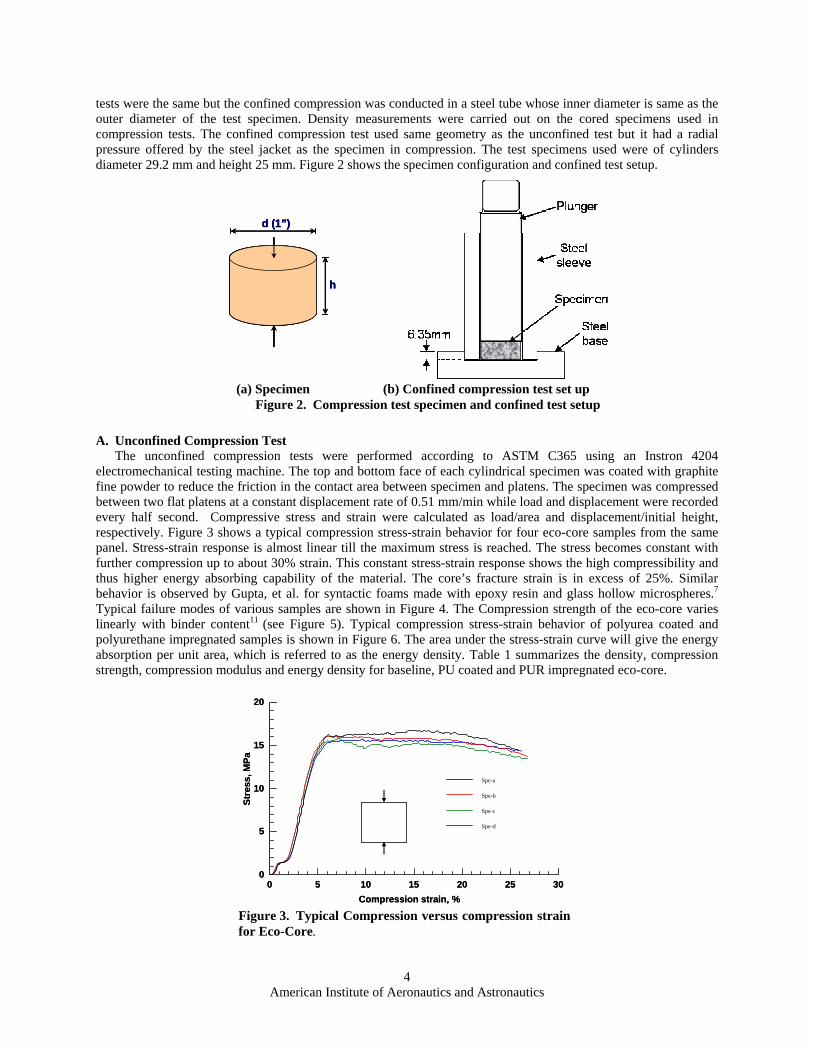
tests were the same but the confined compression was conducted in a steel tube whose inner diameter is same as the outer diameter of the test specimen. Density measurements were carried out on the cored specimens used in compression tests. The confined compression test used same geometry as the unconfined test but it had a radial pressure offered by the steel jacket as the specimen in compression. The test specimens used were of cylinders diameter 29.2 mm and height 25 mm. Figure 2 shows the specimen configuration and confined test setup.
A. Unconfined Compression Test The unconfined compression tests were performed according to ASTM C365 using an Instron 4204
electromechanical testing machine. The top and bottom face of each cylindrical specimen was coated with graphite fine powder to reduce the friction in the contact area between specimen and platens. The specimen was compressed between two flat platens at a constant displacement rate of 0.51 mm/min while load and displacement were recorded every half second. Compressive stress and strain were calculated as load/area and displacement/initial height, respectively. Figure 3 shows a typical compression stress-strain behavior for four eco-core samples from the same panel. Stress-strain response is almost linear till the maximum stress is reached. The stress becomes constant with further compression up to about 30% strain. This constant stress-strain response shows the high compressibility and thus higher energy absorbing capability of the material. The core’s fracture strain is in excess of 25%. Similar behavior is observed by Gupta, et al. for syntactic foams made with epoxy resin and glass hollow microspheres.7 Typical failure modes of various samples are shown in Figure 4. The Compression strength of the eco-core varies linearly with binder content11 (see Figure 5). Typical compression stress-strain behavior of polyurea coated and polyurethane impregnated samples is shown in Figure 6. The area under the stress-strain curve will give the energy absorption per unit area, which is referred to as the energy density. Table 1 summarizes the density, compression strength, compression modulus and energy density for baseline, PU coated and PUR impregnated eco-core.
0
5
10
15
20
0 5 10 15 20 25 30
Spe-d
Spe-c
Spe-b
Spe-a
Stre
ss, M
Pa
Compression strain, %
0
5
10
15
20
0 5 10 15 20 25 30
Spe-d
Spe-c
Spe-b
Spe-a
Stre
ss, M
Pa
Compression strain, %
Figure 3. Typical Compression versus compression strain for Eco-Core.
d (1”)
h
d (1”)
h
d (1”)
h
(a) Specimen (b) Confined compression test set up
Figure 2. Compression test specimen and confined test setup

American Institute of Aeronautics and Astronautics
5
0
10
20
30
40
0 0.1 0.2 0.3 0.4
Com
pres
sion
stre
ss, M
Pa
Compression strain, m/m
EPUR
EPU0
EPU10
Baseline EPU20
EPU40
0
10
20
30
40
0 0.1 0.2 0.3 0.4
Com
pres
sion
stre
ss, M
Pa
Compression strain, m/m
EPUR
EPU0
EPU10
Baseline EPU20
EPU40
Figure 6. Typical Compression stress-strain plot for Eco-Core and modified Eco-Core.
Com
pres
sion
stre
ngth
, MPa
Binder content, %
0
10
20
30
40
50
0 5 10 15 20 25 30
Com
pres
sion
stre
ngth
, MPa
Binder content, %
0
10
20
30
40
50
0 5 10 15 20 25 30
Figure 5. Variation of compression strength withbinder content.
20 mil thk PU coated
(a) (b)
(e) (f)
(c) (d)
20 mil thk PU coated
(a) (b)
(e) (f)
(c) (d)
Figure 4. Broken specimens under compression (a) Baseline (b) PUR impregnated (c) Near-zero PU coated (d) 10 mil PU coated (e) 20 mil PU coated(f) 40 mil PU coated
American Institute of Aeronautics and Astronautics
6
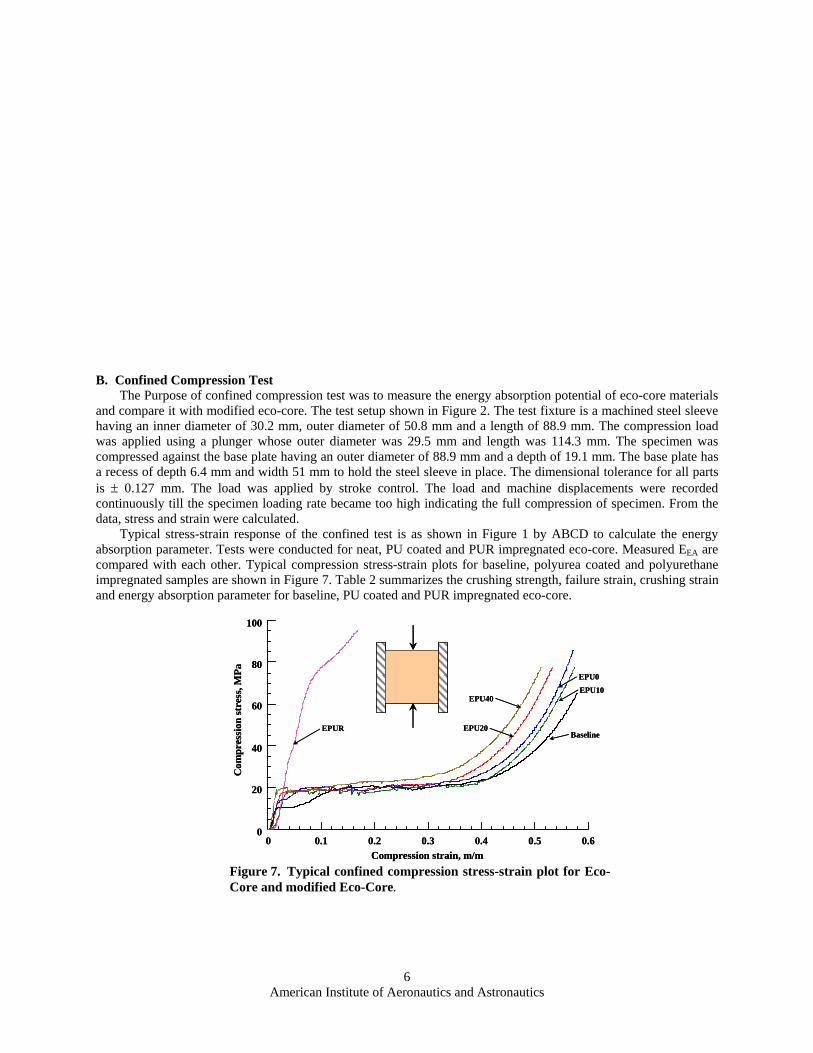
B. Confined Compression Test The Purpose of confined compression test was to measure the energy absorption potential of eco-core materials
and compare it with modified eco-core. The test setup shown in Figure 2. The test fixture is a machined steel sleeve having an inner diameter of 30.2 mm, outer diameter of 50.8 mm and a length of 88.9 mm. The compression load was applied using a plunger whose outer diameter was 29.5 mm and length was 114.3 mm. The specimen was compressed against the base plate having an outer diameter of 88.9 mm and a depth of 19.1 mm. The base plate has a recess of depth 6.4 mm and width 51 mm to hold the steel sleeve in place. The dimensional tolerance for all parts is ± 0.127 mm. The load was applied by stroke control. The load and machine displacements were recorded continuously till the specimen loading rate became too high indicating the full compression of specimen. From the data, stress and strain were calculated.
Typical stress-strain response of the confined test is as shown in Figure 1 by ABCD to calculate the energy absorption parameter. Tests were conducted for neat, PU coated and PUR impregnated eco-core. Measured EEA are compared with each other. Typical compression stress-strain plots for baseline, polyurea coated and polyurethane impregnated samples are shown in Figure 7. Table 2 summarizes the crushing strength, failure strain, crushing strain and energy absorption parameter for baseline, PU coated and PUR impregnated eco-core.
0
20
40
60
80
100
0 0.1 0.2 0.3 0.4 0.5 0.6
Com
pres
sion
stre
ss, M
Pa
Compression strain, m/m
EPUR
EPU0EPU10
BaselineEPU20
EPU40
0
20
40
60
80
100
0 0.1 0.2 0.3 0.4 0.5 0.6
Com
pres
sion
stre
ss, M
Pa
Compression strain, m/m
EPUR
EPU0EPU10
BaselineEPU20
EPU40
Figure 7. Typical confined compression stress-strain plot for Eco-Core and modified Eco-Core.
American Institute of Aeronautics and Astronautics
7
V. Discussion of Results
A. Unconfined Compression Table 1 summarizes density, compression modulus and strength of all eco-core and modified eco-core panels.
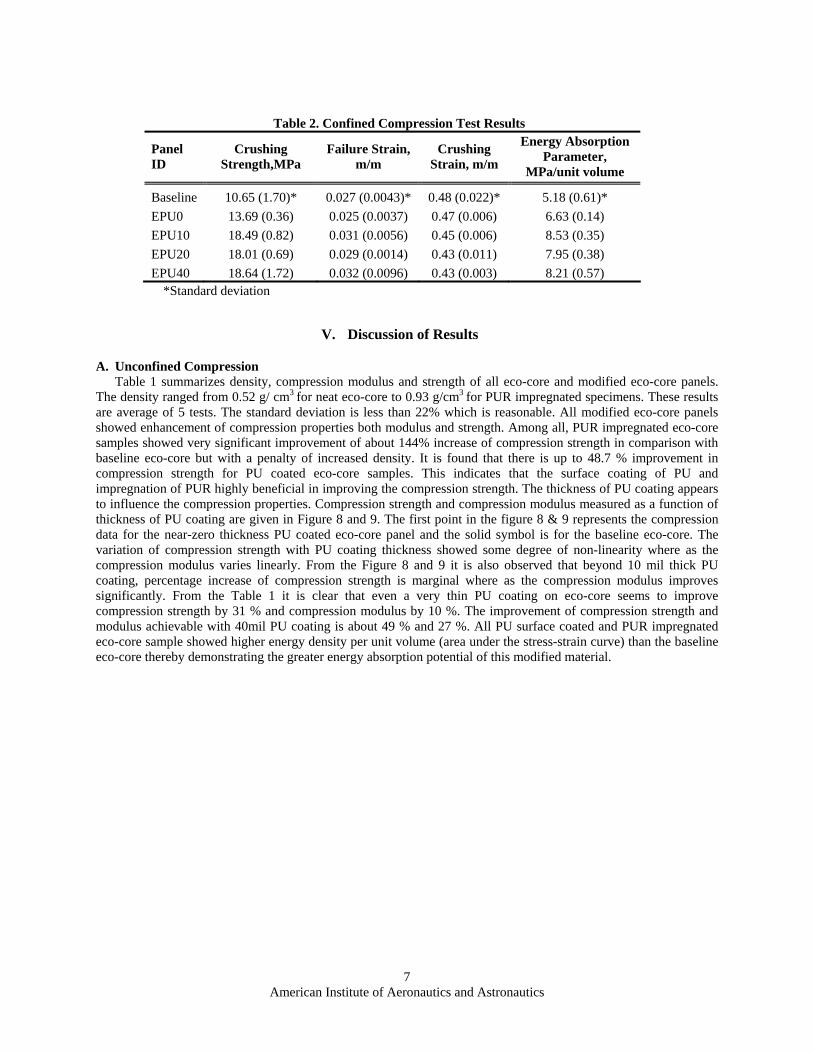
The density ranged from 0.52 g/ cm3 for neat eco-core to 0.93 g/cm3 for PUR impregnated specimens. These results are average of 5 tests. The standard deviation is less than 22% which is reasonable. All modified eco-core panels showed enhancement of compression properties both modulus and strength. Among all, PUR impregnated eco-core samples showed very significant improvement of about 144% increase of compression strength in comparison with baseline eco-core but with a penalty of increased density. It is found that there is up to 48.7 % improvement in compression strength for PU coated eco-core samples. This indicates that the surface coating of PU and impregnation of PUR highly beneficial in improving the compression strength. The thickness of PU coating appears to influence the compression properties. Compression strength and compression modulus measured as a function of thickness of PU coating are given in Figure 8 and 9. The first point in the figure 8 & 9 represents the compression data for the near-zero thickness PU coated eco-core panel and the solid symbol is for the baseline eco-core. The variation of compression strength with PU coating thickness showed some degree of non-linearity where as the compression modulus varies linearly. From the Figure 8 and 9 it is also observed that beyond 10 mil thick PU coating, percentage increase of compression strength is marginal where as the compression modulus improves significantly. From the Table 1 it is clear that even a very thin PU coating on eco-core seems to improve compression strength by 31 % and compression modulus by 10 %. The improvement of compression strength and modulus achievable with 40mil PU coating is about 49 % and 27 %. All PU surface coated and PUR impregnated eco-core sample showed higher energy density per unit volume (area under the stress-strain curve) than the baseline eco-core thereby demonstrating the greater energy absorption potential of this modified material.
Table 2. Confined Compression Test Results
Panel ID
Crushing Strength,MPa
Failure Strain, m/m
Crushing Strain, m/m
Energy Absorption Parameter,
MPa/unit volume
Baseline 10.65 (1.70)* 0.027 (0.0043)* 0.48 (0.022)* 5.18 (0.61)* EPU0 13.69 (0.36) 0.025 (0.0037) 0.47 (0.006) 6.63 (0.14) EPU10 18.49 (0.82) 0.031 (0.0056) 0.45 (0.006) 8.53 (0.35) EPU20 18.01 (0.69) 0.029 (0.0014) 0.43 (0.011) 7.95 (0.38) EPU40 18.64 (1.72) 0.032 (0.0096) 0.43 (0.003) 8.21 (0.57)
*Standard deviation

American Institute of Aeronautics and Astronautics
8
B. Confined Compression Calculation of energy absorption per unit volume of the material is shown in the Figure 1. Based on that
compression strength (σc), failure strain (εc) and crushing strain (εcrush) were measured for all material combination except for the PUR impregnated eco-core. Table 2 summarizes the crushing strength, failure strain, crushing strain and energy absorption parameter for baseline, PU coated and PUR impregnated eco-core. These results are average of 5 tests. All PU coated eco-core samples showed enhancement of energy absorption parameter. Among all, 10 mil thick coated Eco-Core samples showed very significant improvement of about 65 % increase of energy absorption parameter. Even a very thin coating of polyurea has improved the energy absorption by 28 %. The energy absorption parameter does not seem to depend on the thickness of the PU coating. Examining the Table 2, all the increase in energy absorption is due to increased compression strength. The crushing strain is same for all cases, which is evident from the foam formulation. Figure 10 shows the effect of thickness of PU coating on energy absorption parameter. The variation of energy absorption parameter with coating thickness is non-linear. From the Figure 7 it is noticed that the PUR Impregnated eco-core does not show much of compressibility that is required for energy absorption. This indicates that the PUR has filled up the voids between Cenosphere bubbles and more, which in turn must have prevented collapsing of the Cenospheres cells.
Figure 11 shows a plot of compression energy absorption per unit volume of the material versus density for various foam materials tested (balsa, PVC, open cell aluminum, polyimide, phenolic and eco-core). Among them, both balsa and eco-core have high-energy absorption capability. Although balsa has lower density and same energy absorption capability compared to eco-core, its energy absorption in transverse direction is poor. In structures that are subjected to multi axial stress state balsa may be a poor choice for those reasons. Therefore alternate materials like eco-core is being developed because its properties could be tailored to increase σc, εc, and εcrush, as well as density. The eco-core material shows a promise for further modifications to increase energy absorption capability as well as decreasing the density. Dynamic testing is needed to evaluate the performance under dynamic condition.
0
2
4
6
8
10
0 10 20 30 40 50
PU CoatedBaseline
Ene
rgy
Abs
orpt
ion
para
met
er
per
unit
volu
me,
MPa
Thickness of PU coating, mil
EEA = ½ σcεc+ σcεcrush
0
2
4
6
8
10
0 10 20 30 40 50
PU CoatedBaseline
Ene
rgy
Abs
orpt
ion
para
met
er
per
unit
volu
me,
MPa
Thickness of PU coating, mil
EEA = ½ σcεc+ σcεcrush
Figure 10. Variation of Energy Absorption Parameter of modified Eco-Core on thickness of PU coating
0
2000
4000
6000
8000
10000
12000
0 0.1 0.2 0.3 0.4 0.5 0.6
ALPPISMCATLBALSAAFP6ALDSPVC
Density, g/cc
Sp. E
nerg
y ab
sorp
tion,
kPa
Aluminum
foams
A&T’s Eco-Core
PVC
Balsa
0
2000
4000
6000
8000
10000
12000
0
2000
4000
6000
8000
10000
12000
0 0.1 0.2 0.3 0.4 0.5 0.60 0.1 0.2 0.3 0.4 0.5 0.6
ALPPISMCATLBALSAAFP6ALDSPVC
ALPPISMCATLBALSAAFP6ALDSPVC
Density, g/cc
Sp. E
nerg
y ab
sorp
tion,
kPa
Aluminum
foams
A&T’s Eco-Core
PVC
Balsa
Aluminum
foams
A&T’s Eco-Core
PVC
Balsa
Figure 11. Comparison of energy absorption versus density for various foams.
American Institute of Aeronautics and Astronautics
9
VI. Conclusion Eco-Core foam material was made using large volume of fly ash and small volume of high char yield binder by syntactic process. The eco-core is modified by surface coating of polyurea and impregnation by polyurethane to improve compression strength and energy absorption density. Through the surface coating of PU the compression strength is improved by 31- 49% and the energy absorption parameter by 28 – 65%. All the enhancement in energy absorption was by increase in compression strength. The impregnation of PUR enhanced the compression strength by 144% with a penalty of increased density. The energy absorption capability of the eco-core was measured through a confined compression test and it was compared with the modified eco-core and other foam materials. Eco-core and balsa showed the best performance. Although eco-core had higher density, it is fire resistant, its energy absorption performance can be tailored, and mechanical properties in transverse direction are superior to balsa. All the study was based on static tests; dynamic testing needs to be done to confirm the performance.
Acknowledgments The first two authors acknowledge the support of Office of Naval Research (grant N00014-01-1-1033 and Dr.
Yapa Rajapakse) and the U.S. Army Research Office (grant W911NF-04-D-0002 and Dr. Bruce LaMattina).
References 1Malloy R. A., and Hudson, J. A., “Foamed Composites”, International Encyclopedia of Composites, edited by S. M. Lee,
VCH Publishers, New York, 1990, pp. 2, 257. 2Hiel, C., Dietman, D., and Ishai, O., “Composite sandwich construction with syntactic foam core”, Composites, Vol. 24,
1993, pp. 447. 3Shutov, F. A., “Syntactic polymer foams”, Adv. Polym. Sci., Vol. 73, 1985, pp. 63. 4Deanin, R. D., Polymeric Materials Encyclopedia, edited by J. C. Salamone, CRC Press, New York, 1996, Vol. 4, pp. 2554. 5Campbell, F.C., “The Case Against Honeycomb Core”, SAMPE 2004, May 16-20, Long Beach, CA. 6Sorathia, U., “Improving the Fire Safety of Composite Materials for Naval Applications”, SAMPE 2004, May 16-20, Long
Beach, CA. 7Gupta, N., Karthikeyan, C. S., Sankaran, S., and Kishore, Materials Characterization, Vol. 43, 1999, pp. 271. 8Ruhno, R. A., and Sands, B. W., “Handbook for Fillers in Plastics”, edited by H. S. Katz and J. V. Mileski, Kluwer
Publishers, 1987, Chapter 22 , pp. 437. 9Bardella, L., and Genna, F., International Journal of Solids and Structures, Vol. 38, 2001, pp. 7235. 10Shivakumar, K., Sadler, R., Sharpe, M., and Argade, S., North Carolina A&T State University, Greensboro, NC, U. S.
Patent Application for a “Fire Resistant Structural Member”, Docket No. 10/702,063, filed Nov. 2003. 11Shivakumar, K., Argade, S., Sadler, R., “Processing and Properties of a Fire Resistance Core Material for Sandwich
Structures”, SAMPE 2004, May 16- 20, Long Beach, CA. 12Shivakumar, K., Sharpe, M., Sorathia, U., “Modification of Eco-Core Material for Improved Fire Resistance and
Toughness”, SAMPE 2005, May 1-5, Long Beach, CA. 13Russell Jr., L., and Shivakumar, K., "Energy Absorption Mechanism in Certain Foam Materials," Symposium of
Heterogeneous Materials, Society of Experimental Mechanics Conference, July 2005, Portland, Oregon. 14Ashby, M. F., “The Mechanical Properties of Cellular Solids”, Metallurgical Transactions A, Vol. 14A, 1983, pp 1755-
1769.