energy: A comparative analysis between the US and Japan on nuclear power (for questionnaire details,...
35
WORKING PAPER SERIES Consumers’ willingness to pay for renewable and nuclear energy: A comparative analysis between the US and Japan Kayo Murakami 1 Graduate School of Economics, Kyoto University, Japan Takanori Ida 2 Graduate School of Economics, Kyoto University, Japan Makoto Tanaka 3 National Graduate Institute for Policy Studies, Japan Lee Friedman 4 Goldman School of Public Policy, University of California Berkeley, USA August 2014 1 Corresponding author. Yoshida, Sakyo-ku, Kyoto 606-8501, Japan. E-mail: [email protected] 2 Yoshida, Sakyo-ku, Kyoto 606-8501, Japan. E-mail: [email protected] 3 7-22-1 Roppongi, Minato-ku, Tokyo 106-8677, Japan. E-mail: [email protected] 4 2607 Hearst Avenue, Berkeley, CA 94720-7320, USA. E-mail: [email protected]
Transcript of energy: A comparative analysis between the US and Japan on nuclear power (for questionnaire details,...

WORKING PAPER SERIES
Consumers’ willingness to pay for renewable and nuclear
energy: A comparative analysis between the US and Japan
Kayo Murakami1 Graduate School of Economics, Kyoto University, Japan
Takanori Ida2 Graduate School of Economics, Kyoto University, Japan
Makoto Tanaka3 National Graduate Institute for Policy Studies, Japan
Lee Friedman4 Goldman School of Public Policy, University of California Berkeley, USA
August 2014
1 Corresponding author. Yoshida, Sakyo-ku, Kyoto 606-8501, Japan.
E-mail: [email protected] 2 Yoshida, Sakyo-ku, Kyoto 606-8501, Japan.
E-mail: [email protected] 3 7-22-1 Roppongi, Minato-ku, Tokyo 106-8677, Japan.
E-mail: [email protected] 4 2607 Hearst Avenue, Berkeley, CA 94720-7320, USA.
E-mail: [email protected]

1
Consumers’ willingness to pay for renewable and nuclear
energy: A comparative analysis between the US and Japan
Abstract: This paper examines consumers’ willingness to pay for nuclear and renewable
electricity as two alternatives to fossil fuels for the reduction of greenhouse gas emissions.
We conduct a choice experiment of consumer-stated preferences on the basis of an online
survey in four US states and Japan after the Fukushima nuclear plant accident. First, the
results suggest that a US consumer’s willingness to pay for a 1% decrease in greenhouse
gas emissions is $0.31 per month, which is similar to results for the US a decade ago. The
Japanese consumer shows a slightly lower willingness to pay of $0.23 per month. Second,
the average consumer in both countries expresses a negative preference for increases in
nuclear power in the fuel mix (to a greater extent in Japan). Third, renewable energy
sources were endorsed by both US and Japanese consumers, who respectively show a
willingness to pay of $0.71 and $0.38 per month for a 1% increase in the use of renewable
source energy. This study also examines WTP differences by respondents’ characteristics.
Approximately 60% of the US respondents who did not change their perception
concerning the use of nuclear energy subsequent to the Fukushima nuclear crisis have
almost no preference for variation in nuclear power, which is in stark contrast to the
Japanese respondents’ opposition to nuclear energy.
Keywords: renewable energy, nuclear energy, choice experiment
JEL Classifications: O33, Q48, Q51

2
1. Introduction
Increasing awareness concerning global environmental problems and the
requirements for greenhouse gas (GHG) emissions reduction is the motivation for this
study. The Great East Japan Earthquake of March 2011, and the subsequent accident at
the Fukushima nuclear plant, raised concern with the trade-offs involved in replacing
fossil fuels with renewable sources and nuclear power to meet climate change goals.
Changing power sources presents advantages and disadvantages that add to a
complex process. For example, nuclear power has the potential to meet emissions
reduction targets; however, it also brings nuclear power generation risks such as the
environmental impact of radioactive waste and damage to the health of populations in the
event of a catastrophe. Renewable energy also has the potential to drastically reduce GHG
emissions and, as is the case with nuclear energy, it may have additional benefits such as
a decreased reliance on imported energy sources. The pursuit of renewable energy entails
substantial investment costs, intermittent supply, and associated local negative
externalities such as landscape change, noise, and potential harm to birds. Therefore,
consumer opinion concerning the overall value of the attributes of each power source
should be sought.
According to previous social survey findings, substantial public opposition to
nuclear energy exists in conjunction with the endorsement of renewable energy
investment (Ertor-Akyazi et al., 2012; Greenberg, 2009)1. Moreover, the extent to which
people are willing to pay a price premium for green electricity has been examined in
numerous empirical studies. These studies have found that people have a preference for
renewable energy (Goett et al., 2000; Menges et al., 2005; Grosche and Schoroder, 2011;
for a comprehensive review of recent literature, see Menegaki, 2008; 2012, and Zoric and
Hrovatin, 2012). Consumers prefer to avoid the risks related to nuclear power generation
1 Extensive literature addresses public preference for different energy sources. Ertor-
Akyazi et al. (2012) provide a comprehensive review of previous social surveys and
results concerning the endorsement of and opposition to renewables and nuclear power.
Greenberg (2009) reports the recent preferences of US households.

3
and prefer the implementation of future renewable energy generation systems. However,
recent evidence concerning relative consumer willingness to pay (WTP) for emissions
reduction through changing electricity sources, particularly nuclear relative to renewable
sources, is insufficient. The extent to which WTP differs according to the source type,
and according to the characteristics of the consumer, is not known. The Fukushima
nuclear crisis revealed evidence of change in consumer attitudes toward the electric power
source mix that includes nuclear and other alternative energy (Kato et al., 2013;
Stoutenborough et al., 2013; Siegrist et al., 2014; Hartmann et al., 2013; Kim et al., 2013)2.
The extent to which this affects relative WTP is a key issue and lends support to the further
investigation of consumer preferences.
Roe et al. (2001) were the first to evaluate consumers’ WTP for green electricity
using a choice experimental design that included a mix of fuels. The researchers found
that a higher level of WTP for emissions reduction stems from increased reliance on
renewable resources, and a lower level of WTP for emissions reduction stems from a
reliance on nuclear power (for questionnaire details, see Winneg et al., 1998). Based on
this, Borchers et al. (2007) estimated the WTP for each renewable energy source such as
wind, solar, farm methane, and biomass, individually, and found that solar energy is the
first preference for US households, although nuclear energy was not considered.
The results of Roe et al. (2001) also suggest that US consumers’ WTP varies
2 Kato et al. (2013) report the negative shift of attitudes toward the advantages and
disadvantages of hosting nuclear power plants by comparing local citizens' response data
from 2010 and 2011. The authors explain change in consumers' attitudes toward, and
safety perceptions of, nuclear power plants based on public sector knowledge and
information (Stoutenborough et al., 2013), and by the perception of risk and emotional
fear (Siegrist et al., 2014, Hartmann et al., 2013). For a review of changes in consumers'
attitudes toward the mixture of electric sources, see Kim et al. (2013). The authors
examine the effect of the Fukushima disaster on global public acceptance of nuclear
energy using extensive Global Snap Poll data, which was conducted by WIN-Gallup
International in 42 countries.

4
depending on the population segment. For certain segments only, larger premiums may
be obtained for emissions reduction that is accompanied by increased reliance on
renewable fuels. Recent literature, such as Komarek et al. (2011) and Cicia et al. (2012),
have investigated those who prefer each energy source in the context of market
segmentation and public decision making3. The study for the US by Komarek et al. (2011)
and that for Italy by Cicia et al. (2012) showed that consumer WTP varied according to
socio-economic characteristics and environmental awareness. Yoo and Ready (2014) is
the most recent paper investigating consumers’ attitudes toward multiple renewable
energies in Pennsylvania using choice experiments. The paper addresses preference
heterogeneity concerning different renewable technologies. Nuclear energy was not
included for consideration4.
This paper addresses consumer preference for two alternative fuels, nuclear and
renewable sources, as replacements for fossil fuels. We estimate the trade-off involved in
replacing fossil fuels with renewable sources and nuclear power with the aim of reducing
GHG emissions. This study expands the work of Roe et al. (2001) in terms of sample size
and estimation model and compares the results from four US states and Japan. This is the
first comparative study of US and Japanese preferences for renewable and nuclear energy,
and the first to use a choice experiment method and the same questionnaire. The trade-
offs with respect to different renewable sources are dependent on local geographical
3 Komarek et al. (2011) compared different preferences for campus energy strategies with
respect to fuel portfolios including nuclear power among three types of members of a
large university campus community in the US. Cicia et al. (2012) estimated preferences
for wind, solar, biomass, and nuclear energy using a latent class model in Italy. The
authors utilized choice experiments to investigate the WTP for different shares and types
of renewable energy sources. 4 Shin et al. (2014) is another recent study that investigates consumers’ preferences
concerning renewable policy using choice data. The authors focused on specific attributes
of the renewable portfolio standard policy such as employment, length of electricity
shortage, and damage to forest areas in Korea.

5
characteristics (e.g., the amount of sunlight or wind), whereas the priorities for renewable
sources relative to nuclear and fossil fuels are dependent on broader social or political
choices. The latter is of primary interest in this study and narrows the scope of the survey.
Additionally, the results of this study have policy implications concerning future
decisions to adopt renewable portfolio standards and target levels. For more on these
policies, see Schmalensee (2012).
The rest of this paper is organized as follows. Section 2 explains the online stated
preference survey method and the experimental design. Section 3 describes the discrete
choice model used for estimation. Section 4 contains details of the estimation results and
compares the WTP values of the mixture of electric energy sources. Section 5 extends the
analysis to differences in respondents’ characteristics and the expected acceptability for
several future energy services. Section 6 presents the conclusions.
2. Survey and design
Approximately one year after the Fukushima disaster, in February 2012, we
randomly drew a sample from 4,202 US households from four US states (web survey)—
California, Michigan, New York, and Texas. These states were chosen to reflect the
diversity of circumstances and attitudes that exist across the US. The selected states each
differ from one another and from other areas of the country and use different electricity
management systems5. However, the survey responses were similar in each of the four
5 California is in the west, Michigan the mid-west, New York the northeast, and Texas
the south. Texas has by far the greatest amount of competition at both wholesale and
retail levels (where customers can choose from competing power suppliers), followed
by New York, which has substantially less retail competition for residential customers.
California is next and has substantial wholesale competition but almost no retail
competition for residences, followed by Michigan, which has limited power supply
options.

6
states. Thus this study will sometimes refer to the average as the US result. For
comparison, we conducted a similar survey in Japan, which randomly drew a sample of
4,000 Japanese households one year later, in February 2013 (approximately two years
after Fukushima). In contrast to some of the US states, Japanese consumers cannot choose
their electricity provider and energy sources, but public interest in the ability to do so has
been increasing since the Fukushima nuclear crisis.
The respondent demographic profiles are presented in Table 1. No remarkable
differences are observed between the four US states and Japanese households with respect
to age. However, the percentage of female respondents in the US and Japan are 55% to
67% (US) and 44%, (Japan), respectively. Additionally, there is a greater number of
respondents with lower household income and no college degree in the Michigan state
sample. There are differences in monthly electricity expenses between the US and Japan.
Over half of US respondents pay at least $100 for electricity each month, whereas many
Japanese respondents pay less than $100 per month. Despite a lower monthly electricity
bill, household size is relatively larger in Japan than in the US. With respect to residential
type, the percentage of house owners is high in Michigan, New York, and Texas.
<Insert Table 1 here>
The questionnaire surveyed the current electricity usage of respondents and their
perceptions of certain alternative fuels. The questionnaire posed several hypothetical
electricity choice situations. The respondents received a small remuneration for
completing the questionnaire.
We considered the attributes of electricity service using the choice experiment
method. Our focus was on consumer preferences for GHG emissions reduction and two
alternative fuels, nuclear and renewable, which would replace fossil fuels. After
conducting several pretests, we determined the alternatives, attributes, and attribute levels,
shown in Table 26.
6 Current electricity generation by fuel is denoted as the following combination of
7
<Insert Table 2 here>
The attributes of the choice experiment are (1) the monthly electricity bill, (2) air
emissions, and (3) the fuel mix (the portfolio of different electricity sources). We
determined these attributes by referring to the work of Roe et al. (2001). This paper
examines the trade-off between renewables and nuclear power as alternatives to fossil
fuels; we determined the level of “nuclear” and “renewable” as independent, and the level
of “hydroelectric” as fixed. After excluding these sources, the remaining ratio is the level
of “fossil fuels.” Therefore, a 1% increase in the fuel mix from renewable sources is
accompanied by a 1% decrease in fossil fuels, and vice versa. Similarly, a 1% increase in
the fuel mix from nuclear power is accompanied by a 1% decrease in fossil fuels. Because
there are two different types of hydroelectric plants—small- or medium-scale, which are
classified into renewable sources, and large-scale plants such as dams, which are not
sustainable—we fixed the level of hydroelectric power generation at 10% to reflect the
current status.
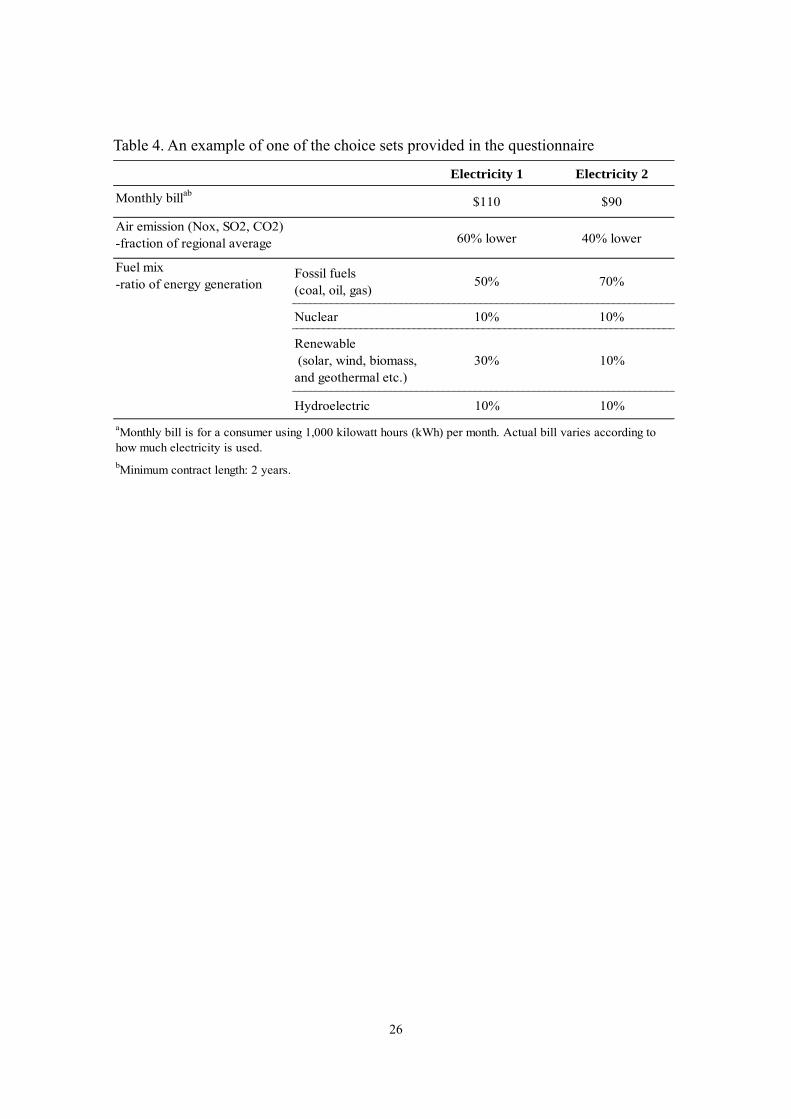
The questionnaire contained information required by the respondents to answer
questions including a description of the various energy sources used for the choice
experiment. This information is presented in Table 3. After the explanations, respondents
were asked to choose their preferred option from two alternatives, which denote different
hypothetical electricity services. Table 4 shows an example of one of the choice sets
provided in the questionnaire. All respondents were asked the same eight questions.
<Insert Table 3 here>
nuclear, renewables without hydroelectric, hydroelectric, and fossil fuels: 19.0%, 5.4%,
6.7%, 68.9% in the US, respectively; 9.3%, 15.0%, 13.7%, 62.0% in California; 25.9%,
3.5%, 0.4%, 70.2% in Michigan; 30.0%, 3.8%, 17.9%, 48.3% in New York; and 8.9%,
7.9%, 0.1%, 83.0% in Texas in 2012 (EIA, 2014b). In Japan, 28.8%, 1.1%, 8.5%, 61.7%
in 2010, and 1.7%, 1.6%, 8.4%, 88.3% in 2012 (FEPC, 2013).

8
<Insert Table 4 here>
3. Model specification
The response data collected from the survey were statistically analyzed using a
random parameter logit (RPL) model, which has greater flexibility than a conditional logit
(CL) model by assuming stochastic variation in the preference intensity. For example, the
preference for a specific energy source varied depending on the respondent. The RPL
model allows for random taste variation (McFadden and Train, 2000). The RPL model is
based on the random utility theory that assumes that utilities vary at random. A utility
function involving a defined term V and a random term 𝜀 is given by:
𝑈𝑖 = 𝑉𝑖(𝑥𝑖, 𝑚𝑖) + 𝜀𝑖, (1)
where 𝑥𝑖 is an attribute vector of a alternative i, and mi is a monetary attribute, which is
a monthly electricity bill in this study.
In linear-in-parameter form, the utility function can be written as follows.
𝑉𝑛𝑖𝑡 = 𝛽𝑛′𝑥𝑖𝑡 + 𝛾′𝑚𝑖𝑡, (2)
where 𝑥𝑖𝑡 and 𝑚𝑖𝑡 denote observable variables, 𝛽𝑛 denotes random parameter vectors,
and γ denotes a fixed parameter set as a numeraire. Subscript n represents distinctive
parameters for each individual, and subscript t represents choice situations. Thus, 𝑉𝑛𝑖𝑡
denotes the conditional utility of respondent n choosing alternative energy service i in
choice situation t.
Assuming that parameter 𝛽𝑛 is distributed with density function 𝑓(𝛽𝑛) (Train
2003, Louviere et al., 2000), the model specification allows for repeat choices by each
respondent, such that the coefficients vary according to respondent, but are constant over
each respondent’s choice situation. The logit probability of respondent n choosing
alternative energy service i in choice situation t is expressed as
𝐿𝑛𝑖𝑡(𝛽𝑛) = ∏ [exp (𝑉𝑛𝑖𝑡(𝛽𝑛)) ∑ exp (𝑉𝑛𝑗𝑡(𝛽𝑛))𝐽𝑗=1⁄ ]𝑇
𝑡=1 , (3)
which is the product of normal logit formulas, given parameter 𝛽𝑛, the observable portion
of utility function 𝑉𝑛𝑖𝑡 and alternatives j = 1, … , J (J = 2 𝑖𝑛 𝑡ℎ𝑖𝑠 𝑠𝑡𝑢𝑑𝑦) in choice
9
situations t = 1, … , 𝑇 (𝑇 = 8 𝑖𝑛 𝑡ℎ𝑖𝑠 𝑠𝑡𝑢𝑑𝑦) . Therefore, choice probability is a
weighted average of logit probability 𝐿𝑛𝑖𝑡(𝛽𝑛) evaluated at parameter 𝛽𝑛 with density
function𝑓(𝛽𝑛), which can be written as
𝑃𝑛𝑖𝑡 = ∫ 𝐿𝑛𝑖𝑡 (𝛽𝑛)𝑓(𝛽𝑛)𝑑𝛽𝑛. (4)
Accordingly, we can demonstrate variety in the parameters at the individual level
using the maximum simulated likelihood (MSL) method for estimation with a set of 100
Halton draws7. We estimated formula (2) and derived WTP values for each attribute using
this formula. Each respondent completed eight questions in the choice experiment; the
data formed a panel, and we applied a standard random effect estimation
A total differentiation of formula (2) gives:
𝑑𝑉𝑛𝑖𝑡 =𝜕𝑉𝑛𝑖𝑡
𝜕𝑥𝑘𝑖𝑡𝑑𝑥𝑘𝑖𝑡 + 𝑑𝑚𝑖𝑡 , (5)
where subscript ki denotes attribute k of alternative i. When the utility level does not
change (dV=0), and attributes other than the said attribute are invariable ( 𝑑𝑥𝑘𝑖𝑡 =
0 𝑓𝑜𝑟 𝑎𝑙𝑙 𝑘 ≠ 𝑙), the following marginal WTP is obtained.
MWTP𝑙 = 𝑑𝑚𝑖𝑡 𝑑𝑥𝑙𝑖𝑡⁄ = − 𝛽𝑙 𝛾⁄ (6)
4. Results and discussion
4.1. Respondents’ perceptions
Table 5 shows respondents’ perceptions with respect to electricity. We asked the
respondents to rate their interest in GHG emissions reduction. A total of 60% to 70% of
the respondents have a positive preference for government action to mitigate the risk of
7 Louviere et al. (2000, p. 201) suggested that 100 replications are sufficient for a typical
problem involving five alternatives, 1,000 observations, and up to 10 attributes (also see
Revelt and Train, 1998). The adoption of the Halton sequence draw is an important issue
(Halton, 1960). Bhat (2001) found that 100 Halton sequence draws are efficient for
simulating an ML model with over 1,000 random draws.

10
global warming. The percentage of respondents interested in GHG emissions reduction is
10% higher in California and New York than in the other jurisdictions.
The respondents were also asked whether their perception of nuclear power had
changed since the March 11, 2011 accident at the Fukushima nuclear power plant in Japan.
Table 5 shows that 65% of the Japanese respondents and 30% to 40% of the US
respondents had altered their perceptions since the incident. Table 5 further describes
respondent preferences for nuclear plants. Only 13% of Japanese respondents supported
the construction of new nuclear power plants. Contrastingly, one out of two respondents
in each of the four states favored building nuclear power plants.
Finally, a large majority in the four US states and the Japanese respondents endorsed
renewable energy sources. Solar power is preferred by the respondents from both
countries (approximately 80% in both countries), and wind power is the second most
preferred source of energy in the US. This finding is consistent with previous US social
surveys (Borthers et al., 2007; Greenberg, 2009). Geothermal power is the second most
preferred source of power among the Japanese respondents.
<Insert Table 5 here>
4.2. Estimation results
Table 6 displays the estimation results for the four US states and Japan. The number
of observations in California, Michigan, New York, Texas, and Japan is 8,176, 8,560,
8,168, 8,712, and 32,000 (number of respondents × 8 questions), respectively. The
McFadden R2 values are 0.15 (California), 0.19 (Michigan), 0.15 (New York), 0.16
(Texas), and 0.24 (Japan), all of which are sufficiently high for a discrete choice model.
We assume that the parameters, except for a monthly electricity bill that is set as a
numeraire, are distributed normally and the mean and standard deviation values are
reported.
First, the parameters of a monthly electricity bill are negative and statistically
significant in every area. All random parameters, except for nuclear power in Michigan,
are statistically significant. For the California, New York, Texas, and Japanese

11
respondents, the statistical estimates of mean represent monthly electricity bill (-), GHG
emissions reduction (+), nuclear (-), and renewable energy (+). Note that the symbols in
the parentheses are the signs for each estimate. Over half of the standard deviations of
random parameters are highly significant, which means it is appropriate to consider that
the parameters are random.
The parameters for a decrease in GHG emissions are positive. Therefore, the US and
Japanese respondents have a positive preference for GHG emissions reduction. The
parameters for an increase in the proportion of nuclear power in the fuel mix are negative,
which implies that the average respondent has a negative preference for an increase in
nuclear power. Similarly, the average respondent has a positive preference for an increase
in renewable power.
Table 6 also summarizes the WTP values, which are derived from subtracting the
parameter of the attribute divided by that of the monthly electricity bill. It is found that
US respondents would be willing to pay an additional $0.27 to $0.34 on a monthly basis
for the service with a 1% emissions reduction. They would also be willing to pay an
additional $0.69 to $0.74 per month for a 1% increase in renewable power. With respect
to nuclear power in the fuel mix, the WTP for a 1% decrease in nuclear power is $0.19
per month in New York and approximately $0.10 per month in California and Texas,
whereas Michigan respondents have no WTP for a change in nuclear power.
In comparison with US respondents, the Japanese respondents would be willing to
pay an additional $0.23 on a monthly basis for the service with a 1% emissions reduction,
which is slightly lower than the result for the US. They also would be willing to pay an
additional $0.38 per month for a 1% increase in renewable power, which is approximately
half of the WTP in the US. Moreover, the Japanese WTP for a 1% decrease in nuclear
power is $0.64 per month, which is substantially larger than that of the US. This fact
implies that the Japanese are strongly opposed to nuclear power (see Table 5).
<Insert Table 6 here>
Table 7 presents average WTP for a change in fuel mix and lowered emissions and
12
the result of Roe et al. (2001). For example, interpreting the top, left value in Table 7, the
US average respondent is willing to pay an additional $0.31 on a monthly basis for a 1%
decrease in GHG emissions. Similarly, they would be willing to pay $0.71 per month for
a 1% increase in renewable fuel accompanied by a 1% decrease in fossil fuels, and $0.11
per month for a 1% decrease in nuclear fuel accompanied by a 1% increase in fossil fuels.
Comparing the four US states, these WTP values are consistent with the US household
income levels shown in Table 1. That is, the higher the income level, the higher the WTP
they exhibit. Because the average monthly electricity bill in each area is $101 (California),
$141 (Texas), $105 (Michigan), $118 (New York), and $96 (Japan) as shown in Table 1,
the WTP values for a 1% decrease in GHG emissions reported in Table 7 are modest,
amounting to approximately 2% to 3% of the monthly electricity bill. Roe et al. (2001),
who surveyed US consumers’ WTP a decade ago, reported that the WTP for a 1%
decrease in GHG emissions is $0.26 per month. Therefore, US consumer preference for
GHG emissions reduction may have increased modestly.
Roe et al. (2001) also reported the WTP values for a 1% decrease in GHG emissions
with a 1% increase in renewable fuels, and a 1% decrease in GHG emissions with a 1%
increase in nuclear fuels. For a comparison with the results of Roe et al. (2001), we
calculate the same WTP values using the estimates in this study. The values shown in the
right two columns of Table 7 are obtained by simply summing related values. We assume
that interaction among marginal preferences for variations, such as an increase in
renewable power and GHG emissions reduction, are at or close to zero within a limited
extent. The values show that the average US respondent would be willing to pay $12.21
per year for a 1% decrease in GHG emissions with a 1% increase in renewable fuels, and
$2.43 per year for a 1% decrease in GHG emissions with a 1% increase in nuclear fuels.
The previous study reported that the average US respondent would be willing to pay $0.11
to $14.22 for a 1% decrease in GHG emissions with a 1% increase in renewable fuels,
and $1.03 to $14.43 for a 1% decrease in GHG emissions with a 1% increase in nuclear
fuels. The recent declining WTP for emissions reduction using nuclear power represents
a significant difference in preferences for renewable energy and nuclear power. Japanese
respondents would be willing to pay $7.37 per year for a 1% decrease in GHG emissions

13
with a 1% increase in renewable fuels, which is lower than the result in the US, and -
$4.89 per year for a 1% decrease in GHG emissions with a 1% increase in nuclear fuels,
which is opposite in sign to the US. This latter fact implies that Japanese consumers are
willing to resist an increase in the proportion of nuclear power even though a certain
amount of GHG emissions could be reduced.
<Insert Table 7 here>
Previous studies concerning the WTP for renewable energy and green electricity in
the US are listed in Table 8 (for consistency, all figures have been converted to show the
monthly value of a 1% increase in renewables). Many of these studies have analyzed
consumer WTP for renewable energy using contingent valuation (CV) methods, which is
a method often used to estimate the economic value of non-market goods and services
(e.g., Champ and Bishop, 2001; Whitehead and Cherry, 2007; Hite et al., 2008;
Mozumder et al., 2011). Recent studies have used a choice experiment method, which is
currently the most advanced methodology, and these studies analyzed preference
heterogeneity (Borchers et al., 2007; Yoo and Ready, 2014). The first three studies in
Table 8 did not specify the percent increase in renewable energy. Respondents evaluated
a general investment program promoting green energy with accompanying improvements
in air quality, visibility, natural resources, and human health. Thus, US consumers’
monthly average willingness to pay for green energy promotion ranges from $1 to $12.62.
In recent decades, several studies estimated WTP for an increase in renewable energy.
According to these studies, the monthly WTP for a 1% increase in renewable energy has
ranged from $0.58 to $5.02, similar to the result of $0.71 in our study. Table 8 shows that
US consumer preference for renewable energy has not changed significantly over the past
decade. Japanese consumers’ WTP is not within the US WTP range. Additionally,
according to the previous papers, the WTP for renewable energy is correlated with
consumer income, environmental concerns, and other perceptions.
<Insert Table 8 here>

14
5. Further discussions
5.1. Differences in respondent characteristics
To determine differences in WTP by income, residential area, and environmental
awareness we estimate the additional model. Table 9 displays the estimation results using
an RPL model with interaction terms between respondent characteristics and attribute
levels that show average differences by respondents’ perceptions. The McFadden R2
values are 0.16 (California), 0.19 (Michigan), 0.16 (New York), 0.17 (Texas), and 0.24
(Japan), all of which are sufficiently high for a discrete choice model.
The interaction terms that we added in this model are as follows. First, the interaction
term “high-income interaction” allows for shifting the mean of the monthly bill parameter
for high-income households by multiplying using a high-income dummy. This parameter
indicates the difference in preference between respondents with an income level higher
than the national median and respondents with an income level lower than the national
median. Second, the interaction term “GHG interaction” is for shifting the mean of the
GHG emissions reduction parameter by multiplying by a GHG interest dummy. This
parameter indicates the difference in preference between the respondents who think GHG
emissions should be reduced aggressively from the respondents who think otherwise.
Third, the interaction term “region interaction” is for shifting the mean of the nuclear
parameter by multiplying by a region dummy. This term, extracting the difference caused
by residential area, is added only to the Japanese model because 13 out of 47 prefectures
in Japan have an active nuclear plant at this time. We consider the differences from the
presence of a nuclear power plant in the neighborhood. The fourth and fifth interaction
terms, “nuclear change” and “renewable change,” shift the mean of the nuclear and
renewable energy parameters. These parameters indicate the difference in preferences of
the respondents whose perception concerning nuclear energy has changed following the
Fukushima crisis from the respondents whose perceptions have not changed.
The statistically significant estimates of interaction terms are GHG interaction (+)
and nuclear-change (-) in all areas. This indicates that the respondents who consider that
GHG emissions should be substantially reduced have a greater positive preference for

15
emissions reductions than the respondents who consider otherwise. Additionally, for the
respondents who changed their perceptions concerning nuclear energy after the
Fukushima crisis, the parameters of the increase in the proportion of nuclear power are
lower. Renewable change (-) is also statistically significant in California and Japan, which
implies that the change in the respondents’ perception for nuclear energy after the crisis
reduced the parameters of an increase in the proportion of renewable power in California
and Japan. For Japanese respondents only, high-income interaction (+) is statistically
significant, whereas the effects of higher income are not statistically significant for US
respondents. Therefore, a higher income mitigates disutility because of decreased
Japanese household income. Finally, regional interaction is not statistically significant,
which implies no significant differences among residential areas in Japan. Because this
result is counterintuitive, we may consider a specific regional area such as the municipal
level.
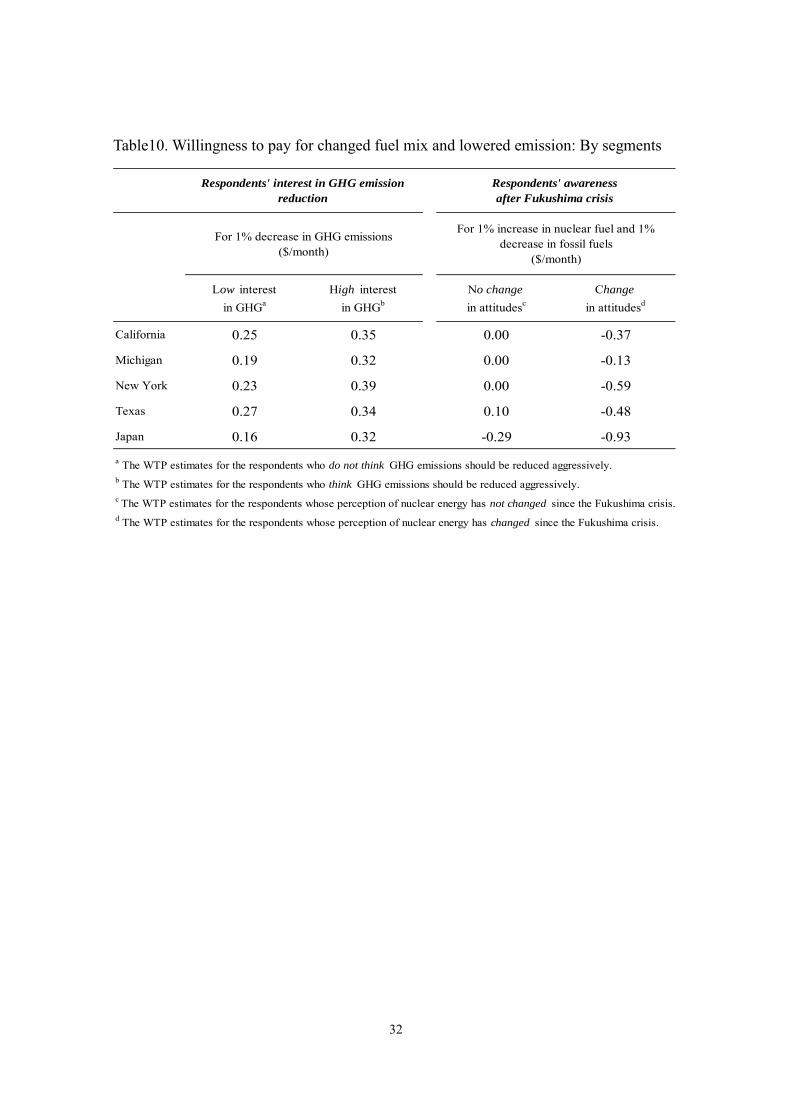
Table 10 shows the average WTP for changed fuel mix and lowered emissions
according to several respondent characteristics. The left two columns show the
respondents who have a positive preference for government action to mitigate the risk of
global warming. These respondents exhibit approximately 1.3 to two times higher WTP
for emissions reductions without altering the fuel mix than other respondents. For
example, the WTP values for 1% GHG reduction among respondents who consider that
GHG emissions should be reduced is $0.35 per month, which is 1.4 times higher than
respondents who consider otherwise; $0.25 in California.
The WTP values concerning an increase in nuclear fuels is particularly interesting.
For the respondents who changed their perceptions concerning nuclear energy after the
Fukushima crisis, the WTP values for an increase in the proportion of nuclear power are
-$0.37 (California), -$0.13 (Michigan), -$0.59 (New York), -$0.48 (Texas), and -$0.93
(Japan), which are negatively dominant. This result applies to both the US and Japan and
implies stronger opposition for increases in nuclear power. However, for those who have
not changed their perception for nuclear energy, remarkable differences are observed
among US and Japanese households. The WTP for an increase in the proportion of nuclear
power is not significant or slightly positive for the US respondents who have not changed

16
their perception after the crisis, whereas the WTP remains negative in Japan at a value of
-$0.29.
<Insert Table 9 here>
<Insert Table 10 here>
5.2. Expected acceptability for scenario variations
We calculate household acceptability with respect to four different scenarios of
electricity service using our estimation results. We determine the baseline scenario with
reference to the current US status. Table 11 presents the baseline scenario denoted by a
combination of monthly bill, GHG emissions reduction, nuclear, renewable, hydroelectric,
and fossil fuels, $100, 4%, 19%, 5%, 10%, and 66%, respectively. According to the
electricity projection for 2040 in the Annual Electricity Outlook (AEO) 2014, we devise
scenario 1 ($100, 4%, 16%, 6%, 10%, and 68%) as a future standard. Comparing scenario
1, which projects a future standard energy service, with the baseline scenario, which is
the current status, acceptability rates (explained below) are approximately equal with
slight variance because of differences in both services. Hereafter, we consider scenario 1
as a standard and compare the acceptability rates of three other scenarios.
The US government calls for an 80% clean energy target that raises the proportion
of clean energy from the current 40% to 80% by 2035. Clean energy includes nuclear,
renewables, and natural gas and clean coal, which are categorized as fossil fuels. Because
consumers stated their different preferences for each energy source in this study, it is
reasonable to expect acceptability variations of clean energy standards (CES) by
accelerated energy sources. First, we devise scenario 2 ($120, 20% emissions reduction,
16%, 6%, 10%, 68%), which meets CES goals by promoting natural gas and clean coal
energy, assuming rising costs from $100 to $120 per month for accelerating clean energy.
Similarly, scenario 3 ($120, 20% emissions reduction, 36%, 6%, 10%, 48%) meets CES
goals with a 20% increase in nuclear energy. Scenario 4 ($120, 20% emissions reduction,
16%, 26%, 10%, 48%) meets CES goals with a 20% increase in renewable energy.
We define acceptability rates as the ratio of choice probabilities, which are the
17
normal logit formulas shown in earlier estimations. Given the above chosen attribute
levels of each scenario, acceptability rates can be derived by calculating:
𝐴𝑐𝑐𝑒𝑝𝑡𝑎𝑏𝑖𝑙𝑖𝑡𝑦 𝑟𝑎𝑡𝑒𝑖 =exp(𝑉𝑖(𝛽))
exp(𝑉0(𝛽)) + exp(𝑉𝑖(𝛽))
exp(𝑉1(𝛽))
exp(𝑉0(𝛽)) + exp(𝑉1(𝛽))⁄ , (7)
where 𝑖 = 0, … ,4 are scenario numbers. We obtain each acceptability rate by calculating
the percentage change of choice probabilities based on the future standard scenario 1.
The results are presented in Figure 1. There are no remarkable differences among
the acceptability rates of the US four states. This implies that the average US consumer
has a similar preference for energy mix. Assuming 100% acceptability in the case of the
standard scenario 1, acceptability rates are 58.6% to 69.3% for scenario 2, 57.5% to
62.2% for scenario 3, and 94.4% to 100.5% for scenario 4. A comparison of the three
different scenarios, all of which are accompanied by an identical rise in electricity cost,
shows that the acceptability rates for scenario 4 are relatively high and maintain the same
levels as scenario 1, which requires no additional cost. Therefore, US consumers prefer
to meet CES goals through accelerated renewable sources rather than through fossil fuel
and nuclear energy use.
With respect to Japanese consumers, the acceptability rates for each scenario are
56.3%, 31.0%, and 75.8%. Scenario 4 is the most preferable, which is the case in the US.
Although there are no remarkable differences between the acceptability rates for scenarios
2 and 3 in the US, Japanese consumers have a strong resistance to scenario 3 and exhibit
approximately half the acceptability rate of the US for scenario 3. This fact reflects the
sensitivity to nuclear energy sources in Japan.
<Insert Table 11 here>
<Insert Figure 1 here>
6. Conclusion
This study conducted a choice experiment based on a web questionnaire survey. We
investigated US and Japanese consumer preferences for two alternative fuels, nuclear and

18
renewable sources, as energy sources that have potential to reduce GHG emissions.
Additionally, the study discusses the differences in preferences according to respondents’
characteristics.
The primary findings of this paper are as follows. First, the results for the US are
similar across the four states concerning consumers’ WTP for the reduction of air
emissions. People are willing to pay approximately $0.3 per month for a 1% decrease in
GHG emissions. Second, the average consumer expresses a negative preference for
increases in nuclear power in the fuel mix in both countries. In comparison with the US
results from the last decade, WTP for emissions reduction through the use of nuclear
power has been decreasing, which has caused a greater trade-off between renewable
energy and nuclear power. Additionally, Japanese consumers have a stronger aversion to
nuclear energy than US consumers. Third, US and Japanese consumers have a higher
acceptance for emissions reduction through the use of renewable sources. Moreover, WTP
varies depending on consumer characteristics such as interest and awareness. For example,
the US and Japanese consumers who changed their perceptions concerning the use of
nuclear energy after the Fukushima crisis have a higher opposition to nuclear energy in
both countries. Approximately 60% of the US respondents did not change their perception
subsequent to the crisis and have no preference for variation in nuclear power. Conversely,
Japanese consumers basically oppose an increase in nuclear power in the fuel mix
regardless of whether or not their perceptions have changed. Finally, the result of scenario
analysis indicates that US and Japanese consumers prefer to meet CES goals through
accelerated renewable sources rather than through fossil fuel and nuclear energy use.
To consider the variable characteristics of respondents, further study must analyze
the data using a latent class model to quantify household preferences for different energy
sources according to several classes. Cost-benefit approaches to policy discussions that
would include other important factors, such as power generation cost and social welfare
impacts, would also be valuable.
We acknowledge that all of these results are based on data analysis of stated
preferences that would benefit from confirmation using revealed preference data.
Therefore, further research should investigate whether our findings are consistent with

19
evidence from the real energy market.

20
References
[1] Bhat, C. 2001 "Quasi-random maximum simulated likelihood estimation of the
mixed multinomial logit model," Transportation Research B 35: 677-693.
[2] Borchers, A.M, J.M. Duke, and G.R. Parsons 2007 “Does willingness to pay for
green energy differ by source?” Energy Policy 35: 3327-3334.
[3] Champ, P.A., and R.C. Bishop 2001 “Donation payment mechanisms and contingent
valuation: An empirical study of hypothetical bias,” Environmental and Resource
Economics 19: 383-402.
[4] Cicia, G., L. Cembalo, T. Del Giudice, and A. Palladino 2012 “Fossil energy versus
nuclear, wind, solar and agricultural biomass: Insights from an Italian national
survey,” Energy Policy 42: 59-66.
[5] Ertor-Akyazi, P., F. Adaman, B. Ozkaynak, and U. Zenginobuz 2012 “Citizens’
preferences on nuclear and renewable energy sources: Evidence from Turkey,”
Energy Policy 47: 309-320.
[6] EIA, Energy Information Administration, US Department of Energy, 2014a, Annual
Energy Outlook 2014.
[7] EIA, Energy Information Administration, US Department of Energy, 2014b, State
Electricity Profile 2014.
[8] FEPC, the Federation of Electric Power Companies of Japan, 2013, “Electricity
Generation by fuel.”
[9] Goett, A.A., K. Hudson 2000 “Customers' Choice among Retail Energy Suppliers:
The Willingness-to-pay for Service Attributes,” Energy Journal 21(4): 1-28.
[10] Greenberg, M. 2009 “Energy sources, public policy, and public preferences:
Analysis of US national and site-specific data,” Energy Policy 37: 3242-3249.
[11] Grösche, P., and C. Schröder 2011 “Eliciting public support for greening the
electricity mix using random parameter techniques,” Energy Economics 33: 363–
370.
[12] Hartman, P., V. Apaolaza, C. D’Souza, C. Echebarria and J.M. Barrutia 2013
“Nuclear power threats, public opposition and green electricity adoption: Effects of
threat belief appraisal and fear arousal,” Energy Policy 62: 1366-1376.

21
[13] Hite, D., P. Duffy, D. Bransby, C. Slaton 2008 "Consumer willingness-to-pay for
biopower: Results from focus groups," Biomass and Bioenergy 32(1): 11-17.
[14] Kato, T., S. Takahara, M. Nishikawa, and T. Homma 2013 “A case study of economic
incentives and local citizens’ attitudes toward hosting a nuclear power plant in Japan:
Impacts of the Fukushima accident,” Energy Policy 59: 808-818.
[15] Kim, Y., M. Kim, and W. Kim 2013 “Effect of the Fukushima nuclear disaster on
global public acceptance of nuclear energy,” Energy Policy 61: 822-828.
[16] Komarek, T.M., F. Lupi, and M.D. Kaplowitz 2011“Valuing energy policy attributes
for environmental management: Choice experiment evidence from a research
institution,” Energy Policy 39: 5105-5115.
[17] Louviere, J.J., D. A., Hensher, and J. D. Swait 2000 “Stated Choice Methods,
analysis and applications” Cambridge: Cambridge University Press.
[18] Menges, R., C. Schroeder, and S. Traub 2005 "Altruism, warm glow and the
willingness-to-donate for green electricity: An artefactual field experiment,"
Environmental and Resource Economics 31: 431–458.
[19] McFadden, D., and K.E. Train 2000 "Mixed MNL models of discrete choice
models of discrete response," Journal of Applied Econometrics 15: 447-470.
[20] Menegaki, A.N. 2008 “Valuation for renewable energy: A comparative review,”
Renewable and Sustainable Energy Reviews 12(9): 2422-2437.
[21] Manegaki, A.N. 2012 “A social marketing mix for renewable energy in Europe based
on consumer stated preference surveys,” Renewable Energy 39: 30-39.
[22] Mozumder, P., W.F. Vasquez, and A. Marathe 2011 "Consumers' preference for
renewable energy in the southwest USA," Energy Economics 33:1119-1126.
[23] Revelt, D., and K. Train 1998 "Mixed logit with repeated choices: Households'
choices of appliance efficiency level," Review of Economics & Statistics 80: 647-
657.
[24] Roe, B., M.F. Teisl, A. Levy, and Matthew Russell 2001 “US consumers' willingness
to pay for green electricity,” Energy Policy 29: 917-925.
[25] Schmalensee, R. 2012 “Evaluating policies to increase electricity generation from
renewable energy,” Review of Environmental Economics and Policy 6: 5-64.

22
[26] Shin, J., J. Woo, S-Y Huh, J. Lee, and G. Jeong 2014 “Analyzing portfolio standards
in Korea,” Energy Economics 42: 17-26.
[27] Siegrist, M., B. Sutterlin, and C. Keller 2014 “Why have some people changed their
attitudes toward nuclear power after the accident in Fukushima?” Energy Policy
forthcoming.
[28] Stoutenborough, J. W., S.G. Sturgess and A. Vedlitz 2013 “Knowledge, risk and
policy support: Public perceptions of nuclear power,” Energy Policy 62: 176-184
[29] Train, K. E., 2003 “Discrete Choice Methods with Simulation,” Cambridge:
Cambridge University Press.
[30] Whitehead, J.C., and T.L. Cherry 2007 "Willingness to pay for a green energy
program: A comparison of ex-ante and ex-post hypothetical bias mitigation
approaches," Resource and Energy Economics 29(4):247–261.
[31] Winneg, K. M.J. Herrmann, A.S. Levy, S. Alan, and B. Roe, 1998 “Label testing:
Results of mall-intercept study,” Consumer Information Disclosure Series, The
Regulatory Assistance Project, ME
[32] Yoo, J., and Richard C. Ready 2014 “Preference heterogeneity for renewable energy
technology,” Energy Economics 42: 101-114.
[33] Zarnikau, J. 2003 "Consumer demand for 'green power' and energy efficiency,"
Energy Policy 31:1661-1672.
[34] Zoric, J., and N. Hrovatin 2012 “Household willingness to pay for green electricity
in Slovenia,” Energy Policy 47: 180-187.

23
Table 1. Summary statistics of sample respondents
Region California Michigan New York Texas Japan
Number of participants in sample 1,022 1,070 1,021 1,089 4,000
Female 55% 67% 62% 63% 44%Age (mean) 44 48 49 50 46Annual income (mean)a
$60,000-$65,000
$50,000-$55,000
$65,000-$70,000
$55,000-$60,000
$60,000-$65,000
With a college degree 59% 47% 59% 52% 60%
Monthly electricity bill (mean)a $101 $105 $118 $141 $96
Household structure (%)
1: Single 33 25 29 27 14 2: Couple 19 22 20 25 19 3: Married or single parent and unmarried child 35 42 39 38 43 4: Two adult generations under one roof 9 8 8 8 10 5: Three adult generations under one roof 2 2 2 2 8 6: Other 3 1 2 1 5
Residential type (%)
1: Owned house 53 73 65 70 51 2: Owned townhouse, condominium, or apartment
7 5 9 2 16
3: Leased house 9 6 4 8 4 4: Leased townhouse, condominium, or apartment
21 12 17 15 25
5: Dormitory or corporate housing 0 0 1 0 3 6: Other 9 5 5 4 1
a 1USD = 100 JPY

24
Table 2. Electricity service attributes and levels used in the choice experiment
Levels
$90, $100, $110, $120 for US respondents
7000JPY, 8000JPY, 9000JPY, 10000JPYfor Japanese respondents
Air emission (Nox, SO2, CO2)-fraction of regional average
No reduction, 20% lower, 40% lower, 60%lower
Fossil fuels(coal, oil, gas) (Display the remaining %)
Nuclearb 0%, 10%, 20%, 30%
Renewablec
(solar, wind, biomass,and geothermal etc.)
0%, 10%, 20%, 30%
Hydroelectric (10%, fixed)d
c A 1% increase in fuel mix from renewable resources is accompanied by a 1% decrease in fossil fuels, and vice versa.
d To focus on the tradeoff between renewables and nuclear power as alternatives to fossil fuels, we determined thelevel of “nuclear” and “renewable” as independent and the level of “hydroelectric” as fixed. We determined theseattributes by referring to the work of Roe et al. (2001).
Attribute
Monthly billa
Fuel mix-ratio of energy generation
a With advisory note for respondents "Monthly bill is for a consumer using 1,000 kilowatt hours (kWh) per month.
Actual bill will vary according to how much electricity you use " in the questionnaire. In this survey, US respondents'actual monthly average bill is between $100 and $125, while Japanese respondents' actual monthly average bill isbetween $75 to $100. We determined this attribute level for each country according to their actual monthly bill.
b A 1% increase in fuel mix from nuclear power is accompanied by a 1% decrease in fossil fuels, and vice versa.

25
Table 3. The descriptions of each energy source
Category Source Description
Renewable Solar power Light energy from the sun is converted into electricity by solar
panels. Solar energy has no environmental impact. The output varies
depending on the amount of solar radiation (e.g., during cloudy and
rainy weather).
Wind power Rotational kinetic energy generated from windmill rotation is
transmitted to power plants and converted to electricity. The
conversion of airflow into energy results has no environmental
impact. Production varies depending on wind levels, but 24-hour
output is possible.
Biomass Heat generated from burning wood, garbage, dead animals, and
waste is converted into electricity. Carbon dioxide produced by
burning resources is absorbed in the resource growing process. Thus,
there is no environmental impact. Output can be controlled.
Geothermal heat Steam power generated by pumping hot water deep within the earth is
used to rotate turbines and generate electricity. Japan is a volcanic
country and rich in geothermal energy. This energy source is not
influenced by weather or time of day and has the potential to provide
a long-term steady supply of energy.
Small/medium
hydro-energy
Small and medium-sized (under 1000 kw) hydro-energy plants
generate electricity from the flow and vertical interval of rivers and
canals. Unlike large-scale facilities, natural landscapes are utilized
and the construction of large-scale dams is not necessary.
Exhaustible Thermal energy
(Fossil fuels)
Electricity is generated by burning fossil fuels (exhaustible
resources) such as petroleum, coal, and natural gas. Carbon dioxide
is released in the burning process and has significant environmental
impact. Output is controllable and a steady supply of electricity is
possible.
Nuclear power The heat energy released by nuclear fission of uranium is used to
heat water and generate steam. The electricity is produced by steam
power that rotates a steam turbine. Carbon dioxide is not released in
the process, but a high level of radioactive materials are produced as
waste.
26
Table 4. An example of one of the choice sets provided in the questionnaire
Electricity 1 Electricity 2
$110 $90
Air emission (Nox, SO2, CO2)-fraction of regional average 60% lower 40% lower
Fossil fuels(coal, oil, gas)
50% 70%
Nuclear 10% 10%
Renewable (solar, wind, biomass,and geothermal etc.)
30% 10%
Hydroelectric 10% 10%
Monthly billab
Fuel mix-ratio of energy generation
aMonthly bill is for a consumer using 1,000 kilowatt hours (kWh) per month. Actual bill varies according tohow much electricity is used.bMinimum contract length: 2 years.

27
Table 5. Respondents’ perception
Regiona California(2012)
Michigan(2012)
New York(2012)
Texas(2012)
Japan(2013)b
Number of sample 1,022 1,070 1,021 1,089 4,000
Respondents' interest in GHG emissions reductions
"The government should aggressively work on reducing the emissionof greenhouse gases to mitigate climate change."
-Totally agree, Somewhat agree
(GHG = 1 in Table 9 estimation model)68.2% 59.1% 69.0% 60.7% 59.3%
-Neither
(GHG = 0 in Table 9 estimation model)19.6% 25.5% 21.2% 22.7% 32.8%
-Totally disagree, Somewhat disagree
(GHG = 0 in Table 9 estimation model)12.2% 15.4% 9.9% 16.6% 8.0%
Respondents' awareness after Fukushima crisis
"My perception toward nuclear power has changed since the nuclearaccident at the Fukushima nuclear power plants in Japan on March11, 2011."
-Totally agree, Somewhat agree
(Change = 1 in Table 9 estimation model)39.9% 34.2% 40.4% 34.0% 64.6%
-Neither
(Change = 0 in Table 9 estimation model)34.1% 38.3% 34.4% 35.9% 25.7%
-Totally disagree, Somewhat disagree
(Change = 0 in Table 9 estimation model)26.0% 27.5% 25.3% 30.1% 9.7%
Respondents' view on the future of nuclear power in their country
-New plants should be built as part of an aggressive program of
expansion.15.4% 10.1% 12.2% 12.7% 2.6%
-New plants should be built, but cautiously. 35.2% 39.6% 36.1% 40.6% 10.6%
-The current situation should be maintained. 17.0% 20.0% 17.5% 17.0% 16.9%
-Current nuclear power plants should be demolished in the future. 8.8% 5.6% 9.1% 6.1% 46.3%
-Current nuclear power plants should be immediately demolished. 4.9% 2.1% 4.8% 4.4% 16.7%
-No idea. 18.7% 22.5% 20.2% 19.3% 7.0%
The ratio of the respondents who think the following renewablesources should be widely implemented in the future.c
-Solar power generation at home
(placing a solar panel on the roof of a house)85.1% 75.1% 80.1% 79.2% 78.2%
-Mega-solar power generation
(setting large-scale solar panels in open country)76.9% 69.0% 72.9% 73.0% 77.6%
-Wind power generation76.6% 79.2% 79.5% 78.8% 70.4%
-Geothermal power generation68.0% 64.3% 66.1% 65.2% 78.8%
a US survey was conducted in 2012. All states surveyed have nuclear plants.b The survey in Japan was conducted in 2013, a year after the US survey.c The sum of the ratio of respondents who replied "totally agree" to those who replied "somewhat agree."

28
Table 6. Estimation result: Four US states and Japan
Coeff. s.e.b WTP($) Coeff. s.e. WTP
($) Coeff. s.e. WTP($) Coeff. s.e. WTP
($) Coeff. s.e.WTP($)a
Monthly bill (US$) -0.047 0.002 *** -0.057 0.002 *** -0.045 0.002 *** -0.050 0.002 *** -0.060 0.001 ***
GHG emissions reduction (%) 0.015 0.001 *** 0.32 0.015 0.001 *** 0.27 0.015 0.001 *** 0.34 0.015 0.001 *** 0.31 0.014 0.001 *** 0.23
Nuclear (%) -0.005 0.002 *** -0.11 -0.001 0.002 -0.02 -0.009 0.002 *** -0.19 -0.005 0.002 ** -0.09 -0.039 0.001 *** -0.64
Renewable (%) 0.034 0.002 *** 0.72 0.039 0.002 *** 0.69 0.033 0.002 *** 0.74 0.034 0.002 *** 0.69 0.023 0.001 *** 0.38
GHG emission reduction (%) 0.008 0.003 *** 0.000 0.003 0.000 0.003 0.001 0.004 0.001 0.001
Nuclear (%) 0.041 0.003 *** 0.039 0.002 *** 0.045 0.003 *** 0.046 0.003 *** 0.051 0.002 ***
Renewable (%) 0.031 0.003 *** 0.037 0.003 *** 0.030 0.003 *** 0.035 0.003 *** 0.002 0.003
Number of observations
McFadden Psedo R-squared
Log likelihood function
b *** denotes 1% significance, and ** denotes 5% significance.
-4803.8 -4799.6 -4818.5 -5053.1 -16765.7a 1USD = 100 JPY
8,712 32,000
0.1523 0.1911 0.1489 0.1632 0.2441
8,168
Mean of fixed parameter
Mean of random parameter
Standard deviation of random parameters
8,176 8,560
US respondentsJapan
California Michigan New York Texas

29
Table 7. Average willingness to pay for changed fuel mix and lowered emission
For 1% decrease in GHG emissions
For 1% increasein renewable fueland 1% decrease
in fossil fuels
For 1% increasein nuclear fuel
and 1% decreasein fossil fuels
1% decreasein GHG emission
1% increasein renewable fuel
1% decreasein fossil fuelsc
1% decrease in GHG emissions
1% increasein nuclear fuel1% decreasein fossil fuelsc
($/month) ($/month) ($/month) ($/yr) ($/yr)
United Statesa
*this study 2012 0.31 0.71 -0.11 12.21 2.43
-California 0.32 0.72 -0.11 12.48 2.45
-Michigan 0.27 0.69 -0.02 11.43 2.93
-New York 0.34 0.74 -0.19 12.97 1.78
-Texas 0.31 0.69 -0.09 11.98 2.55
Japan
*this study 2013 0.23 0.38 -0.64 7.37 -4.89
United Statesb
*Roe et al. 20010.03-0.47 0.11-14.22 1.03-14.43
a The US average values of the four states.b Roe et al. (2001) found significant differences across regions, different segments, such as income level and education, andenvironmental organization affiliation. The range of results are shown here.c This WTP value is obtained by summing related values, assuming that interaction among marginal preferences for variations, such asincrease in renewable power and GHG emission reduction are zero or little different from zero, within a limited extent.

30
Table 8. Recent studies on WTP for general renewable energy in the US
Survey time WTP (US$/month) Survey area Object analyzed Author
N.A. 4.91-8.42 Wisconsin WTP for a wind-generated electricitya Champ and Bishop 2001
1999 1.00 Texas WTP for supporting utility investments in renewablesa Zarnikau 2003
2002 4.24-12.62 North Carolina WTP for green energy programa Whitehead and Cherry 2007
2005 0.65 Alabama WTP for 1% of electric from biopowerb Hite et al. 2008
2006 0.58-1.33 Delaware WTP for 1% increase in general renewable energybc Borcher et al. 2007
2010 0.58-0.93 New Mexico WTP for a energy program providing 1% share of generalrenewable energyb Mozumder et al. 2011
2011 4.61-5.02 Pennsylvania WTP for a programs promoting renewable electricityproductiond Yoo and Ready 2014
2012 0.71 United States(4 states)
WTP for 1% increase in renewable fuel and 1% decrease infossil fuels This study
2013 0.38 Japan WTP for 1% increase in renewable fuel and 1% decrease infossil fuels This study
b The monthly value of a 10% increase in renewables was estimated. In the table, the original value has been converted to show the monthly value of a 1% increase for consistency.
d We calculate an average value of WTP for solar, wind, biomass, and other renewables using the original results.N.A.= not available
a Percent increase in renewable energy was not specified. Respondents evaluated a general investment program promoting green energy with accompanying improvements in air quality,visibility, natural resources, and human health. The value in the table represents monthly WTP for this program.
c We calculate an average value of WTP for general green energy, solar, wind, farm methane, and biomass using the original results.

31
Table 9. Estimation result: Interaction model
Coeff. s.e. Coeff. s.e. Coeff. s.e. Coeff. s.e. Coeff. s.e.
Monthly bill (US$) -0.048 0.002 *** -0.058 0.002 *** -0.045 0.002 *** -0.049 0.002 *** -0.075 0.001 ***
GHG emissions reduction (%) 0.012 0.002 *** 0.011 0.001 *** 0.010 0.002 *** 0.013 0.001 *** 0.012 0.001 ***
Nuclear (%) 0.003 0.002 0.002 0.002 0.003 0.002 0.005 0.002 ** -0.022 0.002 ***
Renewable (%) 0.039 0.003 *** 0.038 0.003 *** 0.034 0.002 *** 0.033 0.002 *** 0.026 0.001 ***
Monthly bill_high income (>median)a 0.001 0.003 0.002 0.004 0.000 0.003 -0.003 0.003 0.006 0.002 ***
GHG emissions reduction (%) _GHGa 0.005 0.002 ** 0.008 0.002 *** 0.007 0.002 *** 0.004 0.004 ** 0.012 0.001 ***
Nuclear (%) _Regionc - - - - 0.001 0.004Nuclear (%) _Change
d -0.020 0.004 *** -0.009 0.004 ** -0.030 0.004 *** -0.028 0.004 *** -0.048 0.003 ***
Renewable (%) _Changed -0.012 0.004 *** 0.003 0.004 -0.003 0.004 0.005 0.004 -0.005 0.002 ***
GHG emissions reduction (%) 0.008 0.003 *** 0.000 0.003 0.000 0.003 0.001 0.004 0.002 0.005Nuclear (%) 0.040 0.003 *** 0.039 0.002 *** 0.043 0.002 *** 0.045 0.002 *** 0.071 0.002 ***
Renewable (%) 0.030 0.003 *** 0.037 0.003 *** 0.030 0.003 *** 0.035 0.003 *** 0.000 0.003
Number observationsMcFadden Psedo R-squared
Log likelihood function
US respondents Japanese
respondentsCalifornia Michigan New York Texas
Mean of parameters
Mean of shift parameters
-additional interaction term
S.D. of random parameters
8,176 8,712 32,0000.1561 0.1551 0.1677 0.2533
8,1688,5600.1931
b Interaction term for shifting the mean of parameter of GHG emissions reduction by multiplying by GHG interest dummy. GHG = 1 if the respondents think GHG emissionsshould be reduced aggressively. See Table 5.c Interaction term for shifting the mean of parameter of nuclear by multiplying by region dummy. Region = 1 if the respondents live in the prefecture that has active nuclearpower plants. The four US states all have active nuclear power plants.d Interaction term for shifting the mean of parameter of nuclear and renewable energy by multiplying by change dummy. Change = 1 if the respondents' perception for nuclearenergy has changed after the Fukushima crisis. See Table 5.e *** denotes 1% significance, ** denotes 5% significance, and * denotes 10% significance.
-4782.5 -4783.8 -5026.2 -16563.1a Interaction term for shifting the mean of parameter of monthly bill by multiplying by high income dummy. High income = 1 if the respondents' income level is higher than thenational median. See Table 5.
-4787.4
32
Table10. Willingness to pay for changed fuel mix and lowered emission: By segments
Low interestin GHGa
High interestin GHGb
No change
in attitudescChange
in attitudesd
California 0.25 0.35 0.00 -0.37
Michigan 0.19 0.32 0.00 -0.13
New York 0.23 0.39 0.00 -0.59
Texas 0.27 0.34 0.10 -0.48
Japan 0.16 0.32 -0.29 -0.93a The WTP estimates for the respondents who do not think GHG emissions should be reduced aggressively.b The WTP estimates for the respondents who think GHG emissions should be reduced aggressively.c The WTP estimates for the respondents whose perception of nuclear energy has not changed since the Fukushima crisis.d The WTP estimates for the respondents whose perception of nuclear energy has changed since the Fukushima crisis.
Respondents' interest in GHG emission
reduction
For 1% decrease in GHG emissions($/month)
For 1% increase in nuclear fuel and 1%decrease in fossil fuels
($/month)
Respondents' awareness
after Fukushima crisis

33
Table 11. Scenario variations
Baseline
(Scenario 0)
Current US statusc
Scenario 1
2040 projectiond
Scenario 2
Meets CESe using
accelerated fossil
fuels
Scenario 3
Meets CESe using
accelerated
nuclear
(20% increase in
nuclear)
Scenario 4
Meets CESe by
accelerated
renewables
(20% increase in
renewables)
Monthly bill (US$) 100 100 120 120 120GHG emissions reduction (%) 4 4 20 20 20Nuclear (%) 19 16 16 36 16
Renewable (%)a 5 6 6 6 26Hydroelectric 10 10 10 10 10
Fossil fuelsb 66 68 68 48 48
e Clean Energy Standards. Clean Energy includes Nuclear, Renewable, Natural gas, and Clean coal .
a Without hydroelectric energyb Fossil fuels include Natural gas and Clean coal , both of which are clean energy.c US Energy Information Administration "State electricity profile."d US Energy Information Administration "Annual Energy Outlook 2014," Early Release Overview, Fig.13.

34
Figure 1. Acceptability rates of energy services by accelerated source
62.2%
58.6%
57.5%
94.4%
69.3%
100.5%
100.0%
56.3%
31.0%
75.8%
0%
20%
40%
60%
80%
100%
Scenario 12040 projection
($100)
Scenario 2meets CES byacceleratedfossil fuels
($120)
Scenario 3meets CES byaccelerated
nuclear($120)
Scenario 4meets CES byacceleratedrenewables
($120)
California
Michigan
NewYork
Texas
Japan
Scenario variations
Acceptability rates