Enercom, Inc. The Oil and Gas Conference August 19-23, 2007.

CRZO
ENERCOM THE OIL & GAS CONFERENCE Carrizo Oil & Gas August 13-17, 2017
CRZO 2 2 2
Forward Looking Statements / Note Regarding Reserves
This presentation contains statements concerning the Company’s intentions, expectations, beliefs, projections, assessments of risks, estimations, plans or predictions for the future, objectives, goals, strategies, future events or performance and underlying assumptions and other statements that are not historical facts. These statements are “forward-looking statements” within the meaning of the Private Securities Litigation Reform Act of 1995. The forward-looking statements in this presentation include, but are not limited to, statements relating to the Company’s business and financial outlook, cost and risk profile of oil and gas exploration and development activities, quality and risk profile of Company’s assets, liquidity and the ability to finance exploration and development activities, including accessibility of borrowings under the Company’s revolving credit facility, commodity price risk management activities and the impact of our average realized prices, growth strategies, ability to explore for and develop oil and gas resources successfully and economically, estimates and forecasts of the timing, number, profitability and other results of wells we expect to drill and other exploration activities, drilling inventory, downspacing, infill drilling and completion optimization results, estimates regarding timing and levels of production or reserves, estimated ultimate recovery, the Company’s capital expenditure plan and allocation by area, cost reductions and savings, efficiency of capital, the price of oil and gas at which projects break-even, future market conditions in the oil and gas industry, ability to make, integrate and develop acquisitions and realize any expected benefits or effects of completed acquisitions, midstream arrangements and agreements, gas marketing strategy, lease terms, expected working or net revenue interests, the ability to adhere to our drilling schedule, acquisition of acreage, including number, timing and size of projects, planned evaluation of prospects, probability of prospects having oil and gas, working capital requirements, liquids weighting, rates of return, net present value, 20167exploration and development plans, any other statements regarding future operations, financial results, business plans and cash needs and all other statements that are not historical facts. Statements in this presentation regarding availability under our revolving credit facility are based solely on the current borrowing base commitment amount and amounts outstanding on such date. The amounts we are able to borrow under the revolving credit facility are subject to, and may be less due to, compliance with financial covenants and other provisions of the credit agreement governing our revolving credit facility.
You generally can identify forward-looking statements by the words “anticipate,” “believe,” budgeted,” “continue,” “could,” “estimate,” “expect,” “forecast,” “goal,” “intend,” “may,” “objective,” “plan,” “potential,” “predict,” “projection,” “scheduled,” “should,” or other similar words. Such statements rely on assumptions and involve risks and uncertainties, many of which are beyond our control, including, but not limited to, those relating to a worldwide economic downturn, availability of financing, the Company’s dependence on its exploratory drilling activities, the volatility of and changes in oil and gas prices, the need to replace reserves depleted by production, operating risks of oil and gas operations, the Company’s dependence on key personnel, factors that affect the Company’s ability to manage its growth and achieve its business strategy, results, delays and uncertainties that may be encountered in drilling, development or production, interpretations and impact of oil and gas reserve estimation and disclosure requirements, activities and approvals of our partners and parties with whom we have alliances, technological changes, capital requirements, the timing and amount of borrowing base determinations (including determinations by lenders) and availability under our revolving credit facility, evaluations of us by lenders under our revolving credit facility, other actions by lenders, the potential impact of government regulations, including current and proposed legislation and regulations related to hydraulic fracturing, oil and natural gas drilling, air emissions and climate change, regulatory determinations, litigation, competition, the uncertainty of reserve information and future net revenue estimates, acquisition risks, availability of equipment and crews, actions by midstream and other industry participants, weather, our ability to obtain permits and licenses, the results of audits and assessments, the failure to obtain certain bank and lease consents, the existence and resolution of title defects, new taxes and impact fees, delays, costs and difficulties relating to our joint ventures, actions by joint venture parties, results of exploration activities, the availability and completion of land acquisitions, cost of oilfield services and equipment, completion and connection of wells, and other factors detailed in the “Risk Factors” and other sections of the Company’s Annual Report on Form 10-K for the year ended December 31, 2016 and other filings with the Securities and Exchange Commission (“SEC”). Should one or more of these risks or uncertainties materialize, or should underlying assumptions prove incorrect, actual outcomes may vary materially from those indicated.
Each forward-looking statement speaks only as of the date of the particular statement or, if not stated, the date printed on the cover of the presentation. When used in this presentation, the word “current” and similar expressions refer to the date printed on the cover of the presentation. Each forward-looking statement is expressly qualified by this cautionary statement and the Company undertakes no obligation to update or revise any forward-looking statement, whether as a result of new information, future events or otherwise. All subsequent written and oral forward-looking statements attributable to us or persons acting on our behalf are expressly qualified in their entirety by reference to these risks and uncertainties. You should not place undue reliance on forward-looking statements. The information contained in this presentation does not purport to be all-inclusive or to contain all information that potential investors may require.
We may use certain terms such as “Resource Potential” that the SEC’s guidelines strictly prohibit us from including in filings with the SEC. Our Probable (2P) and Possible (3P) reserves do not meet SEC rules and guidelines (including those relating to pricing) for such reserves. These terms include reserves with substantially less certainty, and no discount or other adjustment is included in the presentation of such reserve numbers. U.S. investors are urged to consider closely the disclosure in our Form 10-K for the year ended December 31, 2016, File No. 000-29187-87, and in our other filings with the SEC, available from us at 500 Dallas, Suite 2300, Houston, Texas, 77002. These forms can also be obtained from the SEC by calling 1-800-SEC-0330.
CRZO 3 3 3
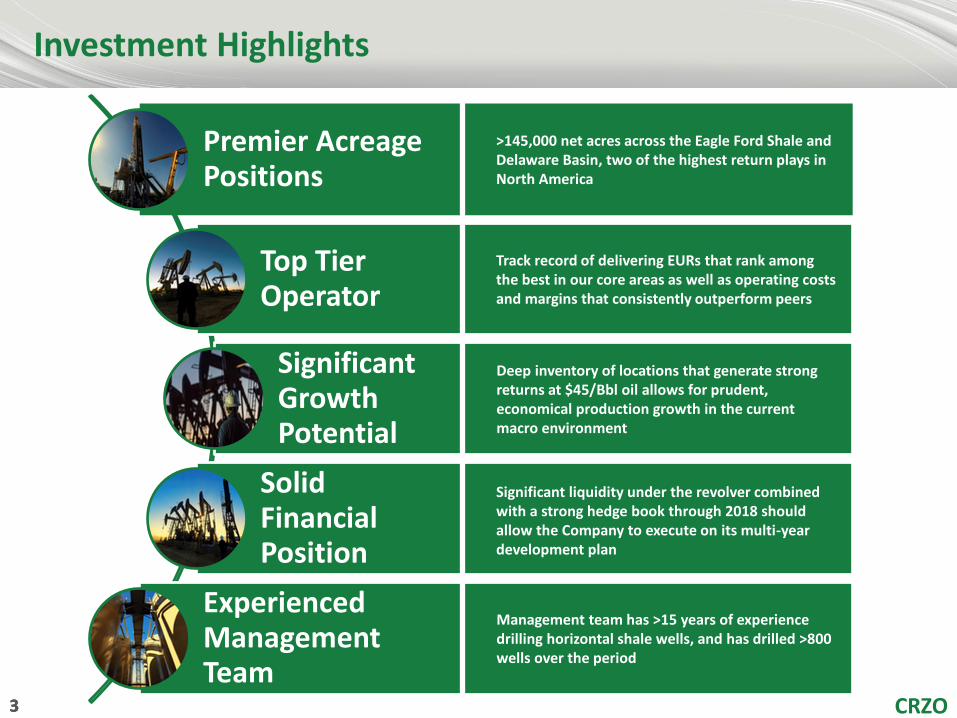
Investment Highlights
Premier Acreage Positions
Top Tier Operator
Significant Growth Potential
Solid Financial Position
Experienced Management Team
>145,000 net acres across the Eagle Ford Shale and Delaware Basin, two of the highest return plays in North America
Track record of delivering EURs that rank among the best in our core areas as well as operating costs and margins that consistently outperform peers
Deep inventory of locations that generate strong returns at $45/Bbl oil allows for prudent, economical production growth in the current macro environment
Significant liquidity under the revolver combined with a strong hedge book through 2018 should allow the Company to execute on its multi-year development plan
Management team has >15 years of experience drilling horizontal shale wells, and has drilled >800 wells over the period
CRZO 4 4 4
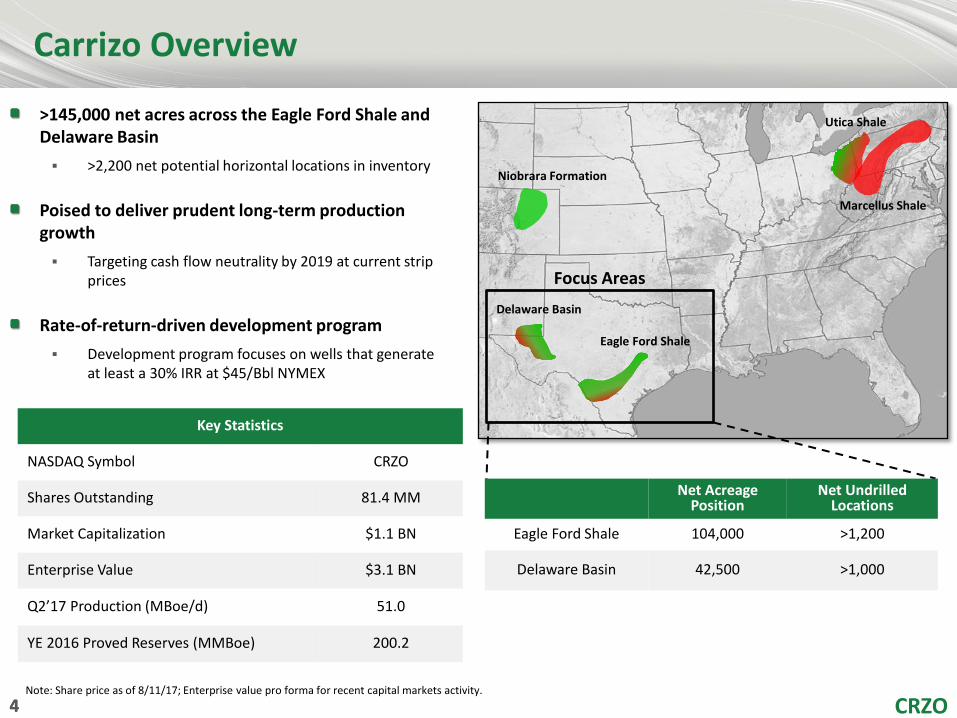
Carrizo Overview
>145,000 net acres across the Eagle Ford Shale and Delaware Basin
>2,200 net potential horizontal locations in inventory
Poised to deliver prudent long-term production growth
Targeting cash flow neutrality by 2019 at current strip prices
Rate-of-return-driven development program
Development program focuses on wells that generate at least a 30% IRR at $45/Bbl NYMEX
Core Positions in Two Basins
Niobrara Formation
Delaware Basin
Eagle Ford Shale
Utica Shale
Marcellus Shale
Focus Areas
Key Statistics
NASDAQ Symbol CRZO
Shares Outstanding 81.4 MM
Market Capitalization $1.1 BN
Enterprise Value $3.1 BN
Q2’17 Production (MBoe/d) 51.0
YE 2016 Proved Reserves (MMBoe) 200.2
Note: Share price as of 8/11/17; Enterprise value pro forma for recent capital markets activity.
Net Acreage Position
Net Undrilled Locations
Eagle Ford Shale 104,000 >1,200
Delaware Basin 42,500 >1,000
CRZO 5 5 5
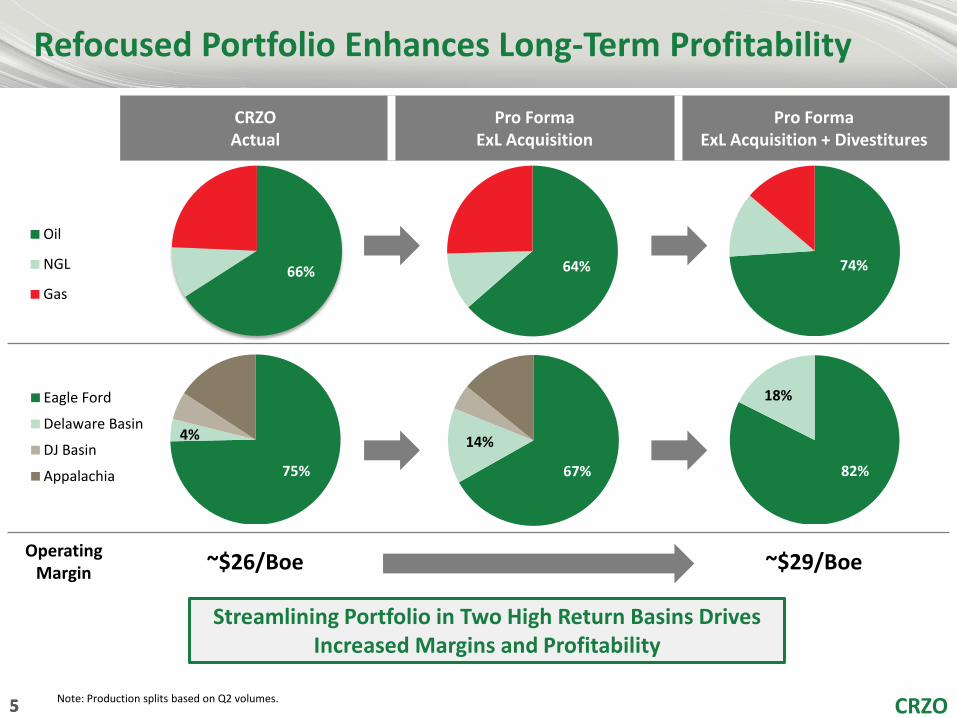
CRZO Actual
Pro Forma ExL Acquisition
Pro Forma ExL Acquisition + Divestitures
Operating Margin
~$26/Boe ~$29/Boe
66%
Oil
NGL
Gas
Refocused Portfolio Enhances Long-Term Profitability
64% 74%
75%
4%
Eagle Ford
Delaware Basin
DJ Basin
Appalachia 67%
14%
82%
18%
Streamlining Portfolio in Two High Return Basins Drives Increased Margins and Profitability
Note: Production splits based on Q2 volumes.
CRZO 6 6 6
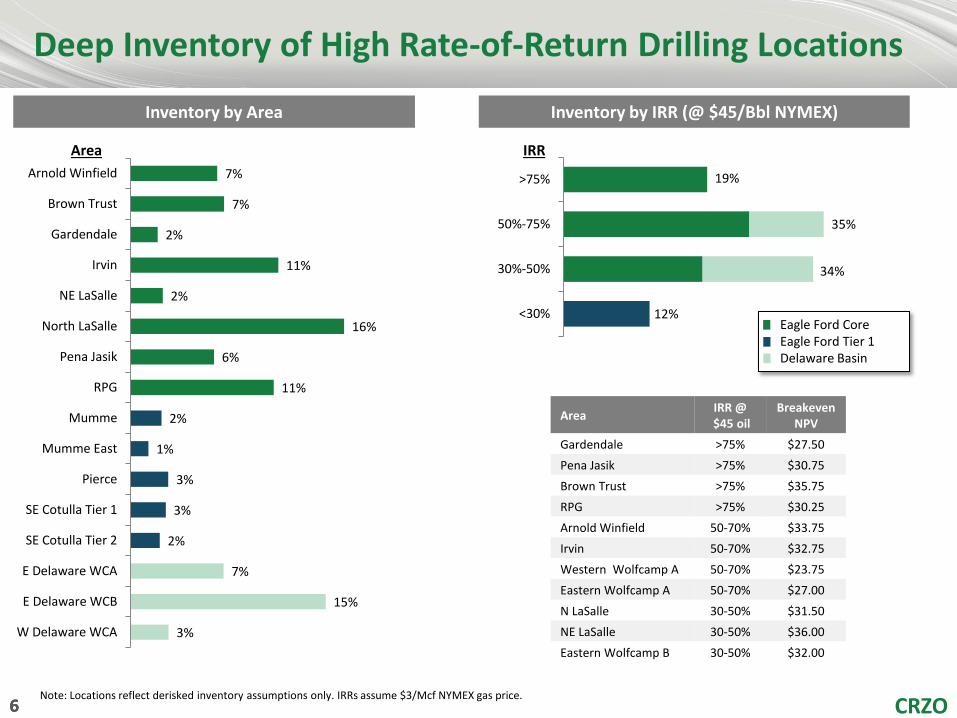
7%
7%
2%
11%
2%
16%
6%
11%
2%
1%
3%
3%
2%
7%
15%
3%
Arnold Winfield
Brown Trust
Gardendale
Irvin
NE LaSalle
North LaSalle
Pena Jasik
RPG
Mumme
Mumme East
Pierce
SE Cotulla Tier 1
SE Cotulla Tier 2
E Delaware WCA
E Delaware WCB
W Delaware WCA
>75%
50%-75%
30%-50%
<30%
Deep Inventory of High Rate-of-Return Drilling Locations
Note: Locations reflect derisked inventory assumptions only. IRRs assume $3/Mcf NYMEX gas price.
Inventory by Area Inventory by IRR (@ $45/Bbl NYMEX)
IRR Area
Eagle Ford Core Eagle Ford Tier 1 Delaware Basin
Area IRR @
$45 oil Breakeven
NPV
Gardendale >75% $27.50
Pena Jasik >75% $30.75
Brown Trust >75% $35.75
RPG >75% $30.25
Arnold Winfield 50-70% $33.75
Irvin 50-70% $32.75
Western Wolfcamp A 50-70% $23.75
Eastern Wolfcamp A 50-70% $27.00
N LaSalle 30-50% $31.50
NE LaSalle 30-50% $36.00
Eastern Wolfcamp B 30-50% $32.00
19%
35%
34%
12%
CRZO 7 CRZO 7 7 CRZO 7 7 CRZO 7
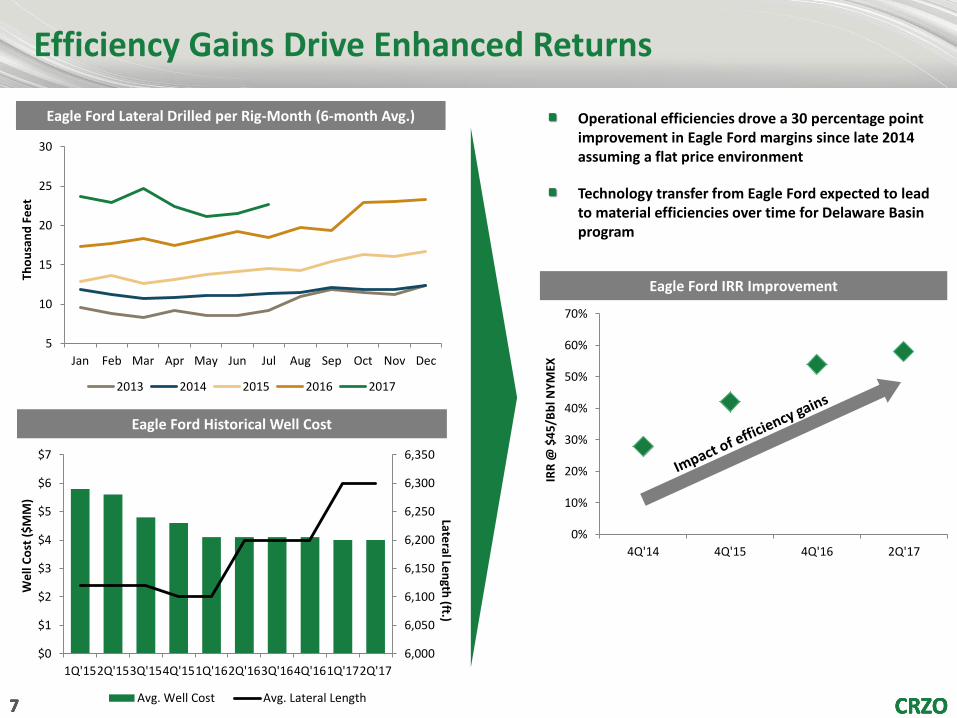
Operational efficiencies drove a 30 percentage point improvement in Eagle Ford margins since late 2014 assuming a flat price environment
Technology transfer from Eagle Ford expected to lead to material efficiencies over time for Delaware Basin program
Efficiency Gains Drive Enhanced Returns
6,000
6,050
6,100
6,150
6,200
6,250
6,300
6,350
$0
$1
$2
$3
$4
$5
$6
$7
1Q'152Q'153Q'154Q'151Q'162Q'163Q'164Q'161Q'172Q'17
Lateral Le
ngth
(ft.)
We
ll C
ost
($
MM
)
Avg. Well Cost Avg. Lateral Length
5
10
15
20
25
30
Jan Feb Mar Apr May Jun Jul Aug Sep Oct Nov Dec
Tho
usa
nd
Fe
et
2013 2014 2015 2016 2017
Eagle Ford Historical Well Cost
Eagle Ford Lateral Drilled per Rig-Month (6-month Avg.)
Eagle Ford IRR Improvement
0%
10%
20%
30%
40%
50%
60%
70%
4Q'14 4Q'15 4Q'16 2Q'17IR
R @
$4
5/B
bl N
YM
EX
CRZO 8 8 8
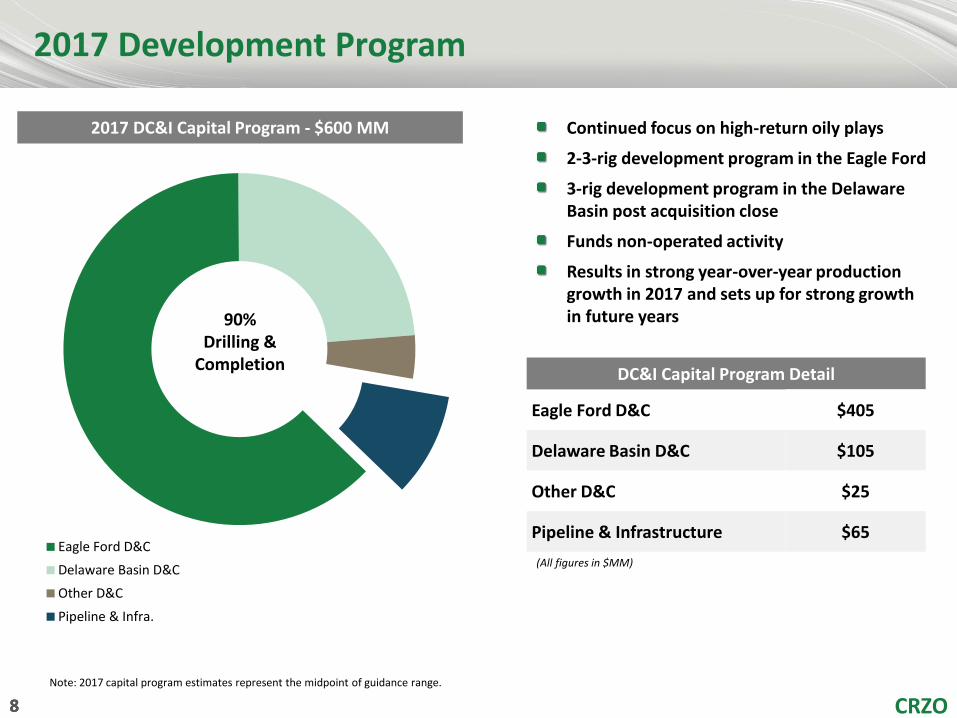
2017 Development Program
Eagle Ford D&C
Delaware Basin D&C
Other D&C
Pipeline & Infra.
Continued focus on high-return oily plays
2-3-rig development program in the Eagle Ford
3-rig development program in the Delaware Basin post acquisition close
Funds non-operated activity
Results in strong year-over-year production growth in 2017 and sets up for strong growth in future years
2017 DC&I Capital Program - $600 MM
90% Drilling &
Completion
Note: 2017 capital program estimates represent the midpoint of guidance range.
DC&I Capital Program Detail
Eagle Ford D&C $405
Delaware Basin D&C $105
Other D&C $25
Pipeline & Infrastructure $65
(All figures in $MM)
CRZO 9 9 9
0
5
10
15
20
25
30
35
40
FY14 FY15 FY16 FY17E
Net
Dai
ly P
rod
. (M
Bo
e/d
)
0
10
20
30
40
50
60
FY14 FY15 FY16 FY17E
Net
Dai
ly P
rod
. (M
Bo
e/d
)
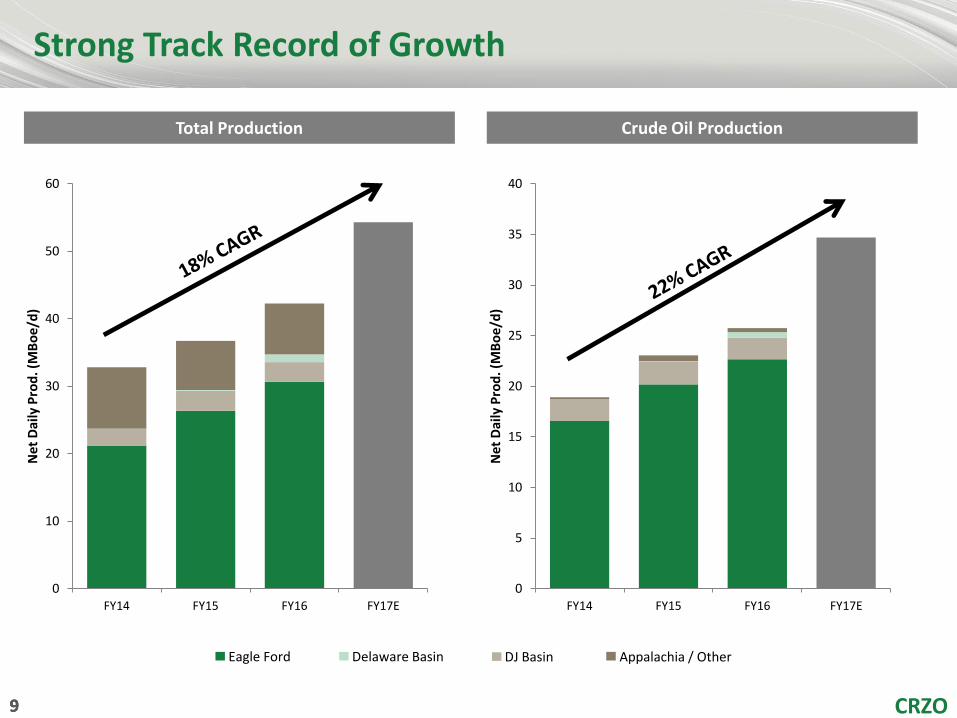
Strong Track Record of Growth
Total Production Crude Oil Production
Appalachia / Other DJ Basin Delaware Basin Eagle Ford
CRZO 10 10 10
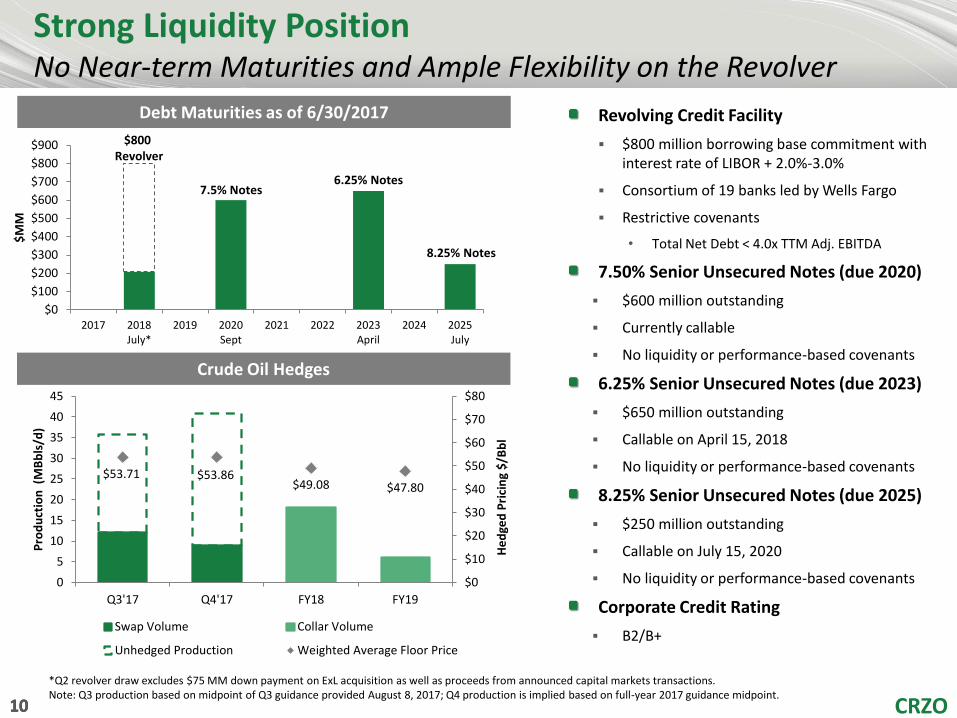
Strong Liquidity Position No Near-term Maturities and Ample Flexibility on the Revolver
$0
$100
$200
$300
$400
$500
$600
$700
$800
$900
2017 2018July*
2019 2020Sept
2021 2022 2023April
2024 2025July
$M
M
7.5% Notes 6.25% Notes
$800 Revolver
Debt Maturities as of 6/30/2017
$53.71 $53.86 $49.08 $47.80
$0
$10
$20
$30
$40
$50
$60
$70
$80
0
5
10
15
20
25
30
35
40
45
Q3'17 Q4'17 FY18 FY19
He
dge
d P
rici
ng
$/B
bl
Pro
du
ctio
n (
MB
bls
/d)
Swap Volume Collar Volume
Unhedged Production Weighted Average Floor Price
Crude Oil Hedges
Revolving Credit Facility
$800 million borrowing base commitment with interest rate of LIBOR + 2.0%-3.0%
Consortium of 19 banks led by Wells Fargo
Restrictive covenants
• Total Net Debt < 4.0x TTM Adj. EBITDA
7.50% Senior Unsecured Notes (due 2020)
$600 million outstanding
Currently callable
No liquidity or performance-based covenants
6.25% Senior Unsecured Notes (due 2023)
$650 million outstanding
Callable on April 15, 2018
No liquidity or performance-based covenants
8.25% Senior Unsecured Notes (due 2025)
$250 million outstanding
Callable on July 15, 2020
No liquidity or performance-based covenants
Corporate Credit Rating
B2/B+
8.25% Notes
*Q2 revolver draw excludes $75 MM down payment on ExL acquisition as well as proceeds from announced capital markets transactions. Note: Q3 production based on midpoint of Q3 guidance provided August 8, 2017; Q4 production is implied based on full-year 2017 guidance midpoint.
CRZO 11 CRZO 11 11 CRZO 11 11 CRZO 11
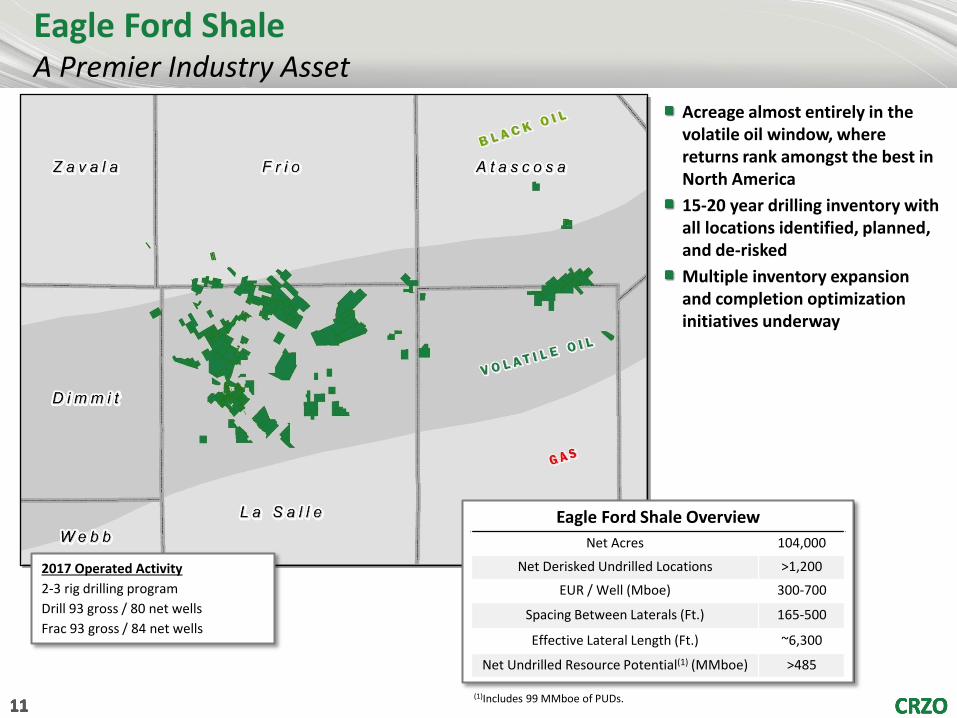
Acreage almost entirely in the volatile oil window, where returns rank amongst the best in North America
15-20 year drilling inventory with all locations identified, planned, and de-risked
Multiple inventory expansion and completion optimization initiatives underway
Eagle Ford Shale A Premier Industry Asset
Eagle Ford Shale Overview
Net Acres 104,000
Net Derisked Undrilled Locations >1,200
EUR / Well (Mboe) 300-700
Spacing Between Laterals (Ft.) 165-500
Effective Lateral Length (Ft.) ~6,300
Net Undrilled Resource Potential(1) (MMboe) >485
(1)Includes 99 MMboe of PUDs.
2017 Operated Activity
2-3 rig drilling program
Drill 93 gross / 80 net wells
Frac 93 gross / 84 net wells
CRZO 12
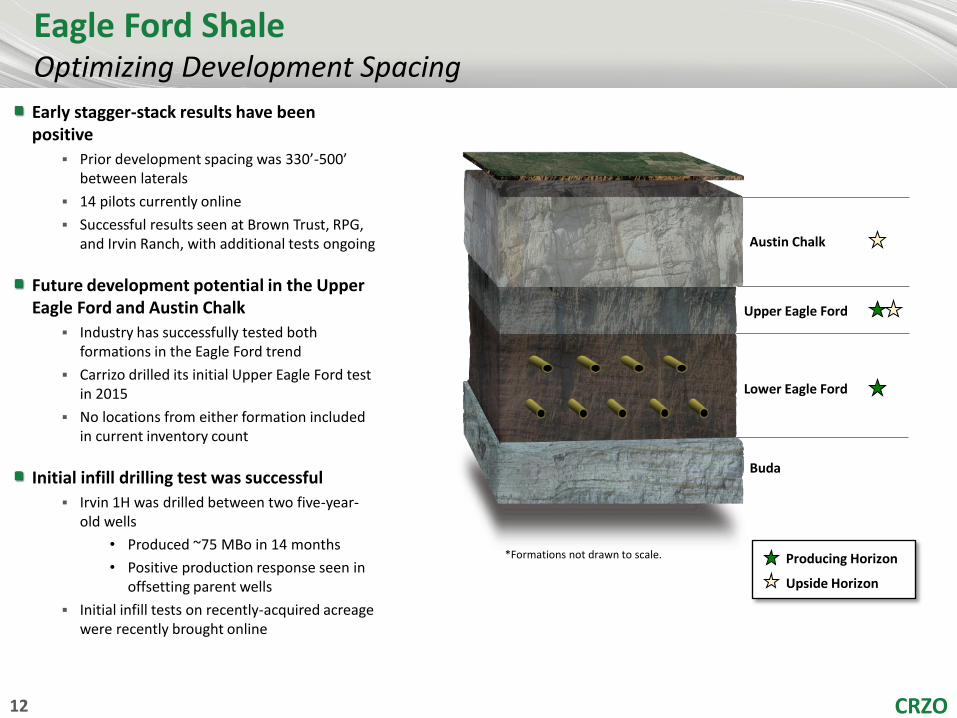
Austin Chalk
Upper Eagle Ford
Lower Eagle Ford
Buda
Producing Horizon
Upside Horizon
*Formations not drawn to scale.
Early stagger-stack results have been positive
Prior development spacing was 330’-500’ between laterals
14 pilots currently online
Successful results seen at Brown Trust, RPG, and Irvin Ranch, with additional tests ongoing
Future development potential in the Upper Eagle Ford and Austin Chalk
Industry has successfully tested both formations in the Eagle Ford trend
Carrizo drilled its initial Upper Eagle Ford test in 2015
No locations from either formation included in current inventory count
Initial infill drilling test was successful
Irvin 1H was drilled between two five-year-old wells
• Produced ~75 MBo in 14 months
• Positive production response seen in offsetting parent wells
Initial infill tests on recently-acquired acreage were recently brought online
Eagle Ford Shale Optimizing Development Spacing
CRZO 13 13 13
Eagle Ford Shale Optimizing Completion Techniques
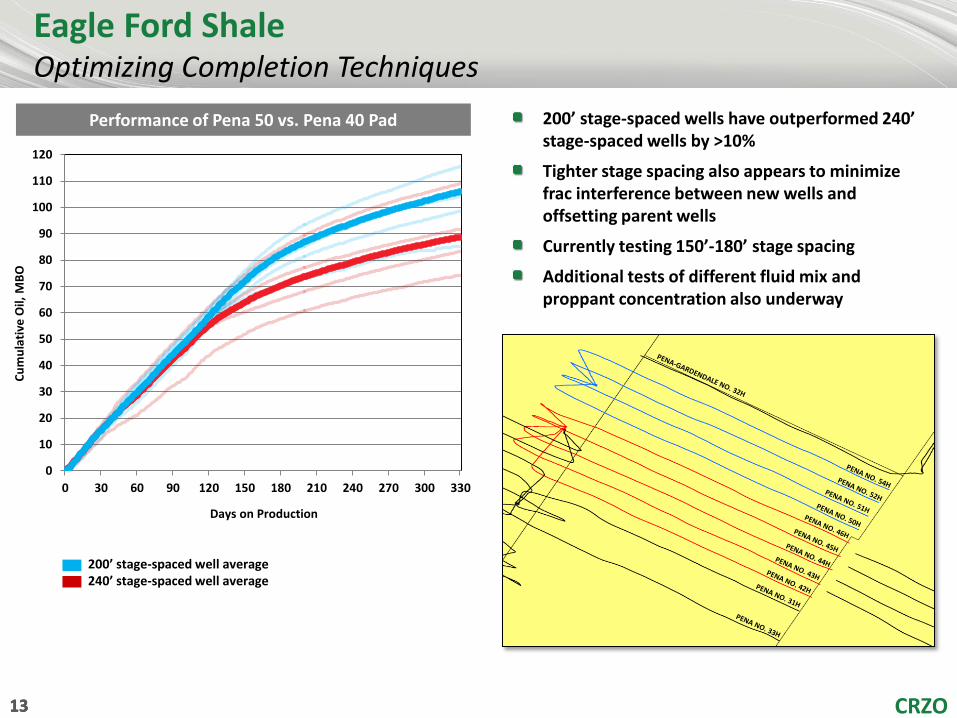
200’ stage-spaced wells have outperformed 240’ stage-spaced wells by >10%
Tighter stage spacing also appears to minimize frac interference between new wells and offsetting parent wells
Currently testing 150’-180’ stage spacing
Additional tests of different fluid mix and proppant concentration also underway
200’ stage-spaced well average 240’ stage-spaced well average
Performance of Pena 50 vs. Pena 40 Pad
0
10
20
30
40
50
60
70
80
90
100
110
120
0 30 60 90 120 150 180 210 240 270 300 330
Cu
mu
lati
ve O
il, M
BO
Days on Production
CRZO 14 CRZO 14 14 CRZO 14 14 CRZO 14
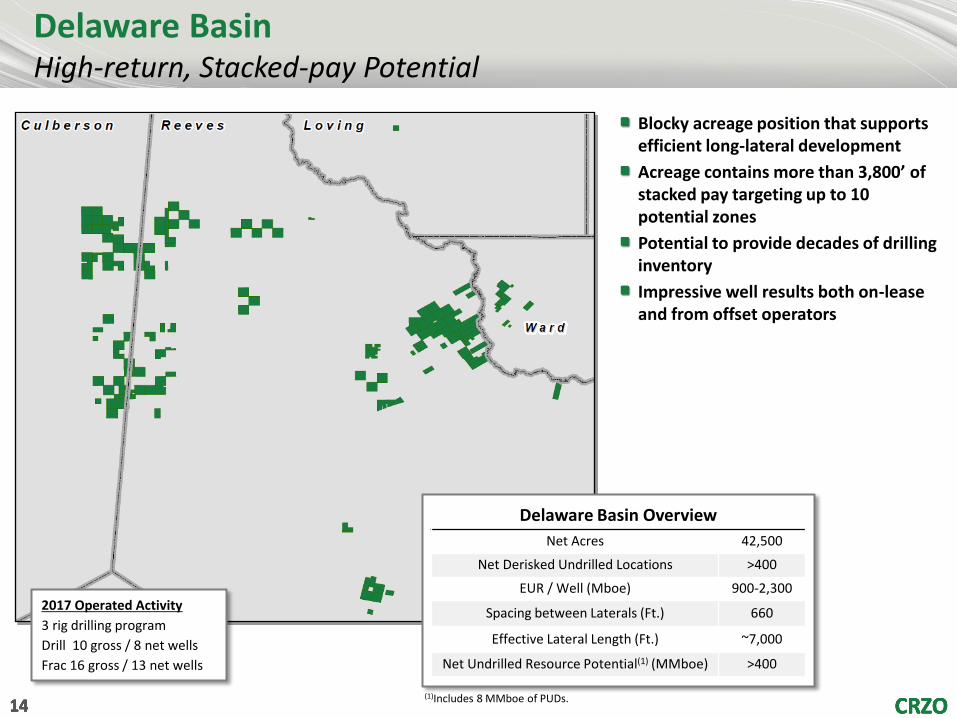
Delaware Basin High-return, Stacked-pay Potential
Blocky acreage position that supports efficient long-lateral development
Acreage contains more than 3,800’ of stacked pay targeting up to 10 potential zones
Potential to provide decades of drilling inventory
Impressive well results both on-lease and from offset operators
Delaware Basin Overview
Net Acres 42,500
Net Derisked Undrilled Locations >400
EUR / Well (Mboe) 900-2,300
Spacing between Laterals (Ft.) 660
Effective Lateral Length (Ft.) ~7,000
Net Undrilled Resource Potential(1) (MMboe) >400
(1)Includes 8 MMboe of PUDs.
2017 Operated Activity
3 rig drilling program
Drill 10 gross / 8 net wells
Frac 16 gross / 13 net wells
CRZO 15
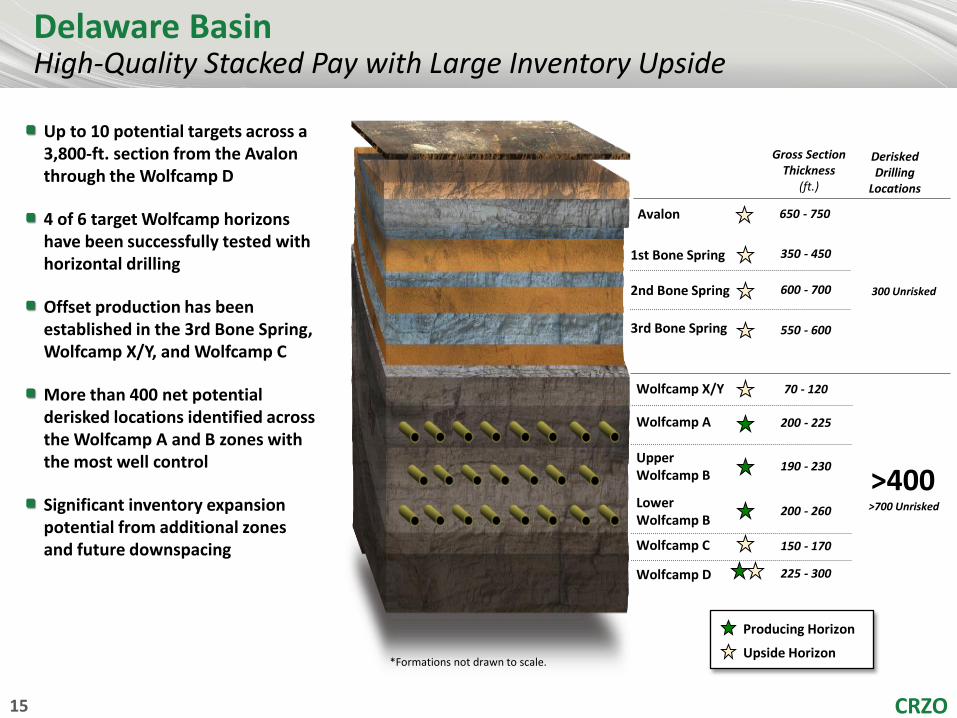
Delaware Basin High-Quality Stacked Pay with Large Inventory Upside
*Formations not drawn to scale.
Producing Horizon
Upside Horizon
1st Bone Spring
2nd Bone Spring
3rd Bone Spring
Wolfcamp X/Y
Wolfcamp A
Upper Wolfcamp B
Wolfcamp C
Wolfcamp D
Lower Wolfcamp B
Avalon
70 - 120
200 - 225
190 - 230
200 - 260
150 - 170
225 - 300
Gross Section Thickness
(ft.)
550 - 600
600 - 700
350 - 450
650 - 750
Up to 10 potential targets across a 3,800-ft. section from the Avalon through the Wolfcamp D
4 of 6 target Wolfcamp horizons have been successfully tested with horizontal drilling
Offset production has been established in the 3rd Bone Spring, Wolfcamp X/Y, and Wolfcamp C
More than 400 net potential derisked locations identified across the Wolfcamp A and B zones with the most well control
Significant inventory expansion potential from additional zones and future downspacing
Derisked Drilling
Locations
>400 >700 Unrisked
300 Unrisked
CRZO 16
MUSTANG STATE 1H Pilot42109328590000
Liberator-State 1H-Pilot42389351040000
CLARK JUDY STATE C19 1H42389334600000
MCGARY STATE UNIT 10 116142389352920000
STATE CVX 22 226642389351117000
SAUL 357142389350260000
WOODSON 36 366342389353567000
ZEMAN 40 UNIT 407142389354410000
PEREGRINE 27 342389336270000
0 200
GR_PCF
1 1000
ILD_PCF
0.3 -0.1
DPHI_PCF
0 200
GR_PCF
1 1000
ILD_PCF
0.3 -0.1
DPHI_PCF
0 200
GR_PCF
1 1000
ILD_PCF
0.3 -0.1
DPHI_PCF
0 200
GR_PCF
1 1000
ILD_PCF
0.3 -0.1
DPHI_PCF
0 200
GR_PCF
1 1000
ILD_PCF
0.3 -0.1
DPHI_PCF
0 200
GR_PCF
1 1000
ILD_PCF
0.3 -0.1
DPHI_PCF
0 200
GR_PCF
1 1000
ILD_PCF
0.3 -0.1
DPHI_PCF
0 200
GR_PCF
1 1000
ILD_PCF
0.3 -0.1
DPHI_PCF
0 200
GR_PCF
1 1000
ILD_PCF
0.3 -0.1
DPHI_PCF
9000
9000
10000
10000
11000
12000
10000
11000
10000
11000
10000
11000
10000
11000
10000
11000
10000
11000
BS3_MID_SHALE [PCF]
BS_SAND_3 [PCF]
BS_MK5 [PCF]
WOLFCAMP [PCF]
WOLFCAMP_A [PCF]
WOLFCAMP_B [PCF]
MIDDLE_B [PCF]
WOLFCAMP_C [PCF]
WOLFCAMP_D [PCF]
BASE_WCB_EXL [PCF]
9 5/8 IN1606 Sacks of Cement
9 5/8 IN1870 Sacks of Cement
7 IN615 Sacks of Cement
9 5/8 IN2060 Sacks of Cement9 5/8 IN2060 Sacks of Cement
9 5/8 IN2100 Sacks of Cement
9 5/8 IN2350 Sacks of Cement
9 5/8 IN2450 Sacks of Cement
9 5/8 IN2585 Sacks of Cement
5 1/2 IN1300 Sacks of Cement
RelDepth(ft)
RelDepth(ft)
-750 -750
-650 -650
-550 -550
-450 -450
-350 -350
-250 -250
-150 -150
-50 -50
50 50
150 150
250 250
350 350
450 450
550 550
650 650
750 750
850 850
950 950
1050 1050
1150 1150
1250 1250
1350 1350
1450 1450
Bone Springs
HS=684
PETRA 6/1/2017 3:51:57 PM
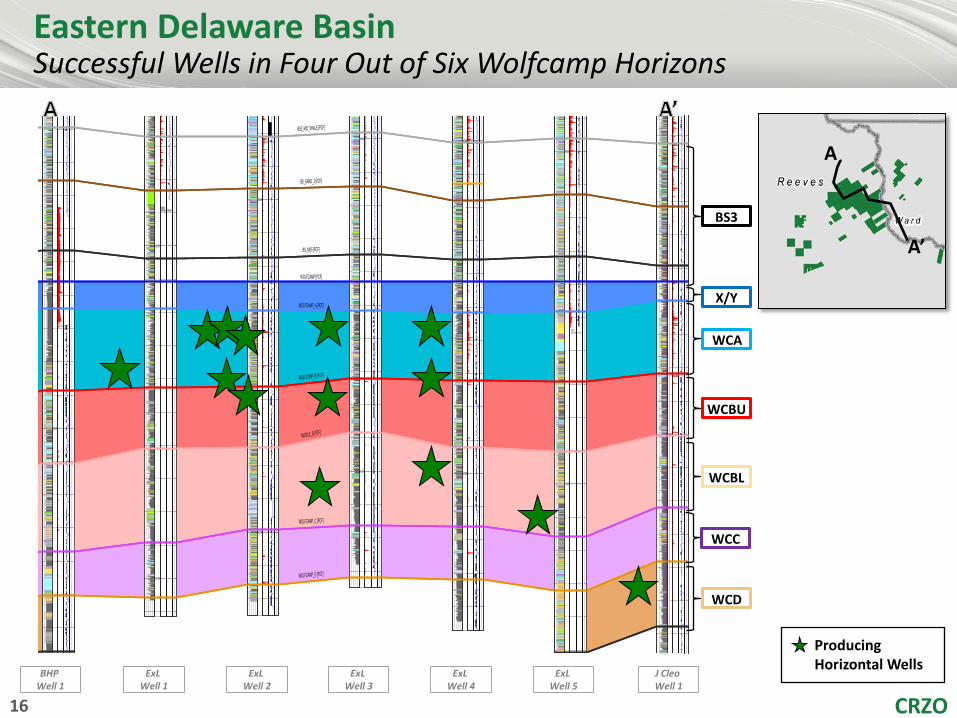
Eastern Delaware Basin Successful Wells in Four Out of Six Wolfcamp Horizons
BHP Well 1
ExL Well 1
ExL Well 2
ExL Well 3
ExL Well 4
ExL Well 5
J Cleo Well 1
WCA
WCBU
WCBL
WCC
WCD
BS3
X/Y
Producing Horizontal Wells
A
A’
CRZO 17
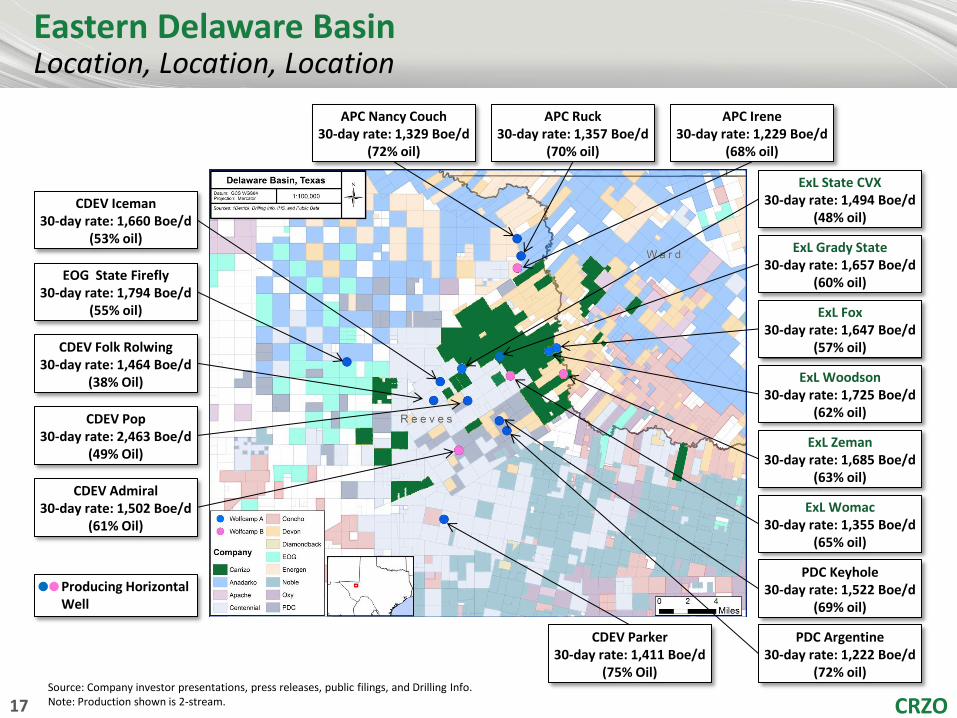
Eastern Delaware Basin Location, Location, Location
Source: Company investor presentations, press releases, public filings, and Drilling Info. Note: Production shown is 2-stream.
PDC Argentine 30-day rate: 1,222 Boe/d
(72% oil)
CDEV Parker 30-day rate: 1,411 Boe/d
(75% Oil)
EOG State Firefly 30-day rate: 1,794 Boe/d
(55% oil)
CDEV Pop 30-day rate: 2,463 Boe/d
(49% Oil)
CDEV Admiral 30-day rate: 1,502 Boe/d
(61% Oil)
ExL Fox 30-day rate: 1,647 Boe/d
(57% oil)
ExL State CVX 30-day rate: 1,494 Boe/d
(48% oil)
ExL Womac 30-day rate: 1,355 Boe/d
(65% oil)
CDEV Iceman 30-day rate: 1,660 Boe/d
(53% oil)
APC Nancy Couch 30-day rate: 1,329 Boe/d
(72% oil)
APC Ruck 30-day rate: 1,357 Boe/d
(70% oil)
APC Irene 30-day rate: 1,229 Boe/d
(68% oil)
ExL Woodson 30-day rate: 1,725 Boe/d
(62% oil)
ExL Zeman 30-day rate: 1,685 Boe/d
(63% oil)
PDC Keyhole 30-day rate: 1,522 Boe/d
(69% oil)
CDEV Folk Rolwing 30-day rate: 1,464 Boe/d
(38% Oil)
ExL Grady State 30-day rate: 1,657 Boe/d
(60% oil)
Producing Horizontal Well
CRZO 18 18 18
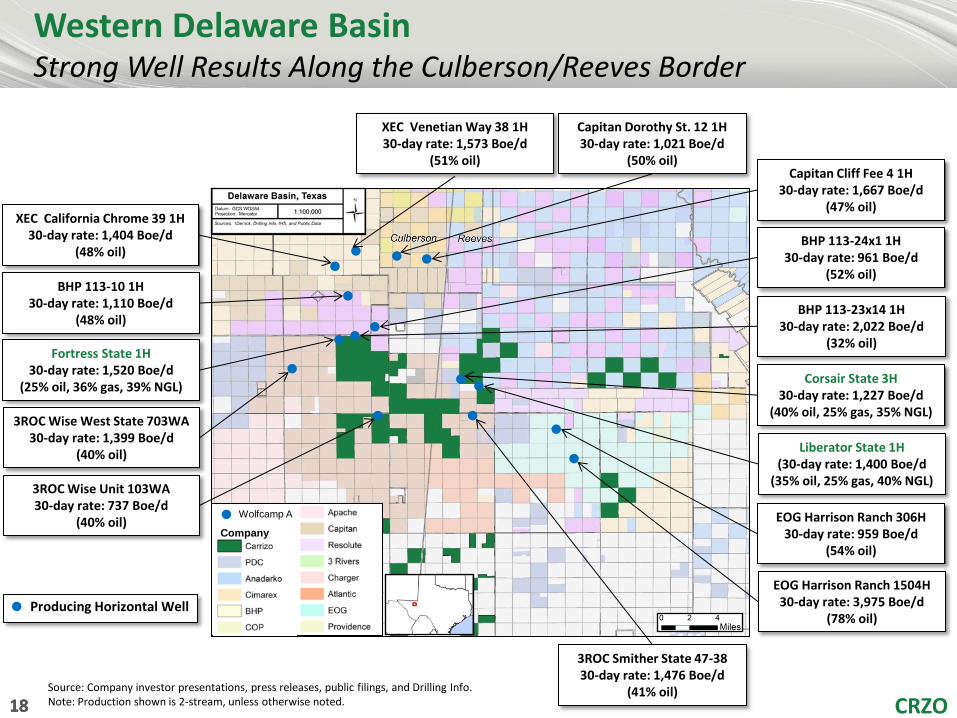
Western Delaware Basin Strong Well Results Along the Culberson/Reeves Border
Liberator State 1H (30-day rate: 1,400 Boe/d
(35% oil, 25% gas, 40% NGL)
Corsair State 3H 30-day rate: 1,227 Boe/d
(40% oil, 25% gas, 35% NGL)
Fortress State 1H 30-day rate: 1,520 Boe/d
(25% oil, 36% gas, 39% NGL)
BHP 113-24x1 1H 30-day rate: 961 Boe/d
(52% oil)
BHP 113-23x14 1H 30-day rate: 2,022 Boe/d
(32% oil)
3ROC Wise West State 703WA 30-day rate: 1,399 Boe/d
(40% oil)
XEC Venetian Way 38 1H 30-day rate: 1,573 Boe/d
(51% oil)
EOG Harrison Ranch 306H 30-day rate: 959 Boe/d
(54% oil)
EOG Harrison Ranch 1504H 30-day rate: 3,975 Boe/d
(78% oil)
Capitan Dorothy St. 12 1H 30-day rate: 1,021 Boe/d
(50% oil) Capitan Cliff Fee 4 1H
30-day rate: 1,667 Boe/d (47% oil)
3ROC Smither State 47-38 30-day rate: 1,476 Boe/d
(41% oil) Source: Company investor presentations, press releases, public filings, and Drilling Info. Note: Production shown is 2-stream, unless otherwise noted.
3ROC Wise Unit 103WA 30-day rate: 737 Boe/d
(40% oil)
XEC California Chrome 39 1H 30-day rate: 1,404 Boe/d
(48% oil)
BHP 113-10 1H 30-day rate: 1,110 Boe/d
(48% oil)
Producing Horizontal Well
Wolfcamp A
Company
CRZO 19 19 19
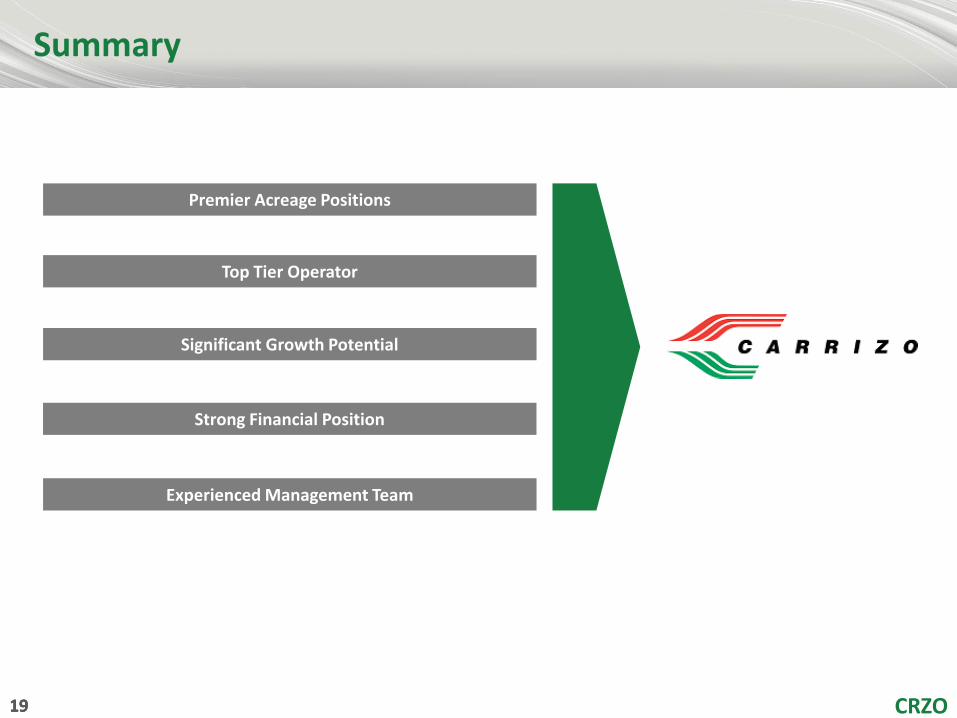
Summary
Premier Acreage Positions
Top Tier Operator
Significant Growth Potential
Experienced Management Team
Strong Financial Position
CRZO 20
Appendix
CRZO 21 CRZO 21 21 CRZO 21 21 CRZO 21
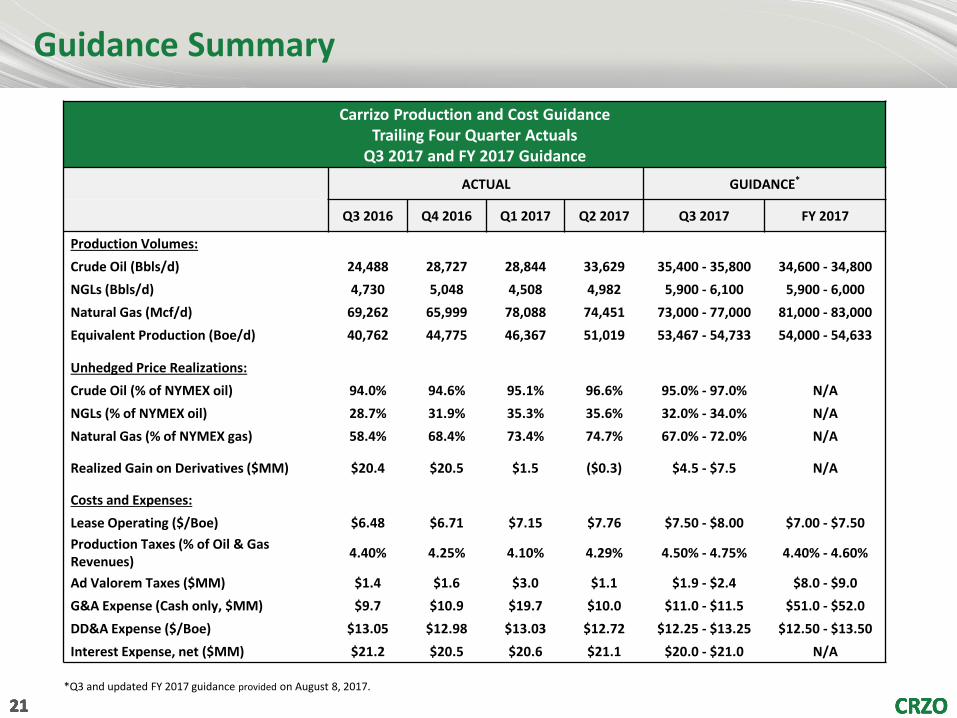
Guidance Summary
Carrizo Production and Cost Guidance Trailing Four Quarter Actuals
Q3 2017 and FY 2017 Guidance
ACTUAL GUIDANCE*
Q3 2016 Q4 2016 Q1 2017 Q2 2017 Q3 2017 FY 2017
Production Volumes:
Crude Oil (Bbls/d) 24,488 28,727 28,844 33,629 35,400 - 35,800 34,600 - 34,800
NGLs (Bbls/d) 4,730 5,048 4,508 4,982 5,900 - 6,100 5,900 - 6,000
Natural Gas (Mcf/d) 69,262 65,999 78,088 74,451 73,000 - 77,000 81,000 - 83,000
Equivalent Production (Boe/d) 40,762 44,775 46,367 51,019 53,467 - 54,733 54,000 - 54,633
Unhedged Price Realizations:
Crude Oil (% of NYMEX oil) 94.0% 94.6% 95.1% 96.6% 95.0% - 97.0% N/A
NGLs (% of NYMEX oil) 28.7% 31.9% 35.3% 35.6% 32.0% - 34.0% N/A
Natural Gas (% of NYMEX gas) 58.4% 68.4% 73.4% 74.7% 67.0% - 72.0% N/A
Realized Gain on Derivatives ($MM) $20.4 $20.5 $1.5 ($0.3) $4.5 - $7.5 N/A
Costs and Expenses:
Lease Operating ($/Boe) $6.48 $6.71 $7.15 $7.76 $7.50 - $8.00 $7.00 - $7.50
Production Taxes (% of Oil & Gas Revenues)
4.40% 4.25% 4.10% 4.29% 4.50% - 4.75% 4.40% - 4.60%
Ad Valorem Taxes ($MM) $1.4 $1.6 $3.0 $1.1 $1.9 - $2.4 $8.0 - $9.0
G&A Expense (Cash only, $MM) $9.7 $10.9 $19.7 $10.0 $11.0 - $11.5 $51.0 - $52.0
DD&A Expense ($/Boe) $13.05 $12.98 $13.03 $12.72 $12.25 - $13.25 $12.50 - $13.50
Interest Expense, net ($MM) $21.2 $20.5 $20.6 $21.1 $20.0 - $21.0 N/A
*Q3 and updated FY 2017 guidance provided on August 8, 2017.
CRZO 22 22 22 *Q3 2017 gas production guidance of 75.0 MMcf/d at midpoint, oil at 35,600 Bbls/d.
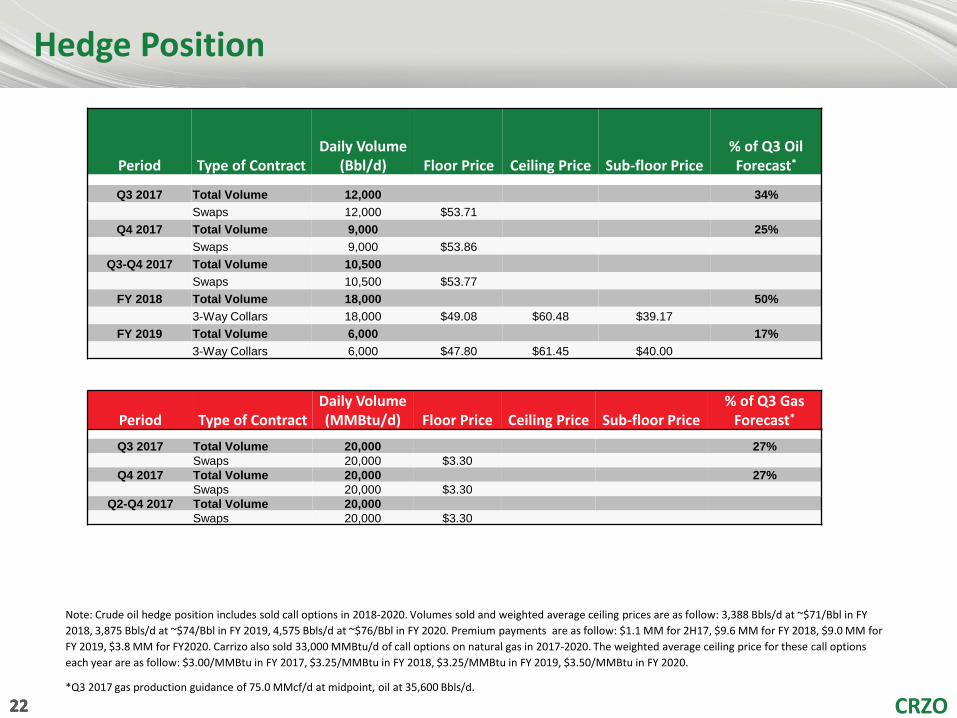
Period Type of Contract Daily Volume
(Bbl/d) Floor Price Ceiling Price Sub-floor Price % of Q3 Oil Forecast*
Q3 2017 Total Volume 12,000 34%
Swaps 12,000 $53.71
Q4 2017 Total Volume 9,000 25%
Swaps 9,000 $53.86
Q3-Q4 2017 Total Volume 10,500
Swaps 10,500 $53.77
FY 2018 Total Volume 18,000 50%
3-Way Collars 18,000 $49.08 $60.48 $39.17
FY 2019 Total Volume 6,000 17%
3-Way Collars 6,000 $47.80 $61.45 $40.00
Hedge Position
Note: Crude oil hedge position includes sold call options in 2018‐2020. Volumes sold and weighted average ceiling prices are as follow: 3,388 Bbls/d at ~$71/Bbl in FY
2018, 3,875 Bbls/d at ~$74/Bbl in FY 2019, 4,575 Bbls/d at ~$76/Bbl in FY 2020. Premium payments are as follow: $1.1 MM for 2H17, $9.6 MM for FY 2018, $9.0 MM for
FY 2019, $3.8 MM for FY2020. Carrizo also sold 33,000 MMBtu/d of call options on natural gas in 2017-2020. The weighted average ceiling price for these call options
each year are as follow: $3.00/MMBtu in FY 2017, $3.25/MMBtu in FY 2018, $3.25/MMBtu in FY 2019, $3.50/MMBtu in FY 2020.
Period Type of Contract Daily Volume (MMBtu/d) Floor Price Ceiling Price Sub-floor Price
% of Q3 Gas Forecast*
Q3 2017 Total Volume 20,000 27%
Swaps 20,000 $3.30
Q4 2017 Total Volume 20,000 27%
Swaps 20,000 $3.30
Q2-Q4 2017 Total Volume 20,000
Swaps 20,000 $3.30
CRZO 23 23 23
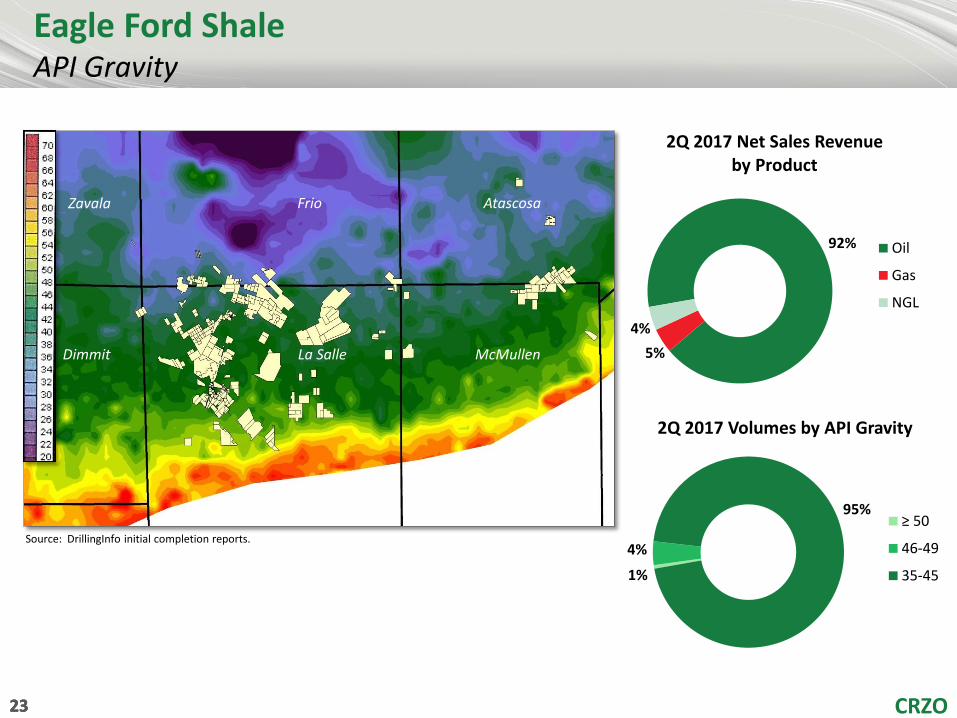
Eagle Ford Shale API Gravity
Source: DrillingInfo initial completion reports.
92%
5%
4%
2Q 2017 Net Sales Revenue by Product
Oil
Gas
NGL
1%
4%
95%
2Q 2017 Volumes by API Gravity
≥ 50
46-49
35-45
Zavala Frio Atascosa
Dimmit La Salle McMullen
CRZO 24 CRZO 24 24 CRZO 24 24 CRZO 24
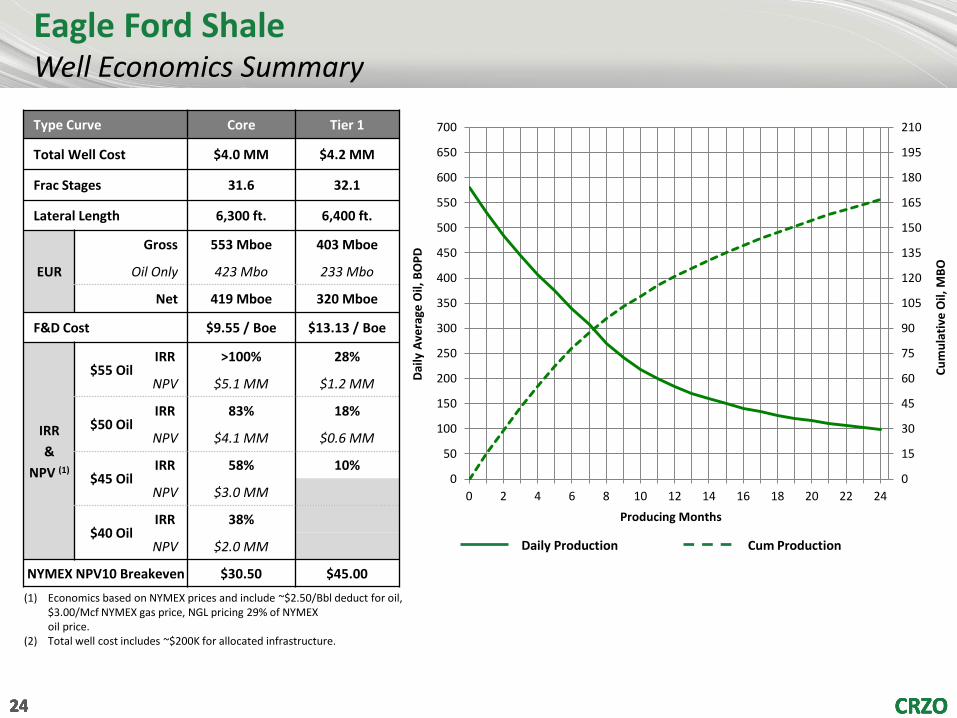
Eagle Ford Shale Well Economics Summary
(1) Economics based on NYMEX prices and include ~$2.50/Bbl deduct for oil, $3.00/Mcf NYMEX gas price, NGL pricing 29% of NYMEX oil price.
(2) Total well cost includes ~$200K for allocated infrastructure.
Daily Production Cum Production
0
15
30
45
60
75
90
105
120
135
150
165
180
195
210
0
50
100
150
200
250
300
350
400
450
500
550
600
650
700
0 2 4 6 8 10 12 14 16 18 20 22 24
Cu
mu
lati
ve O
il, M
BO
Dai
ly A
vera
ge O
il, B
OP
D
Producing Months
Type Curve Core Tier 1
Total Well Cost $4.0 MM $4.2 MM
Frac Stages 31.6 32.1
Lateral Length 6,300 ft. 6,400 ft.
EUR
Gross 553 Mboe 403 Mboe
Oil Only 423 Mbo 233 Mbo
Net 419 Mboe 320 Mboe
F&D Cost $9.55 / Boe $13.13 / Boe
IRR
&
NPV (1)
$55 Oil IRR >100% 28%
NPV $5.1 MM $1.2 MM
$50 Oil IRR 83% 18%
NPV $4.1 MM $0.6 MM
$45 Oil IRR 58% 10%
NPV $3.0 MM
$40 Oil IRR 38%
NPV $2.0 MM
NYMEX NPV10 Breakeven $30.50 $45.00
CRZO 25
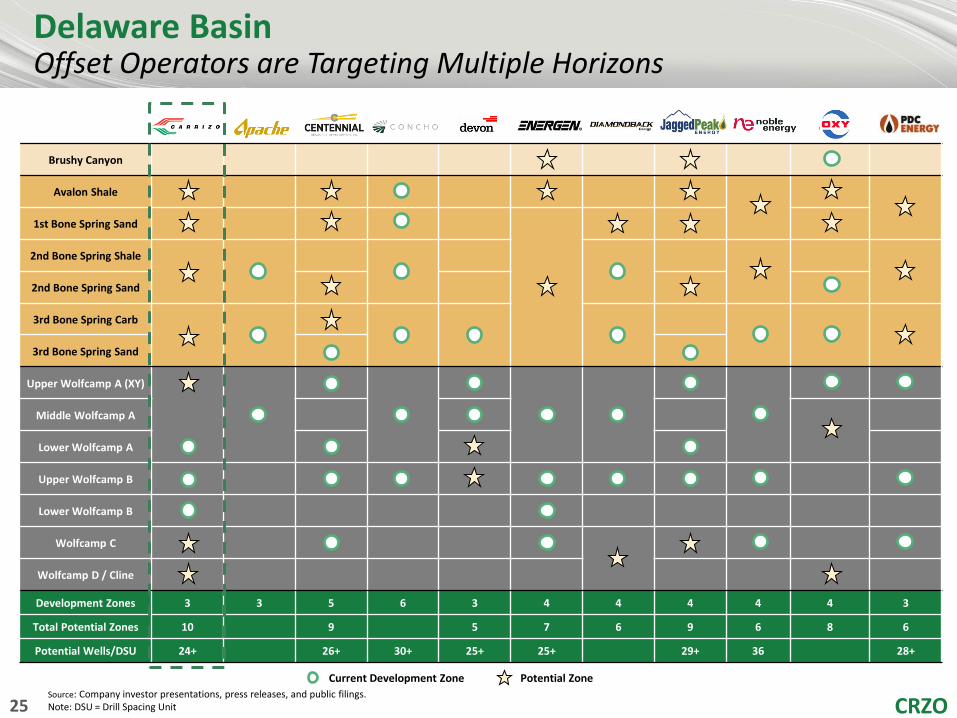
Source: Company investor presentations, press releases, and public filings. Note: DSU = Drill Spacing Unit
Delaware Basin Offset Operators are Targeting Multiple Horizons
APC CDEV CXO DVN EGN FANG JAG NBL OXY PDCE
Brushy Canyon P P Y
Avalon Shale Y P P P
P P
1st Bone Spring Sand P Y
P
P P P
2nd Bone Spring Shale
Y Y Y P P 2nd Bone Spring Sand P P Y
3rd Bone Spring Carb
Y P
Y Y Y Y Y P 3rd Bone Spring Sand Y Y
Upper Wolfcamp A (XY)
Y
Y
Y
Y
Y Y
Y
Y
Y Y
Middle Wolfcamp A Y P
Lower Wolfcamp A Y P Y
Upper Wolfcamp B Y Y P Y Y Y Y Y
Lower Wolfcamp B Y
Wolfcamp C Y Y P
P Y Y
Wolfcamp D / Cline P
Development Zones 3 3 5 6 3 4 4 4 4 4 3
Total Potential Zones 10 9 5 7 6 9 6 8 6
Potential Wells/DSU 24+ 26+ 30+ 25+ 25+ 29+ 36 28+
Current Development Zone Potential Zone
CRZO 26 26 26
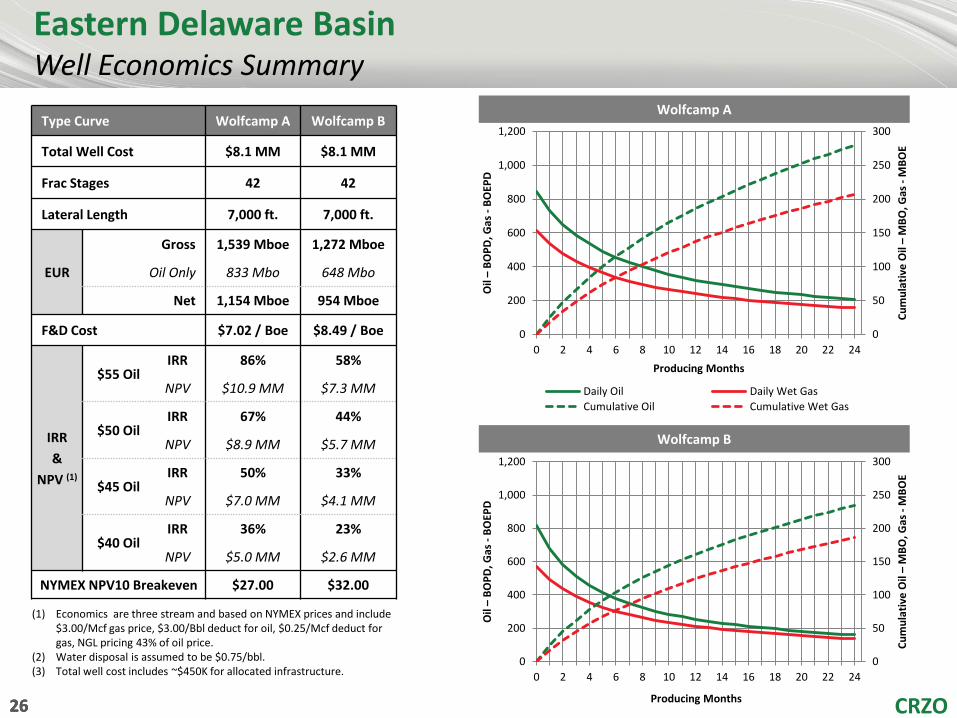
Eastern Delaware Basin Well Economics Summary
(1) Economics are three stream and based on NYMEX prices and include $3.00/Mcf gas price, $3.00/Bbl deduct for oil, $0.25/Mcf deduct for gas, NGL pricing 43% of oil price.
(2) Water disposal is assumed to be $0.75/bbl. (3) Total well cost includes ~$450K for allocated infrastructure.
Type Curve Wolfcamp A Wolfcamp B
Total Well Cost $8.1 MM $8.1 MM
Frac Stages 42 42
Lateral Length 7,000 ft. 7,000 ft.
EUR
Gross 1,539 Mboe 1,272 Mboe
Oil Only 833 Mbo 648 Mbo
Net 1,154 Mboe 954 Mboe
F&D Cost $7.02 / Boe $8.49 / Boe
IRR
&
NPV (1)
$55 Oil IRR 86% 58%
NPV $10.9 MM $7.3 MM
$50 Oil IRR 67% 44%
NPV $8.9 MM $5.7 MM
$45 Oil IRR 50% 33%
NPV $7.0 MM $4.1 MM
$40 Oil IRR 36% 23%
NPV $5.0 MM $2.6 MM
NYMEX NPV10 Breakeven $27.00 $32.00
0
50
100
150
200
250
300
0
200
400
600
800
1,000
1,200
0 2 4 6 8 10 12 14 16 18 20 22 24
Cu
mu
lati
ve O
il –
MB
O, G
as -
MB
OE
Oil
– B
OP
D, G
as -
BO
EPD
Producing Months
Daily Oil Daily Wet Gas
Cumulative Oil Cumulative Wet Gas
0
50
100
150
200
250
300
0
200
400
600
800
1,000
1,200
0 2 4 6 8 10 12 14 16 18 20 22 24
Cu
mu
lati
ve O
il –
MB
O, G
as -
MB
OE
Oil
– B
OP
D, G
as -
BO
EPD
Producing Months
Wolfcamp A
Wolfcamp B
CRZO 27 27 27 27
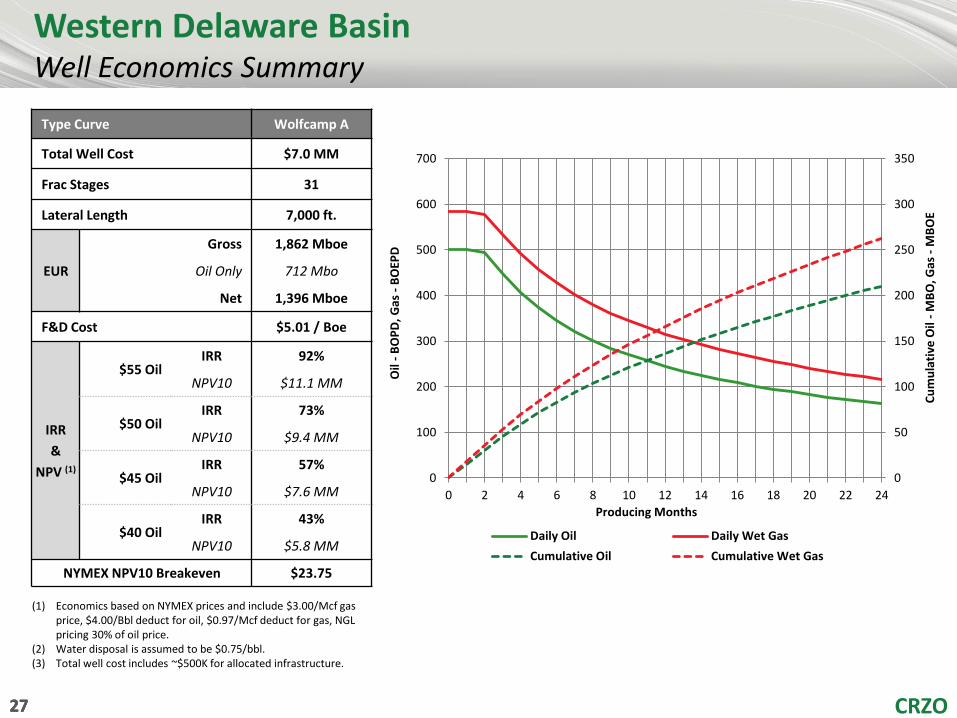
Western Delaware Basin Well Economics Summary
Type Curve Wolfcamp A
Total Well Cost $7.0 MM
Frac Stages 31
Lateral Length 7,000 ft.
EUR
Gross 1,862 Mboe
Oil Only 712 Mbo
Net 1,396 Mboe
F&D Cost $5.01 / Boe
IRR
&
NPV (1)
$55 Oil IRR 92%
NPV10 $11.1 MM
$50 Oil IRR 73%
NPV10 $9.4 MM
$45 Oil IRR 57%
NPV10 $7.6 MM
$40 Oil IRR 43%
NPV10 $5.8 MM
NYMEX NPV10 Breakeven $23.75
(1) Economics based on NYMEX prices and include $3.00/Mcf gas price, $4.00/Bbl deduct for oil, $0.97/Mcf deduct for gas, NGL pricing 30% of oil price.
(2) Water disposal is assumed to be $0.75/bbl. (3) Total well cost includes ~$500K for allocated infrastructure.
0
50
100
150
200
250
300
350
0
100
200
300
400
500
600
700
0 2 4 6 8 10 12 14 16 18 20 22 24
Cu
mu
lati
ve O
il -
MB
O, G
as -
MB
OE
Oil
- B
OP
D,
Gas
- B
OEP
D
Producing Months
Daily Oil Daily Wet Gas
Cumulative Oil Cumulative Wet Gas
CRZO 28 28 28
DJ Basin Materially Improving Economics
DJ Basin Overview
Net Acres 30,600
Net Undrilled Locations >640
EUR / Well (Mboe) 150-350
Spacing between Laterals (Ft.) 300/450
Effective Lateral Length (Ft.) 4,200
Net Undrilled Resource Potential (MMboe) >125
Acreage mostly HBP’d
Stacked-pay nature provides development potential in the Niobrara A, B, and C benches
New completion designs resulting in 20%-30% uplift in productivity
Nearby industry testing of the deeper Codell formation could add another layer of potential
CRZO 29 CRZO 29 29 CRZO 29 29 CRZO 29
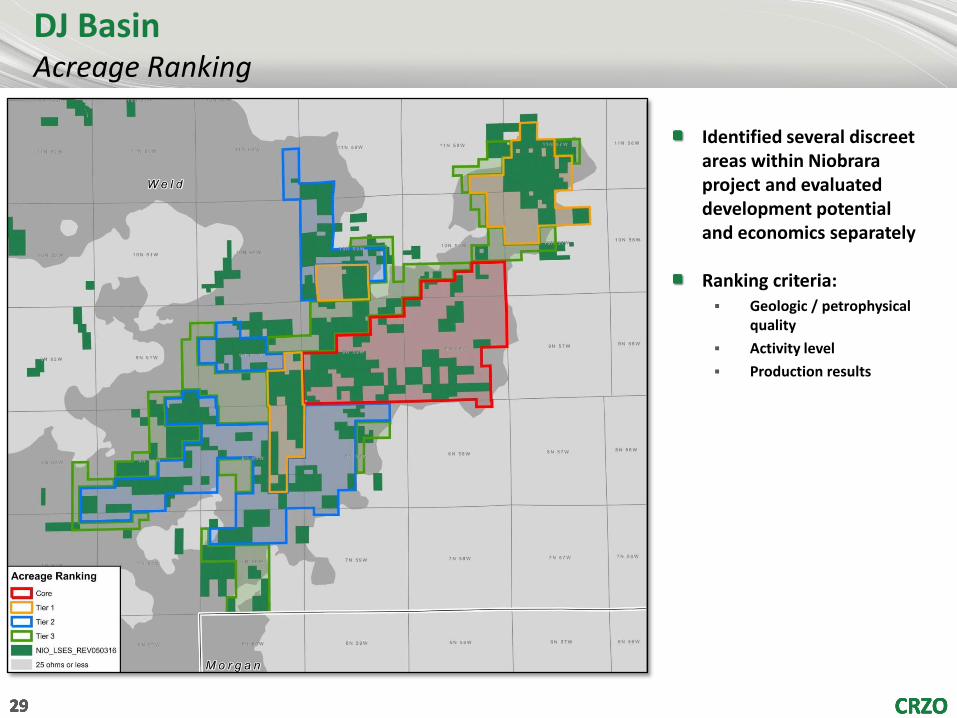
DJ Basin Acreage Ranking
Identified several discreet areas within Niobrara project and evaluated development potential and economics separately Ranking criteria: Geologic / petrophysical
quality
Activity level
Production results