Enel Green Power · Enel Green Power strategic levers: growth 1. Figures based on public data and...
41
Enel Green Power 9M 2015 consolidated results Rome November 13, 2015
Transcript of Enel Green Power · Enel Green Power strategic levers: growth 1. Figures based on public data and...

Enel Green Power
9M 2015 consolidated results
Rome
November 13, 2015

Inve
sto
r R
ela
tio
ns
1
9M 2015 consolidated results
Agenda
Overview of recent events
Analysis of results
Closing remarks

Inve
sto
r R
ela
tio
ns
2
9M 2015 consolidated results
Active portfolio management
~1.8€ bn proceed in less than a year
Dec 2014
Dec 2014
Mar 2015
Sept 2015
Sept 2015
Oct 2015
Exit from France Cash-in: 298€m Capital gain: 31€m
Exit from El Salvador Cash-in: 224€m Capital gain: 123€m
Entry into the Indian market 172 MW in operation Majority stake acquisition: 29€m
US minority stake sale 440m USD consideration CAFD yield: 9.3%
Italian solar JV 210 MW in operation Enterprise Value: 515€m
Sale agreement on Portugal 900€m consideration Expected gain: 29€m

Inve
sto
r R
ela
tio
ns
3
9M 2015 consolidated results
Disposal of Portuguese assets
Delivering on commitments to the market
900€ million consideration
642MW in operation
550€ million positive impact on net debt
9.3x EV/EBITDA
1.4€m/MW
Transaction milestones
Limited further development after completion of ENEOP portfolio
Fully operational platform in a favourable market with stable regulatory framework
Strong appetite for operating wind assets
Rationale of Portugal disposal

Inve
sto
r R
ela
tio
ns
4
9M 2015 consolidated results
Entry into the Indian market
Gateway to further expansion across Asia
Expected electricity demand growth at 5.2% (CAGR)
300 million of people with no access to electricity
175 GW of new renewable capacity targeted by 2022
Abundant wind and solar resources
Market overview
Market with high potential
Reliability of the political framework
Regulation under review
Opportunities in several technologies
Strategic rationale
172 MW wind operating assets with PPAs attached
Large pipeline of wind and interest in participating in the upcoming public solar tenders
Local team with strong expertise and market knowledge
Transaction features

Inve
sto
r R
ela
tio
ns
5
9M 2015 consolidated results
Solar PV joint venture
Creating a leader in the Italian solar market
18 GW of installed capacity
High fragmentation, with top 5 players <5% of market share
Stable regulatory framework
Small operating assets with
project finance attached
Italian solar market overview
Non-organic growth opportunities to create value
Aggregation to extract untapped synergies
New player with larger footprint and critical mass
Strategic rationale
Up to 1GW of potential growth
Efficient operational and financial structure
Option to acquire control
Expected development

Inve
sto
r R
ela
tio
ns
6
9M 2015 consolidated results
Enel Green Power strategic levers: growth
1GW added in the period
Additional capacity progression (GW)
4.5
3.0
1.6 7.1
1.0
1.5
COD 9M 2015
Projects in execution
& contracted
Residual target
Additional capacity
2015-2019
Growth capex by area
19%
15%
53%
13%
8.8 €bn Rest of World
Europe
Latin America
North America
1. As of October 2015
1
>75%

Inve
sto
r R
ela
tio
ns
7
9M 2015 consolidated results
Enel Green Power strategic levers: growth
1. Figures based on public data and EGP’s expectations on overall volumes to be tendered by governments
Geo Hydro Wind Biomass Solar
Nov-15 Dec-15 1Q-16 2Q-16
Peru 135 MW
Brazil – Reserva 500 MW
South Africa 650 MW
Spain 500 MW
Mexico A-2 1,500 MW
Italy 800 MW
Brazil A-2/A-5
Turkey
Chile
India 500 MW
Peru 175 MW
India 2,500 MW
Mexico A-2 500 MW
Chile
Morocco 170 MW
Brazil – Reserva 500 MW
South Africa 520 MW
Brazil A-2/A-5
Italy 110 MW
Peru 75 MW
Mexico 100 MW
Kenya 300 MW
Brazil – Concession

Inve
sto
r R
ela
tio
ns
8
9M 2015 consolidated results
Agenda
Strategic overview of recent events
Analysis of results
Closing remarks

Inve
sto
r R
ela
tio
ns
9
9M 2015 consolidated results
Financial highlights
Strong cash flow generation of 1.3€bn
Ahead of plan growth trajectory with 1.6€bn of capex
EBITDA growth driven by new additions in PPA-based markets
Group net income at 245€m impacted by impairment in Romania

Inve
sto
r R
ela
tio
ns
10
9M 2015 consolidated results
Cash-flow generation
9M 2015 cash-flow utilization (€m) 9M 2015 cash-flow generation (€m)
1,293
454
808
(298)
(419)
(122) 354
Cash generated
Delta NWC
Tax & interest
Maint. capex
FFO Portfolio mgmt
Cash available
808 (1,575)
(212) (199)
(1,178)
Cash available
Growth capex Portfolio
mgmt2 Cash absorption
Dividends
1
Strong operating cash-flow
1. EGP North America minority stake sale 2. 3SUN and BLP net debt consolidation

Inve
sto
r R
ela
tio
ns
11
9M 2015 consolidated results
Total growth capex
Main projects under constructions By geography
13%
11% 69%
7%
Rest of World 201
Europe 109
Latin America
1,088
North America 177
1,575 €m
By technology
13%
6% 52%
26%
3%
Wind 826
Other 39
Solar 411
Hydro 208
Geo 91
1,575 €m
Country: Chile
Plant: Cerro Pabellon
Capacity: 38 MW
Technology: geothermal
Country: Brazil
Plant: Apiacas
Capacity: 102 MW
Technology: hydro
Spread over WACC 200-300bps

Inve
sto
r R
ela
tio
ns
12
2%
20%
19%
59% 10.6 GW
Europe1 Latin America
North America
Total installed capacity by area
Total installed capacity by technology2
25%
8% 63%
4%
10.6 GW
Wind
Hydro
Solar
Geo
1. Including 10MW of solar capacity in South Africa 2. Including 44MW of biomass
New markets
India 172 MW wind
Italy 5 MW biomass
Portugal 445 MW wind
Chile 61 MW wind 18 MW solar
Panama 12 MW solar
Mexico 202 MW wind
Brazil 12 MW solar
Uruguay 50 MW wind
9M 2015 consolidated results
Capacity additions in the period

Inve
sto
r R
ela
tio
ns
13
9M 2015 consolidated results
Net production analysis (GWh)
23,526 2,029 (574) 88 (198) 24,871
9M 2014 Additional capacity
Resource availability
Technical availability
Perimeter 9M 2015
+6%
Load factor 40% 39%
1.01 1.01
9M 2014 9M 2015
Wind resource index1
1.10 1.07
9M 2014 9M 2015
Hydro resource index1
2
1. Ratio between actual values for 2014/2015 and historical values (10 years for hydro and 5 years for wind) 2. Mainly related to French assets disposal

Inve
sto
r R
ela
tio
ns
14
9M 2015 consolidated results
EBITDA analysis (€m)
1. Mainly related to French assets disposal
EBITDA margin 66% 63%
1,317 58 86 (62) (12) 83 1,470
9M 2014 Energy margin
Other revenues
Opex Perimeter Forex 9M 2015
+12%
+153
1
Growth: +136€m Resource: -35€m
Price: -43€m

Inve
sto
r R
ela
tio
ns
15
9M 2015 consolidated results
EBITDA analysis: Latin America (€m)
127
64
75 (10) 4 (23) 37 274
9M 2014 Additional capacity
Resource Price Other revenues
Opex Forex 9M 2015
+116%
+147

Inve
sto
r R
ela
tio
ns
16
9M 2015 consolidated results
EBITDA analysis: North America (€m)
192
46 (35)
(4) 19 (7)
46 257
9M 2014 Additional capacity
Resource Price Other revenues
Opex Forex 9M 2015
+34%
+65

Inve
sto
r R
ela
tio
ns
17
9M 2015 consolidated results
EBITDA analysis: Europe (€m)
-6%
-59
755 664
140 181
103
26 (75) (29) 63 (12) (32)
94
9M 2014 Additional capacity
Resource Price Other revenues
Perimeter Opex 9M 2015
1. Mainly related to French assets disposal 2. Includes South Africa and Turkey for -7€m
1
Iberia
Italy
Rest of Europe2
998 939

Inve
sto
r R
ela
tio
ns
18
9M 2015 consolidated results
Group net income (€m)
-4%
-17
245
395
153 (131)
(36) (22)
61 5 (47) 378 (133)
9M 2014 EBITDA D&A Net financial expense
Equity investment
Taxes Discontinued operations
Minorites 9M 2015 net of impairment
Impairment 9M 2015 group net
income

Inve
sto
r R
ela
tio
ns
19
9M 2015 consolidated results
Net debt evolution (€m)
Tax partnership liabilities
+1,307€m
(1,178)
(129)
FY 2014
NFCF
Forex
9M 2015
Average maturity = 5.3 yrs
Net debt/EBITDA = 3.5x
Average cost of gross debt = 5.1%
Current availability = 2.1€bn
(6,038)
(7,345)
(5,361) (677)
(776) (6,569)

Inve
sto
r R
ela
tio
ns
20
9M 2015 consolidated results
Forward sales
Spain1 Italy
North America Latin America
91% 91%
2015 2016
92% 54%
2015 2016
77% 31%
2015 2016
96% 91%
2015 2016
Unhedged volumes
Hedged volumes
1. Share of hedged production from capacity <2004

Inve
sto
r R
ela
tio
ns
21
9M 2015 consolidated results
Agenda
Strategic overview of recent events
Analysis of results
Closing remarks

Inve
sto
r R
ela
tio
ns
22
9M 2015 consolidated results
Closing remarks
Able to grow on multiple opportunities
Visible growth supported by operating cash generation
Own sources supplemented by asset management activities
A global player exploiting multiple levers to create value

Enel Green Power
9M 2015 consolidated results
Annexes Rome
November 13, 2015

Inve
sto
r R
ela
tio
ns
1.5 5.9
13.6 21.0
Highly confident
(90%)
Likely (50%)
Potential (20%)
Oct 2015
24
9M 2015 consolidated results
Gross pipeline
15.1 0.4 0.6 4.9 0.0 21.0
Wind Hydro Geo Solar Biomass Oct 2015
2.8 3.3
10.4 4.5 21.0
Europe North America
Latin America
Rest of World
Oct 2015
1.1 6.8
10.5 1.4 1.2 21.0
2016 2017 2018 2019 >2019 Oct 2015
By technology By probability of success
By COD By geography

Inve
sto
r R
ela
tio
ns
25
9M 2015 consolidated results
Total projects in execution (MW)1
Business unit Wind Hydro Geo Solar Other Total
Italy 8 11 - - 16 35
Greece 154 - - - - 154
Europe 162 11 - - 16 189
Brazil 470 102 - 254 - 826
Chile 224 - 38 336 - 598
Costa Rica - 50 - - - 50
Mexico 229 - - - - 229
Panama - - - 42 - 42
Latin America 923 152 38 632 - 1,745
USA 532 - - - - 532
North America 532 - - - - 532
South Africa 199 - - 314 - 513
Rest of World 199 - - 314 - 513
Total 1,816 163 38 946 16 2,979
1. As of October 2015

Inve
sto
r R
ela
tio
ns
26
9M 2015 consolidated results
Projects under construction (MW) 1
Business unit Wind Hydro Geo Solar Other Total
Italy 8 8 - - 16 32
Greece - - - - - -
Europe 8 8 - - 16 32
Brazil 118 102 - - - 220
Chile 112 - 38 336 - 486
Costa Rica - 50 - - - 50
Mexico 229 - - - - 229
Latin America 459 152 38 336 - 985
USA 424 - - - - 424
North America 424 - - - - 424
South Africa 199 - - 314 - 513
Rest of World 199 - - 314 - 513
Total 1,090 160 38 650 16 1,954
1. As of October 2015

Inve
sto
r R
ela
tio
ns
27
9M 2015 consolidated results
Projects ready to build (MW) 1
Business unit Wind Hydro Geo Solar Other Total
Italy - 3 - - - 3
Greece 154 - - - - 154
Europe 154 3 - - - 157
Brazil 352 - - 254 - 606
Chile 112 - - - - 112
Costa Rica - - - - - -
Mexico - - - - - -
Uruguay - - - - - -
Panama - - - 42 - 42
Latin America 464 - - 296 - 760
USA 108 - - - - 108
North America 108 - - - - 108
South Africa - - - - - -
Rest of World - - - - - -
Total 726 3 - 296 - 1,025
1. As of October 2015

Inve
sto
r R
ela
tio
ns
28
9M 2015 consolidated results
Net installed capacity (MW) Business unit Wind Hydro Geo Solar Other Total
Italy 720 1,512 761 122 5 3,120 Rest of Europe 740 20 - 124 - 884
Bulgaria 42 - - - - 42
Greece 200 20 - 88 - 308
Romania 498 - - 36 - 534
Iberia 2,187 43 - 13 39 2,282 Spain 1,616 43 - 13 39 1,711
Portugal 571 - - - - 571
Europe 3,647 1,575 761 259 44 6,286
Brazil 283 93 - 12 - 388
Chile 340 92 - 154 - 586
Costa Rica 24 31 - - - 55
Mexico 446 53 - - - 499
Panama - 300 - 12 - 312
Guatemala - 163 - - - 163
Uruguay 50 - - - - 50
Latin America 1,143 732 - 178 - 2,053
USA 1,563 316 72 28 - 1,979
Canada 103 - - - - 103
North America 1,666 316 72 28 - 2,082
India 172 - - - - 172
South Africa - - - 10 - 10
Rest of World 172 - - 10 - 182
Total 6,628 2,623 833 475 44 10,603

Inve
sto
r R
ela
tio
ns
29
9M 2015 consolidated results
Additional capacity (MW) Business unit Wind Hydro Geo Solar Other Total
Italy - - - - 5 5 Rest of Europe - - - - - -
Bulgaria - - - - - -
Greece - - - - - -
Romania - - - - - -
Iberia - - - - - - Spain - - - - - -
Portugal 445 - - - - 445
Europe 445 - - - 5 450
Brazil - - - 12 - 12
Chile 61 - - 18 - 79
Costa Rica - - - - - -
Mexico 202 - - - - 202
Panama - - - 12 - 12
Guatemala - - - - - -
Uruguay 50 - - - - 50
Latin America 313 - - 42 - 355
USA - - - - - -
Canada - - - - - -
North America - - - - - -
India 172 - - - - 172
South Africa - - - - - -
Rest of World 172 - - - - 172
Total 930 - - 42 5 977

Inve
sto
r R
ela
tio
ns
30
9M 2015 consolidated results
Net production (GWh) Business unit Wind Hydro Geo Solar Other Total
Italy 880 4,778 4,321 117 - 10,096 Rest of Europe 1,357 22 - 139 - 1,518
Bulgaria 69 - - - - 69
Greece 314 22 - 102 - 438
Romania 974 - - 37 - 1,011
Iberia 2,967 57 - 21 143 3,188 Spain 2,691 57 - 21 143 2,912
Portugal 276 - - - - 276
Europe 5,204 4,857 4,321 277 143 14,802
Brazil 569 372 - 2 - 943
Chile 584 311 - 185 - 1,080
Costa Rica 72 115 - - - 187
Mexico 766 150 - - - 916
Panama - 1,474 - 5 - 1,479
Guatemala - 382 - - - 382 Uruguay 3 - - - - 3
Latin America 1,994 2,804 - 192 - 4,990
USA 3,911 634 284 36 - 4,865
Canada 201 - - - - 201
North America 4,112 634 284 36 - 5,066
India - - - - - -
South Africa - - - 13 - 13
Rest of World - - - 13 - 13
Total 11,310 8,295 4,605 518 143 24,871
Inve
sto
r R
ela
tio
ns
31
9M 2015 consolidated results
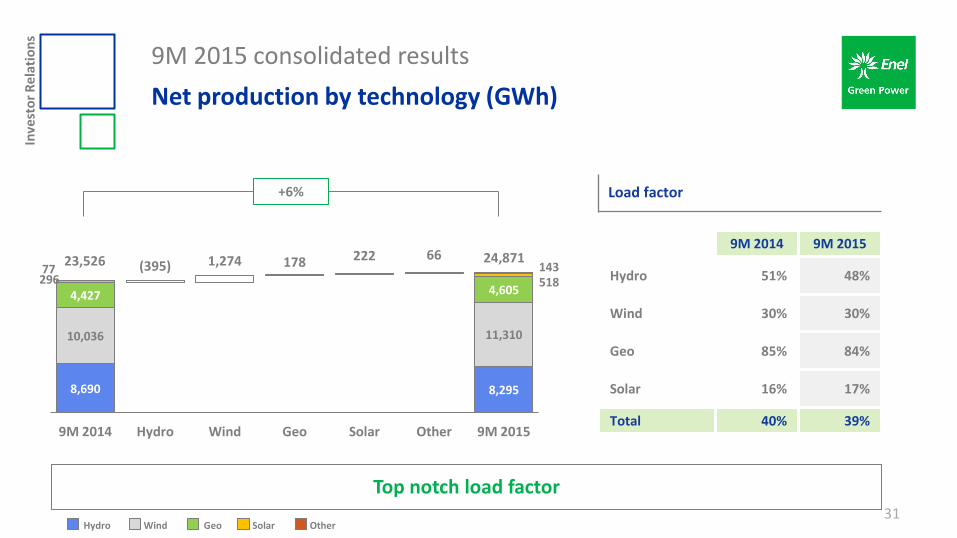
Net production by technology (GWh)
Top notch load factor
8,690 8,295
10,036
(395) 1,274 178 222 66
11,310
4,427 4,605 296 518 77 143
9M 2014 Hydro Wind Geo Solar Other 9M 2015
Load factor
9M 2014 9M 2015
Hydro 51% 48%
Wind 30% 30%
Geo 85% 84%
Solar 16% 17%
Total 40% 39%
23,526 24,871
+6%
Hydro Geo Wind Solar Other

Inve
sto
r R
ela
tio
ns
32
9M 2015 consolidated results
Net production by geography (GWh)
Load factor +6%
15,629 14,815
3,045
(814) 1,945 214
4,990
4,852 5,066
9M 2014 Europe Latin America
North America
9M 2015
9M 2014 9M 2015
Europe 38% 40%
Latin America 43% 42%
North America 37% 40%
Total 40% 39%
23,526 24,871
1
1. Includes South Africa Europe Latin America North America

Inve
sto
r R
ela
tio
ns
33
9M 2015 consolidated results
Total operating capex (€m)
By geography By technology By activity
93%
7%
Growth 1,575
Maintenance 122
12%
11% 65%
12%
Rest of World 201
Europe 197
Latin America
1,104
North America 195
14%
8% 50%
25%
3%
Wind 854
Other 52
Solar 422
Hydro 237
Geo 132
Total operating capex for the period = 1,697€m

Inve
sto
r R
ela
tio
ns
34
9M 2015 consolidated results
Profit & loss (€m)
9M 2015 9M 2014
Energy revenues 1,422 1,344 78 +6%
Revenues from incentives 553 589 (36) -6%
Other revenues 267 151 116 +77%
Total revenues 2,242 2,084 158 +8%
Direct costs 180 284 (104) -37%
Energy & fuel puchases 109 224 (115) -51% Transmission costs 44 41 3 +7% Other 27 19 8 +42%
Personnel costs 161 147 14 +10% - 7 -
Operation & maintenance1 263 239 24 +10% - -
G&A and other1 168 97 71 +73% - -
Total costs 772 767 5 +1%
9M 2015 9M 2014
EBITDA 1,470 1,317 153 +12% 00 0
D&A (790) (504) (286) +57% 0
EBIT 680 813 (133) -16% 0
Net financial expense (226) (190) (36) +19% 0
Income from equity investment 8 30 (22) -73% 0
EBT 462 653 (191) -29% -
Income tax (133) (216) 83 -38%
Continuing operations 329 437 (108) -25%
Discontinued operations - (5) 5 n.m. -
Net income 329 432 (103) -24% -
Minorities 84 37 47 n.m. 0
Group net income 245 395 (150) -38%

Inve
sto
r R
ela
tio
ns
35
9M 2015 consolidated results
Debt structure
From net to gross debt (€bn) Third party debt breakdown
Parent company Third party
7.3 7.9 0.6
Net debt September 30,
2015
Cash & equivalent Financial
receivables
Gross debt September 30,
2015
49%
51% 25%
19%
48%
8%
Development institutions & ECAs 1.9 €bn
Bank loans & other 1.0 €bn
Tax partnerships
0.8 €bn
Structured finance 0.3 €bn
4.0 €bn
Average maturity = 5.5yrs Average cost of debt = 5.1% Current availability = 2.1€bn

Inve
sto
r R
ela
tio
ns
USD
36
9M 2015 consolidated results
Debt structure
By currency By interest rate By maturity
63%
37%
Fixed + Hedged
Floating
76%
24%
Long-term
Short-term
62%
31%
7%
Euro
Other
7.9€bn 7.9€bn 7.9€bn
One-to-one third party - parent company ratio

Inve
sto
r R
ela
tio
ns
37
9M 2015 consolidated results
Long-term debt maturity (€m)
2015 2016 2017 2018 2019 >2019 Total
Third party 114 331 340 626 370 2,163 3,944
Parent company - - - - - 2,064 2,064
Total 114 331 340 626 370 4,227 6,008

Inve
sto
r R
ela
tio
ns
38
9M 2015 consolidated results
Capital structure (€m)
13,821
16,778 2,696 181 (30) (447) 557 9,433
7,345
Assets WIP Equity Investments
NWC Other provisions
Net assets held for sale
Net invested capital
Total equity
Net debt
56% 44%
Net fixed assets 16,698

Inve
sto
r R
ela
tio
ns
39
9M 2015 consolidated results
Disclaimer
This presentation contains certain forward-looking statements that reflect the Company’s management’s current views with respect to future events and financial and operational performance of the Company and its subsidiaries. These forward looking statements are based on Enel Green Power S.p.A.’s current expectations and projections about future events. Because these forward-looking statements are subject to risks and uncertainties, actual future results or performance may differ materially from those expressed in or implied by these statements due to any number of different factors, many of which are beyond the ability of Enel Green Power S.p.A. to control or estimate precisely, including changes in the regulatory environment, future market developments, fluctuations in the price and other risks. You are cautioned not to place undue reliance on the forward-looking statements contained herein, which are made only as of the date of this presentation. Enel Green Power S.p.A. does not undertake any obligation to publicly release any updates or revisions to any forward-looking statements to reflect events or circumstances after the date of this presentation. This presentation does not constitute a recommendation regarding the securities of the Company.
Pursuant to article 154-bis, par 2, of the Consolidated Financial Act of February 24, 1998, the executive in charge of preparing the corporate accounting documents at Enel Green Power S.p.A., Giulio Antonio Carone, declares that the accounting information contained herein correspond to document results, books and accounting records.

Inve
sto
r R
ela
tio
ns
40
9M 2015 consolidated results
Contact us
Donatella Izzo, IR manager Elena Accorinti Federico Caggia Alessandro Marchi Etienne Martoïa
T: +39 06 8305 9104 F: +39 06 6444 2758
E-mail: [email protected] Web site: www.enelgreenpower.com