Enea 2014 H1
33
Krzysztof Zamasz President of the Board Warsaw, 27 August 2014 Dalida Gepfert Vice-President of the Board for Financial Affairs We consistently implement the goals included in the strategy Q2, H1 2014 Paweł Orlof Vice-President of the Board for Corporate Affairs Grzegorz Kinelski Vice-President of the Board for Commercial Affairs
-
Upload
enea -
Category
Investor Relations
-
view
83 -
download
0
Transcript of Enea 2014 H1

Krzysztof Zamasz President of the Board
Warsaw, 27 August 2014
Dalida Gepfert Vice-President of the Board for Financial Affairs
We consistently implement the goals included in the strategy
Q2, H1 2014
Paweł Orlof Vice-President of the Board for Corporate Affairs
Grzegorz Kinelski Vice-President of the Board for Commercial Affairs

2
Agenda
Energy market and key operating data
ENEA CG's results in Q2 and H2 2014
Key projects implemented in H1 2014
New power unit in Kozienice

Grzegorz Kinelski Vice-President of the Board for Commercial Affairs
ENEA CG is monitoring the market situation on a continuous basis

4
• Higher average price of baseload by 9.5% yoy
• SPOT market was affected by: energy generation from wind sources, situation on the European carbon market, changes in the methods of settlements for the operating power reserve and higher volume of losses in the generating capacity
• In H1 2014 prices of energy on the futures market were characterised with the increasing sideways trend supported by the prices from the European carbon market and price levels from the SPOT market of electricity
• Explicit strengthening of quotations in the second half of June
In H1 2014 we observed growths in prices on the energy market
130
140
150
160
170
180
190
200
210
220
230
I II III IV V VI VII VIII IX X XI XII
PLN
/kW
h
Average electricity prices on SPOT market on PPE
Baseload - 2012 Baseload - 2013 Baseload - 2014
140
146
152
158
164
170
176
182
188
194
200
0
20
40
60
80
100
120
140
160
180
200
04/10/2012 21/05/2013 05/09/2013 26/11/2013 18/02/2014 23/04/2014 30/06/2014
PLN
/MW
h
MW
Transaction prices and volumes - baseload for 2015
trade volumes weighted average price

5
• Low prices of coal on foreign markets
• Prices of coal in Q2 2014 were maintained on the level reached as a result of drops in Q1 2014, comparable to prices from the period of June to August 2013
• The market of allowances for
emissions of CO2 was strongly
dependant on political decisions in EU
• Great surplus of EUA in EU ETS
In H1 2014 prices of coal maintained on a low level
0
2
4
6
8
10
I II III IV V VI VII VIII IX X XI XII I II III IV V VI VII VIII IX X XI XII I II III IV V VI
2012 2013 2014
EU
R/t
EUA and CER quotations - closing prices on SPOT market
EUA 2 Phase CER EUA 3 Phase
70
80
90
100
110
120
I II III IV V VI VII VIII IX X XI XII I II III IV V VI VII VIII IX X XI XII I II III IV V VI
2012 2013 2014
USD
/t
Monthly indices of coal prices (globalCOAL)
Richards Bay (RPA) Newcastle (Australia) Amsterdam-Rotterdam-Antwerpia
6
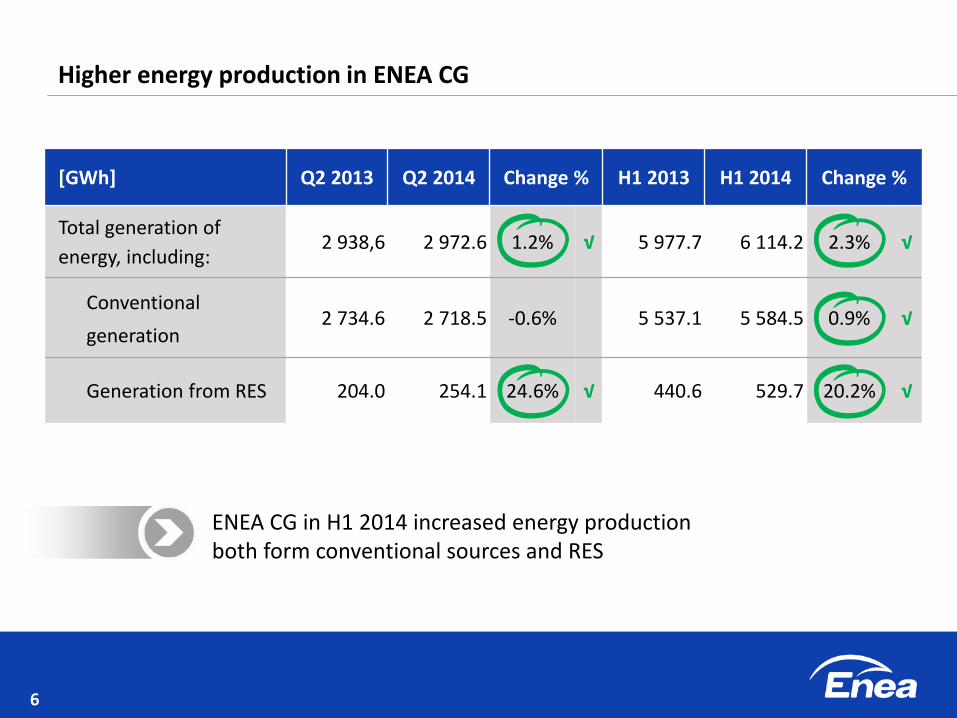
[GWh] Q2 2013 Q2 2014 Change % H1 2013 H1 2014 Change %
Total generation of
energy, including: 2 938,6 2 972.6 1.2% √ 5 977.7 6 114.2 2.3% √
Conventional
generation 2 734.6 2 718.5 -0.6% 5 537.1 5 584.5 0.9% √
Generation from RES 204.0 254.1 24.6% √ 440.6 529.7 20.2% √
Higher energy production in ENEA CG
ENEA CG in H1 2014 increased energy production both form conventional sources and RES

7
Agenda
Energy market and key operating data
ENEA CG's results in Q2 and H1 2014
Key projects implemented in H1 2014
New power unit in Kozienice

Dalida Gepfert Vice-President of the Board for Financial Affairs
ENEA CG generated good results in H1 2014

9
[PLN mln] Q2 2013 Q2 2014 Change % H1 2013 H1 2014 Change %
Net sales revenues 2 215.3 2 466.5 11.3% 4 595.6 4 840.2 5.3% √
EBITDA 387.7 642.0 65.6% 937.6 1 103,5 17.7% √
Net profit 158.0 415.6 163.1% 454.8 624.9 37.4% √
Net debt/EBITDA -0.9 -0.2 0.7 -0.9 -0.2 0.7
Financial results of ENEA CG above market expectations

10
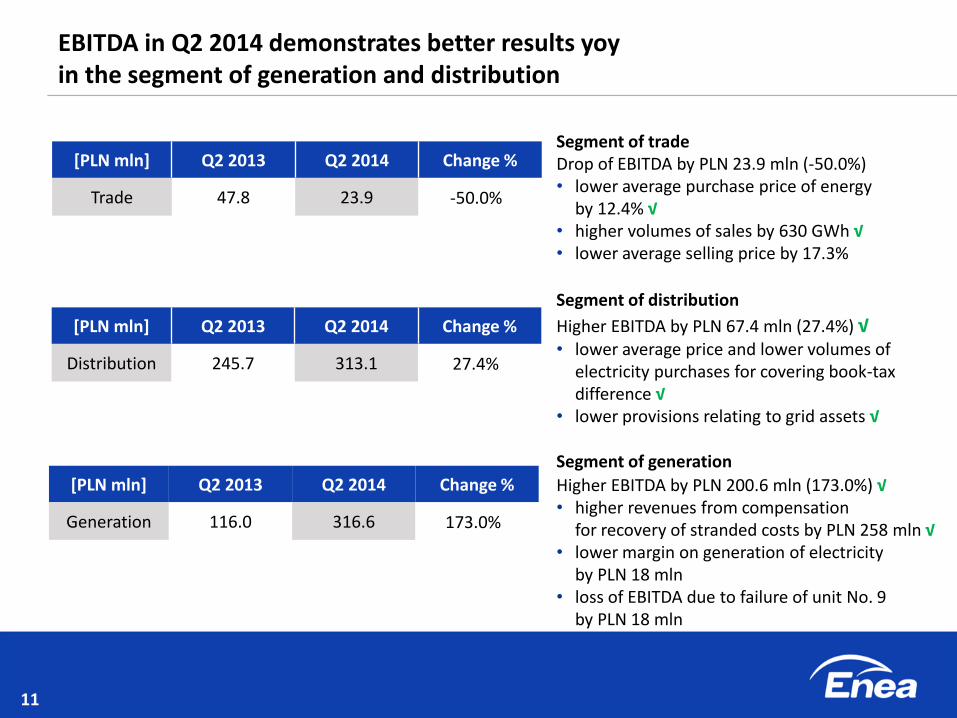
EBITDA in Q2 2014 demonstrates better results yoy in the segment of generation and distribution
2.4% 43.5% 32.2% 8.5% 26.0% 17.5% [PLN mln]
196.4
492.2
191.3 -2.9
67.4
200.6
-3.7
13.9
149.8
0,0
100,0
200,0
300,0
400,0
500,0
600,0
700,0
EBITDA Q2 2013 Trade Distribution Generation Other activity Exclusions* EBITDA Q2 2014
387.7
642.0
-41.6% 27.4% -50.0% 173.0%
* Includes undistributed expenses
of the whole Group and exclusions
EBIT
Amortisation/ depreciation
Growth in segment
Drop in segment
Change in segment yoy [%]
EBITDA margin [%]
11
[PLN mln] Q2 2013 Q2 2014 Change %
Generation 116.0 316.6 173.0%
[PLN mln] Q2 2013 Q2 2014 Change %
Trade 47.8 23.9 -50.0%
EBITDA in Q2 2014 demonstrates better results yoy in the segment of generation and distribution
Segment of trade Drop of EBITDA by PLN 23.9 mln (-50.0%) • lower average purchase price of energy
by 12.4% √ • higher volumes of sales by 630 GWh √ • lower average selling price by 17.3%
Segment of distribution Higher EBITDA by PLN 67.4 mln (27.4%) √ • lower average price and lower volumes of
electricity purchases for covering book-tax difference √
• lower provisions relating to grid assets √
Segment of generation Higher EBITDA by PLN 200.6 mln (173.0%) √ • higher revenues from compensation
for recovery of stranded costs by PLN 258 mln √ • lower margin on generation of electricity
by PLN 18 mln • loss of EBITDA due to failure of unit No. 9
by PLN 18 mln
[PLN mln] Q2 2013 Q2 2014 Change %
Distribution 245.7 313.1 27.4%

12
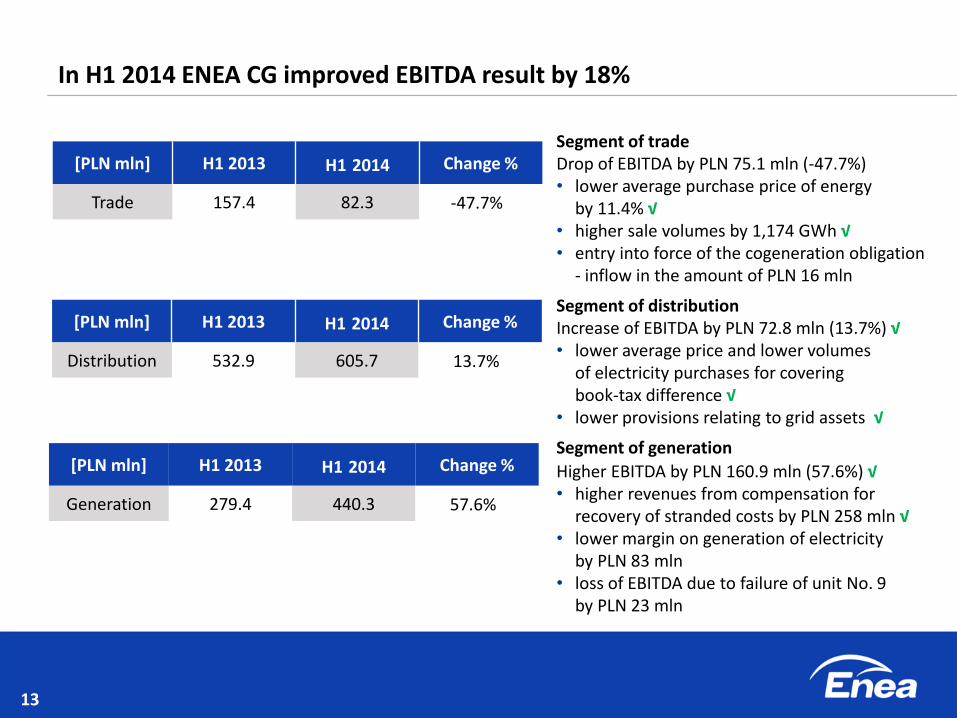
In H1 2014 ENEA CG improved EBITDA result by 18%
551.7
758.9
385.9 -7.1
72.8
160.9
-4.6
11.9
344.6
0,0
200,0
400,0
600,0
800,0
1000,0
1200,0
EBITDA H1 2013 Trade Distribution Generation Other activity Exclusions* EBITDA H1 2014
-47.7% 13.7% 57.6%
937.6
1 103.5
[PLN mln]
-26.5%
20.4% 40.3% 24.5% 11.1% 22.8% 4.1%
* Includes undistributed expenses of the whole Group and exclusions
EBIT
Amortisation/ depreciation
Growth in segment
Drop in segment
Change in segment yoy [%]
EBITDA margin [%]
13
[PLN mln] H1 2013 H1 2014 Change %
Generation 279.4 440.3 57.6%
[PLN mln] H1 2013 H1 2014 Change %
Distribution 532.9 605.7 13.7%
In H1 2014 ENEA CG improved EBITDA result by 18%
Segment of trade Drop of EBITDA by PLN 75.1 mln (-47.7%) • lower average purchase price of energy
by 11.4% √ • higher sale volumes by 1,174 GWh √ • entry into force of the cogeneration obligation
- inflow in the amount of PLN 16 mln
Segment of distribution Increase of EBITDA by PLN 72.8 mln (13.7%) √ • lower average price and lower volumes
of electricity purchases for covering book-tax difference √
• lower provisions relating to grid assets √
Segment of generation Higher EBITDA by PLN 160.9 mln (57.6%) √ • higher revenues from compensation for
recovery of stranded costs by PLN 258 mln √ • lower margin on generation of electricity
by PLN 83 mln • loss of EBITDA due to failure of unit No. 9
by PLN 23 mln
[PLN mln] H1 2013 H1 2014 Change %
Trade 157.4 82.3 -47.7%
14
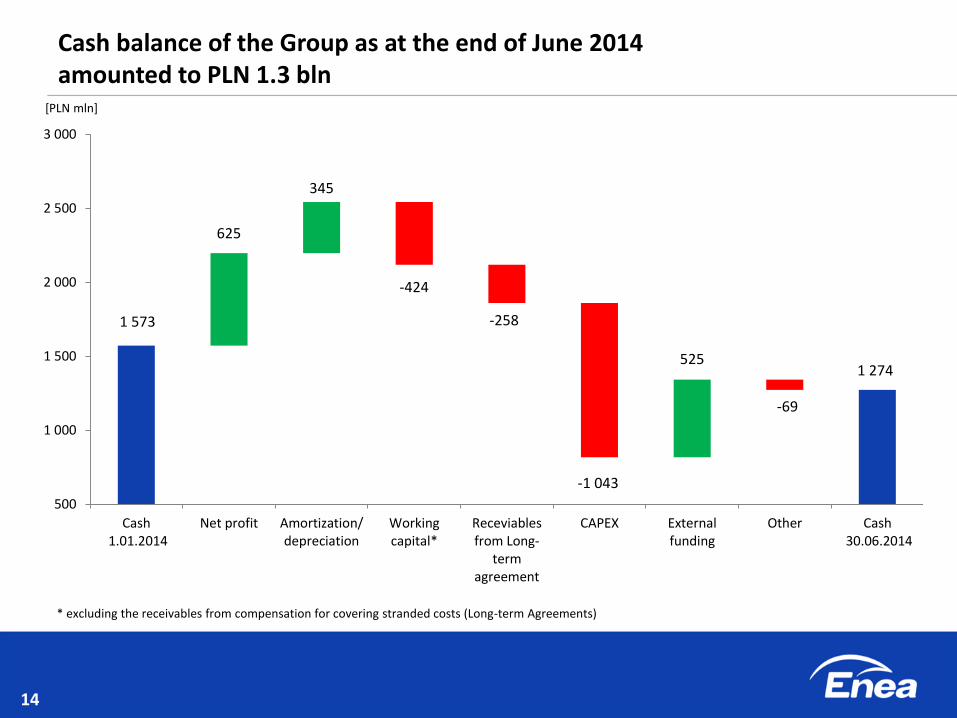
Cash balance of the Group as at the end of June 2014 amounted to PLN 1.3 bln
818
1 573
625
345
-424
-258
-1 043
525
-69
1 274
500
1 000
1 500
2 000
2 500
3 000
Cash 1.01.2014
Net profit Amortization/depreciation
Workingcapital*
Receviablesfrom Long-
termagreement
CAPEX Externalfunding
Other Cash 30.06.2014
[PLN mln]
* excluding the receivables from compensation for covering stranded costs (Long-term Agreements)

15
Cost regime and optimum use of the resources allowed ENEA CG to generate good financial results
In Q2 revenues were recognised from Long-term Agreements which added to the result of the segment of generation
ENEA CG implements the projects anticipated in the corporate strategy consistently and in a timely fashion
Financial results of ENEA CG are above market expectations
Intense development of ENEA CG - CAPEX in H1 2014 higher by PLN 186 mln with a favourable value of net debt/EBITDA ratio -0.2
PLN 75 mln cost savings after H1 2014

16
Agenda
Energy market and key operating data
ENEA CG's results in Q2 and H1 2014
Key projects implemented in H1 2014
New power unit in Kozienice

Krzysztof Zamasz President of the Board
We efficiently implement the projects specified in the strategy
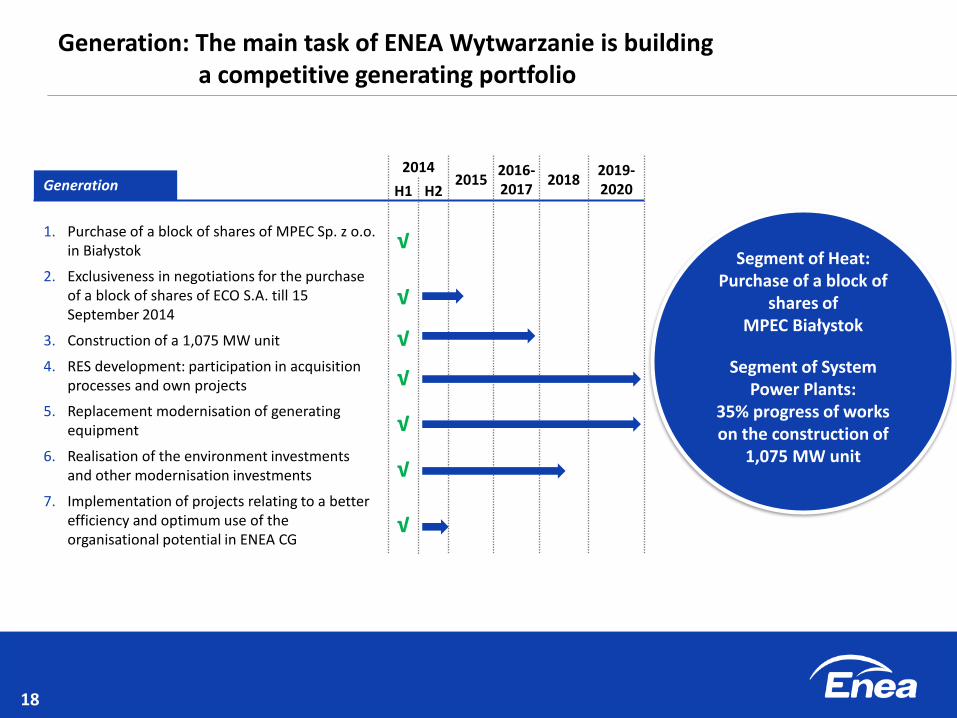
18
Generation: The main task of ENEA Wytwarzanie is building a competitive generating portfolio
1. Purchase of a block of shares of MPEC Sp. z o.o. in Białystok
2. Exclusiveness in negotiations for the purchase of a block of shares of ECO S.A. till 15 September 2014
3. Construction of a 1,075 MW unit
4. RES development: participation in acquisition processes and own projects
5. Replacement modernisation of generating equipment
6. Realisation of the environment investments and other modernisation investments
7. Implementation of projects relating to a better efficiency and optimum use of the organisational potential in ENEA CG
Generation 2014
2015 2016- 2017
2018 2019-2020 H1 H2
√
√
√
√
√
√
√
Segment of Heat: Purchase of a block of
shares of MPEC Białystok
Segment of System Power Plants:
35% progress of works on the construction of
1,075 MW unit

19
Distribution: ENEA Operator prepares for the introduction of the quality tariff in 2016
1. Better condition of the power grid - investments in its development and modernisation (better reliability ratios)
2. Better Customer service, especially within connecting to the grid (shorter time of issuing connection conditions and shorter time of realisation of connection agreements)
3. Cooperation with the President of ERO and other operators of distribution systems within the preparation of companies to the introduction of the quality tariff
4. Intensification of activities within smart grid and smart metering (preparation of the AMI application test in 3 localisations and preparation to the commencement of the balancing meters installation)
5. Operating costs optimisation
6. Closer cooperation with ENEA CG companies: ENEA Centrum and companies comprising the distribution area: ENERGOBUD and ENERGOMIAR - transfer to ENEA Centrum of some functions from within IT, Finance and Accounting and part of the Customer service
Distribution 2014
2015 2016 2017- 2018
2019- 2020 H1 H2
PLN 3 bln - investments in the extension and
modernisation of the grid during 2011-2013
PLN 4.2 bln - investments during 2014-2019
Shorter time for issuing
connection conditions from 30 to 15 days
√
√
√
√
√
√

20
Trade: We focus on building long-term relations with Customers
1. 63,689 - the number of new Customers who trusted ENEA in H1 2014
2. Higher sales of electricity in the segment of strategic Customers by 1 TWh
3. Development of sales in the whole of Poland - introduction of a Poland wide sales structure
4. Launching sales realised by Contact Centre
5. Introduction of a dual-fuel offer 6. "Energy with an account" - development of
a common offer with Getin Bank for individual Clients
7. Launching new products: Fixed price, Strike the raise, Always cheaper +
Trade
2014
H1
√
√
√
√
√
√
√
Higher sales of electricity by 1.82 TWh

21
SSC: 60% functions were centralised in SSC in H1 2014
SSC 2014
2015 H1 H2
√
√
√
√
√
The works were completed relating to
the centralisation of 3 functions:
Finance and Accounting Customer Service
IT
1. Completion of the construction of the Mass Communication Centre - centralisation of the area of printing and delivery of mass communications
2. Extension of the scope of issues which customers may realise remotely through the Contact Centre and increasing the number of matters realised on first contact (FCR ratio)
3. Finalisation of activities within the development of SAP business concept in ENEA CG
4. Completion of the concept stage for a new billing system - conclusion of the implementation agreement
5. Start-up of design works within the centralisation of the subsequent 3 functions: Human Resources, Logistics and Legal Area

22
After H1 cost reduction in ENEA CG amounted to PLN 75 mln
1. Generation
2. Distribution
3. Sales
4. SSC
5. Other companies
TOTAL
Cost savings [PLN mln] H1 2014 Prognosis of initiative
realisation in 2014
56 137
13 39
3 5
1 5
2 3
75 189
Undertaken activities will enable to reduce
costs by ca. PLN 500 mln by 2016

23
Agenda
Energy market and key operating data
ENEA CG's results in Q2 and H1 2014
Key projects implemented in H1 2014
New power unit in Kozienice

Paweł Orlof Vice-President of the Board for Corporate Affairs
Construction of unit No. 11 is on the schedule

25
In H1 2014 ENEA CG implemented actions relating to the construction of 1,075 MW unit
65%
35%
Performance of the lower foundation slab with poles of the load bearing structure of the turbine set
Performance of a reinforced concrete structure of the cooling tower jacket to the level of 40 m
Concreting the upper foundation slab of the boiler house
Performance of a steel load bearing structure of the boiler to the level of 44 m
Completion of reinforced concrete works of communication pylons
Completion of concreting the cooling water piping along the engine room building 2012 – H1 2014 H2 2014 2015
0%
20%
40%
60%
80%Scope of works to be performed in 2014

Additional information

28
116.0
316.6 206.7
-5.2 -0.8
0
50
100
150
200
250
300
350
EBITDA Q2 2013 Segment of System PowerPlants
Segment of Heat Segment of RES EBITDA Q2 2014
Growth
Drop
[PLN mln] Generation – EBITDA Q4 2014 bridge
Attachment 1 – Higher EBITDA in the segment of generation results from the recognition in Q2 2014 of revenues from compensation for recovery of stranded costs

29
47.8
23.9 9.4
-3.6 -2.7
0
10
20
30
40
50
60
EBITDAQ2 2013
First contribution margin Cost of sales Other factors EBITDAQ2 2014
Trade – EBITDA Q4 2014 bridge
Attachment 2 – Lower first contribution margin impaired the results of the segment of trade in Q2 2014
Growth
Drop
[PLN mln]

30
245.7
313.1
39.9
40.5
-1.4
-2.7
0
50
100
150
200
250
300
350
EBITDAQ2 2013
Regulation Gird assets Organisation Other factors EBITDA Q2 2014
Attachment 3 - In Q2 2014 in the segment of distribution lower costs were reported of establishment of provisions relating to the grid assets and employee benefit provisions
Distribution – EBITDA Q2 2014 bridge
Growth
Drop
[PLN mln]

31
279.4
440.3 149.8
9.6 1.5
0
100
200
300
400
500
EBITDAH1 2013
Segment of System PowerPlants
Segment of Heat Segment of RES EBITDAH1 2014
Attachment 4 - Recognition in H1 2014 revenues from compensation for recovery of stranded costs impacted the growth of EBITDA in the segment of generation
Generation – EBITDA H1 2014 bridge
Growth
Drop
[PLN mln]

32
15.4
82.3 0.6
-70.5 -5.3
0
20
40
60
80
100
120
140
160
180
EBITDAH1 2013
First contribution margin Cost of sales Other factors EBITDAH1 2014
Attachment 5 – Lower first contribution margin charged the results of the segment of trade in H1 2014
Trade – EBITDA H1 2014 bridge
Growth
Drop
[PLN mln]

33
532.9
605.7
5.0
40.9 32.1
-5.1
0
100
200
300
400
500
600
700
EBITDAH1 2013
Regulation Gird assets Organisation Other factors EBITDAH1 2014
Attachment 6 - In H1 2014 in the segment of distribution lower costs of energy purchases were reported for covering the book-tax difference and costs of establishment of reserves
Distribution – EBITDA H1 2014 bridge
Growth
Drop
[PLN mln]