Endogeneity of Inter-Relations among Corporate...
31
0 Endogeneity of Inter-Relations among Corporate Environmental Performance, Environmental Disclosures, Financial Performance, and Risk Amama Shaukat Brunel Business School Brunel University London Kingston Lane Uxbridge Middlesex, UB8 3PH UK Tel: +44 1895 268899 E-mail: [email protected] Grzegorz Trojanowski* University of Exeter Business School Xfi Building Rennes Drive Exeter EX4 4ST UK Tel: +44 1392 723441 E-mail: [email protected] * Corresponding author
Transcript of Endogeneity of Inter-Relations among Corporate...

0
Endogeneity of Inter-Relations among Corporate Environmental
Performance, Environmental Disclosures, Financial Performance, and Risk
Amama Shaukat
Brunel Business School
Brunel University London
Kingston Lane
Uxbridge Middlesex, UB8 3PH
UK
Tel: +44 1895 268899
E-mail: [email protected]
Grzegorz Trojanowski*
University of Exeter Business School
Xfi Building
Rennes Drive
Exeter EX4 4ST
UK
Tel: +44 1392 723441
E-mail: [email protected]
* Corresponding author
1
Endogeneity of Inter-Relations among Corporate Environmental
Performance, Environmental Disclosures, Financial Performance, and Risk
Abstract
We propose a holistic approach to modelling of the links among various environmental and
financial outcomes of a firm, taking into account the endogeneity of these relations. In
particular, we explicitly incorporate financial risk in the environmental-financial accountability
analysis. We find corporate environmental performance and disclosures, corporate financial
performance, and financial risk to be endogenously determined. First, consistent with the
voluntary disclosure theory, we find a positive link between environmental performance and
environmental disclosures. Second, we find that higher and more objective environmental
disclosures help improve a firm’s operating performance while mitigating its operating risk.
Apparently, environmental disclosures are largely a means of engaging with and building a
positive reputation among the firm’s key operational stakeholders including customers. Third,
we find corporate environmental performance to improve a firm’s market value while reducing
its market risk: for investors, environmental actions seem to speak louder than words. Finally
we find many of the links between the endogenous variables to be bi-directional. Overall these
results have important conceptual and methodological implications for future research as well
as for policy and practice.
Keywords: corporate social responsibility; environmental performance; environmental
disclosures; financial performance; financial risk; endogeneity

2
1. Introduction
As the issues of climate change and natural resource degradation and depletion gain
importance, corporate environmental accountability is also gaining momentum around the
world. Accordingly all interested parties including policy makers, academics, corporate
managers and investors are striving to understand the inter-relations between corporate
environmental performance (CEP), corporate environmental disclosures (CED), and the link
of both these variables with corporate financial performance (CFP). While scholars have
investigated the link between CEP and CED from different theoretical standpoints and have
obtained mixed empirical results (e.g. Cho & Patten, 2007; Clarkson, Li, Richardson, &
Vasvari, 2008; Patten, 2002), the bulk of research in this area has focussed on studying the link
between CEP and CFP also known broadly as the study of the ‘business case’ for corporate
social (and environmental) responsibility (for good reviews see Beurden & Gossling, 2008,
Margolis & Walsh, 2003; and Orlitzky, Schmidt & Rynes, 2003). There are very few studies,
however, that examine the link among the three variables simultaneously, taking into account
the endogeneity of these links (a notable exception being the study by Al-Tuwaijri, Christensen,
& Hughes, 2004). Moreover, to the best of our knowledge, no prior work incorporates firm risk
in such an analysis. The omission of risk from the financial-environmental accountability type
analysis is quite problematic as Orlitzky and Benjamin (2001; p. 369) aptly remark that ‘[t]rue
economic performance (…) manifests itself in both high financial return and low financial
risk.’ Hence the so-called business case for environmental accountability would be incomplete
without consideration of its impact on financial risk alongside financial return.
In this paper we aim to develop a more holistic understanding of the links between the
key environmental and financial outcomes of a firm taking into account the endogeneity of
these links. The specific contributions we make to the related literature are as follows. On the
conceptual level, we incorporate financial risk in the environmental-financial accountability

3
analysis. Reduction of risk is central to the discussion of the strategic role of responsible
environmental management by a firm (Godfrey 2005; Husted, 2005; Sharfman & Fernando,
2008). Yet, barring some studies (e.g. Chen & Metcalf, 1980; McGuire et al., 1988; Oikonomou
et al., 2012; Salama, Anderson, & Toms 2011; Spicer, 1978) it has largely been neglected in
the CEP-CFP-type analyses (Orlitzky & Benjamin, 2001). Moreover, barring a very few studies
that incorporate direct measures of firm risk (e.g. Benlemlih et al., 2016; Cormier & Magnan,
1999), it has also been ignored in the literature on environmental disclosures. We not only
incorporate risk explicitly in this analysis, i.e. examine the simultaneous links between CEP,
CED, CFP, and corporate financial risk (CFR), but also study these links separately for the
firm’s financial operating and market outcomes. As noted earlier, omission of any of the
aforementioned variables not only presents an incomplete picture, but potentially leads to the
danger of producing biased and inconsistent results with ensuing problematic managerial and
other corporate stakeholder-related implications.
We also improve on the empirical level over prior related analysis by Al-Tuwaijri et al.
(2004) and Clarkson, Li, Richardson, and Vasvari (2008 and 2011). First, we use an extensive
longitudinal data set covering a wide cross-section of industries over the period 2005-2013 for
the UK-listed firms – prior related studies are largely cross-sectional and/or limited to the most
environmentally-sensitive industries (e.g. Al-Tuwaijri et al., 2004; Clarkson et al., 2008 and
2011). Second, we improve on the measurement of relevant variables. While both Al-Tuwaijri
et al. (2004) and Clarkson et al. (2011) measure CEP in terms of only limited environmental
performance indicators, for example Al-Tuwaijri et al. (2004) use the proportion of hazardous
waste recycled, we employ the now widely-used comprehensive environmental performance
measures, namely Asset4 environmental performance scores. These scores capture a wide array
of indicators of environmental performance for a firm relative to its industry peers as well as
wider industry sectors (Ioannou & Serafeim, 2015; Shaukat, Qiu, & Trojanowski, 2016).

4
Similarly we measure environmental disclosures using the Bloomberg disclosure scores, used
recently in a number of studies (e.g. Benlemlih et al., 2016; Qiu, Shaukat, & Tharyan, 2016).
These disclosure scores also cover a wide array of industry-relevant items of environmental
information that can be provided by a firm.
As expected, we find CEP, CED, CFP, and CFR, to be endogenously determined.
Specifically, while both CEP and CED are linked to CFP (both operating and market
performance) as well as CFR (both operating and market risk), the effects of CEP and CED
differ. While CED improves a firm’s operating performance and reduces the variability of this
performance, CEP improves the firm’s market performance and reduces the market risk. These
prior findings suggest that firms make instrumental use of their CED to engage with their key
economic stakeholders including customers in order to improve corporate perception,
reputation (Aerts and Cormier, 2008; Hasseldine et al., 2005; Jones, 1995; Toms, 2002) and
hence encourage their cooperation which is vital for the firm’s continued operational success
(Jensen, 2002). For corporate investors, however, environmental actions speak louder than
words. Prior evidence suggests that investors consider a firm’s social and environmental
disclosures to be ‘self-congratulatory PR puff’ (Milne and Chan, 1999; p. 452) or
‘perfunctionary’ (Campbell and Slack, 2011). Our findings suggest that this investor
perception, at least in the UK, has not changed. This assertion is further supported by the fact
that we find CED to have a strong negative link with a firm’s current market performance and
a weak positive link with market risk. CEP on the other hand, has a strong negative link with a
firm’s current operating performance and a positive link with the variability of this
performance. The latter finding in conjunction with market-related results suggest that while
investments in environmental actions (which are usually innovative and risky) are
contemporaneously costly for a firm (thus negatively impacting its financial bottom line) while
increasing its contemporaneous operating risk, are still valued by investors as they are possibly

5
seen as investments that would reap future environmental pay offs. These findings also suggest
that CEP and CED are two distinct, complementary and apparently balancing activities of a
firm: firms engage in corporate environmental reporting to build better relations with
stakeholders vital for a firm’s operational success, while CEP, although contemporaneously
costly, is undertaken as it matters to the firm’s investors. Overall, our findings shed new light
on the distinct economic relevance of CEP and CED, as well as highlight the importance of
including CFR alongside CFP in such analyses: both CEP and CED seem to have true economic
relevance for a firm and its stakeholders.
In terms of other results, we find evidence of reverse causality going from higher market
risk to higher CEP for all types of firms (and not just for the firms in controversial industries
as found by Jo and Na, 2012). We also document the positive bi-directional nature of the link
between CED and operating performance, suggesting that not only CED improves profitability,
but it also pays for profitable firms to communicate more with its key stakeholders. Finally,
consistent with the resource-based view (RBV) theory and voluntary disclosure theory we
show a positive link between CEP and CED. Across the industrial sectors, firms are now
making environmental disclosures that are reflective of their actual environmental
performance.
2. Literature review and hypotheses development
2.1. Corporate environmental performance, environmental disclosures, operating
performance, and operating risk
The CEP-CFP link has been approached in the literature from different perspectives, depending
on the discipline of the researching scholar. From the management perspective, drawing on the
RBV theory (Hart, 1995) scholars have argued and found evidence that being environmentally
responsible can be a source of competitive advantage that can bring economic benefits to a

6
firm, including superior operating profits. While this case has not been unequivocally
established, there is some evidence to suggest that this may at times be the case (Beurden &
Gossling, 2008; Margolis & Walsh, 2003; Russo & Fouts, 1997; Waddock & Graves, 1997).
There is also an alternative view again from the RBV perspective and some evidence to suggest
that that it is important for a firm to be profitable first and to have excess resources in order to
lead green initiatives (often costly with long horizon benefits; Clarkson et al. 2011). In short,
evidence suggests that in the case of CEP and corporate profitability, causality could run in
either or both directions, and as Al-Tuwaijri et al. (2004) and Clarkson et al. (2011) suggest,
both may be determined jointly by some other unobservable variable like superior management
quality of firms.
As with CEP, recent evidence suggests that it is also the firms having sufficient
financial resources (i.e. financial slack and higher operating returns) that are able to make
costly extensive and objective environmental disclosures (CED). Moreover, firms making such
environmental (and social) disclosures are also found to enjoy higher expected growth rates of
their cash flows (Qiu, Shaukat, & Tharyan, 2016). Hence, as with CEP, the link between CED
and profitability may also be endogenous with bi-directional causality. In today’s world of
rapid corporate information dissemination and the similarly instant access to information, it is
likely that not only more profitable firms would have requisite resources and credibility (due
to proprietary and opportunity costs associated with making extensive environmental
disclosures, see Brammer & Pavelin, 2008; Cormier & Magnan, 1999), but also, that the
benefits of such credible environmental disclosures would translate quickly into higher cash
flows/profits (by creating a positive firm reputation among its various stakeholders including
customers; Lev, Petrovits, & Radhakrishnan, 2010; Qiu, Shaukat, & Tharyan, 2016). The
recent disclosure of poor environmental performance of VW cars (although by a third party)
7
provides a good example of how powerful and instantaneous the effect of environmental
information can be for both the firm bottom line and stock prices.
Importantly, the discussion of risk, including operating profitability risk, has largely
been absent within the CEP and/or CED and profitability analysis. This omission is quite
surprising given that, on a theoretical level, mitigation of operating risk has often been argued
to be a key strategic purpose of undertaking effective corporate social including corporate
environmental programmes (Husted, 2005). Husted (2005) theoretically argues that
investments in corporate social responsibility-related activities are real options involving
strategic and operating decisions by managers that can help reduce the operating risk of the
firm. He however does not elaborate on which aspects of corporate social (including
environmental) responsibility-related activities would matter for a firm’s operating risk. In this
regard, Hart (1995) clearly highlights that it is important not just to undertake environmental
responsibility-related performance, but also to make effective disclosure of this performance –
in order to build a positive firm reputation among key corporate stakeholders. For example, it
is not enough to produce ‘greener’ cars, but also to communicate effectively (to all relevant
stakeholders) about the operational initiatives that the firm is undertaking in order to become
‘green’ itself, including making its suppliers, employees and customers ‘green’. This can help
the firm enlist the support of various corporate stakeholders including environmental activists
(who may give free valuable publicity to the firm), proud employees (who are likely to be
happy/proud to be associated with such an environmentally responsible company), suppliers
(whose practices the company helps in making more environmentally and thus also
economically long-run sustainable), and loyal customers who are even willing to pay more in
order to do their bit for the environment. Increasingly B2C companies now appeal to ‘green’-
oriented consumers by making use of certification from organizations working for promoting
environmental sustainability. For example, Unilever-owned PG tips tea company in the UK

8
actively promotes its position as being the first major UK tea brand to sell fully Rainforest
Alliance CertifiedTM black and green teas. They are also engaging their customers by calling
on them to recycle or compost their tea waste. The website of Tesco (one of the sample firms)
goes to considerable length to explain how the company is engaging with its suppliers,
customers, government and other agencies (like Sustainable Seafood Coalition) to ensure that
it responsibly and sustainably sources and supplies fish to its customers. Recognizing the
importance of communicating this to its customers, it says on its website ‘We’re also working
with other agencies, Government, UK retailers and brand owners through the Sustainable
Seafood Coalition to ensure transparency and consistency when it comes to how we
communicate sustainability to our customers.’
All such actions (i.e. environmental performance) and their reporting (i.e. related
disclosures) should promote better stakeholder relations (including customer relations) thus
helping reduce operating risk. The empirical evidence examining the links among CEP, CED
and CFR (operating) is quite limited, however. To the best of our knowledge, a number of prior
studies have only examined the link between CEP and market risk (which we discuss in the
next section), while one recent study examines the link between CED and operating risk
(Benlemlih et al. 2016). Given the lack of relevant evidence, we consider the existence of the
link between CEP and operating risk an open empirical question, allowing for the link to be bi-
directional. However, following Benlemlih et al. (2016) we hypothesize the link to run from
CED to operating risk. Furthermore, we simultaneously study the links among these four
variables (i.e. CEP, CED, as well as operating measures of CFP and CFR), which to the best
of our knowledge have not been studied as such before. Pointing to this notable omission in
the literature, Orlitzky and Benjamin (2001; p. 370) comment that “reviews of the social-
financial performance literature usually do not correct for any potentially confounding CSP-
risk effects. Instead, many of those previous reviews and studies relating CSP to corporate

9
financial outcomes have focused almost exclusively on performance level instead of
performance variability.”
Moreover, given the mixed and inconsistent prior results on any pair-wise relations
between CEP, CED, operating profits, and their variability, we refrain from making any
specific predictions about the nature (positive/negative) of these links.
2.2. Corporate environmental performance, environmental disclosures, market performance,
and market risk
Over the years, scholars have also been interested in examining various capital market
implications of CEP and CED. In this context, many studies have examined the link between
various measures of a firm’s CEP and measures of its market performance. As with operating
performance, scholars have been divided on whether better CEP should lead to superior market
performance or vice versa. Proponents of the former view, drawing on the resource-based view
(RBV) theory, have generally argued, that superior CEP of a firm should signal to the market
its superior management quality (Ullman, 1985) and/or superior corporate strategy (Hart,
1995), which in turn should increase the market value of the firm. Alternatively, consistent
with Friedman’s (1970) argument, there is also a view in the literature that expenditures on
environmental responsibility related activities of a firm, for example pollution-control or
waste-recycling expenditures, are a wasteful cost that could reduce the financial
competitiveness of a firm and thus should be discounted by the market (e.g. Barnea & Rubin,
2010). Consistent with these divergent theoretical stances, prior evidence on the link between
CEP and market performance tends to be mixed, with some studies finding a positive link
between measures of CEP and measures of market performance such as Tobin’s Q (e.g. Al-
Tuwaijri et al., 2004; Clarkson et al., 2011; Dowell, Hart, & Young, 2000), and others finding

10
a negative link (e.g. Barth & McNichols, 1994; Brammer, Brooks, & Pavelin, 2006; Hughes,
2000).
As is the case with CEP, the research examining the link between CED and measures
of market performance also yield mixed empirical results. While many earlier studies using
limited (mostly negative news-related) environmental disclosures find a negative link between
measures of CED and market performance (e.g. Freedman & Patten, 2004; Lorraine, Collinson,
& Power, 2004; Shane & Spicer, 1983), more recent work (e.g. Clarkson et al., 2011) using a
more comprehensive and objective measure of CED, find a positive link between CED and the
market value of a firm. Additionally, consistent with the arguments and empirical results of Al-
Tuwaijri et al. (2004), Clarkson et al. (2011) find the links among CEP, CED, and measures of
market performance to be endogenous – assumed to be determined simultaneously by the
superior management quality of firms.
Again, while Al-Tuwaijri et al. (2004) and Clarkson et al. (2011) consider CEP, CED,
and market performance to be endogenous, they surprisingly omit the consideration of firm
market risk from their analysis. There is a long-standing argument and evidence to support the
notion that good environmental performance can be an effective risk-management strategy that
can lower the firm’s market risk (e.g. Chen & Metcalf, 1980, McGuire et al., 1988; Spicer,
1978). Recent studies, presenting different theoretical arguments, including good CEP leading
to reduction in implicit stakeholder claims (Salama et al., 2011) or good CEP providing
insurance-like protection to a firm’s assets against downside risk (Oikonomou et al., 2012),
find a negative link between measures of CEP and market risk. There is, however, an alternative
argument, also supported by empirical evidence, that firms in ‘controversial’ industries which
are likely to have higher market risk, may be more inclined to undertake higher CSP (including
CEP) as a reputation building exercise (Jo & Na, 2012; Toms, 2002). Hence, one can conclude

11
that the link between CEP and market risk could also be endogenous, due to reverse causality
and/or simultaneity.
Contrary to the relatively frequently studied link between CEP and measures of market
risk, the link between CED and market risk, to the best of our knowledge, is rather under-
studied. A recent study by Benlemlih et al. (2016) finds a negative link running from CED to
market risk. The authors postulate that reliable and relevant environmental disclosures can
reduce the information asymmetry between the firm and its investors and thus, by reducing the
market participants’ perception of riskiness of a firm can help reduce its market risk. Thus, in
the light of the prior results relating to the links among CEP, CED, market performance and
market risk, we treat these as endogenous in our analysis. Again, given prior inconsistent
results, we refrain from making any predictions about the specific nature (positive/negative) of
the relations.
2.3. The link between corporate environmental performance and environmental disclosures
Finally, the discussion of CEP, CED and firm financial outcomes would be incomplete
without a commentary on the link between CEP and CED themselves. In this regard, scholars
have been divided on both the theoretical as well as the empirical front. While some scholars
drawing on socio-political and legitimacy theory-based arguments contend and find support
for the notion that such disclosures are primarily an environmental reputation/legitimacy
building exercise and therefore poor environmental performers are likely to make greater
environmental disclosures (e.g. Cho et al. 2012; Cho and Patten, 2007; Patten, 2002); other
scholars based on RBV and voluntary disclosure theory (VDT) argue and find support for the
notion that superior environmental performers are likely to make greater environmental
disclosures in order to convey their ‘type’ (see Al-Tuwaijri et al., 2004; Clarkson et al., 2008;
Qiu, Shaukat, & Tharyan, 2016). Regardless of the specific nature of the link, scholars tend to
12
agree that CEP and CED are inter-related and thus not only should both be included in an
environmental-financial accountability type analysis, but their endogeneity should also be
controlled for. Hence, we include both and treat them as endogenous.
3. Data and methodology
3.1 Sample
Our sample covers UK firms that are FTSE350 index constituents over the period, 2005-2013.
The initial sample comprises 1,835 firm-years for which Bloomberg environmental disclosure
scores (used for measuring the disclosures in our study and discussed in detail below) are
available. We then match these with data on financial variables collected from Worldscope (via
Thomson One) and Thomson Reuters Asset4 environmental performance scores (discussed
below and retrieved from Datastream). Finally, to be consistent with prior studies, we drop
observations corresponding to firms belonging to financial sector (Industry 11 in Fama &
French, 1997, 12-industry classification) leaving us with a usable sample of 961 firm-year
observations covering a wide cross-section of industries.
3.2. Endogenous variables
The environmental performance score (CEP) as defined by Asset4 (a Thomson Reuters
database) “measures a company's impact on living and non-living natural systems, including
the air, land and water, as well as complete ecosystems. It reflects how well a company uses
best management practices to avoid environmental risks and capitalize on environmental
opportunities”. It covers ’hard’ performance indicators (as classified by Clarkson et al., 2008)
such as information on energy used, CO2 emissions, water and waste recycled, and spills and
pollution controversies. Hence, the aggregate environmental performance score can be
considered to provide a largely objective measure of a firm’s overall environmental

13
performance and it has been used by prior related literature (e.g. Ioannou & Serafeim, 2015;
Shaukat, Qiu, & Trojanowski, 2016).
The environmental disclosure score (CED) is developed by Bloomberg. Bloomberg
assigns the disclosure scores to companies based on data points collected via multiple sources
including annual reports, standalone sustainability reports and company websites etc. The data
points used for calculating the disclosure scores are based on the GRI framework and capture
standardized cross-sector and industry-specific metrics. The weighted score is normalized to
range from zero, for companies that do not disclose any environmental data, to 100 for those
disclosing every data point collected. Moreover, the individual company score is expressed as
a percentage, so as to make the score comparable across companies. The score is also tailored
to be industry relevant, so that each company is evaluated only in terms of the data that is
relevant to its industry sector. For example, ‘Phones Recycled’ is only considered in the score
for telecommunications companies and not for other sectors. The data points are also weighted
(based on a proprietary weighting scheme) in terms of relevance. For example ‘Green House
Gas emissions’ would be weighted more heavily than other data points in computing the E
disclosure score. Hence, the E disclosure score captures both the quantity (i.e. number of E
items reported by a company) as well as the quality (in terms of objective and industry-relevant
data) of environmental disclosures. Approximately 80% of environmental disclosure items
covered are objective data items, while only 20% are ‘soft’ i.e. subjective data points. Thus,
these environmental scores largely capture what Clarkson et al. (2008) would call a firm’s
‘hard’ environmental disclosure. A number of recent studies have used Bloomberg disclosure
scores (e.g. Benlemlih et al., 2016; Qiu, Shaukat, & Tharyan, 2016; Utz & Wimmer, 2014).
In alternative model specifications, we employ two different measures of firm financial
performance (CFP), i.e. an accounting-based profitability measure (return on assets, ROA) and
stock-based performance measure (Tobin’s_Q), both used in prior related literature (e.g.
14
Dowell et al., 2000; Waddock & Graves, 1997). Depending on the financial performance
measure employed in the model, we employ corresponding measures of firm risk (CFR). Hence
in the models including profitability, consistent with prior related literature (e.g. McGuire et
al., 1988) we use standard deviation of ROA over three-year period (SD_ROA) as the
corresponding operating risk measure. In the models employing stock-based measure of
financial performance, we employ stock Volatility a measured by the standard deviation of the
firm’s daily stock’s return as the measure of firm risk (cf. Jo & Na, 2012; McGuire et al., 1988).
As discussed above, we expect to find the following endogenous links (depicted in
Figure 1). First, we expect a unidirectional contemporaneous link running from CEP to CED.
Second, we expect a bi-directional link of both CEP and CED with both measures of firm
financial performance i.e. operating and market. Third, we expect a bi-directional link between
CEP and both measures of firm risk. Finally, we postulate that CED affects both measures of
risk.
[Insert Figure 1 about here]
3.3. Exogenous regressors and control variables
The decisions to include/exclude particular variables are driven by theoretical considerations
and the identification requirements for the system of equations. In particular, we control for
firm size (Size) as measured by the natural logarithm of total assets in all the regressions. Larger
firms face greater public scrutiny as well as stakeholder responsibility pressures and thus are
more likely to engage in broader social responsibility, including environmental activities
(Brammer & Pavelin, 2008; Cho & Patten, 2007; Qiu, Shaukat, & Tharyan, 2016). We also
expect a negative relationship between size and firm’s risk: prior studies suggest that larger
firms are less exposed to risk, as they are more able to manage risk especially in times of high
volatility (e.g. Jo & Na, 2012).
15
Leverage is measured by total debt to total assets ratio. Prior evidence suggests higher
leverage to be associated with higher firm risk (Jo & Na, 2012). Thus a positive association is
expected between firm’s leverage and risk. Higher leverage is also expected to boost firm
financial performance.
Following prior studies, we control for capital expenditure scaled by total assets
(CapEx) while modelling firm environmental performance (Shaukat, Qiu, & Trojanowski,
2016). We also control for asset growth (Asst_Grwth), as measured by total assets in year t
minus total assets in year t-1 divided by total assets in year t-1, in the equations explaining
environmental disclosures and firm risk (cf. Jo & Na, 2012; Qiu, Shaukat, & Tharyan, 2016).
Clarkson et al. (2011) argue and find empirical support for the claim that firms pursuing
a proactive environmental strategy are the ones with greater financial resources. We therefore
control for financial slack (Fin_Slack, measured as the ratio of the sum of cash and short-term
investments and total receivables to the book value of total assets, cf. Qiu, Shaukat, & Tharyan,
2016; Shaukat, Qiu, & Trojanowski, 2016) while modeling environmental disclosures.
There is a theoretical argument (Johnson & Greening 1999) that large block holders,
due to their narrow short term share performance targets and illiquidity of holdings, may tend
to focus on short term returns, whereas investments in CSR require longer time horizons.
Accordingly we expect a negative relation between block holdings (Blck_Hold, measured as
block holdings of 5% or more) and measures of environmental performance and disclosure (cf.
Qiu, Shaukat, & Tharyan, 2016).
Finally, asset intangibility as a proxy for firm’s investments in R&D (Asst_Intngblty,
measured as the ratio of intangible assets to total assets) is likely to relate to both firm financial
performance and risk (cf. Jo & Na, 2012).
16
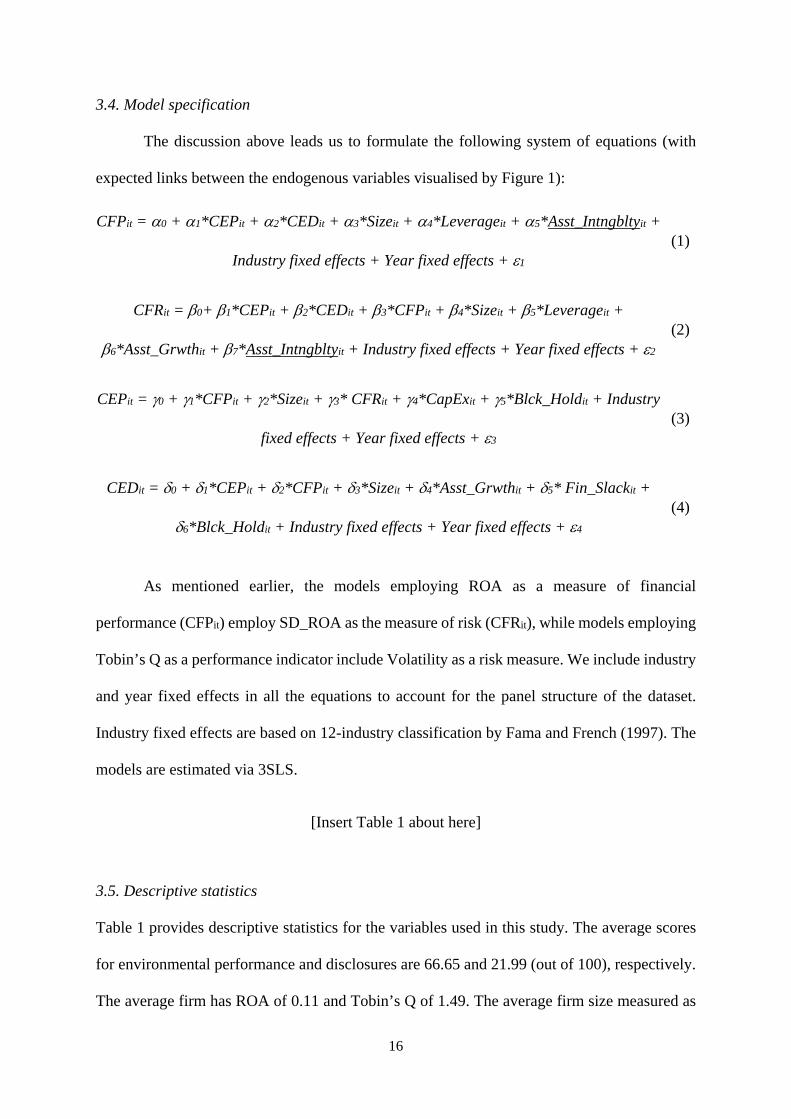
3.4. Model specification
The discussion above leads us to formulate the following system of equations (with
expected links between the endogenous variables visualised by Figure 1):
CFPit = 0 + 1*CEPit + 2*CEDit + 3*Sizeit + 4*Leverageit + 5*Asst_Intngbltyit +
Industry fixed effects + Year fixed effects + 1
(1)
CFRit = 0+ 1*CEPit + 2*CEDit + 3*CFPit + 4*Sizeit + 5*Leverageit +
6*Asst_Grwthit + 7*Asst_Intngbltyit + Industry fixed effects + Year fixed effects + 2
(2)
CEPit = 0 + 1*CFPit + 2*Sizeit + 3* CFRit + 4*CapExit + 5*Blck_Holdit + Industry
fixed effects + Year fixed effects + 3 (3)
CEDit = 0 + 1*CEPit + 2*CFPit + 3*Sizeit + 4*Asst_Grwthit + 5* Fin_Slackit +
6*Blck_Holdit + Industry fixed effects + Year fixed effects + 4 (4)
As mentioned earlier, the models employing ROA as a measure of financial
performance (CFPit) employ SD_ROA as the measure of risk (CFRit), while models employing
Tobin’s Q as a performance indicator include Volatility as a risk measure. We include industry
and year fixed effects in all the equations to account for the panel structure of the dataset.
Industry fixed effects are based on 12-industry classification by Fama and French (1997). The
models are estimated via 3SLS.
[Insert Table 1 about here]
3.5. Descriptive statistics
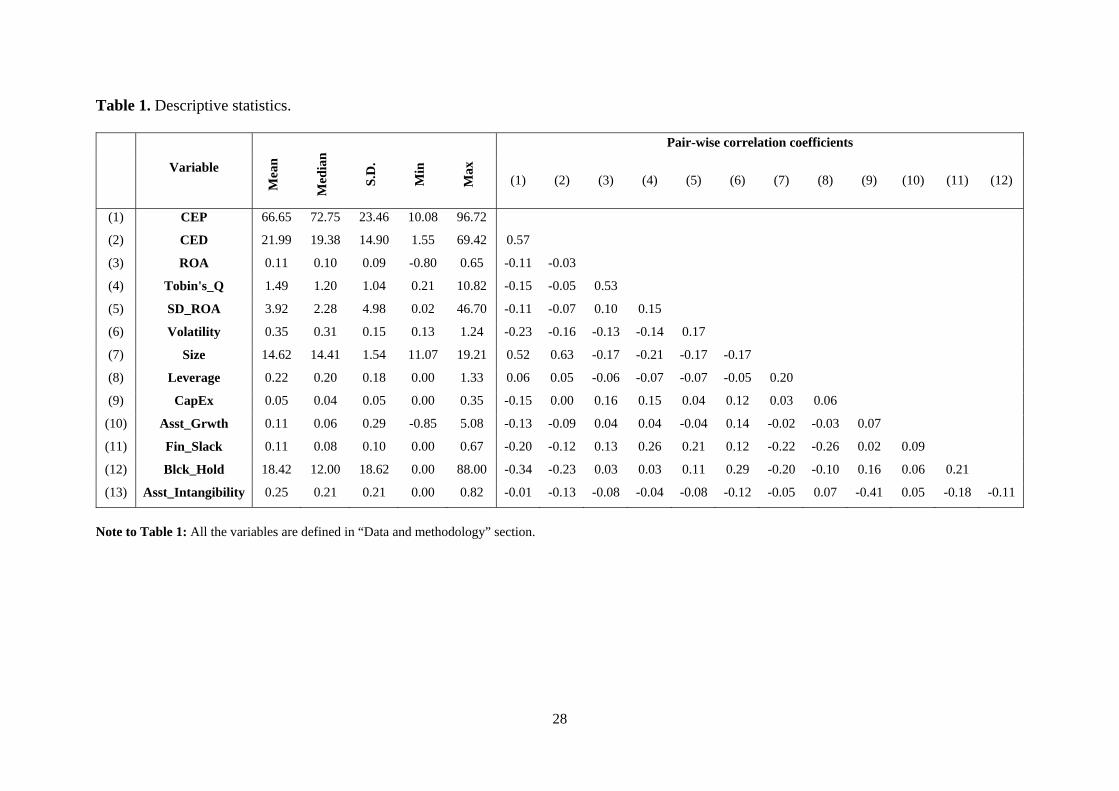
Table 1 provides descriptive statistics for the variables used in this study. The average scores
for environmental performance and disclosures are 66.65 and 21.99 (out of 100), respectively.
The average firm has ROA of 0.11 and Tobin’s Q of 1.49. The average firm size measured as

17
natural log of total assets is 14.62, which correspond to £2.24bn. The average firm is
moderately leveraged (at 22%), spends about 5% of total assets on capital expenditures, and
has the annual asset growth of 11%. On average 18.42% of equity outstanding is controlled by
large block holders. Finally, intangible assets represent on average about a quarter of the total
asset base. For most variables, the median and mean values are pretty close to each other
indicating lack of skewness in the corresponding distributions.
Table 1 also presents the pair-wise Pearson correlations for all variables. It shows a
high correlation between environmental performance and disclosure (0.57). Moreover, the
correlations between these two CSR-related measures and firm size are strongly positive (at
0.52 and 0.62, respectively). The absolute values of all the remaining correlation coefficients
do not exceed 0.41, indicating that our models are unlikely to suffer from multicollinearity
problems.
4. Results
Tables 2 and 3 present the main results of the analyses. While Table 2 reports parameter
estimates for the model employing accounting-based measures (i.e. ROA and SD_ROA as
proxies for financial performance and risk, respectively), Table 3 presents results for the model
employing market-based indicators (i.e. Tobin’s Q and Volatility, respectively).
[Insert Tables 2 and 3 about here]
First, both models, i.e. Tables 2 and 3, strongly support the predictions of the RBV and
VDT theories: in other words, our evidence suggests that across the industrial sectors, better
environmental performers make more extensive and objective environmental disclosures: one-
standard-deviation increase in CEP translates almost exactly into one-standard-deviation
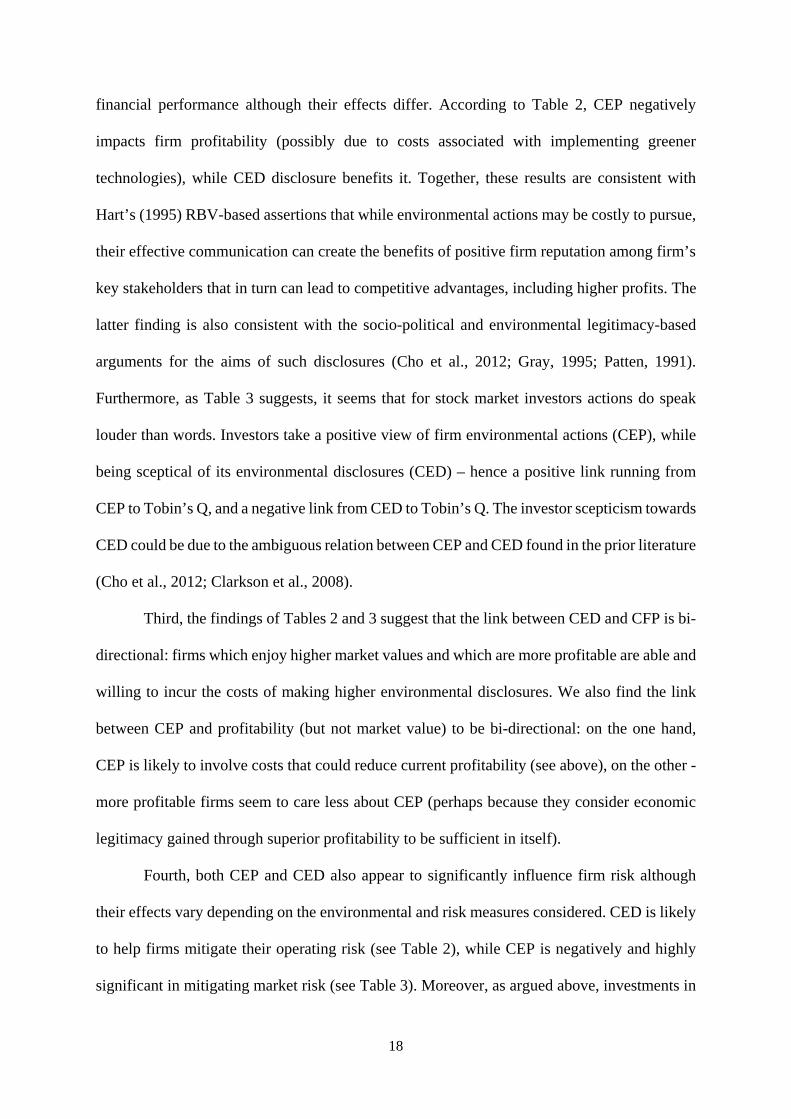
increase in the CED score. Second, we find that both CEP and CED significantly affect firm
18
financial performance although their effects differ. According to Table 2, CEP negatively
impacts firm profitability (possibly due to costs associated with implementing greener
technologies), while CED disclosure benefits it. Together, these results are consistent with
Hart’s (1995) RBV-based assertions that while environmental actions may be costly to pursue,
their effective communication can create the benefits of positive firm reputation among firm’s
key stakeholders that in turn can lead to competitive advantages, including higher profits. The
latter finding is also consistent with the socio-political and environmental legitimacy-based
arguments for the aims of such disclosures (Cho et al., 2012; Gray, 1995; Patten, 1991).
Furthermore, as Table 3 suggests, it seems that for stock market investors actions do speak
louder than words. Investors take a positive view of firm environmental actions (CEP), while
being sceptical of its environmental disclosures (CED) – hence a positive link running from
CEP to Tobin’s Q, and a negative link from CED to Tobin’s Q. The investor scepticism towards
CED could be due to the ambiguous relation between CEP and CED found in the prior literature
(Cho et al., 2012; Clarkson et al., 2008).
Third, the findings of Tables 2 and 3 suggest that the link between CED and CFP is bi-
directional: firms which enjoy higher market values and which are more profitable are able and
willing to incur the costs of making higher environmental disclosures. We also find the link
between CEP and profitability (but not market value) to be bi-directional: on the one hand,
CEP is likely to involve costs that could reduce current profitability (see above), on the other -
more profitable firms seem to care less about CEP (perhaps because they consider economic
legitimacy gained through superior profitability to be sufficient in itself).
Fourth, both CEP and CED also appear to significantly influence firm risk although
their effects vary depending on the environmental and risk measures considered. CED is likely
to help firms mitigate their operating risk (see Table 2), while CEP is negatively and highly
significant in mitigating market risk (see Table 3). Moreover, as argued above, investments in

19
CEP (which usually involve innovations with uncertain outcomes) seem to increase
contemporaneous operating risk; while riskier firms also seem to be inclined to undertake more
CEP (as risk mitigation strategy) – hence a positive link running from CEP to operating risk
and vice versa. Table 3 suggests that higher CED leads to increased stock return volatility.
Again, this could be driven by investors’ ambiguity about the less than consistent relation found
between CEP and CED in the prior literature (Cho et al., 2012; Clarkson et al., 2008), and thus
about the signal higher CED sends to the market. The resulting divergence of opinions among
investors is likely to result in the increased stock volatility (consistent with general predictions
about effects of CSR on stock market participants; Orlitzky, 2013).
Fifth, we find a link between CFP and risk: while higher profitability is associated with
higher operating risk, higher Tobin’s Q is associated with lower volatility. The former result is
as expected, as companies that earn higher profits choose to undertake riskier projects. The
latter result is consistent with the risk-return trade-off documented in finance literature: higher
Tobin’s Q corresponds to higher firm value and lower expected returns and lower stock risk.
Finally, Tables 2 and 3 also document significant effects that a number of control
variables have on the key endogenous variables of interest. First, financial performance of
smaller firms is stronger while other control variables do not reach conventional significance
levels in the corresponding equations. Second, the effects of control variables on firm risk
measures are not consistent across the two model specifications. Third, as expected, larger (and
thus more visible and heavily scrutinised firms) tend to deliver significantly stronger CEP, and
so do firms with smaller proportion of equity controlled by block holders. Fourth, Table 3
suggests a trade-off between firm capital expenditures and commitment to ’greening up’ their
act: firms that invest more heavily in property, plant, and equipment tend to score lower on
their environmental performance (CEP). Fifth, larger firm size facilitates significantly better
environmental disclosures. Possibly, better-performing and larger firms can afford to devote

20
resources to engage with their stakeholders by means of extensive environmental disclosures.
Finally, the results indicate that while block holders may not necessarily be too keen on firms
focusing on environmental performance initiatives (as discussed above), corporate
transparency in this regard is appreciated by large investors: larger block holdings are
associated with higher environmental disclosure scores. This discrepancy between the effects
of block holdings on environmental performance and disclosure scores once again underscores
the importance of empirically distinguishing between the two.
5. Discussion and conclusions
We propose a holistic approach to modelling of the links between key environmental and
financial outcomes of a firm, taking into account the endogeneity of these relations. Moreover,
we build on prior related literature (Al-Tuwaijri et al., 2004; Clarkson et al., 2011) by explicitly
incorporating financial risk in the environmental-financial accountability analysis. We find
corporate environmental performance and disclosures, corporate financial performance, and
financial risk to be endogenously determined, with many of the links among these variables
being bi-directional.
First, consistent with the RBV and VDT theories, we find a highly significant and
positive relation between CEP and CED – across industries, stronger environmental performers
appear to make higher and more objective environmental disclosures. Second, we find such
CED to be associated with stronger operating performance and reduced operating risk. This
finding is consistent with both the VDT (Clarkson et al., 2008, 2011) as well as the legitimacy
theory-based (Cho et al. 2012; Cho & Patten, 2007; Patten, 2002) arguments for why firms
make higher environmental disclosures. CED appears to be both, a means of signalling the firm
‘type’ to its relevant stakeholders (cf. Al-Tuwaijri et al. 2004; Clarkson et al. 2008); as well as
a means of building positive perception and reputation, thus helping gain co-operation of key
21
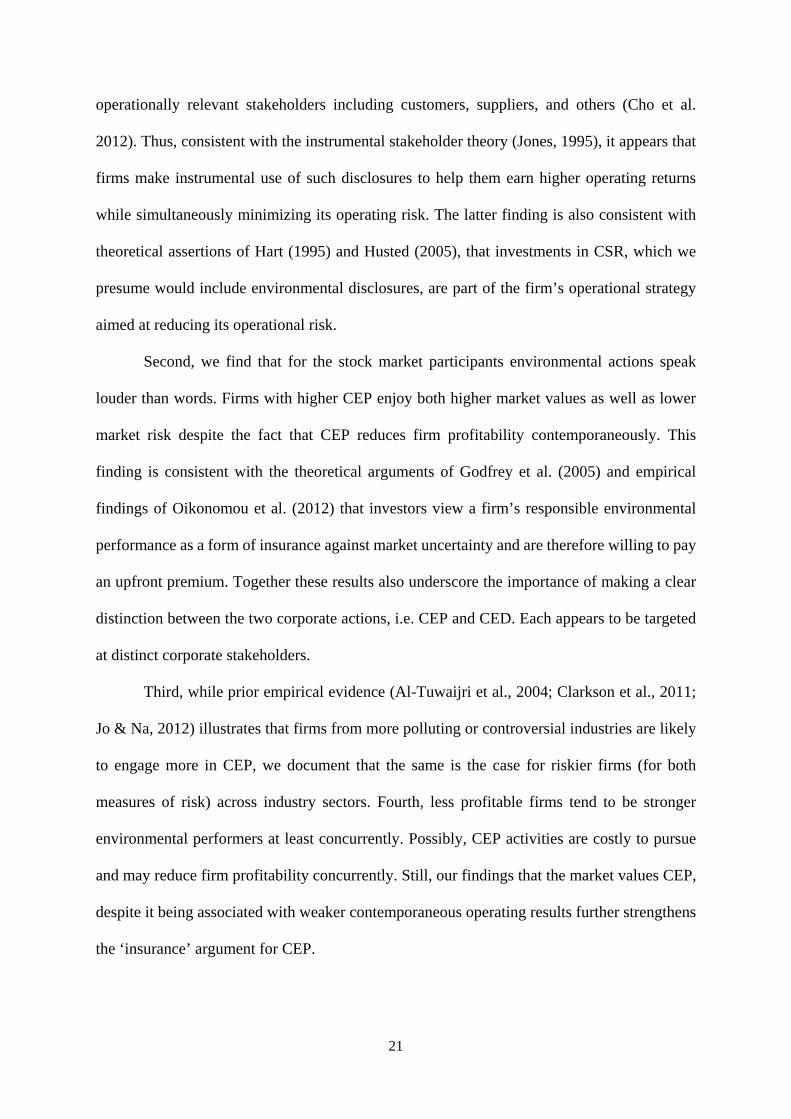
operationally relevant stakeholders including customers, suppliers, and others (Cho et al.
2012). Thus, consistent with the instrumental stakeholder theory (Jones, 1995), it appears that
firms make instrumental use of such disclosures to help them earn higher operating returns
while simultaneously minimizing its operating risk. The latter finding is also consistent with
theoretical assertions of Hart (1995) and Husted (2005), that investments in CSR, which we
presume would include environmental disclosures, are part of the firm’s operational strategy
aimed at reducing its operational risk.
Second, we find that for the stock market participants environmental actions speak
louder than words. Firms with higher CEP enjoy both higher market values as well as lower
market risk despite the fact that CEP reduces firm profitability contemporaneously. This
finding is consistent with the theoretical arguments of Godfrey et al. (2005) and empirical
findings of Oikonomou et al. (2012) that investors view a firm’s responsible environmental
performance as a form of insurance against market uncertainty and are therefore willing to pay
an upfront premium. Together these results also underscore the importance of making a clear
distinction between the two corporate actions, i.e. CEP and CED. Each appears to be targeted
at distinct corporate stakeholders.
Third, while prior empirical evidence (Al-Tuwaijri et al., 2004; Clarkson et al., 2011;
Jo & Na, 2012) illustrates that firms from more polluting or controversial industries are likely
to engage more in CEP, we document that the same is the case for riskier firms (for both
measures of risk) across industry sectors. Fourth, less profitable firms tend to be stronger
environmental performers at least concurrently. Possibly, CEP activities are costly to pursue
and may reduce firm profitability concurrently. Still, our findings that the market values CEP,
despite it being associated with weaker contemporaneous operating results further strengthens
the ‘insurance’ argument for CEP.

22
Overall, our findings have important practice and research implications. For managers,
our findings bring good news: both CED and CEP are worth pursuing as they can bring true
economic benefits for a firm and its various stakeholders. Our results also have implications
for the interpretation of findings of prior related studies that neglect endogeneity concerns and
posit causal unidirectional links among only some of the variables of interest examined here as
reviews by Beurden and Gossling (2008), Margolis and Walsh (2003), and Orlitzky and
Benjamin (2001) clearly highlight. At least some of these findings are likely plagued by biases
resulting from omitted variables, simultaneity, and reverse causality. Our paper provides a
conceptual framework that could be used by future research in different institutional contexts
to re-examine issues of environmental and broader social accountability and financial
accountability.

23
References
Al-Tuwaijri, S.A., Christensen, T.E., Hughes, K.E. (2004). The relations among environmental disclosure,
environmental performance, and economic performance: a simultaneous equations approach. Accounting,
Organizations and Society, 29(5-6), 447-471.
Barnea, A., Rubin, A. (2010). Corporate Social Responsibility as a Conflict between Shareholders. Journal of
Business Ethics, 97(1), 71-86.
Barth, M.E., McNichols, M.F. (1994). Estimation and market valuation of environmental liabilities relating to
superfund sites. Journal of Accounting Research, 32(Supplement), 177-209.
Benlemlih, M., Shaukat, A., Qiu, Y., Trojanowski, G. (2016). Environmental and social disclosures and firm risk.
Forthcoming in Journal of Business Ethics, Online First, available at:
http://link.springer.com/article/10.1007/s10551-016-3285-5.
Beurden, P., Gossling, T. (2008). The worth of values: A literature review on the relation between corporate social
and financial performance. Journal of Business Ethics, 82(2), 407-424.
Brammer, S., Brooks, C., Pavelin, S. (2006). Corporate social performance and stock returns: UK evidence from
disaggregate measures. Financial Management, 35(3), 97-116.
Brammer, S., Pavelin, S. (2008). Factors influencing the quality of corporate environmental disclosure. Business
Strategy and the Environment, 17(2), 120-136.
Campbell, D., Slack, R. (2011). Environmental disclosure and environmental risk: Sceptical attitudes of UK sell-
side bank analysts. British Accounting Review, 43(1), 54-64.
Chen, K.H., Metcalf, R.W. (1980). The relationship between pollution control record and financial indicators
revisited. Accounting Review, 55(1), 168-177.
Cho, C.H., Guidry, R.P., Hageman, A.M., Patten, D.M. (2012). Do actions speak louder than words? An empirical
investigation of corporate environmental reputation. Accounting, Organizations and Society, 37(1), 14-25.
Cho, C.H., Patten, D.M. (2007). The role of environmental disclosures as tools of legitimacy: a research note.
Accounting, Organizations and Society, 32(7-8), 639-647.
Clarkson, P.M., Li, Y., Richardson, G.D., Vasvari, F.P. (2008). Revisiting the relation between environmental
performance and environmental disclosure: an empirical analysis. Accounting, Organizations and Society
33(4), 303-327.

24
Clarkson, P.M., Li, Y., Richardson, G.D., Vasvari, F.P. (2011). Does it really pay to be green? Determinants and
consequences of proactive environmental strategies. Journal of Accounting and Public Policy, 30(2), 122-
144.
Cormier, D., Magnan, M. (1999). Corporate environmental disclosure strategies: determinants, costs and benefits.
Journal of Accounting, Auditing and Finance, 14(3), 429-451.
Dowell, G., Hart, S., Yeung, B. (2000). Do corporate global environmental standards create or destroy market
value? Management Science, 46(8), 1059-1074.
Eccles, R. G., Serafeim, G., Krzus, M.P. (2011), Market interest in nonfinancial information. Journal of Applied
Corporate Finance, 23(1), 113-127.
Fama, E.F., French, K. (1997). Industry costs of equity. Journal of Financial Economics, 43(2), 153-193.
Freedman, M., Patten, D.M. (2004). Evidence on the pernicious effect of financial report environmental
disclosure. Accounting Forum, 28(1), 27-41.
Friedman, M. (1970). The social responsibility of business is to increase its profits. New York Times Magazine,
32, 122-126.
Godfrey, P.C. (2005). The relationship between corporate philanthropy and shareholder wealth: A risk
management perspective. Academy of Management Review, 30(4), 777-798.
Hart, S.L. (1995). A natural resource based view of the firm. Academy of Management Review, 20(4), 986-1014.
Hughes, K. (2000). The value relevance of nonfinancial measures of air pollution in the electric utility industry.
Accounting Review, 75(2), 209-228.
Husted, B.W. (2005). Risk management, real options, and corporate social responsibility. Journal of Business
Ethics, 60(2), 175-183.
Ioannou, I., Serafeim, G. (2015). The impact of corporate social responsibility on investment recommendations:
Analysts’ perceptions and shifting institutional logics. Strategic Management Journal, 36(7), 1053-1081.
Jo, H., Na, H. (2012). Does CSR reduce firm risk? Evidence from controversial industry sectors. Journal of
Business Ethics, 110(4), 441-457.
Johnson, R.A., Greening, D.W. (1999). The effects of corporate governance and institutional ownership types on
corporate social performance. Academy of Management Journal, 42(5), 564-576.
Jones, T.M. (1995). Instrumental Stakeholder Theory: A Synthesis of Ethics and Economics. Academy of
Management Review, 20(2), 404-437.
25
Lev, B., Petrovits, C., Radhakrishnan, S. (2010). Is doing good good for you? How corporate charitable
contributions enhance revenue growth. Strategic Management Journal, 31(2), 182-200.
Lorraine, N.H.J., Collison, D.J., Power, D.M. (2004). An analysis of the stock market impact of environmental
performance information. Accounting Forum, 28(1), 7-26.
Margolis, J.D., Walsh, J.P. (2003). Misery loves companies: Rethinking social initiatives by business.
Administrative Science Quarterly, 48(2), 268-305.
McGuire, J.B., Simdgren, A., Schneeweis, T. (1988). Corporate social responsibility and firm financial
performance. Academy of Management Journal, 31, 854-872.
Oikonomou, I., Brooks, C., Pavelin, S. (2012). The impact of corporate social performance on financial risk and
utility: A longitudinal analysis. Financial Management, 41(2), 483-515.
Orlitzky, M. (2013). Corporate social responsibility, noise, and stock market volatility. Academy of Management
Perspectives, 27(3), 238-254.
Orlitzky, M., Benjamin, J. D. (2001). Corporate social performance and firm risk: A meta-analytic review.
Business & Society, 40(4), 369-396.
Orlitzky, M., Schmidt, F.L., Rynes, S.L. (2003). Corporate social and financial performance: A meta-analysis.
Organization Studies, 24(3), 403-441.
Patten, D. M. (1991). Exposure, legitimacy, and social disclosure. Journal of Accounting and Public Policy, 10(4),
297-308.
Patten, D.M. (2002). The relation between environmental performance and environmental disclosure: A research
note. Accounting, Organizations and Society, 27(8), 763-764.
Qiu, Y., Shaukat, A., Tharyan, R. (2016). Environmental and social disclosures: Link with corporate financial
performance. British Accounting Review, 48(1), 102-116.
Russo, M.V., Fouts, P.A. (1997). A resource-based perspective on corporate environmental performance and
profitability. Academy of Management Journal, 40(3), 534-559.
Salama, A., Anderson, K., Toms, S. (2011). Does community and environmental responsibility affect firm risk?
Evidence from UK panel data 1994-2006. Business Ethics: A European Review, 20(2), 192-204.
Shaukat, A., Qiu, Y., Trojanowski, G. (2016). Board attributes, corporate social responsibility strategy, and
corporate environmental and social performance. Journal of Business Ethics, 135(3), 569-585.
Shane, P., Spicer, B. (1983). Market response to environmental information produced outside the firm.
Accounting Review, 58(3), 521-538.

26
Sharfman, M.P., Fernando, C.S. (2008). Environmental risk management and the cost of capital. Strategic
Management Journal, 29(6), 569-592.
Spicer, B.H. (1978). Investors, corporate social performance, and information disclosure: An empirical study.
Accounting Review, 55(1), 94-111.
Toms, J. S. (2002). Firm resources, quality signals and the determinants of corporate environmental reputation:
some UK evidence. British Accounting Review, 34(3), 257-282.
Ullmann, A. (1985). Data in search of a theory: A critical examination of the relationship among social
performance, social disclosure, and economic performance. Academy of Management Review, 10, 540-577.
Utz, S., Wimmer, M. (2014). Are they any good at all? A financial and ethical analysis of socially responsible
mutual funds. Journal of Asset Management, 15, 72-82.
Waddock, S.A., Graves, S.B. (1997). The corporate social performance-financial performance link. Strategic
Management Journal, 18(4), 303-319.
Walden, W.D., Schwartz, B.N. (1997). Environmental disclosures and public policy pressure. Journal of
Accounting and Public Policy, 16(2), 125-154.

27
Figure 1. Predicted relations between the endogenous variables.
Corporate Financial Performance
(ROA or Tobin’s Q)
Corporate Financial Risk
(SD_ROA or Volatility)
Corporate Environmental Performance
Corporate Environmental Disclosure
28
Table 1. Descriptive statistics.
Variable
Mea
n
Med
ian
S.D
.
Min
Max
Pair-wise correlation coefficients
(1) (2) (3) (4) (5) (6) (7) (8) (9) (10) (11) (12)
(1) CEP 66.65 72.75 23.46 10.08 96.72
(2) CED 21.99 19.38 14.90 1.55 69.42 0.57
(3) ROA 0.11 0.10 0.09 -0.80 0.65 -0.11 -0.03
(4) Tobin's_Q 1.49 1.20 1.04 0.21 10.82 -0.15 -0.05 0.53
(5) SD_ROA 3.92 2.28 4.98 0.02 46.70 -0.11 -0.07 0.10 0.15
(6) Volatility 0.35 0.31 0.15 0.13 1.24 -0.23 -0.16 -0.13 -0.14 0.17
(7) Size 14.62 14.41 1.54 11.07 19.21 0.52 0.63 -0.17 -0.21 -0.17 -0.17
(8) Leverage 0.22 0.20 0.18 0.00 1.33 0.06 0.05 -0.06 -0.07 -0.07 -0.05 0.20
(9) CapEx 0.05 0.04 0.05 0.00 0.35 -0.15 0.00 0.16 0.15 0.04 0.12 0.03 0.06
(10) Asst_Grwth 0.11 0.06 0.29 -0.85 5.08 -0.13 -0.09 0.04 0.04 -0.04 0.14 -0.02 -0.03 0.07
(11) Fin_Slack 0.11 0.08 0.10 0.00 0.67 -0.20 -0.12 0.13 0.26 0.21 0.12 -0.22 -0.26 0.02 0.09
(12) Blck_Hold 18.42 12.00 18.62 0.00 88.00 -0.34 -0.23 0.03 0.03 0.11 0.29 -0.20 -0.10 0.16 0.06 0.21
(13) Asst_Intangibility 0.25 0.21 0.21 0.00 0.82 -0.01 -0.13 -0.08 -0.04 -0.08 -0.12 -0.05 0.07 -0.41 0.05 -0.18 -0.11
Note to Table 1: All the variables are defined in “Data and methodology” section.

29
Table 2. Simultaneous equation model employing accounting-based measures of financial performance and risk.
Dependent variable ROA SD_ROA CEP CED
Regressors Coeff. z-stat p-value Coeff. z-stat p-value Coeff. z-stat p-value Coeff. z-stat p-value
CEP -0.01 -3.20 0.00 0.96 3.06 0.00 0.68 5.14 0.00
CED 0.02 2.45 0.01 -2.68 -3.03 0.00
ROA 104.87 4.00 0.00 -306.75 -2.01 0.04 73.40 3.27 0.00
SD_ROA 10.20 2.08 0.04
Size -0.09 -1.90 0.06 10.04 2.67 0.01 13.51 4.23 0.00 1.47 1.39 0.17
Leverage 0.09 1.30 0.19 -12.41 -2.64 0.01
CapEx 104.92 1.15 0.25
Asst_Grwth -1.73 -2.51 0.01 1.92 1.63 0.10
Fin_Slack -1.60 -0.48 0.63
Blck_Hold -0.46 -2.99 0.00 0.07 1.78 0.07
Asst_Intangibility 0.09 1.31 0.19 -12.17 -2.51 0.01
Intercept, Year and Industry FE Yes Yes Yes Yes
Note to Table 2: The system is estimated by 3SLS method. All the variables are defined in “Data and methodology” section.

30
Table 3. Simultaneous equation model employing market-based measures of financial performance and risk.
Dependent variable Tobin’s_Q Volatility CEP CED
Regressors Coeff. z-stat p-value Coeff. z-stat p-value Coeff. z-stat p-value Coeff. z-stat p-value
CEP 0.26 2.91 0.00 -0.01 -3.14 0.00 0.63 5.45 0.00
CED -0.10 -3.63 0.00 0.02 1.82 0.07
Tobin’s_Q -0.12 -2.79 0.01 -4.59 -0.98 0.33 7.01 3.59 0.00
Volatility 220.18 2.71 0.01
Size -1.02 -2.45 0.01 -0.06 -1.17 0.24 9.54 7.71 0.00 2.31 2.53 0.01
Leverage 0.68 1.08 0.28 -0.01 -0.20 0.84
CapEx -91.64 -2.25 0.03
Asst_Grwth -0.02 -1.36 0.17 0.83 0.82 0.42
Fin_Slack -2.30 -0.67 0.50
Blck_Hold -0.55 -4.35 0.00 0.07 1.82 0.07
Asst_Intangibility 1.00 1.57 0.12 -0.07 -1.33 0.18
Intercept, Year and Industry FE Yes Yes Yes Yes
Note to Table 3: The system is estimated by 3SLS method. All the variables are defined in “Data and methodology” section.